Northern Plains Blizzards in Past and Future Climates › cpasw › documents › program-pdfs ›...
15
Northern Plains Blizzards in Past and Future Climates Alex Trellinger Advisor: Dr. Aaron Kennedy University of North Dakota
Transcript of Northern Plains Blizzards in Past and Future Climates › cpasw › documents › program-pdfs ›...

Northern Plains Blizzards in Past and Future Climates
Alex Trellinger
Advisor: Dr. Aaron Kennedy
University of North Dakota

Blizzard Climatology • Northern Great Plains (NGP) is
the blizzard capital of the CONUS Coleman and Schwartz (2017)
• Grand Forks NWS office has
maintained database of blizzard cases
• Since that time, we have
‘cleaned’ and double checked this archive against NCEI Storm Events Database for 1979-2015
2
3
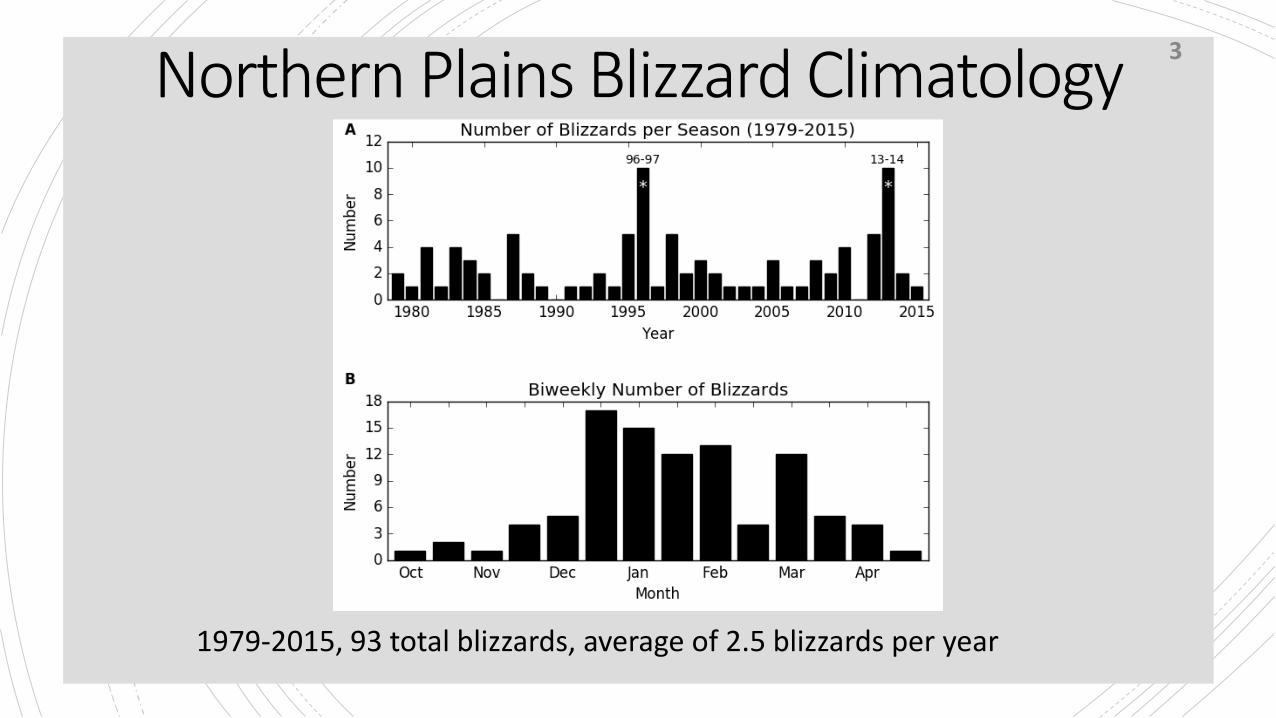
1979-2015, 93 total blizzards, average of 2.5 blizzards per year
Northern Plains Blizzard Climatology

What Causes Our Blizzards
• Some systems have characteristics of multiple patterns… defined as ‘Hybrids’ • Blizzards can be due to falling or relofted snow (ground blizzards)
4

Occurrence of Classified Patterns 5
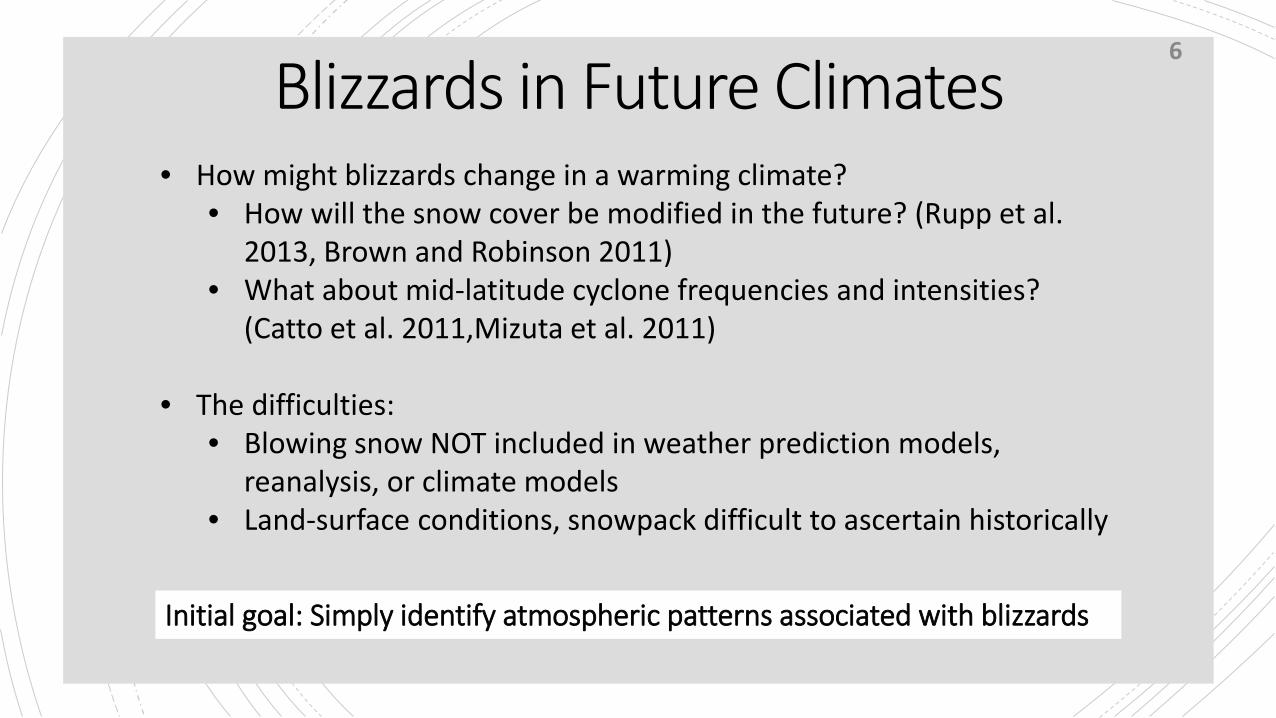
Blizzards in Future Climates • How might blizzards change in a warming climate?
• How will the snow cover be modified in the future? (Rupp et al. 2013, Brown and Robinson 2011)
• What about mid-latitude cyclone frequencies and intensities? (Catto et al. 2011,Mizuta et al. 2011)
• The difficulties:
• Blowing snow NOT included in weather prediction models, reanalysis, or climate models
• Land-surface conditions, snowpack difficult to ascertain historically
6
Initial goal: Simply identify atmospheric patterns associated with blizzards
Objective Classification of Patterns • Utilize Self Organizing Maps (SOMs, Kohonen 1996)
• Competitive neural network with neighborhood function • Classes related to each other in 2-D matrix.
• SOMs created using meteorological data from the North American
Regional Reanalysis (NARR, Mesinger et al. 2006) • Averaged to ~1° grid matching the Global Climate Model (GCM) • GCM: Community Earth System Model (CESM, Hurrel et al.
2013) Mother of All Runs (MOAR), provides 6-hr output
• Pattern recognition done for variables/properties not subject to bias: e.g. MSLP and 500 hPa geopotential height anomalies
7

Example 8-class SOM for Blizzard Events 8

Classified Patterns 9
Hybrids are identified in classes between Colorado Lows and Alberta Clippers

• To differentiate blizzard / non blizzard patterns, modify methodology to cluster all atmospheric states. ‘Climatology’ SOM
• Thresholds are then used (e.g. temperature, wind speed) to rule out certain
states
Automated Blizzard Pattern Recognition 10

• Apply thresholds to events in the main area of interest at each grid point • Use the minimum observed maximum wind speed for each month • Use 0.2℃ as temperature threshold • Precipitation had negligible impacts
Thresholds 11
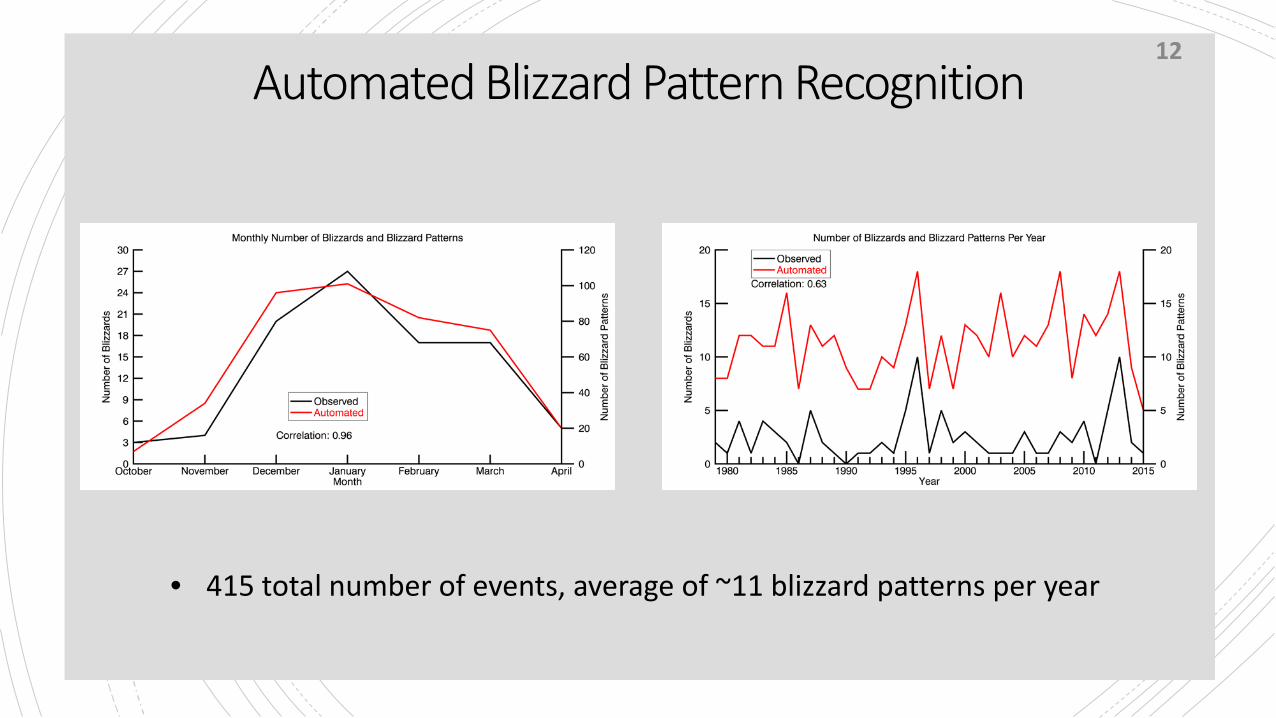
• 415 total number of events, average of ~11 blizzard patterns per year
Automated Blizzard Pattern Recognition 12

Example Automated Blizzard Pattern Recognition 13

Automated CESM Climatology 14
Analysis NARR CESM Past CESM RCP4.5
CESM RCP8.5
Average Number of
Blizzard Patterns per
Year
11.2 14.9 11.9 12.6

Conclusions and Future Work 15
• The Northern Plains experience on average 2-3 blizzards per year • Automated blizzard pattern recognition using SOMs works, and shows
that we experience roughly 11 blizzard patterns per year based on the NARR.
Future work • Why does the historical CESM have more blizzard patterns than NARR? • Why do the CESM future projections have fewer blizzard patterns?
• Are certain patterns not occurring as often, or is it a decrease of all patterns?
• Simply the warmer temperatures? • Applying this methodology to an ensemble (LENS)