Chem(h)ist(o)ry Charlotte Still Education Coordinator, North West Using cross-curricular.

Lefapha la Thuto la Bokone BophirimaNoord-Wes Onderwys DepartementNorth West Education DepartmentNORTH WEST PROVINCE
education
N O RT H W E S T E D U C AT I O N D E PA RT M E N T
2019/20

Page 2 of 208
Table of Contents1. VISION ................................................................................................................................ 5
2. MISSION ............................................................................................................................. 5
3. STRATEGIC GOALS .......................................................................................................... 5
4. VALUES .............................................................................................................................. 7
5. FOREWORD BY THE MEC................................................................................................ 8
6. INTRODUCTION BY ACCOUNTING OFFICER................................................................. 9
PART A: STRATEGIC OVERVIEW................................................................................................................................................11
1. EDUCATION IN THE CONTEXT OF ENTREPRENEURSHIP, SKILLS DEVELOPMENTAND THE FOURTH REVOLUTION.................................................................................. 11
2. NATIONAL DEVELOPMENT PLAN: VISION 2030 .......................................................... 31
3. MEDIUM TERM STRATEGIC FRAMEWORK (MTSF) .................................................... 33
4. THE SECTOR PLAN: SCHOOLING 2030........................................................................ 34
5. SECTORAL NON-NEGOTIABLES ................................................................................... 35
6. DELIVERY AGREEMENT UPDATE................................................................................. 37
7. UPDATED SITUATIONAL ANALYSES ............................................................................ 39
8. ORGANIZATIONAL ENVIRONMENT............................................................................... 58
9. REVISION TO LEGISLATIVE AND OTHER MANDATES ............................................... 63
10. PLANNED INTERVENTIONS AND PRIORITIES............................................................. 63
11. SONA ................................................................................................................................ 67
12. SOPA ................................................................................................................................ 68
13. PERFORMANCE DELIVERY FOCUS AREAS IN 2019/20.............................................. 69
14. BUDGET PRIORITIES: EARMARKED FUNDS ............................................................... 72
15. OVERVIEW OF 2019/20 BUDGET AND MTEF ESTIMATES.......................................... 73
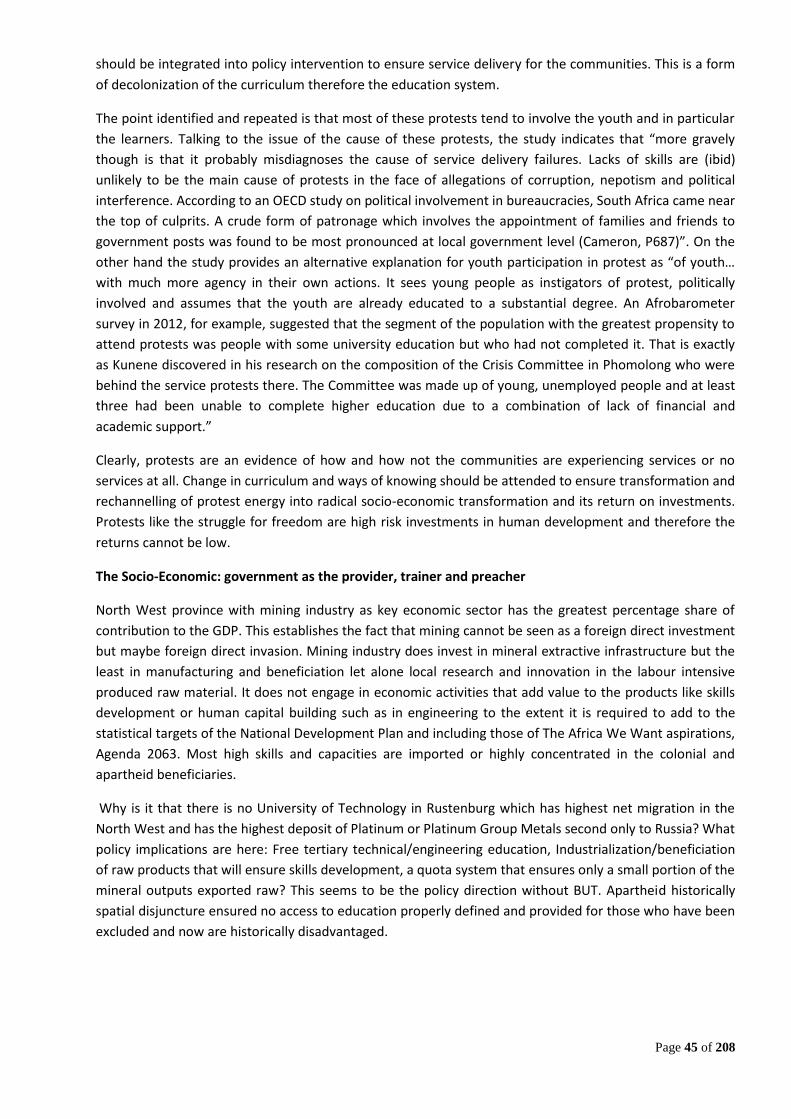
16. BUDGET EXPENDITURE AND ESTIMATES .................................................................. 74
PART B: PROGRAMME AND SUB-PROGRAMME PLANS.........................................................................................................77
1. PROGRAMME 1: ADMINISTRATION .............................................................................. 77
2. PROGRAMME 2: PUBLIC ORDINARY SCHOOLS ......................................................... 86
3. PROGRAMME 3: INDEPENDENT SCHOOL SUBSIDIES............................................... 98
4. PROGRAMME 4: PUBLIC SPECIAL SCHOOL EDUCATION ....................................... 103
5. PROGRAMME 5: EARLY CHILDHOOD DEVELOPMENT ............................................ 110
6. PROGRAMME 6: INFRASTRUCTURE DEVELOPMENT.............................................. 117
7. PROGRAMME 7: EXAMINATION AND EDUCATION RELATED SERVICES .............. 125

Page 3 of 208
PART C: LINKS TO THE LONG-TERM INFRASTRUCTURE AND OTHER CAPITAL PLANS.................................................132
PART D: CONDITIONAL GRANTS..............................................................................................................................................135
PART E: PUBLIC ENTITIES ........................................................................................................................................................150
PART F: PUBLIC-PRIVATE PARTNERSHIPS............................................................................................................................150
PART G: OTHER ANNEXURES ..................................................................................................................................................151
ANNEXURE 1: TECHNICAL INDICATOR DESCRIPTORS FOR NATIONALLY DETERMINEDPROGRAMME PERFORMANCE MEASURES (PPM’S) .............................................. 151
ANNEXURE 2: TECHNICAL INDICATOR DESCRIPTORS FOR PROVINCIAL DETERMINEDPROGRAMME PERFORMANCE INDICATORS ........................................................... 175
ANNEXURE 3: INDICATORS NOT APPLICABLE IN 2019/20............................................................... 202
ANNEXURE 4: AMENDMENTS TO THE ANNUAL PERFORMANCE PLAN ....................................... 203
ANNEXURE 5: SONA AND SOPA PRONOUNCEMENTS .................................................................... 204
ANNEXURE 6: ACRONYMS................................................................................................................... 207


Page 5 of 208
1. VISIONTowards excellence in Education.
2. MISSIONWe provide quality basic education for high learner achievement through educator excellence.
3. STRATEGIC GOALSStrategic Goal 1 Effective and efficient governance, management and financial support systems
Goal statement 1. Improved Financial Management systems2. Improved Human resource strategy3. Improved internal and external communication strategies4. Improved Security Systems5. Improved Internal Audit processes6. Improved Risk Management Systems
Justification The Education system is broad and complex. Improvement of services in theAdministration functions provides leverage on which the specific functionaries can deliverto improve the quality of teaching and learning. The Business processes andadministrative processes within these functionaries directly affect the entire managementof the system.
Links 1. Strengthening administration systems through compliance to financial, risk andhuman resource management.
2. Monitoring of internal controls effectiveness and economical use of resources.3. Supplementing teaching and learning material. Accessibility to national database
statistics.4. Compliance to Skills Development Act, HRD strategy, Public service Act chapter IV and
Batho Pele principles.

Page 6 of 208
Strategic Goal 2 Improved learner attainment in Grades (R to 12) 3, 6, 9 and 12
Goal statement 1. Improved quality education provided to all Grade R learners by gradually placingthem in primary schools where they can be thoroughly prepared for the physical andacademic demands of learning. This is coupled with provision of proper learningmaterials and educational toys, plus qualified grade R educators.
2. Ensure that educators in the Pre-Grade R programme are thoroughly trained to offerquality pre-school service to younger children.
3. Ensure the monitoring of curriculum implementation with special reference to grade3,6,9 and 12; Enhance and strengthen mathematics and science education in orderto improve technological expertise; Support school enrichment programmes inorder to produce holistically developed learners; and provide multi-media services toenhance teaching and learning in all grades.
4. Ensure the implementation of support programmes that enhance learning, namely;the school nutrition programme, learner transport, infrastructure development andmaintenance; and school safety.
5. Ensure that all independent schools, including Home Schools are registered with theDepartment. This allows a diverse learning environment and a broader choice ofcurriculum. Ensure that all subsidized schools are supported and monitored toascertain compliance and for quality assurance purposes.
6. Strengthen special schools by empowering educators and creating access forlearners with disability including provision of professional support by specialists
7. Ensuring well managed and monitored School Based Assessment (SBA) to enhanceteaching and learning to ensure that mainstream schools’ infrastructure isrehabilitated to be accessible to learners with minor disabilities; that educators aretrained to identify learners with serious disabilities for referral to special schools; andthat the curriculum needs of these learners are taken care of so that all learners withlearning barriers are well catered for in Full Service Schools.
8. Implementing life skills and HIV and AIDS programmes and structures in schools inorder to deal with the impact of HIV and AIDS in the school system.
Justification 1. Provide learners with skills/qualifications to become employable and contributesuccessfully to the economy.
2. Children from birth to four years afforded the best start in life through quality earlycare and education experiences.
3. Increase of HIV/AIDS related illnesses and death place pressure on learners andeducators in the education system.
4. Ensure that communities, parents and learners become active participants inenhancing the integrity of assessment which is problem/ challenge free.
Links 1. Strengthening the skills and human resource base. Build cohesive, caring andsustainable communities. Reduction of illiteracy in communities, promoting access tohigher education, curbing skills shortage and enhancing socio-economic values ofsociety from an early stage in education.
2. Improve the health profile of the nation and to build cohesive, caring and sustainablecommunities.
3. Increase of learners and educators with HIV/AIDS living a full life.4. Parents and all stakeholders including educators benefit from intangible benefits
associated with assessment in the province

Page 7 of 208
4. VALUES
EXCELLENCE We move beyond compliance by going an extra mile.
INNOVATION We will continually strive for better and new ways of doing things.
PEOPLE CENTRED We enhance human capital investment, teamwork and accountability.
COMMUNICATION We share information in an honest, responsible and transparent manner.
INTEGRITY ANDHONESTY
We respond to our fellow employees and other stakeholders with honesty, fairnessand respect.


Page 9 of 208
6. INTRODUCTION BY ACCOUNTING OFFICER
This is the last of the five APPs of the Fifth Administration. Quality education remains one of thekey priorities of government. This is enshrined in the constitution as a fundamental right andsuccinctly proclaimed in the National Development Plan (NDP), a government’s socio-economicframework, as the main driver of transformation and development.
The 2019/20 Annual Performance Plan (APP) is fundamentally built upon our determination asa system to improve efficiency in the delivery of quality education. In recognition of theenormous responsibility entrusted upon us, we have themed the current year: ReclaimingExcellence. The commitment of government in this regard manifests itself in the amount offunds appropriated to education budget. It is always a significant portion of the Gross DomesticProduct (GDP)
To achieve this, we have to continuously ensure optimal performance by all at all levels of thesystem. A rigorous effort will be focused at eliminating mediocrity and poor performance,especially in areas where underperformance has been identified and support provided throughaccountability sessions.
In recognition of the enormous responsibility entrusted to us, this department has at all times,been striving very hard to establish and implement various systems and processes to improvethe quality of education in the province. At the centre of our endeavors we are striving todevelop a more responsive and decisive leadership among our senior and middle managers.Notwithstanding this, much has been achieved so far.
Newly built schools are of high standards, making provision for quality ICT. As a result of thesevere drought experienced by the country, provision of water and sanitation to a large extenthas been a challenge. Our Learner Attainment Improvement Plan (LAIP) continues to yieldpositive results. Both national and international learner assessment results (TIMMS; SAQMEC &NSC) bear testimony to this.
Forging on with our efforts to live to repositioning and rebranding our department andeventually our province, this plan seeks to drive us in a direction of strengthening andsustaining the good performance whilst on the other hand stimulating creativity and innovationamongst departmental officials. We strive to maximise with the minimum.
Top of our priorities this year will be:
• Provision of requisite infrastructure: Priority will be made to the improvement ofsanitation, establishment of specialised rooms, fencing and renovations.
• Acceleration of ICT infrastructure to schools: In keeping with the pace of technology andE-Learning requirements, efforts will be made to provide schools with computers andinternet connectivity for administrative and learning purposes
• The strengthening of the quality of Learning and Teaching Campaign (QLTC) aimed atmobilising critical education stakeholders
Installation of the Mathematics Laboratories with the view of promoting the quality ofthe teaching of Mathematics in the Foundation Phase


Page 11 of 208
PART A: STRATEGIC OVERVIEW
1. EDUCATION IN THE CONTEXT OF ENTREPRENEURSHIP, SKILLS DEVELOPMENTAND THE FOURTH REVOLUTION
The Departments approach to development strategy is to change the educational landscape to allowfor entrepreneurship. Important aspects that need to shape the future are:
Growth Problem solving Collaborative leadership Self-awareness Engagement
Entrepreneurial competences will include:
Knowledge Passion & fire Skills
In terms of Global level, SA is considered lagging in terms of entrepreneurial activity. Therefore interms of business rate is at 2, 3%, the second lowest in the world. SA has the lowest levels ofentrepreneurship and education in Africa.
a. ENTREPRENEURSHIP IN THE CURRENT CURRICULUM
Subject Content that supports/developentrepreneurship
Entrepreneurship opportunities
Engineering Graphics and Design ArchitectureIndustrial designerInterior designerLandscape architectQuality surveyorBuilding managementGraphic illustrator
Table 1: Engineering graphics and design (DBE: 2018)
Participation rate Success Rate2014 475 982015 642 1002016 2087 96Growth(%) 214-2016 +1612 -2Ranking 6 5Table 2: Participation Rate and Success rate Grade 12:2014-2016(DBE: 2018)

Page 12 of 208
Subject Content that supports/ develops entrepreneurship Entrepreneurship Opportunities1. Construction2. Woodworking3. Civil Services
Carpenter and joinerBricklayerTilerPlumberRoof SpecialistBuilding Inspector
Table 3: Civil Technology (DBE: 2018)
Participation rate Success Rate2014 208 982015 295 992016 771 98Growth(%) 214-2016 +563 0Ranking 1 4Table 4: Participation Rate and Success rate Grade 12:2014-2016(DBE: 2018)
Subject Content that supports/ develops entrepreneurship Entrepreneurship Opportunities
1. Power Systems2. Electronics3. Digital Electronic
Electronic mechanicAuto-electricElectricianRadio TechnicianCommunication TechnicianPLC ProgrammingElectronics ProgrammingRobotics
Table 5: Electrical Technology (DBE: 2018)
Participation rate Success Rate2014 134 932015 183 972016 538 98Growth(%) 214-2016 +404 +5Ranking 1 2Table 6: Participation Rate and Success rate Grade 12:2014-2016(DBE: 2018)
Subject Content that supports/ developsentrepreneurship
Entrepreneurship Opportunities
1. Automotive2. Fitting and Machining3. Welding and metalwork
Fitter, Machinist, locksmith, motor mechanic,diesel mechanic, farm mechanic, vehicledesigner, auto electrician, specialised enginetuner and diagnostic analyst, suspension builder,blacksmith, jeweller, rigger, welder, boilermaker,panel beater, exhaust fitter, brake and clutchfitter and mechanist, draughtsman, Toolmaker,Automotive machinist and fitter, enginerebuilder, transmission machinist, roof trussdeveloper.

Page 13 of 208
Table 7: Mechanical Technology (DBE: 2018)
Participation rate Success Rate2014 150 992015 206 942016 593 96Growth(%) 214-2016 +443 -3Ranking 1 3Table 8: Participation Rate and Success rate Grade 12:2014-2016
Subject Content that supports/ develops entrepreneurship Entrepreneurship Opportunities
1. Tourism Sectors2. Tourism attractions3. Culture and heritage4. Communication and Customer service
Tourism products andservices owners
Tour guides Curio shop owner Transport services operator Tourist attraction guides
Table 9: Tourism (DBE: 2018)
Participation rate Success Rate2014 4156 99.82015 4209 99.52016 4282 99.2Growth(%) 214-2016 +126 -0.6Ranking 4 6Table 10: Participation Rate and Success rate Grade 12:2014-2016(DBE: 2018)
Subject Content that supports/ develops entrepreneurship Entrepreneurship Opportunities
1. Sectors and careers2. Food preparation3. Food Service4. Function Service
Small scale production offood, fashion and softfurnishing items
Caterer Event planner Interior designer Tailor/ dress maker Upholster Developing a small micro-
enterpriseTable 11: Hospitality Studies (DBE: 2018)
Participation rate Success Rate2014 124 1002015 323 1002016 356 99.7Growth(%) 214-2016 +232 -0.3Ranking 1 5Table 12: Participation Rate and Success rate Grade 12:2014-2016(DBE: 2018)

Page 14 of 208
Subject Content that supports/ develops entrepreneurship Entrepreneurship Opportunities
1. The Consumer2. Entrepreneurship
Small scale production offood and clothing items
Caterer Event planner Interior planner Tailor / Dress maker Developing a micro-
enterprise Product development
Table 13: Consumer Studies (DBE: 2018)
Participation rate Success Rate2014 1917 99.82015 2672 99.52016 2597 98.7Growth(%) 214-2016 +680 -1.1Ranking 4 8Table 14: Participation Rate and Success rate Grade 12:2014-2016(DBE: 2018)
Subject Content that supports/ develops entrepreneurship Entrepreneurship Opportunities
1. Agricultural entrepreneurship and business planning:2. Concept and aspects of entrepreneur and
entrepreneurship, entrepreneurial success factors3. Agribusiness planning: concept of business planning in
the Agricultural sector4. Agricultural marketing systems: Free market,
cooperative and controlled marketing5. Intensive and extensive farming processes6. Plant and animal production systems
Commercial farmer Subsistence farmer Owner of Agricultural feedcompany Involved in dairy farmingand making of yoghurt andhoney Supplier of fruit,vegetables and fruits tocommercial conglomerateslike Woolworths, Pick nPay,etc. Ownership of AnimalHealth facilities
Table 15: Agricultural Sciences (DBE: 2018)
Participation rate Success Rate2014 4461 902015 6022 822016 6462 81.9Growth(%) 214-2016 +2001 -8.1Ranking 5 6Table 16: Participation Rate and Success rate Grade 12:2014-2016(DBE: 2018)

Page 15 of 208
Participation rate Success Rate2014 92 1002015 123 1002016 219 100Growth(%) 214-2016 +127 0Ranking 4 2Table 17: Agricultural Management practices (DBE: 2018)
SUBJECT Subject Content that supports/develops entrepreneurship
EntrepreneurshipOpportunities
Dance studies Encourage learners to read andresearch dance history andtheories
Choreographer Dancer
Design Design in a business context (Graphic) Designer [includingautomotive]• Art Director• Digital Print Designer
Dramatic arts Understand different theatrestaging & film conventions andspaces and how these affectPerformance
Theatre Practitioner• Director
• Filmmakers
Music Music knowledge and analysis(Music industry value chain)
Musical Director• Sound Engineer• Composer• Publishing / Recording Label /Printing Plant Owner
Visual arts Visual Culture Studies:emphasis on visual literacy
Curator• Architect• Art Director• Digital Print Designer
Table 18: Art Subjects (DBE: 2018)
b. THE THREE STREAM MODEL
These streams are:
Academic Stream Technical Vocational Stream Technical Occupational Stream
i. Academic Stream
The targets are as follows:
Plan is to increase the number to 300 000 by 2024 with 350 000 passing mathematics. 320 00 learners passing physical science. Commission also targeted for 2030 of 450 000 learners being eligible for bachelors programme
with maths and science.

Page 16 of 208
ii. Focus Schools
Agric focus schools have been identified and the support will be intensified this year in partnership withUniWest. Wagpos in Brits is an example of a very successful school with a farm that offers learners actualpractice.
The focus schools are:
Maths and Science schools Arts schools Agricultural Science schools Aviation schools Maritime schools Pathway Tech Schools
Number of SchoolNat EMIs
Grade 10 Grade 11 Grade 12 Total
10 882 754 590 2226Table 19: Agricultural Focus Schools (DBE: 2018)
iii. Technical Vocational Stream
Targets set for 2014 in the delivery signed by the Minister of Higher Education and Training was to produce10 000 artisans per year. Department of Basic Education propose a target of 30 000 by 2030, subject todemand.
Civil Technology ElectricalTechnology
Mechanical Technology
Woo
d-w
orki
ng
Cons
truc
tion
Civi
l ser
vice
s
Tota
l
Pow
er S
yste
ms
Digi
tal E
lect
roni
cs
Elec
tron
ics
Tota
l
Auto
mot
ive
Fitt
ing
&M
achi
ning
Wel
ding
Tota
l
19 16 14 49 20 23 17 60 28 15 14 57
Table 20: Technical High Schools (DBE: 2018)
iv. Skills and Vocational Programme for GET
Provide inclusive education that enables everyone to participate effectively in a free society. Provideknowledge and skills that people with disabilities can use to exercise a range of other human rights. Theintention is to ensure that all children with disabilities have access to quality education.
Number of schools ofskill
Teachers schools of skill Learners in schools ofskill
NW 5 159 2429Table 21: Schools of Skill (DBE: 2018)

Page 17 of 208
c. OTHER DEPARTMENTAL STRATEGIES
i. QLTC
QLTC is used to popularise the department and its programmes through stakeholder relations by mobilisingall stakeholders, parents, Institutions of Higher Learning, Traditional Authorities, Municipalities, Faith BasedOrganisations, NGO’s, Sport Federations with a view of making education a societal matter.
In line with the campaign of opening the doors of learning, the department has accepted the formerPremier’s recommendation of reminding learners about the Fruits of Freedom and their responsibilities”.April month has been set aside for this purpose. Schools are expected to celebrate with Governmentofficials and Public representatives.
ii. NSNP
The Department of Education provides nutritious food to the needy learners in schools through theNational School Nutrition Programme (NSNP). Provision of learners entails purchasing of quality food andutensils and training of food handlers. There are food gardens in schools that support the initiative. Thenumber of vegetable tunnels remains 15 in 2017/18 (donated by Mafikeng municipality). Schools willsupport community initiatives by purchasing from community gardens and bakeries.
Interdepartmental collaboration is with Social Development, Health, Rural Economic and AgricultureDevelopment, District municipalities on training food handlers.
iii. TRANSVERSAL INTEGRATED SOCIAL SUPPORT STRATEGY
The department strives to provide accessible, equitable, integrated and inclusive education. This is aneffort to address the inequality of the past and ensure that quality education in North West are available toall who live in it. It is the intension of the Department to ensure that schools in the Province are accessible.Learners from the farms and deep rural areas staying 5KM from the school are entitled or qualify to benefitfrom scholar transport.
The department uses the Fundza Lushaka bursary scheme to ensure that adequate, qualified andcompetent educators can be employed in schools that have shortage of staff. The department’s Employeewellness sub-directorate with its four development strategy ensures that there is extensive physical andorganisational wellness activities conducted in different villages, townships or small towns. In addition theunit assists with individual counselling that supports personal healing. Some of the strategic objectives tosupport the pillar are:
To develop a responsive healthy workforce by ensuring adequate training and development Accelerate delivery on the Education Improve quality of life of persons with disabilities (inclusive education and provision of assistive
devices and training of educators on SIAS) Improve access to all schools (public ordinary / special or independent)
The sub programme Race and Values activities in schools also ensure that children learn to be patriotic andunderstand the constitution enough to be able to accept those that are different to them in terms of race,creed or gender. Some of the activities that schools are expected to do include:
Recital of the Preamble to the Constitution of the Republic of South Africa Singing of the African Union Anthem Knowledge and understanding of the National Symbols and National Orders Bill of Rights Bill of Responsibilities Knowledge and interpretation of the Constitution

Page 18 of 208
The department has inculcated Setswana in Public and Farm schools through SASCA (South African SchoolsChoral Music Eistefod Competition). There is also an annual ARTS N CULTURE festival in which each yearhas a theme. The activity exposes learners to poetry, drama and traditional music.
The provision of quality education service will always be guided by the needs of the community of NorthWest. The resource demands for improved learner performance will always be above the supplyparticularly within the current resource constraints environment. It is therefore imperative to bring onboard all the partners, business, NGO and community structures to meet the community expectations.
iv. COMMUNITY OUTREACH
The Community outreach approach assists the department to identify community challenges regardingeducation. This approach improves time on task on issues raised by communities as well as identifies areasthat need improved planning. The department will continue to contribute to the economy of NWRP areasthrough:
Schools to support bakeries that are initiated by government Support local food production initiatives like community gardens Marking Centres to be established in NWRP Vacation camps in NWRP Training will also be conducted in venues in NWRP Dialogue sessions will be held in NWRP

Page 19 of 208
Table 22: Relationship between MTSF and Indicators
NR PPMPPI
PPMPPINR
PROGRAMME PERFORMANCEMEASURES
ACTION PLAN/MTSF/ SOPA/SONA priorities
2019/20TARGET
JUSTIFICATIONOF TARGETS
RISKS CONTROLS
1. PPM PPM101 Number of public schools that usethe South African SchoolsAdministration and ManagementSystems (SA-SAMs) toelectronically provide data
MTSF Aligned 1486 Based on thecurrent numberin SA SAMS
Lack of supportingdocuments fordeviation
Documentary evidence to besubmitted on a quarterlybasis
2. PPM PPM102 Number of public schools that canbe contacted electronically (e-mail)
MTSF Aligned 1486 Based on thecurrent numberin SA SAMS
Lack of supportingdocuments fordeviation
Documentary evidence to besubmitted on a quarterlybasis
3. PPM PPM103 Percentage of educationexpenditure going towards non-personnel items
MTSF Aligned 10% It is a NationalNorm
Under-expenditure ongood and services
Submission of ProcurementPlans by the 15th ofFebruary,1st March implementationstarts.Monthly expenditurereports, monitoring andreporting
4. PPM PPM104 Number of schools visited byDistrict officials for monitoring andsupport purposes
MTSF Aligned 100% All Open Publicschools
Lack of transportVacancies
Provide transport to districtofficials
5. PPI PPI 1.2.1 Percentage of 7 to 15 year oldsattending education institutions
MTSF Aligned 100% Numerator:Number of 7-15year oldlearners inschoolsDenominator:Stats SAPopulationestimates
Learners withoutIDsEstimate ofpopulation byStats SA
Encourage schools tocapture Learner ID Numberson SA-SAMS

Page 20 of 208
6. PPI PPI 1.2.2 Percentage of learners havingaccess to information throughConnectivity (other thanbroadband); andBroadband
MTSF Aligned 15% New PPM ,it willbe piloted in 1district
Theft andvandalism
Provision of high impactdevices with low resell value
7. PPI PPI 1.2.3 The percentage of schoolprincipals rating the supportservices of districts as beingsatisfactory
MTSF Aligned 70% New surveyform
Principals notfilling the surveyforms
N/A
8. PPI 1.2.4 Number of office basedemployees trained
Action Plan 700 Target is basedon the budget
Non-attendancedue to competingpriorities(wastefulexpenditure)
Consequence managementfor non-attendance
9. PPI 1.2.5 Number of unemployed youthparticipating in internship,learnerships and /or skillsprogramme
Pronouncement 238 Budgetconstraints.DPSA directive
Lateappointments
Centralise recruitment,review recruitment ofmanagement plan to ensureassumption of dutybeginning of April
10. PPI 1.2.6 Number of employees attendingemployee Health and Wellnessactivities
MTSF Aligned 10000 OTP/DPSAdirective
Competingprovincialactivities, PoorAttendance
Signed targeted list bymanagers and confirmationof attendance
11. PPI 1.2.7 Number of schools that will bemonitored on integrating ICT inteaching and learning
MTSF Aligned 150 Dependent onavailability andsupply of ICT toschools
VandalismconnectivityFear for ICT
Advocacy
12. PPI 1.2.8 Percentage of women appointedin SMS positions (Percentage ofoffice based women in SeniorManagement Service)
MTSF Aligned 50% Policyimperativeagainst currentvacancies
Political andAdministrative adecisions/interference
Adherence to employmenttargets
13. PPI 1.2.9 Percentage of invoices paid within30 days
MTSF Aligned 80% N/A N/A N/A

Page 21 of 208
14. PPM PPM201 Number of full service schoolsservicing learners with learningbarriers
MTSF Aligned 16
15. PPM PPM202 The percentage of children whoturned 9 in the previous year andwho are currently enrolled inGrade 4 (or a higher grade)
MTSF Aligned 75% Base lineTargeting andtakes intoconsiderationLearnerRetention intheir respectivegrades andprogression
Learners withoutand / or incorrectIDs captured andDate of birth
Internal System control toidentify and correct at thesource
16. PPM PPM203 The percentage of children whoturned 12 in the preceding yearand who are currently enrolled inGrade 7 (or a higher grade)
MTSF Aligned 60% Base lineTargeting andtakes intoconsiderationLearnerRetention intheir respectivegrades andprogression
Learners withoutand / or incorrectIDs captured andDate of birth
Internal System control toidentify and correct at thesource
17. PPM PPM204 Number of schools provided withmulti-media resources
MTSF Aligned 25 Budget dictates VandalismDamage and lossNo libraryteachers
Advocacy & TrainingTighten security
18. PPM PPM205 Learner absenteeism rate MTSF Aligned 2.1% Base LineTargeting
LearnerAttendance notcaptured VS whatis on theattendanceregister
Constant monitoring ofLearner attendance
19. PPM PPM206 Teachers absenteeism rate MTSF Aligned 3% Trend analyses Non submission ofleave forms/notcapturing on time
Implementation Leavemanagement system

Page 22 of 208
20. PPM PPM207 Number of learners in publicordinary school benefiting fromthe ”No-fee school” policy
MTSF Aligned 715 111 National policydirectives
Non Non
21. PPM PPM208 Number of educators trained onLiteracy/Language content andmethodology
MTSF Aligned 1680 Budget dictates Non attendanceFrequent andcontinuesmovement ofteachers – subjectallocationMovement ofeducators
Proper communication andinvitation
22. PPM PPM209 Number of educators trained onNumeracy/Mathematics contentand methodology
MTSF Aligned 1680 Budget dictates Non attendanceFrequent andcontinuesmovement ofteachers – subjectallocationMovement ofeducators
Proper communication andinvitation
23. PPI PPI 2.1 The average hours per year spendby teachers on professionaldevelopment activities
MTSF Aligned 70hrs The annualtargets arestaggeredtowards the 80hours
Non attendanceFrequent andcontinuesmovement ofteachers – subjectallocationMovement ofeducators
Proper communication andinvitation

Page 23 of 208
24. PPI PPI 2.2 Number of teachers who havewritten the Self-DiagnosticAssessments
MTSF Aligned 2000 The target isachievablethrough pre andpost test
1.Voluntaryprocess2. Anonymitynature makes itdifficult to makefollow up3 Lack of ICTconnectivity
Pre and post-test will beused mean time
25. PPI PPI 2.3 Percentage of teachers meetingrequired content knowledge levelsafter support
MTSF Aligned 10% It is relativelynew, it refers toscare andcritical subjectwhereperformance isstill a challenge
1.Ever changing ofsubject allocationdisadvantages theteachers tospecialize2. Teachersreluctant toparticipate in Pre-Testing
Improved stability in subjectallocation
26. PPI PPI 2.4 Percentage of learners in schoolswith at least one educator withspecialist training on inclusion
MTSF Aligned 7%
27. PPI PPI 2.5 Percentage of Funza Lushakabursary holders placed in schoolswithin six months uponcompletion of studies or uponconfirmation that the bursar hascompleted studies
MTSF Aligned (120)100%
National quota Students who fail/ some refuse togo where they areplaced
Enforcement of the contract
28. PPI PPI 2.6 Number of qualified teachers,aged 30 and below, entering thepublic service as teachers for thefirst time during the financial year
MTSF Aligned 1138 Statisticalindicator
Non filling ofvacancies
Immediate filling of vacantposts

Page 24 of 208
29. PPI PPI 2.7 Percentage of learners who are inclasses with no more than 45learners
MTSF Aligned 54% Base LineTargeting
No declaration ofthe learnerpopulation size ofthe school forequitabledistribution
Declare the official size ofeach school
30. PPI PPI 2.8 Percentage of schools whereallocated teaching posts are allfilled
MTSF Aligned 100% Statisticalindicator
Non filling ofvacancies
Immediate filling of vacantposts
31. PPI PPI 2.9 Percentage of learners providedwith required textbooks in allgrades and all subjects
MTSF Aligned 100% Universalcoverage.Nationalpronouncement
Non-implementationof retrievalsystem at schoollevel.Outcome ofdistribution VSwhat schoolsreceive
Implementation of retrievalsystem
32. PPI PPI 2.10 Number and percentage oflearners who complete the wholecurriculum each year
MTSF Aligned FET95%
To ensure thatlearners achievethe requiredskills andknowledge level
1.CommunityProtests2. Lateappointment ofteachers3. Scarce subject4. Uncontrolledmovement ofteachers
DBE is working on it

Page 25 of 208
MTSF Aligned GET95%
To ensure thatlearners achievethe requiredskills andknowledge level
1.CommunityProtests2. Lateappointment ofteachers3. Scarce subject4. Uncontrolledmovement ofteachers
DBE is working on it
33. PPI PPI 2.11 Percentage of schools producingthe minimum set of managementdocuments at the requiredstandard for instance (Schoolbudget, School Improvement Plan,Annual Report, AttendanceRegisters and Record of learnermarks)
MTSF Aligned 80%
34. PPI PPI 2.12 Percentage of SGB's in sampledschools that meet the minimumcriteria in terms of effectivenessevery year
MTSF Aligned 80%
35. PPI PPI 2.13 Percentage of schools with morethan one financial responsibilityon the basis of assessment
MTSF Aligned 100% N/A N/A N/A
36. PPI PPI 2.14 Percentage of learners in schoolsthat are funded at a minimumlevel
MTSF Aligned 100% Norms andstandards
Inflated numbers Regular head counts(sampling per quarter)
37. PPI PPI 2.15 Percentage of targeted PublicOrdinary schools that receivedtheir stationery in January
MTSF Aligned 100% Improvedaccess. Nationalmandate
Poor planning,e.g. Not in theProcurementplan, appointmentof ServiceProviders.Incorrect data
Management plan ofprocurement plan

Page 26 of 208
38. PPI PPI 2.16 Percentage of targeted PublicOrdinary schools that receivedtheir text books in January
MTSF Aligned 100% Improvedaccess. Nationalmandate
Poor planning,e.g. Not in theProcurementplan, appointmentof ServiceProviders.Incorrect data
Management plan ofprocurement plan
39. PPI PPI 2.17 Number of workbooks procuredfor top up
MTSF Aligned 135 000 Trend analyses Late submissionfor top ups,Inaccurate data
Improved quality of data
40. PPI PPI 2.18 Number of schools provided withextra support for the achievementof safety measures
MTSF Aligned 80
41. PPI PPI 2.19 Number of school basededucators trained on otherinterventions excludingMathematics (PPM 209) andLanguages (PPM 208) contenttraining
MTSF Aligned 9688 Closes the fiveyear target
1.Delayedprocurementprocess
Plan in advance and theprocess to be started in time
42. PPI PPI 2.20 Number of school basedadministrative employees trained
MTSF Aligned 956 Target based onthe budget
Non-attendancedue to competingpriorities(wastefulexpenditure)
Consequence Managementfor non-attendance
43. PPI PPI 2.21 Number of new bursaries awardedto school based employees(excluding reinstatements)
MTSF Aligned 288 Identified scarceand critical skills
Wastefulexpenditure dueto failingstudents, latesigning ofcontracts bybeneficiaries
Regular communication s

Page 27 of 208
44. PPI PPI 2.22 Percentage of women inPrincipalship posts
MTSF Aligned 50% Employmentequity
More malesoccupyingprincipal shipposts
Adherence to the equity plan
45. PPI PPI 2.23 Number of learners provided withsanitary towels
MTSF Aligned 10 000 Budgetlimitation
N/A N/A
46. PPI PPI 2.24 Number of learners who benefitfrom learner transport
MTSF Aligned 58 000 N/A N/A N/A
47. PPI PPI 2.25 Number of learners with specialeducation needs identified inpublic ordinary schools
MTSF Aligned 1414 N/A N/A N/A
48. PPI PPI 2.26 Number of events supported byschool enrichment programmes
PronouncementMTSF Aligned
30 Responding tooutcome 13(Nation buildingand cohesion)
Age cheatingAvailability oflearners
Regular meeting with theschool code structures.Regular update on SA SAMS.
49. PPM PPM301 Percentage of registeredindependent schools receivingsubsidies
MTSF Aligned 45% N/A N/A N/A
50. PPM PPM302 Number of learners at subsidisedregistered independent schools
MTSF Aligned 9200 N/A N/A N/A
51. PPM PPM303 Percentage of registeredindependent schools visited formonitoring and support(a) SUBSIDIZED(b) NOT SUBSIDIZED
MTSF Aligned 100%
100%
N/A N/A N/A
52. PPM PPM401 Percentage of special schoolsserving as Resource Centres
MTSF Aligned 13% N/A N/A N/A
53. PPM PPM402 Number of learners in publicspecial schools
MTSF Aligned 7440 N/A N/A N/A

Page 28 of 208
54. PPM PPM403 Number of therapists/specialiststaff in special schools
MTSF Aligned 35 Statisticalindicator
Non filling ofvacancies/pressure oncompensationbudget
Immediate filling of vacantposts
55. PPI 4.1 Number of Special schoolsprovided with assistive devices
MTSF Aligned 32 These are allspecial schools
N/A N/A
56. PPI 4.2 Number of special schools MTSF Aligned 32 These are allspecial schools
N/A N/A
57. PPI 4.3 Number of learners in specialschools provided with assistivedevices
MTSF Aligned 70 N/A N/A N/A
58. PPM PPM501 Number of public schools thatoffer Grade R
Action plan 980 To comply withuniversalizationof Grade R inaccordance withthe NDP
1.Unreliable dataBack log of GradeR ( customizedinfrastructure)
1.Timeuos capturing andVerification of dataPrioritization of Grade RCustomaries class room
59. PPM PPM502 Percentage of Grade 1 learnerswho have received formal Grade Reducation.
Action Plan 70% To Ensure thatvery learnersgoes throughGrade R
1.Unreliable dataBack log of GradeR ( customizedinfrastructure)
1.Timeuos capturing andVerification of dataPrioritization of Grade RCustomaries class room
60. PPI 5.1 Number of Grade R schoolsprovided with resources (includeanimated toys)
Pronouncement 504 504 To enhanceimplementationof Grade Rteaching andlearning
Unreliable needs analysisdataorganizational Structuraldeficiencies
61. PPI 5.2 Number of Grade R Educatorstrained
Action Plan 105 105 To CapacitateGrade R teachers
Nonattendance of teachersUnreliable data on Persal

Page 29 of 208
62. PPI 5.3 Number of practitioners trainedon NQF 4 and above
Action Plan 731 731 To ensure theprofessionalism ofPractitioners inECD centres
Data base of Practitionersfrom DDSMigration of practitioners
63. PPM PPM601 Number of public ordinaryschools provided with watersupply
Action Plan N/A N/A N/A N/A
64. PPM PPM602 Number of public ordinary schoolsprovided with electricity supply
Action Plan N/A N/A N/A N/A
65. PPM PPM603 Number of public ordinary schoolssupplied with sanitation facilities
Action Plan 22 Budgetavailability andmarket relatedprices
Managementchallenges andcapacity
Increase Infrastructurehuman capacity
66. PPM PPM604 Number of additional classroomsbuilt in, or provided for, existingpublic ordinary schools
Action plan 13 Budgetavailability andmarket relatedprices
Managementchallenges andcapacity
Increase Infrastructurehuman capacity
67. PPM PPM605 Number of specialist rooms builtin public ordinary schools(includes replacement schools)
Action Plan 7 Budgetavailability andmarket relatedprices
Managementchallenges andcapacity
Increase Infrastructurehuman capacity
68. PPM PPM606 Number of new schoolscompleted and ready foroccupation (includes replacementschools)
Action plan 7 Budgetavailability andmarket relatedprices
Managementchallenges andcapacity
Increase Infrastructurehuman capacity
69. PPM PPM607 Number of new schools underconstruction (includesreplacement schools)
MTSF Aligned 3 Budgetavailability andmarket relatedprices
Managementchallenges andcapacity
Increase Infrastructurehuman capacity
70. PPM PPM608 Number of new or additionalGrade R classrooms built (includesthose in replacement schools)
Action Plan 9 Budgetavailability andmarket relatedprices
Managementchallenges andcapacity
Increase Infrastructurehuman capacity

Page 30 of 208
71. PPM PPM609 Number of hostels built MTSF Aligned 1 Budgetavailability andmarket relatedprices
Managementchallenges andcapacity
Increase Infrastructurehuman capacity
72. PPM PPM610 Number of schools in whichscheduled maintenance projectswere completed
Action Plan 15 Budgetavailability andmarket relatedprices
Managementchallenges andcapacity
Increase Infrastructurehuman capacity
73. PPI 6.1 Number of special schoolsupgraded
Action Plan N/A N/A N/A N/A
74. PPI 6.2 Number of existing PublicOrdinary Schools converted intofull services schools
Action Plan N/A N/A N/A N/A
75. PPM PPM701 Percentage of learners whopassed National Senior Certificate(NSC)
MTSF Aligned 84.5%*29340/34953
N/A N/A N/A
76. PPM PPM702 Percentage of Grade 12 learnerspassing at bachelor level
MTSF Aligned 29.0%*10197/34953
N/A N/A N/A
77. PPM PPM703 Percentage of Grade 12 learnersachieving 50% and above inMathematics
MTSF Aligned 27.0%*2733/10122
N/A N/A N/A
78. PPM PPM704 Percentage of Grade 12 learnersachieving 50% or more in PhysicalScience
MTSF Aligned 25.0%*2238/8950
N/A N/A N/A
79. PPM PPM705 Number of secondary schools withNational Senior Certificate (NSC)pass rate of 60% and above
MTSF Aligned 370 N/A N/A N/A

Page 31 of 208
2. NATIONAL DEVELOPMENT PLAN: VISION 2030
'Inclusion and equity in and through education is the cornerstone of a transformative education agenda,and we therefore commit to addressing all forms of exclusion and marginalization, disparities andinequalities in access, participation and learning outcomes. No education target should be considered metunless met by all.” ‘World Education Forum: Incheon Declaration, 2015, article 7.
The NDP 2012(Page: 7) objective states:
“The different parts of the education system should work together allowing learners to take differentpathways that offer high quality learning opportunities.”
The National Development Plan proposes to eliminate poverty and reduce inequality by 2030 throughuniting South Africans, unleashing the energies of its citizens, growing an inclusive economy, buildingcapabilities and enhancing the capability of the state and leaders by working together to solve complexproblems
Figure 1: NDP objectives (NDP: 2012; P 27)
The National Development Plan for the Education Sector draws on “Action Plan to 2019: Towards therealisation of Schooling 2030” and the proposal in the Green Paper for Post School Education and Trainingin developing plans, strategies, programmes and policy initiatives. The aim of the National Development

Page 32 of 208
Plan is to ensure that South Africans have access to education and training of a high quality, leading tosignificantly improved learning outcomes by 2030. We envisage that all schools will provide learners withan excellent education, especially in literacy, mathematics and science.
The NDP focuses its efforts around four sub-sectors of the education, training and innovative system:
Early Childhood Development Basic Education Post-School education and training The national research and innovation system.
Figure 2: NDP outcomes on education (NDP: 2012; P 30)
The sub-outcomes in the NDP that are also fundamental to the North West, include:
Access to quality Early Childhood Development (ECD) Improved quality teaching and learning Capacity of the state to intervene and support quality education Increased accountability for improved learning Human resources development and management of schools Infrastructure and learning materials to support effective education
The NDP endeavors to cater for different needs and produce highly skilled individuals to meet the futureneeds of the economy and society. To achieve this cohesion, the different parts of the education systemshould work together to allow learners to take different pathways that offer high quality learning

Page 33 of 208
opportunities. This demonstrates the clear link between schools and FET colleges, universities and othereducation and training providers.
“We, the people of South Africa, have journeyed far since the longlines of our first democratic election on 27April 1994, when we elected a government for us all.We began to tell a new story then .We have lived and renewed that story along the way.Now in 2030 we live in a country which we have remade…”
3. MEDIUM TERM STRATEGIC FRAMEWORK (MTSF)
Figure 3: Planning route towards MTSF (NDP: 2012; P 52)
Chapter one of the Medium Term Strategic Framework (MTSF) opens as follows: “The NDP’s vision for 2030is that South Africans should have access to training and education of the highest quality, characterized bysignificantly improved learning outcomes”. The education output priorities of the MTSF are:
Improved quality of teaching and learning through development, supply and effective utilization ofteachers.
Improved quality of teaching and learning through provision of adequate quality infrastructure andLearning and Teaching Support Materials (LTSM).
Tracking of learner performance through reporting and analysis of the Annual National Assessment(ANA) at Grade 3, 6 and 9 level and improving ANA over time to ensure appropriate feedback tolearners and teachers and to benchmark performance over time.
Expanded access to Early Childhood Development and improvement of the quality of Grade R. Strengthening accountability and improving management at the school, community and district
level. Partnerships for education reform and improved quality.
Our focus on these will intensify as systems and indicators are incrementally put into place, bothprovincially and at a national level, and budgets and models are adapted as required. Each of the outputs

Page 34 of 208
has a set of sub-outputs, activities and linked indicators. There are not yet baseline readings on some ofthese. Those that are a provincial responsibility are described under the relevant headings and targets havebeen set for the linked indicators.
4. THE SECTOR PLAN: SCHOOLING 2030
The South African education sector plan is set out in Action Plan 2019, towards Schooling 2030. The plancontains 27 goals. The first 13 goals deal with learning outcomes and the other 14 goals deal with howthese learning outcomes will be achieved.
The 27 goals are linked to indicators, and to targets and their milestones. The number of goals is limited;the indicators are expressed clearly and are measurable. The targets need to be ‘in range’ and shouldimprove education outcomes incrementally. They are disaggregated per province and should not beregarded as a ceiling. National targets have been set over the long term and milestones focus on desiredachievements in the medium term (up to five years into the future). National milestones have been set forperformance goals 1 – 13. Milestones are not specified for goals 14 to 27.
The goals for the learning outcomes are:
Increase the number of learners in Grade 3 who by the end of the year have mastered theminimum language and numeracy competencies for Grade 3.
Increase the number of learners in Grade 6 who by the end of the year have mastered theminimum language and mathematics competencies for Grade 6.
Increase the number of learners in Grade 9 who by the end of the year have mastered theminimum language and mathematics competencies for Grade 9.
Increase the number of Grade 12 learners who become eligible for a Bachelors programme at auniversity.
Increase the number of Grade 12 learners who pass mathematics. Increase the number of Grade 12 learners who pass physical science. Improve the average performance of Grade 6 learners in languages. Improve the average performance of Grade 6 learners in mathematics. Improve the average performance in mathematics of Grade 8 learners. Ensure that all children remain effectively enrolled in school at least up to the year in which they
turn 17. Improve the access of children to quality early childhood development (ECD) below Grade 1. Improve the grade promotion of learners through Grades 1 to 9. Improve the access of youth to Further Education and Training beyond Grade 9. The goals for how the learning outcomes will be achieved are: Attract in each year a new group of young, motivated and appropriately trained teachers into the
teaching profession. Ensure that the availability and utilization of teachers is such that excessively large classes are
avoided. Improve the professionalism, teaching skills, subject knowledge and computer literacy of teachers
throughout their entire careers. Strive for a teacher workforce that is healthy and enjoys a sense of job satisfaction. Ensure that learners cover all the topics and skills areas that they should cover within their current
school year.

Page 35 of 208
Ensure that every learner has access to the minimum set of textbooks and workbooks requiredaccording to national policy.
Increase access amongst learners to a wide range of media, including computers, which enrichtheir education.
Ensure that the basic annual management processes occur across all schools in the country in away that contributes towards a functional school environment.
Improve parent and community participation in the governance of schools, partly by improvingaccess to important information via the e-Education strategy.
Ensure that all schools are funded at least at the minimum per learner levels determined nationallyand that funds are utilized transparently and effectively.
Ensure that the physical infrastructure and environment of every school inspires learners to wantto come to school and learn, and teachers to teach.
Use schools as vehicles for promoting access to a range of public services amongst learners in areassuch as health, poverty alleviation, psychosocial support, sport and culture.
Increase the number of schools which effectively implement the inclusive education policy andhave access to centres which offer specialist services.
Improve the frequency and quality of the monitoring and support services provided.
5. SECTORAL NON-NEGOTIABLES
The Ten Non-Negotiables form parts of the key deliverables of the Department in order to fast track someof the key imperatives of government in the basic education sector. The essential work of the Departmentis primarily aligned with the educational outputs in the Medium Term Strategic Framework (MTSF) and isfundamental to the successful attainment of the outputs, as outlined below.
Learning and Teaching Support Material
MTSF Output 2: Improved quality of teaching and learning through provision of adequate, qualityinfrastructure and learning materials
We will increase emphasis on special and full service schools so that all learners have access to qualityeducation with all the necessary support and resources.
Infrastructure
MTSF Output 2: Improved quality of teaching and learning through provision of adequate, qualityinfrastructure and learning materials
The Department will ensure that all schools have running water, electricity and functional toilets, and allblocked toilets are cleared with immediate effect. A plan will be developed to accomplish the delivery ofquality basic infrastructure accompanied by routine maintenance.
Districts
MTSF Output 5: Strengthening accountability and improving management at the school, community anddistrict level
The focus of this pillar is on deepening the support provided to school management by head-office anddistrict offices through virtual District structures. Effective District Management is essential as Districts arelargely responsible for curriculum implementation and support.

Page 36 of 208
Teacher Placement, Deployment and Development
MTSF Output 1: Improved quality of teaching and learning through development, supply and effectiveutilization of teachers
The Department will implement its Teacher Development Strategy to enhance teacher development incurriculum delivery, management and assessment. The in-service training component will increase teachercompetence in the use of ICT to improve quality teaching and learning. The recruitment policy will berevised to ensure that only the best teachers are employed in North West schools. All appointments will beconcluded on merit and marked by competence, trust and integrity. Personnel in excess will beappropriately dealt with.
Information Communication Technology
MTSF Output 1: Improved quality of teaching and learning through development, supply and effectiveutilization of teachers
The Department has launched multiple projects to introduce technology into the education system. Theseprojects will be consolidated into a single strategy, along with all lessons learnt. The strategy will involvethe process of the implementation of South African School Administration System (SA-SAMS), e-Education;the introduction of an e-Learning Solution Project; the expansion of communications and ICT roll-out;Teacher Training Programme; Data-driven Decision-making rollout to all district Satellite Broadcast Project;Communications Project; Teacher Centres and school-based ICT projects.
Library Services
MTSF Output 2: Improved quality of teaching and learning through provision of adequate, qualityinfrastructure and learning materials
To improve learner performance across the phases in schools, educators will be trained in the managementof library trolleys and the teaching of literacy whilst the Department will support schools in the optimal useof these resources.
Rural schools
MTSF Output 1: Improved quality of teaching and learning through development, supply and effectiveutilization of teachers
To improve learner performance across primary school grades, the Department has begun institutionalizingand mainstreaming the key intervention programmes into districts. This is to ensure that the support toteachers, learners and schools becomes a daily task of the district officials to ensure a sustained qualityimprovement trajectory across primary schools.
Curriculum
MTSF Output 1: Improved quality of teaching and learning through development, supply and effectiveutilization of teachers
Accountability sessions with school management will be central to ensure the key thrusts of theDepartment are being met. The strengthening of subject advisor capacity to support schools will beprioritized together with improved management and support to schools.

Page 37 of 208
MTSF Output 3: Regular annual national assessments to track improvements in the quality of teaching andlearning
The Department will consolidate all achievements obtained and ensure that consistency and steadyprogress marks the path moving forward. The focus will include improvements in learner performance.
Furthermore, 10 of the 21 schools identified as part of the “21 school model” will be provided with thenecessary support to ensure that there is a complete turnaround in learner performance and become themodel schools of the province.
MTSF Output 4: Improved Grade R and planning for extension of ECD
This output prioritizes Grade R to ensure that all learners have access to Grade R. Furthermore Grade R andpre-Grade R practitioners will receive training to improve their qualification levels. Grade R will also beprioritized in respect of access to learner support material.
Partnership and social mobilization
MTSF Output 6: Partnerships for a strong Education System
The Department will strengthen stakeholder and community involvement in education and their support toschools. Partnerships with various organizations and stakeholders will be entered into to support ourinitiatives.
The coming financial year will bring along new changes, approaches and more events in the department inorder to attain our key priorities without fail.
6. DELIVERY AGREEMENT UPDATE
Government has agreed on 14 outcomes as a key focus of work between now and 2030. Each outcome hasa limited number of measurable outputs with targets. Each output is linked to a set of activities that willhelp achieve the targets and contribute to the outcome. Each of the 14 outcomes has a DeliveryAgreement which in most cases involves all spheres of government and a range of partners outsidegovernment. Combined, these agreements reflect government’s delivery and implementation plans for itsforemost priorities.
This Delivery Agreement is a negotiated charter which reflects the commitment of the key partnersinvolved in the direct delivery process to working together to undertake activities effectively and on timeto produce the mutually agreed-upon outputs which in turn will contribute to achieving outcome 1,‘improved quality of basic education’. This Delivery Agreement should be read in conjunction with the plantitled Action Plan to 2019: Towards the realisation of Schooling 2030 (published as Government Notice 752of 2010). That document, which is the outcome of consultations with stakeholders, is envisaged as theDepartment of Basic Education’s primary vehicle for communicating key sectoral strategies to stakeholders.
The Performance Indicators for the eight Sub-Outputs are aligned with the national indicators as it relatesto the 27 Goals. We have revised our Strategic Objectives for 2016/2017 to integrate these PerformanceIndicators with our performance information. This integration necessitated a revision of the OperationalPlans to ensure that the execution is done on a daily basis and monitored on a quarterly basis.

Page 38 of 208
The Department of Education is responsible for Outcomes 1.
Outcomes 1
The Department is progressively implementing universalization of access to primary school. Even thoughthis year, the department could not provide Grade R resources, a number of Grade R classrooms were builtand at least 92 ECD practitioners and 192 Educators were trained. LTSM was also procured for Grade Rlearners.
LAIP continues to track performance on ICT Provision and Support and Utilization; LTSM Provision andSupport and Utilization; Subject-specific interventions: Improving Language proficiency (EAC / EFAL);Support for progressed learners; Tracking learner performance; Measuring impact of interventions.Interventions are for both learners and teachers. Monthly reports are used to identify gaps and addressthem. This plan has ensured that the department continued to improve and retain the above 80%performance in Matric results.
Governance in schools plays a critical role on how the school performs. The department continues to trainSGB’S, RCL’s and SMT’s on governance matters. Selected SGB’s are also assessed to check their level ofeffectiveness.
1 300 public schools are electronically accessible by the officials of the department and stakeholders suchas parents through the use of e-mails. Officials at Corporate, district offices, Area Offices and circuits areable to send circulars, providing supplementary materials and getting information from schools rapidly.
It is mandatory that schools are visited regularly to undertake regular assessments and track progress oncurriculum coverage. In the endeavour to achieve that, 1 387 schools were visited by district officials formonitoring and support purposes.
100 unemployed youth received an internship from the department. 148 unemployed youth were grantedbursaries.
370 out of secondary schools with National Senior certificate (NSC) received a pass rate of 60% and above.
Learner and teacher absenteeism are monitored as a result improving the attendance. In order to improveadministrative and management capacity 720 Office Based Employees were trained. 13 new bursaries wereawarded to office based employees.

Page 39 of 208
7. UPDATED SITUATIONAL ANALYSES
1. PERFORMANCE DELIVERY ENVIRONMENT
a. Demographic facts about the North West
The main concentrations of economic activity provide the regional activity centers, which providecollectively the basis for the development of future development corridors and already accommodate astrong urbanization trend. Approximately 63% of the total economic activity of North West is concentratedinto the 4 local economies of Madibeng, Rustenburg, Mahikeng and Matlosana Municipalities. Thesemunicipalities represent approximately 50% of the North West population and 58% of the North Westlabor force (STASTSA 2018).
All the main concentrations experienced very low or declining economic growth rates. The populationgrowth rates within these concentrations are exceeding the province population growth rates by farespecially in Madibeng (2.4%) and Rustenburg (3.1%)(Mid Population statistics 2018).
Should slow economic growth rates prevail, it can be expected that it will assist in lower incomes and GVA’sper capita and higher unemployment. High employment growth rates are however necessary to ensure theeradication of poverty. The concentration of economic activities into the 4 municipalities supported by thelarge accessible activity nodes of Madibeng, Rustenburg, Mahikeng and Matlosana provides a strong basisfor further urbanisation and nuclei for attracting and distributing economic development.
The total population of the North West is 3,856,200 it makes 6.8% of the total South African population.The graph below shows the population growth of the North West Province. It is notable that there hasbeen a gradual increase of the population as shown in the graph below (Mid Population statistics 2018).The implications of population growth for any government is that it will put pressure on government interms of service delivery and other concomitants to cater for all people or communities. In essence, thisput strain on the already limited resources. It is against this backdrop that planners and decision makers orstrategists need to consider the integration of population information when planning. The most importantquestions to note are: How large is the population in relation to resources that will be made available tothe sector during the planning period and how will the population distribution affect the provision ofservices?

Page 40 of 208
Figure 5: Population concentration by municipality and effects on education demand (Land use Report:2018)
Statistic South Africa’s mid population estimates demonstrated that the population of South Africa hasincreased from 40, 6 million in 1996 to 51, 7 million in 2011. For the year 2017, the South AfricanPopulation increased by 3,8 million. It was also noted that the number of households in the country hasalso significantly increased from 14, 5 million in 2011 to 16, 9 million in 2017. In terms of the Age-sexdistribution, it is worth noting that South Africa comprises of a youthful population. The majority or thehighest proportions of both the male and female population were recorded between the 0 – 4 and 5 – 9age cohorts.
According to this analysis by age groups, it shows the largest increase in population amongst those aged 5–9 years (from 4, 8 million in 2011 to 5, 6 million in 2016). South Africa experienced a positive populationgrowth year on year, since 2002 until to date. There was an overall increase in life expectancy (55, 2 to 62,4 years) and a decline in infant (48, 2 to 33, 7 deaths per 1000 live births) and under 5 mortality rate (70,8to 44,1 deaths per 1000 live births). A third of the population is estimated to be under the age of 15, whilst8% of the population is aged of 60 and over. There has been a proportional population growth by 1.5%between 2011 and 2016.

Page 41 of 208
Figure 6: Demand for Education by demographics (STATSA 2018)
The North West population structure in terms of age and gender suggest that, it is critical that largeinvestments are channeled to the Early-Childhood Development sector and education in general. Post-matriculation training remains essential for young people aged between 20 – 34 years who form the largestpopulation cohort in the province. There is a need therefore to implement viable Economic andGovernance Policies that will adequately respond to this growing young population. Population informationforms an important foundation of planning process in many countries, governments, private institutionsand communities. For effective budget planning processes and resource allocation, it is salient thatgovernment clearly understands population dynamics with special emphasis on age and gender.
Large Population concentrations
Large population concentrations are represented by Moretele, Moses Kotane, Disobotla, RamotshereMoiloa, Greater Taung, Tlokwe, Ratlou, Tswaing and Kagisano. These economies make up 30.5% of thetotal North West population and represent 28% of the total provincial economy and 29% of its labourforce. The rural community areas, representing poverty pockets with low levels of social, economic andengineering infrastructure are spatially segregated from main economic activity nodes and people of theseareas have to travel long distances to employment and service nodes. These areas have little economicdevelopment potential and have to rely on social grants and public capital spending.
The medium size population concentrations (population 100000-150000)
The medium sized population concentrations are represented by Ratlou, Tswaing and Kagisano-Molopo.The population represents 9.7% of the North West population, the economy 2.9% and labour force 14.5%.Tswaing has the highest population growth rate at 0.9% p.a.
All local economies are not growing or declining. Employment experienced limited or negative growth.
Small population concentrations (population 100000-150000)
Small population concentrations are represented by Kgetlengrivier, Naledi, Mamusa, Lekwe- Teemane,Ventersdorp and Maquassi Hills. The population represents 10.0% of the North West population, the

Page 42 of 208
economy 6.4% and labour force 8.8%. Kgetlengrivier (2.6% p.a) and Ventersdorp experiences the highestpopulation growth rates with LekwaTeemane declining at -0.4% p.a. With the exception of Ventersdorp(0.3% p.a.) and Maquassi Hills (1.2% p.a.) all the municipalities have declining economies.
Figure 7: Population concentration in the North West (STATSA 2018)
Migration is an important demographic process in shaping the age structure and distribution of theprovincial population. The population of women in the world or globally are in the majority whencompared to their male counter-parts. In the main, women are the ones who suffer the brunt of poverty,unemployment and inequality when compared to the male population. In the context of the North WestProvince there are more males compared to the female population as cited in the Community Survey of2016. The survey recorded that there are 1 909 589 males compared to 1 838 846 females in the Province.
It is also significant to note other variances and disparities in terms of gender in some local municipalities.For instance the majority of the males were recorded in Bojanala Platinum District in particular atRustenburg; Madibeng and Kgetleng River local municipalities. It was therefore deduced that this maylargely be attributed to the mining activities and other big industrial zones found in these areas.Consequently the majority of men migrate to these areas in search of better employment opportunities.This on its own has implication for planning.

Page 43 of 208
Figure 8: Population pyramid of the North West (STATSA 2018)
Spatial and Other Issues in the Strategic External/Internal Environment of Service Delivery of theDepartment of Education.
Disjuncture in terms of space of work and growth and employment
We know that
“the spatial configuration of our country is not only the product of growth but also apartheid spatial planning – adisjuncture exist between where people live and where economic opportunities exist. This spatial marginalization fromeconomic opportunities is still a significant feature of our space economy that needs to be addressed in order to reducepoverty and inequality, and ensure shared growth…. Apartheid spatial planning ensured that the mass of our peoplewere located far from social and economic opportunities”.
The educational spatial patterns during apartheid mirrored the above disjuncture. All schools in the DETand Banstustan apartheid architecture were constructed to ensure marginalization from the educationalopportunities and positive outcomes. The spatial patterns ensured delivery of education for ‘oppression’,‘subjugation’ and ‘barbarism’.
Corruption as one feature of the service delivery environment
Corruption is stated as one of the highs in the South Africa in the past five or more years. It is debated andreported mainly from its economic and service delivery negative impact view. The educational view, thatmanagement and leadership corrupt practices are becoming the culture of the society is not publicly givena greater percentage share of time and space. It characterizes the neo-colonial and apartheid reproductionof itself as learners and youth see corrupt practices as legitimate and the way of life (culture). The cycle ofmanagement and leadership violent criminal corruption practices are exploited by the Africa pessimisticforces and voices to blame the victims of the colonial and apartheid state, orders and legal regimes.Children and youth as learners from the river of leadership and management corrupt practices swim inside

Page 44 of 208
this society and do not find it clean. They are labelled permanently and inherently criminals. For the Africanpessimists and doomsayers, it is fait accompli.
Do we need BUT in policy Command within Strategic Context.
Expropriation, ‘redistribution’ and ‘restitution’ of land through amended section 25 in terms of genderparity and women empowerment will and should impact new settlement patterns and household dwellingsin the North West. Concomitantly it will impact on school infrastructure delivery as a consequence ofappropriated land to new owners. Consequently, equality of racial groups should impact inequality of bothincome and wealth, the latter being the key determinant of reduction or elimination of poverty. The caseof white commercial farmers who till today are still transporting their children to their separate schoolsfrom the African people is another aspect of this issue, where the impact should be equality not before thelaw only but the objects of the right to equality, that is land, education about land, wealth, education aboutwealth not only about the poorest of the poor or poverty or education about the poor. (-Systematicanalysis of studies shows and will show that the poor knows that they are poor, exploited, and oppressedhence the struggle for freedom-). For instance the redistribution of land should bring about completedestruction of the classification of schools into quintiles as above (where 1 is from the least spatiallywealthy while 5 is a school from historically and spatially highly opportune, from where there are greaterchances of getting educated and getting to be employed)
The Political – The Conflict Issue
It is evident that the colonial and apartheid ‘divide, separate and rule’ has been translated and reproducedmanifestly as political disunity and factionalism, class division, the rich and the poor (high gini-coefficient:.67). This is even where and when the new constitutional and legislative frameworks allow and serve as thebasis for unity in purpose for the different political stakeholders. For instance, in the years past, thegovernment machinery has been party politicized instead of becoming powerful and developmental statesystem in the transformation of the whole society. Consequently, protests have been the response to theeffects of these political issues and dynamics.
The Service Delivery Protests
Protests are evidence of the community contestation within the political and socio-economic context whoattempt to record reality to power. A study by Runciman,C., Maruping, B. &Moloto, B. of University ofJohannesburg make the following findings.
Planning to satisfy protestors’ issues cannot mean planning to teach them about the violent and disruptivenature of protests. Besides, there is a need to acknowledge and live the prescript of Chapter 2 of theConstitution which provides rights to protest actions in different forms albeit within the law. Studies onpost-coloniality and or neo-colonial demonstrate the need to decolonize the curriculum since protesting isa form of struggle or toying-toying. There is a need to structure them academically and scientifically as theyare the processes of resistance to oppression through radical transformation and contestation.Consequently they are the aspect of valorisation and affirmation of the people experiences throughout,including in new settlement areas so as to explain why, how and when did the people settle where theyare.
Evidently the trend is not of the number of protests decreasing, instead the inverse holds. The protests arein most cases linked with disruption of schooling time and mostly involve learners roped in to supportsome service delivery issues. Evidently both valorisation of the people’s experiences and skills development
Page 45 of 208
should be integrated into policy intervention to ensure service delivery for the communities. This is a formof decolonization of the curriculum therefore the education system.
The point identified and repeated is that most of these protests tend to involve the youth and in particularthe learners. Talking to the issue of the cause of these protests, the study indicates that “more gravelythough is that it probably misdiagnoses the cause of service delivery failures. Lacks of skills are (ibid)unlikely to be the main cause of protests in the face of allegations of corruption, nepotism and politicalinterference. According to an OECD study on political involvement in bureaucracies, South Africa came nearthe top of culprits. A crude form of patronage which involves the appointment of families and friends togovernment posts was found to be most pronounced at local government level (Cameron, P687)”. On theother hand the study provides an alternative explanation for youth participation in protest as “of youth…with much more agency in their own actions. It sees young people as instigators of protest, politicallyinvolved and assumes that the youth are already educated to a substantial degree. An Afrobarometersurvey in 2012, for example, suggested that the segment of the population with the greatest propensity toattend protests was people with some university education but who had not completed it. That is exactlyas Kunene discovered in his research on the composition of the Crisis Committee in Phomolong who werebehind the service protests there. The Committee was made up of young, unemployed people and at leastthree had been unable to complete higher education due to a combination of lack of financial andacademic support.”
Clearly, protests are an evidence of how and how not the communities are experiencing services or noservices at all. Change in curriculum and ways of knowing should be attended to ensure transformation andrechannelling of protest energy into radical socio-economic transformation and its return on investments.Protests like the struggle for freedom are high risk investments in human development and therefore thereturns cannot be low.
The Socio-Economic: government as the provider, trainer and preacher
North West province with mining industry as key economic sector has the greatest percentage share ofcontribution to the GDP. This establishes the fact that mining cannot be seen as a foreign direct investmentbut maybe foreign direct invasion. Mining industry does invest in mineral extractive infrastructure but theleast in manufacturing and beneficiation let alone local research and innovation in the labour intensiveproduced raw material. It does not engage in economic activities that add value to the products like skillsdevelopment or human capital building such as in engineering to the extent it is required to add to thestatistical targets of the National Development Plan and including those of The Africa We Want aspirations,Agenda 2063. Most high skills and capacities are imported or highly concentrated in the colonial andapartheid beneficiaries.
Why is it that there is no University of Technology in Rustenburg which has highest net migration in theNorth West and has the highest deposit of Platinum or Platinum Group Metals second only to Russia? Whatpolicy implications are here: Free tertiary technical/engineering education, Industrialization/beneficiationof raw products that will ensure skills development, a quota system that ensures only a small portion of themineral outputs exported raw? This seems to be the policy direction without BUT. Apartheid historicallyspatial disjuncture ensured no access to education properly defined and provided for those who have beenexcluded and now are historically disadvantaged.

Page 46 of 208
Table 23: School related population data (STATSA 2018)
Distribution of population aged 5 and older by attendance at an educational institution - percentages
All South Africans have a right to basic education. This is enshrined in the Bill of Rights of the South AfricanConstitution which obliges the South African Government to progressively make education available andaccessible through all reasonable measures. The development of human population constitutes theultimate basis for the wealth of a nation. It is against that backdrop and it is salient for a country andProvinces in particular to develop the skills and knowledge of its human population to the greater benefitof all.
b. Learner population data
The North West Province has recorded a total of 50.1 % males and 49.1% females attending educationalinstitutions. The number of persons attending educational institutions has increased over time for persons5 years and older. There are more females attending educational institutions than males. In terms of non-attendance at educational institutions, the North West Province recorded 51.4 % males compared to theirfemale counter-parts at 48.6%.
Enrolment rates (education access rates)
Type of institution NW RSA
Pre- school 2,6 2,8
School 89,2 88,0
AET 1,4 0,7
Literacy classes 0,1 0,1
Higher education institutions 3,6 4,4
TVET 1,9 2,5
Other Colleges 0,7 1,1
Home schooling 0,0 0,1
Other 0,6 0,3
Total 1 048 16 068

Page 47 of 208
Figure 9: Enrolment of Learners of Selected Grades/Year (EMIS 2018)
Data Source: DBE-NW own calculation
A policy success of introduction and implementation of pre-schooling structured learning in the form ofGrade R (ECD Programme) is showing by the upward trend line. The upward trend of access/increase ofgrade R learners starts in 2003/4, and after five years it picks up in 2010 and continues steadily the upwardmovement. We notice the downward counts of learner enrolment in grade 12.
What is of interesting observation is the gap between increased/retention of enrolment of grade R learnersvs the increase in retention of grade 12 learners post 2009 onward seemed to have narrowed as comparedto the gap in the period before. This suggests and assumes a positive causal association where increase inthe number of the grade R learners with structured learning experience (curriculum) having an effect ingrade 12 learner retention as grade R learners move across the years towards grade 12. This associationseems to hold with other grades also as there is a levelling from 2007.
Recent study from Stellenbosch University is reporting that the children of high classes gain more fromGrade R (ECD) structured learning as compared with those from the poor people with poorfacilities/resources and poor quality structured learning experiences.
However, studies are plenty to evidence that investment in pre-schooling learning (ECD) has greater returnon investment than at FET systems, the strength of the foundation of the system determines the wholesystem’s success.
Y1997 Y1998 Y1999 Y2000 Y2001 Y2002 Y2003 Y2004 Y2005 Y2006 Y2007 Y2008 Y2009 Y2010 Y2011 Y2012 Y2013 Y2014 Y2015 Y2016 Y2017
Grade 12 51 46 52 82 46 59 42 83 39 88 38 47 36 57 36 94 35 21 34 64 32 46 34 82 33 35 30 33 26 02 28 23 29 97 26 88 34 39 36 26 35 59
Grade 9 71 80 69 16 70 24 68 63 67 88 81 72 70 69 68 22 66 54 66 63 61 79 58 09 59 58 63 26 63 76 65 30 68 21 68 80 59 59 57 89 58 57
Grade 6 75 86 76 33 75 86 76 80 81 09 80 71 91 44 73 91 59 11 57 80 60 99 63 23 62 68 59 89 59 60 61 05 59 92 58 53 60 41 62 61 64 63
Grade 3 104 8 98 10 94 92 87 12 81 81 66 42 73 90 83 12 77 62 69 64 69 16 68 68 68 76 64 39 64 16 65 94 70 57 71 97 72 42 74 52 75 39
Grade 1 101 4 89 91 83 36 79 76 79 69 95 34 88 09 84 77 82 50 75 20 73 58 74 97 73 97 73 32 76 73 75 92 78 11 79 86 80 49 79 25
Grade R 1 629 2 327 3 444 3 331 3 171 3 080 4 325 5 284 9 737 13 67 15 75 22 29 30 17 42 01 42 93 44 48 47 74 50 64 50 73 51 42 54 19
-20 000
0
20 000
40 000
60 000
80 000
100 000
120 000
Lear
ner E
nrol
men
t-Ac
tual Trend Analysis - Enrolment: Grade R, 1, 3, 6, 9 and 12 in Years

Page 48 of 208
Figure 10: Trend Analysis: Learner Loss and Gain across the Years (EMIS 2018)
Data Source DBE – NW own calculations
It is observed that as the learners move from grade to grade from 1997, in the selected grades viz R, 1, 3, 6,9 and 12 there are losses and gains of learners. Greater losses are observed to be during the period prior2007. Accumulative gains in contrast are in the period beyond and in particular in grade R in 2010.
It can only mean that policy interventions are improving the outputs of the system but not enough sincethe ratio between those admitted at entry level and those at the final matric exit level is vast.
Trend Analysis: Number of Educators and Schools
Figure 11: Number of Educators and Schools per Year, (2003-2017) (Data Source: DBE-NW ownCalculation)
Y1998 Y1999 Y2000 Y2001 Y2002 Y2003 Y2004 Y2005 Y2006 Y2007 Y2008 Y2009 Y2010 Y2011 Y2012 Y2013 Y2014 Y2015 Y2016 Y2017
Grade 12 1 353 -6 229 -3 761 -2 944 -1 409 -1 905 369 -1 731 -562 -2 184 2 357 -1 468 -3 024 -4 302 2 205 1 746 -3 097 7 510 1 873 -675
Grade 9 -2 636 1 076 -1 604 -756 13 840 -11 02 -2 470 -1 679 89 -4 846 -3 693 1 491 3 677 497 1 540 2 911 590 -9 205 -1 705 684
Grade 6 463 -461 940 4 287 -385 10 731 -17 52 -14 80 -1 311 3 195 2 239 -546 -2 797 -284 1 450 -1 131 -1 391 1 876 2 205 2 014
Grade 3 -6 770 -3 179 -7 796 -5 306 -15 39 7 483 9 213 -5 495 -7 987 -471 -485 80 -4 368 -235 1 783 4 629 1 406 448 2 099 867
Grade 1 -11 53 -6 552 -3 599 -75 15 657 -7 253 -3 318 -2 278 -7 297 -1 622 1 397 -1 000 -658 3 417 -811 2 185 1 754 629 -1 237
Grade R 698 1 117 -113 -160 -91 1 245 959 4 453 3 940 2 081 6 536 7 880 11 836 927 1 552 3 255 2 901 91 690 2 765
-20 000
-15 000
-10 000
-5 000
0
5 000
10 000
15 000
20 000
Coun
t of
Loss
and
Gai
n
Loss of Learners Grade R, 1, 3, 6, 9 and 12 In Years From 1997
Y2003 Y2004 Y2005 Y2006 Y2007 Y2008 Y2009 Y2010 Y2011 Y2012 Y2013 Y2014 Y2015 Y2016 Y2017
No. of Educators 30 326 30 827 27 463 26 677 25 701 26 620 26 697 26 006 25 897 25 924 26 194 26 034 26 070 28 232
No. of Schools 2 253 2 174 2 064 1 860 1 820 1 821 1 768 1 701 1 669 1 645 1 606 1 570 1 544 1 535 1 556
010 00020 00030 00040 000
Actu
al N
umbe
rs
Number of Educators and Schools

Page 49 of 208
Trend Analysis: Delivered Infrastructure (DESD)
Figure 12: Number of Schools Built/District - 2015 – 2017 (Data Source DBE-NW APRs own calculations)
Analysis of evidence from the village view is making us to be mathematically philosophical first, in thatenvironmental reality dictates the thought and abstraction and not necessarily the other way around.
We want to believe in the developmental model that says 10 Africa-based problem(s) solving and evidencebased quality education Annual Performance Implemented Plans should arrive earlier than 2030. Thisshould be minus inequality and poverty but be plus, self-sustaining (entrepreneurial), self-employmentthrough Africa’s self-reliance and Africa driven solutions leadership. Locally trusted and confident resourcesmobilization, like implementation strategies of these plans should be constructively emergent from theproperly diagnosed, assessed and evaluated context. This is optimism.
Or viewed from another perspective, we should believe in a model of a 2 Five Year Strategic ImplementedPlans that rapidly arrive before 2030, less of conflict, free from any form of oppression in whatever form.
The rapidly repeated implementation of these plans post 2030 should mean arrival long before to Agenda2063, the Africa We Want vision, Africa ancestrally and decidedly to be bestowed on and endowed toBatho, we the people with and living the culture of freedom from colonial and apartheid oppression andexploitation.
Two of the strategic issues within services delivery environment identified are time and the issue ofexpropriation of land without compensation to ensure the gains of freedom.
Evidence points at that we are only 10 years from 2030 if we minus 2019 election year and 2020. This is inview and recognition of the neo-colonial resistance forces to transformation and freedom: the high riskforces that fear the changing forces of emancipation from inequality, poverty and exploitation andexpropriation of labour, land and all factors of production only for the miniscule wealthy few.
All evidence, historical in nature (- be it political history, economic, social, cultural, statistical, educational,agricultural, outer-space, spiritual-) seem to point directly without ‘BUT’, at policy direction that saysexpropriation of land without compensation and its equitable and equal distribution is an input and aprocess that dissolves the opposites and the divide of landed property moguls vs the landlessness,“included vs excluded”, the rich vs. poor, the neo-colonizer vs. neo-colonized, white monopoly capitalist vs.

Page 50 of 208
the ‘black consumer middle class’; rural vs. urban (rural will be urbanized while the urban will assume nobetter status than the rural), the education capital of the non-schooled vs. the capital of the schooled;white vs. black, the irrational vs. rational. In reality, land use by the few (in particular white) vs. no use bythe empty handed dispossessed majority (in particular indigenous Africans). The key outcome is peace(silencing of the guns), not the reversal of the opposites, the unity of pairs in the circle of life. And theeducational impact of this is that time as a constant of change is freed from those who attempt to fossilizeit in their space. Reality is re-imagined; the future is made in the vision of the plans. Evidence directseducation.
Spatially, evidence suggests that it cannot be taken into the future the understanding that it is normal for avillage learner/citizen should live in a geographic space that is only known theoretically that “it is hers” butin fossilized neo-colonial legal reality, it belongs to the multinational company that uses it for extractingmineral resources (products- minerals per se/services-educational spinoffs) that are consequently andpermanently migrated to the former colonial metropolis. This is educational alienation. And it is pessimismreproduced into the future.

Page 51 of 208
Table 24: Number of learners, educators and schools, and learner-educator ratio (LER), learner-school ratio (LSR) and educator-school ratio (ESR) in ordinarypublic in the province. (EMIS 2018)
Type of schools LEARNERS EDUCATORS SCHOOLS
YEARS YEARS YEARS
2016 2017 2018 2016 2017 2018 2016 2017 2018
Primary and Secondary Schools 791659 797623 830146 20282 26505 27053 1450 1472 1486
ECD : Grade R 54652 51926 53751 938 996 973
Special Schools DNA DNA 7725 436 698 637 32 32 32
Independent Schools 17806 18461 20149 811 1090 1252 60 63 69
Independent Schools: Grade R 1594 1403 1015

Page 52 of 208
Type of schools LER LSR ESR
YEARS YEARS YEARS
YEARS 2016 2017 2018 2016 2017 2018 2016 2017 2018
Primary and Secondary Schools
39 30 31 546 542 559 14 18 18
ECD : Grade R58 52 52
Special Schools14 22 20
Independent Schools
22 17 16 298 293 292 13 17 18
Independent Schools: Grade R
Table 25: Number of learners, educators and schools, and learner-educator ratio (LER), learner-school ratio (LSR) and educator-school ratio (ESR) in ordinarypublic in the districts. (EMIS 2018)

Page 53 of 208
2. PROGRESS TOWARDS ACHIEVING THE FIVE YEARS STRATEGIC TARGETS
This is an APP and not the Annual Performance Report; however, it is key that the following progressshould be highlighted.
Goals Goal Statement Achievements
Effective andefficient governance,management andfinancial supportsystems
1. Improved Financial Managementsystems 2. Improved Human resourcestrategy 3. Improved internal and externalcommunication strategies 4. ImprovedSecurity Systems 5. Improved Internal Auditprocesses 6. Improved Risk ManagementSystems
MPAT 1.6: The department is notdoing well in Human resourceand financial management. OtherKPAs are not out of the red. Animprovement plan is developed.
Audit outcome: The Departmentreceived a unqualified auditopinion with improvement planhas been developed
Improved learnerattainment in Grades(R to 12) 3, 6, 9 and12
Improved quality education provided to allGrade R learners by gradually placing themin primary schools where they can bethoroughly prepared for the physical andacademic demands of learning. This iscoupled with provision of proper learningmaterials and educational toys, plusqualified grade R educators.
Ensure that educators in the Pre-Grade Rprogramme are thoroughly trained to offerquality pre-school service to youngerchildren.
Ensure the monitoring of curriculumimplementation with special reference tograde 3,6,9 and 12; enhance andstrengthen mathematics and scienceeducation in order to improvetechnological expertise; support schoolenrichment programmes in order toproduce holistically developed learners;and provide multi-media services toenhance teaching and learning in allgrades.
Ensure the implementation of supportprogrammes that enhance learning,namely; the school nutrition programme,learner transport, infrastructuredevelopment and maintenance; and school
Provisioning of Grade R LTSM andinfrastructure are on track. Thetarget of placing Grade R learnersin public schools is well on sight.The numbers are in Part B of thisPlan
This is on track and well achievedeven though there are newdemands from NDP
The Department is doing wellthough there are challenges.
All support programmes are ontrack. Learner transport willremain a challenge as it is notwithin the Departments’ control
Independent schools are doing

Page 54 of 208
Goals Goal Statement Achievements
safety.
Ensure that all independent schools,including Home Schools are registered withthe Department. This allows a diverselearning environment and a broader choiceof curriculum. Ensure that all subsidizedschools are supported and monitored toascertain compliance and for qualityassurance purposes.
Strengthen special schools by empoweringeducators and creating access for learnerswith disability including provision ofprofessional support by specialists
Ensuring well managed and monitoredSchool Based Assessment (SBA) to enhanceteaching and learning To ensure thatmainstream school infrastructure isrehabilitated to be accessible to learnerswith minor disabilities; that educators aretrained to identify learners with seriousdisabilities for referral to special schools;and that the curriculum needs of theselearners are taken care of so that alllearners with learning barriers are wellcatered for in Full Service Schools.
Implementing life skills and HIV and AIDSprogrammes and structures in schools inorder to deal with the impact of HIV andAIDS in the school system.
very well.
All special schools are providedwith requisite support andinfrastructure.
This is on track and no challengesanticipated to challenge ourtarget
This is a big problem, however,the targets set by the departmentare being achieved

Page 55 of 208
3. MPAT 1.7 OUTCOMES
The department has registered improvement in 40 % of the standards with regression of 15% on MPAT 1.7.The Strategic Management and Governance and Accountability ensured intense monitoring ofimprovement plans. The required evidence was available although not meeting the set standards in someareas.
On the other hand Human Resource Management and Financial Management were urged to develop andimplement their improvement plans. Intense and monthly monitoring of the improvement plans will beimplemented in the coming financial year especially for KPA that scored 2 and below.
The lesson learnt is that the KPA coordinators must be encouraged to perform completeness and qualityreview on the DPME system to ensure that evidence uploaded is properly tagged before submitting self-assessment score for audit purposes.
4. AUDITOR GENERALS’ REPORT AND MANAGEMENT PLAN
The Department received unqualified audit opinion with findings. The table outlines the audit outcome onperformance information for the past 3 years
Programme 2017-18 2016-17 2015-16Programme 2Public ordinary schools
Disclaimer Disclaimer disclaimer
Programme 5 Qualified Qualified DisclaimerProgramme 6 Adverse Adverse DisclaimerProgramme 7 Unqualified Unqualified Unqualified
Some of the root causes identified for poor performance on Performance Information was, lack ofconsequence management, vacancies in key and support positions, slow response by management toaddress matters raised by the Auditors and lack of oversight responsibility over performance reporting.
The department is implementing systems that generate complete and accurate performance information,while enforcing internal controls through various structures and monitoring of performance information.Action plans to address AOPO findings was compiled per programme and indicators and is being monitoredmonthly.
Recommendation
The programme managers must provide the office of Strategic Planning with the performancereport that has comments on deviation
Pre-list and post-list are compulsory The TIDs must be thoroughly checked and ensure that the definition, method of calculation and
desired performance are in consistence with the indicator title Indicators with N/A must be footnoted and explained Implement systems that will generate complete and accurate performance information, while
enforcing internal controls through consequence management. Implementation and monitoring of the action plans to ensure that the underlying causes are
addressed and challenges are addressed timely.

Page 56 of 208
5. PROVINCIAL EDUCATION PERFORMANCE: 2018 GRADE 12 ANALYSES
Figure 13: Key elements used in the analyses of the Departmental performance
Figure 14: Performance of the North West in SCMEC

Page 57 of 208
We pride ourselves as a province about the performance of our learners which has been consistent for thepast three consecutive years, dating back to 2014. We obtained position two (2) in 2014, position four (4)in 2015 and position four (4) in 2016 and the same for 2017 and 18.
For the past academic year, our Province was plagued by a series of service delivery protests whichnegatively impacted on learning and teaching. Most of our learners lost valuable contact time whichresulted in curriculum delivery backlog.
The service delivery protests had a direct bearing or influence on our matric results hence a ripple effect ofour learner performing not according to our target.
Various intervention strategies, in pursuit of helping our learners in their studies were tried. TheDepartment had a Prayer Day where we invited different religions to come and pray for our learners, wehad TsetsepelaMorutwana, Spring Camps, and Extra Classes and Catch Up programmes in the areas thatwere affected by these service delivery protests.
The Department undertook renovations at various dilapidated schools and provided mobile classes toschools where overcrowding was observed. This was made to ensure that learning and teachingenvironment is conducive. We ensured that every learner has a textbook and enough stationery, and everyeducator had all the teacher support materials.
The 2018 provincial learner performance has shown a slight improvement for all grades from Grade 1 to12. Performance increased by an average of 1.9% for all Grades. There was a considerable improvement interms of quality performance as measured by the Bachelor passes in Grade 12 from 26.7 to 32.5%
There is a challenge of performance in the senior phase particularly Grade 8 despite the slightestimprovement. Grade 10 performance is the least performer in the FET band. The exit groups registeredpasses higher than other grades as a result of progression
Profile of the current Grade 12 cohort indicates that the group is slightly weaker in comparison to the 2018group based on the Grade 11 performance.
2019 Intervention strategies
Use learner performance to determine underperformance quarterly Enforce curriculum coverage in the lower grades Correct implementation of all assessment forms Ensure appropriate holistic monitoring Ensure that best practising teachers shares their expertise with school that perform at the lowest
averages Encourage proper recruitments Follow the performance trends for early interventions and ensure accountability for performance
at all levels Ensure use of resources, Performance reports and digital gadgets supplied to schools to be
fruitfully used Strengthen Reading initiatives Ensure response to the Auditor General’s findings

Page 58 of 208
8. ORGANIZATIONAL ENVIRONMENT
Organizational Structure
The environment of NWDOE is made up of the provincial office and district offices. The districts are furtherdivided into Sub –districts which are made up of clusters. The latter two are the links with delivery sites,which are public ordinary schools, special schools, independent schools. The NDP states that “teaching inschools can be improved through targeted support by District offices”. In line with this policy directive, theDepartment re-demarcated the education districts to align them with the districts municipalities. This wasconsciously implemented in order to bring about synergy with a view of producing the desired impetus forquality service delivery.
There are three branches at head office namely, Corporate services, Curriculum Management and Deliveryand Institutional Management Governance and Support. These Branches are headed by DDG’s. Thedepartment also has Internal Audit Directorate that reports directly to the Superintendent General.
The Department has re-aligned its Organisational Structure in line with the Department of Public Serviceand Administration (DPSA) generic structure for provincial education departments. The Re-alignedOrganisational Structure has been approved by the Minister of Public Service and Administration. The re-aligned organizational structure will improve curriculum delivery in the province.
The North West Department of Education is mandated to provide quality teaching and learning to thecitizens of the Province. To achieve this, the Department has a comprehensive organisational structuredesigned and staffed to meet the professional, curriculum, institutional governance and administrativesupport demands to deliver services; there are corporate services which provide management services;educators; the school governing bodies; the learners and other stakeholders.
The district support structure comprises of four districts, namely, Ngaka Modiri Molema, Dr KennethKaunda, Dr Ruth Segomotsi Mompati and Bojanala. Districts consist of Area Offices and Area Offices aremade up of clusters. All learner support prorammes including among others (Life Skills Programme,Inclusive Education, School Nutrition Programme, Learner transport, School Governance and IndependentSchools, were put under one directorate called Institutional Governance Development and Learner SocialSupport Services (IGD&LSSS) reporting directly to the Deputy Director General. Teacher Development wasmerged with Curriculum Support.

Page 59 of 208
Figure 15: Vacancy Rate (Own calculations)
In terms of administration 37% post are not filled resulting in the high risk for department as theadministration plays a critical role in ensuring that the department is able to deliver its mandate. Publicordinary schools remain a key to the department as the service of the department mainly affects thelearners who are in public ordinary schools. In terms of education posts the department is able to hiremore teachers because graduate with other degrees are able to do PGCE and qualify as professionalteachers after they graduate.
This also addresses the issue of shortage of teachers throughout the country. Public special schools remaina challenge regarding high vacancy rate because learners enrolled in public special schools require highlevel of attention. The department must strive to ensure that administrative posts are filled in thisprogramme.
Examinations and other related services are mainly made up of administration rather than educators.Therefore vacancies is 52% raise a concern because if the examination programme is inadequately staffedchances of learners to pass is at threat.

Page 60 of 208
Figure 16: Vacancies per level (own Calculation)
The unskilled and defined decision are employees that are responsible to make the department conducivefor working, this include the gardeners, cleaners to name a few. Therefore the unoccupied post is 233making it a very huge number although the vacancy has no such impact but if the post are filled this willalleviate poverty and contribute positively on the economy. The interns are also counted in this category,therefore it is also important for the newly graduated to be capacitated with the experience so that theycan be able to develop the department. In terms of semi-skilled and discretionary this will relies mainly onthe grooming of interns in unskilled category. The department must strive to absorb new blood in thedepartment for innovation and transformation.
The department has ensured that the senior posts are occupied to ensure a smooth flow of decisionmaking with regard. Professional qualified and experienced mid-management, there is a need to hire morecandidates with required expertise and knowledge. Skilled qualified and junior management has a 7%vacancy rate, the rate is not at risk but the department is making an effort to ensure that these posts arefilled.

Page 61 of 208
EDUCATION PROPOSED SCEMATIC MACRO STRUCTURE
MEC
OFFICE OF THE MECCHIEF OF STAFF
NWEDSUPERINTENDENT-GENERAL
DIRECTORATEEXECUTIVE SUPPORT
DIRECTORATEINTERNAL AUDIT
BRANCHCURRICULUM MANAGEMENT
AND DELIVERY
CHIEF DIRECTORATECURRICULUM MANAGEMENT
DIRECTORATE EARLY CHILDHOOD
DEVELOPMENT,GENERALAND FURTHER EDUCATION
AND TRAINING
DIRECTORATEPROFESSIONAL
EDUCATOR DEVELOPMENTSERVICES
DIRECTORATECURRICULUM SUPPORT
SERVICES
CHIEF DIRECTORATEEXAMINATIONS AND
ASSESSMENTS
DIRECTORATE EXAMINATIONS
DIRECTORATE ASSESSMENT
BRANCHINSTITUTIONAL
MANAGEMENT GOVERNANCEAND SUPPORT
CHIEF DIRECTORATEDISTRICT COORDINATION
AND MANAGEMENT
DIRECTORATE EDUCATIONDISTRICT OFFICE DR RUTH
SEGOMOTSI MOMPATI
DIRECTORATE EDUCATIONDISTRICT OFFICE NGAKA
MODIRI MOLEMA
DIRECTORATE EDUCATIONDISTRICT OFFICE
BOJANALA
DIRECTORATE EDUCATIONDISTRICT OFFICE DRKENNETH KAUNDA
DIRECTORATEINSTITUTIONAL
DEVELOPMENT SERVICESDIRECTORATE LEARNER
SOCIAL SUPPORT SERVICES
BRANCHCORPORATE MANAGEMENT
SERVICES
CHIEF DIRECTORATEHUMAN RESOURCEMANAGEMENT AND
DEVELOPMENT (HRM&D)SERVICES
DIRECTORATEHR ADMINISTRATION
DIRECTORATE ORGANISATIONAL
DEVELOPMENT AND HRPLANNING
DIRECTORATEHUMAN RESOURCEUTILISATION ANDDEVELOPMENT
DIRECTORATELABOUR RELATIONS
DIRECTORATE EMPLOYEEHEALTH AND WELLNESS
CHIEF DIRECTORATESTRATEGY AND
GOVERNANCE SERVICES
DIRECTORATELEGAL SERVICES
DIRECTORATECOMMUNICATION SERVICES
DIRECTORATEMINIMUM INFORMATION
SECURITY STANDARDS ANDRECORDS MANAGEMENT
SERVICES
DIRECTORATEGOVERNMENT INFORMATION
AND COMMUNICATIONTECHNOLOGY MANAGEMENT
(GICTM)
DIRECTORATESTRATEGIC PLANNING
SERVICES
CHIEF DIRECTORATEPHYSICAL RESOURCES
(INFRASTRUCTURE)MANAGEMENT
DIRECTORATEPHYSICAL RESOURCE
PLANNING
DIRECTORATEINFRASTRUCTURE
PROGRAMME DELIVERY
CHIEF DIRECTORATE FINANCE (CFO)
DIRECTORATEMANAGEMENT ACCOUNTING
DIRECORATEFINANCIAL ACCOUNTING
AND ADMINISTRATION
DIRECTORATESUPPLY CHAIN MANAGEMENT
DIRECTORATEASSET MANAGEMENT
SERVICES
Number of SMS PostsMEC: 1HOD: 1DDG: 3Chief Directors: 7Directors: 30Total No of Posts: 42

Page 62 of 208
Inputs (if we synthesize data as provided/indicated…. Process (planners then use the evidence from the synthesized data in processingplans…
Outputs (therefore the milestones as listed)
Evidenced based Integrated plans withinand different levels of government action/business Policy decisions/policies and other
interventions Department of Education Integrated
Spatial Development Plan (EISDP) e.g.Where to build schools within thecontext of land being expropriated: inthe farms
Five year sectoral plans linked/alignedwith the MTSF, Electoral Manifestosand the NDP
Annual Performance Plans of theDepartments aligned with Five yearplans
Multiyear Plans aligned with budgets Provincial Developmental Plan
interfaced with the NDP and the IDPs Municipal IDPs articulated in relation
to the local community needs:economical, political, spatial etc
Figure 4: Theory of Change and Log Frame: Rapid Evidence Assessment – Service Delivery Strategic Environment Issues, Forces and Education Spatial Development
• APP/R Analysis data• DPME Evaluations• NIDS studies• SALDRU Studies• Statistics SA Studies
Data -Input
• Data mining•Senthesizing of Evidence of
Service Delivery Strategicissues/forces and spatialinequality and porverty
•Reviews of plans/reportsand reviews
Activities
• Evidence for Scientificbased plans: APP,Education SpatialDevelopment Plan
• SystematicEvaluations/researchevidence Reports
Output -Evidence
•Lessons•Insights
OutcomeKnowledge
• Planning• Decision Making• Distribution of
Resources
Use
EducationDevelopmental
Planning: -Spatial/Resource
Planning
Instrumental /Direct Utilization ofEvidence e.g. BothNet Migration andMining (PGM) GDPproportion dictates
education policyintervention of
building technicaland industrial
colleges in Bojanala
Persuasive/Symbolic Utilization
of Evidence
Conceptual
Utilization
Evidence: (Synthesis ofStudies: implementation
and Impact evaluationresearch reports)
Service DeliveryEnvironment Issues
and Forces-Data
Socio-EducationDemand
Indicators Data
Spatial PatternsStudies Data
(NIDS)
Evidence UseStudies Data
Inequality andPoverty Studies
Data (NIDS/SALDRU)
AdministrativeData: Report
Reviews
Strategic/SpatialInterlinks

Page 63 of 208
Impact and outcome that the Departmental delivery environment intends to achieve through the theory ofchange
High-quality early childhood education, with 100% access rate. Quality school education, with globallycompetitive literacy and numeracy standards. Further and higher education and training that enables people tofulfil their potential.
An expanding higher education sector that is able to contribute towards rising incomes, higher productivity andthe shift to a more knowledge-intensive economy.
A wider system of innovation that links key public institutions (universities and science councils) with areas ofthe economy consistent with our economic priorities.
The specific service delivery policy issues within the Department of Education are depicted in the theory ofchange figure 4 above.
To achieve the above the Department of education has the responsibility to provide quality education and inaddition improve access to sport across all schools..
The three year review of the internal environment of the organization mainly talks to the interventions and subprogrammes that address issues pertinent to different groups of the education services clientele.
We found that the different sub-programmes are not sequenced similarly across the years. This could suggestdecision to reprioritize or issues of just reporting. The nature of partnerships given the kind of services theyprovide puts them more in the categories of donors not partnerships per se. This is especially on the issue ofmaterial support.
There is an indication that across the years the programmes are increasing numerically. There seems to beneed for consistent structured reporting for the each programme as the reporting tend to differ across theyears.
9. REVISION TO LEGISLATIVE AND OTHER MANDATESNone
10. PLANNED INTERVENTIONS AND PRIORITIES Use learner performance to determine underperformance quarterly Enforce curriculum coverage in the lower grades Correct implementation of all assessment forms Ensure appropriate holistic monitoring Ensure that best practicing teachers shares their expertise with school that perform at the lowest
averages Encourage proper recruitments Follow the performance trends for early interventions and ensure accountability for performance at
all levels

Page 64 of 208
Ensure use of resources, Performance reports and digital gadgets supplied to schools to be fruitfullyused
Strengthen Reading initiatives Ensure response to the Auditor General’s findings
INTEGRATED DEVELOPMENT PLANS
Chapter 5 of MSA requires municipalities to undertake developmentally orientated planning so as to achievelocal government objectives, developmental duties & fundamental rights as set out in the Constitution of SA.
The purposes of IDPs include:
A single, inclusive and strategic plan giving direction to all development initiatives Identifies development and service delivery priorities for whole municipality Supports optimal allocation of scarce resources Forms basis for National, Provincial and Municipal Budgeting alignment (DORA and MTEF)
The aims of the IDP are:
Figure 18: IDP on Local Government (Limpopo Model)

Page 65 of 208
To develop a credible IDP the following process should be followed:
Figure 19: Stages of IDP (Own work)
The Treasury Framework for the development of APPs and Strategic Plans dictates that IDPs should be thebedrock of all Departmental plans. The frameworks are presented below:

Page 66 of 208
Figure 20: IDP vs MTSF (Treasury Framework)

Page 67 of 208
11. SONA
The President, in his state of the nation (SONA) address, emphasized the need for government and business tojoin hands in the upbringing of the child. Amongst the deliverables and the priorities for 2019/20 financial year,the following were alluded to:
11.1 Deliverables
1. Establishing a firm foundation for a comprehensive ECD programme.2. Migrate responsibility for ECD centers from Social Development to Basic Education.3. Develop a package of reading resources, expert reading coaches and lesson plans4. Expanding the availability of these early reading resources across the foundation phase of schooling.5. To expand participation in the technical streams, several ordinary public schools will be transformed
into technical high schools.6. Mobilising all available resources, including pledges from business, strategic partners, and the
building industry to replace all unsafe toilets in public schools.7. Creating a healthy, learning environment to ensure safety of learners in schools.
11.2 Priorities
1. Integrated system between and ECD and education system.2. Accessible early childhood education to children.3. Substantially improved in reading comprehension in the first years of school.4. Equipping children to succeed in education.5. Providing every school child in South Africa with digital workbooks and textbooks on a tablet
device.6. Textbooks in high enrolment subjects across all grades and all workbooks have must be digitized.7. Expanding the training of both educators and learners to respond to emerging technologies
including the internet of things, robotics and artificial intelligence.8. Several new technology subjects and specialization’s will to be introduced, including technical
mathematics and technical sciences, maritime sciences, aviation studies, mining sciences, andaquaponics.
9. Eradicate unsafe and inappropriate sanitation facilities within the next three years.10. Strengthen the basic education system by empowering school leadership teams, improving the
capabilities of teachers and ensuring a more consistent measurement of progress for grades 3, 6and 9.
11.3 The Departmental Programme indicators that are responding/ in line with SONA 2019/20priorities and deliverables
1. Number of schools provided with extra support for the achievement of safety measures [PPI 2.18]2. Number of Grade R schools provided with resources (include animated toys)[PPI 5.1]3. Number of public schools that offer Grade R [PPM 501]4. Number of Grade R Educators trained [PPI 5.2]5. Number of public ordinary schools supplied with sanitation facilities [PPM 603]6. Percentage of SGB's in sampled schools that meet the minimum criteria in terms of effectiveness
every year [PPI 2.12]

Page 68 of 208
12. SOPA
Professor Job Mokgoro, in the state of the province address emphasized a need to uproot corruption and badpractices. The following priorities were noted for education:
Physical infrastructure project list:o the eradication of Pit latrines and addressing insufficient sanitation,o upgrade and replacement of unsafe buildings,o and building of laboratories,o libraries,o administration blocks,o nutrition centres,o Grade R classrooms in schools.
Strengthen engagements with the building industry, existing and potential strategic partners, businessand donors.
Fast track the handing over of completed school building projects to the concerned communitiesacross the province in the next financial year.
Extensive monitoring and evaluation should be followed and supported by sporadic site inspections aswell as interventions to fill gaps identified.
No Department will be allowed underspend their appropriated budgets for 2019/20 Financial year. Strategic Transformation Unit in the Office of the Premier, tasked with the mandate of managing key
transversal functions which are critical to enhancing state capacity and delivery of services inDepartments.
100 more schools participating in the MST grant will receive 20 tablets each for the current financialyear.
Establish a Provincial Innovation Hub in Mahikeng this year, and further three regional Innovation Hubsin the other Districts in the next two years, under the Coordination of the IKATISONG School ofGovernance in the Office of the Premier.
1200 teachers; 300 per district, will receive training on ICT skills to incorporate E-Learning and DigitalEducation Programs will be installed in 100 schools and training will be provided for proper use of thecontent targeting Villages, Farms and Townships.
A call for every 10 year old to read for meaning into effect (28 June 2019 SOPA)
A comparison of SONA and SOPA
SONA SOPA1. Providing every school child in South Africa
with digital workbooks and textbooks on atablet device.
Provisioned tablets for learner use
2. Eradicate unsafe and inappropriate sanitationfacilities within the next three years.
All unsafe pit toilets in the remainingHundred and four (104) schools in ourprovince will be prioritised
3. Expanding the training of both educators andlearners to respond to emerging technologies
1200 teachers; 300 per district, willreceive training on ICT skills to

Page 69 of 208
including the internet of things, robotics andartificial intelligence.
incorporate E-Learning and DigitalEducation Programs will beinstalled in 100 schools andtraining will be provided for properuse of the content targetingVillages, Farms and Townships
Departmental Programme Indicators Responding to SOPA
Percentage of learners having access to information through(a) Connectivity (other than broadband); and(b) Broadband [PPI 1.2.2]
Number of schools that will be monitored on integrating ICT in teaching and learning [PPI 1.2.7] Number of public ordinary schools supplied with sanitation facilities [PPM 603] Number of educators trained on ICT [PPI 2.19] Infrastructure indicators on sanitation, renovations, new schools, libraries and laboratories, Nutrition
rooms, etc. [PPM’S 603 TO 610]
13. PERFORMANCE DELIVERY FOCUS AREAS IN 2019/20
A combination of the National Development Plan (Planning Commission: 2012), Action Plan to 2014: Towardsthe realisation of Schooling 2025 (DBE: 2011), Delivery Agreement for North West and NWED plans andPremier pronouncements direct our focus of performance delivery in the following areas as outlined in detail inPart C of this plan.
Improve the quality of teaching
There are still shortages of teachers for certain subjects and age-groups. Subjects with teacher shortagesinclude languages, mathematics, science, technology and the arts. The shortages are compounded by the factthat teachers who specialize in these subjects are not always assigned to teach them. The Department’s mainobjective is to reduce class sizes as it impacts on learner performance, with a focus on schools where learner toeducator ratio exceeds the average ratio of 29.
The availability of skilled teachers in all subjects in all schools to improve the quality of teaching requires us to:
Attract a new group of young, motivated and appropriately trained teachers. Improve professionalism, teaching skills and subject knowledge. Strive for a workforce that is healthy and enjoys job satisfaction. Ensure availability and utilization of teachers. Monitoring & support training programmes for IQMS and PDMS. Expand our training capacity for all educators. Investigate new ways of attracting and preparing teachers. Develop better ways of delivering the curriculum using the learner workbooks that are provided,
including structuring lessons, covering the material in the curriculum and conducting assessments.

Page 70 of 208
Help teachers improve their knowledge of the subjects they teach and to build teachers’ subjectknowledge and provide training in effective teaching methods. Teacher development programmeswill be targeted at those areas where teachers’ subject knowledge is weakest.
Expose teachers to the use of technology in their own training, and train them to use it in theirteaching through e-learning initiatives.
Effective implementation of educator performance management systems. Providing learner materials before the opening of schools.
Improve literacy, numeracy/mathematics and science outcomes
Our focus is to increase the number of learners eligible to study mathematics and science-based degrees at auniversity. This is aligned with the Department of Basic Education’s aim to increase the number of learners ingrades 3, 6 and 9 who have mastered the minimum competencies in language and numeracy to 90 % by theend of each year. The focus, as reflected in Programme 2 will be on:
Provision of minimum basic numeracy resources to all schools. Undertaking of regular learner assessments to monitoring the percentage of Grade 3, 6 and 9 learners that
performed at the required level for mathematics and language. Ensuring that all Quintile 1 – 3 schools receive the minimum basic numeracy resources and assisting in the
implementation and use of these resources. Undertake regular assessments of a sample of all learners to track progress at the end of Grade 3,6 and 9
in all Quintile 1 – 3 schools. Providing schools with maths and science equipment.
Early Childhood Development
Traditionally, Grade R development services are mainly provided by private centres for profit making. Ourfocus in the next year, as reflected in Programme 5, is to introduce and expand primary schools with Grade Rresources and equipment to prepare learners for formal schooling:
The funding of infrastructure. The provision of staff. Specialised training for practitioners. The provision of learner support materials and equipment. Targeted plans to reach the most vulnerable children and families.
School support and governance
Provide capacity building programmes to management and governors of all schools to ensure adherence tonationally prescribed minimum criteria and set standards to: Increase the percentage of schools producing the minimum set of management documents at a required
standard. Increase the percentage of schools where the School Governing Body meets minimum criteria in terms of
effectiveness. Capacitating school governing bodies, school management and Representative Council of Learners. Improvement of district support by ensuring regular visits by Circuit Managers and District Officials.

Page 71 of 208
Registration of all schools. Monitoring of all independent schools.
Improve the access and quality of learning
Ensure that all targeted learners benefit from the “No School Fee” policy. Ensure schools are funded at the minimum levels. Provide a support system to all learners that are infected and affected with HIV/Aids. Use schools for health, poverty alleviation, psychosocial support, sport and culture. Support to schools as per grant framework for supply of nutritious meals. Effective implementation of the inclusive policy. Provision of responsive FET and ABET programmes. Establishment of functional adult education training centers. Provision of responsive occupational programmes.
Infrastructure
Our focus is to provide and maintain all Public Ordinary School’s infrastructure in line with minimum physicalinfrastructure standards so that that learners and teachers have an inspiring environment. This requires thefinalisation and implementation of the Infrastructure and Maintenance Plans to accelerate service delivery andeliminate backlogs. Focus areas include: Ensuring that schools comply with very basic level of school infrastructure. Ensuring water, electricity supply and sanitation facilities. Ensuring that all required classrooms are built in public ordinary schools. Ensuring that all specialist rooms in Public Ordinary Schools are build (all rooms accept classrooms-included;
laboratories, stock rooms, sick bay, kitchen, etc.) Providing technical schools with well-resourced workshops. Providing Grade R facilities to Public Primary Schools. Upgrading of special schools.
Improve Administration
The following is a summary of key issues that are covered by these plans: Resolving the root causes for audit qualification. Providing an adequate framework of rules and practices to ensure accountability, fairness and transparency
in all dealings for control and information-flows to serve as checks-and-balances and compliance tostatutory requirements.
Enhance the performance management and reporting mechanisms that are applied consistently and inalignment with the Annual Performance Plan.
Addressing the significant lack of skills in performing required tasks, especially in technical and core areas. Implement documented business processes to define structured activities or tasks to produce specific
service to mitigate the absence or misaligned job descriptions and irrelevant or non-existent performancemanagement contracts and standards.
Improve data management practices through architectures, policies, and procedures that properly managethe full data lifecycle in a protected, integrated and reliable manner.

Page 72 of 208
14. BUDGET PRIORITIES: EARMARKED FUNDSThe table below provides a summary of payments and estimates of expenditure for earmarked funds over the seven year period from 2015/16 to 2021/22.
Mainappropriation
Adjustedappropriation
Revisedestimate
2015/16 2016/17 2017/18 2019/20 2020/21 2021/22
PRE-GR R (0-4) 32 084 773 11 672 35 000 35 000 35 000 35 000 35 700 36 414
EMIS 12 614 11 533 15 160 19 596 19 596 19 596 25 734 26 877 28 357
EMPLOYEE DEVELOP 43 151 31 307 37 876 25 556 25 556 25 556 26 834 28 176 29 585
EXPAND INCLUSI 29 458 6 462 30 512 35 284 35 284 35 284 37 049 38 901 39 679
FET CURRIC SCHLS 2 134 1 991 2 177 2 264 2 264 2 264 2 377 2 496 2 546
GET CURRIC SCHLS 1 290 793 1 316 1 368 1 368 1 368 1 437 1 508 1 539
GR R IMPLEMENT 39 186 30 197 45 035 43 360 43 360 43 360 45 678 48 111 49 074
HIV/AIDS PROGRAM 1 051 964 1 072 1 115 1 115 1 115 1 171 1 229 1 254
IN-SCHOOL SPORT 15 770 17 273 17 603 17 779 17 779 17 779 18 668 19 602 19 994
LAIP 62 639 85 482 97 463 99 412 99 412 99 412 101 401 101 401 103 429
LTSM 408 273 474 284 500 640 520 829 520 829 520 829 540 038 560 245 593 058
MATHS & SCIENCE 6 5 670 5 783 5 841 5 899 5 899 5 899 6 194 6 504 6 634
QUAL LEARN &TEAC 2 384 2 859 2 432 2 228 2 228 2 228 2 355 2 488 2 537
SCHOOL LIBRA SERV 7 190 7 413 7 611 7 687 7 687 7 687 8 072 8 475 8 645
SETA SKILLS LEV 7 826 14 241 14 653 15 503 15 503 15 503 16 278 17 092 17 434
SKILLS DEV/TRAIN 10 081 11 308 19 085 19 022 19 022 19 022 23 801 24 728 26 089
TEACHER DEVELOP 11 392 9 095 11 621 27 378 27 378 27 378 29 855 31 347 32 915
692 193 711 759 821 769 879 281 879 281 879 281 921 940 954 880 999 181
Outcome Medium-term estimates
2018/19DESCRIPT ION

Page 73 of 208
15. OVERVIEW OF 2019/20 BUDGET AND MTEF ESTIMATESThe services rendered by the Department are categorized under seven programmes as indicated below, which are aligned to the uniform budget andprogramme structure developed by National Treasury.
The department’s expenditure increased from R13.006 billion in 2015/16 to R14.929 billion in 2017/18 which represent an increase of 16.6 per cent overthree-year period. From 2018/19 budget increasing from R16.041 billion to R17.110 billion in 2019/20 representing an increase of 6.7 per cent. Theallocation for programme 6 Infrastructure development declines as result of Education Infrastructure grant allocation reduction.
The spending focus over the medium term will continue to go towards service delivery outputs as captured in the Annual Performance Plan of thedepartment. A significant amount of the budget is allocated to Compensation of Employees as the main cost driver in the sector, provision of learner andteacher support material, infrastructure development, sport development and skills development programs and interventions. However, operationalexpenditure, including payment of fixed costs will remain under pressure over the medium term due to current budgetary constraints.
Outcome Mainappropriation
Adjustedappropriation Revised estimate Medium-term estimates
R thousand 2015/16 2016/17 2017/18 2019/20 2020/21 2021/221. Administration 717 877 769 606 860 269 907 197 895 197 863 463 924 956 1 005 241 1 060 533
2. Public Ordinary School Education 9 653 381 10 421 187 11 203 534 12 106 920 12 184 926 12 199 395 13 069 170 14 105 764 14 991 730
3. Independent School Subsidies 28 887 30 324 27 486 31 331 31 331 29 950 33 148 34 971 36 894
4. Public Special School Education 472 029 518 815 574 733 623 809 645 309 636 960 699 057 741 771 790 901
5. Early Childhood Development 467 305 524 898 542 273 625 436 639 540 606 264 672 704 724 639 773 067
6. Infrastructure Development 1 052 693 1 084 968 1 072 308 1 004 996 883 598 691 441 904 712 1 010 169 1 088 260
7. Examination And Education Related Services 613 438 622 201 648 057 741 716 706 516 675 177 806 204 834 765 880 695
Total payments and estimates 13 005 610 13 971 999 14 928 660 16 041 405 15 986 417 15 702 650 17 109 951 18 457 320 19 622 080
2018/19
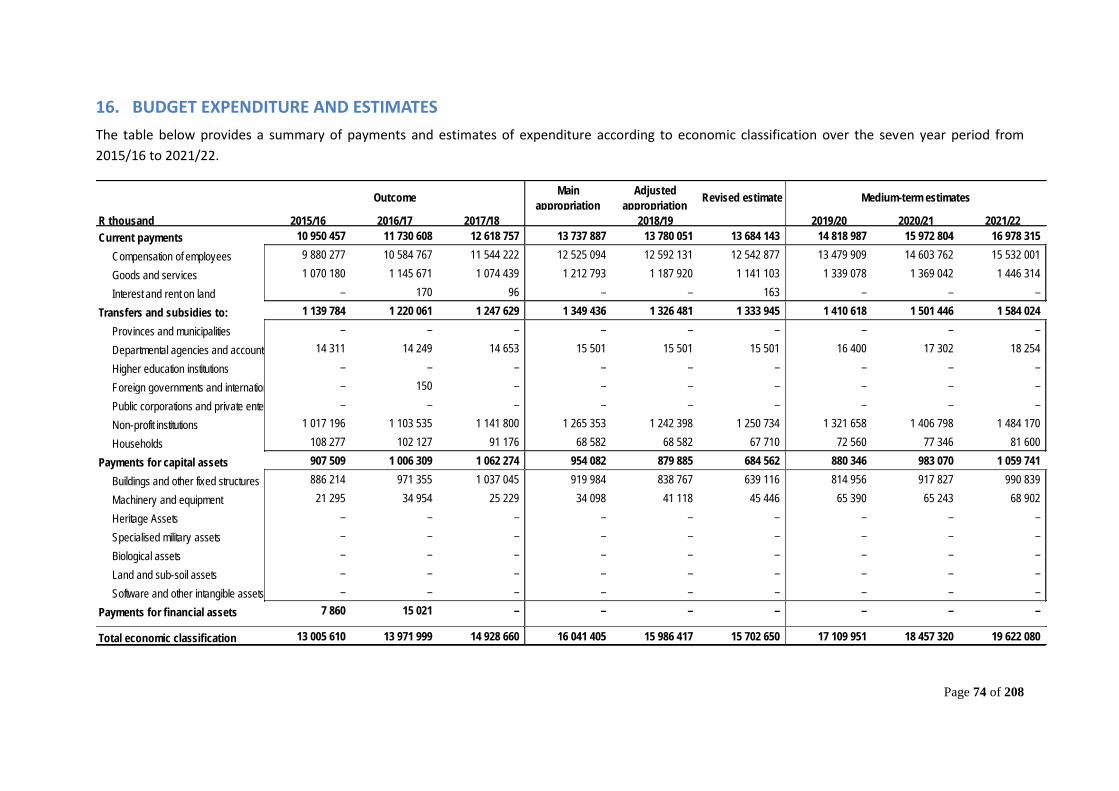
Page 74 of 208
16. BUDGET EXPENDITURE AND ESTIMATESThe table below provides a summary of payments and estimates of expenditure according to economic classification over the seven year period from2015/16 to 2021/22.
Outcome Mainappropriation
Adjustedappropriation Revised estimate Medium-term estimates
R thousand 2015/16 2016/17 2017/18 2019/20 2020/21 2021/22Current payments 10 950 457 11 730 608 12 618 757 13 737 887 13 780 051 13 684 143 14 818 987 15 972 804 16 978 315
Compensation of employees 9 880 277 10 584 767 11 544 222 12 525 094 12 592 131 12 542 877 13 479 909 14 603 762 15 532 001
Goods and services 1 070 180 1 145 671 1 074 439 1 212 793 1 187 920 1 141 103 1 339 078 1 369 042 1 446 314
Interest and rent on land – 170 96 – – 163 – – –
Transfers and subsidies to: 1 139 784 1 220 061 1 247 629 1 349 436 1 326 481 1 333 945 1 410 618 1 501 446 1 584 024
Provinces and municipalities – – – – – – – – –
Departmental agencies and accounts 14 311 14 249 14 653 15 501 15 501 15 501 16 400 17 302 18 254
Higher education institutions – – – – – – – – –
Foreign governments and international organisations – 150 – – – – – – –
Public corporations and private enterprises – – – – – – – – –
Non-profit institutions 1 017 196 1 103 535 1 141 800 1 265 353 1 242 398 1 250 734 1 321 658 1 406 798 1 484 170
Households 108 277 102 127 91 176 68 582 68 582 67 710 72 560 77 346 81 600
Payments for capital assets 907 509 1 006 309 1 062 274 954 082 879 885 684 562 880 346 983 070 1 059 741
Buildings and other fixed structures 886 214 971 355 1 037 045 919 984 838 767 639 116 814 956 917 827 990 839
Machinery and equipment 21 295 34 954 25 229 34 098 41 118 45 446 65 390 65 243 68 902
Heritage Assets – – – – – – – – –
Specialised military assets – – – – – – – – –
Biological assets – – – – – – – – –
Land and sub-soil assets – – – – – – – – –
Software and other intangible assets – – – – – – – – –
Payments for financial assets 7 860 15 021 – – – – – – –
Total economic classification 13 005 610 13 971 999 14 928 660 16 041 405 15 986 417 15 702 650 17 109 951 18 457 320 19 622 080
2018/19

Page 75 of 208
Compensation of Employees: Expenditure incurred by the department on compensation of employees grew from R9.880 billion in 2015/16 to a budget ofR11.544 billion in 2017/18. The 2019/20 compensation budget grows by 7.5 per cent when compared to the 2018/19 Revised Estimate largely due to theadditional funding for the carry-though effects of the 2018 wage agreement. The increase mainly caters for cost of living adjustment carry-through effects
Goods and services: Spending on goods and services is largely influenced by various priorities in the education sector such as learner and teacher supportmaterials, skills and teacher development, learner attainment improvement strategies, subject advisory and curriculum implementation support, ICTrelated costs for monitoring and reporting as well as fixed costs security and municipality services. Goods and services expenditure is not growing fromR1.070 billion to R1.074 billion between 2015/16 and 2017/18. The budget increases at an average of 8.4 per cent over the 2019/20 MTEF, mainly due toreprioritisation in 2019/20.
A larger portion of the Goods and services budget will be spent on procurement of textbooks and stationery for learners. Training and LAIP budget alsoaccounts for a significant amount of the Goods and services budget. Also, included under Goods and services is the allocation for Sanitary Dignity Project,which is allocated for 2019/20 financial year only.
The department will have to implement stringent measures to contain spending on discretionary items such a catering to realize any savings that can beutilized to counter the effect of price increasing in some of the cost driver that fall under this economic classification.
Transfers and subsidies: The greater portion of the budget under Transfer Payments goes towards funding of school operations as all public schools in theprovince are Section 21. These allocations are based on the national school funding norms and standards. Schools receive two tranches per annum, i.e. by15 May and 15 November respectively. Subsidies to independent schools are also expended through transfer payments.
A significant amount is also transferred to schools implementing the National School Nutrition Programme (NSNP) as procurement of groceries and relatedfoodstuffs is done at school level. Stringent measures have been put in place to ensure that these funds are not utilized for any other activities other thanNSNP related.
Transfer payments budget grows substantially over the 2019/20 MTEF. The increase caters mainly for norms and standard; section 21 schools includinggrade R in Public schools; Special schools and NSNP. It is also important to indicate that the department comply with the national norms and standard infunding our section 21 public schools. Apart from these, there are transfers in respect of Households which reflects payments in respect of staff exit costs.
Capital assets – Machinery and equipment: The budget for machinery and equipment goes towards procurement of ICT equipment for schools and topurchase Maths and Science kits. The growth in Machinery and Equipment over the 2019/20 MTEF will assist the department in the acquisition of the toolsof trade that are lacking.

Page 76 of 208
Capital assets - Buildings and other fixed structures: The allocation of buildings and other fixed structures declines from 2018/19 of R 919.984 million toR814.956 million in 2019/20, representing a decrease of 7.7 per cent as result of declined in allocation on Education Infrastructure grant. Total budget forbuildings and fixed structures mainly focuses on the upgrading and rehabilitation of existing school infrastructure, including construction of additionalclassrooms to ensure that all school facilities provide a conducive environment for effective teaching and learning to take place.

Page 77 of 208
PART B: PROGRAMME AND SUB-PROGRAMME PLANS
1. PROGRAMME 1: ADMINISTRATIONPurpose: To provide overall management of the education system in accordance with the National Education Policy Act, the Public Finance ManagementAct and other relevant policies.
1.1. Programme 1: Sub-programmesSub-programme Description Objective
Sub-programme 1.1 Office of the MEC To provide for the functioning of the office of the Member of the Executive Council (MEC) foreducation in line with the ministerial handbook.
Sub-programme 1.2 Corporate Services To provide management services which are not education specific for the education systemSub-programme 1.3 Education Management To provide education management services for the education systemSub-programme 1.4 Human Resource Development To provide human resource development for office-based staffSub-programme 1.5 Education Management
Information System (EMIS)To provide Education Management Information System in accordance with the NationalEducation Information Policy
Sub-programme 1.6 Conditional grant To provide for projects under programme 1 specifies by the Department of Basic Educationand funded by conditional grants
1.2. Programme 1: Priorities Up-skilling, professionalisation, financial assistance, addressing scarce and critical skills, youth development Adverting and Filling of posts: Resettlement Processes
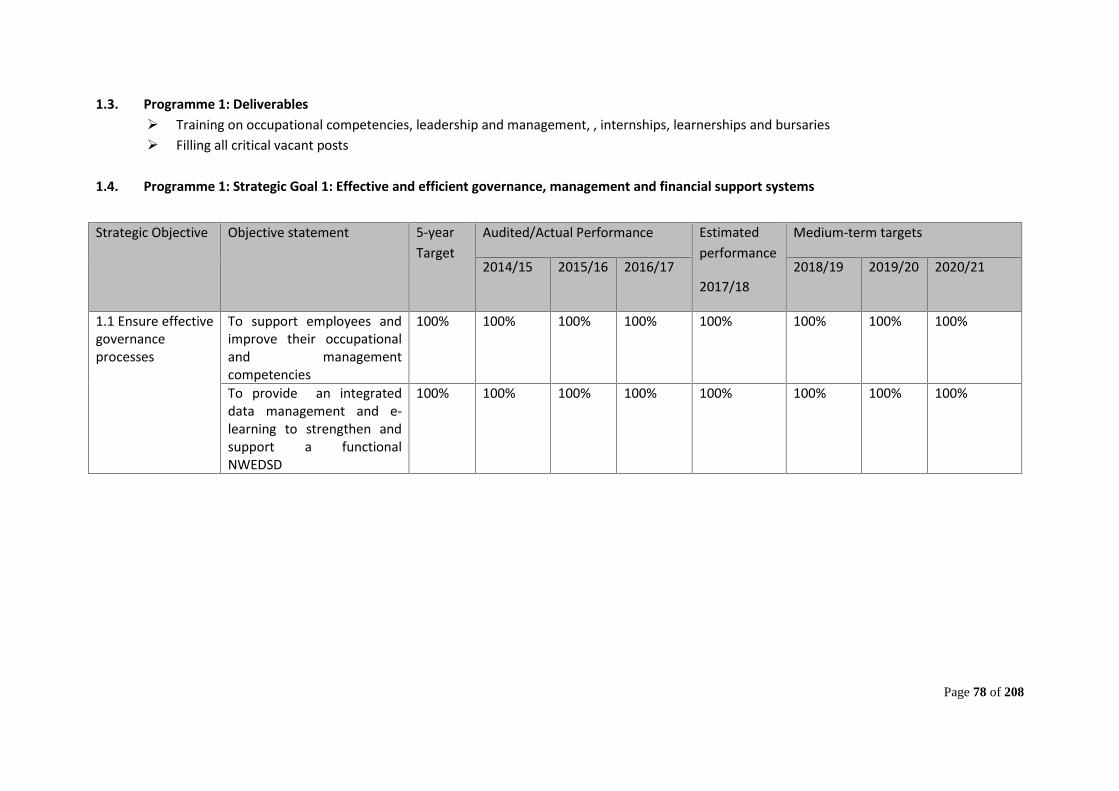
Page 78 of 208
1.3. Programme 1: Deliverables Training on occupational competencies, leadership and management, , internships, learnerships and bursaries Filling all critical vacant posts
1.4. Programme 1: Strategic Goal 1: Effective and efficient governance, management and financial support systems
Strategic Objective Objective statement 5-yearTarget
Audited/Actual Performance Estimatedperformance
2017/18
Medium-term targets
2014/15 2015/16 2016/17 2018/19 2019/20 2020/21
1.1 Ensure effectivegovernanceprocesses
To support employees andimprove their occupationaland managementcompetencies
100% 100% 100% 100% 100% 100% 100% 100%
To provide an integrateddata management and e-learning to strengthen andsupport a functionalNWEDSD
100% 100% 100% 100% 100% 100% 100% 100%

Page 79 of 208
1.5. Programme 1: Performance Indicators and MTEF Targets
Programme Performance Indicator5-yearTarget1
Audited/Actual Performance Estimatedperformance
2018/19
Medium-term targets
2015/16 2016/17 2017/18 2019/20 2020/21 2021/22
PPM 101 Number of public schools that use the SouthAfrican Administration and ManagementSystems (SA-SAMS) to electronically providedata
1407 1455 1486 1489 1486 1486 1486
PPM 102 Number of public schools that can becontacted electronically (e-mail)
1494 1300 1465 1465 1486 1486 1486
PPM 103 Percentage of education expenditure goingtowards non-personnel items
10% 10% 10% 10% 10% 10% 10%
PPM 104 Number of schools visited by District officialsfor monitoring and support purposes
1291 1496 1464 100% 100% 100% 100%
1.2.1 Percentage of 7 to 15 year olds attendingeducation institutions
N/A N/A 87% 99% 100% 100% 100%
1.2.2 Percentage of learners having access toinformation through(a)Connectivity (other than broadband); and(b)Broadband
N/A N/A N/A 5% 15% 30% 30%
1.2.3 Percentage of school principals rating thesupport services of districts as beingsatisfactory
N/A N/A 63.4% 70% 70% 70% 70%
1.2.4 Number of office based employees trained 2700 616 720 611 700 700 700 7001.2.5 Number of unemployed youth participating in
internship, learnerships and/or skills programs778 99 100
N/A1510
140 238 238 238
1.2.6 Number of employees attending employeeHealth and Wellness activities
39914 187 12 319 12773 8000 10000 10000 10000
1 All PPMS don’t have five year targets. This applies to all programmes

Page 80 of 208
Programme Performance Indicator5-yearTarget1
Audited/Actual Performance Estimatedperformance
2018/19
Medium-term targets
2015/16 2016/17 2017/18 2019/20 2020/21 2021/22
1.2.7 Number of schools that will be monitored onintegrating ICT in teaching and learning
1000 249 230 267 150 150 150 150
1.2.8 Percentage of women appointed in SMSpositions. (Percentage of office based womenin Senior Management Service).
50% DNA DNA 30% 50% 50% 50% 50%
1.2.9 Percentage of invoices paid within 30 days 100% DNA DNA DNA DNA 80% 80% 80%

Page 81 of 208
1.6. Programme 1: Annual and Quarterly Performance Targets for 2019/2020
Programme Performance IndicatorReportingperiod
Annualtarget2019/20
Quarterly targets
1st
(Apr-Jun)
2nd
(Jul-Sep)
3rd
(Oct-Dec)
4th
(Jan-Mar)
PPM101 Number of public schools that use the South AfricanAdministration and Management Systems (SA-SAMS) toelectronically provide data
Quarterly 1486 1486 1486 1486 1486
PPM102 Number of public schools that can be contactedelectronically (e-mail)
Quarterly 1486 1486 1486 1486 1486
PPM103 Percentage of education expenditure going towards non-personnel items
Annual 10% 10%
PPM 104 Number of schools visited by District officials for monitoringand support purposes
Quarterly 100% 100%
1.2.1 Percentage of 7 to 15 year olds attending educationinstitutions
Annual 100% 100%
1.2.2 Percentage of learners having access to information through(a)Connectivity (other than broadband); and(b)Broadband
Quarterly 15% 15% 15% 15% 15%
1.2.3 Percentage of school principals rating the support services ofdistricts as being satisfactory
Annual 70% 70%
1.2.4 Number of office based employees trained Quarterly 700 150 200 200 150
1.2.5 Number of unemployed youth participating in internship,learnerships and/or skills programs
Annual 238 238
1.2.6 Number of employees attending employee Health andWellness activities
Quarterly 10000 2500 2500 2500 2500
1.2.7 Number of schools that will be monitored on integrating ICTin teaching and learning
Quarterly 200 80 60 22 38

Page 82 of 208
Programme Performance IndicatorReportingperiod
Annualtarget2019/20
Quarterly targets
1st
(Apr-Jun)
2nd
(Jul-Sep)
3rd
(Oct-Dec)
4th
(Jan-Mar)
1.2.8 Percentage of women appointed in SMS positions.(Percentage of office based women in Senior ManagementService).
Annual 50% 50%
1.2.9 Percentage of invoices paid within 30 days Annual 80% 80%

Page 83 of 208
1.7. Programme 1: Reconciling Performance Targets with the Budget and MTEF: Allocation per sub-programme as well as economic classification
Outcome Mainappropriation
Adjustedappropriation Revised estimate Medium-term estimates
R thousand 2015/16 2016/17 2017/18 2019/20 2020/21 2021/221. Office Of The Mec 6 822 8 328 8 695 10 452 10 452 9 329 11 144 11 757 12 404
2. Corporate Services 342 770 369 521 427 819 425 933 439 933 441 289 426 311 460 692 486 031
3. Education Management 356 077 361 088 379 539 432 194 406 194 377 759 439 776 481 187 507 652
4. Human Research Development 9 564 16 973 15 187 19 022 19 022 18 376 21 991 24 728 26 089
5. Conditional Grants – – – – – – – – –
6. Education Management System 2 644 13 696 29 029 19 596 19 596 16 710 25 734 26 877 28 357
Total payments and estimates 717 877 769 606 860 269 907 197 895 197 863 463 924 956 1 005 241 1 060 533
2018/19
Outcome Mainappropriation
Adjustedappropriation Revised estimate Medium-term estimates
R thousand 2015/16 2016/17 2017/18 2019/20 2020/21 2021/22Current payments 710 023 756 934 843 559 894 772 877 772 850 115 911 810 991 373 1 045 899
Compensation of employees 562 146 571 338 650 675 715 854 702 854 673 906 750 636 800 916 844 967
Goods and services 147 877 185 426 192 788 178 918 174 918 176 046 161 174 190 457 200 932
Interest and rent on land – 170 96 – – 163 – – –
Transfers and subsidies to: 6 301 5 902 11 467 5 768 12 768 10 015 6 102 6 437 6 791
Provinces and municipalities – – – – – – – – –
Departmental agencies and accounts – 8 – – – – – – –
Higher education institutions – – – – – – – – –
Foreign governments and international organisations – 150 – – – – – – –
Public corporations and private enterprises – – – – – – – – –
Non-profit institutions – – – – – – – – –
Households 6 301 5 744 11 467 5 768 12 768 10 015 6 102 6 437 6 791
Payments for capital assets 1 568 6 770 5 243 6 657 4 657 3 333 7 044 7 431 7 843
Buildings and other fixed structures – – – – – – – – –
Machinery and equipment 1 568 6 770 5 243 6 657 4 657 3 333 7 044 7 431 7 843
Heritage Assets – – – – – – – – –
Specialised military assets – – – – – – – – –
Biological assets – – – – – – – – –
Land and sub-soil assets – – – – – – – – –
Software and other intangible assets – – – – – – – – –
Payments for financial assets -15 – – – – – – – –
Total economic classification 717 877 769 606 860 269 907 197 895 197 863 463 924 956 1 005 241 1 060 533
2018/19

Page 84 of 208
1.8. Programme 1: Budget Expenditure
The spending focus for the programme over the medium term is mainly for provision of administrative support and monitoring of schools and circuitoffices.
The overall programme increase marginally by 7.1 per cent from 2018/19 revised estimate to 2019/20 allocation. The increase is manly driven by personnelbudget, as goods and services is declining. The greater part of the budget on the programme is allocated to fund compensation of employees underCorporate and Education Management Services. The budget of the Office of the MEC is increasing modestly in the medium term in line with its currentoperational needs.
The budget for Corporate Services is inclusive of the entire department’s support services, inclusive of financial management, legal services, supply chainmanagement, security services, human resource management, communication and infrastructure management. With the budget allocated under this sub-programme the department is planning to continue with implementation of interventions to improve the overall performance of the department’s supportservices with special attention issues raised by the Auditor General on operational efficiency, compliance with laws and regulations as well monitoring andevaluation performance information.
The main functions of the sub-programme Education Management is to provide education planning, implementation of curriculum related interventionsand programs and general support to all schools in the province through the district and circuit offices. The programme is also responsible for professionaland subject advisory services and provision of curriculum related resources to improve learner outcomes in subjects such as mathematics and science.
The Human Resources Development funding provide funding for learnerships to school leavers and graduates. However, the sub programme allocationincreases over the 2019 MTEF to accommodate more learnerships into the programme.
Education Management Information System (EMIS) grows significantly from the 2018/19 Revised Estimate onward in order to ensure the speedy roll-out ofthe South African Schools Administration and Management System (SA-SAMS).
Compensation of employees grows modestly at 6.8 per cent to cover for the annual salary cost of living adjustments.
The 2019/20 Goods and Services allocation recorded a decline of 7.9 per cent from the adjusted budget of 2018/19. Cost containment measures that thedepartment implemented in the past financial years will continue in 2019/20. These measures are intended to reduce spending on day-to-day discretionaryexpenditure items such as subsistence and travelling, catering, etc. Any efficiency gains and savings realized from cost containment will be redirected toensure adequate funding for fixed costs such as municipality and security services as they are expected to increase considerably in the medium term.

Page 85 of 208
Initiatives that were previously implemented to strengthen financial, human resources, supply chain management and accountability will also continue inthe new financial year.
1.9. Programme 1: Risk ManagementRISKS MITIGATION
Inadequate implementation of documents and ICT security measures Electronic filing systemIneffective provision of revenue services Decentralisation of revenue function to the districts. Make
recommendation for the revenue official posts to be created
Ineffective reconciliation of suspense and control accounts Investigate the transactions in each account and correct, timeous monthlyreconciliations. Regular visits to districts (make schedule), sending lists ofrequested supporting documents to districts. Ongoing training andmotivation
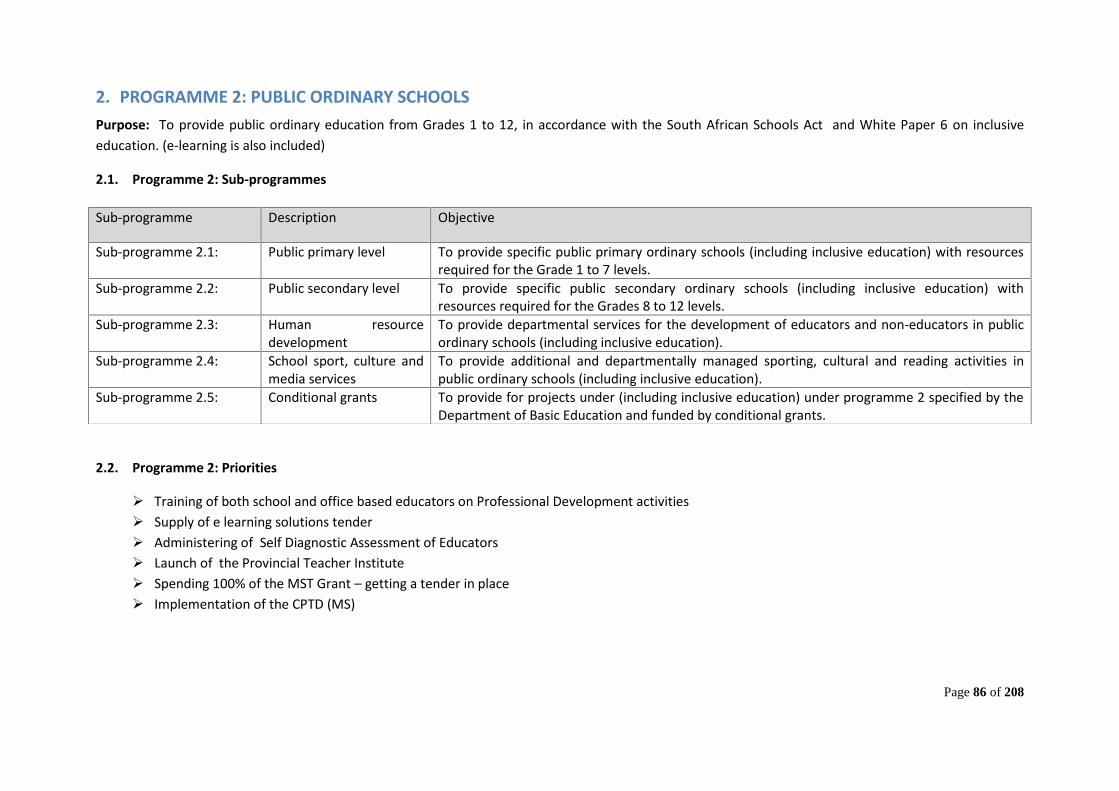
Page 86 of 208
2. PROGRAMME 2: PUBLIC ORDINARY SCHOOLSPurpose: To provide public ordinary education from Grades 1 to 12, in accordance with the South African Schools Act and White Paper 6 on inclusiveeducation. (e-learning is also included)
2.1. Programme 2: Sub-programmes
2.2. Programme 2: Priorities
Training of both school and office based educators on Professional Development activities Supply of e learning solutions tender Administering of Self Diagnostic Assessment of Educators Launch of the Provincial Teacher Institute Spending 100% of the MST Grant – getting a tender in place Implementation of the CPTD (MS)
Sub-programme Description Objective
Sub-programme 2.1: Public primary level To provide specific public primary ordinary schools (including inclusive education) with resourcesrequired for the Grade 1 to 7 levels.
Sub-programme 2.2: Public secondary level To provide specific public secondary ordinary schools (including inclusive education) withresources required for the Grades 8 to 12 levels.
Sub-programme 2.3: Human resourcedevelopment
To provide departmental services for the development of educators and non-educators in publicordinary schools (including inclusive education).
Sub-programme 2.4: School sport, culture andmedia services
To provide additional and departmentally managed sporting, cultural and reading activities inpublic ordinary schools (including inclusive education).
Sub-programme 2.5: Conditional grants To provide for projects under (including inclusive education) under programme 2 specified by theDepartment of Basic Education and funded by conditional grants.

Page 87 of 208
2.3. Programme 2: Deliverables
A Provincial Teacher Institute which is supported by functional District Teacher Centres Induction Programmes for newly appointed educators Training in National Priority Areas : Accredited and/or endorsed programmes and qualifications for identified teachers in all public schools Results on self-diagnostic assessment which are used to inform capacity building programmes Procure for schools Early procurement and delivery A service provider (University) for training Participation of SMTs and PL1 teachers in the CPTD system (Signing up and reporting) Training of educators on the development of endorsed material Establishment of PLCs
2.4. Programme 2: Strategic Goal 2: Improved learner attainment in Grades (R to 12) 3, 6, 9 and 12
Strategic Objective Objective Statement 5-yearTarget
Audited/Actual Performance Estimatedperformance
2018/19
Medium-term targets
2015/16 2016/17 2017/18 2019/20 2020/21 2021/22
Improvedfunctionality andperformance ofschools
To support targeted schools to be accessible,functional and improve performance throughevaluations, provision of resources, trainingof personnel and ensure compliance in theimplementation of IQMS
100% 100% 100% 100% 100% 100% 100% 100%

Page 88 of 208
2.5. Programme 2: Performance Indicators and MTEF TargetsProgramme Performance Indicator 5-year
TargetAudited/Actual Performance Estimated
performance
2018/19
Medium-term targets
2015/16 2016/17 2017/18 2019/20 2020/21 2021/22
PPM 201 Number of full service schools servicinglearners with learning barriers
16 16 16 16 16 16 16
PPM 202 The percentage of children who turned 9 inthe previous year and who are currentlyenrolled in Grade 4 (or a higher grade)
DNA 70.7% 75.1% 70% 75% 76% 76%
PPM 203 The percentage of children who turned 12 inthe preceding year and who are currentlyenrolled in Grade 7 (or a higher grade)
DNA 57.1% 58.8% 60% 60% 60% 60%
PPM 204 Number of schools provided with multi-media resources
107 150 25 25 25 25 25
PPM 205 Learner absenteeism rate 3% 2.97% 3.3% 2.1% 2.1% 2.1% 2.1%PPM 206 Teachers absenteeism rate 3.9% 4.99% 5.6% 3.7% 3% 3% 3%PPM 207 Number of learners in public ordinary
schools benefiting from the no-fee schoolpolicy
695 338 704 931 718 545 714 397 715 111 715 826 715 826
PPM 208 Number of educators trained inLiteracy/Language content and methodology
3 328 1 830 3497 2554 1680 1680 1680
PPM 209 Number of educators trained inNumeracy/Mathematics content andmethodology
1 754 889 1502 1460 1680 1680 1680
2.1 The average hours per year spent byteachers on professional developmentactivities
N/A N/A 68,78hrs 66hrs 70hrs 70hrs 70hrs
2.2 Number of teachers who have written theSelf-Diagnostic Assessments
N/A N/A N/A 2000 2000 2000 2000
2.3 Percentage of teachers meeting required N/A N/A N/A 10% 10% 10% 10%

Page 89 of 208
Programme Performance Indicator 5-yearTarget
Audited/Actual Performance Estimatedperformance
2018/19
Medium-term targets
2015/16 2016/17 2017/18 2019/20 2020/21 2021/22
content knowledge levels after support.2.4 Percentage of learners in schools with at
least one educator with specialist training oninclusion
N/A N/A 6.68% 23% 7% 7% 7%
2.5 Percentage of Funza Lushaka bursary holdersplaced in schools within six months uponcompletion of studies or upon confirmationthat the bursar has completed studies.
200 200 100% 120100%
(120)100%
120100%
120100%
2.6 Number of qualified Grade R-12 teachers,aged 30 and below, entering the publicservice as teachers for the first time duringthe financial year
DNA DNA 1901 1138 1138 1138 1138
2.7 Percentage of learners who are in classeswith no more than 45 learners.
DNA DNA 54.9% 60% 54% 54% 54%
2.8 Percentage of schools where allocatedteaching posts are all filled.
DNA DNA 100% 100% 100% 100% 100%
2.9 Percentage of learners provided withrequired textbooks in all grades and in allsubjects per annum
DNA DNA 90% 90% 100% 100% 100%
2.10 Number and Percentage of learners whocomplete the whole curriculum each year
DNA DNA FET=100%GET=65.33%
FET=95%GET=95%
FET=95%GET=95%
FET=95%GET=95%
FET=95%GET=95%
2.11 Percentage of schools producing a minimumset of management documents at a requiredstandard
DNA DNA 94% 60% 80% 80% 80%
2.12 Percentage of SGBs in sampled schools thatmeet minimum criteria in terms of
41%(897
68%(715
88% 60% 80% 80% 80%

Page 90 of 208
Programme Performance Indicator 5-yearTarget
Audited/Actual Performance Estimatedperformance
2018/19
Medium-term targets
2015/16 2016/17 2017/18 2019/20 2020/21 2021/22
effectiveness every year schools) schools)2.13 Percentage of schools with more than one
financial responsibility on the basis ofassessment.
DNA DNA DNA 100% 100% 100% 100%
2.14 Percentage of learners in schools that arefunded at a minimum level
N/A N/A N/A 100% 100% 100% 100%
2.15 Percentage of targeted Public Ordinaryschools that received their stationery inJanuary
100% 100% 88% 100% 100% 100% 100% 100%
2.16 Percentage of targeted Public Ordinaryschools that received their textbooks inJanuary
100% 100% 82% 100% 100% 100% 100% 100%
2.17 Number of workbooks procured for top up DNA DNA DNA DNA 128 000 135 000 142 000 150 0002.18 Number of schools provided with extra
support for the achievement of safetymeasures
440 80 N/A 124 80 80 80 80
2.19 Number of school based educators trainedon other interventions excludingMathematics (PPM 209) and Languages(PPM 208) content training
50 000 14 000 N/A 10 195 10 000 9688 9688 6312
2.20 Number of school based administrativeemployees trained
2 500 538 300 306 400 956 400 400
2.21 Number of new bursaries awarded to schoolbased employees (excluding reinstatements)
1 500 300 250 332 330 288 370 370
2.22 Percentage of women in Principalship posts N/A N/A 34% 39% 50% 50% 50% 50%
2.23 Number of learners provided with sanitary DNA DNA DNA 8479 10 000 12 000 12 000

Page 91 of 208
Programme Performance Indicator 5-yearTarget
Audited/Actual Performance Estimatedperformance
2018/19
Medium-term targets
2015/16 2016/17 2017/18 2019/20 2020/21 2021/22
towels
2.24 Number of learners who benefit fromlearner transport.
N/A N/A N/A 57 015 57 000 58 000 59 000 59 000
2.25 Number of learners with special educationneeds identified in public ordinary schools.
N/A N/A N/A 1414 3600 1414 1514 1514
2.26 Number of events supported by schoolenrichment programme
28 25 30 30 30 30 30 30

Page 92 of 208
2.6. Programme 2: Annual and Quarterly Performance Targets for 2019/2020
Programme Performance IndicatorReportingperiod
Annualtarget2019/20
Quarterly targets
1st
(Apr-Jun)
2nd
(Jul-Sep)
3rd
(Oct-Dec)
4th
(Jan-Dec)
PPM 201 Number of full service schools servicing learners with learningbarriers
Annual 16 16
PPM202 The percentage of children who turned 9 in the previous year andwho are currently enrolled in Grade 4 (or a higher grade)
Annual 75% 75%
PPM203 The percentage of children who turned 12 in the preceding yearand who are currently enrolled in Grade 7 (or a higher grade)
Annual 60% 60%
PPM 204 Number of schools provided with multi-media resources Annual 25 25PPM 205 Learner absenteeism rate Quarterly 2.1% 2.1% 2.1% 2.1% 2.1%
PPM 206 Teachers absenteeism rate Quarterly 3% 3% 3% 3% 3%
PPM207 Number of learners in public ordinary school benefiting from theno-fee school policy
Annual 715 111 715 111
PPM208 Number of educators trained on Literacy/Language content andmethodology
Annual 1680 1680
PPM209 Number of educators trained on Numeracy/Mathematics contentand methodology
Annual 1680 1680
2.1 The average hours per year spent by teachers on professionaldevelopment activities
Annual 70hrs 70hrs
2.2 Number of teachers who have written the Self-DiagnosticAssessments
Annual 2000 2000
2.3 Percentage of teachers meeting required content knowledgelevels after support.
Annual 10% 10%
2.4 Percentage of learners in schools with at least one educator withspecialist training on inclusion
Annual 7% 7%

Page 93 of 208
Programme Performance IndicatorReportingperiod
Annualtarget2019/20
Quarterly targets
1st
(Apr-Jun)
2nd
(Jul-Sep)
3rd
(Oct-Dec)
4th
(Jan-Dec)
2.5 Percentage of FunzaLushaka bursary holders placed in schoolswithin six months upon completion of studies or uponconfirmation that the bursar has completed studies
Annual 120100%
120100%
2.6 Number of qualified Grade R-12 teachers, aged 30 and below,entering the public service as teachers for the first time duringthe financial year
Annual 1138 1138
2.7 Percentage of schools with learners who are in classes with nomore than 45 learners.
Annual 54% 54%
2.8 Percentage of schools where allocated teaching posts are allfilled.
Annual 100% 100%
2.9 Percentage of learners provided with required textbooks in allgrades and all subjects
Annual 100% 100%
2.10 Number and Percentage of learners who complete the wholecurriculum each year
Annual FET=95%GET=95%
FET=95%GET=95%
2.11 Percentage of schools producing the minimum set ofmanagement documents at the required standard
Annual 80% 80%
2.12 Percentage of SGBs in sampled schools that meet minimumcriteria in terms of effectiveness every year
Annual 80% 80%
2.13 Percentage of schools with more than one financial responsibilityon the basis of assessment.
Annual 100% 100%
2.14 Percentage of learners in schools that are funded at a minimumlevel
Annual 100% 100%
2.15 Percentage of targeted Public Ordinary schools that receivedtheir stationery in January
Annual 100% 100%
2.16 Percentage of targeted Public Ordinary schools that receivedtheir textbooks in January
Annual 100% 100%

Page 94 of 208
Programme Performance IndicatorReportingperiod
Annualtarget2019/20
Quarterly targets
1st
(Apr-Jun)
2nd
(Jul-Sep)
3rd
(Oct-Dec)
4th
(Jan-Dec)
2.17 Number of workbooks procured for top up Annual 135 000 135 0002.18 Number of schools provided with extra support for the
achievement of safety measuresAnnual 80 80
2.19 Number of school based educators trained on other interventionsexcluding Mathematics (PPM 209)and Languages (PPM 208)content training
Quarterly 9688 2000 4500 1500 1688
2.20 Number of school based administrative employees trained Quarterly 956 200 350 300 1062.21 Number of new bursaries awarded to school based employees
(excluding reinstatements)Annual 288 288
2.22 Percentage of women in Principalship posts Annual 50% 50%2.23 Number of learners provided with sanitary towels Annual 10 000 10 0002.24 Number of learners who benefit from learner transport. Annual 58 000 58 0002.25 Number of learners with special education needs identified in
public ordinary schools.Annual 1414 1414
2.26 Number of events supported by school enrichment programme Quarterly 30 7 13 5 5

Page 95 of 208
2.7. Programme 2: Reconciling performance targets with budget and MTEF: Allocation per sub-programme as well as economic classificationOutcome Main
appropriationAdjusted
appropriation Revised estimate Medium-term estimates
R thousand 2015/16 2016/17 2017/18 2019/20 2020/21 2021/221. Public Primary School 5 921 636 6 391 780 6 896 997 7 407 987 7 486 027 7 589 711 7 999 664 8 624 602 9 128 193
2. Public Secondary School 3 238 524 3 511 797 3 778 542 4 126 425 4 120 425 4 052 519 4 468 761 4 843 620 5 190 905
3. Professioanal Services – – – – – – – – –
4. Human Resource Development 49 440 38 551 47 018 42 911 40 911 36 040 41 198 46 891 49 470
5. In -School Sport And Culture 33 133 33 174 24 771 37 074 39 074 27 988 39 297 41 459 43 740
6. Conditional Grant - Infrastructure – – – – – – – – –
7. Conditional Grt - School Nutrition Programme 379 385 406 668 427 319 456 176 456 397 453 122 481 859 508 361 536 321
8. Maths,Science And Technology Grant (Schools Recap)31 263 39 217 28 887 36 347 42 092 40 015 38 391 40 831 43 101
9. Maths,Science And Technology Grant (Dinaledi Schools)– – – – – – – – –
Total payments and estimates 9 653 381 10 421 187 11 203 534 12 106 920 12 184 926 12 199 395 13 069 170 14 105 764 14 991 730
2018/19
Outcome Mainappropriation
Adjustedappropriation Revised estimate Medium-term estimates
R thousand 2015/16 2016/17 2017/18 2019/20 2020/21 2021/22Current payments 8 770 748 9 460 180 10 237 389 11 096 298 11 185 011 11 161 318 11 993 496 12 960 142 13 783 035
Compensation of employees 8 316 073 8 922 540 9 716 589 10 510 948 10 587 988 10 581 882 11 334 216 12 296 651 13 081 090
Goods and services 454 675 537 640 520 800 585 350 597 023 579 436 659 280 663 491 701 945
Interest and rent on land – – – – – – – – –
Transfers and subsidies to: 864 197 935 301 960 426 1 004 455 986 093 1 018 000 1 042 365 1 111 371 1 172 495
Provinces and municipalities – – – – – – – – –
Departmental agencies and accounts – – – – – – – – –
Higher education institutions – – – – – – – – –
Foreign governments and international organisations – – – – – – – – –
Public corporations and private enterprises – – – – – – – – –
Non-profit institutions 768 908 847 267 886 390 958 172 939 810 971 717 983 397 1 048 914 1 106 603
Households 95 289 88 034 74 036 46 283 46 283 46 283 58 968 62 457 65 892
Payments for capital assets 10 589 10 682 5 719 6 167 13 822 20 077 33 309 34 251 36 200
Buildings and other fixed structures – -20 – – – – – – –
Machinery and equipment 10 589 10 702 5 719 6 167 13 822 20 077 33 309 34 251 36 200
Heritage Assets – – – – – – – – –
Specialised military assets – – – – – – – – –
Biological assets – – – – – – – – –
Land and sub-soil assets – – – – – – – – –
Software and other intangible assets – – – – – – – – –
Payments for financial assets 7 847 15 024 – – – – – – –
Total economic classification 9 653 381 10 421 187 11 203 534 12 106 920 12 184 926 12 199 395 13 069 170 14 105 764 14 991 730
2018/19

Page 96 of 208
2.8. Programme 2: Budget Expenditure
Programme 2 is the largest budget programme in the department and accounts for 76 per cent of the total budget allocated to this department. The largest
portion of the budget under this programme is allocated to the sub-programme: Public Primary Schools and Public secondary schools. The spending focus
over the medium term will be on sustaining the provision of quality education in public ordinary schools to ensure that learner outcomes continue to
improve in the medium term.
To achieve these objectives, the greater portion of the budget allocated to this programme will be directed towards payment of salaries to educators and
support staff at schools. Compensation of employees constitute 86.7 per cent of funds allocated to this programme. The programme grew by 7.1 per
cent from R10.582 billion in 2018/19 Revised Estimate to R11.334 billion in 2019/20, largely due to the carry-through effect of the salary adjustments.
Given the current pressure on the fiscus, the department will continue to ensure that the implementation of the Post Provision Norms responds adequately
and effectively to the teaching needs of every school in the province. Measures to eliminate inefficiencies in the system will also continue in the new
financial year as this will assist to redirect gains or savings realized from this exercise to deal with other critical areas that require funding thus ensuring that
all schools in the province have adequate number of educators for effective teaching and learning.
Budget for Goods and Services increases by 13.8 per cent in 2019/20. Adequate budget is allocated for provision of textbooks and stationery to all public
schools in the province. Processes for procurement of textbooks and stationery will start early in the financial year to ensure that schools receive their
learner materials before the commencement of the school calendar. Additional resources will also be provided to schools to curriculum delivery. These will
include among others kits for learners who are enrolled in mathematics and science and consumables for practical work.
Programme 2 houses the larger portion of the transfers to schools: Non-profit institutions reflect payments made in respect of section 21 norms and
standards and the NSNP allocation. Transfers and subsidies to: Non-profit institutions reflect a steady increase over the 2019/20 MTEF.
The budget under Human Resource Development sub programme is allocated for teacher development. The sub-programme fluctuates over the period
under review, with low spending in 2016/17. The 2019/20 MTEF reflects a steady increase. In-school Sport and Culture sub-programme reflects a steady
increase over the MTEF to enable the department to deliver on its social cohesion goal. The National School Nutrition Programme grant shows a marked

Page 97 of 208
increase over the medium term due to the progressive implementation of the program to all deserving learners across the province. The Mathematics,
Science and Technology Grant will support interventions and programs that are geared to improve learner outcomes and in mathematics and science
related subjects.
2.9. Programme 2: Risk ManagementRISKS MITIGATION
Tight schedules of competing priorities with minimal staff Principals to be oriented on prioritizing ICT integration training
Delay in the development of the SLALate delivery by suppliersCorrect / appropriate use of transferred grant funds to schools for auditreporting
Starting procurement in quarter 1 to circumvent all possible delaysTender in place to procure for schools and or intense monitoring on the useof procured equipment and transferred budget
Limited ability to source competent service providers on time to executetraining programmes due to limited capacity to develop specifications ontraining programmes
Internal training and coachingImprove on planning, management and timely communication with allrelevant role players
Service Providers stopping to transport learners due to non-paymentNon-compliance of Service Providers by using taxis and old, unreliablebusses.
Scholar transport transferred to North West Transport Investment (NTI)which will then appoint New Service Providers and enforce on contractedand reliable capacity

Page 98 of 208
3. PROGRAMME 3: INDEPENDENT SCHOOL SUBSIDIESPurpose: To support independent schools in accordance with the South African Schools Act
3.1. Programme 3: Sub-programmes
3.2. Programme 3: Priority Monitor and support independent schools.
3.3. Programme 3: Deliverables Independent school subsidy Independent learner’s subsidy
3.4. Programme 3: Strategic Goal 2: Improved learner attainment in grades 3, 6, 9 and 12Strategicobjective
Objective statement 5-yearTarget
Audited/Actual Performance Estimatedperformance2017/18
Medium-term targets
2014/15 2015/16 2016/17 2018/19 2019/20 2020/21
Support ofIndependentschools
To subsidise and/or monitor registeredindependent schools to ensure compliance withSASA and North West Regulations
80 69 63 69 68 68 68 68
Sub-programme Description Objective
Sub-programme 3.1 Primary Phase To support independent schools in Grades 1 to 7Sub-programme 3.2 Secondary Phase To support independent schools in Grades 8 to 12

Page 99 of 208
3.5. Programme 3: Performance Indicators and MTEF TargetsProgramme Performance Indicator 5-year Target Audited/Actual Performance Estimated
performance
2018/19
Medium-term targets
2015/16 2016/17 2017/18 2019/20 2020/21 2021/22
PPM 301 Percentage of registeredindependent schools receivingsubsidies
41% 35% 35% 45% 45% 46% 46%
PPM 302 Number of learners at subsidisedregistered independent schools
8873 8184 8482 9200 9200 9500 10 000
PPM 303 Percentage of registeredindependent schools visited formonitoring and support
Subsidised(31)
100% 100% 100% 100% 100% 100% 100%
Non-subsidised(37)
79% 100% 100% 100% 100% 100% 100%

Page 100 of 208
3.6. Programme 3: Annual and Quarterly Performance Targets for 2019/2020
Programme Performance Indicator
Reportingperiod
Annualtarget2019/20
Quarterly targets
1st
(Apr-June)
2nd
(Jul-Sep)
3rd
(Oct-Dec)
4th
(Jan-Mar)
PPM301 Percentage of registered independent schools receivingsubsidies
Annual 45% 45%
PPM302 Number of learners at subsidised registered independentschools
Annual 9200 9200
PPM303 Percentage of registered independent schools visited formonitoring and support
Quarterly(Subsidised)
100% 100% 100% 100% 100%
Quarterly(Non-subsidised)
100% 27% 32% 22% 19%
Footnote: PPM 301: 31 out of 68 registered independent schools receive state subsidy.Footnote: PPM 303 Subsidised: All 31 subsidised independent schools and 37 non-subsidised independent schools shall be visited for monitoring and support.Footnote: PPM 303 Non-subsidised: Monitoring and support visitations to 37 non-subsidised independent schools shall be spread into four quarters. That is Q1=10, Q2=12, Q3=8 and Q4=7.

Page 101 of 208
3.7. Programme 3: Reconciling performance targets with budget and MTEF: Allocation per sub-programme as well as economic classification
Mainappropriation
Adjustedappropriation
Revisedestimate
R thousand 2015/16 2016/17 2017/18 2019/20 2020/21 2021/22
1. Primary Phase 21 540 20 196 21 976 22 826 22 826 23 651 24 150 25 478 26 879
2. Secondary Phase 7 347 10 128 5 510 8 505 8 505 6 299 8 998 9 493 10 015
Total payments and estimates 28 887 30 324 27 486 31 331 31 331 29 950 33 148 34 971 36 894
2018/19
Outcome Medium-term estimates
Outcome Mainappropriation
Adjustedappropriation Revised estimate Medium-term estimates
R thousand 2015/16 2016/17 2017/18 2019/20 2020/21 2021/22Current payments -2 – – – – – – – –
Compensation of employees -2 – – – – – – – –
Goods and services – – – – – – – – –
Interest and rent on land – – – – – – – – –
Transfers and subsidies to: 28 889 30 324 27 486 31 331 31 331 29 950 33 148 34 971 36 894
Provinces and municipalities – – – – – – – – –
Departmental agencies and accounts – – – – – – – – –
Higher education institutions – – – – – – – – –
Foreign governments and international organisations – – – – – – – – –
Public corporations and private enterprises – – – – – – – – –
Non-profit institutions 28 889 30 324 27 486 31 331 31 331 29 950 33 148 34 971 36 894
Households – – – – – – – – –
Payments for capital assets – – – – – – – – –
Buildings and other fixed structures – – – – – – – – –
Machinery and equipment – – – – – – – – –
Heritage Assets – – – – – – – – –
Specialised military assets – – – – – – – – –
Biological assets – – – – – – – – –
Land and sub-soil assets – – – – – – – – –
Software and other intangible assets – – – – – – – – –
Payments for financial assets – – – – – – – – –
Total economic classification 28 887 30 324 27 486 31 331 31 331 29 950 33 148 34 971 36 894
2018/19

Page 102 of 208
3.8. Programme 3: Budget Expenditure
The spending focus of the programme over the MTEF is to provide subsidies to qualifying independent schools in terms of the national funding norms,within the current constraints on the budget. The number of independent schools which may be eligible to receive state subsidy is expected to increase infuture given the trend of the new independent schools that are established throughout the country.
The larger portion of the subsidy allocation goes to the Primary Phase as a proportion of the number of leaners in primary schools than in secondary schoolsincreases. The subsidy allocation shows a marked increase over the medium term due to the progressive implementation of the programme to all learnersacross independent schools the province. Non-profit institutions under Programme 3 reflect payments made in respect of the subsidy given to independentschools.
The programme reflects a slight growth over the seven-year period and is facing pressures due to the number of independent schools that qualify forsubsidy but cannot be funded due to budget challenges. In order to deal with this, the department has to maintain the current subsided Independentschools over the MTEF in order for the programme to stay within budget.
3.9. Programme 3: Risk ManagementRISKS MITIGATIONPolicy/Regulation not clear and guiding on registered learners atIndependent Schools which may lead to schools admitting learners ondaily basis to increase subsidy intake. The Province will exceed their targetto be met at the end of the financial year.
DBE and PED’s to finalize guidelines for registrations and regulationspertaining to the Independent Schools and Rights and ResponsibilityDocuments to further outline measures for transgression.
Lack of staff hampered the sub directorate to reach targets which will leadto the Department not detecting administrative errors, and Inadequatemonitoring of responsibilities may lead to the directorate’ s setobjectives/targets not met at the end of the year.
HR must ensure that a gap of staff shortage is addressed and vacant posts asper the organizational structure are advertised and filled to ensure smoothflow of the day- to – day activities within the unit
Late submission/loss of documents from the District with regards to CGGand AFS will lead to mismanagement of funds that may not be timelydetected from schools.
The schools, sub-districts and District Offices must hand them personally tothe Sub Directorate and avoid them to be lost in couriers.

Page 103 of 208
4. PROGRAMME 4: PUBLIC SPECIAL SCHOOL EDUCATIONPurpose: To provide compulsory public education in special schools in accordance with the South African Schools Act and White Paper 6 on inclusiveeducation.( Including E-learning and inclusive education)
4.1. Programme 4: Sub-programmesSub-programme Description Objective
Sub-programme 4.1 Schools To provide specific public special schools with resources. (Including E-learning and inclusiveeducation)
Sub-programme 4.2 Human resource development To provide departmental services for the development of educators and non-educators in publicspecial schools (including inclusive education).
Sub-programme 4.3 School sport, culture and mediaservices
To provide additional and departmentally managed sporting, cultural and reading activities inpublic special schools (including inclusive education).
Sub-programme 4.4 Conditional grants To provide for projects under programme 4 specified by the Department of Basic Education andfunded by conditional grants (including inclusive education).
4.2. Programme 4: Priorities Professional development of IE support staff and Educators Provision of relevant resources to FSS and special schools Strengthen the special Education system

Page 104 of 208
4.3. Programme 4: Deliverables Trainings: Trauma. SIAS, Accommodations and Concessions, Braille, HRD, Technical Occupational Curriculum Assistive devices for 16 FSS, 32 special schools and learners LTSM including Braille and enlarged print and textbooks Vehicles for special schools and Therapists
4.4. Programme 4: Strategic Goal 2: Improved learner attainment in grades 3,6, 9 and 12Strategic
objectiveObjective statement 5-year
TargetAudited/Actual performance Estimated
performance2017/18
Medium-term targets
2014/15 2015/16 2016/17 2018/19 2019/20 2020/21
EnhancedAccessibilityof Specialschools
To ensure that all specialschools are madeaccessible through theupgrading of resources forlearners with special needs
32 32 31 32 32 32 32 32

Page 105 of 208
4.5. Programme 4: Performance Indicators and MTEF TargetsProgramme Performance Indicator 5-year
TargetAudited/Actual Performance Estimated
performance
2018/19
Medium-term targets
2015/16 2016/17 2017/18 2019/20 2020/21 2021/22
PPM 401 Percentage of special schoolsserving as Resource Centres
13% 25% 13% 13% 13% 13% 13%
PPM 402 Number of learners in publicspecial schools
DNA DNA 7725 7440 7440 7440 7440
PPM 403Number of therapist/specialiststaff in special schools
DNA DNA 32 32 35 40 45
PPI 4.1 Number of Special schoolsprovided with assistive devices
32 32 32 32 32 32 32
PPI 4.2 Number of special schools N/A N/A 32 32 32 32 32PPI 4.3 Number of learners in special
schools provided with assistivedevices
N/A N/A 75 180 70 80 85

Page 106 of 208
4.6. Programme 4: Annual and Quarterly Performance Targets for 2019/2020
Programme Performance Indicator
Reportingperiod
Annualtarget2019/20
Quarterly targets
1st
(Apr-June)
2nd
(Jul-Sep)
3rd
(Oct-Dec)
4th
(Jan-Mar)
PPM401 Percentage of special schools serving as Resource Centres Annual 13% 13%
PPM402 Number of learners in public special schools Annual 7440 7440
PPM403 Number of therapists/specialist staff in special schools Quarterly 35 35 35 35 35
4.1 Number of Special schools provided with assistive devices Annual 32 32
4.2 Number of special schools Annual 32 32
4.3 Number of learners in special schools provided with assistivedevices
Annual 70 70

Page 107 of 208
4.7. Programme 4: Reconciling performance targets with the budget and MTEF: Allocation per sub-programme as well as economic classification
Outcome Mainappropriation
Adjustedappropriation Revised estimate Medium-term estimates
R thousand 2015/16 2016/17 2017/18 2019/20 2020/21 2021/221. Schools 469 660 517 686 572 167 608 113 629 613 623 982 679 723 720 121 768 061
2. Professional Services – – – – – – – – –
3. Human Resource Development 2 369 1 129 2 566 2 899 2 899 2 318 3 067 3 236 3 413
4. In-School Sport And Culture – – – – – – – – –
5. Education Infrastructure Grant – – – – – – – – –
6. Osd For Therapists – – – – – – – – –
7. Learner With Profound Intellectual Disabilities Grant – – – 12 797 12 797 10 660 16 267 18 414 19 427
Total payments and estimates 472 029 518 815 574 733 623 809 645 309 636 960 699 057 741 771 790 901
2018/19
Outcome Mainappropriation
Adjustedappropriation Revised estimate Medium-term estimates
R thousand 2015/16 2016/17 2017/18 2019/20 2020/21 2021/22Current payments 362 768 394 499 444 907 485 457 501 457 493 828 539 054 574 602 614 537
Compensation of employees 357 179 389 882 439 775 474 531 486 758 482 783 521 634 555 811 594 714
Goods and services 5 589 4 617 5 132 10 926 14 699 11 045 17 420 18 791 19 823
Interest and rent on land – – – – – – – – –
Transfers and subsidies to: 109 261 122 155 127 043 134 915 140 415 142 120 156 070 163 763 172 770
Provinces and municipalities – – – – – – – – –
Departmental agencies and accounts – – – – – – – – –
Higher education institutions – – – – – – – – –
Foreign governments and international organisations – – – – – – – – –
Public corporations and private enterprises – – – – – – – – –
Non-profit institutions 107 334 119 025 125 849 134 915 138 215 139 920 153 870 161 563 170 449
Households 1 927 3 130 1 194 – 2 200 2 200 2 200 2 200 2 321
Payments for capital assets – 2 161 2 783 3 437 3 437 1 012 3 933 3 406 3 594
Buildings and other fixed structures – – – – – – – – –
Machinery and equipment – 2 161 2 783 3 437 3 437 1 012 3 933 3 406 3 594
Heritage Assets – – – – – – – – –
Specialised military assets – – – – – – – – –
Biological assets – – – – – – – – –
Land and sub-soil assets – – – – – – – – –
Software and other intangible assets – – – – – – – – –
Payments for financial assets – – – – – – – – –
Total economic classification 472 029 518 815 574 733 623 809 645 309 636 960 699 057 741 771 790 901
2018/19

Page 108 of 208
4.8. Programme 4: Budget Expenditure
The spending on special schools has increased from R472.029 million in 2015/16 to R699.057 million in 2019/20, as a result of the department’sresponsibility of ensuring that all learners with special educational needs are suitably accommodated in institutions that are appropriately resourced. Theincrease in expenditure is mainly to cater for the annual cost-of-living adjustments and projected growth in learner enrolment. The introduction of a newconditional grant, Learner with Profound Intellectual Disabilities increased the allocation. The grant was allocated R2.2 million in 2017/18 and it grew toR16.367 million, R18.414 million and R19.427 million over the 2019/20 MTEF.
The significant increase from 2016/17 onward in the Schools sub-programme is due to the increased allocation to support inclusive education, and thiscontinues over the 2019/20 MTEF as evident by the healthy growth of 8.9 per cent. Human Resource Development sub-programme is reflecting a moderategrowth over the 2019/20 MTEF period.
Spending on compensation of Employees grows from R357.179 million in 2015/16 to R439.775 million in 2017/18 and maintains a reasonable trend from2019/20 onwards to ensure adequate funding to employ educators and other professional and support staff for special schools in the province.
Goods and Services’ budget grows significantly over the 2019 MTEF as it increase from R11.045 million in 2018/19 to R17.420 million in 2019/20, so as toensure adequate funding in order to provide requisite support and that the curriculum needs of these learners are taken care of. Provisioning of LTSM forspecial schools including large print, braille and SASL CAPS.
The category Transfers and subsidies related to Non-profit institutions reflects payments made to public special schools. Transfers and subsidies allocationfor 2019/20 increase by 9.8 per cent from the 2018/19 to ensure that learners in public special schools are appropriately resourced and supported.
Machinery and equipment, the allocation over the 2019/20 MTEF is to enable the department to purchase requisite vehicles for outreach teams, as well asprocuring additional purpose-made buses.

Page 109 of 208
4.9. Programme 4: Risk ManagementRISKS MITIGATION
Minimal number of educators with specialist training on inclusiveeducationPlacement of teachers not qualified in special needs education
Offer bursaries to educators to be trained on special needs education
Shortage of budget especially for specialist support staff Prioritisation of assistive devices
Transfer of budget in tranches inhibit procurement of expensive devices ontime
Submission to Budget requesting annual transfer of funds to schools
Lack of early identification of learners increases delayed support Involvement of circuit managers to ensure proper implementation of SIASpolicy
Transfer, ill health and early retirement of non-professional and non-educator support staff
Filling of posts
Dysfunctional special schools Continuous monitoring and support
Late admission and identification of learners 'needs. Insufficient budgetallocation
Monitoring of the implementation of SIAS

Page 110 of 208
5. PROGRAMME 5: EARLY CHILDHOOD DEVELOPMENTPurpose: To provide Early Childhood Education (ECD) at the Grade R and pre-grade R in accordance with White Paper 5. (E-learning is also included)
5.1. Programme 5: Sub-programmesSub-programme Description Objective
Sub-programme 5.1: Grade R in public schools To provide specific public ordinary schools with resources required for Grade R.Sub-programme 5.2: Grade R in early childhood
development centresTo support Grade R at early childhood development centres.
Sub-programme 5.3: Pre-Grade R Training To provide training and payment of stipends of Pre-Grade R Practitioners.Sub-programme 5.4: Human resource development To provide departmental services for the development of educators and Grade R
classroom assistants in public schools and practitioners in community based ECDcentres.
Sub-programme 5.5: Conditional grants To provide for projects under programme 5 specified by the Department of BasicEducation and funded by conditional grants.
5.2. Programme 5: Priorities Ensure accessibility and incorporation of Grade R in public ordinary schools by: Training practitioners in order to prepare them for absorption in the system Providing physical resources (equipment, LTSM, infrastructure etc) to Grade R in public ordinary schools Supporting ECD centres in providing quality Grade R education
5.3. Programme 5: Deliverables Schools furniture for Grade R learners Supply of resources (indoor and outdoor equipment) Providing mobile and permanent grade R classrooms for schools that are incorporating grade R Training grade R educators on the New Curriculum Statement Provision of educational toys Provision of library books Upgrading qualifications of grade R educators

Page 111 of 208
Training of ECD practitioners at NQF level, 4 and 5 Payment of Practitioners in Community sites
5.4. Programme 5: Strategic Goal 2: Improved learner attainment in grades 3,6,9 and 12Strategic Objective Objective statement 5-year
TargetAudited/Actual performance Estimated
performance
2017/18
Medium-term targets
2014/15 2015/16 2016/17 2018/19 2019/20 2020/21
Accessible qualityGrade R education
To expand primaryschools with Grade Rthrough provision ofresources and training,to prepare learners forformal schooling
1 325 250 225 265 275 280 280 280

Page 112 of 208
5.5. Programme 5: Performance Indicators and MTEF targetsProgramme Performance Indicator 5-year
TargetAudited/Actual Performance Estimated
performance
2018/19
Medium-term targets
2015/16 2016/17 2017/18 2019/20 2020/21 2021/22
PPM501 Number of public schools thatoffer Grade R
938 996 1040 973 980 985 990
PPM 502 Percentage of Grade 1 learnerswho have received formalGrade R education
99% 52.1% 63% 80% 70% 72% 74%
5.1 Number of Grade R schoolsprovided with resources(include animated toys)
1 000 255 0 130 111 504 504 504
5.2 Number of Grade R Educatorstrained
1737 345 192 995 100 105 105 105
5.3 Number of practitionerstrained on NQF 4 and above
3000 449 90 0 830 731 400 400
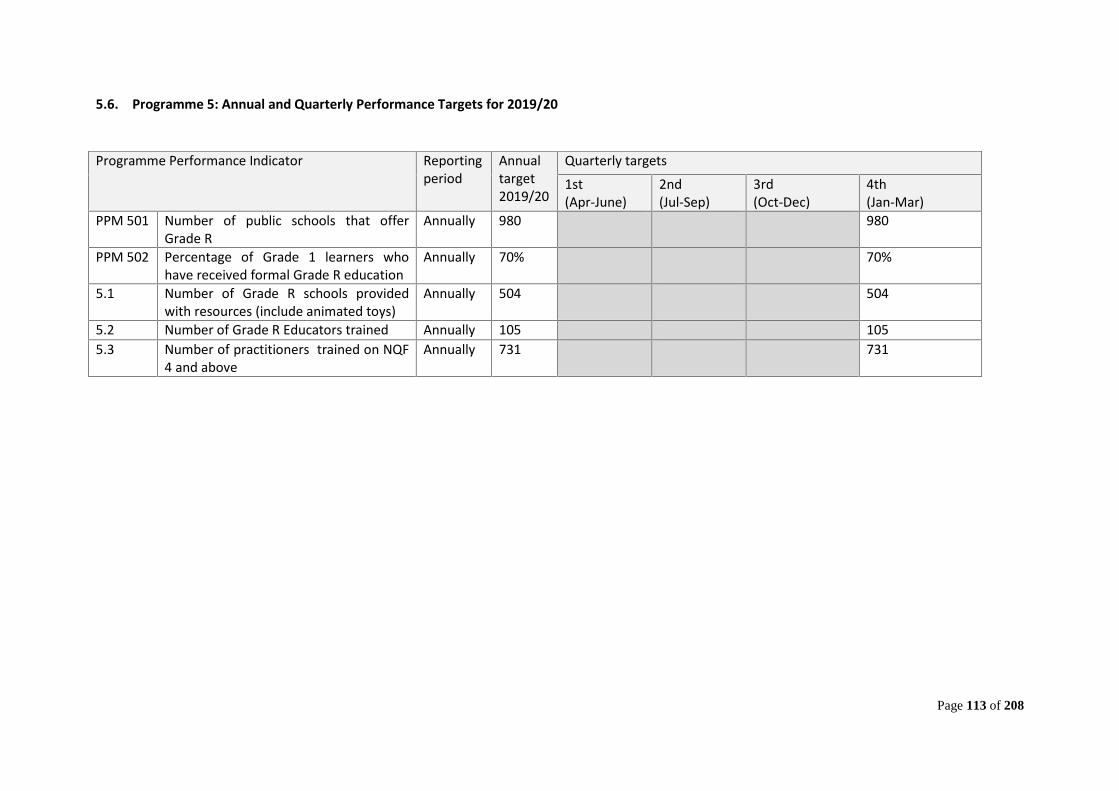
Page 113 of 208
5.6. Programme 5: Annual and Quarterly Performance Targets for 2019/20
Programme Performance Indicator Reportingperiod
Annualtarget2019/20
Quarterly targets
1st(Apr-June)
2nd(Jul-Sep)
3rd(Oct-Dec)
4th(Jan-Mar)
PPM 501 Number of public schools that offerGrade R
Annually 980 980
PPM 502 Percentage of Grade 1 learners whohave received formal Grade R education
Annually 70% 70%
5.1 Number of Grade R schools providedwith resources (include animated toys)
Annually 504 504
5.2 Number of Grade R Educators trained Annually 105 1055.3 Number of practitioners trained on NQF
4 and aboveAnnually 731 731

Page 114 of 208
5.7. Programme 5: Reconciling Performance Targets with the Budget and MTEF: Allocation per sub-programme as well as economic classificationOutcome Main
appropriationAdjusted
appropriation Revised estimate Medium-term estimates
R thousand 2015/16 2016/17 2017/18 2019/20 2020/21 2021/221. Grade R In Public Schools 419 330 493 791 510 100 561 875 583 679 564 007 615 722 662 264 707 261
2. Grade R In Community Schools 13 903 15 969 13 817 17 696 14 396 13 198 14 687 15 715 16 579
3. Pre-Grade R (0-4) 24 290 773 11 172 35 000 30 600 18 453 35 000 43 814 46 224
4. Professional Services – – – – – – – – –
5. Human Resource Development 68 1 629 3 643 2 550 2 550 2 386 2 697 2 846 3 003
6. Education Infrastru Drants – – – – – – – – –
7. Epwp Grants 9 714 12 736 3 541 8 315 8 315 8 220 4 598 – –
8. Conditional Grant – – – – – – – – –
Total payments and estimates 467 305 524 898 542 273 625 436 639 540 606 264 672 704 724 639 773 067
2018/19
Outcome Mainappropriation
Adjustedappropriation Revised estimate Medium-term estimates
R thousand 2015/16 2016/17 2017/18 2019/20 2020/21 2021/22Current payments 382 075 465 501 482 465 524 570 545 567 522 583 576 539 620 698 663 408
Compensation of employees 367 694 412 645 448 380 479 515 495 108 491 638 528 697 567 059 606 822
Goods and services 14 381 52 856 34 085 45 055 50 459 30 945 47 842 53 639 56 586
Interest and rent on land – – – – – – – – –
Transfers and subsidies to: 78 746 59 397 59 748 96 214 89 321 74 955 91 243 98 748 104 179
Provinces and municipalities – – – – – – – – –
Departmental agencies and accounts – – – – – – – – –
Higher education institutions – – – – – – – – –
Foreign governments and international organisations – – – – – – – – –
Public corporations and private enterprises – – – – – – – – –
Non-profit institutions 76 435 57 502 59 197 96 214 88 321 73 585 91 243 98 748 104 179
Households 2 311 1 895 551 – 1 000 1 370 – – –
Payments for capital assets 6 484 – 60 4 652 4 652 8 726 4 922 5 193 5 480
Buildings and other fixed structures – – – – – – – – –
Machinery and equipment 6 484 – 60 4 652 4 652 8 726 4 922 5 193 5 480
Heritage Assets – – – – – – – – –
Specialised military assets – – – – – – – – –
Biological assets – – – – – – – – –
Land and sub-soil assets – – – – – – – – –
Software and other intangible assets – – – – – – – – –
Payments for financial assets – – – – – – – – –
Total economic classification 467 305 524 898 542 273 625 436 639 540 606 264 672 704 724 639 773 067
2018/19

Page 115 of 208
5.8. Programme 5: Budget Expenditure
Early Childhood Development programme expenditure increase significantly from 2015/16 to 2017/18. This increase can be attributed to the expansion ofGrade R by providing adequate funding for payment of salaries and training to Grade R Educators. The 2018/19 Revised Estimate is higher than the MainAppropriation due to rollovers received in the adjusted budget. With the substantial increase in the allocation the programme will be able to achieve theservice delivery targets as set out in the Annual Performance Plan. The allocation increases steadily over the 2019/20 MTEF.
The largest portion of the budget is allocated to the sub-programme Grade R in Public Schools and it is meant for payment of salaries for Grade R educatorsas well as procurement of learner teacher support material and other related resources such as in-door and out-doors playing equipment. Transferpayment and subsidies to ensure that schools with Grade R classes are able to run their own affairs in line with the norms and standards for Grade R.
Grade R in Community Centres reflects an increasing trend over the period under review. Training of Pre-Grade R (0-4yrs) practitioners’ remains part of theprogrammes deliverables and the budget allocated under the sub-programme funds provided for payment of stipends to the trainees.
The Human Resource Development sub-programme’s budget is allocated to counter the shortage of qualified educators in this area. The budget reflects asteady growth in the MTEF to ensure that the training programme is sustained.
Social sector EPWP incentive grant has decreased substantially from R13.637 million in 2016/17 to R3.557 million in 2017/18. The allocation increased toR8.315 million in 2018/19 and declined to R4.598 million in 2019/20.
The 2019/20 MTEF reflects an increase allocation for compensation of employees to cater for the cost of living adjustment carry-through effects. Goods andservices’ budget make provision of resources such as educational toys, stationary and Grade R packs.
The budget allocated to Transfers and subsidies to Non-profit institutions is to:-
Ensure that schools with Grade R classes are able to run their own affairs in line with the norms and standard for Grade R;
Provide funding for Grade R in Community Sites;
Pre-Grade R (0-4yrs) allocation;
EPWP Incentive grant allocation.
Budget under Machinery and equipment caters for the indoors and outdoors equipment for Grade R in Public Schools.

Page 116 of 208
5.9. Programme 5: Risk ManagementRISKS MIGRATION
Lack of appropriate customised Grade R infrastructure Grade R budget should be utilised solely for the purpose that it was intended,the building and /or refurbishment of ablution facilities and playrooms in publicschools
Lack of sufficient funding for Grade R infrastructure Currently, the infrastructure budget in programme 2 (Ordinary schools) is alsoused to provide for the ECD programme
Currently, the department is unsure of learner numbers as well aseducators in the PERSAL system. This makes targeting and reportingvery difficult in that numbers keep on changing
There is a Task Team which is working on cleaning up educator data in thePERSAL system
Lack of awareness of the benefits of ECD among previouslydisenfranchised communities.
Employment and Upskilling of qualified Grade R educators and practitioners incommunity-based ECD (crèches)
The low quality of Grade R provisioning in some public schools. More posts should be created at corporate, district and sub-district levels foroptimum ECD delivery in line with the NDP.A more focused attention should begiven to government priorities.

Page 117 of 208
6. PROGRAMME 6: INFRASTRUCTURE DEVELOPMENTPurpose: To provide and maintain infrastructure facilities for schools and non-schools
6.1. Programme 6: Sub-programmesSub-programme Description Objective
Sub-programme 6.1: Administration To provide and maintain infrastructure facilities for administration.
Sub-programme 6.2: Public Ordinary Schools To provide and maintain infrastructure facilities for public ordinary schools
Sub-programme 6.3: Special Schools To provide and maintain infrastructure facilities for public special schools
Sub-programme 6.4: Early Childhood Development To provide and maintain infrastructure facilities for early childhood development
6.2. Programme 6: Priorities Eradicate inappropriate structures in schools Eradication of backblocks in Basic Services Political Pronouncements: Resuscitating hostels and replacement of asbestos roofs
6.3. Programme 6: Deliverables New proper facilities provided Sanitation facilities complying with the norms and standards. Functional hostel facilities Replacement of roofs

Page 118 of 208
6.4. Programme 6: Strategic Goal 2: Improved learner attainment in grades 3,6,9 and 12StrategicObjective
Objective statement 5-yearTarget
Audited/Actual performance Estimatedperformance2017/18
Medium-term targets2014/15 2015/16 2016/17 2018/19 2019/20 2020/21
Infrastructuremanagement inschools
To ensure that publicordinary schools andspecial schools’infrastructure are in linewith minimum physicalinfrastructure standards sothat learners and teachershave an inspiringenvironment
75** 28 25 25 25 25 25 25
**This is a three year estimated target because infrastructure has to bid annually for funds depending on their performance in expenditure.

Page 119 of 208
6.5. Programme 6: Performance Indicator and MTEF TargetsProgramme Performance Indicator 5-year
TargetAudited/Actual Performance Estimated
performance2018/19
Medium-term targets2015/16 2016/17 2017/18 2019/20 2020/21 2021/22
PPM 601 Number of public ordinary schoolsprovided with water supply
15 8 N/A N/A N/A2 N/A N/A
PPM 602 Number of public ordinary schoolsprovided with electricity supply
0 0 N/A N/A N/A3 N/A N/A
PPM 603 Number of public ordinary schoolssupplied with sanitation facilities
11 11 14 50 22 12 12
PPM 604 Number of additional classrooms built in,or provided for, existing public ordinaryschools (include replacement schools)
99 140 105 248 13 22 22
PPM 605 Number of additional specialist roomsbuilt in public ordinary schools
53 86 93 140 7 10 10
PPM 606 Number of new schools completed andready for occupation (includesreplacement schools)
2 5 3 13 7 2 2
PPM 607 Number of new schools underconstruction (includes replacementschools)
0 13 8 8 3 6 6
PPM 608 Number of new or additional Grade Rclassrooms built(includes replacementschools)
9 21 5 12 9 4 4
PPM 609 Number of hostels built 2 0 1 1 1 1 1
PPM 610 Number of schools where scheduledmaintenance projects were completed
81 70 32 26 15 15 15
2 Provided by DW&F. Refer to Annexure 3
3 Provided by ESKOM. Refer to Annexure 3

Page 120 of 208
Programme Performance Indicator 5-yearTarget
Audited/Actual Performance Estimatedperformance2018/19
Medium-term targets2015/16 2016/17 2017/18 2019/20 2020/21 2021/22
6.1 Number of special schools upgraded 3 1 2 1 1 N/A4 1 1
6.2 Number of existing Public OrdinarySchools converted into full servicesschools
27 5 2 0 4 N/A5 7 7
4 Refer to Annexure 3
5 Refer to Annexure 3

Page 121 of 208
6.6. Programme 6: Annual and Quarterly Performance Targets for 2019/2020Programme Performance Indicator Reporting
periodAnnualtarget2019/20
Quarterly targets
1st(Apr-June)
2nd(Jul-Sep)
3rd(Oct-Dec)
4th(Jan-Mar)
PPM601 Number of public ordinary schools provided with watersupply
N/A N/A6 N/A
PPM602 Number of public ordinary schools provided with electricitysupply
N/A N/A7 N/A
PPM603 Number of public ordinary schools supplied with sanitationfacilities
Annual 22 22
PPM604 Number of additional classrooms built in, or provided for,existing public ordinary schools
Annual 13 13
PPM605 Number of specialist rooms built in public ordinary schools Annual 7 7
PPM606 Number of new schools completed and ready for occupation(includes replacement schools)
Annual 7 7
PPM607 Number of new schools under construction (includesreplacement schools)
Annual 3 3
PPM608 Number of new or additional Grade R classrooms built Annual 9 9
PPM609 Number of hostels built Annual 1 1
PPM610 Number of schools in which scheduled maintenance projectswere completed
Annual 15 15
6.1 Number of special schools upgraded Annual N/A8 N/A
6 Refer to Annexure 3
7 Refer to Annexure 3
8 Refer to Annexure 3

Page 122 of 208
Programme Performance Indicator Reportingperiod
Annualtarget2019/20
Quarterly targets
1st(Apr-June)
2nd(Jul-Sep)
3rd(Oct-Dec)
4th(Jan-Mar)
6.2 Number of existing Public Ordinary Schools converted into fullservices schools
Annual N/A9 N/A
9 Refer to Annexure 3

Page 123 of 208
6.7. Programme 6: Reconciling Performance Targets with the Budget and MTEF: Allocation per sub-programme as well as economic classification
Outcome Mainappropriation
Adjustedappropriation Revised estimate Medium-term estimates
R thousand 2015/16 2016/17 2017/18 2019/20 2020/21 2021/221. Administration – – – – – – – – –
2. Public Ordinary Schools 984 397 1 014 516 1 012 808 905 836 843 188 663 113 799 697 901 729 973 856
3. Special Schools 26 986 55 484 57 661 50 642 31 176 26 651 53 579 56 526 59 635
4. Early Childhood Development 41 310 14 968 1 839 48 518 9 234 1 677 51 436 51 914 54 769
Total payments and estimates 1 052 693 1 084 968 1 072 308 1 004 996 883 598 691 441 904 712 1 010 169 1 088 260
2018/19
Outcome Mainappropriation
Adjustedappropriation Revised estimate Medium-term estimates
R thousand 2015/16 2016/17 2017/18 2019/20 2020/21 2021/22Current payments 164 309 112 786 35 263 85 012 44 831 52 325 89 756 92 342 97 421
Compensation of employees 6 848 9 485 4 415 6 831 7 008 6 956 12 228 12 274 12 949
Goods and services 157 461 103 301 30 848 78 181 37 823 45 369 77 528 80 068 84 472
Interest and rent on land – – – – – – – – –
Transfers and subsidies to: 1 965 – – – – – – – –
Provinces and municipalities – – – – – – – – –
Departmental agencies and accounts – – – – – – – – –
Higher education institutions – – – – – – – – –
Foreign governments and international organisations – – – – – – – – –
Public corporations and private enterprises – – – – – – – – –
Non-profit institutions 1 965 – – – – – – – –
Households – – – – – – – – –
Payments for capital assets 886 406 972 185 1 037 045 919 984 838 767 639 116 814 956 917 827 990 839
Buildings and other fixed structures 886 214 971 375 1 037 045 919 984 838 767 639 116 814 956 917 827 990 839
Machinery and equipment 192 810 – – – – – – –
Heritage Assets – – – – – – – – –
Specialised military assets – – – – – – – – –
Biological assets – – – – – – – – –
Land and sub-soil assets – – – – – – – – –
Software and other intangible assets – – – – – – – – –
Payments for financial assets 13 -3 – – – – – – –
Total economic classification 1 052 693 1 084 968 1 072 308 1 004 996 883 598 691 441 904 712 1 010 169 1 088 260
2018/19

Page 124 of 208
6.8. Programme 6: Budget Expenditure
The programme allocation decline by 10 per cent from R1.005 billion in 2018/19 to R904.712 million in 2019/20 mainly due to Education InfrastructureGrant reduction over the 2019 MTEF. These funds will go towards construction of new schools, rehabilitation and upgrading of existing facilities, provisionof water and sanitation and well as procurement of mobile classrooms to address emergencies caused by sudden overcrowding experienced at someschools during re-opening. In particular, the department is planning to attend to sanitation problems experienced by schools in village and townships andscarcity of water supply. The department is also planning to improve monitoring of infrastructure projects which are implemented by Department of PublicWorks and Roads in order to fast track delivery and spending. The programme also includes EPWP Integrated Grant for payment of stipends to beneficiariesemployed to provide support to the programme is allocated an amount of R2.228 million in 2019/20 financial year.
6.9. Programme 6: Risk ManagementRISKS MIGRATION
Appointing a single contractor for a number of projects simultaneously. Enforce contracts and penalty measures
Community unrests because of the projects Enhance communication
Delay by Contractor/ Consultant Heighten project social facilitation in communities
Delivering irrelevant Infrastructure Projects related to what the end-userneed
Having meeting with chief directorates to discuss infrastructure needs toinform the project scope

Page 125 of 208
7. PROGRAMME 7: EXAMINATION AND EDUCATION RELATED SERVICESPurpose: To provide the education institutions as a whole with examination and education related services.
7.1. Programme 7: Sub-programmes
7.2. Programme7: Priorities
To support examination processes in public ordinary schools To ensure a credible examination system To monitor and support the implementation of the care and support programmes in public and special schools
7.3. Programme 7: Deliverables
Selection of marking venues in line with NWRP work with supply chain Appointment of markers/ Examination assistants/ SBA moderatos
Sub-programme Description Objective
Sub-programme 7.1 Payments to SETA To provide employee HRD in accordance with the Skills Development Act.
Sub-programme 7.2 Professional Services To provide educators and learners in schools with departmentally managed support services.
Sub-programme 7.3 Special projects To provide for special departmentally managed intervention projects in the education system as awhole.
Sub-programme 7.4 External examinations To provide for departmentally managed examination services.
Sub-programme 7.5 Conditional grant To provide for projects specified by the Department of Education that is applicable to more than oneprogramme and funded with conditional grants.

Page 126 of 208
Appointment of security services at marking venues Security at printing unit work with security services Appointment of managers responsible for conduct of examination Preparations for printing unit and advertisement of tender for printing machines Supply chain and Auxiliary services Key custody controls
7.4. Programme 7: Strategic Goal 2: Improved learner attainment in grades 3, 6, 9 and 12
StrategicObjective
Objective statement 5-yearTarget
Audited/Actual performance Estimatedperformance
2017/18
Medium-term targets
2014/15 2015/16 2016/17 2018/19 2019/20 2020/21
7.1 Examinationservices managed
To conduct regular assessments to tracklearner performance in order to issue avalid National Senior Certificate (NSC)
100% 100% 100% 100% 100% 100% 100% 100%

Page 127 of 208
7.5. Programme 7: Performance Indicators and MTEF Targets
Programme Performance Indicator 5-yearTarget
Audited/Actual Performance Estimatedperformance2018/19
Medium-term targets2015/16 2016/17 2017/18 2019/20 2020/21 2021/22
PPM 701 Percentage of learners who passedNational Senior Certificate (NSC)
81.47% 82.5% 79.44%
*27189/
31950
83.5%
*26770/
32055
84.5%
*29340/
34953
86.5%
*27189/
31950
87.5%
PPM 702 Percentage of Grade 12 learnerspassing at Bachelor level
26.63% 27.52% 26.88%
*8276/
30792
28.5%
*9150/
32055
29.0%
*10197/
34953
30.0%
*9899/
31950
31.5%
PPM 703 Percentage of Grade 12 learnersachieving 50% or more inMathematics
22.11% 24.94% 24.12%
*2468/
10232
26.5%
*2616/
9873
27.0%
*2733/
10122
27.0%
*2733/
10122
27.7%
PPM 704 Percentage of Grade 12 learnersachieving 50% and above inPhysical Science
19.89% 25.49% 24.23%
*2048/
8451
28.0%
*2493/
8912
25.0%
*2238/
8950
25.0%
*2238/
8950
26%
PPM 705 Number of secondary schools withNational Senior Certificate (NSC)pass rate of 60% and above
N/A 350 364 380 370 375 380

Page 128 of 208
7.6. Programme 7: Annual and Quarterly Performance Targets for 2019/2020
Programme Performance Measure/IndicatorReportingperiod
Annual target2019/20
Quarterly targets
1st(Apr-June)
2nd(Jul-Sep)
3rd(Oct-Dec)
4th(Jan-Mar)
PPM 701 Percentage of learners who passedNational Senior Certificate (NSC)
Annual 84.5%*29340/34953
84.5%*29340/34953
PPM 702 Percentage of Grade 12 learnerspassing at bachelor level
Annual 29.0%*10197/34953
29.0%*10197/34953
PPM 703 Percentage of Grade 12 learnersachieving 50% and above inMathematics
Annual 27.0%*2733/10122
27.0%*2733/10122
PPM 704 Percentage of Grade 12 learnersachieving 50% and above in PhysicalScience
Annual 25.0%*2238/8950
25.0%*2238/8950
PPM 705 Number of secondary schools withNational Senior Certificate (NSC)pass rate of 60% and above
Annual 370 370

Page 129 of 208
7.7. Programme 7: Reconciling Performance Targets with the Budget and MTEF: Allocation per sub-programme as well as economic classification
Outcome Mainappropriation
Adjustedappropriation Revised estimate Medium-term estimates
R thousand 2015/16 2016/17 2017/18 2019/20 2020/21 2021/221. Payment To Seta 13 811 14 241 14 653 15 501 15 501 15 501 16 400 17 302 18 254
2. Professional Services 486 560 521 535 540 491 613 961 585 761 566 279 658 419 694 566 732 764
3. Special Projects 26 625 2 501 300 229 229 – 14 908 – –
4. Exetrnal Examinations 64 125 68 327 77 624 94 141 87 141 75 591 97 628 103 106 108 798
5. Conditional Grant Projects Hiv/Aids 22 317 15 597 14 989 17 884 17 884 17 806 18 849 19 791 20 879
Total payments and estimates 613 438 622 201 648 057 741 716 706 516 675 177 806 204 834 765 880 695
2018/19
Outcome Mainappropriation
Adjustedappropriation Revised estimate Medium-term estimates
R thousand 2015/16 2016/17 2017/18 2019/20 2020/21 2021/22Current payments 560 536 540 708 575 174 651 778 625 413 603 974 708 332 733 647 774 015
Compensation of employees 270 339 278 877 284 388 337 415 312 415 305 712 332 498 371 051 391 459
Goods and services 290 197 261 831 290 786 314 363 312 998 298 262 375 834 362 596 382 556
Interest and rent on land – – – – – – – – –
Transfers and subsidies to: 50 425 66 982 61 459 76 753 66 553 58 905 81 690 86 156 90 895
Provinces and municipalities – – – – – – – – –
Departmental agencies and accounts 14 311 14 241 14 653 15 501 15 501 15 501 16 400 17 302 18 254
Higher education institutions – – – – – – – – –
Foreign governments and international organisations – – – – – – – – –
Public corporations and private enterprises – – – – – – – – –
Non-profit institutions 33 665 49 417 42 878 44 721 44 721 35 562 60 000 62 602 66 045
Households 2 449 3 324 3 928 16 531 6 331 7 842 5 290 6 252 6 596
Payments for capital assets 2 462 14 511 11 424 13 185 14 550 12 298 16 182 14 962 15 785
Buildings and other fixed structures – – – – – – – – –
Machinery and equipment 2 462 14 511 11 424 13 185 14 550 12 298 16 182 14 962 15 785
Heritage Assets – – – – – – – – –
Specialised military assets – – – – – – – – –
Biological assets – – – – – – – – –
Land and sub-soil assets – – – – – – – – –
Software and other intangible assets – – – – – – – – –
Payments for financial assets 15 – – – – – – – –
Total economic classification 613 438 622 201 648 057 741 716 706 516 675 177 806 204 834 765 880 695
2018/19

Page 130 of 208
7.8. Programme 7: Budget Expenditure
The spending focus over the MTEF is mainly to provide for departmentally managed examination services and district professional and support services toschools. Part of the budget also goes to the HIV and AIDS related programmes implemented by the department to all schools in the province throughtraining and provision of resources and programs related to HIV Life skills.
The bulk of the budget is allocated to the sub-programme: Professional services at R658.419 million in 2019/20 from to R585.761 million in 2018/19 tocater for subject advisory and other professional services rendered by the districts.
The second largest sub-programme is External Examinations which receives an allocation of R97.628 million in 2019/20. The programme coordinatesplanning, writing and monitoring of external examinations in the province and the greater part of it goes to printing, payment of examiners and otherrelated professional and support staff.
Special Projects sub programme: Implementation of the Sanitary Dignity project, to be targeted at the intended population of schoolgirls from Grade 4upwards. There is consistent growth against the HIV and AIDS (Life-Skills Education) Grant, it grows modestly over the 2019/20 MTEF.
The Goods and Services’ budget grows substantially over the 2019/20 MTEF to cater for activities priorities such as Examination Services, Professionalsupport services, Special Projects etc., as well as the inflationary increases over the period.
Transfers and subsidies under this programme represent payment to departmental agencies and accounts; Non-profit institutions and Householdspayments. Transfers and subsidies to: Departmental agencies and accounts reflect an increase over the 2019/20 MTEF. These transfers are made to ETDPSETA.
The budget allocated to Transfers and subsidies to Non-profit institutions is to provide educators and learners at schools with departmentally managedintervention projects. Transfers and subsidies to Households caters for staff exit costs.
The growth in Machinery and equipment in 2019/20 will assist the department in the acquisition of the tools of trade that are lacking. The portion of thebudget goes towards procurement of ICT equipment for schools.

Page 131 of 208
7.9. Programme 7: Risk Management
Risk Intervention
Security at printing and distribution Intensify security at Printing Unit and improve management of thedistribution of papers
Reduced Math's oriented career pathway Less scientists or scienceoriented career pathway
Introduction of Inclusive basket of criteria which is in line with NDPpriorities
More schools dropping Math's and Science as priority subjects Have roadshow with school managers to explain the impact.
Release of papers by DBE being late thus impacting on printing On-going discussion with DBE to release papers earlier
Leakage of Question papers Senior Manager being in charge of Printing and packing

Page 132 of 208
PART C: LINKS TO THE LONG-TERM INFRASTRUCTURE AND OTHER CAPITAL PLANS
No Categories Region/
district Type of infrastructureProgrammeProjectstart
Projectend
Totalprojectcost
Expenditureto date frompreviousyears
Totalavailable2018/19
Totalavailable2019/20
Totalavailable2020/21
A. Education Infrastructure Grant
1. New and replacement assets
New andreplacementassets
FourDistricts
New schools andreplacement schools
6 2012 2022 2 385 199 1 352 853 504 304 233 701 50 916
New andreplacementassets
FourDistricts
Hostels and School 6 2013 2022 572 788 193 894 122 200 77 740 30 000
New andreplacementassets
FourDistricts
Special Schools 6 2015 2019 117 669 104 636 13 033 - -
New andreplacementassets
FourDistricts
Teachers quarters 6 2013 2018 14 219 9 9719 4 5000 - -
New andreplacementassets
Ngaka Modiri
Molema
Temporary School 6 2017 2022 6 000 4 497 1 503 - -
UPGRADES AND ADDITIONS
Upgrades andadditions
Four districts Additions 6 2012 2018 592 878 369 783 83 669 53 376 10 000

Page 133 of 208
Upgrades andadditions
Four districts Sanitation 6 2012 2019 88 525 - 71 450 17 575 17 550
Upgrades andadditions
Four districts Fencing 6 2016 2019 10 572 5 670 4 902
Upgrades andadditions
Four districts Full service 6 2013 2019 34 479 32 020 2 459
Upgrades andadditions
Four districts Grade R 6 2015 2019 28 306 24 420 3 886
Upgrades andadditions
Four districts Rationalisation 6 2014 2021 69 384 55 104 14 280
REFURBISHMENT AND REHABLILITATION
Refurbishmentandrehabilitation
Four districts Repairs 6 2014 2017 217 843 135 625 75 984 6 236
Refurbishmentandrehabilitation
Four districts Renovations andrepairs
6 2013 2018 49 016 23 537 29 079 -
Refurbishmentandrehabilitation
` Fourdistricts
Firedamaged Schools
6 2015 2017 10 024 8 696 1 328 - -
MAINTENANCE
Recurrentmaintenance
Four districts Maintenance 6 2014 2020 80 840 366 28 474 26 000 26 000

Page 134 of 208
NON- INFRASTRUCTURE
Dora fundingfor posts
Four districts Capacitation 2014 2021 - - 7 000 7 000 7 000
ImplementingAgent fees forIDT
Four districts Fees 2014 2018 -
TOTAL 7 015 677 2 472 599 1 011 996 900 412 999 095
Total: Education Infrastructure Grant 7 015 677 2 472 599 1 011 996 900 412 999 095

Page 135 of 208
PART D: CONDITIONAL GRANTS(a) HIV and Aids (Life Skills Education) Grant:
To support South Africa’s HIV prevention strategy by increasing sexual and reproductive knowledge, skills and appropriate decision making among learners and educators; to mitigate
the impact of HIV by providing a caring, supportive and enabling environment for learners and educators; and to ensure the provision of a safe, rights-based environment in schools
that is free of discrimination, stigma and any form of sexual harassment.
(b) National School Nutrition Programme Grant: To enhance learning capacity and to improve access to education by providing nutritious meals to targeted learners.
(c) Education Infrastructure Grant: To help accelerate construction, maintenance, upgrading and rehabilitation of new and existing infrastructure in education; and to enhance capacity
to deliver infrastructure in education.
(d) MST Grant: To provide resources to learners, teachers and schools for the improvement of Maths, Science and Technology teaching and learning in selected public schools.
To improve achievement of learner participation and success rate, teacher demand, supply, utilisation, development and support, resourcing and partnerships, consistent with targets
set in the Action Plan 20120 and the National Development plan.
(e) Expanded Public Works Grant for social sector: To increase job creation by focusing on strengthening and expansion of social service programme
(f) Expanded Public Works programme integrated grant : To create employment opportunities to the youth and other unemployed`d people through infrastructure development
(g) Learners with Severe to Profound Intellectual Disability (LSPID) To provide the necessary support, resources and equipment to identified care centres and schools for the provision of
education to children with severe to profound intellectual disabilities (LSPID).

Page 136 of 208
(a) HIV and AIDS (Life Skills Education) Grant - Description of HIV and AIDS Grant
Name of grant HIV and AIDS (Life Skills Education)
Purpose To support South Africa’s HIV prevention strategy by increasing sexual and reproductive health knowledge, skills and appropriate decision making amonglearners and educatorsTo mitigate the impact of HIV and TB by providing a caring, supportive and enabling environment for learners and educatorsTo reduce the vulnerability of children to HIV, TB and sexually transmitted infections (STIs), with a particular focus on orphaned and vulnerable children
Performance indicator Number of learners benefiting from care and support activities within life skills HIV and AIDS programmes.Number of educators trained to provide care and support for vulnerable learners.Number of schools visits to monitor the implementation of the care and support within life skills HIV and AIDS programmes.
Continuation The grant programme is to continue during the period covered by the Strategic Plan
Motivation Continued implementation of care and support programmes in order to address barriers (including HIV and AIDS) to teaching learning.
(b) National School Nutrition Programme Grant - Description of National School Nutrition Programme Grant
Name of grant National School Nutrition Programme
Purpose To provide nutritious meals to learners.
Performance indicator Number of learners benefiting from the school nutrition programme.
Continuation The grant programme is to continue during the period covered by the Strategic Plan
Motivation Improve school attendance and increase in learner enrolment.
(c) Infrastructure Programme Grant - Description of Infrastructure Programme Grant
Name of grant Infrastructure Grant to Provinces
Purpose To help accelerate construction, maintenance, upgrading and rehabilitation of new and existing infrastructure in education; to enhance the application of labourintensive methods in order to maximise job creation and skills development as encapsulated in the EPWP guidelines; and to enhance capacity to deliverinfrastructure.
Performance indicator Number of special schools upgradedNumber of schools fenced.Number of existing public ordinary schools converted into full servicesNOTE: all the PPMs ( Programme Performance Measures i.e PPM 601 TO 610)
Continuation The grant programme is to continue during the period covered by the Strategic Plan
Motivation Improve service delivery and access by addressing serious infrastructure backlogs in respect of school infrastructure.

Page 137 of 208
(d) Maths Science and Technology Grant- Description of MST Grant
Name of grant MST GRANT
Purpose To provide resources to learners, teachers and schools for the improvement of Maths, Sciences and Technology teaching and learning in selected public schools.To improve achievement of Learner participation and success rate, teacher demand, supply, utilization, development and support, resourcing and partnerships,
consistent with targets set in the Action Plan 2014 and the National Development Plan.Performance indicator 1. Number of schools supplied, with computer hardware in accordance with the minimum specifications
2. Number of schools supplied with internet connectivity infrastructure (Local Area Network and or Wide Area Network) in accordance with the minimumspecifications
3. Provision of ICT resources (server loaded with subject content, 40 tablet bay cart and wifi-router)4. Number of Technical Schools’ workshops supplied with machinery for technology subjects in accordance with the minimum specifications5. Number of Technical Schools’ workshops supplied with tools for technology subjects in accordance with the minimum specifications6. Number of schools supplied with computer hardware in accordance with minimum specification7. Number of laboratories and workshops supplied with apparatus and consumables for Mathematics, Science and technology subjects in accordance
with the minimum specifications8. Number of learners registered for participation in Mathematics, Science and Technology Olympiads/Fairs/Expos and other competitions9. Specific training and orientation for teachers and subject advisors in subject content and teaching methodologies on CAPS for Electrical, Civil and
Mechanical Technology, Technical Mathematics, and Technical Sciences10. Targeted training in teaching methodologies and subject content for Mathematics, Physical, Life, Natural and Agricultural Sciences, Technology,
Computer Applications Technology, Information Technology, Agricultural Management and Technology subjects11. Number of participants in training and support in integrating ICT in the learning and teaching environment training and support in integrating ICT in the
learning and teaching environment
(e) Learner with Profound Intellectual Disabilities Grant - Description of Learner with Profound Intellectual Disabilities Grant
Name of grant Learner with Profound Intellectual Disabilities Grant
Purpose To provide the necessary support, resources and equipment to identified care centres and schools for the provision of education to children with severe toprofound intellectual disabilities (SPID).
Performance indicator Number of learners with severe to profound intellectual disability benefiting from Special Schools and Care Centres. Number of educators and Centre Care givers trained to provide care and education for learners with severe to profound intellectual disability. Number of schools visits to monitor the implementation of the severe to profound intellectual disability programme.
Continuation NEW
Motivation The conditional grant for learners with severe to profound intellectual disability is new starting from 2017/18 to 2019/20.

Page 138 of 208
(f) Expanded Public Works Programme (EPWP) - Description of Expanded Public Works Programme (EPWP)
Grant Name Expanded Public Works Programme (EPWP)Aim Expanded Public Works Programme (EPWP)Sector Job Creation and Poverty AlleviationPurpose Social SectorLocation Appoint 357 Grade R Classroom assistants on contract basisAmount Allocated Public Ordinary Primary schoolsGrant commencing R 9 300 000Grant ending 01 April 2019Duration 31 March 2020
(g) Expanded Public Works Programme Integrated Grant (EPWP) - Description of Expanded Public Works Programme Integrated Grant (EPWP)Grant Name Expanded Public Works Programme (EPWP)Aim Job Creation and Poverty AlleviationSector InfrastructurePurpose Appoint 58 beneficiaries as general assistantLocation public ordinary schoolsAmount Allocated R 2 008 000
Grant commencing 01 April 2019Grant ending 31 March 2020Duration 12 months for 54 beneficiaries in four districts.
3 multi –year for four data capturers at corporateRunning cost at stipend R 2 008 000Protective clothing R0Equipment R0
(h) Learner with Profound Intellectual Disabilities Grant - Description of Learner with Profound Intellectual Disabilities Grant (LSPID)Grant Name Learners with Severe to Profound intellectual DisabilityAim Provision of education to learners with severe to profound intellectual disability.Sector Education SectorPurpose To provide the necessary support, resources and equipment to identified care centres and schools for the provision of education to children
with severe to profound intellectual disabilities (SPID).Location Care Centres and Special Schools for SID learnersAmount Allocated R 2 963 041Grant commencing 01 April 2017Grant ending 31 March 2020Duration 36 months

Page 139 of 208
CONDITIONAL GRANTS: ANNUAL AND QUARTERLY PERFORMANCE TARGETS FOR 2019/2020
NAME OF GRANT OUTPUTSPERFORMANCE INDICATOR ANNUAL BUSINESS PLAN TARGET
Annual target2019/20
1st
(Apr-June)
2nd
(Jul-Sep)
3rd
(Oct-Dec)
4th
(Jan-Mar)
HIV and AIDS Number of learners benefiting from care and support activitieswithin life skills HIV and AIDS programmes.
7000 2000 2000 1000 2000
Number of educators trained to provide care and support forvulnerable learners.
1500 500 500 0 500
Number of schools visits to monitor the implementation of thecare and support within life skills HIV and AIDS programmes.
400 120 120 40 120
National School NutritionPlan
Number of learners benefiting from National School NutritionProgramme (NSNP)
736 284 736 284 736 284 736 284 736 284
Infrastructure Grant toProvinces
Number of schools fenced. N/A N/ANumber of special schools upgraded N/A N/ANumber of existing public ordinary schools converted into fullservices(INCLUDING ALL PPMs (Programme Performance Measures)
N/A N/A
MST Grant Number of schools supplied with internet connectivityinfrastructure (Local Area Network and or Wide Area Network)in accordance with the minimum specifications
Provision of ICT resources (server loaded with subject content,40 tablet bay cart and Wifi-router)
83 83
Number of Technical Schools’ workshops supplied withequipment for technology subjects in accordance with theminimum specifications
19 19
Number of Technical Schools’ workshops supplied withmachinery for technology subjects in accordance with theminimum specifications
19 19
Number of Technical Schools’ workshops supplied with tools fortechnology subjects in accordance with the minimumspecifications
19 19

Page 140 of 208
NAME OF GRANT OUTPUTSPERFORMANCE INDICATOR ANNUAL BUSINESS PLAN TARGET
Annual target2019/20
1st
(Apr-June)
2nd
(Jul-Sep)
3rd
(Oct-Dec)
4th
(Jan-Mar)
Number of primary schools supplied with Mathematics kits 30 30
Number of Agricultural Science focus schools supplied withmachinery, apparatus and consumables
2 2
Number of laboratories and workshops supplied withconsumables and apparatus for Mathematics, Science andTechnology subjects in accordance with the minimumspecifications
70 70
Number of learners registered for participation in Mathematics,Science and Technology Olympiads/Fairs/Expos and othercompetitions
6000 2000 2000 55 1945
Specific training and orientation for teachers and subjectadvisors in subject content and teaching methodologies on CAPSfor Electrical, Civil and Mechanical Technology, TechnicalMathematics, and Technical Sciences
696 236 250 210
Targeted training in teaching methodologies and subject contentfor Mathematics, Physical, Life, Natural and AgriculturalSciences, Technology, Computer Applications Technology,Information Technology, Agricultural Management andTechnology subjects
N/A
Number of participants in training and support in integrating ICTin the learning and teaching environment
120 120
Expanded Public WorksGrant for social sector(EPWP)
Number of classroom assistants appointed on contract 181 181
Expanded Public Worksprogramme integratedgrant
Number of beneficiaries recruited as General Assistants inschools through the labour intensive (maintenance of schools,cleaning of ablution facilities and food production) andprovided with training through the EPWP Programme.
58 58 58 58 58

Page 141 of 208
NAME OF GRANT OUTPUTSPERFORMANCE INDICATOR ANNUAL BUSINESS PLAN TARGET
Annual target2019/20
1st
(Apr-June)
2nd
(Jul-Sep)
3rd
(Oct-Dec)
4th
(Jan-Mar)
Number of training opportunity feeling the educational/ skillsgaps in the province.
58 58
Learners with ProfoundIntellectual DisabilitiesGrant
Number of learners with severe to profound intellectualdisability benefiting from Special Schools and Care Centres (database to be created).
500 500
Number Care givers and special schools’ teachers trained toprovide care and education for learners with severe to profoundintellectual disability.
180180

Page 142 of 208
CONDITIONAL GRANTS: TECHNICAL INDICATOR DESCRIPTORS
HIV/AIDS: TECHINICAL INDICATOR DESCRIPTORSIndicator title Number of learners benefitting from Care and Support programmes
Short definition The implementation of care and support Programme such as, Peer Education Programmes, Service Delivery Events, Material Support, awarenesscampaigns. OVC (Orphans and Vulnerable children)
Purpose/importance Through the HIV and AIDS programme, schools are being turned into schools of care and support.Prevent and mitigate factors that have a negative impact on the enrolment, retention, performance and progress of learners
Policy linked to Integrated School Health PolicyNational Department of Basic Education Policy on HIV/STI/TB
Source/collection of data List of Care and Support programmesMeans of verification Distribution list of learners (vulnerable learners provided with support)Method of calculation Count the number of vulnerable learners benefitting from Care and Support programmesData limitations Challenges with SA SAMSType of indicator InputCalculation type CumulativeReporting cycle QuarterlyNew indicator NoDesired performance Retention of vulnerable learners in schools
Implementation and management of Life skill education in line with HIV and AIDS, drug and substance abuseIndicator responsibility Directorate: LSSS
Indicator title Number of educators trained to provide care and support for vulnerable learnersShort definition Training of educators to deal with HIV/AIDS
Teachers trained to integrate the Sexual Reproductive Health and TB programmes into the school curriculum, with the specific focus on the preventionof learner pregnancy and the reduction of the burden of the twin epidemics of HIV and TB as well as to deliver care and support through theseprogrammes
Purpose/importance Provide educator support to learners that are infected or affected by HIV/Aids Prevent and mitigate factors that have a negative impact on theenrolment, retention, performance and progress of learners
Policy linked to Integrated School Health PolicyNational Department of Basic Education Policy on HIV/STI/TB
Source/collection of data List of Care and Support programmesMeans of verification Signed attendance registersMethod of calculation Count the number of teachers who participated in the Care and Support trainingsData limitations None attendance/ shortage of staffType of indicator InputCalculation type CumulativeReporting cycle Quarterly

Page 143 of 208
New indicator NoDesired performance Improved teachers capacity of managing Life skill educationIndicator responsibility Directorate: LSSS
Indicator title Number of schools visits to monitor the implementation of the care and support programmesShort definition Monitoring implementation of Care and Support programmes in Public Ordinary SchoolsPurpose/importance Ensure proper implementation of Care and Support Programmes
Policy linked to Integrated School Health PolicyNational Department of Basic Education Policy on HIV/STI/TB
Source/collection of data Monitoring instrumentsMeans of verification List of schoolsMethod of calculation Count the number of schools visited for implementation of care and supportData limitations Inadequate resources required for monitoringType of indicator OutputCalculation type CumulativeReporting cycle QuarterlyNew indicator NoDesired performance All schools must be able to implement and manage Care and Support programmesIndicator responsibility Directorate: LSSS

Page 144 of 208
NATIONAL SCHOOL NUTRITION PROGRAMME (NSNP): TECHNICAL INDICATOR DESCRIPTORIndicator title Number of learners who benefit from NSNP.Short definition The total number of learners who benefit from NSNP.Purpose/importance Provide a nutritious meal to learnersPolicy linked to Access to quality food as enshrined in the Constitution of the Republic of South Africa (Act 108 of 1996 and the International Children’s CharterSource/collection of data Learner feeding registersMeans of verification Reports on average number of learners fedMethod of calculation Count the total number of learners in all Quintiles 1,2, 3 schools benefiting from NSNPData limitations Non submission by some schoolsType of indicator OutputCalculation type Non-cumulativeReporting cycle AnnualNew indicator YesDesired performance Providing a nutritious meal to learnersIndicator responsibility Directorate : LSSS
Indicator title Number of Learner Support Agents appointedShort definition Appoint Learners Support Agents (LSAs)
Learner support Agents are unemployed youth who will be appointed to do the following:- Network for health and Social Welfare Services, including material support ( for example school uniform, sanitary towels) Conduct awareness programmes Renders homework assistance (especially to learners from child headed household) Conduct home visits for vulnerable learners Establish and sustain peer education programmes
Purpose/importance Effective implementation, accurate and timely reporting on care and support activitiesPolicy linked to Care and Support for Teaching and Learning Framework
Integrated School Health PolicyNational Department of Basic Policy on HIV, STIs and TB
Source/collection of data List of Learners Support AgentsMeans of verification List of Learners Support Agents appointedMethod of calculation Count number of Learners Support Agents appointedData limitations Delay of advertising postsType of indicator InputCalculation type Non-cumulativeReporting cycle AnnualNew indicator Yes

Page 145 of 208
MATHS, SCIENCE AND TECHNOLOGY GRANT: TECHNICAL INDICATOR DESCRIPTORSIndicator title Number of schools supplied with Internet connectivity ( Local Area Network or Wide Area Network) in accordance with minimum specificationsShort definition Support schools by providing Laptops, data projectors, tablets, tablet trolleys, wi-fi and installationsPurpose/importance To increase learner performance in maths and sciencePolicy linked to NDP, DORA and MSTS conditional grant frameworkSource/collection of data MSTS conditional grantMeans of verification Stamped and signed delivery notes by the school officialMethod of calculation CountData limitations Validity of delivery notes (stamp, date and signature)Type of indicator OutputCalculation type Non-cumulativeReporting cycle Annual (Q2)New indicator NoDesired performance Improved performance in Maths and ScienceIndicator responsibility Curriculum Support: Directorate
Indicator title Number of Technical schools workshop maintained /refurbished and workshops supplied with machinery, equipment and tools in accordance withminimum specifications.
Short definition Support schools by providing maintenance of existing machinery and supply workshops with machinery, equipment and toolsPurpose/importance To increase learner performance in maths and sciencePolicy linked to NDP, DORA and MSTS conditional grant frameworkSource/collection of data MSTS conditional grantMeans of verification Stamped and signed delivery notes by the school officialMethod of calculation CountData limitations Validity of delivery notes (stamp, date and signature)Type of indicator OutputCalculation type Non-cumulativeReporting cycle Annual (Q2)New indicator NoDesired performance Improved performance in Maths and ScienceIndicator responsibility Curriculum Support: Directorate

Page 146 of 208
Indicator title Number of schools provided with computer hardware in accordance with minimum specifications.Short definition Support schools by providing Laptops, data projectorsPurpose/importance To increase learner performance in maths and sciencePolicy linked to NDP, DORA and MSTS conditional grant frameworkSource/collection of data MSTS conditional grantMeans of verification Stamped and signed delivery notes by the school officialMethod of calculation CountData limitations Validity of delivery notes (stamp, date and signature)Type of indicator OutputCalculation type Non-cumulativeReporting cycle Annual (Q2)New indicator NoDesired performance Improved performance in Maths and ScienceIndicator responsibility Curriculum Support: Directorate
Indicator title Number of learners registered for Mathematics, Science and Technology Olympiads, Fairs, Expos and other competitions.Short definition Support schools by registering learners in Olympiads, Fairs, Expos and other competitionsPurpose/importance To increase learner performance in maths and sciencePolicy linked to NDP, DORA and MSTS conditional grant frameworkSource/collection of data MSTS conditional grantMeans of verification Attendance registersMethod of calculation CountData limitations Validity of attendance registersType of indicator OutputCalculation type Non-cumulativeReporting cycle Annual (Q2- Q4)New indicator NoDesired performance Improved performance in Maths and ScienceIndicator responsibility Curriculum Support: Directorate
Indicator title Number of Technical subject teachers and subject advisors trained in subject content and teaching methodologies on CAPS for Electrical, Civil andMechanical Technology, Technical Mathematics and technical sciences
Short definition Support schools by training Technical subject teachers, technical Maths and Technical SciencePurpose/importance To increase learner performance in Technology, Technical Maths and Technical Science.Policy linked to NDP, DORA and MSTS conditional grant frameworkSource/collection of data MSTS conditional grantMeans of verification Training manuals, Attendance registersMethod of calculation Count

Page 147 of 208
Indicator title Number of Technical subject teachers and subject advisors trained in subject content and teaching methodologies on CAPS for Electrical, Civil andMechanical Technology, Technical Mathematics and technical sciences
Data limitations Validity of attendance registersType of indicator OutputCalculation type Non-cumulativeReporting cycle Annual (Q2- Q4)New indicator NoDesired performance Improved performance in Maths and ScienceIndicator responsibility Curriculum Support: Directorate
Indicator title Number of trained in teaching methodologies and subject content for Mathematics, Physical, Life , Natural and agricultural SciencesShort definition Support schools by training Maths, Science and Agricultural sciences teachersPurpose/importance To increase learner performance in Mathematics and SciencesPolicy linked to NDP, DORA and MSTS conditional grant frameworkSource/collection of data MSTS conditional grantMeans of verification Training manuals, Attendance registersMethod of calculation CountData limitations Validity of attendance registersType of indicator OutputCalculation type Non-cumulativeReporting cycle Annual (Q2- Q4)New indicator NoDesired performance Improved performance in Maths and ScienceIndicator responsibility Curriculum Support: Directorate
Indicator title Number of participants in training and support in integrating ICT in the learning and teaching environmentShort definition Support schools by training Maths, Science and Agricultural sciences teachers in integrating ICT in the teaching and learning environment.Purpose/importance To increase learner performance in Mathematics and SciencesPolicy linked to NDP, DORA and MSTS conditional grant frameworkSource/collection of data MSTS conditional grantMeans of verification Training manuals, Attendance registersMethod of calculation CountData limitations Validity of attendance registersType of indicator OutputCalculation type Non-cumulativeReporting cycle Annual (Q2- Q4)New indicator NoDesired performance Improved performance in Maths and ScienceIndicator responsibility Curriculum Support: Directorate
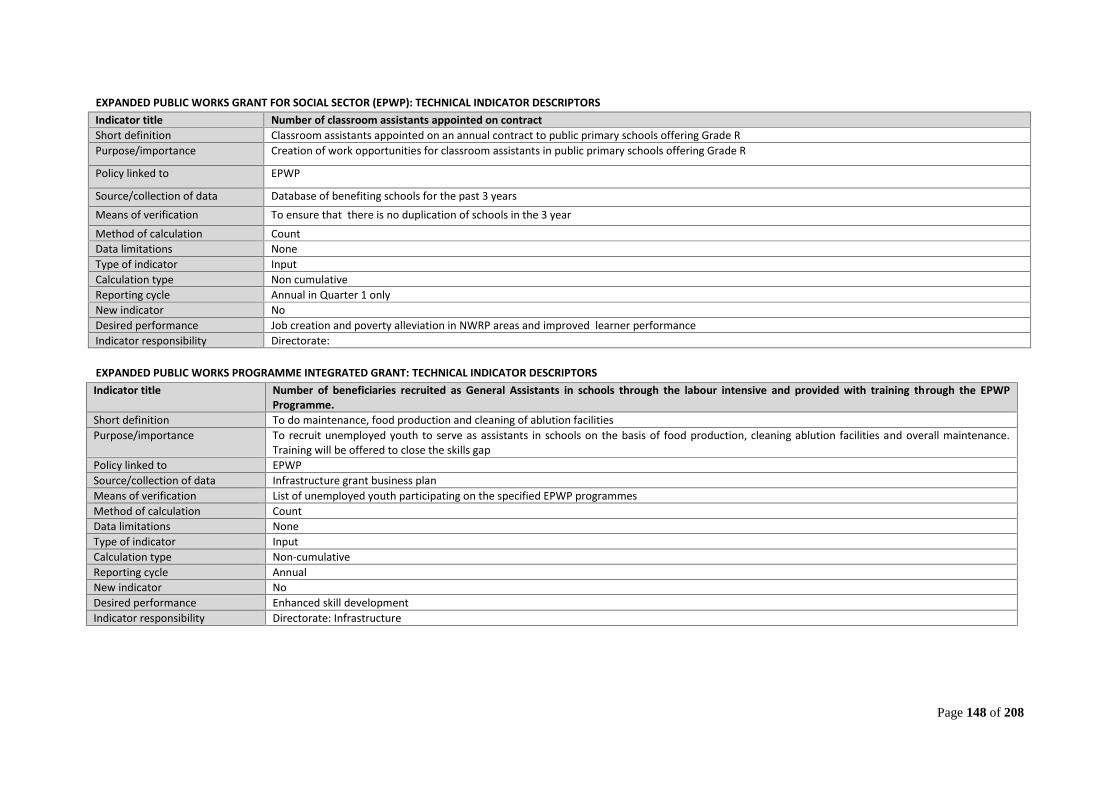
Page 148 of 208
EXPANDED PUBLIC WORKS GRANT FOR SOCIAL SECTOR (EPWP): TECHNICAL INDICATOR DESCRIPTORSIndicator title Number of classroom assistants appointed on contractShort definition Classroom assistants appointed on an annual contract to public primary schools offering Grade RPurpose/importance Creation of work opportunities for classroom assistants in public primary schools offering Grade R
Policy linked to EPWP
Source/collection of data Database of benefiting schools for the past 3 yearsMeans of verification To ensure that there is no duplication of schools in the 3 yearMethod of calculation CountData limitations NoneType of indicator InputCalculation type Non cumulativeReporting cycle Annual in Quarter 1 onlyNew indicator NoDesired performance Job creation and poverty alleviation in NWRP areas and improved learner performanceIndicator responsibility Directorate:
EXPANDED PUBLIC WORKS PROGRAMME INTEGRATED GRANT: TECHNICAL INDICATOR DESCRIPTORSIndicator title Number of beneficiaries recruited as General Assistants in schools through the labour intensive and provided with training through the EPWP
Programme.Short definition To do maintenance, food production and cleaning of ablution facilitiesPurpose/importance To recruit unemployed youth to serve as assistants in schools on the basis of food production, cleaning ablution facilities and overall maintenance.
Training will be offered to close the skills gapPolicy linked to EPWPSource/collection of data Infrastructure grant business planMeans of verification List of unemployed youth participating on the specified EPWP programmesMethod of calculation CountData limitations NoneType of indicator InputCalculation type Non-cumulativeReporting cycle AnnualNew indicator NoDesired performance Enhanced skill developmentIndicator responsibility Directorate: Infrastructure

Page 149 of 208
LEARNERS WITH PROFOUND INTELLECTUAL DISABILITIES GRANT: TECHNICAL INDICATOR DESCRIPTORS
Indicator title Number of learners with severe to profound intellectual disability benefitting from Special Schools and Care Centres(data base to be created)Short definition Conditional Grant for Learners with Severe to Profound Intellectual Disability (SPID) in Special Schools and Care Centres (under the Departments of Social
Development and Health).Purpose/importance To provide the necessary support, resources and equipment (to0 learners) in identified care centres and schools for the provision of education to children
with (SPID).Policy linked to White Paper 6 and Screening, Identification, Assessment and Support (SIAS).Source/collection of data Auditing of Special Schools and Care Centres to develop a data base (Auditing tool to be provided by DBE).Means of verification List of Special Schools and Care Centres participating in the Grant and the number of learners involved.Method of calculation Count the number of learners with severe to profound intellectual disability benefitting from Special Schools and Care CentresData limitations NoneType of indicator InputCalculation type Non-cumulativeReporting cycle QuarterlyNew indicator YesDesired performance To ensure that learners with severe to profound intellectual disabilities access quality public funded education and support.Indicator responsibility Directorate : Learner Social Support Services- Inclusive Education
Indicator title Number of Care Givers and Special Schools’ teachers trained to provide care and education for learners with severe to profound intellectual disability.Short definition Special School teachers and Care Centre caregivers are to be trained to provide care, education and support to learners with SPID.Purpose/importance To capacitate and empower teachers and care givers to be able to provide the learning programme and support learners with SPIDPolicy linked to White Paper 6 and Screening, Identification, Assessment and Support (SIAS).Source/collection of data Auditing of special schools and care centres to create a data base of teachers and carers.Means of verification List of teachers and care givers.Method of calculation Countthenumber of Care Givers and Special Schools’ teachers trained to provide care and education for learners with severe to profound intellectual
disability.Data limitations NoneType of indicator InputCalculation type Non-cumulativeReporting cycle QuarterlyNew indicator YesDesired performance To ensure that learners with severe to profound intellectual disabilities access quality public funded education and support.Indicator responsibility Directorate : Learner Social Support Services- Inclusive Education
Page 150 of 208
PART E: PUBLIC ENTITIESNone
PART F: PUBLIC-PRIVATE PARTNERSHIPSThere are no projects funded through Private Public Partnership in the department for the MTEF period.

Page 151 of 208
PART G: OTHER ANNEXURES
ANNEXURE 1: TECHNICAL INDICATOR DESCRIPTORS FOR NATIONALLY DETERMINED PROGRAMME PERFORMANCE MEASURES (PPM’S)
PROGRAMME 1: ADMINISTRATION
Indicator title PPM101: Number of public schools that use the South African Schools Administration and Management Systems (SA-SAMs) to electronically provide dataShort definition This performance measure tracks the number of public schools that use South African Schools Administration (SA-SAMS) to provide data
Public Schools: Refers to ordinary and special schools. It excludes independent schools.Purpose/importance To measure improvement in the ability to provide data from schools using SA-SAMS in the current financial year.Policy linked to National Education Information PolicySource/collection of data Primary Evidence:
Provincial EMIS/ data warehouseSecondary Evidence:Database with the list of schools that submit data using SA-SAMS
Means of verification Snapshot of provincial data systems that use data provided electronically (using SA-SAMS) by schools based on provincial warehouse (This should include EMISno., District and name of schools).
Method of calculation Count the total number of public schools that use SA-SAMs to submit data.If an annual target is reflected for a particular quarter, then the output reported for that quarter will be used as the annual output.
Data limitations Uploading of incomplete or incorrect (human error) informationType of indicator OutputCalculation type Non-cumulativeReporting cycle QuarterlyNew indicator NoDesired performance All public ordinary schools must be able to collect and submit data electronically using SA-SAMS. On or above target.Indicator responsibility EMIS Directorate(province may insert the more relevant Responsibility Manager)
Indicator title PPM102: Number of public schools that can be contacted electronically (e-mail)Short definition Number of public schools that can be contacted electronically particularly through emails or any other verifiable means e.g. Human Resource Management
Systems (HRMS).Public Schools: Refers to ordinary and special schools. It excludes independent schools.
Purpose/importance This indicator measures accessibility of schools by departments through other means than physical visits, This is useful for sending circulars, providingsupplementary materials and getting information from schools speedily in the current financial year.

Page 152 of 208
Policy linked to National Education Information PolicySource/collection of data Provincial EMIS/ data warehouse/ICT databaseMeans of verification Master-list of schools (EMIS No, Name of a school and email address e.g. HRMS user access reports).Method of calculation Count the total number of public schools that can be contacted electronically. The totals of the four quarters are added and averaged to provide the annual
total.If an annual target is reflected for a particular quarter, then the output reported for that quarter will be used as the annual output.Data limitations NoneType of indicator OutputCalculation type Non- cumulativeReporting cycle QuarterlyNew indicator NoDesired performance All public schools to be contactable through emails or any other verifiable means. On or above target.Indicator responsibility EMIS directorate / IT Directorate (province may insert the more relevant Responsibility Manager)
Indicator title PPM103: Percentage of education expenditure going towards non-personnel itemsShort definition This indicator measures the total expenditure (budget) on non-personnel items expressed as a percentage of total expenditure in education. Education
Expenditure: Refers to all government non-personnel education expenditure (inclusive of all sub-sectors of education including special schools, independentschools and conditional grants). This indicator looks at the total budget, inclusive of capital expenditure, transfers and subsidies.
Purpose/importance To measure education expenditure on non-personnel items in the financial year under review.Policy linked to PFMASource/collection of data Basic Accounting System (BAS) systemMeans of verification Annual Financial ReportsMethod of calculation Numerator: total education expenditure (budget) on non-personnel items
Denominator: total expenditures at the end of the financial year in educationMultiply by 100.
Data limitations NoneType of indicator OutputCalculation type Non-cumulativeReporting cycle AnnualNew indicator NoDesired performance To decrease personnel expenditure and ensure that more funds are made available for non-personnel items. On or below target i.e. more funds spent on non-
personnel items than anticipated.Indicator responsibility Financial Management Services

Page 153 of 208
Indicator title PPM104: Number of schools visited by District officials for monitoring and support purposes.Short definition Number of schools visited by district officials (including subject advisors) for monitoring, and professional support. This includes visits to public ordinary
schools, special schools and excludes visits to independent schools. District officials include all officials from education district office and circuits visitingschools for monitoring and support purposes.Professional support in this instance refers to the principal, SMT and teachers in a school receiving support or capacitation in areas identified as part of theircore duties, e.g. management and leadership, teacher development, and subject teaching.
Purpose/importance To measure support given to schools by the district officials in the financial year under review.Policy linked to SASA and MTSFSource/collection of data District officials signed schools schedule and schools visitor records or schools visit form.Means of verification Reports on the number of schools visited by district officials.Method of calculation Count the number of schools visitedData limitations NoneType of indicator InputCalculation type Non-CumulativeReporting cycle AnnualNew indicator YesDesired performance All schools that need assistance to be visited at least twice a year by district officials (including subject advisors) for monitoring, professional support and
liaison purposes. On or above target.Indicator responsibility Institutional Governance and Support Management (IGSS)

Page 154 of 208
PROGRAMME 2: PUBLIC ORDINARY SCHOOL EDUCATION
Indicator title PPM201: Number of full service schools servicing learners with learning barriersShort definition Number of public ordinary schools that have been converted to full service schools. Full-service schools: are public ordinary schools that are specially
resourced, converted and orientated to provide quality education to all learners by supplying the full range of learning needs in an equitable manner. Theseschools serve mainstream learners together with those experiencing moderate learning barriers.By resources it means the school must have all the facilities and LTSM must be available for the educator to provide equitable learning.By converted it means the infrastructure, school building and classrooms must be accessible to all learners and teachers. This may differ from school to schoolaccording to needs and to the possibilities for conversion at a particular school. All new schools to be built to ensure universal accessibility.By oriented it is referred to teachers must be oriented to ensure differentiated teaching and assessment as well as adaptation of LTSM.By Equitable the department refer to teaching and learning that takes place is the same for every learner irrespective of their disability or differences in learningstyle or pace.
Purpose/importance To measure access to public ordinary schools by learners with learning barriers in the current financial year.Policy linked to White Paper 6, Guidelines for Full Service SchoolsSource/collection of data Inclusive Education schools database
Primary Evidence:Inclusive Education schools database supported with signed off letters to each school designating it as a full service school.Database of identified schools with progress against national criteria (each province will provide the list of criteria)Secondary Evidence:List of schools and progress with regard to the conversion of the schools based on the criteria stipulated in the Guidelines for Full Service Schools/InclusiveSchools, 2009.
Means of verification List of public ordinary schools converted to full service schools.Method of calculation Count the total number of full service schools.Data limitations NoneType of indicator OutputCalculation type Non-cumulativeReporting cycle AnnualNew indicator NoDesired performance To ensure that all special needs learners have access to schooling system and that selected public ordinary schools are able to accommodate these learners. On
or above target.Indicator responsibility Inclusive Education Directorate

Page 155 of 208
Indicator title PPM202: The percentage of children who turned 9 in the previous year and who are currently enrolled in Grade 4 (or a higher grade)Short definition The appropriate age for children enrolled in Grade 4 is 10 years old. The number of learners who turned 9 in the previous year, are equal to the children aged
10 in the current year, who are currently enrolled in Grade 4 and higher, expressed as percentage of the total number of 10 year old learners enrolled in publicordinary schools.
Purpose/importance This indicator measures the efficiency in the schooling system for example the impact of late entry into Grade 1, grade repetition, and dropping out.Policy linked to SASA and MTSFSource/collection of data Provincial data warehouse
Means of verification Provincial data warehouse (e.g. EMIS)Method of calculation Numerator: number of 10 year old learners enrolled in Grade 4 and higher in public ordinary schools as on 31 March
Denominator: number of 10 year old learners attending these schools regardless of grade as on 31 March.Multiply by 100
Data limitations Lack of evidence of accurate date of birthType of indicator EfficiencyCalculation type Non-cumulativeReporting cycle AnnualNew indicator NoDesired performance High proportions of learners of appropriate age to be in the appropriate Grades at schools.Indicator responsibility EMIS Directorate(province may insert the more relevant Responsibility Manager)
Indicator title PPM203: The percentage of children who turned 12 in the preceding year and who are currently enrolled in Grade 7 (or a higher grade)Short definition The appropriate age for children enrolled in Grade 7 is 13 years old. The number of learners who turned 12 in the previous year, is equal to the children aged
13 in the current year, who are currently enrolled in Grade 7 and higher expressed as percentage of the total number 13 year old learners enrolled in publicordinary schools.
Purpose/importance This indicator measures the efficiency in the schooling system for example the impact of late entry into Grade 1, grade repetition, and dropping out.Policy linked to South African Schools Act (SASA) and MTSFSource/collection of data Provincial data warehouse
Means of verification Provincial data warehouse (e.g. EMIS)Method of calculation Numerator: number of 13 year old learners enrolled in Grade 7 and higher in public ordinary schools as on 31 March
Denominator: total number of 13 year old learners attending these schools regardless of grade as on 31 MarchMultiply by 100
Data limitations None

Page 156 of 208
Type of indicator EfficiencyCalculation type Non-cumulativeReporting cycle AnnualNew indicator NoDesired performance High proportions of learners of appropriate age to be in the appropriate Grades at schools. On or above target.Indicator responsibility EMIS Directorate(provinces may insert the more relevant Responsibility Manager)
Indicator title PPM204: Number of schools provided with multi-media resourcesShort definition Learners need access to a wider range of materials such as books other than textbooks, and newspapers, materials which would typically be found in a library or
multimedia centre. This includes both hardware and software and material which are both print and non-print material.Purpose/importance To measure the number of public ordinary schools with access to media resources. Access to quality library resources are essential to developing lifelong
reading habits, particularly in poor communities where children do not have access to private reading material in the current financial year.Policy linked to South African Schools Act (SASA) and Library Information Service GuidelinesSource/collection of data Primary Evidence:
Library Information Service databaseDelivery notes kept at schools and district offices of media resources provided.Secondary Evidence:Database with list of schools and media resources provided.
Means of verification List of schools provided with media resources including proof of deliveries (PODs) or other means of proof as defined at a provincial levelMethod of calculation Count the total number of schools that received the multi-media resourcesData limitations NoneType of indicator OutputCalculation type Non-cumulativeReporting cycle AnnualNew indicator NoDesired performance All schools to be provided with media resources. On or above target.Indicator responsibility Curriculum Services

Page 157 of 208
Indicator title PPM205: Learner absenteeism rateShort definition Learner absenteeism is defined as a situation where a learner is not at school for an entire day.Purpose/importance The aim is to measure the percentage of days lost within a quarter in the current financial/academic year due to learner absenteeism
Policy linked to South African Schools Act (SASA), Learner Attendance PolicySource/collection of data Learner attendance registers (manual/electronic)
Means of verification Consolidated information gathered from Provincial data source.Method of calculation Numerator: total number of school days absent by learners per quarter
Denominator: total number of school days per quarter multiplied by total number of learnersMultiply by 100.(To be tested by PEDs)
Data limitations Delay in the submission of the summary list of absent learners by schools without internet connections. Inadequate record-keeping by schools. Incorrect datacapturing
Type of indicator OutputCalculation type Non-cumulativeReporting cycle QuarterlyNew indicator NoDesired performance High percentage of learners to attend schools regularly. On or below target i.e. fewer learners are absent than anticipated.Indicator responsibility EMIS Directorate
Indicator title PPM206: Teachers absenteeism rateShort definition Absence of a teacher, who should be at school teaching and whose absence from school has been recorded.Purpose/importance To measure the extent of teachers absenteeism in schools in order to develop systems to reduce and monitor the phenomenon regularly. The aim is to count
learner days lost due to educator absenteeism in the current financial year.Policy linked to Employment of Educators Act (EEA)Source/collection of data Primary source: Attendance register and leave forms
Secondary source: PERSAL/SAMS/ Provincial data warehouseMeans of verification Database of educators recorded as absent from work/PERSAL.Method of calculation Numerator: total number of working days lost due to teachers absenteeism
Denominator: total number of possible working days in a quarterMultiply by 100This is a provincial average rate.

Page 158 of 208
Data limitations Delay in the submission of leave forms and the updating of PERSALType of indicator EfficiencyCalculation type Non-cumulativeReporting cycle QuarterlyNew indicator NoDesired performance High percentage of teachers to be teaching at schools during school hours. On or below target i.e. absenteeism to be less than anticipatedIndicator responsibility Human Resource Management and Provisioning
Indicator title PPM207: Number of learners in public ordinary schools benefiting from the “No Fee Schools” policyShort definition Number of learners attending public ordinary schools who are not paying any school fees in terms of “No fee schools policy”. The government introduced the
no-fee schools policy to end the marginalisation of poor learners. This is in line with the country's Constitution, which stipulates that citizens have the right tobasic education regardless of the availability of resources.
Purpose/importance To measure access to free education in the current financial year.Policy linked to Constitution, South African Schools Act (SASA) and No fee schools PolicySource/collection of data Resource target and Provincial data warehouseMeans of verification Resource targeting table (this could be known by different names in various other provinces)Method of calculation Count the number of learners registered in no-fee paying schools in line with “No Fee Schools Policy”.Data limitations NoneType of indicator OutputCalculation type Non-cumulativeReporting cycle AnnualNew indicator NoDesired performance All eligible learners to benefit from No Fee Schools Policy. Target met or exceeded.Indicator responsibility Budget Manager
Indicator title PPM208: Number of educators trained on Literacy/Language content and methodologyShort definition Teacher training and development is one of the top priorities in South African education guided and supported by the Strategic Planning Framework for
Teachers Education and Development. Teachers are expected to complete courses aimed at improving their content knowledge and will be encouraged to worktogether in professional learning communities to achieve better quality education. Provinces to supply own definition in terms of own context e.g. “Training” isdefined as a course with defined content, assessment and duration.
Purpose/importance Teacher development is conducted to improve content knowledge, pedagogy and the quality of teaching which impacts on learner performance in theclassroom.

Page 159 of 208
Policy linked to Strategic Planning Framework for Teachers Education and DevelopmentSource/collection of data Attendance registers of teachers trained in the provinceMeans of verification Human Resource Development or other provincial DatabaseMethod of calculation Count the total number of teacher trained in content and methodology in Literacy/LanguageData limitations Quality of source documentsType of indicator OutputCalculation type Non-cumulativeReporting cycle AnnualNew indicator NoDesired performance All teachers in all phases to be trained in Literacy/Language content and methodology. Target for year to be met or exceeded.Indicator responsibility Curriculum Management and Delivery
Indicator title PPM209: Number of educators trained on Numeracy/Mathematics content and methodologyShort definition Teacher training and development is one of the top priorities in South African education guided and supported by the Strategic Planning Framework for
Teachers Education and Development. Teachers are expected to complete courses aimed at improving their content knowledge and will be encouraged to worktogether in professional learning communities to achieve better quality education. Provinces to supply own definition in terms of own context e.g. “Training” isdefined as a course with defined content, assessment and duration.
Purpose/importance Teacher development is conducted to improve content knowledge, pedagogy and the quality of teaching which impacts on learner performance in theclassroom.
Policy linked to Strategic Planning Framework for Teachers Education and DevelopmentSource/collection of data Registers of teachers trained in the provinceMeans of verification Human Resource Development or other provincial DatabaseMethod of calculation Count the total number of teachers formally trained on content and methodology in Numeracy/MathematicsData limitations Quality of source documentsType of indicator OutputCalculation type Non-cumulativeReporting cycle AnnualNew indicator NoDesired performance All teachers in all phases to be trained in Numeracy/Mathematics content and methodology. Target for year to be met or exceeded.Indicator responsibility Curriculum Management and Delivery

Page 160 of 208
PROGRAMME 3: INDEPENDENT SCHOOL SUBSIDIES
Indicator title PPM301: Percentage of registered independent schools receiving subsidiesShort definition Number of registered independent schools that are subsidised expressed as a percentage of the total number of registered independent schools.
Independent Schools: schools registered or deemed to be independent in terms of the South African Schools Act (SASA). Funds are transferred to registeredindependent schools that have applied and qualified for government subsidies for learners in their schools.
Purpose/importance To improve access to education in the current financial year.Policy linked to Compliance with schools funding norms and standards for independent schoolsSource/collection of data Schools Funding Norms and standards databaseMeans of verification Budget transfer documents (these documents list schools, number of learners and budget allocation).Method of calculation Numerator: total number of registered independent schools that are subsidized
Denominator: total number of registered independent schoolsMultiply by 100
Data limitations NoneType of indicator InputCalculation type Non-cumulativeReporting cycle AnnualNew indicator YesDesired performance All qualifying independent schools to be subsidized and that subsidized independent schools must adhere to minimum standards for regulating Independent
schools. Target for year to be met or exceeded.Indicator responsibility Institutional Support Management and Governance: Independent Schools or Independent Schools Programme Manager
Indicator title PPM302: Number of learners at subsidized registered independent schoolsShort definition Independent Schools: schools registered or deemed to be independent in terms of the South African Schools Act (SASA). Funds are transferred to registered
independent schools that have applied and qualified for government subsidies for learners in their schools.Purpose/importance To improve access to education in the current financial year.Policy linked to Compliance with schools funding norms and standards for independent schoolsSource/collection of data Schools Funding Norms and standards databaseMeans of verification Budget transfer documents (these documents list schools, number of learners and budget allocation).Method of calculation Count the total number of learners in independent schools that are subsidizedData limitations NoneType of indicator Output

Page 161 of 208
Calculation type Non-cumulativeReporting cycle AnnualNew indicator NoDesired performance All learners in qualifying independent schools to be subsidised. Target for year to be met or exceeded.Indicator responsibility Institutional Support Management and Governance: Independent Schools or Independent Schools Programme Manager
Indicator title PPM303: Percentage of registered independent schools visited for monitoring and supportShort definition Number of registered independent schools visited by Provincial Education Department officials for monitoring and support purposes expressed as a percentage
of the total number of registered independent schools. These include schools visits by Circuit Mangers, Subject Advisors and any official from the Departmentfor monitoring and support.
Purpose/importance To measure monitoring and oversight of independent schools by Provincial Education Departments in the current financial year.Policy linked to SASA and MTSFSource/collection of data Provincial Education Department officials, Circuit Managers and Subject Advisers signed schools schedule and schools visitor records or schools visit form.Means of verification Provincial Education Departments reports on the number of independent schools visitedMethod of calculation Numerator: total number of registered independent schools visited by Provincial Education Department officials for monitoring and support purposes
Denominator: total number of registered independent schoolsMultiply by 100
Data limitations NoneType of indicator InputCalculation type Non-cumulativeReporting cycle QuarterlyNew indicator NoDesired performance All registered independent schools to be visited by Provincial Education Departments for oversight, monitoring, support and liaison purposes at least once a
year.Indicator responsibility Institutional Support Management and Governance: Independent Schools or Independent Schools Programme Manager

Page 162 of 208
PROGRAMME 4: PUBLIC SPECIAL SCHOOL EDUCATION
Indicator title PPM401: Percentage of special schools serving as Resource CentresShort definition Education White Paper 6 speaks of the “qualitative improvement of special schools for the learners that they serve and their phased conversion to special
schools resource centres that provided special support to neighbouring schools and is integrated into district based support team”.Purpose/importance To measure support that the special schools resource centres offer to mainstream and full service schools as a lever in establishing an inclusive education
system in the current financial year.Policy linked to White Paper 6 and Guidelines to Ensure Quality Education and Support in
Special Schools and Special Schools Resource CentresSource/collection of data Inclusive education databaseMeans of verification List of Special Schools serving as resource centresMethod of calculation Numerator: total number of special schools
Denominator: total number of special schools serving as resource centresMultiply by 100
Data limitations NoneType of indicator OutputCalculation type Non-cumulativeReporting cycle AnnualNew indicator NoDesired performance All special schools to serve as resource centres. Target for year to be met or exceeded.Indicator responsibility Inclusive Education Directorate (provinces may insert the more relevant Responsibility Manager)
Indicator title PPM402: Number of learners in public special schoolsShort definition Number of learners enrolled in special schools. Special School: Schools resourced to deliver education to learners requiring high-intensity educational and other
support on either a full-time or a part-time basis. The learners who attend these schools include those who have physical, intellectual or sensory disabilities orserious behaviour and/or emotional problems, and those who are in conflict with the law or whose health-care needs are complex.
Purpose/importance To measure access to education for special needs children, to provide information for planning and support for special schools purposesPolicy linked to White Paper 6Source/collection of data Provincial data warehouseMeans of verification Declarations signed-off by principals when they submit completed survey forms or electronic databases and co-signed by the Circuit and District Managers
(electronic or hardcopy)Method of calculation Count the total number of learners enrolled in public Special Schools at the end of the calendar year.Data limitations Completeness and accuracy of survey forms or electronic databases from schools

Page 163 of 208
Type of indicator OutputCalculation type Non-cumulativeReporting cycle AnnualNew indicator NoDesired performance All learners with physical, intellectual or sensory disabilities or serious behaviour and/or emotional problems, and those who are in conflict with the law or
whose health-care needs are complex to attend special schools.Indicator responsibility EMIS
Indicator title PPM403: Number of therapists/specialist staff in special schoolsShort definition This indicator measures the total number of professional non-educator/specialist staff employed in public special schools. Professional non-educator staff is
personnel who are classified as paramedics, social workers, therapists, nurses but are not educators. Note that although therapists, counsellors andpsychologists are appointed in terms of the Employment of Educators Act these should all be included in the total.
Purpose/importance To measure professional support given to learners and educators in public special schoolsPolicy linked to White Paper 6Source/collection of data PERSAL databaseMeans of verification PERSAL databaseMethod of calculation Count the total number of professional non-educator staff employed in public special schools.Data limitations Completeness and accuracy of PERSAL informationType of indicator InputCalculation type Non-cumulativeReporting cycle QuarterlyNew indicator NoDesired performance All public special schools to have the requisite number of school based professionals staffIndicator responsibility Human Resource and Management Directorate / Corporate Services – HR Administration (provinces may insert the more relevant Responsible Manager or unit)

Page 164 of 208
PROGRAMME 5: EARLY CHILDHOOD DEVELOPMENT
Indicator title PPM501: Number of public schools that offer Grade RShort definition This indicator measures the total number of public schools(ordinary and special) that offer Grade R.Purpose/importance To measure provision of Grade R in public schools.Policy linked to White Paper 5Source/collection of data Provincial data warehouseMeans of verification Signed-off declaration by Principal or District Manager (electronic or hardcopy) or other formal record as determined by the Province.Method of calculation Count the number of public schools (ordinary and special) that offer Grade RData limitations NoneType of indicator OutputCalculation type Non-cumulativeReporting cycle AnnualNew indicator NoDesired performance All public schools with Grade 1 to offer Grade R. Target for year to be met or exceeded.Indicator responsibility EMIS Directorate
Indicator title PPM502: Percentage of Grade 1 learners who have received formal Grade R educationShort definition Number of Grade 1 learners in public schools who have attended Grade R in public ordinary and/or special schools and registered independent schools/ECD
sites expressed as a percentage of total number of learners enrolled in Grade 1 for the first time, excluding learners who are repeating.Purpose/importance This indicator measures the readiness of learners entering the schooling system and records children who were exposed to Early Childhood Development
stimuli in the prior financial year.Policy linked to White Paper 5 and MTSFSource/collection of data Provincial data warehouseMeans of verification Signed-off declaration by Principal or District Manager (electronic or hardcopy). Provincial record systemsMethod of calculation Numerator: total number of Grade 1 learners in Public ordinary school who had formal Grade R in the previous year
Denominator: total Grade 1 learners enrolled in public ordinary schools, for the first time, excluding learners who are repeatingMultiply by 100
Data limitations NoneType of indicator OutputCalculation type Non-cumulativeReporting cycle AnnualNew indicator NoDesired performance All eligible children to attend Grade R in a given year. Target for year to be met or exceeded.Indicator responsibility EMIS Directorate

Page 165 of 208
PROGRAMME 6: INFRASTRUCTURE DEVELOPMENT
Indicator title PPM601: Number of public ordinary schools provided with water supplyShort definition This indicator measures the total number of public ordinary schools provided with water. This includes water tanks or boreholes or tap water. This measure
applies to addressing the backlogs that affect existing schools. It does not include provisioning for new schools.Purpose/importance To measure the plan to provide access to water in the year concerned in the current financial year.Policy linked to Schools Infrastructure ProvisionSource/collection of data NEIMS or School Infrastructure databaseMeans of verification Completion certificates and/or practical completion certificates and/or, work completion certificates and/or invoices.Method of calculation Count the total number of existing public ordinary schools that were provided with water in the year under review.Data limitations NoneType of indicator OutputCalculation type Non-cumulativeReporting cycle AnnualNew indicator NoDesired performance All public ordinary schools to have access to water. Target for year to be met or exceeded.
NB: Provinces in which this target has already been met and where this has been audited and confirmed will indicate “Not applicable” for this measure whichrefers solely to improvements to existing buildings and not new stock.
Indicator responsibility Schools Infrastructure Directorate / Infrastructure Development Unit
Indicator title PPM602: Number of public ordinary schools provided with electricity supplyShort definition This indicator measures the total number of public ordinary schools provided with electricity. This measure applies to existing schools and excludes new
schools. Definition: Schools with electricity refers to schools that have any source of electricity including Eskom Grid, solar panels and generators.Purpose/importance To measure additional access to electricity provided in the current financial year.Policy linked to Schools Infrastructure ProvisionSource/collection of data NEIMS or School Infrastructure databaseMeans of verification Completion certificate and/or practical completion certificates and/or works completion certificates.Educator space and support areas form.Method of calculation Count the total number of existing public ordinary schools that were provided with electricity in the year under review.Data limitations NoneType of indicator OutputCalculation type Non-cumulativeReporting cycle AnnualNew indicator No

Page 166 of 208
Desired performance All public ordinary schools to have access to electricity. Target for year to be met or exceeded.NB: Provinces in which this target has already been met and where this has been audited and confirmed will indicate “Not applicable” for this measure whichrefers solely to existing and not new stock.
Indicator responsibility Schools Infrastructure Directorate / Infrastructure Development Unit
Indicator title PPM603: Number of public ordinary schools supplied with sanitation facilitiesShort definition This indicator measures the total number of public ordinary schools provided with sanitation facilities. This measure applies to existing schools and excludes
new schools. Sanitation facility: Refers to all kinds of toilets such as: Pitlatrine with ventilated pipe at the back of the toilet, Septic Flush, Municipal Flush, EnviroLoo, Pit-latrine, Wendy flush and Chemical.
Purpose/importance To measure additional access to sanitation facilities provided in the current financial year.Policy linked to Schools Infrastructure ProvisionSource/collection of data School Infrastructure databaseMeans of verification Completion certificate and/or practical completion certificates and/or works completion certificates. Educator space and support areas form.Method of calculation Count the total number of public ordinary schools provided with sanitation facilities in the year under review.Data limitations NoneType of indicator OutputCalculation type Non-cumulativeReporting cycle AnnualNew indicator NoDesired performance All public ordinary schools to have access to sanitation facilities. Target for year to be met or exceeded.
NB: Provinces in which this target has already been met and where this has been audited and confirmed will indicate “Not applicable” for this measure whichrefers solely to existing and not new stock.
Indicator responsibility Schools Infrastructure Directorate/ Infrastructure Development Unit
Indicator title PPM604: Number of additional classrooms built in, or provided for, existing public ordinary schools (includes replacement schools)Short definition This indicator measures the number of classrooms built onto or provided to public ordinary schools. These are additional classrooms or mobile classrooms for
existing schools. The measure excludes classrooms in new schools. This should also not include Grade R classrooms.Classrooms: Rooms where teaching and learning occurs, but which are not designed for special instructional activities. This indicator excludes specialist rooms.
Purpose/importance To measure additional access to the appropriate learning environment and infrastructure in schools provided in the current financial year.Policy linked to Guidelines Relating to Planning for Public School InfrastructureSource/collection of data School Infrastructure databaseMeans of verification Completion certificate or practical completion certificate. The evidence could include province-specific items such as letters of satisfaction provided by the
school, Works Completion Certificates etc. The mobiles should be recorded in the Asset Registers, as per provincial norms.Educator space and support areas

Page 167 of 208
form.Method of calculation Count the total number of additional classrooms built or provided in existing schools.Data limitations NoneType of indicator OutputCalculation type Non-cumulativeReporting cycle AnnualNew indicator NoDesired performance All public ordinary schools to have adequate numbers of classrooms. Target for year to be met or exceeded.Indicator responsibility Schools Infrastructure Directorate / Infrastructure Development Unit
Indicator title PPM605: Number of additional specialist rooms built in public ordinary schools (includes replacement schools).Short definition This indicator measures the total number of additional specialist rooms built in public ordinary schools.
These include additional specialist rooms in existing schools and those in new or replacement schools. This should not include Grade R classrooms.Specialist room is defined as a room equipped according to the requirements of the curriculum.Examples: technical drawing room, music room, metal work room. It excludes administrative offices and classrooms (as defined in PPM 604) and includes roomssuch as laboratories.Note that although the school might decide to put the room to a different use from the specifications in the building plan it will still be classified as a specialistroom for the purposes of this measure.
Purpose/importance To measure availability and provision of specialist rooms in schools in order to provide the appropriate environment for subject specialisation through thecurriculum in the current financial year.
Policy linked to Guidelines Relating To Planning For Public School InfrastructureSource/collection of data School Infrastructure databaseMeans of verification Completion Certificate. The room is built to the designated size. The evidence could include province-specific items such as letters of satisfaction provided by
the school, Works Completion Certificates etc.Educator space and support areas form.Method of calculation Count the total number of specialist rooms builtData limitations NoneType of indicator OutputCalculation type Non-cumulativeReporting cycle AnnualNew indicator NoDesired performance All public ordinary schools to have libraries, resource centre etc. Target for year to be met or exceeded.Indicator responsibility Schools Infrastructure Directorate / Infrastructure Development Unit

Page 168 of 208
Indicator title PPM606: Number of new schools completed and ready for occupation (includes replacement schools)Short definition This indicator measures the total number of public ordinary schools built in a given year. These include both new and replacement schools built and completed.Purpose/importance To measure access to education through provision of appropriate schools infrastructure in the current financial year.Policy linked to Guidelines Relating To Planning For Public School InfrastructureSource/collection of data School Infrastructure database.Means of verification Completion Certificate or practical completion certificate. The evidence could include province-specific items such as letters of satisfaction provided by the
school, Works Completion Certificates etc.Method of calculation Count the total number of new schools completedData limitations NoneType of indicator OutputCalculation type Non-cumulativeReporting cycle AnnualNew indicator NoDesired performance All children to have access to public ordinary schools with basic services and appropriate infrastructure. Target for year to be met or exceeded.Indicator responsibility Schools Infrastructure Directorate / Infrastructure Development Unit
Indicator title PPM607: Number of new schools under construction (includes replacement schools)Short definition This indicator measures the total number of public ordinary schools under construction includes replacement schools and schools being built.
Under-construction means any kind of building work, such as laying of a building foundation, with construction workers on site and brick and mortar delivered.Purpose/importance To measure availability and provision of education through provision of more schools in order to provide the appropriate learning and teaching in the current
financial year.Policy linked to Guidelines Relating To Planning For Public School InfrastructureSource/collection of data School Infrastructure databaseMeans of verification Consultants progress reportsMethod of calculation Count the total number of schools under construction including replacement schoolsData limitations NoneType of indicator OutputCalculation type Non-cumulativeReporting cycle AnnualNew indicator NoDesired performance Public ordinary schools to cater for learner numbers and meet required standards. In the year concerned the building targets should be met or exceeded so
there are no lags in the provision of adequate accommodation.Indicator responsibility Schools Infrastructure Directorate / Infrastructure Development Unit

Page 169 of 208
Indicator title PPM608: Number of new or additional Grade R classrooms built (includes those in replacement schools).Short definition This indicator measures the total number of classrooms built to accommodate Grade R learners.Purpose/importance To measure expansion of the provision of early childhood development in the current financial year.Policy linked to Guidelines on Schools InfrastructureSource/collection of data School Infrastructure databaseMeans of verification Completion Certificate or practical completion certificate. The evidence could include province-specific items such as letters of satisfaction provided by the
school, Works Completion Certificates etc.Method of calculation Count the total number of new or additional Grade R classrooms built.Data limitations NoneType of indicator OutputCalculation type Non-cumulativeReporting cycle AnnualNew indicator NoDesired performance All public ordinary schools with Grade 1 to have a Grade R classroom(s).Indicator responsibility Schools Infrastructure Directorate / Infrastructure Development Unit
Indicator title PPM609: Number of hostels builtShort definition This indicator measures the number of hostels built in the public ordinary schools.Purpose/importance To measure access to education for learners who would benefit from being in a hostel in the current financial year.Policy linked to Guidelines on Schools InfrastructureSource/collection of data School Infrastructure databaseMeans of verification Completion Certificate or practical completion certificate The evidence could include province-specific items such as letters of satisfaction provided by the
school, Works Completion Certificates etc.Method of calculation Count the total number of additional hostels built in public ordinary schoolsData limitations NoneType of indicator OutputCalculation type Non-cumulativeReporting cycle AnnualNew indicator NoDesired performance All children to have access to education regardless of geographical location. Target for year to be met or exceeded.Indicator responsibility Schools Infrastructure Directorate / Infrastructure Development Unit
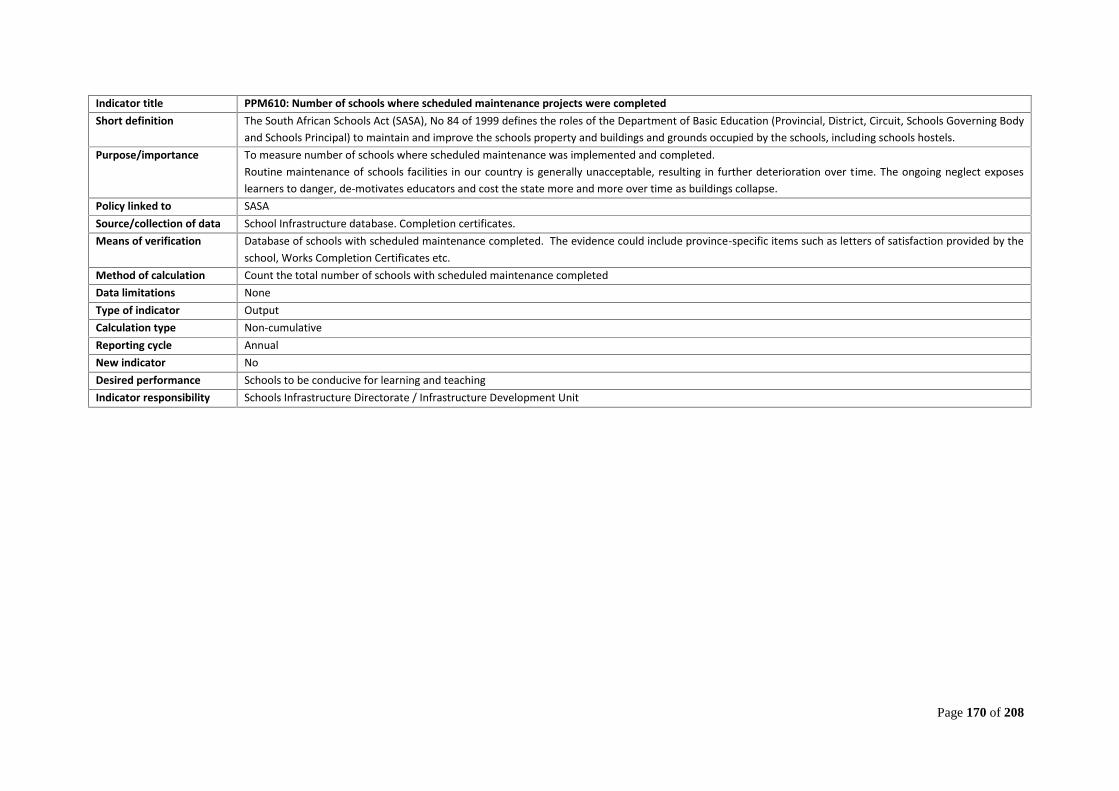
Page 170 of 208
Indicator title PPM610: Number of schools where scheduled maintenance projects were completedShort definition The South African Schools Act (SASA), No 84 of 1999 defines the roles of the Department of Basic Education (Provincial, District, Circuit, Schools Governing Body
and Schools Principal) to maintain and improve the schools property and buildings and grounds occupied by the schools, including schools hostels.Purpose/importance To measure number of schools where scheduled maintenance was implemented and completed.
Routine maintenance of schools facilities in our country is generally unacceptable, resulting in further deterioration over time. The ongoing neglect exposeslearners to danger, de-motivates educators and cost the state more and more over time as buildings collapse.
Policy linked to SASASource/collection of data School Infrastructure database. Completion certificates.Means of verification Database of schools with scheduled maintenance completed. The evidence could include province-specific items such as letters of satisfaction provided by the
school, Works Completion Certificates etc.Method of calculation Count the total number of schools with scheduled maintenance completedData limitations NoneType of indicator OutputCalculation type Non-cumulativeReporting cycle AnnualNew indicator NoDesired performance Schools to be conducive for learning and teachingIndicator responsibility Schools Infrastructure Directorate / Infrastructure Development Unit

Page 171 of 208
PROGRAMME 7: EXAMINATION AND EDUCATION RELATED SERVICES
Indicator title PPM701: Percentage of learners who passed National Senior Certificate (NSC)Short definition This indicator measures the total number of NSC learners who passed in the National Senior Certificate (NSC) examination expressed as a percentage of the
total number of learners who wrote the National Senior Certificate.Purpose/importance To measure the efficiency of the schooling system in the current financial year.Policy linked to MTSF and Examinations and AssessmentsSource/collection of data National Senior Certificate databaseMeans of verification List of National Senior Certificate learnersMethod of calculation Numerator: total number of learners who passed NSC examinations
Denominator: total number of learners who wrote the National Senior Certificate (NSC)Multiply by 100The total includes learners in Programmes 2, 3 and 4. The figure used is based on the announcement of the Minister in January of each year.
Data limitations NoneType of indicator OutputCalculation type Non-cumulativeReporting cycle AnnualNew indicator NoDesired performance To increase the number of Grade 12 learners that are passing the NSC examinations.Indicator responsibility Examinations and Assessments Directorates

Page 172 of 208
Indicator title PPM702: Percentage of Grade 12 learners passing at bachelor levelShort definition Number of learners who obtained Bachelor passes in the National Senior Certificate (NSC). Bachelor passes enables NSC graduates to enrol for degree courses
in universities expressed as a percentage of the total number of learners who wrote NSC examinations.Purpose/importance To measure quality aspects of NSC passes in the current financial year.Policy linked to MTSF and Examinations and AssessmentsSource/collection of data National Senior Certificate databaseMeans of verification List of National Senior Certificate learnersMethod of calculation Numerator: total number of Grade 12 learners who achieved a Bachelor pass in the NSC
Denominator: total number of Grade 12 learners who wrote NSC examinationsMultiply by 100The figure used is based on the announcement of the Minister in January of each year.
Data limitations NoneType of indicator OutputCalculation type Non-cumulativeReporting cycle AnnualNew indicator NoDesired performance To increase the percentage of learners who are achieving Bachelor passes in the NSC examinationsIndicator responsibility Examinations and Assessment Directorate
Indicator title PPM703: Percentage of Grade 12 learners achieving 50% or more in MathematicsShort definition Number of Grade 12 learners passing Mathematics with 50% or more in the NSC examinations expressed as a percentage of the total number of learners who
wrote Mathematics in the National Senior Certificate (NSC) examinations.Purpose/importance To measure efficiency in the schooling system with a focus on
Mathematics as a key gateway subject in the current financial year.Policy linked to MTSF and Examinations and AssessmentsSource/collection of data National Senior Certificate databaseMeans of verification List of National Senior Certificate learnersMethod of calculation Numerator: total number of Grade 12 learners who passed Mathematics in the NSCwith 50% and more
Denominator: total number of learners who wrote Mathematics in the NSC examinationsMultiply by 100The figure used is based on the announcement of the Minister in January of each year.
Data limitations None

Page 173 of 208
Type of indicator OutputCalculation type Non-cumulativeReporting cycle AnnualNew indicator NoDesired performance To increase the number of NSC learners who are passing Mathematics with 50% and aboveIndicator responsibility Examinations and Assessment Directorate
Indicator title PPM704: Percentage of Grade 12 learners achieving 50% or more in Physical SciencesShort definition Number of Grade 12 learners passing Physical Sciences with 50% or more in the National Senior Certificate (NSC) examinations expressed as a percentage of the
total number of learners who wrote Physical Sciences in the NSC examinations.Purpose/importance To measure efficiency in the schooling system with a focus on
Physical Sciences as a key gateway subject in the current financial year.Policy linked to MTSF and Examinations and AssessmentsSource/collection of data National Senior Certificate databaseMeans of verification List of National Senior Certificate learnersMethod of calculation Numerator: total number of Grade 12 learners who passed Physical Sciences in the NSC with 50% and above
Denominator: total number of learners who wrote Physical Science in the NSC examinationsMultiply by 100The figure used is based on the announcement of the Minister in January of each year.
Data limitations NoneType of indicator OutputCalculation type Non-cumulativeReporting cycle AnnualNew indicator NoDesired performance To increase the number of NSC learners who are passing Physical Sciences at 50% and aboveIndicator responsibility Examinations and Assessment Directorate

Page 174 of 208
Indicator title PPM705: Number of secondary schools with National Senior Certificate (NSC) pass rate of 60% and aboveShort definition This indicator measures the total number of secondary schools that have achieved a pass rate of 60% and above in the National Senior Certificate (NSC).Purpose/importance This indicator measures the quality of NSC passes as the sector wants to ensure that more Grade 12 learners obtain an NSC qualification in the current financial
year.Policy linked to Action Plan to 2019 and CAPSSource/collection of data Primary Evidence:
National Senior Certificate databaseProvincial database reconstructed to mirror national results.Secondary Evidence:NSC results as calculated by DBE in the NSC Report.
Means of verification National Senior Certificate databaseMethod of calculation Count the total number of schools with a pass rate of 60% and above in the NSC examinations. The figure used is based on the announcement of the Minister in
January of each year.Data limitations NoneType of indicator OutputCalculation type Non-cumulativeReporting cycle AnnualNew indicator NoDesired performance All public ordinary schools to perform at 60% and above in the NSCIndicator responsibility Curriculum Branch and Assessment and Examinations Directorate (province may insert the more relevant Responsibility Manager)

Page 175 of 208
ANNEXURE 2: TECHNICAL INDICATOR DESCRIPTORS FOR PROVINCIAL DETERMINED PROGRAMME PERFORMANCE INDICATORS
PROGRAMME 1: ADMINISTRATION
New MTSF aligned PPM
Indicator title PPI: 1.2.1 Percentage of 7 to 15 year olds attending education institutions.Short definition The percentage of children 7 to 15 years old in the province attending any school or educational institution (this refers to Public Ordinary Schools, Special
Schools and Independent Schools). Data to be provided by DBE Research UnitPurpose/importance To measure the extent to which children of compulsory school going age are attending schools as expressed in the Constitution.Policy linked to Constitution, South African Schools Act and National Education Policy Act.Source/collection of data Statistics South Africa (STATSSA) for the number of learners of schools going age in the province and provincial learner records for the number of learners.
The General Household Survey (GHS) information for the year in progress will be used as the denominator and will be supplied by DBE.Means of verification STATSSA records and General Household Survey (GHS)
Provincial Department of Education learner recordsMethod of calculation Numerator: total number of learners between the ages of 7 and 15 who are attending schools in the province
Denominator: total number of learners between the ages of 7 and 15 who are in the province according to STATSSAMultiply by 100
Data limitations Data from STATSSA is based on sampling;The data which will be provided will be from different time periods. There is a time lag between GHS data and the PED APPs
Type of indicator OutputCalculation type Non-cumulativeReporting cycle AnnualNew indicator YesDesired performance All learners of compulsory school going age are attending school.Indicator responsibility Directorate: EMIS section; DBE for STATSSA information for denominator.

Page 176 of 208
Indicator Title PPI: 1.2.2 Percentage of learners having access to information through(a) Connectivity (other than broadband); and(b) Broadband
Short definition This indicator measures the percentage of learners in public schools where there is connectivity and broadband, to provide access to internet and informationfor learners.Note: Connectivity, including Broadband refers to telecommunication in which a wide band of frequencies is available to transmit information and enables alarge number of messages to be communicated simultaneously. In the context of internet access, broadband is used to mean any high speed internet accessthat is always on and faster than traditional dial-up access. This can be achieved through fixed cable and DSL internet services or through fixed wirelessbroadband services, such as mobile wireless broadband where a mobile card is purchased for a modem or laptop and users connect to the internet through cellphone towers.
Purpose/importance To ensure that ICT can be used for improved learning and teaching in an effective manner and allow learners to gain access to information via the internet toassist them in learning and assessment.
Policy linked to NDP;MTSF andWhite Paper on E-Education.
Source/collection of data Database of schools where learners have access to connectivity and broadband, for access to information and the internet connectivity and/or broadbandaccess.
Means of verification Annual audit of schools where learners have access to broadband or any other internet connectivity access; and/orBAS report/invoices of broadband/ICT services paid by and on behalf of schools in the year under review.
Method of calculation Numerator: total number of learners in public schools that have access to connectivity/ broadband.Denominator: total number of learners in all public schoolsMultiply by 100
Data limitations NoneType of indicator InputCalculation type Non-cumulativeReporting cycle QuarterlyNew indicator YesDesired performance All learners have access to internet connection to be able to access information that may assist them in the completion of learning and assessment assignments.Indicator responsibility Directorate: ICT

Page 177 of 208
Indicator Title PPI: 1.2.3 The percentage of school principals rating the support services of districts as being satisfactory.Short definition Percentage of school principals rating the support services of districts as being satisfactory.
Survey tool is called the Principal Survey Instrument/ToolSatisfactory means: the service provided by the district that has been rated as such by the surveyed school principals i.e. the recorded sum of the scores 3and 4 as described by the 4 point scale (1=Not useful, 2=Somewhat useful, 3=Useful, 4=Very useful)
Purpose/importance To measure how principals view the support provided to their schools by Circuit Managers and Subject Advisors.Policy linked to SASA, MTSF, District PolicySource/collection of data Sample Survey
Database of school principals participating in the surveyMeans of verification School Survey on District Support.Method of calculation Numerator: total number of school principals expressing satisfaction
Denominator: total number of principals participating in the surveyMultiply by 100
Data limitations Schools not participating.Type of indicator OutputCalculation type Non-cumulativeReporting cycle Annually
New indicator YesDesired performance Schools must get full support from education districts in management and governance as well as curriculum provision to ensure that all schools provide
quality basic education across the province.Indicator responsibility Strategic Management Services: Research Unit

Page 178 of 208
Indicator title PPI 1.2.4: Number of office based employees trainedShort definition Up-skilling of administrative staff in occupational , management and leadership competenciesPurpose/importance Improvement of administrative, management and leadership capacity to contribute towards effective and efficient implementation of the Departmental
Strategic PlanPolicy linked to Skills development Act and National Skills Development Strategy IIISource/collection of data Districts and Corporate priority training needs submissions, mandatory programs from the Department of Public Service and Administration, Training Schedule
and Annexure 2Means of verification Signed attendance registers of programmesMethod of calculation Count the number of office based employees trainedData limitations AbsenteeismType of indicator OutputCalculation type CumulativeReporting cycle Monthly and QuarterlyNew indicator NoDesired performance Improved individual and organisational performanceIndicator responsibility Director: Human Resource Utilisation and Development
Indicator title PPI 1.2.5: Number of unemployed youth participating in internship, learnerships and/or skills programsShort definition To provide skills development opportunities for increasing prospects of employabilityPurpose/importance Enhancing opportunities for employment and further learningPolicy linked to Skills development Act and National Skills Development Strategy IIISource/collection of data Districts and Corporate internship, learnership and skills program needs submissions, Provincial prioritiesMeans of verification Signed Internship contracts and learnership agreements.Method of calculation Count the number of unemployed youth participating in internship, learnerships and/or skills programsData limitations Assumption of duty not submitted on timeType of indicator OutputCalculation type Non-cumulativeReporting cycle AnnualNew indicator Revised IndicatorDesired performance Unemployed youth have acquired skills and knowledge which improves opportunities for employment and further learningIndicator responsibility Directorate: Human Resource Utilisation and Development

Page 179 of 208
Indicator title PPI 1.2.6: Number of Employees attending Employee Health and Wellness activitiesShort definition Employee Health and Wellness Unit comprises of Four Development strategy: Wellness Management, on comprehensive wellness, ensuring work life balance
and individual and organisational wellness. HIV and AIDS & TB Management, ensuring an HIV&AIDS competent aids free public service. Health andProductivity Management focuses on Disease Management, mental health and injury on duty. Safety, Environment, Health, Risk and Quality Management(SHERQ) ensures a public service that is safe, with limited and controlled hazards and limited effects on employees and the working environment.
Purpose/importance Ensuring a Healthy and Safe Working Environment, and Healthy and Productive WorkforcePolicy linked to Safety, Environment, Health, Risk and Quality Management (SHERQ)Source/collection of data Four development strategy of Employee Health and WellnessMeans of verification Signed attendance registers, on different dates and different venuesMethod of calculation Count the number of Employees attending Employee Health and Wellness activitiesData limitations No limitationsType of indicator OutputCalculation type CumulativeReporting cycle QuarterlyNew indicator NoDesired performance To ensure that four development strategy are executed in the institutionsIndicator responsibility Directorate: Human Resources Management
Indicator title PPI 1.2.7: Number of schools that will be monitored on integrating ICT in teaching and learning
Short definition School monitoring and support on ICT integration in the curriculum. Teachers are trained over a period of five days on integrating ICT in teaching and learning.E-learning officials visit schools to monitor how the integration of ICT has been implemented. Where a gap is identified, support will be given immediately. Thesupport can be a follow up training.
Purpose/importance To support teaching and learningPolicy linked to ICT policySource/collection of data Monitoring tool (inclusive of support)Means of verification Monitoring tool (inclusive of support) for every school visitedMethod of calculation Count the number of schools that will be monitored on integrating ICT in teaching and learningData limitations Inaccurate completion of the monitoring toolType of indicator OutputCalculation type CumulativeReporting cycle QuarterlyNew indicator NoDesired performance To ensure that schools integrate ICT in teaching and learningIndicator responsibility Directorate: Curriculum Support (E-Learning)

Page 180 of 208
Indicator title PPI 1.2.8: Percentage of women appointed in SMS positions (Percentage of office based women in Senior Management Service).Short definition Total number of women appointed as senior management expressed as a percentage of total SMS in the province
Considering the number of women already appointed and the difference between the numbers of men appointed. A proportional ratio and percentage of men andwomen appointed in SMS posts to be used in re-in fencing posts for the appointment of women in advertised posts on a progressive pattern until the 50% Nationaltarget is reached.
Purpose/importance Advancing the employment of women and people with disabilities in management positions office based levelPolicy linked to Employment Equity PlanSource/collection of data PERSALMeans of verification PERSALMethod of calculation Numerator :Total women appointed in the SMS posts
Denominator: Total number of SMS posts advertisedmultiply by 100
Data limitations No specific data limitationsReporting cycle AnnualDesired performance National target is 50%Indicator responsibility Chief Director HRM
Indicator title PPI 1.2.9: Percentage of invoices paid within 30 daysShort definition Service providers within the procurement unit are referred to as suppliers for goods and services, e.g. stationery, printing and repairs
The 30 days will be calculated from the date of receipt of invoicePurpose/importance It is the contribution of the Department in growing the economy of the country through State Departments supporting SMMEsPolicy linked to PFMASource/collection of data Basic Accounting System (BAS)Means of verification Records of all invoices received by the procurement unitMethod of calculation ‘invoices paid within 30 days’/ ‘invoices received’ multiply by 100Data limitations NoneType of indicator OutputCalculation type Non-cumulativeReporting cycle QuarterlyNew Indicator YesDesired performance All invoices received and paid within 30 daysIndicator responsibility Accounting service

Page 181 of 208
PROGRAMME 2: PUBLIC ORDINARY SCHOOLS
New MTSF aligned PPM
Indicator Title PPI 2.1: The average hours per year spent by teachers on professional development activities.Short definition The average hours spent by teachers on professional development. Professional development is defined as training provided in a formal environment, for which
identified teachers (preferably as per Provincial Teacher Development Plan) and attendance recorded. Afternoon workshops are included in this definition.Purpose/importance To measure the average hours per year spent by teachers on professional development activities to ensure that teachers at all levels spend adequate time in
professional development activities. Teachers are expected to undergo training aimed at improving their pedagogic and content knowledge and will also beencouraged to work together in professional learning communities to achieve better quality education. The CPTD programme of SACE (to be phased in) willrequire of teachers to accumulate a number of hours annually by attending or participating in verifiable professional development activities.“adequate” means 66 hours spent professional development
Policy linked to Integrated Strategic Planning Framework for Teachers Education and Development;Skills development legislation; andSACE
Source/collection of data Attendance Registers with hours spent indicatedProvincial Teacher Development Plan
Means of verification Framework/Plan for teacher development;Registers of training workshops and attendance summary;Database of educators who participated in professional developmentActivities.Report(s) on the number of hours spent by teachers on teacher development activities
Method of calculation Numerator: Total number of hours spent by teachers in training provided by the departmentDenominator: Total number of teachers who attended the training workshops
Data limitations Poor database management and incomplete attendance registers and non-submission of attendance registers by trainersType of indicator InputCalculation type CumulativeReporting cycle QuarterlyNew indicator YesDesired performance Teachers show high commitment to teaching and learning and are equipped with excellent content knowledge and pedagogical skills to deliver the prescribed
curriculumIndicator responsibility Curriculum Management and Delivery

Page 182 of 208
New MTSF aligned PPM
Indicator Title PPI 2.2: Number of teachers who have written the Self-Diagnostic Assessments.Short definition To ensure that teachers at all levels are able to identify gaps in their content knowledge in order for relevant teacher development to be provided.Purpose/importance Teachers training and development is one of the top priorities in South African education guided and supported by the Strategic Planning Framework for
Teachers Education and Development. Teachers are expected to complete courses aimed at improving their content knowledge and will be encouraged to worktogether in professional learning communities to achieve better quality education. The MTSF requires of teachers to test their content knowledge byparticipatingin sample-based assessments to contribute towards relevant teacher development.
Policy linked to MTSF andStrategic Planning Framework for Teachers Education and Development.
Source/collection of data List of teachers who participated in the self-diagnostic assessment.
Means of verification Database of identified educators who participated in sample-based self-assessments; andList of teachers that participated in the assessments.
Method of calculation Count the number of teachers who participated in the assessment.Data limitations NoneType of indicator OutputCalculation type Non-cumulativeReporting cycle AnnuallyNew indicator YesDesired performance Identified teachers participate in anonymous self-assessmentsIndicator responsibility Curriculum Management and Delivery
New MTSF aligned PPM
Indicator title PPI 2.3: Percentage of learners in schools with at least one educator with specialist training on inclusionShort definition The total number of learners in public ordinary schools with at least one educator with specialist training on inclusion expressed as a percentage of the total
number of learners.Specialist training is defined as all teachers who have one of the following:A full Higher Education Institution (HEI) qualification in Inclusive Education, e.g. Postgraduate Diploma in Education, NQF Level 8 or Postgraduate Certificate inEducation / Advanced Diploma, NQF Level 7 or Advanced Certificate of Education in Inclusive Education NQF level 6 or BEd and BEdHonoursspecialising inInclusive Education; and/orAttainment of accredited Short Courses and/or SACE endorsed programmes in one or more of the following: SIAS Policy, CurriculumDifferentiation, Guidelines for Special Schools as Resource Centres, Guidelines for Full-Service Schools, SASL, Braille, and Curriculum Adaptation for Learnerswith Visual Impairment.
Purpose/importance To measure access to education for learners experiencing barriers to learning in the public ordinary schooling system.Policy linked to NDP;
White Paper 6Source/collection of data Formal qualification;

Page 183 of 208
Short Course certificates;Attendance register of educators trained on inclusion (where applicable);Training and development data base (where applicable);PERSAL print out of qualifications; andList of all public ordinary schools with numbers of learners in those schools.
Means of verification List of public ordinary schools with numbers of learners where at least one educator was trained on inclusion according to the definition given above.Method of calculation Numerator: total learner enrolment in public ordinary schools where there is at least one educator with specialist training on inclusion
Denominator: total learner enrolment in public ordinary schoolsMultiply by 100
Data limitations Specialist qualification details might not be adequately specified/ documented.Type of indicator InputCalculation type Non-cumulativeReporting cycle AnnualNew indicator YesDesired performance To ensure that all learners in public ordinary schools have access to specialised learning support.Indicator responsibility Directorate: Inclusion and Special Schools Directorate
Human Resources (HR)
New MTSF aligned PPM
Indicators Title PPI 2.4: Percentage of teachers meeting required content knowledge levels after support.Short definition The percentage of teachers that show improved content knowledge in priority subjects after support.
A priority subject refers to Mathematics/Numeracy and Language/literacy.Note: Training needs identified are linked to a specific topic/item in the curriculum which determines the required content knowledge that is expected of theeducator to have. Based on the training needs and the curriculum requirements, a support intervention is developed and delivered. To measure contentknowledge, teachers will be expected to write assessments before and after training programmes/sessions.
Purpose/importance To know if intervention programmes have a positive effect on educator content subject knowledge, and thereby to improve the quality of teaching andlearning.
Policy linked to Integrated Strategic Planning Framework for Teacher Education and Development;ELRC resolutions; andSkills Development Policy
Source/collection of data Pre and Post-training assessments completed by identified teachers attending the training programmes
Means of verification Pre and post-training assessment reports.List/summary of results on assessments per training programme/session.
Method of calculation Numerator: total number of identified teachers who obtained 80% and above in post training assessment.Denominator: total number of identified teachers who completed the post training assessmentMultiply by 100

Page 184 of 208
New MTSF aligned PPM
Indicator title PPI 2.5: percentage of FunzaLushaka bursary holders placed in schools within six months upon completion of studies or upon confirmation that the bursarhas completed studies.
Short definition Measure the number of FunzaLushaka bursary holders appointed by schools, in the province in question, within six months of completion of studies.“Placed” is defined as: securing appointment at a school in a permanent capacity.Note: based on the allocated provincial listPEDs should report in the academic year
Purpose/importance The basic education sector continues to experience problems attracting enough young and appropriately skilled people.The FunzaLushaka Bursary scheme is used to ensure that young people study towards an educator qualification aimed at scarce skills within the sector.These new entrants need to be absorbed in schools in provinces according to the requirements of the bursary scheme.
Policy linked to NDP; andFunzaLushaka Policy
Source/collection of data Human Resource Directorate – PERSALMeans of verification PERSAL; and
Data base of FunzaLushaka bursary holdersMethod of calculation Numerator: total number of FunzaLushaka bursary holders placed in schools within 6 months
Denominator: total number of eligible (based on time of qualification), qualified FunzaLushaka bursary graduatesMultiply by 100
Data limitations Placement of graduates in other provinces impacts on the provision of comprehensive provincial data; andAdequate data not readily available to track the placement of FunzaLushaka bursars.
Type of indicator OutputCalculation type Non - cumulativeReporting cycle AnnualNew indicator YesDesired performance All FunzaLushaka bursary holders with the right qualifications and skills to be appointed in schools.Indicator responsibility Directorate: Human Resource Administration
Data limitations Teachers not always willing to complete pre-and post-training assessments andThe indicator applies only to teachers with identified needs.
Type of indicator InputCalculation type Non-cumulativeReporting cycle AnnualNew indicator YesDesired performance That the subject knowledge of teachers, on a particular topic in the curriculum, increases after training.Indicator responsibility Curriculum Management and Delivery

Page 185 of 208
New MTSF aligned PPM
Indicator title PPI 2.6: Number of qualified Grade R-12 teachers aged 30 and below, entering the public service as teachers for the first time during the financial year.Short definition The number of qualified teachers, aged 30 and below, being permanently/temporarily employed for the first time as teachers.Purpose/importance To ensure that young teachers are entering the workforce.Policy linked to School Post Provisioning Norms;
Educators Employment Act (EEA); andPersonnel Administration Measure (PAM)
Source/collection of data PERSALMeans of verification PERSAL data/InformationMethod of calculation Count the total number of educators in schools who are registered in the PERSAL system that are below 30 years of age and are first time
permanently/temporarily employed during the period under review. If an annual target is reflected for a particular quarter, then the output reported for thatquarter will be used as the annual output.
Data limitations NoneType of indicator InputCalculation type Non-cumulativeReporting cycle AnnualNew indicator YesDesired performance The Department needs to ensure that a stream of young teachers enters the profession.Indicator responsibility Directorate: Human Resource Administration
New MTSF aligned PPM
Indicator title PPI 2.7: Percentage of learners who are in classes with no more than 45 learners.Short definition The total number of public schools learners who are in classes with less than or equal to 45 learners expressed as a percentage.
“Classes” are defined as “Register Class”.This excludes Special SchoolsPurpose/importance To determine the extent of overcrowding in the classroomsPolicy linked to South African Schools Act (SASA);
School Post Provisioning Norms;Employment of Educators Act (EEA);Personnel Administration Measure (PAM); andInfrastructure Norms and Standards.
Source/collection of data Provincial data warehouseMeans of verification Class lists of registered classes
Signed off declaration by Principal (manual/electronic)Method of calculation Numerator: total number of learners in register class size of less than or equal to 45 learners.
Denominator: total learner enrolment in public schools.

Page 186 of 208
Multiply by 100Data limitations The data may not be current/up to dateType of indicator OutputCalculation type Non-cumulativeReporting cycle AnnualNew indicator YesDesired performance To prevent overcrowding and to provide adequate classroom space.Indicator responsibility Directorates: EMIS (Provinces may insert the more relevant Responsibility Manager)
New MTSF aligned PPM
Indicator title PPI 2.8: Percentage of schools where allocated teaching posts are all filledShort definition The total number of schools where allocated teaching posts are all filled expressed as percentage of all schools.
“Filled” is defined as having a permanent/temporary teacher appointed in the post.In the context of education temporary appointments are very much an inherent part of the appointment process.
Purpose/importance To ensure that the availability and utilisation of teachers are such that there is a teacher in every class at all times.Policy linked to Post Provisioning NormsSource/collection of data Post provisioning database; and
PERSALMeans of verification PERSAL data;
Post provisioning database; andStaff establishment of schools
Method of calculation Numerator: total number of schools that have filled all their posts in accordance with their post provisioning norms allocationDenominator: total number of schools that received post provisioning norms allocationMultiply by 100
Data limitations NoneType of indicator InputCalculation type Non-cumulativeReporting cycle AnnualNew indicator YesDesired performance To ensure that all posts allocated are filled.Indicator responsibility Directorate: Human Resource Administration
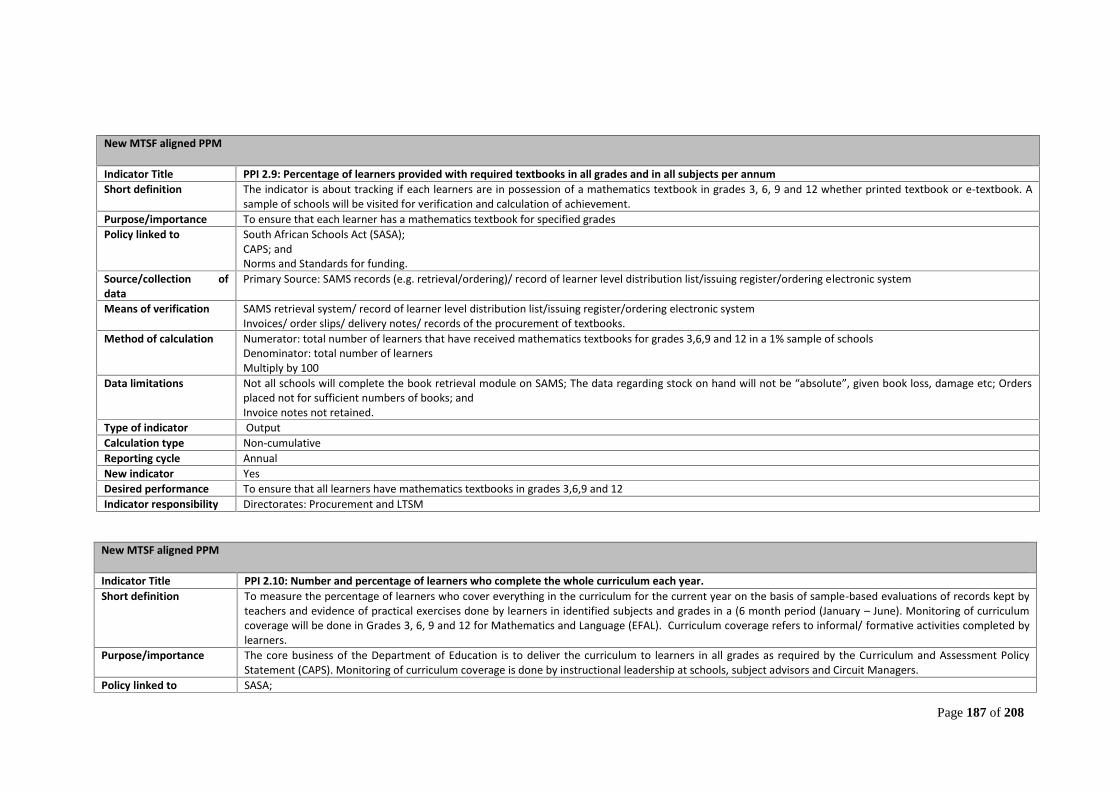
Page 187 of 208
New MTSF aligned PPM
Indicator Title PPI 2.10: Number and percentage of learners who complete the whole curriculum each year.Short definition To measure the percentage of learners who cover everything in the curriculum for the current year on the basis of sample-based evaluations of records kept by
teachers and evidence of practical exercises done by learners in identified subjects and grades in a (6 month period (January – June). Monitoring of curriculumcoverage will be done in Grades 3, 6, 9 and 12 for Mathematics and Language (EFAL). Curriculum coverage refers to informal/ formative activities completed bylearners.
Purpose/importance The core business of the Department of Education is to deliver the curriculum to learners in all grades as required by the Curriculum and Assessment PolicyStatement (CAPS). Monitoring of curriculum coverage is done by instructional leadership at schools, subject advisors and Circuit Managers.
Policy linked to SASA;
New MTSF aligned PPM
Indicator Title PPI 2.9: Percentage of learners provided with required textbooks in all grades and in all subjects per annumShort definition The indicator is about tracking if each learners are in possession of a mathematics textbook in grades 3, 6, 9 and 12 whether printed textbook or e-textbook. A
sample of schools will be visited for verification and calculation of achievement.Purpose/importance To ensure that each learner has a mathematics textbook for specified gradesPolicy linked to South African Schools Act (SASA);
CAPS; andNorms and Standards for funding.
Source/collection ofdata
Primary Source: SAMS records (e.g. retrieval/ordering)/ record of learner level distribution list/issuing register/ordering electronic system
Means of verification SAMS retrieval system/ record of learner level distribution list/issuing register/ordering electronic systemInvoices/ order slips/ delivery notes/ records of the procurement of textbooks.
Method of calculation Numerator: total number of learners that have received mathematics textbooks for grades 3,6,9 and 12 in a 1% sample of schoolsDenominator: total number of learnersMultiply by 100
Data limitations Not all schools will complete the book retrieval module on SAMS; The data regarding stock on hand will not be “absolute”, given book loss, damage etc; Ordersplaced not for sufficient numbers of books; andInvoice notes not retained.
Type of indicator OutputCalculation type Non-cumulativeReporting cycle AnnualNew indicator YesDesired performance To ensure that all learners have mathematics textbooks in grades 3,6,9 and 12Indicator responsibility Directorates: Procurement and LTSM

Page 188 of 208
MTSF; andCAPS
Source/collection of data Primary Source: Completed standardised instruments/ data collection tools.Secondary Source: Consolidated Excel curriculum coverage sheet
Means of verification Completed and stamped standardized data collection tools administered as per guidelines.Consolidated Excel curriculum coverage sheet;Data collection tools to be signed off by the provincial / district official and principal.(This involves looking at both the completed tools and the excel database to check that the capturing of the data from the database was done correctly).
Method of calculation 60 schools to be selected randomly per province. Focus on Mathematics and EFAL (if no EFAL, only focus on Mathematics). Administer standardised datacollection tools through observingidentified learner books (homework/classwork exercises/informal tests). Monitors should request 5 books of strongestlearners, selecting one book for in-depth analysis and 4 for verification purposes).Capture results of all 60 schools on template provided. Provide completed Excel curriculum coverage sheet to DBE for calculation of the overall number and % oflearners.
Data limitations Unreliable flow of dataType of indicator OutputCalculation type Non-cumulativeReporting cycle AnnualNew indicator YesDesired performance All schools have covered the curriculum in Grade 3, 6,9 and 12 for Mathematics and EFAL as required by CAPSIndicator responsibility Directorate: Curriculum Management and Delivery
New MTSF aligned PPM
Indicator Title PPI 2.11: Percentage of schools producing a minimum set of management documents at a required standard.Short definition This indicator measures the extent to which all schools adhere to good management practice by ensuring that the following minimum set of management
documents are produced at the required standard, which means in line with the templates provided.The documents are: School Budget, School Improvement Plan, Annual Academic Performance Report, attendance registers for educators and learners, Recordsof learner marks.
Purpose/importance SASA and other educational policies prescribe certain management documents to be available and implemented at schools and are managed at least at aminimum standard across the country (templates provided).
Policy linked to SASA;Whole School Evaluation Policy 2001;School Policy on Learner Attendance; andSchool Policy on Educator Attendance
Source/collection of data Completed survey tool in the form of achecklist; and

Page 189 of 208
New MTSF aligned PPM
Indicator Title PPI 2.12: Percentage of SGBs in sampled schools that meet minimum criteria in terms of effectiveness every year.Short definition The percentage of sampled schools where the School Governing Body (SGB) meets the minimum criteria in terms of effectiveness, i.e. where there is an elected
SGB, a Constitution of the SGB in terms of membership, at least one SGB meeting per quarter was held and there was a parents meeting where the budget wastabled (evidenced by attendance registers and minutes of meetings).
Purpose/importance To ensure that all schools comply with the legislations and regulations that directs the functionality of School Governing Bodies towards parental involvement ineducation.
Policy linked to The Constitution of the RSA Act;SASA (Section 20, 21, 34 – 44);Whole School Evaluation Policy 2001; andPromotion of Access to Information Act.
Source/collection of data Sample survey tool in the form of questionnaire/checklist.Means of verification The survey tool signed off by the official and the principal or representative.Method of calculation Numerator: total number of schools sampled in which the SGB meets the minimum criteria in terms of effectiveness (as defined above)
Denominator: total number of sampled schoolsMultiply by 100
Data limitations NoneType of indicator OutputCalculation type Non-cumulativeReporting cycle AnnualNew indicator YesDesired performance All schools have functional and effective SGB structures.Indicator responsibility IGSS
List of schools with minimum set of managementdocumentsMeans of verification Monitoring tools and/or reports.Method of calculation Numerator: total number of Public ordinary schools with all identified management documents available
Denominator: total number of all Public ordinary schoolsMultiply by 100
Data limitations NoneType of indicator OutputCalculation type Non-cumulativeReporting cycle AnnualNew indicator YesDesired performance All schools must be able to produce minimum management documentsIndicator responsibility IGSS

Page 190 of 208
New MTSF aligned PPM
Indicator title PPI 2.13: Percentage of schools with more than one financial responsibility on the basis of assessment.Short definition This indicator measures the total number of schools with more than one financial management function expressed as a percentage of the total number of
schools.Note: Section 21 A, B, C
Purpose/importance To enable schools to operate autonomously.Policy linked to Amended National Norms and Standards for School Funding/ adequacy allocation for learners / PFMA / SASASource/collection of data School Funding Norms and Standards databaseMeans of verification Budget transfer documents (these documents list schools, number of learners, budget allocation and the functions allocated).Method of calculation Numerator: number of ordinary public schools that are given more than one financial management function as per Section 21 of SASA
Denominator: total number of ordinary public schoolsMultiply by 100
Data limitations NoneType of indicator OutputCalculation type Non-cumulativeReporting cycle AnnualNew indicator YesDesired performance All qualifying schools given the full set of financial management functionsIndicator responsibility FMS
New MTSF aligned PPM
Indicator title PPI 2.14: Percentage of learners in schools that are funded at a minimum level.Short definition This indicator measures the total number of learners funded at a minimum level expressed as a percentage of the total number of learners in ordinary public
schools.Purpose/importance To improve access to education.Policy linked to Amended National Norms and Standards for School Funding /adequacy allocation for learners.Source/collection of data School Funding Norms and Standards database.Means of verification Budget transfer documents (these documents list schools, number of learners and budget allocation per learner).Method of calculation Numerator: total number of learners enrolled at ordinary public schools that received their subsidies at or above the nationally determined per-learner
adequacy amountDenominator: total number of learners enrolled in ordinary public schoolsMultiply by 100.
Data limitations NoneType of indicator OutputCalculation type Non-cumulativeReporting cycle Annual

Page 191 of 208
New indicator YesDesired performance All qualifying schools to be funded according to the minimum standards for public school funding.Indicator responsibility FMS
Indicator title PPI 2.15: Percentage of targeted Public Ordinary schools that received their stationery in JanuaryShort definition On-time stationery delivery to (primary and secondary) schoolsPurpose/importance Delivery of planned stationery orders to schools within a specified periodPolicy linked to LTSM policySource/collection of data Stationery Ordering Management System (e-LTSM)Means of verification Stationery reconciled delivery register/notes
List of schools that received stationeryMethod of calculation Numerator : number of schools that received stationeries
Denominator: total number of public schools multiply by 100.Data limitations No limitationsType of indicator OutputCalculation type Non-cumulativeReporting cycle AnnualNew indicator NoDesired performance To ensure that learners can use stationery in the first month of the academic yearIndicator responsibility Chief Director: FMS
Indicator title PPI 2.16: Percentage of targeted Public Ordinary schools that received their textbooks in JanuaryShort definition On-time textbooks delivery to (primary and secondary) schools. Targeted means schools that have ordered textbooksPurpose/importance Delivery of planned textbooks orders to schools within a specified periodPolicy linked to LTSM policySource/collection of data Book Ordering Management System (e-LTSM)Means of verification Textbooks reconciled delivery register/notes
List of schools that received textbooksMethod of calculation Numerator: number of schools that received textbooks
Denominators: the total number of targeted schoolsmultiply by 100
Data limitations Late delivery of textbooks by the publishersType of indicator OutputCalculation type Non-cumulativeReporting cycle AnnualNew indicator NoDesired performance To ensure that learners can use textbooks in the first month of the academic year

Page 192 of 208
Indicator title PPI 2.16: Percentage of targeted Public Ordinary schools that received their textbooks in JanuaryIndicator responsibility Chief Director: FMS
Indicator title PPI 2.17: Number of workbooks procured for top upShort definition On-time workbooks delivery to Grade R to Grade 9 learners. Targeted means schools that have identified shortages and are included in the Consolidated
Districts` requests.Purpose/importance Delivery of identified workbooks to schools within a specified periodPolicy linked to LTSM policySource/collection of data Consolidated Requests by districtsMeans of verification Workbooks reconciled delivery register/notes
List of schools that received workbooksMethod of calculation Count the number of workbooks procured for top upData limitations Late delivery of workbooks by the Service Provider – LebonelithoType of indicator OutputCalculation type Non-cumulativeReporting cycle AnnualNew indicator YesDesired performance To ensure that learners can use workbooks in the first month of the academic yearIndicator responsibility Chief Director: FMS
Indicator title PPI 2.18:Number of schools provided with extra support for the achievement of safety measuresShort definition To operationalize (to put into work) the National School Safety Framework (NSSF) and ensure Safety compliance in targeted schools by implementing
strategies for crime and violence prevention.Targeted schools are those with reported challenges including special and schools with hostelsexamples of extra support are awareness, safety boards, metal detectors and breathalyzers
Purpose/importance To ensure improved conditions in the targeted schools so that learners and teachers can operate in a safe and secure environment that is conducive toeffective learning and teaching
Policy linked to SASASource/collection of data NSSF/ List of targeted SchoolsMeans of verification School safety Plan
Monitoring toolList of targeted schools provided with extra support for the achievement of safety measures
Method of calculation CountData limitations No data limitationsType of indicator OutputCalculation type Non- cumulativeReporting cycle Annual

Page 193 of 208
Indicator title PPI 2.18:Number of schools provided with extra support for the achievement of safety measuresNew indicator NoDesired performance To ensure that the targeted schools are supported to improve safety in schoolsIndicator responsibility IGD&LSSS Directorate
Indicator title PPI 2.19: Number of school based educators trained on other interventions excluding Mathematics (PPM 209) and Languages (PPM 208) content trainingShort definition Teacher training and development is one of the top priorities in South African education as guided and supported by the Integrated Strategic Planning
Framework for Teacher Education and Development National Policy framework on teacher Education and development and National Development Plan.Teachers are encouraged to work together in Professional Learning communities to achieve better quality education. The Continuing Professional TeacherDevelopment activities are then put together into Teacher Development Plan which is informed by National and Provincial Priorities.
Purpose/importance Capacity building of educators on ICT, school management and inclusive education excluding PPM 208 and PPM 209Policy linked to National Policy Framework on Teacher Education and DevelopmentSource/collection of data Teacher development planMeans of verification Signed Attendance Registers of programmes rolled out.Method of calculation Count The number of educators trained on other interventions excluding Mathematics (PPM 208)and Languages (PPM 209)Data limitations AbsenteeismType of indicator OutputCalculation type CumulativeReporting cycle QuarterlyNew indicator NoDesired performance Capacity building on teachers to impact on learners performanceIndicator responsibility Directorate: PEDS
Indicator title PPI 2.20: Number of school based administrative employees trainedShort definition Provide knowledge and skills to Administrative Assistants (AA) and General Assistant (GA) in schools
School based administrative employees refers to AA and GA.Purpose/importance Up skilling of administrative competencies and skills. Improvement of administration competencies to enable efficient and effective school administrationPolicy linked to Skills Development Act and National Development Strategy IIISource/collection of data Districts and Corporate priority training needs submissions, mandatory programs from the Department of Public Service and Administration, Training Schedule
and Annexure 2Means of verification Signed Programme Attendance RegistersMethod of calculation Count the number of school based administrative employees trainedData limitations AbsenteeismType of indicator OutputCalculation type CumulativeReporting cycle QuarterlyNew indicator No

Page 194 of 208
Indicator title PPI 2.20: Number of school based administrative employees trainedDesired performance Improved individual competencies and school administrationIndicator responsibility Directorate: Human Resources Utilisation and Development
Indicator title PPI 2.21: Number of new bursaries awarded to school based employees (excluding reinstatements)Short definition New bursaries awarded for the first time for upskilling of school based employee in teaching, management and administrative competenciesPurpose/importance Up-skilling of school-based employees in occupational , management and leadership competencies
Improvement of school administration, management and leadership capacity to contribute towards effective and efficient implementation of the DepartmentalStrategic Plan
Policy linked to Skills Development Act and National Development Strategy IIISource/collection of data Bursary applicationsMeans of verification Signed Bursary Agreement FormsMethod of calculation Count the number of new bursaries awarded to school based employees (excludes reinstatements)Data limitations Bursary Agreements not submitted on timeType of indicator OutputCalculation type Non-cumulativeReporting cycle AnnualNew indicator NoDesired performance Improved individual competencies and school administrationIndicator responsibility Directorate: Human Resource Utilisation and Development
Indicator title PPI 2.22: Percentage of women in Principalship postsShort definition Considering the number of women already appointed and the difference between the numbers of men and women appointed. A proportional ratio and
percentage of men and women appointed in Principalship posts to be used in re-in fencing posts for the appointment of women in advertised posts on arevolving pattern until the 50% National target is reached.
Purpose/importance Advancing the employment of women in principal positions institution levelPolicy linked to Employment Equity PlanSource/collection of data PERSALMeans of verification PERSAL data/Information/ Completed HR forms for appointment(HR7, HR8, HR11 and HR13)Method of calculation Numerator :Total women appointed in Principalship posts
Denominator: Total number of Principalship posts advertised Multiply by 100Data limitations No specific data limitationsReporting cycle AnnualDesired performance National target is 50%Indicator responsibility Directorate: HRM

Page 195 of 208
Indicator title PPI 2.23: Number learners provided with sanitary towelsShort definition Provision of sanitary towels to deserving girl learners in special schools and farm schools (including Mega farm schools)Purpose/importance To ensure that learners do not miss school during their menstrual cyclePolicy linked to SASASource/collection of data Distribution listMeans of verification Signed sanitary towels delivery note
Signed distribution list (for learners who received sanitary towels)Method of calculation Count the number learners provided with sanitary towelsData limitations Late delivery of materials by the suppliersType of indicator InputCalculation type Non-cumulativeReporting cycle AnnualNew indicator YesDesired performance Regular attendanceIndicator responsibility Directorate: LSSS
Indicator title PPI 2.24: Number of learners who benefit from learner transportShort definition The total number of learners who travel 5km or more from their homes to school who benefit from learner transport.
According to Learner Transport Policy, the 5km is a single trip.Purpose/importance To ensure that identified learners have access to schools and eliminate barriers to educationPolicy linked to Learner Transport PolicySource/collection of data Learner Transport databaseMeans of verification The list of learners per school who utilises transport servicesMethod of calculation Count all learners that are benefiting from Learner Transport ProgrammeData limitations Poor monitoring by schools. Not all learners who require learner transport are recorded.Type of indicator OutputCalculation type Non-cumulativeReporting cycle AnnualNew indicator YesDesired performance To ensure that learner transport is provided to all qualifying learners who walk over 5 kilometres (single trip) to the nearest school.Indicator responsibility Directorate : LSSS
Indicator title PPI 2.25: Number of learners with special education needs identified in public ordinary schoolsShort definition Learners with special education needs are learners with moderate disabilities in public ordinary schools. (Moderate disabilities refer to disabilities that require
low levels of support that can be provided by teachers in mainstream schools. These include Mild to moderate intellectual difficulties, Attention Disorders,Epilepsy etc.)
Purpose/importance To measure access to education for special needs children.

Page 196 of 208
Policy linked to White Paper 6Source/collection of data EMIS databaseMeans of verification List of learners derived from EMIS data
List of learners with special education needs in public ordinary schoolsMethod of calculation Count the total number of learners with special education needs enrolled in public ordinary schoolsData limitations NoneType of indicator OutputCalculation type Non-cumulativeReporting cycle AnnualNew indicator YesDesired performance To ensure that all learners with moderate education needs of school going age attend schoolsIndicator responsibility Directorate : LSSS
Indicator title PPI 2.26: Number of events supported by school enrichment programmesShort definition To use school enrichment programmes (sports, arts, culture, race and values) and to turn public schools into stable, functional and vibrant institutions of learningPurpose/importance To address social dysfunctionality, instability and parity among youth and learners which impact negatively on the overall academic resultsPolicy linked to SASASource/collection of data List of events supportedMeans of verification Purchase order
invoicesSigned attendance registersClose up reports
Method of calculation Countthe number of events supported by school enrichment programmeData limitations No data limitationsType of indicator OutputCalculation type CumulativeReporting cycle QuarterlyNew indicator NoDesired performance To ensure that enrichment programmes are executed in schoolsIndicator responsibility Development: Directorate

Page 197 of 208
PROGRAMME 4: PUBLIC SPECIAL SCHOOLS EDUCATION
Indicator title PPI 4.1: Number of Special Schools provided with assistive devicesShort definition Provision of assistive devices to special schoolsPurpose/importance To make Special Schools accessible by providing assistive devices for learners with special needsPolicy linked to White paper 6Source/collection of data List of special schoolsMeans of verification Transfer payment report
List of schools that received approved Assistive DevicesSigned delivery notes
Method of calculation Count the number of Special Schools provided with assistive devicesData limitations No limitationsType of indicator OutputCalculation type Non-cumulativeReporting cycle AnnualNew indicator NoDesired performance To ensure that all special schools are provided with assistive devicesIndicator responsibility LSSS: Directorate
Indicator title PPI 4.2: Number of special schoolsShort definition Total number of special schools built to accommodate learners with special educational needs.Purpose/importance To measure the expansion of the provision of special schools educationPolicy linked to White Paper 6Source/collection of data NEIMS/ Infrastructure database/EMIS Master list/EMIS (10th day stats)Means of verification Completion CertificateMethod of calculation Count the total number of special schoolsData limitations NoneReporting cycle AnnualDesired performance To ensure that all learners with special needs have access to quality educationIndicator responsibility Directorate: LSSS

Page 198 of 208
PROGRAMME 5: EARLY CHILDHOOD DEVELOPMENT
Indicator title PPI 5.1: Number of Grade R schools provided with resources(include animated toys)Short definition Provision of Grade R resources such as indoor and outdoor play equipment to public primary schools.
Outdoor equipment refers to, amongst others, jungle gym, slide and swing.Indoor equipment refers to, amongst others, tables and chairs for learners as well as educational toys.
Purpose/importance Ensure availability of resources for Grade R learnersPolicy linked to SASA,NDPSource/collection of data List of Grade R schools
Means of verification Lists of schoolsDelivery notes
Method of calculation Count the number of Grade R schools provided with resourcesData limitations Delay in submission of list of schoolsType of indicator OutputCalculation type CumulativeReporting cycle AnnuallyNew indicator NoDesired performance Improve access to schoolsIndicator responsibility Director: Curriculum Development Services
Indicator title PPI 4.3: Number of learners in special schools provided with assistive devicesShort definition Learners have access to personal assistive devices to promote independent living and curriculum supportPurpose/importance To provide assistive device to learners with barriers to learningPolicy linked to White Paper 6Source/collection of data Inclusive Education DatabaseMeans of verification Number of learners in public special schools provided with assistive devices.Method of calculation Count the number of learners provided with assistive devicesData limitations NoneReporting cycle AnnualDesired performance To ensure that learners in need of assistive devices are accommodated to improve their quality of learning.Indicator responsibility Directorate: LSSS

Page 199 of 208
Indicator title PPI 5.2: Number of Grade R educators trainedShort definition Empowerment and monitoring of Grade R educatorsPurpose/importance Ensure availability of skilled Grade R educatorsPolicy linked to SASA,CAPSSource/collection of data List of Grade R educatorsMeans of verification Monitoring report
Signed Attendance registerMethod of calculation Count the number of Grade R educators trainedData limitations No limitationsReporting cycle AnnualType of indicator OutputCalculation type CumulativeNew indicator NoDesired performance Improved performance of Grade R educatorsIndicator responsibility Director: Curriculum Development Services
Indicator title PPI 5.3: Number of practitioners trained on NQF 4 and aboveShort definition Empowerment of practitioners ( Pre-Grade R facilitators)Purpose/importance Ensure availability of skilled Pre-Grade R practitionersPolicy linked to SASA, White Paper 5,NDPSource/collection of data List of practitionersMeans of verification Signed Attendance register
Proof of registration : learner registration formMethod of calculation Count the number of practitioners trained on NQF 4 and NQF 5Data limitations No limitationsReporting cycle AnnualType of indicator OutputCalculation type CumulativeNew indicator NoDesired performance Improved performance of educatorsIndicator responsibility Director: Curriculum Development Services

Page 200 of 208
PROGRAMME 6: INFRASTRUCTURE DEVELOPMENT
Indicator title PPI 6.1: Number of special schools upgradedShort definition Upgrading of special schools
“Upgrade” (Extensions, additions) means comprehensive capital works that increases the value of the asset and extend the area or add new functionality ofthe asset.
Purpose/importance Providing physical access at schools for learners with special needsPolicy linked to SASASource/collection of data Table B5Means of verification Practical completion certificateMethod of calculation Countthe number of special schools upgradedData limitations No limitationsReporting cycle AnnualType of indicator OutputCalculation type CumulativeNew indicator NoDesired performance Improved access to schoolsIndicator responsibility Director: Infrastructure
Indicator title PPI 6.2: Number of existing Public Ordinary Schools converted into full service schoolsShort definition Full-service schools: are public ordinary schools that are specially resourced, converted and orientated to provide quality education to all learners by
supplying the full range of learning needs in an equitable manner. These schools serve mainstream learners together with those experiencing moderatelearning barriers.By converted it means the infrastructure, school building and classrooms must be accessible to all learners and teachers. This may differ from school toschool according to needs and to the possibilities for conversion at a particular school.
Purpose/importance Increase the number of public ordinary schools that provide full services (Full services schools complying with learner with moderate disabilities, such asprovision of ramps, compliant sanitation services (paraplegic)Moderate disabilities refer to disabilities that require low levels of support that can be provided by teachers in mainstream schools.
Policy linked to SASASource/collection of data Table B5Means of verification Practical completion certificateMethod of calculation Count the number of existing Public Ordinary Schools converted into full service schoolsData limitations Non- performance by the contractorReporting cycle Annual
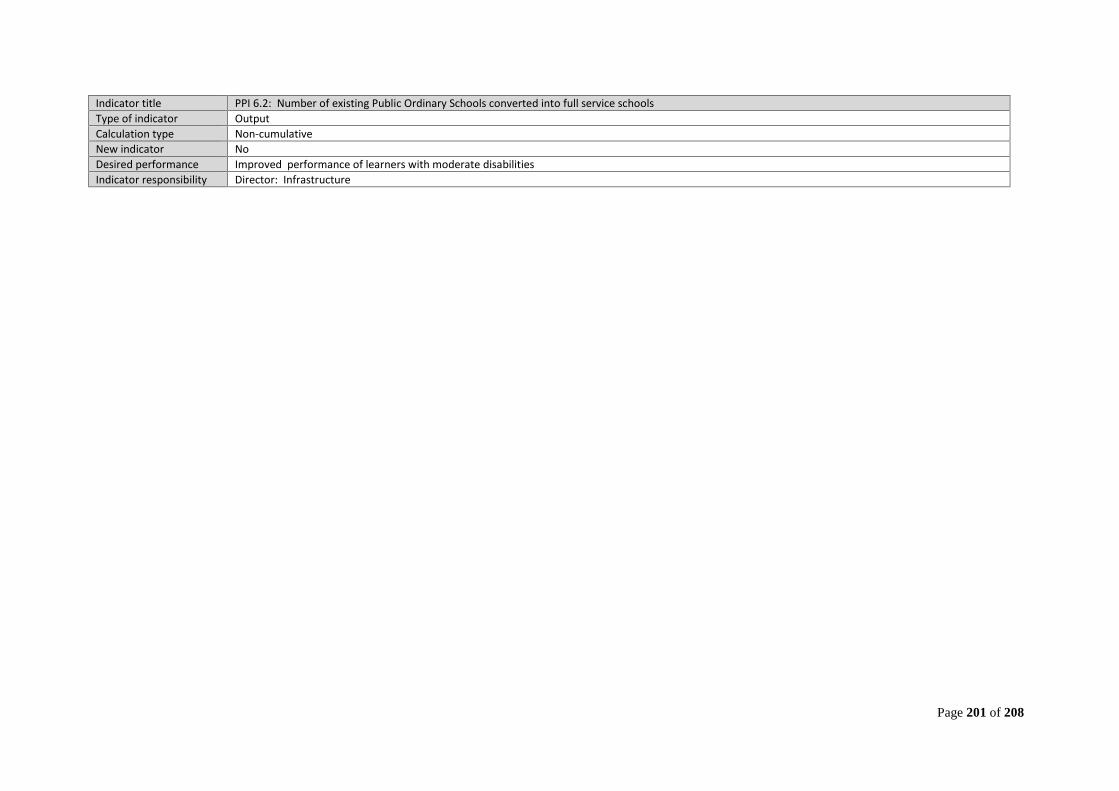
Page 201 of 208
Indicator title PPI 6.2: Number of existing Public Ordinary Schools converted into full service schoolsType of indicator OutputCalculation type Non-cumulativeNew indicator NoDesired performance Improved performance of learners with moderate disabilitiesIndicator responsibility Director: Infrastructure

Page 202 of 208
ANNEXURE 3: INDICATORS NOT APPLICABLE IN 2019/20INDICATOR NUMBER INDICATOR TITLE REASON FOR NOT APPLICABLE
PPM 503 Number and percentage of Grade R practitioners withNQF level 6 and above qualification each year
The department will be up-scaling training to level 5 in 2018/19 and level 6 in 2019/20
PPM 601 Number of public ordinary schools provided with watersupply
All schools have been provided with water
PPM 602 Number of public ordinary schools provided withelectricity supply
All schools have been provided with electricity
PPM 609 Number of hostels built No hostel will be finalized in 2018/19PPI 6.1 Number of special schools upgraded No special schools will be upgraded in 2019/20PPI 6.2 Number of existing public ordinary schools converted
into full services schoolNo existing public ordinary schools will be converted into full service schools in 2019/20

Page 203 of 208
ANNEXURE 4: AMENDMENTS TO THE ANNUAL PERFORMANCE PLANPROGRAMME INDICATOR PREVIOUS 2018/19 REVISED 2019/20 REASON
1 1.2.9 The indicator was not part of the APP Percentage of invoices paid within 30 days Government priority/commitment
2 2.8 Number of schools provided with cleaning materials Removed Not affordable
2 2.10 Number of schools provided with smart boards Removed Not affordable
2 2.11 Number of vacant teaching post Removed Moved to statistical table
2 2.12 Number of educators employed in public ordinaryschools
Removed Moved to statistical table
22.13
Number of non-educators employed in publicordinary schools
Removed Moved to statistical table
2 2.17 Number of learners enrolled in public ordinaryschools
Removed Moved to statistical table
2 2.24 Number of schools provided with E-Beam Removed Not affordable
4 4.2 Number of educators employed in public specialschools
Removed Moved to statistical table
4 4.3 Number non-professional and non-educator staffemployed in public special schools
Removed Moved to statistical table
4 4.6 Number of schools where SHE bins are maintained Removed Not affordable/practical
5 5.4 Number of learners enrolled in Grade R in publicschools
Removed Moved to statistical table
5 5.5 Number of learners in Grade R in RegisteredIndependent Schools
Removed Moved to statistical table
8 ALL Programme 8 : Sport and Recreation Removed New configuration of Department
8 GOAL 3 Create, promote and develop sustainable SportDevelopment Programmes
Removed New configuration of Department

Page 204 of 208
ANNEXURE 5: SONA AND SOPA PRONOUNCEMENTS
1. SONA PERFORMANCE INDICATORS COVERED BY THE APP
SONA Performance Indicator covered by the APP PPM/I
1. Accessible early childhood education to children PPM 501 & 503, PPI 5.12. Eradicate unsafe and inappropriate sanitation facilities within the next three years PPM 6033. Number of schools provided with extra support for the achievement of safety
measuresPPI 2.18
4. Number of public schools that offer Grade R PPM 5015. Number of public ordinary schools supplied with sanitary facilities PPI 2.236. Number of schools provided with connectivity PPM 102 & PPI 1.2.27. Physical infrastructure projects:
o upgrade : PPM 604 & 610o replacement of unsafe buildings: PPM 607o building of laboratories: PPM 605o Libraries: PPM 605o administration blocks: PPM 605o nutrition centres, PPM 605o Grade R classrooms in schools: PPM 608
8. Fast track the handing over of completed school building projects to the concernedcommunities across the province in the next financial year:
PPM 606
9. Strengthen the basic education system by empowering school leadership teams,improving the capabilities of teachers and ensuring a more consistent measurement ofprogress for grades 3, 6 and 9.
PPI 2.12

Page 205 of 208
2. NEW SONA PERFORMANCE INDICATORS
New SONA Performance IndicatorMedium-term targets
2019/20 2020/21 2021/22 Notes
1. Number of learners provided with digital workbooks 0 0 0 No capacity2. Number educators trained to respond to :
the internet of things, 0 0 0 No budget
robotics and 0 0 0 No budgetartificial intelligence 0 0 0 No budget
3. Number of learners trained to respond to:the internet of things, 0 0 0 No budgetrobotics and 0 0 0 No budgetartificial intelligence 0 0 0 No budget
4. Number of schools provided with reading resource packages atfoundation phase
0 0 0 No capacity
5. Number of digitised textbooks provided for high enrolmentsubjects across all grades
0 0 0 No capacity
6. Number of Technical high schools where new technical subjectshave been introduced
0 0 0 No budget
7. Number of ECD centres transferred from DSD to the NWDOBSD 0 0 0 No Policy / Model

Page 206 of 208
3. NEW SOPA PERFORMANCE INDICATORS
New SOPA Performance IndicatorMedium-term targets
2019/20 2020/21 2021/22 Comments
1 Eradicate unsafe pit toilets in 104 schools in the province. 104 0 0 N/A2 Teachers in the 100 schools that received tablets will receive
training on Modular Object Oriented Dynamic LearningEnvironment (MOODLE) management in learning and support.
100 0 0 N/A
3 Hundred (100) more schools participating in the MST grant willreceive 20 tablets each for the current financial year.
100 0 0 N/A
4 Hold School Safety Summit. 1 0 0 N/A
4. SOPA PRONOUNCEMENTS COVERED BY THE APP
SOPA Performance Indicator Covered by the APP PPM/I
1 Number of public schools that offer Grade R PPM501
2 Number of public ordinary schools supplied with sanitary facilities PPI 2.23
3 Number of schools provided with connectivity PPM102
4 One thousand two hundred (1200) teachers; receiving on training on ICT skills toincorporate E-Learning and Digital Education Programs in Hundred (100) schoolS
PPI 2.19

Page 207 of 208
ANNEXURE 6: ACRONYMS
AET: Adult Education and Training MTEF: Medium-Term Expenditure Framework
ACE: Advanced Certificate in Education NCS: National Curriculum Statement
CEM: Council of Education Ministers NC (V): National Curriculum (Vocational)
CEMIS: Central Education Management Information System NPDE : National Professional Diploma in EducationCLC: Community Learning Centre NEPA: National Education Policy Act
CTLI: Cape Teaching and Learning Institute NGO: Non-Governmental Organisation
DHET: Department of Higher Education and Training NQF: National Qualifications Framework
DOCS : Department of Community Safety NSC: National Senior Certificate
DBE: Department of Basic Education NSNP: National School Nutrition Programme
DEMIS: District Education Management Information System OHSA: Occupational Health and Safety ActDNA: Data Not Available PALC: Public Adult Learning CentreECD: Early Childhood Development PFMA: Public Finance Management Act
ECM : Enterprise Content Management PILIR: Policy on Incapacity Leave and Ill-Health RetirementEE: Employment Equity PPI: Programme Performance Indicator
EIG: Education Infrastructure Grant PPP: Public-Private Partnership
EMIS: Education Management Information System PPM: Programme Performance Measure
EPP: Education Provisioning Plan QIDS-UP: Quality Improvement, Development, Support and Upliftment Programme
EPWP: Expanded Public Works Programme RCL: Representative Council of Learners
EWP: Employee Wellness Programme SACE: South African Council for Educators
FET: Further Education and Training SAQA: South African Qualifications Authority

Page 208 of 208
NSRP National Sport and Recreation Plan SAQMEC The Southern and Eastern Africa Consortium for Monitoring EducationalQuality
GET: General Education and Training SASA: South African Schools’ Act
HEI: Higher Education Institution SASAMS: School Administration and Management System
ICT: Information and Communication Technology SAPS: South African Police Services
IMG: Institutional Management and Governance SETA: Sector Education and Training Authority
I-SAMS: Integrated School Administration and Management System SGB: School Governing Body
IQMS: Integrated Quality Management System SITA: State Information Technology Agency
KM: Knowledge Management SMT: School Management Team
LSEN: Learners with Special Education Needs SPMDS: Staff Performance Management and Development SystemMST Mathematics,Science and Technology TIMSS Trends in International Maths and Science StudyLTSM: Learning and Teaching Support Materials WSE: Whole-School Evaluation
NWRP North West Rural Periphery

For more information:
Directorate: Strategic ManagementMr Peter Paul Kgatitsoe / Ms Pamela Rasetswane Tel.: (018) 388-1046 / 2114 • Fax: (018) 388-3430
Cell: 083 282 9117Website: www.nwdesd.gov.za