North Thorne Project Area Watershed Restoration Plan€¦ · North Thorne Project Area Watershed...
74
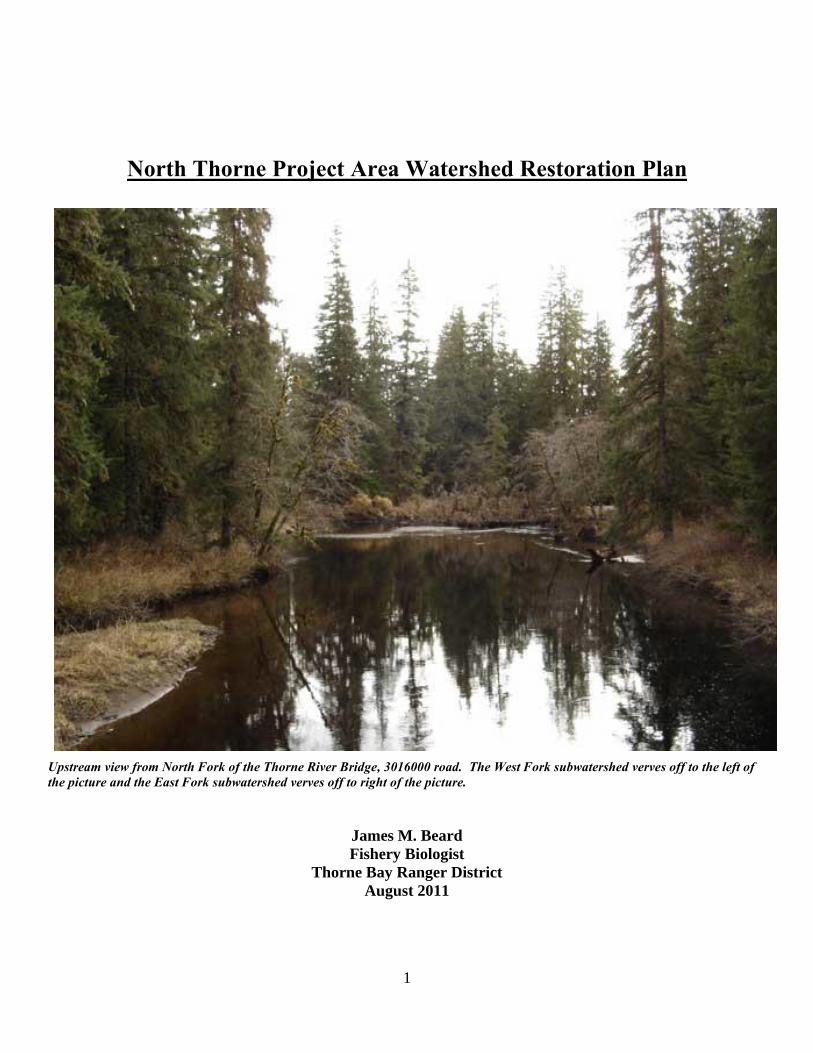
1 North Thorne Project Area Watershed Restoration Plan Upstream view from North Fork of the Thorne River Bridge, 3016000 road. The West Fork subwatershed verves off to the left of the picture and the East Fork subwatershed verves off to right of the picture. James M. Beard Fishery Biologist Thorne Bay Ranger District August 2011
Transcript of North Thorne Project Area Watershed Restoration Plan€¦ · North Thorne Project Area Watershed...
1
North Thorne Project Area Watershed Restoration Plan
Upstream view from North Fork of the Thorne River Bridge, 3016000 road. The West Fork subwatershed verves off to the left of
the picture and the East Fork subwatershed verves off to right of the picture.
James M. Beard
Fishery Biologist
Thorne Bay Ranger District
August 2011
2
Table of Contents
EXECUTIVE SUMMARY....................................................................................................................................................................... 4
WATERSHED CHARACTERISTICS AND CONDITIONS ........................................................................................................................... 6
Project Area Watersheds .................................................................................................................................................................. 8 Hydrologic Units ............................................................................................................................................................................... 8 Ecological Subsection ....................................................................................................................................................................... 9 Climate ........................................................................................................................................................................................... 10 Air Temperature ............................................................................................................................................................................. 11 Geology........................................................................................................................................................................................... 11 Soils................................................................................................................................................................................................. 13 Vegetation ...................................................................................................................................................................................... 14 Old Growth Forest .......................................................................................................................................................................... 15 Productive Old Growth ................................................................................................................................................................... 15 Second Growth Vegetation ............................................................................................................................................................. 16 Wetlands ........................................................................................................................................................................................ 16 Value Comparison Units ................................................................................................................................................................. 18 Land Use Designations ................................................................................................................................................................... 18 Recreation ...................................................................................................................................................................................... 19 Wildlife ........................................................................................................................................................................................... 20 Fisheries .......................................................................................................................................................................................... 20 Fishery Escapement ........................................................................................................................................................................ 21 Fish Use and Catch ......................................................................................................................................................................... 23
WATERSHED CONDITIONS ............................................................................................................................................................... 25
HYDROLOGIC CONDITIONS ......................................................................................................................................................................... 25 Stream Classes ................................................................................................................................................................................ 25 Stream Process Groups ................................................................................................................................................................... 28 Beneficial Water Use ...................................................................................................................................................................... 29 Water Quality ................................................................................................................................................................................. 29 Water Chemistry ............................................................................................................................................................................. 29 Water Temperature ........................................................................................................................................................................ 33 Sediment ......................................................................................................................................................................................... 33 Sediment Risk Assessment .............................................................................................................................................................. 33
UPLANDS/HILLSLOPE CONDITION ................................................................................................................................................................ 35 Timber Harvest ............................................................................................................................................................................... 37 Roads .............................................................................................................................................................................................. 39
VALLEY/FLOODPLAIN CONDITIONS .............................................................................................................................................................. 39 Large Wood Dependent Channels .................................................................................................................................................. 39 Riparian Vegetation ........................................................................................................................................................................ 40
INCHANNEL CONDITIONS ........................................................................................................................................................................... 42 Proper Functioning Condition (PFC) Surveys ................................................................................................................................... 42 Tier II Surveys .................................................................................................................................................................................. 46 Road Condition Surveys (RCS) ......................................................................................................................................................... 47 Road Storage .................................................................................................................................................................................. 47 Fish Passage ................................................................................................................................................................................... 48 Remediated Red Pipes .................................................................................................................................................................... 51
RESTORATION GOALS, OBJECTIVES, AND OPPORTUNITIES .............................................................................................................. 53
RESTORATION GOALS ................................................................................................................................................................................ 53 RESTORATION OBJECTIVES ......................................................................................................................................................................... 54 RESTORATION OPPORTUNITIES ................................................................................................................................................................... 54
Riparian Thinning ........................................................................................................................................................................... 55 Road Storage .................................................................................................................................................................................. 57 Fish Passage ................................................................................................................................................................................... 61 Red Pipe Remediation Prioritization ............................................................................................................................................... 62
3
Instream structures ........................................................................................................................................................................ 65 PROJECT SEQUENCING .............................................................................................................................................................................. 65 PROJECT MONITORING AND EVALUATION ..................................................................................................................................................... 66
RECOMMENDATIONS ...................................................................................................................................................................... 66
LITERATURE CITED ........................................................................................................................................................................... 67
List of Figures Figure 1. Location of North Thorne Project Area on Prince of Wales Island ............................................................................................. 6 Figure 2. Names of watersheds in the North Thorne Project Area. ........................................................................................................... 8 Figure 3. Ecological subsection by watershed for the North Thorne Project Area .................................................................................. 10 Figure 4. Monthly Climate Summary for Hollis, Alaska, Station 503650, Years 1949 to 2010. Data from WRCC 2011. ........................ 11 Figure 5. Stream Class and channel type of streams, and roads located within the North Thorne Project Area. Data from USFS, Tongass National Forest GIS Coverages. .................................................................................................................................................. 27 Figure 6. Mapped landslides, areas susceptible to medium and high storm damage from wind, and location of mass movement index (MMI) hazard soils in the North Thorne Project Area. Data from USFS, Tongass National Forest GIS Coverages. ................................ 37 Figure 7. Alder dominated riparian area due to harvest of Old Growth trees up to the streambank in the upper West Fork subwatershed. Note also bedload aggregation due to lack of a stable channel. ................................................................................... 40 Figure 8. Aggregrated bedload surrounding conifers in a side channel in the upper East Fork subwatershed below the 3015640 road crossing .................................................................................................................................................................................................... 45 Figure 9. Wide width-to-depth ratio in upper East Fork subwatershed below 3015640 road crossing. ................................................. 45 Figure 10. Down-cut channel in upper East Fork subwatershed above 3015640 road crossing. ............................................................ 45 Figure 11. A remediated red pipe at 3015000 MP 0.344. Before photo (left) shows a 36 inch pipe that is perched and is installed at a steep gradient. After photo (right) shows a 96 inch pipe that has had bedload placed inside the pipe simulating a stream bottom. .. 53 Figure 12. A red pipe removed at 3015105_0.96L MP 0.038. Before photo (left) shows 36 in pipe that is crushed and buried in the road prism. After photo (right) shows downstream view of removed crossing due to proper road storage. ......................................... 53
List of Tables Table 1 Watersheds of the North Thorne Project Area, including watershed name, hydrologic unit (HU) field, HU code number, and size in acres and square miles. Data from USFS Tongass National Forest GIS Coverages. ....................................................................... 7 Table 2 Rock types, Rock Category, Rock Code, and total acres of rock type within the North Thorne Project Area. Data from USFS Tongass National Forest GIS Coverages. Rounding may adjust number totals slightly. ......................................................................... 12 Table 3. Soil map units (SMU), Soil name, Soil drainage Class, Mass Movement Index (MMI) and Percent Coverage of North Thorne Project Area. Data from USFS, Tongass National Forest GIS Coverages. ................................................................................................ 13 Table 4. Acres of forest type by watershed within the North Thorne Project Area. Other includes non-forested wetlands, lakes, rock, etc. Data from USFS, Tongass National Forest GIS Coverages. ............................................................................................................... 15 Table 5.. Productive Old Growth by volume strata and acres in the North Thorne Project Area. Data from USFS, Tongass National Forest GIS Coverages. .............................................................................................................................................................................. 16 Table 6. Distribution of Stand Development Stages in the North Thorne Project Area. Data from USFS, Tongass National Forest GIS Coverages. ................................................................................................................................................................................................ 16 Table 7. Wetland types, Wet-Hab code, and acres by watershed in the North Thorne Project Area. Data from USFS, Tongass National Forest GIS Coverages. .............................................................................................................................................................................. 17 Table 8. VCU number and acres by watershed in the North Thorne Project Area. Data from USFS, Tongass National Forest GIS Coverages. ................................................................................................................................................................................................ 18 Table 9. Land Use Designations, size (in acres), and percent of the North Thorne Project Area. Data from USFS, Tongass National Forest GIS Coverages. .............................................................................................................................................................................. 19 Table 10. Fish species use of the North Thorne Project Area streams and lakes by life stage. ............................................................... 21 Table 11. Peak escapement counts for pink salmon in the Thorne River, for selected years 2000 to 2010 (ADF&G 2011a). ................. 23 Table 12. Thorne System (streams & lakes) fishing effort and harvest by species, 1997- 2006. Data from ADF&G 2007a, ADF&G 2007b, and USFS 2008. ............................................................................................................................................................................ 24 Table 13. Miles of stream, by watershed, stream class, and stream density in the North Thorne Project Area. Data from USFS, Tongass National Forest GIS Coverages. .................................................................................................................................................. 28

4
Table 14. Miles of stream by process group and acres of lake habitat, by watershed in the North Thorne Project Area. Data from USFS, Tongass National Forest GIS Coverages. ........................................................................................................................................ 28 Table 15. Conductivity, dissolved oxygen percent and mg/l, pH, total dissolved solids ppm, and water temperature for streams within the North Thorne Project Area (NTPA). Additional data is also shown for pristine streams outside the NTPA for comparison. na=not assessed. Data from Rinella et al 2005. .................................................................................................................................................. 29 Table 16. Selected Sediment Risk Index values for watersheds in the North Thorne Project Area. Data from USFS, Tongass National Forest GIS Coverages. .............................................................................................................................................................................. 34 Table 17. Mass Movement Index (MMI) hazard soil acres, landslide acres, and landslide acres impacting streams by watershed for the North Thorne Project Area, Prince of Wales Island, Alaska. . Data from USFS, Tongass National Forest GIS Coverages. ................ 35 Table 18. Acres of Timber Harvest by decade in the North Thorne Project Area. Data from USFS, Tongass National Forest GIS Coverages. ................................................................................................................................................................................................ 38 Table 19. Acres of Timber Harvest by watershed, harvested acres less than 30 yrs old, and percentages in the North Thorne Project Area. Data from USFS, Tongass National Forest GIS Coverages. ............................................................................................................ 38 Table 20. Road Mileage and Road Density in the North Thorne Project Area. Data from USFS, Tongass National Forest GIS Coverages. ................................................................................................................................................................................................ 39 Table 21. Number of Stream Crossings by Stream Class in the Project Area. *= Data from RCS surveys; **= Data from USFS, Tongass National Forest GIS Coverages. ................................................................................................................................................................ 39 Table 22. Stand number, Year originally harvested, and approximate acres of Class I and II stream riparian thinning completed, and year thinned within the North Thorne Project Area (based on one side of stream, 100 ft wide riparian area). ...................................... 41 Table 23. Stand number, Year originally harvested, and approximate acres of Class III stream riparian thinning completed, and year thinned within the North Thorne Project Area (based on one side of stream, 100 ft wide riparian area). .............................................. 41 Table 24. Summary of proper functioning condition surveys within the North Thorne Project Area. PFC= proper functioning condition, FAR = functioning at risk, NF = not functioning........................................................................................................................................ 42 Table 25. Mean and the 25
th, 50
th, and 75
th percentiles for total LWD/m, total key pieces LWD/m, and number of pools/km for
streams on the Tongass National Forest (USFS 2007). ............................................................................................................................ 46 Table 26. Stream parameter measurements for Tier II surveys conducted on streams in the North Thorne Project Area. Data based on field surveys. Grayed cells are below the 75
th percentile for a given parameter. .............................................................................. 46
Table 27. Roads that have been currently stored in the North Thorne Project Area. ............................................................................. 47 Table 28. Number of existing Green and Red fish stream crossings (Class I and II) in the North Thorne Project Area. Data from USFS, Tongass National Forest Road Condition Survey database...................................................................................................................... 49 Table 29. Locations of red pipes impassable to various life stages of resident and anadromous fish species in the Project Area. Data from USFS, Tongass National Forest Road Condition Survey database. .................................................................................................. 49 Table 30. Remediated Red Pipes (replacement or removal for road storage) in the North Thorne Project Area. .................................. 51 Table 31. Stand number, Year originally harvested, and approximate acres of Class I and II stream riparian thinning opportunity within the North Thorne Project Area (based on one side of stream, 100 ft wide riparian area). Total riparian thinning opportunity for Class I streams is 34 acres, for Class II streams is 41 acres. ..................................................................................................................... 55 Table 32. Estimated costs for riparian thinning along Class I and Class II streams in the North Thorne Project Area. ........................... 56 Table 33. Stand number, Year originally harvested, and approximate acres of Class III stream riparian thinning opportunity within the North Thorne Project Area (based on one side of stream, 100 ft wide riparian area). ............................................................................ 56 Table 34. Estimated costs for riparian thinning along Class III streams in the North Thorne Project Area. ........................................... 57 Table 35. Road storage opportunities and priority in the North Thorne Project Area. Road storage opportunities are based on POW ATM (USFS 2009) ..................................................................................................................................................................................... 58 Table 36. Estimated costs for road storage by road segment in the North Thorne Project Area. ........................................................... 60 Table 37. Team Recommendation for remediation of red pipes impassable to various life stages of resident and anadromous fish species in the North Thorne Project Area (see also Table 26). Upstrm Hab= Upstream Habitat. ........................................................... 62 Table 38. Location, Action Proposed, Priority, and Access for instream structures in the North Thorne Project Area. .......................... 65
Executive Summary
The North Thorne Project Area is a set of highly valued and ecologically diverse watersheds located in the central
eastern portion of Prince of Wales Island, Southeast Alaska. It is around 7 miles northwest of the community of
Thorne Bay, and is 35,750 acres in size (55.7 mi2). The Project Area includes four watersheds and includes sub
watersheds. Streams within these watersheds flow into the mainstem Thorne River, which flows in an easterly
direction into Clarence Strait.
5
All of these watersheds have had past timber harvest and road construction, which began in the 1960’s. Today
the Project Area is used for recreation, subsistence, timber harvest, and other resource management. The richness
and diversity of resources in the North Thorne cause differing management objectives for the Project Area. This
assessment reports the existing condition of the watershed resources and restoration opportunities. These
opportunities are aimed at maintaining the ecological integrity and restoring the form and function of the North
Thorne Project Area.
This was the first hard look at a Project Area for restoration opportunities on the Thorne Bay Ranger District,
thus a rapid assessment approach was utilized to identify potential projects. Only 1 summer was allowed for
field work. Special areas of concern within the Project Area were identified in consultation with Jim Beard,
Fish Biologist and Steve Paustian, Tongass Forest Hydrologist, and reviewed by Ron Medel, Tongass Forest
Fish Biologist, and Ann Puffer, Alaska Regional Hydrologist.
Information used in this Watershed Restoration Plan (WRP) is a product of GIS data, field surveys and
information, reports, publications, and personal communication. Analysis and maps were developed using GIS,
with coverages updated as of June 2008.
The underlying geology, and a maritime climate that includes relatively high precipitation and wind storms,
influences landscape processes within the North Thorne Project Area. There are two ecological subsections in
the Project Area, Central Prince of Wales Volcanics which dominates the area, and a smaller portion of Central
Prince of Wales Till Lowlands (Nowacki et al. 2001). Broad U-shaped valleys are found in the Volcanics
subsection, and shallow lakes and ponds are found in the Till Lowlands subsection. Both subsections have
hemlock and hemlock-spruce forests on well-drained sites, and mixed conifers and lodgepole pine forest in
wetter areas. Elevation ranges from 100 feet above sealevel at the confluence with the Thorne River, to 2,000-3,000
feet at the upper ridges of the watersheds.
Land Use Designations (LUD’s) are defined areas of land to which specific management direction is applied
(USFS 2008). LUD’s within the Project Area include Timber Production, Modified Landscape, Scenic
Viewshed, Scenic River, Recreational River, and Old Growth. Most of these LUD’s allow timber harvest. Old
Growth makes up a small portion (< 20%) of the Project Area and is unsuitable for timber harvest.
Key problems identified in the Project Area include:
Fish passage problems at road crossings due to improper placement (vertical location, gradient) or size
of culverts.
Stream degradation (increased sediment loads, streambank stability, loss of fish spawning & rearing
habitat, stream channel complexity) due to lack of inchannel large woody debris (LWD) and past timber
harvest of riparian areas.
Alteration of riparian vegetation due to past timber harvest of riparian areas.
Sediment entering streams from roads due to road failures and erosion.
Sediment entering streams due to mass wasting (landslides) caused by past timber harvest and road
location.
Loss of hydrologic connectivity and hillslope drainage problems due to roads.
Recent restoration efforts in the Project Area has included wildlife thinning, riparian thinning, proper road
storage (including culvert removal and waterbar placement), landslide seeding, and fish passage remediation.
6
Watershed Characteristics and Conditions
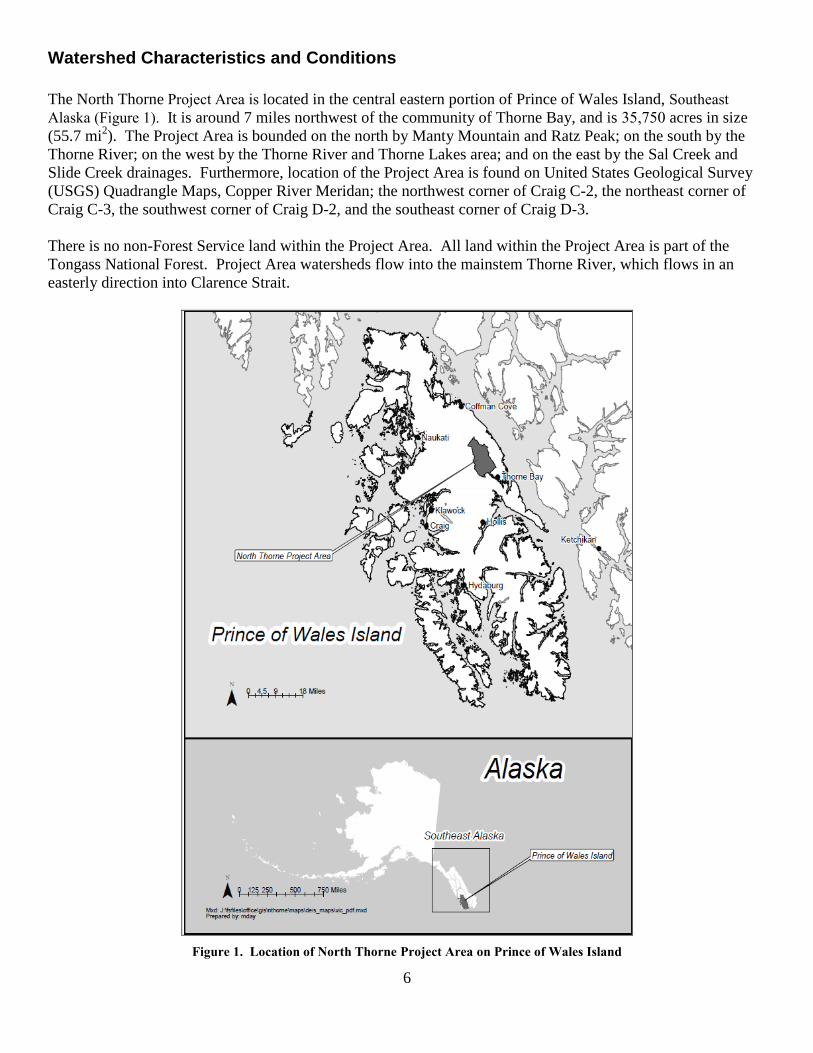
The North Thorne Project Area is located in the central eastern portion of Prince of Wales Island, Southeast
Alaska (Figure 1). It is around 7 miles northwest of the community of Thorne Bay, and is 35,750 acres in size
(55.7 mi2). The Project Area is bounded on the north by Manty Mountain and Ratz Peak; on the south by the
Thorne River; on the west by the Thorne River and Thorne Lakes area; and on the east by the Sal Creek and
Slide Creek drainages. Furthermore, location of the Project Area is found on United States Geological Survey
(USGS) Quadrangle Maps, Copper River Meridan; the northwest corner of Craig C-2, the northeast corner of
Craig C-3, the southwest corner of Craig D-2, and the southeast corner of Craig D-3.
There is no non-Forest Service land within the Project Area. All land within the Project Area is part of the
Tongass National Forest. Project Area watersheds flow into the mainstem Thorne River, which flows in an
easterly direction into Clarence Strait.
Figure 1. Location of North Thorne Project Area on Prince of Wales Island

7
The Desired Future Condition for the North Thorne Project Area should be to have healthy, functioning
watersheds, that have hydrologic connectivity, adequately store water, functioning channel morphology,
provides adequate habitat for fish and wildlife, have unimpaired passage for fish, and that can still support
multiple uses including timber harvest.
Prior to 1960, the North Thorne Project Area had little man-caused disturbance. Most of the disturbance in the
Project Area was naturally caused, primarily due to mass wasting (landslides) and windthrow. Some timber
harvest did occur adjacent to the Thorne River, near the confluence with the Lava (Gravelly) Creek area in the
early 1900’s (1910-1920). Little is known about the harvest activities. It is assumed that a steam donkey was
used for yarding of harvested timber to the Thorne River. Yarding down the Lava (Gravelly) Creek stream
corridor is likely to have occurred (Tierney, personal communication).
In the early to mid 1960’s the Ketchikan Pulp Company moved its logging camp from Hollis to Thorne Bay. In
the early 1960’s timber harvest began in the Lava Creek watershed. Construction of logging roads also began
into the Lava Creek watershed and along the Thorne River in the early 1960’s. By 1973, eighteen miles of road
had been built west toward the Control Lake Area to meet the road from Klawock, and roads accessing the
watersheds within the North Thorne Project Area had been constructed.
Table 1 Watersheds of the North Thorne Project Area, including watershed name, hydrologic unit (HU) field, HU code
number, and size in acres and square miles. Data from USFS Tongass National Forest GIS Coverages.
Watershed Name HU Field HU Code Size (acres) Size (mi
2) % of Prj Area
Lava Creek 7th
1901010304100800 7030.4 11 19.7
Falls Creek 7th
1901010304100900 2491 3.9 7
Unnamed
Composite
7th
1901010304101000 3361.3 5.3 9
West Fork North
Thorne
8th
1901010304101101 8402.4 13.1 23.5
Snakey Lakes
Lowlands
8th
1901010304101102 6795.7 10.4 19
East Fork North
Thorne
8th
1901010304101103 7669 12 21.5
Total 35,750 55.7 100
8
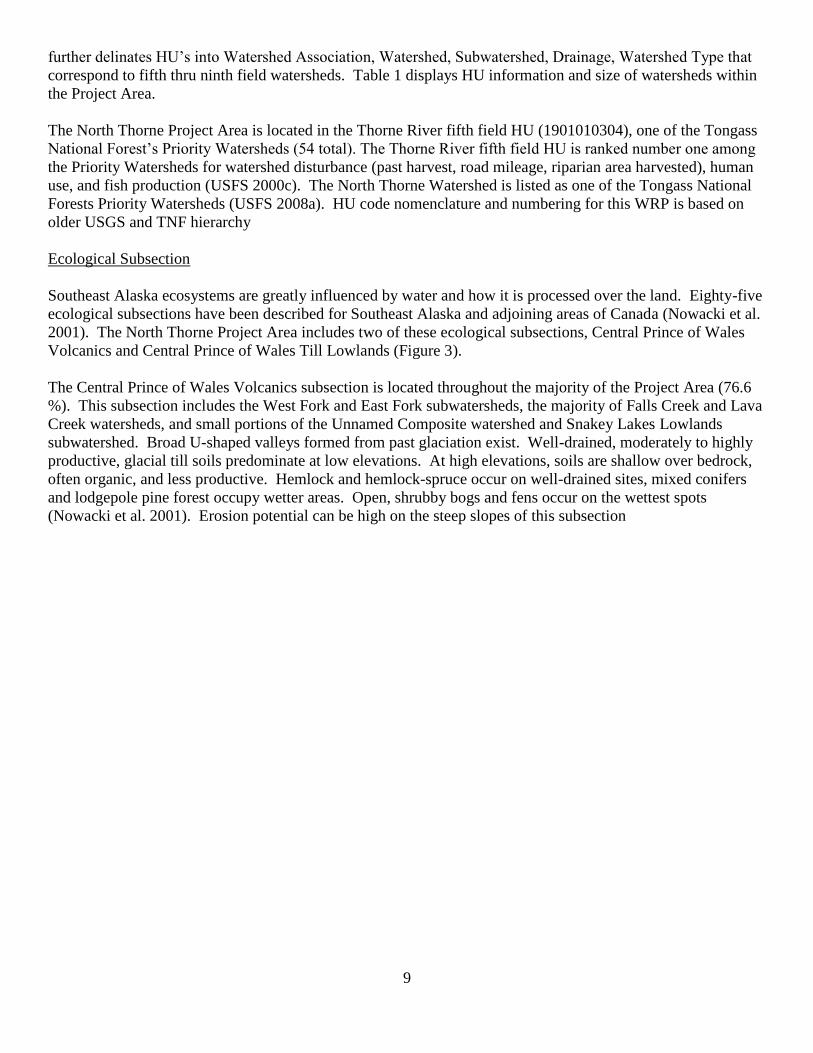
Figure 2. Names of watersheds in the North Thorne Project Area.
Project Area Watersheds
A watershed is the area in which all surface waters flow to a lowest, common point. It’s boundary is the divide
that separates one drainage area from another. The water moves by means of a network of drainage patterns
that may be underground or on the surface. These drainage patterns connect to a stream and river system that
becomes progressively larger as water flows downstream. Because water moves downstream in a watershed,
any activity that affects the quality, quantity, or rate of movement at one location can change the characteristics
of the watershed at locations downstream (OWEB 1999).
Watersheds within the North Thorne Project Area include Lava Creek, Falls Creek, an unnamed composite
watershed, and the North Fork of the Thorne River. The North Thorne watershed is further subdivided into the
West Fork, the East Fork, and the Snakey Lakes Lowlands sub watersheds. Figure 2 displays the Project Area
boundary, watershed and subwatershed boundaries, and watershed names for the North Thorne Project Area.
Hydrologic Units
Hydrologic Units (HU) define the hydrological providence where a given watershed is located and follow a
national standard hierarchal organization developed by the USGS and further refined by the United States
Forest Service (USFS), Tongass National Forest (USFS 2000b ). The USGS hierarchy uses Region, Subregion,
Accounting Unit, and Catalog Code, and is typically displayed as a numeric code (eight digits), with each
subsequent two digits or “field” defining Region, Subregion, etc. The USFS Tongass National Forest (TNF)
9
further delinates HU’s into Watershed Association, Watershed, Subwatershed, Drainage, Watershed Type that
correspond to fifth thru ninth field watersheds. Table 1 displays HU information and size of watersheds within
the Project Area.
The North Thorne Project Area is located in the Thorne River fifth field HU (1901010304), one of the Tongass
National Forest’s Priority Watersheds (54 total). The Thorne River fifth field HU is ranked number one among
the Priority Watersheds for watershed disturbance (past harvest, road mileage, riparian area harvested), human
use, and fish production (USFS 2000c). The North Thorne Watershed is listed as one of the Tongass National
Forests Priority Watersheds (USFS 2008a). HU code nomenclature and numbering for this WRP is based on
older USGS and TNF hierarchy
Ecological Subsection
Southeast Alaska ecosystems are greatly influenced by water and how it is processed over the land. Eighty-five
ecological subsections have been described for Southeast Alaska and adjoining areas of Canada (Nowacki et al.
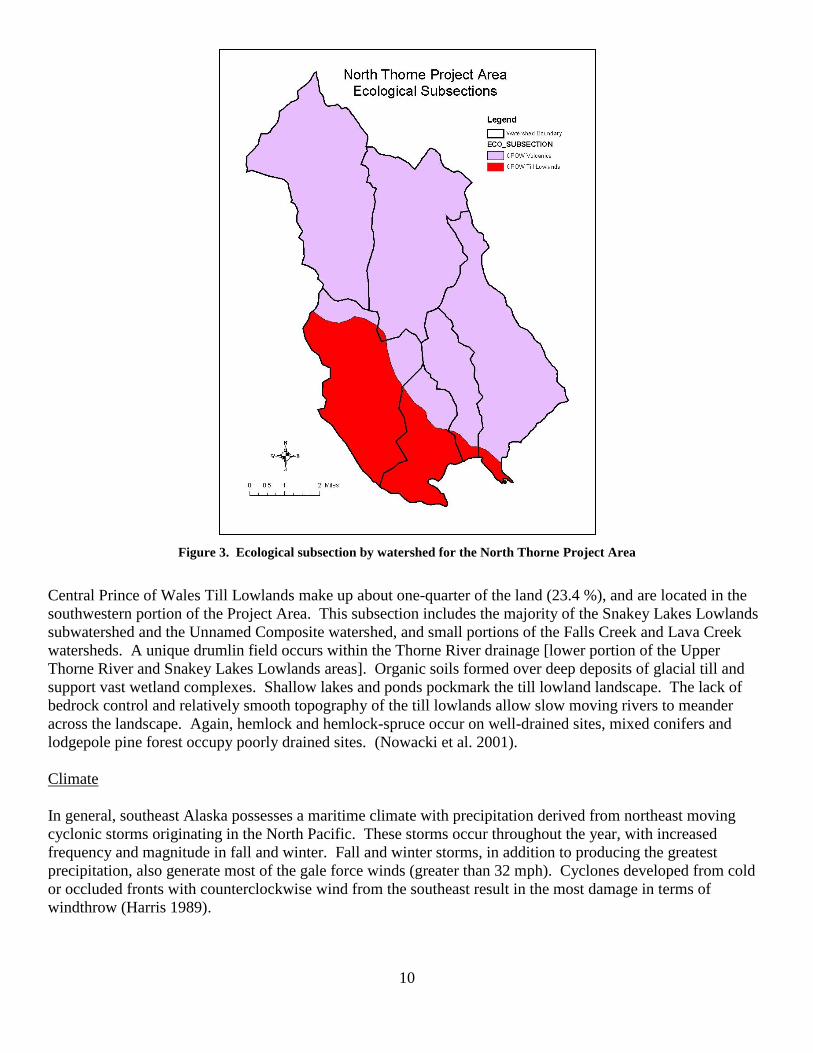
2001). The North Thorne Project Area includes two of these ecological subsections, Central Prince of Wales
Volcanics and Central Prince of Wales Till Lowlands (Figure 3).
The Central Prince of Wales Volcanics subsection is located throughout the majority of the Project Area (76.6
%). This subsection includes the West Fork and East Fork subwatersheds, the majority of Falls Creek and Lava
Creek watersheds, and small portions of the Unnamed Composite watershed and Snakey Lakes Lowlands
subwatershed. Broad U-shaped valleys formed from past glaciation exist. Well-drained, moderately to highly
productive, glacial till soils predominate at low elevations. At high elevations, soils are shallow over bedrock,
often organic, and less productive. Hemlock and hemlock-spruce occur on well-drained sites, mixed conifers
and lodgepole pine forest occupy wetter areas. Open, shrubby bogs and fens occur on the wettest spots
(Nowacki et al. 2001). Erosion potential can be high on the steep slopes of this subsection
10
Figure 3. Ecological subsection by watershed for the North Thorne Project Area
Central Prince of Wales Till Lowlands make up about one-quarter of the land (23.4 %), and are located in the
southwestern portion of the Project Area. This subsection includes the majority of the Snakey Lakes Lowlands
subwatershed and the Unnamed Composite watershed, and small portions of the Falls Creek and Lava Creek
watersheds. A unique drumlin field occurs within the Thorne River drainage [lower portion of the Upper
Thorne River and Snakey Lakes Lowlands areas]. Organic soils formed over deep deposits of glacial till and
support vast wetland complexes. Shallow lakes and ponds pockmark the till lowland landscape. The lack of
bedrock control and relatively smooth topography of the till lowlands allow slow moving rivers to meander
across the landscape. Again, hemlock and hemlock-spruce occur on well-drained sites, mixed conifers and
lodgepole pine forest occupy poorly drained sites. (Nowacki et al. 2001).
Climate
In general, southeast Alaska possesses a maritime climate with precipitation derived from northeast moving
cyclonic storms originating in the North Pacific. These storms occur throughout the year, with increased
frequency and magnitude in fall and winter. Fall and winter storms, in addition to producing the greatest
precipitation, also generate most of the gale force winds (greater than 32 mph). Cyclones developed from cold
or occluded fronts with counterclockwise wind from the southeast result in the most damage in terms of
windthrow (Harris 1989).

11
The Project Area receives moderately high levels of precipitation (Nowacki et al. 2001). The mean annual
precipitation based on regional nomigraphs is approximately 120 inches [304.8 cm] (Jones and Fahl 1994). The
nearby town of Hollis, Alaska, located about 19 miles to the south of the Project Area, had an average annual
rainfall of 103 inches [261.6 cm] for May 1949 to December 2010 (WRCC 2011). The highest annual rainfall
was during the month of October, and the lowest annual rainfall was during the month of June (Figure 4). Snow
falls at all elevations during the winter season, with more snowfall in the higher elevations, and rain-on-snow
events do occur.
Figure 4. Monthly Climate Summary for Hollis, Alaska, Station 503650, Years 1949 to 2010. Data from WRCC 2011.
A Remote Automated Weather Station (RAWS) has been operating near the North Thorne Project Area since
August 29, 2002. The station (THOA2) is located at an elevation of 600 feet above sea level, near the end of
the 3015200 road, and can be view as real-time 24-hour data in 1 hour increments by day. Data includes
precipitation, maximum-minimum air temperature, relative humidity, and wind speed (NOAA 2011).
Air Temperature
Figure 3 shows average maximum and minimum air temperatures for years 1949 to 2010 at Hollis, Alaska.
Minimum average temperatures of 28°F [-2.2°C] occurred during the month of January. Maximum average
temperatures of 67°F [19.4°C] occurred during the month of July (WRCC 2011).
Between 1999-2002 air temperature has been monitored at a site just downstream of the North Fork of the
Thorne River bridge, on the 3016000 road (Walters and Prefontaine 2005). January’s mean minimum air
temperature was 31.2°F [-0.42°C], the mean maximum air temperature was 35.6°F [2°C], with the mean
average being 33.4°F [0.75°C]. July’s mean minimum air temperature was 50.2°F [10.13°C], the mean
maximum was 59.7°F [15.39 C], and the mean average was 54.8°F [12.67]. It should be noted however that
periods of low air temperatures occurred in February and March, and higher air temperatures occurred in
August.
Geology
The southwestern portion of the North Thorne Project Area is a lowlands (Snakey Lakes sub watershed),
formed where continental ice lobes eroded the present Thorne River valley from the north. Organic soils have
formed over deep deposits of glacial till. Soils vary throughout the lowlands area, but are often poorly drained
in the low lying areas with muskeg and low productivity (scrub) forest. In addition to vast wetland complexes,
shallow lakes, and ponds, the area is intermixed with forested drumlins. The effects of past glaciation in the
12
northern and eastern portions of the Project are complex, resulting from a mixture of continental and alpine ice
flows. Numerous small steep valleys dissect the mountains and coalesce to form broad U-shaped valleys along
larger drainages (West Fork and East Fork sub watersheds). Here, bedrock exposures and faults control the
valley development. Well-drained, moderately to highly productive, glacial till soils predominate the valley
slopes and lower elevations. Alluvial soils, formed by water transport and deposition, are found along the major
stream courses and riparian areas.
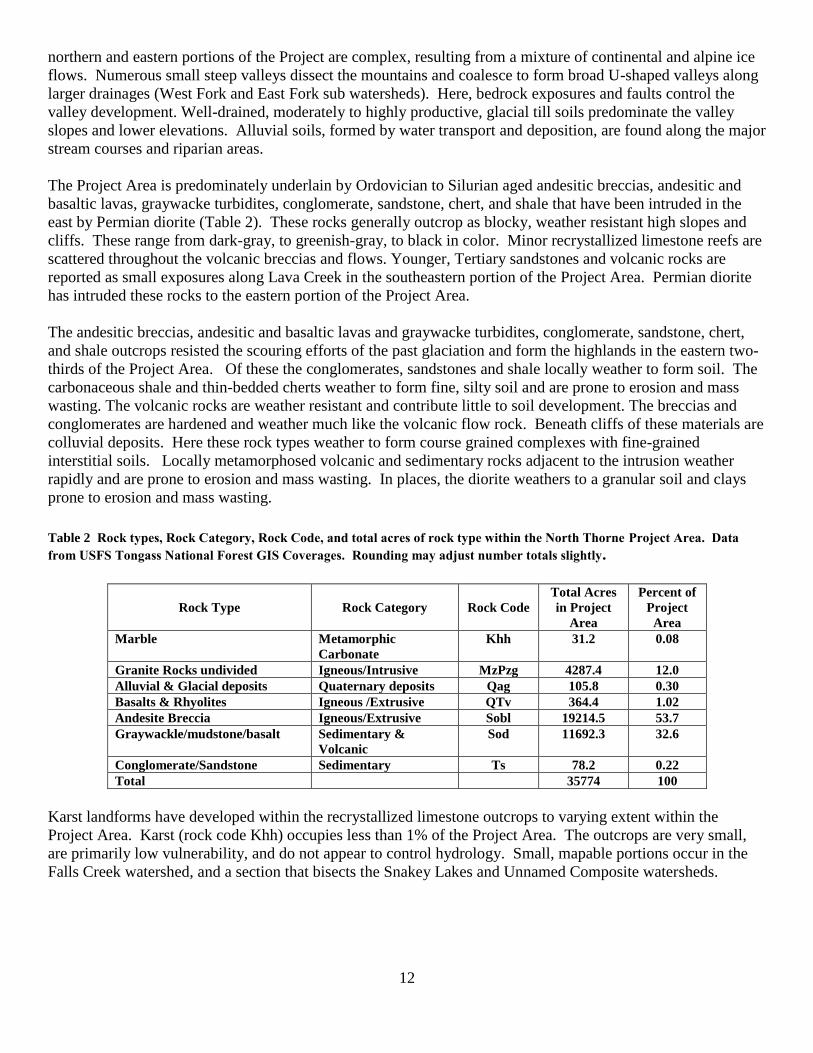
The Project Area is predominately underlain by Ordovician to Silurian aged andesitic breccias, andesitic and
basaltic lavas, graywacke turbidites, conglomerate, sandstone, chert, and shale that have been intruded in the
east by Permian diorite (Table 2). These rocks generally outcrop as blocky, weather resistant high slopes and
cliffs. These range from dark-gray, to greenish-gray, to black in color. Minor recrystallized limestone reefs are
scattered throughout the volcanic breccias and flows. Younger, Tertiary sandstones and volcanic rocks are
reported as small exposures along Lava Creek in the southeastern portion of the Project Area. Permian diorite
has intruded these rocks to the eastern portion of the Project Area.
The andesitic breccias, andesitic and basaltic lavas and graywacke turbidites, conglomerate, sandstone, chert,
and shale outcrops resisted the scouring efforts of the past glaciation and form the highlands in the eastern two-
thirds of the Project Area. Of these the conglomerates, sandstones and shale locally weather to form soil. The
carbonaceous shale and thin-bedded cherts weather to form fine, silty soil and are prone to erosion and mass
wasting. The volcanic rocks are weather resistant and contribute little to soil development. The breccias and
conglomerates are hardened and weather much like the volcanic flow rock. Beneath cliffs of these materials are
colluvial deposits. Here these rock types weather to form course grained complexes with fine-grained
interstitial soils. Locally metamorphosed volcanic and sedimentary rocks adjacent to the intrusion weather
rapidly and are prone to erosion and mass wasting. In places, the diorite weathers to a granular soil and clays
prone to erosion and mass wasting.
Table 2 Rock types, Rock Category, Rock Code, and total acres of rock type within the North Thorne Project Area. Data
from USFS Tongass National Forest GIS Coverages. Rounding may adjust number totals slightly.
Rock Type
Rock Category
Rock Code
Total Acres
in Project
Area
Percent of
Project
Area
Marble Metamorphic
Carbonate
Khh 31.2 0.08
Granite Rocks undivided Igneous/Intrusive MzPzg 4287.4 12.0
Alluvial & Glacial deposits Quaternary deposits Qag 105.8 0.30
Basalts & Rhyolites Igneous /Extrusive QTv 364.4 1.02
Andesite Breccia Igneous/Extrusive Sobl 19214.5 53.7
Graywackle/mudstone/basalt Sedimentary &
Volcanic
Sod 11692.3 32.6
Conglomerate/Sandstone Sedimentary Ts 78.2 0.22
Total 35774 100
Karst landforms have developed within the recrystallized limestone outcrops to varying extent within the
Project Area. Karst (rock code Khh) occupies less than 1% of the Project Area. The outcrops are very small,
are primarily low vulnerability, and do not appear to control hydrology. Small, mapable portions occur in the
Falls Creek watershed, and a section that bisects the Snakey Lakes and Unnamed Composite watersheds.

13
Soils
Soils are formed from weathered glacial till, both on the side slopes of valleys, and in the valley bottoms. These
include not only glacial till, but glaciofluvial and glacial marine sediments. Until approximately 6,500 years
ago, the Thorne River valley was an estuary/salt chuck complex that drained through the narrow gap just north
of the current bridge across the Thorne River on the 30 Road. The southern project boundary represents the
boundary between glacial till and drumlin development from a stagnant ice sheet to the north, and glacial
outwash deposits to the south. Coarser grained glacial tills deposited on the slopes of the valley walls are prone
to erosion and mass wasting. Compacted glacial tills and glacial marine sediments of the valley floors often
control the down cutting of watercourses. The uncompacted till and outwash deposits on top of these layers are
prone to erosion and small slope and cut bank failures.
Generally mineral soils in the Project Area have developed an “organic mat” that protects the mineral surface
from extensive erosion. The buildup of organic material on the mineral surfaces is a result of the cool and
moist, high precipitation maritime climate in southeast Alaska. Cool temperatures inhibit microbial
decomposition at the ground surface; thus, thick (6 to 10 inches or greater) organic layers build up on the
mineral surface. High precipitation leads to abundant vegetative growth in southeast Alaska, which further
increases organic matter accumulation. Organic soils derived solely from organic matter accumulations vary
greatly in depth depending on location. These unique soils can be less than 14 inches thick in forested wetland
and can range up to 20 feet thick in muskeg areas. These organic soils are very poorly drained and typically
overlie bedrock and/or glacial till deposits. Very poorly drained organic soils in the Project Area may vary
greatly in their degree of decomposition from minimal to extensively decomposed. Well drained, shallow
organic soils (<14 inches) are commonly found on bedrock outcrops and steep slopes in the Project Area.
The North Thorne Project Area contains 33 different soil types. The Tongass National Forest defines different
soil types as soil map units (SMU’s) based on National standards. The SMU is named after the major soil type
within that unit. A SMU is rarely one soil type; rather it is dominated by one or two soils with inclusions of
other soils of minor extent (USFS 2001). Often two soil types are so complexly intermixed within a mapping
unit that no distinction can be made. These SMU’s are called soil complexes. A number of soil complexes are
found in the North Thorne Project Area (Table 3).
The Project Area is covered with approximately 50% poorly drained and very poorly drained soils. These soils
are generally associated with forested wetlands and muskegs that are typically found on gently sloping areas,
benches, flat lowlands, and depressions. The well drained and moderately well drained soils, are found on the
steeper slopes of the U-shaped valleys in the Project Area, primarily the West Fork and East Fork
subwatersheds. These productive soils are often shallow and can be at risk for mass wasting on steep (>72%)
slopes. Tolstoi and Karta soils are the dominant well drained soils and comprise 31% of the Project Area.
Additional well-drained and high productivity soils known as Tonowek and Tuxekan are generally found along
floodplains in the Project Area. These soils were formed by alluvial processes and currently cover 2.6% of the
Project Area.
Table 3. Soil map units (SMU), Soil name, Soil drainage Class, Mass Movement Index (MMI) and Percent Coverage of North
Thorne Project Area. Data from USFS, Tongass National Forest GIS Coverages.
SMU
Number
Soil Name Soil Drainage Class MMI %Coverage of Project
Area
10 Tonowek and Tuxecan soils, 0 to 15% slope well drained 1 2.58
201 Kogish-Maybeso complex, 2 to 10% slopes
very poorly and poorly
drained 1 2.44
20CDX Maybeso-Kaikli complex, 5 to 60% slopes very poorly drained 1 2.89
21A Kogish peat, 0 to 5% slopes
very poorly and poorly
drained 1 1.77

14
220C Kina-Maybeso association, 5 to 35% slopes very poorly drained 1 9.65
23 Kina-Kaikli association, 0 to 40% slopes very poorly drained 1 0.04
245CE
Hydraburg-Sunnyhay association, 5 to 75%
slopes very poorly drained 1 9.33
26A Staney Peat, 0 to 5% slopes very poorly drained 1 2.22
30C Karta silt loam, 5 to 35% slopes
moderately well and well
drained 1 5.73
81 Rock outcrop none 1 0.14
85 Kina peat, 0 to 35% slope very poorly drained 1 3.87
91CDX Maybeso peat, 5 to 60% slopes very poorly drained 1 0.54
252
Wadleigh-Kogish association, 0 to 25%
slopes poorly drained 2 5.25
28 McGilvery and Tolstoi soils, 5 to 60% slopes
moderately well and well
drained 2 0.24
31C Wadleigh gravelly silt loam, 5 to 35% slopes poorly drained 2 1.49
540
Tokeen-McGilvery complex, 10 to 65%
slopes well drained 2 0.44
30CFX Karta silt loam, 5 to 100% slopes
moderately well and well
drained 3 1.64
30D
Karta very fine sandy loam, 35 to 60%
slopes
moderately well and well
drained 3 3.10
31CDX Wadleigh gravelly silt loam, 5 to 60% slopes poorly drained 3 4.01
320CD
Wadleigh-Maybeso complex, 5 to 60%
slopes
very poorly and poorly
drained 3 0.11
32CDX
St. Nicholas very fine sandy loam, 5 to 60%
slopes poorly drained 3 0.32
331CD Karta-Wadleigh complex, 5 to 60% slopes
moderately well and well
drained 3 7.78
351DE Karta-Tolstoi complex, 35 to 75% slopes
moderately well and well
drained 3 10.38
528DF
Tolstoi-McGilvery complex, 35 to 100%
slopes
moderately well and well
drained 3 1.47
54CEX
Tokeen gravelly sandy loam, 5 to 75%
slopes well drained 3 0.89
550CE
St. Nicholas-Kaikli complex, 5 to 75%
slopes
very poorly and poorly
drained 3 1.38
14DFX Shakan sandy loam, 35 to 100% slopes
moderately well and well
drained 4 2.38
15 Cryorthents
moderately well and well
drained 4 0.01
32CFX
St. Nicholas very fine sandy loam, 5 to
100% slopes poorly drained 4 0.13
32EFX
St. Nicholas very fine sandy loam, 60 to
100% slopes poorly drained 4 1.12
33CFX
St. Nicholas-McGilvery complex, 5 to 100%
slopes poorly drained 4 0.03
34DFX
St. Nicholas-Shakan association, 35 to 100%
slopes poorly drained 4 3.22
50CFX Tolstoi and Karta soils, 5 to 100% slopes
moderately well and well
drained 4 0.91
Vegetation
The natural vegetation of the Project Area is a mosaic of coniferous forest intermixed with alpine tundra,
muskeg, riparian, and shrub land plant communities. Productive forests of hemlock and hemlock-spruce occur
within the Project Area and are restricted to well drained soils. These sites usually occur on steeper slopes,

15
scoured mountains, and along streambanks. Low productive forests of mixed conifers occupy wetter areas
(poorly drained sites). Open, shrubby bogs and fens occur on the wettest spots (Nowacki et al. 2001).
Table 4 displays acres of forest type by watershed. Hemlock dominated forests are prevalent in the upper
slopes, above already harvested areas in the West Fork, East Fork, Falls, and Lava Creek watersheds (Figure 8).
Harvested areas primarily were hemlock-spruce forests. Spruce dominated forests are in the valley bottoms
along mainstem streams, primarily the Snakey Lakes lowlands. Alder often dominates the vegetation in areas
harvested to the streambank, and on upland sites that have been highly disturbed. Alder dominated riparian
areas are present along harvested streambank sections of Lava Creek, the West and East Fork of the North
Thorne River, and in Falls Creek. Cedar dominated stands are small and isolated in the Project Area, primarily
in unharvested stands.
Old Growth Forest
Old-growth forest is defined in the Forest Plan as an ecosystem distinguished by the later stages of forest stand
development that differs significantly from younger stands in structure, ecological function, and species
composition. Old-growth forest is characterized by a patchy, multi-layered canopy, many age classes of trees,
large trees dominating the overstory, large standing dead (snags) or decadent trees, and higher accumulations of
large down woody material (USFS 2008). Productive Old Growth (POG) are stands of forest capable of
producing and containing enough tree volume per acre to be commercially harvestable; i.e. 20 cubic feet per
acre per year with 8,000 or more board feet per acre and provide important wildlife habitat.
Table 4. Acres of forest type by watershed within the North Thorne Project Area. Other includes non-forested wetlands,
lakes, rock, etc. Data from USFS, Tongass National Forest GIS Coverages.
Watershed
Name Red Alder Cedar Hemlock Spruce
Hemlock -
Spruce Other
Lava Creek 18.1 0 1025.6 52.8 3756.2 2177.8
Falls Creek 0 0 442.2 2.8 984.8 1061.7
Unnamed
Composite 0 17.2 860.4 16.4 1625.3 842.1
West Fork
North
Thorne
0 0 2149.6 0 3312 2940.8
Snakey
Lakes
Lowlands
0 28.3 1920.4 130.2 2866.5 1850.2
East Fork
North
Thorne
0 69.6 2159.3 85.9 2164.6 3189.7
Productive Old Growth
There is about 14,753 acres of Productive Old Growth (POG) within the Project Area (Table 5). POG at less
than 1,500 foot elevations provides the best quality habitat for several wildlife species. Most timber harvest
activity in the Project Area has occurred in these low elevation habitats (below 1,200 feet). Large scale timber
harvest in the Project Area began in the 1960s, and there has been little or no retention of overstory structure in
the Project Area’s 8,935 acres harvested to date. High volume strata POG forest below 1,500 foot elevation is
important habitat for many of the wildlife management indicator species listed in the Forest Plan FEIS (USFS
2008) and in the Project Area.

16
Table 5.. Productive Old Growth by volume strata and acres in the North Thorne Project Area. Data from USFS, Tongass
National Forest GIS Coverages.
Productive Old Growth
by Volume Strata
Acres in Project
Area
Acres below
1500’ Elevation
Acres above
1500’ Elevation
High Volume Strata 6,905 6,086 819
Medium Volume Strata 4,799 3,616 1,183
Low Volume Strata 3,049 2,363 686
Total Acres 14,753 12,065 2,688
Second Growth Vegetation
The Project Area contains 8,935 acres of second growth (also referred to as young growth). Second growth is
found in two stand developmental stages, stand initiation and stem exclusion (Nowacki and Kramer 1988), and
represents about 26 percent of the Project Area (Table 6). Stand initiation begins after a natural disturbance to
the forest or timber harvest, and usually last 25 to 35 years. During the stem exclusion stage tree density
increases to a point where the canopy closes and little sunlight reaches the forest floor. This stage usually lasts
from 35 to 150 years after disturbance.
Individual second growth stand size within the Project Area ranges from 0.25 acres to 801 acres, with an
average size of 55 acres. The largest contiguous block of second growth is 3,682 acres. To date, 2,820 acres
have been thinned; leaving 6,115 acres as young or second growth. Much of the remaining second growth is in,
or near, the stem exclusion stage. As time passes, more of the second growth stands that are currently in stand
initiation will move into a stem exclusion stage. The trees within these stands are crowded, and uniform in size.
Stands in the stem exclusion stage exhibit a poorly developed understory, an even-aged overstory, and provide
low value habitat for wildlife.
Table 6. Distribution of Stand Development Stages in the North Thorne Project Area. Data from USFS, Tongass National
Forest GIS Coverages.
Stand
Development
Stages
Stand
Initiation
Stem
Exclusion
Understory
Reinitiation
Productive
Old Growth
Other Old
Growth*
Non-
Forest**
Acres and %
of Project
Area
3,379
(10%)
5,556
(16%)
0
14,753
(41%)
10,582
(29%)
1,590
(4%)
*Other Old Growth – lands having greater than 10% tree cover but not capable of producing a commercial
timber crop of 8 MBF/acre/year.
**Non-Forest – lands having less than 10% tree cover, and includes water.
Wetlands
Wetlands occupy approximately 62% of the land area in the North Thorne Project Area. Forested wetland and
complexes with wetland types make up approximately two-thirds of the wetlands (Table 7). Wetlands
considered to be either biologically or hydrologically significant throughout the Project Area include emergent
short and tall sedge fens, muskeg, and alpine muskeg. These wetlands types comprise approximately one-third
of all wetland types in the Project Area.
Forested wetlands cover nearly 41% of the Project Area. Forested wetlands include a number of forested plant
communities with hemlock, cedar, or mixed conifer overstories, and ground cover consisting largely of skunk
cabbage and deer cabbage. Forested wetlands occur on poorly or very poorly drained mineral and organic soils.
Forested wetlands are most common on gentle gradient hill slopes or benches, and support the transfer of water

17
to downslope resources. Forested wetlands function as recharge areas for groundwater and streams, and for
deposition of sediment and nutrients’
Table 7. Wetland types, Wet-Hab code, and acres by watershed in the North Thorne Project Area. Data from USFS, Tongass
National Forest GIS Coverages.
Wetland Type
Wet-
Hab
Code
Lava
Ck
Falls
Creek
Un-named
Composite
West
Fork
North
Thorne
Snakey
Lakes
Lowlands
East
Fork
North
Thorne
% of
Proj
Area
Alpine Muskeg AM 355.8 453.6 0 1865.9 0 1966 13
Scrub Estuarine E 2.3 0 0 0 0 0 0.01
Emergent Short Sedge EM 517.8 381.1 0 226.2 25.5 229.9 3.9
Forested/Emergent
Sedge
(<50% Forested)
FES 1657.5 174.7 282.1 352.5 418.8 553.5 9.6
Forested Wetland/
Non-Forested Non-
Wetland
(>50% Forested)
FIA 28.4 0 0 0973.3 11.6 401.2 4.0
Forest
Wetland/Forested Non-
Wetland
(>50% Forested)
FIC 0 0 760.5 380.9 1327.5 304.1 7.8
Forest
Wetland/Forested Non-
Wetland
(>50% Wetland)
FIW 0 0 0 11.3 0 0 0.03
Forested Wetland/
Moss Muskeg
(>50% Forested)
FMS 0 0 580.2 0 1290 0 5.2
Forested Wetland/
Moss Muskeg
(<50% Forested)
FSS 28.2 5.36 44.3 176.2 168.5 447.9 2.4
Forested Wetland FW 1054.1 196.1 77.4 879.9 854.5 1206.1 11.9
Sphagnum Peat Moss
Muskeg MP 28.2 7.6 153.5 144 159.4 136.6 1.8
Emergent Tall Sedge MT 0.2 0.4 20.5 208.1 437.9 125.9 2.2
Scrub-Shrub
Evergreen/Emergent
Wetland (<50% Scrub-
Shrub Evergreen)
SES 12.6 0 0 0 0 0 0.04
Total 3685.1 1218.9 1918.5 5218.3 4693.7 5371.2 61.9
Emergent short sedge wetlands (wet-hab code EM) include poor fens and rich bogs on moderately deep and
very poorly drained organic soils. This wetland occupies approximately 4% of the Project Area and is often
found on lower footslopes and on broad ridgetops. These wetlands contribute water to downslope resources and
are considered to have high biological and hydrological value in the Project Area.
Emergent tall sedge fens (wet-hab code MT) are characterized by a diverse community of sedges, dominated by
tall sedges such as Sitka sedge, with a variety of forbs and occasional stunted trees, usually spruce or hemlock.
Soils are typically deep organic muck, often with some thin layers of alluvial mineral soil material. They occur
in landscape positions where they receive some runoff from adjacent slopes resulting in somewhat richer
nutrient status than bogs. These wetlands function as areas for recharge of groundwater and streams, deposition
and storage of sediment and nutrients, and for waterfowl and terrestrial wildlife habitat, including black bear,
18
mink, river otter, and beaver. Some sedge fens contain beaver ponds that often provide high quality waterfowl
habitat and salmon rearing habitat. This wetland occupies approximately 2% of the Project Area.
Muskegs (wet-hab code MP) are dominated by sphagnum moss with a wide variety of other plants adapted to
very wet, acidic, organic soils. They typically contain shore pine and hemlock trees less than 15 feet high. This
wetland type is typically made up of raised bogs as well as sloping “poor fens” and some shrub-scrub
coniferous wetlands. These wetlands function as areas for recharge of groundwater and streams and for
deposition and storage of sediment, and nutrients. The wetland is a valuable source of biological and vegetative
diversity and occupies approximately 2% of the Project Area, especially in the southwest corner of the Project
Area.
Alpine muskegs (wet-hab code AM) occupy approximately 13% of the Project Area. They are similar to
muskegs; however, they occur at higher elevations (1,200 to 2,500 feet) in the landscape, such as ridge tops and
mountain summits in the West and East Fork watersheds. Vegetation is a combination of muskeg and sedge
meadows on peat deposits, and low growing blueberry and heath on higher rises. Similar to muskeg, shore pine
and hemlock trees less than 15 feet high are common. Alpine muskegs are important for snow storage and can
be a source for snowmelt water throughout the spring and early summer months. These wetlands also provide
summer habitat for terrestrial wildlife.
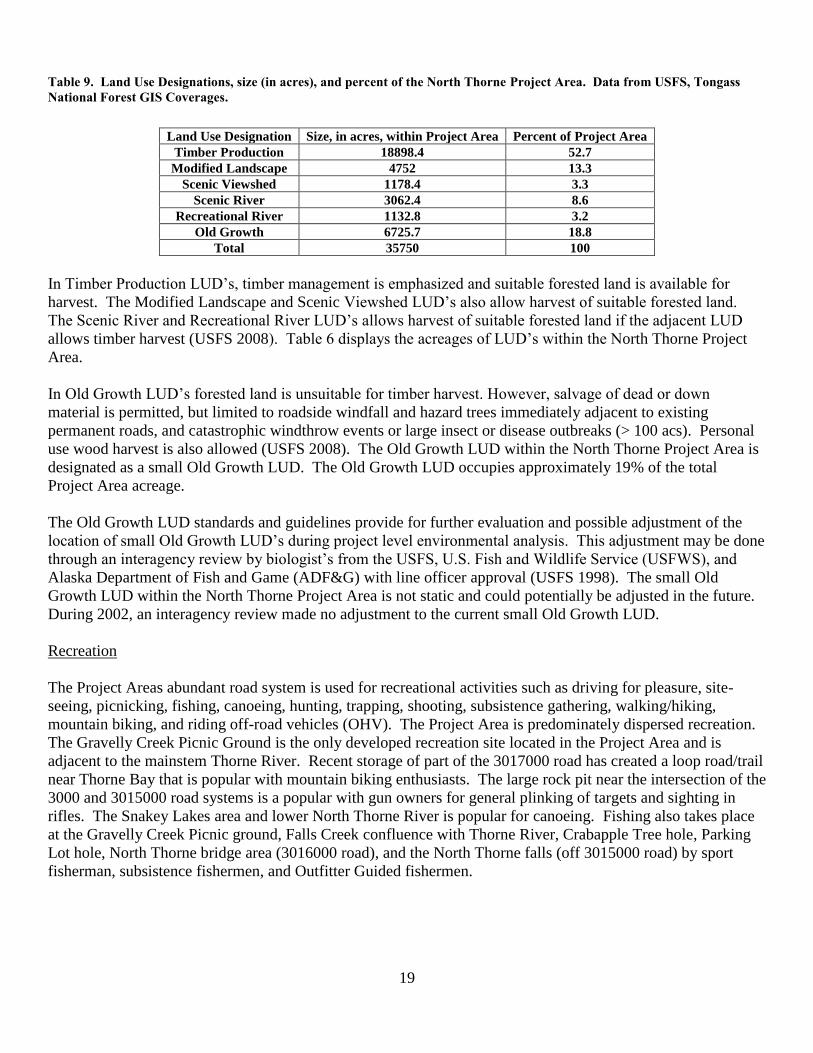
Value Comparison Units
Value Comparison Units (VCU’s) were first developed for the 1979 Tongass Land Management Plan (TLMP)
as distinct geographic areas that generally encompass a drainage basin containing one or more large stream
systems. Boundries usually follow easily recognizable watershed divides (USFS 2008). On Prince of Wales
Island, in many locations, VCU’s often bisect a watershed or include several watersheds. The North Thorne
Project Area includes large portions of VCU’s 5780, 5790, 5800, and 597.1, and small fragments of 5750, 5810,
5830, 5840, 5850, 5860, and 597.2. Table 8 displays the VCU acres by watershed.
Table 8. VCU number and acres by watershed in the North Thorne Project Area. Data from USFS, Tongass National Forest
GIS Coverages.
VCU
Number
Lava
Ck
Falls
Creek
Un-named
Composite
West Fork
North Thorne
Snakey Lakes
Lowlands
East Fork
North
Thorne
Percent of
Project
Area
5750 0 0 0 394.4 461.5 0 2.4
5780 0 0.2 1076.5 0.01 5392.3 41.5 18.2
5790 6475.6 2393.6 886.2 0 655.2 256.5 29.8
5800 37.2 22.1 0 7847 57.1 7277.7 42.6
5810 0 0 0 85.7 0 0 0.2
5830 0 0 0 75.3 0 37.9 0.3
5840 0 0 0 0 0 51.1 0.1
5850 116.4 0 0 0 0 4.3 0.3
5860 401.2 15.4 0 0 0 0 1.2
597.1 0 59.9 1398.6 0 229.5 0 4.7
597.2 0 0.2 0 0 0 0 0
Total 7030.4 2491.4 3361.3 8402.4 6795.6 7669 100
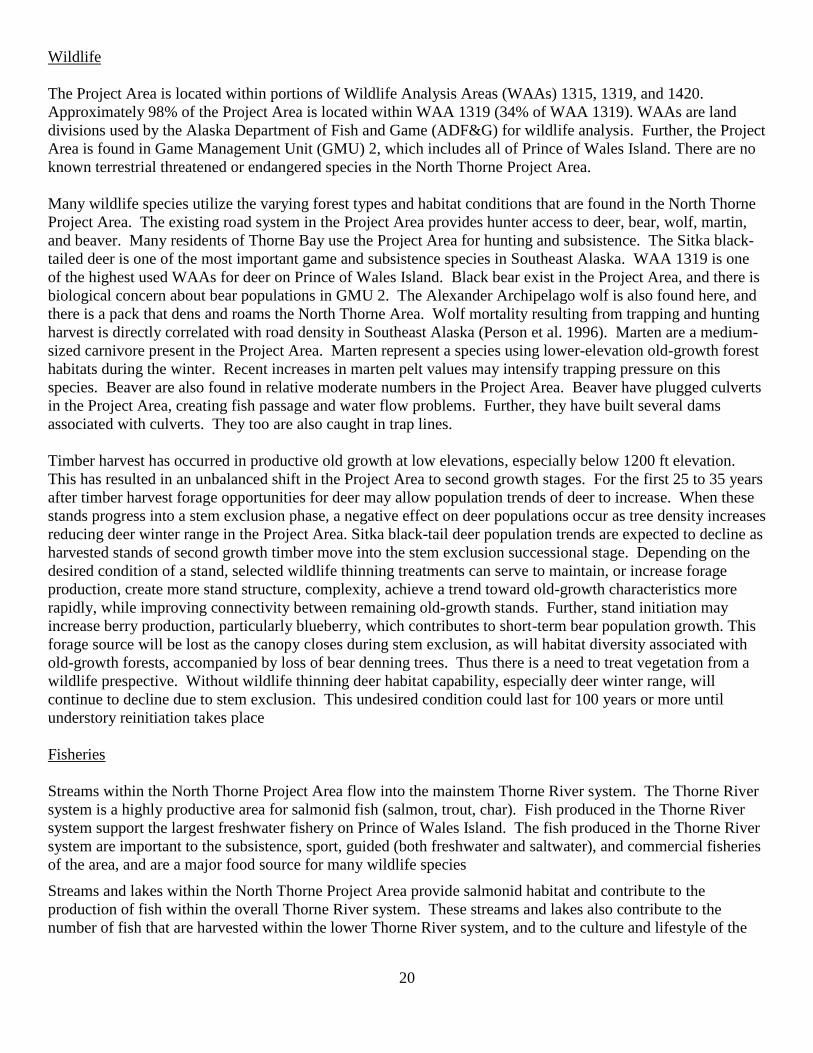
Land Use Designations
Land Use Designations (LUD’s) are defined areas of land to which specific management direction is applied
(USFS 2008). LUD’s within the Project Area include Timber Production, Modified Landscape, Scenic
Viewshed, Scenic River, Recreational River, and Old Growth (Table 9).
19
Table 9. Land Use Designations, size (in acres), and percent of the North Thorne Project Area. Data from USFS, Tongass
National Forest GIS Coverages.
Land Use Designation Size, in acres, within Project Area Percent of Project Area
Timber Production 18898.4 52.7
Modified Landscape 4752 13.3
Scenic Viewshed 1178.4 3.3
Scenic River 3062.4 8.6
Recreational River 1132.8 3.2
Old Growth 6725.7 18.8
Total 35750 100
In Timber Production LUD’s, timber management is emphasized and suitable forested land is available for
harvest. The Modified Landscape and Scenic Viewshed LUD’s also allow harvest of suitable forested land.
The Scenic River and Recreational River LUD’s allows harvest of suitable forested land if the adjacent LUD
allows timber harvest (USFS 2008). Table 6 displays the acreages of LUD’s within the North Thorne Project
Area.
In Old Growth LUD’s forested land is unsuitable for timber harvest. However, salvage of dead or down
material is permitted, but limited to roadside windfall and hazard trees immediately adjacent to existing
permanent roads, and catastrophic windthrow events or large insect or disease outbreaks (> 100 acs). Personal
use wood harvest is also allowed (USFS 2008). The Old Growth LUD within the North Thorne Project Area is
designated as a small Old Growth LUD. The Old Growth LUD occupies approximately 19% of the total
Project Area acreage.
The Old Growth LUD standards and guidelines provide for further evaluation and possible adjustment of the
location of small Old Growth LUD’s during project level environmental analysis. This adjustment may be done
through an interagency review by biologist’s from the USFS, U.S. Fish and Wildlife Service (USFWS), and
Alaska Department of Fish and Game (ADF&G) with line officer approval (USFS 1998). The small Old
Growth LUD within the North Thorne Project Area is not static and could potentially be adjusted in the future.
During 2002, an interagency review made no adjustment to the current small Old Growth LUD.
Recreation
The Project Areas abundant road system is used for recreational activities such as driving for pleasure, site-
seeing, picnicking, fishing, canoeing, hunting, trapping, shooting, subsistence gathering, walking/hiking,
mountain biking, and riding off-road vehicles (OHV). The Project Area is predominately dispersed recreation.
The Gravelly Creek Picnic Ground is the only developed recreation site located in the Project Area and is
adjacent to the mainstem Thorne River. Recent storage of part of the 3017000 road has created a loop road/trail
near Thorne Bay that is popular with mountain biking enthusiasts. The large rock pit near the intersection of the
3000 and 3015000 road systems is a popular with gun owners for general plinking of targets and sighting in
rifles. The Snakey Lakes area and lower North Thorne River is popular for canoeing. Fishing also takes place
at the Gravelly Creek Picnic ground, Falls Creek confluence with Thorne River, Crabapple Tree hole, Parking
Lot hole, North Thorne bridge area (3016000 road), and the North Thorne falls (off 3015000 road) by sport
fisherman, subsistence fishermen, and Outfitter Guided fishermen.
20
Wildlife
The Project Area is located within portions of Wildlife Analysis Areas (WAAs) 1315, 1319, and 1420.
Approximately 98% of the Project Area is located within WAA 1319 (34% of WAA 1319). WAAs are land
divisions used by the Alaska Department of Fish and Game (ADF&G) for wildlife analysis. Further, the Project
Area is found in Game Management Unit (GMU) 2, which includes all of Prince of Wales Island. There are no
known terrestrial threatened or endangered species in the North Thorne Project Area.
Many wildlife species utilize the varying forest types and habitat conditions that are found in the North Thorne
Project Area. The existing road system in the Project Area provides hunter access to deer, bear, wolf, martin,
and beaver. Many residents of Thorne Bay use the Project Area for hunting and subsistence. The Sitka black-
tailed deer is one of the most important game and subsistence species in Southeast Alaska. WAA 1319 is one
of the highest used WAAs for deer on Prince of Wales Island. Black bear exist in the Project Area, and there is
biological concern about bear populations in GMU 2. The Alexander Archipelago wolf is also found here, and
there is a pack that dens and roams the North Thorne Area. Wolf mortality resulting from trapping and hunting
harvest is directly correlated with road density in Southeast Alaska (Person et al. 1996). Marten are a medium-
sized carnivore present in the Project Area. Marten represent a species using lower-elevation old-growth forest
habitats during the winter. Recent increases in marten pelt values may intensify trapping pressure on this
species. Beaver are also found in relative moderate numbers in the Project Area. Beaver have plugged culverts
in the Project Area, creating fish passage and water flow problems. Further, they have built several dams
associated with culverts. They too are also caught in trap lines.
Timber harvest has occurred in productive old growth at low elevations, especially below 1200 ft elevation.
This has resulted in an unbalanced shift in the Project Area to second growth stages. For the first 25 to 35 years
after timber harvest forage opportunities for deer may allow population trends of deer to increase. When these
stands progress into a stem exclusion phase, a negative effect on deer populations occur as tree density increases
reducing deer winter range in the Project Area. Sitka black-tail deer population trends are expected to decline as
harvested stands of second growth timber move into the stem exclusion successional stage. Depending on the
desired condition of a stand, selected wildlife thinning treatments can serve to maintain, or increase forage
production, create more stand structure, complexity, achieve a trend toward old-growth characteristics more
rapidly, while improving connectivity between remaining old-growth stands. Further, stand initiation may
increase berry production, particularly blueberry, which contributes to short-term bear population growth. This
forage source will be lost as the canopy closes during stem exclusion, as will habitat diversity associated with
old-growth forests, accompanied by loss of bear denning trees. Thus there is a need to treat vegetation from a
wildlife prespective. Without wildlife thinning deer habitat capability, especially deer winter range, will
continue to decline due to stem exclusion. This undesired condition could last for 100 years or more until
understory reinitiation takes place
Fisheries
Streams within the North Thorne Project Area flow into the mainstem Thorne River system. The Thorne River
system is a highly productive area for salmonid fish (salmon, trout, char). Fish produced in the Thorne River
system support the largest freshwater fishery on Prince of Wales Island. The fish produced in the Thorne River
system are important to the subsistence, sport, guided (both freshwater and saltwater), and commercial fisheries
of the area, and are a major food source for many wildlife species
Streams and lakes within the North Thorne Project Area provide salmonid habitat and contribute to the
production of fish within the overall Thorne River system. These streams and lakes also contribute to the
number of fish that are harvested within the lower Thorne River system, and to the culture and lifestyle of the
21
residents of the area. ADF&G anadromous catalogued streams are found within the watersheds of the North
Thorne Project Area, in addition to non-catalogued anadromous fish streams and resident fish streams.
ADF&G lists VCU’s 578, 580, and 597.1 as being a primary sportfish producer on the Tongass National Forest
(Flanders et al. 1998). These VCU’s primarily are the West Fork, East Fork, Snakey Lakes, and Unnamed
composite watersheds. ADF&G also lists VCU’s 578, 580, and 597.1 as being primary producers of salmon for
the Tongass National Forest. The other VCU’s in the Project Area are listed as secondary producers of salmon.
This is primarily the Lava Creek and Falls Creek watersheds.
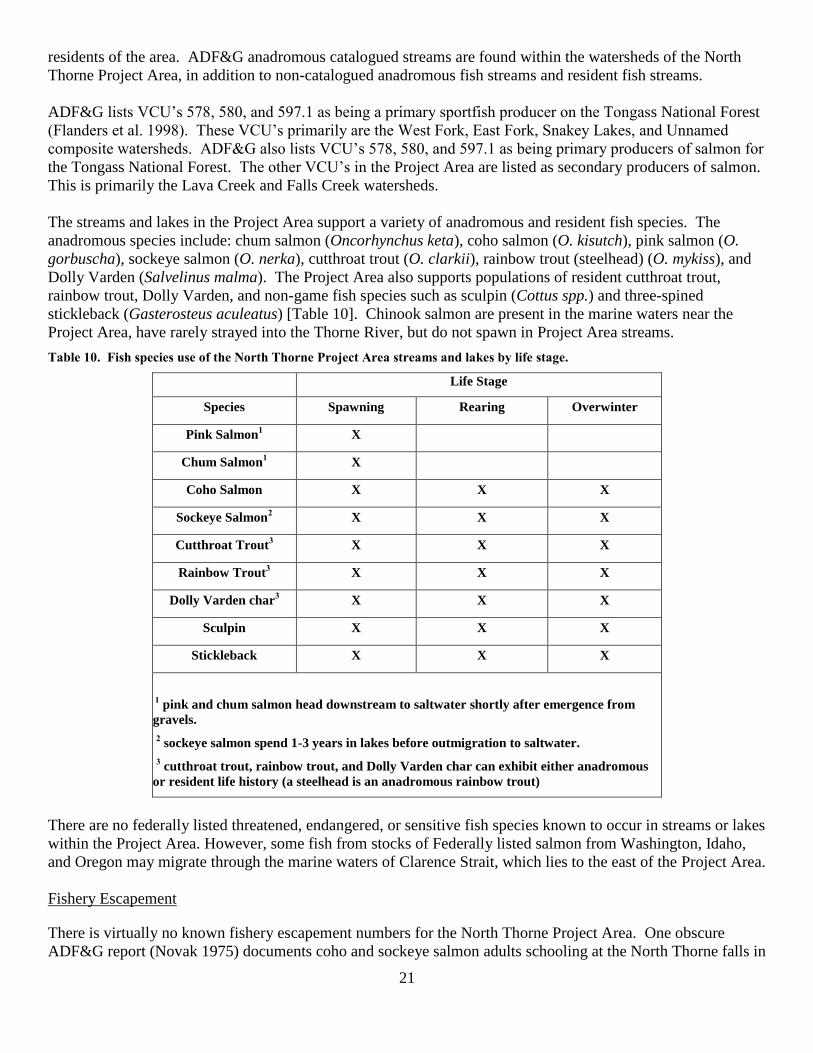
The streams and lakes in the Project Area support a variety of anadromous and resident fish species. The
anadromous species include: chum salmon (Oncorhynchus keta), coho salmon (O. kisutch), pink salmon (O.
gorbuscha), sockeye salmon (O. nerka), cutthroat trout (O. clarkii), rainbow trout (steelhead) (O. mykiss), and
Dolly Varden (Salvelinus malma). The Project Area also supports populations of resident cutthroat trout,
rainbow trout, Dolly Varden, and non-game fish species such as sculpin (Cottus spp.) and three-spined
stickleback (Gasterosteus aculeatus) [Table 10]. Chinook salmon are present in the marine waters near the
Project Area, have rarely strayed into the Thorne River, but do not spawn in Project Area streams.
Table 10. Fish species use of the North Thorne Project Area streams and lakes by life stage.
Life Stage
Species Spawning Rearing Overwinter
Pink Salmon1 X
Chum Salmon1 X
Coho Salmon X X X
Sockeye Salmon2 X X X
Cutthroat Trout3 X X X
Rainbow Trout3 X X X
Dolly Varden char3 X X X
Sculpin X X X
Stickleback X X X
1 pink and chum salmon head downstream to saltwater shortly after emergence from
gravels.
2 sockeye salmon spend 1-3 years in lakes before outmigration to saltwater.
3 cutthroat trout, rainbow trout, and Dolly Varden char can exhibit either anadromous
or resident life history (a steelhead is an anadromous rainbow trout)
There are no federally listed threatened, endangered, or sensitive fish species known to occur in streams or lakes
within the Project Area. However, some fish from stocks of Federally listed salmon from Washington, Idaho,
and Oregon may migrate through the marine waters of Clarence Strait, which lies to the east of the Project Area.
Fishery Escapement
There is virtually no known fishery escapement numbers for the North Thorne Project Area. One obscure
ADF&G report (Novak 1975) documents coho and sockeye salmon adults schooling at the North Thorne falls in

22
the West Fork subwatershed [200 coho, 2 sockeye]. It also documents 59 coho salmon observed spawning
between the North Thorne falls and the upper end of the West Fork subwatershed. Steelhead are found to the
upper end of the West Fork watershed. Beard et al 2008 observed about 10 adult coho in a pool just below the
first crossing of the 3015640 road in the upper East Fork subwatershed.
Novak 1975 also documents adult sockeye salmon schooling in Snakey Lakes, and 118 adult sockeye salmon
observed spawning in the East Fork subwatershed in the vicinity of the East Fork bridge on the 3015000 road.
Beard et al 2006 observed several adult sockeye salmon immediately below the East fork bridge.
It has been thought that the falls below the Snakey Lakes area is a partial barrier to pink salmon. Beard 2006
observed several adult pink salmon schooling in deeper areas of the North Fork upstream of the North Thorne
bridge on the 3016000 road. However, during the previous 5 years no adult pink salmon were observed at this
location.
The Unnamed Composite watershed supports coho, chum, and pink salmon, and steelhead primarily west of the
3015000 road. The Lava Creek watershed supports coho, chum, and pink salmon. Coho salmon appear to be
present to the upper end of the Lava Creek watershed. The Falls Creek watershed has the lowest mileage of
Class I stream due to a waterfall that precludes upstream movement of anadromous fish. Coho, chum, and pink
salmon are found to the falls.
Figure 5. Photo on left is North Thorne Falls, a partial barrier to coho salmon and steelhead. Photo on right is a complete
barrier falls to salmon on Falls Creek.
23
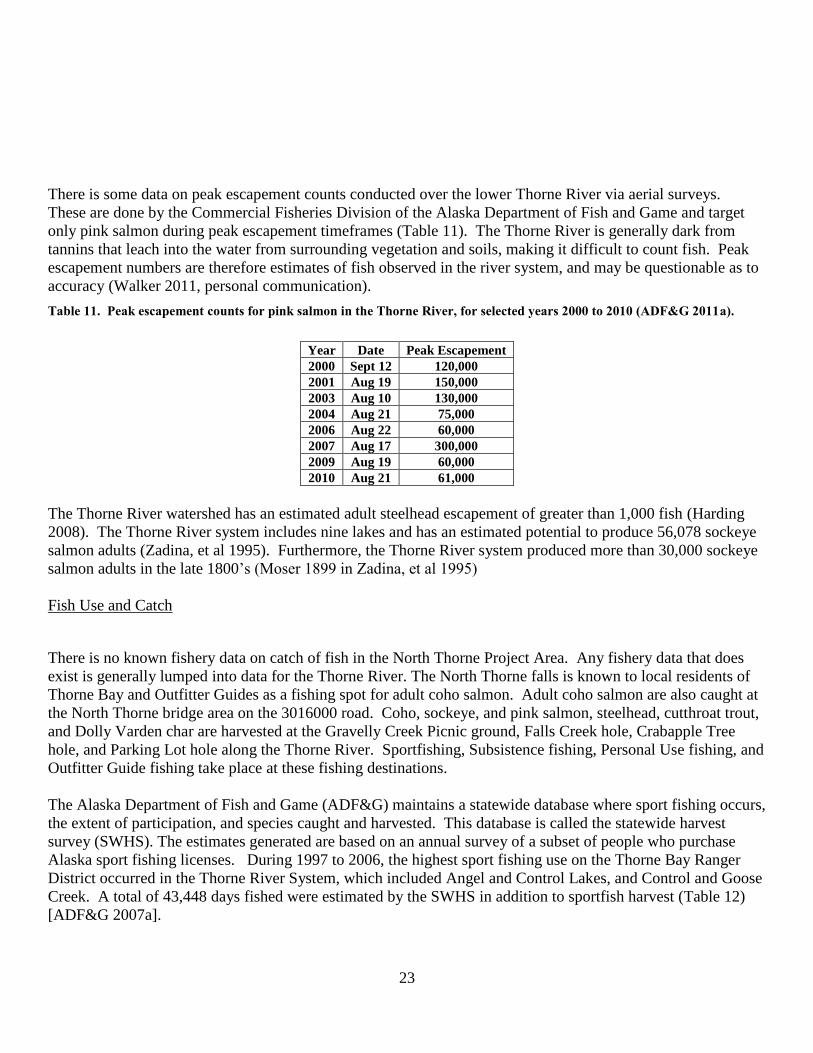
There is some data on peak escapement counts conducted over the lower Thorne River via aerial surveys.
These are done by the Commercial Fisheries Division of the Alaska Department of Fish and Game and target
only pink salmon during peak escapement timeframes (Table 11). The Thorne River is generally dark from
tannins that leach into the water from surrounding vegetation and soils, making it difficult to count fish. Peak
escapement numbers are therefore estimates of fish observed in the river system, and may be questionable as to
accuracy (Walker 2011, personal communication).
Table 11. Peak escapement counts for pink salmon in the Thorne River, for selected years 2000 to 2010 (ADF&G 2011a).
Year Date Peak Escapement
2000 Sept 12 120,000
2001 Aug 19 150,000
2003 Aug 10 130,000
2004 Aug 21 75,000
2006 Aug 22 60,000
2007 Aug 17 300,000
2009 Aug 19 60,000
2010 Aug 21 61,000
The Thorne River watershed has an estimated adult steelhead escapement of greater than 1,000 fish (Harding
2008). The Thorne River system includes nine lakes and has an estimated potential to produce 56,078 sockeye
salmon adults (Zadina, et al 1995). Furthermore, the Thorne River system produced more than 30,000 sockeye
salmon adults in the late 1800’s (Moser 1899 in Zadina, et al 1995)
Fish Use and Catch
There is no known fishery data on catch of fish in the North Thorne Project Area. Any fishery data that does
exist is generally lumped into data for the Thorne River. The North Thorne falls is known to local residents of
Thorne Bay and Outfitter Guides as a fishing spot for adult coho salmon. Adult coho salmon are also caught at
the North Thorne bridge area on the 3016000 road. Coho, sockeye, and pink salmon, steelhead, cutthroat trout,
and Dolly Varden char are harvested at the Gravelly Creek Picnic ground, Falls Creek hole, Crabapple Tree
hole, and Parking Lot hole along the Thorne River. Sportfishing, Subsistence fishing, Personal Use fishing, and
Outfitter Guide fishing take place at these fishing destinations.
The Alaska Department of Fish and Game (ADF&G) maintains a statewide database where sport fishing occurs,
the extent of participation, and species caught and harvested. This database is called the statewide harvest
survey (SWHS). The estimates generated are based on an annual survey of a subset of people who purchase
Alaska sport fishing licenses. During 1997 to 2006, the highest sport fishing use on the Thorne Bay Ranger
District occurred in the Thorne River System, which included Angel and Control Lakes, and Control and Goose
Creek. A total of 43,448 days fished were estimated by the SWHS in addition to sportfish harvest (Table 12)
[ADF&G 2007a].

24
Federal Subsistence uses means the customary and traditional uses by rural Alaskan residents of wild,
renewable resources for direct personal or family consumption as food, shelter, fuel, clothing, tools, or
transportation; for the making and selling of handicraft articles out of non-edible by-products of fish and
wildlife resources taken for personal or family consumption; for barter, or sharing for personal or family
consumption; and for customary trade on Federal public lands and waters (FWS 2011). The Thorne River also
had the highest number of Federal Subsistence fishing permits issued on the Thorne Bay Ranger District. A
total of 86 Federal Subsistence fishing permits were issued for years 2002 to 2006 (Table 12) [USFS 2008b].
Federal Subsistence harvest is also shown in Table 9.
Personal Use fishing is defined as the taking, fishing for, or possession of finfish, shellfish, or other fishery
resources, by Alaskan residents for personal use and not for sale or barter, with gill or dip net, seine, fish wheel,
long line, or other means defined by the Alaskan Board of Fisheries (ADF&G 2011b). The Thorne River had a
total of 147 personal use anglers for years 1997 to 2006 (Table 12) [ADF&G 2007b]. Personal Use harvest is
also shown in Table 9.
Outfitter Guide Fishing Use was determined from angler day counts returned to the USFS from Outfitter Guides
(Slayton 2008). This annual count is a condition of receiving a permit the following fishing season. It should
be noted that an unknown percent of the Alaska Statewide Sportfish Harvest Survey may include anglers that
fished with Outfitter Guides. Thus, fishing effort of anglers with Outfitter Guides is not able to be separated
from the Alaska Statewide Harvest Survey, but is actually an unknown subset of that data. The Thorne River
had the second highest number of angler days reported from Outfitter Guides on the Thorne Bay Ranger District
for years 2002 to 2006, approximately 959 angler days. It is known that Outfitter Guides occasionally use the
North Fork of the Thorne River when the mainstem Thorne River is overcrowded.
Table 12. Thorne System (streams & lakes) fishing effort and harvest by species, 1997- 2006. Data from ADF&G 2007a,
ADF&G 2007b, and USFS 2008.
Year Type Fishing
#
Anglers
Days
Fished SS RS PS CS SH RT CT DV
1997
Sportfish catch
1402 3911
1597 10 5479 799 410 1208 4659 6375
Sportfish harvest 802 0 992 0 0 82 81 719
Fed subsistence 0 0 0 0 0 0 0 0 0 0
personal use 8 unk 0 141 0 0 0 0 0 0
1998
Sportfish catch
844 4791
1655 76 2910 230 268 2744 6471 9011
Sportfish harvest 1020 76 1095 42 10 443 472 665
Fed subsistence 0 0 0 0 0 0 0 0 0 0
personal use 29 unk 30 382 3 2 0 0 0 0
1999
Sportfish catch
1560 5264
1847 0 10491 542 1306 133 1722 2810
Sportfish harvest 1308 0 1952 0 8 12 378 271
Fed subsistence 0 0 0 0 0 0 0 0 0 0
personal use 9 unk 2 98 29 2 0 0 0 0
2000
Sportfish catch
1574 5468
2083 211 8343 217 841 1724 4807 11360
Sportfish harvest 1323 164 525 0 0 258 527 1486
Fed subsistence 0 0 0 0 0 0 0 0 0 0
personal use 5 unk 14 17 11 1 0 0 0 0
2001
Sportfish catch
1058 3366
2843 425 7266 239 1226 439 2049 6681
Sportfish harvest 999 59 263 0 26 25 238 361
Fed subsistence 0 0 0 0 0 0 0 0 0 0
personal use 1 unk 8 0 7 0 0 0 0 0
2002
Sportfish catch
1392 5037
3675 374 5683 206 114 1704 2800 6985
Sportfish harvest 2224 19 921 8 0 152 193 1653
Fed subsistence 6 unk 21 0 11 0 0 0 0 0

25
personal use 21 unk 20 365 18 0 0 0 0 0
2003
Sportfish catch
1748 6535
3105 131 7183 427 361 635 4500 13113
Sportfish harvest 1672 0 344 0 9 65 75 2196
Fed subsistence 16 unk 16 10 0 0 10 0 0 0
personal use 14 unk 41 98 26 0 0 0 0 0
2004
Sportfish catch
1763 4303
2846 135 12957 1214 95 812 2570 6393
Sportfish harvest 1479 0 358 0 0 0 164 1221
Fed subsistence 24 unk 10 68 0 0 3 0 0 0
personal use 22 unk 28 427 10 0 0 0 0 0
2005
Sportfish catch
1347 4234
4932 36 6990 560 43 338 729 1291
Sportfish harvest 1824 0 230 0 0 52 139 94
Fed subsistence 14 unk 0 2 0 0 4 0 6 0
personal use 29 unk 7 547 2 0 0 0 0 0
2006
Sportfish catch
0 0
0 0 0 0 0 0 0 0
Sportfish harvest 0 0 0 0 0 0 0 0
Fed subsistence 26 unk 5 6 4 2 3 0 13 0
personal use 9 unk 42 51 0 0 0 0 0 0
unk=unknown; SS=silver (coho) salmon; RS=red (sockeye) salmon; PS=pink salmon; CS=chum salmon;
SH=steelhead; RT=rainbow trout; CT=cutthroat trout; DV=Dolly varden char
Watershed Conditions
Hydrologic Conditions
Only a few streams on Prince of Wales Island have been infrequently or intermittently gauged. There are no
stream gauges within or adjacent to the North Thorne Project Area, therefore no discharge data is available for
streams within the Project Area. The closest stream gauge is located in the Staney Creek drainage,
approximately 18 to 20 miles west-northwest of the Project Area. The Staney Creek drainage is 50.6 mi2 in
size, similar to the size of the North Thorne Project Area.
Typically, October is the wettest month, and July is the driest month in Southeast Alaska. Therefore, the
highest flows likely occur in the late fall and winter months, the lowest flows in the summer months. Because
of the steep slopes and relatively shallow soils within the Project Area, and the generally high rainfall, it is
assumed that runoff generally responds quickly to rainfall events. Discharge measurements in Staney Creek
support rapid streamflow response to precipitation (USGS 2004)
Stream Classes
Stream classes are a means to categorize stream channels based on the instream habitat and fish production
value.
Streams are separated into four class designations according to the Aquatic Habitat Management Handbook
(USFS 2001a) and the Tongass Forest Plan (USFS 2008). In general, Class I and Class II streams are fish-
bearing, whereas Class III and Class IV streams are non fish-bearing (Figure 6). There is about 253 miles of
stream within the Project Area (Table 13).
Class I: Streams and lakes with anadromous or adfluvial fish habitat; or high quality resident fish waters, or
habitat above fish migration barriers known to provide reasonable enhancement opportunities for anadromous
fish.

26
Class II: Streams with resident fish or fish habitat and generally steep (often 6-25 percent or higher) gradients
where no anadromous fish occur, and otherwise not meeting Class I criteria.
Class III: Perennial and intermittent streams with no fish populations or fish habitat, but have sufficient flow or
sediment and debris transport to directly influence downstream water quality or fish habitat capability. These
streams generally have bankfull widths greater than 1.5 meters (5 feet) and channel incision greater than 5
meters (15 feet); may be called Class III based on professional interpretation of stream characteristics.
Class IV: Other intermittent, ephemeral, and small perennial channels with insufficient flow or sediment
transport capabilities to directly influence downstream water quality or fish habitat capability. These streams
generally are shallowly incised into the surrounding hillslope.
Non-streams: Rills and other watercourses, generally intermittent and less than one foot in bankfull width,
showing little or no incisement into the surrounding hillslope or evidence of scour.
In addition to surface water streams, there are about 286 acres of lakes in the Project Area (Table 14). These
primarily support resident fish species which include Dolly Varden char, rainbow and coastal cutthroat trout.
Lakes also play an important role in juvenile sockeye salmon life history, providing food in the form of
phytoplankton and zooplankton and rearing habitat
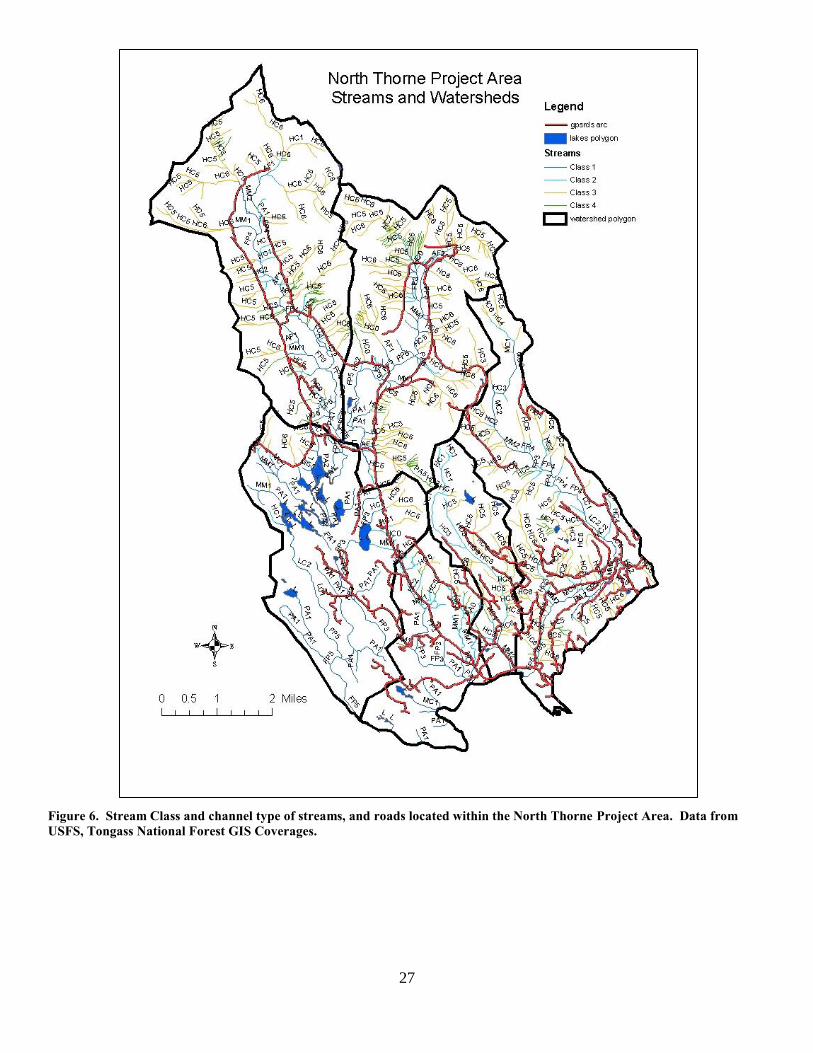
27
Figure 6. Stream Class and channel type of streams, and roads located within the North Thorne Project Area. Data from
USFS, Tongass National Forest GIS Coverages.

28
Table 13. Miles of stream, by watershed, stream class, and stream density in the North Thorne Project Area. Data from
USFS, Tongass National Forest GIS Coverages.
Watershed
Class I Class II Class III Class IV Total stream miles Stream Density (mi/mi2)
Lava Ck 11.2 8.6 28.8 3.6 52.2 4.7
Falls Ck 1.4 6.4 8.4 0.7 16.9 4.3
Unnamed Composite 7.2 6.9 1.4 2.3 17.8 3.4
West Fk North Thorne 12.8 4.8 31.91 10.6 60.1 4.6
Snakey Lakes Lowlands 25.7 3.4 4.5 0 33.6 3.2
East Fk North Thorne 13.9 4.7 42.0 11.5 72.1 6.0
Total miles 72.2 34.6 117.0 28.7 252.7 4.4 (average)
Percent of Project Area (29%) (14%) (46%) (11%) (100%)
Stream Process Groups
Streams in the Project Area have been assigned a channel type (USFS 1992). Channel typing stratifies stream
and lake sections within a watershed into different stream process groups. The process groups are based on
physical characteristics of streams and describe the interrelationship between watershed runoff, topography,
geology, and glacial or tidal influences on fluvial erosion and deposition. Channel types allow the prediction of
the physical responses of streams to different management activities. For a description of stream process
groups, see Appendix D of the Tongass Forest Plan (USFS 2008). There are seven process groups found within
the Project Area (Table 14).
Table 14. Miles of stream by process group and acres of lake habitat, by watershed in the North Thorne Project Area. Data
from USFS, Tongass National Forest GIS Coverages.
Process
Group
Miles of Stream
Lava
Creek
Falls
Creekk
Unnamed
Composite
W. Fk.
North
Thorne
Snakey
Lakes
E. Fk.
North
Thorne
Total
% of
Project
Area
Alluvial Fan 0.9 0.3 0 2.3 0.2 4.1 7.8 (3%)
Floodplain 4.4 0 1.9 5.9 7.5 4.4 24.1 (10%)
High
Gradient
Contained
40.1 15.5 7.0 45.5 6.9 55.1 170.1 (67%)
Large
Contained 1.3 0 0 0.7 1.8 0 3.8 (1%)
Moderate
Gradient
Contained
1.9 0 1.5 0 1.0 0.2 4.6 (2%)
Moderate
Gradient
Mixed
Control
2.6 0.9 3.6 3.1 2.4 5.0 17.6 (7%)
Palustrine 0.9 0.2 3.8 2.7 13.7 3.2 24.5 (10%)
Total 52.1 16.9 17.8 60.2 33.5 72.0 252.5 (100%)
Lakes (acres) 18.7 19.5 24.2 11.2 197.1 15.5 286.2
Stream process groups are also an indicator of the amount and quality of fish habitat within the Project Area.
The amount and quality of rearing habitat predicted by the various channel types has been established through
field studies within the Tongass National Forest. Floodplain, palustrine, alluvial fan, and moderate gradient
mixed control channels are sediment sensitive. Floodplain channels provide the greatest amount of spawning
area for salmon and much of the rearing area. Moderate gradient mixed control channels can also provide good
spawning and rearing habitat in the lower gradient sections. Palustrine channels are areas with low water

29
velocities, which are important rearing areas for juvenile coho salmon. The high gradient contained process
group has the most miles of stream within a process group (Table 14).
Beneficial Water Use
Water quality affects uses by humans, fish and aquatic organisms, and wildlife. There are no known domestic or
municipal water uses of streams, and no hydro projects within the North Thorne Project Area. Human use of
water in the Project Area is recreational; canoeing the Snakey Lakes area and lower North Fork of the Thorne
River and fishing. Water is sometimes used from nearby streams for road dust abatement, and other operations
surrounding drilling or rock pit use. The main water use in the Project Area is for recreation and the
propagation of trees, fish and wildlife.
Water Quality
Water quality includes the components of water chemistry, water temperature, and sediment. The natural
variability of climate, geology, soils, and vegetation generally result in differing values of these components.
Land use can alter the natural variability resulting in increased sediment delivery to streams, and variations in
water chemistry and water temperature. Water quality affects uses by humans, fish and aquatic organisms, and
other animals.
Limited water quality data exists for streams within the North Thorne Project Area. The University of Alaska
Anchorage, Environmental and Natural Resources Institute (ENRI) personnel began conducting biological
assessments of some streams within the North Thorne Project Area during 2002 (Major et al 2003). This survey
was part of a larger effort to develop a stream condition index for Southeast Alaska. Streams were designated
as either reference (watershed in pristine condition), stressed (watershed had been logged or had other land use
activities), or urban a priori. Macroinvertebrate samples and water chemistry samples were collected, and
visual physical habitat assessment were noted.
Water Chemistry
Water chemistry parameters collected by ENRI include conductivity, dissolved oxygen, pH, total dissolved
solids, and water temperature were measured at each site in situ using a Hydrolab Surveyor 4 and Minisonde
that was calibrated daily (Rinella et al 2005). This is basically a one day sample, and represents a one day
“snapshot” of data. Table 15 displays results of data collect by ENRI. Stressed streams within the North
Thorne Project Area are compared to streams in a nearby pristine watershed. Results do not appear to show
major differences between the stressed and pristine streams.
Table 15. Conductivity, dissolved oxygen percent and mg/l, pH, total dissolved solids ppm, and water temperature for streams
within the North Thorne Project Area (NTPA). Additional data is also shown for pristine streams outside the NTPA for
comparison. na=not assessed. Data from Rinella et al 2005.
Stream Name Stream
Type
Water
Color Date sampled
Conductivity
(us/cm)
D.O. (%
sat)
D.O.
(mg/l) pH
TDS
(ppm)
Temp
(oC)
Falls Ck (NTPA) stressed stained 4/25/2002 23 na na 7.4 0.0144 3.8
Lava Ck (NTPA) stressed stained 4/25/2002 23 na na 7.4 0.0143 4.7
West Fk North
Thorne(NTPA) stressed stained 4/25/2002 36 92 12.0 7.6 na 3.8
East Fk North
Thorne (NTPA) stressed stained 5/4/2003 28 88 11.0 7.0 na 5.9
Anderson Ck
Karta River reference stained 4/27/2002 22 79 12.3 7.5 0.0139 5.6
Unnamed trib
lower Karta River reference stained 4/28/2002 8 95 12.7 6.3 0.0053 3.2

30
Unnamed trib to
Salmon Lk. Karta
River
reference stained 4/27/2002 20 96 12.6 6.8 0.0127 3.6
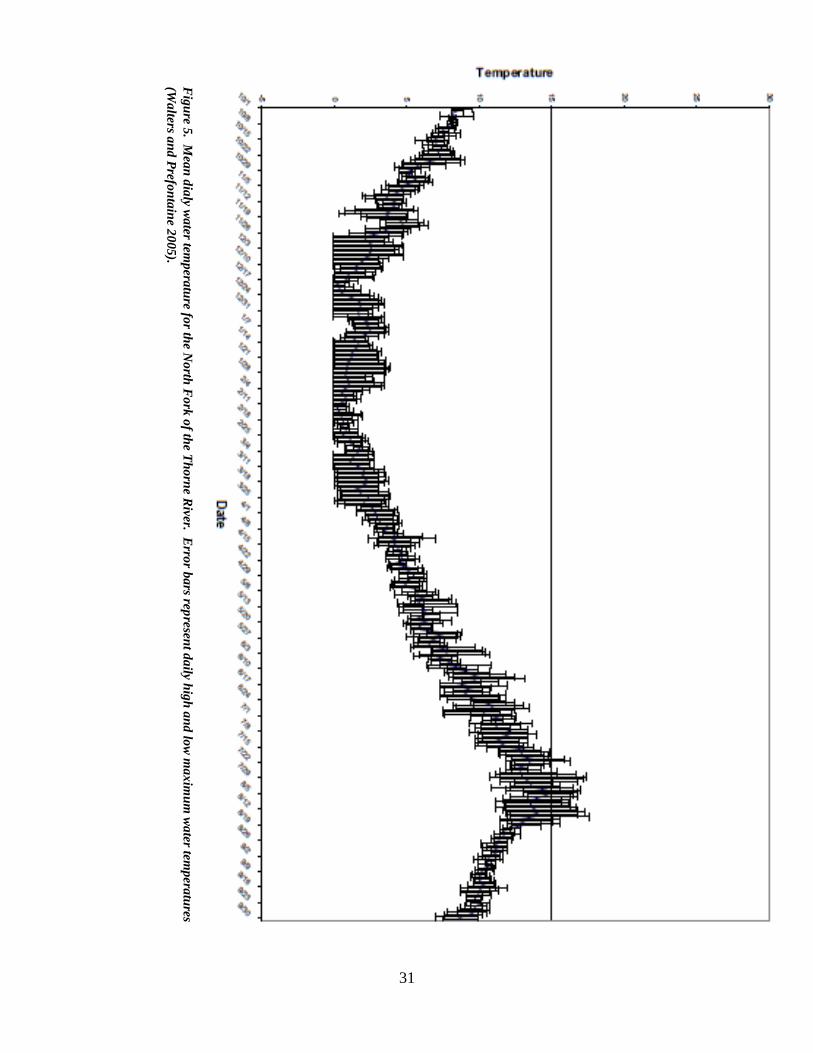
31
Fig
ure 5
. Mea
n d
ialy w
ater tem
pera
ture fo
r the N
orth
Fo
rk o
f the T
ho
rne R
iver. Erro
r ba
rs represen
t da
ily hig
h a
nd
low
ma
xim
um
wa
ter temp
eratu
res
(Wa
lters an
d P
refon
tain
e 20
05
).

32
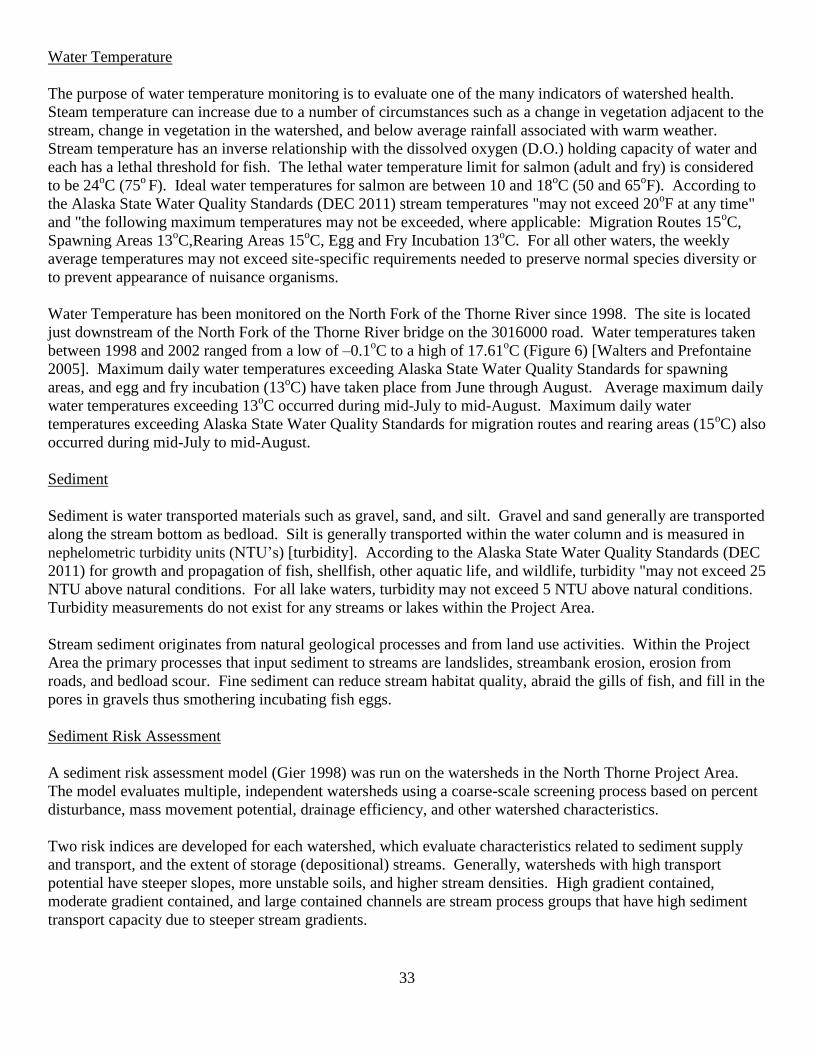
33
Water Temperature
The purpose of water temperature monitoring is to evaluate one of the many indicators of watershed health.
Steam temperature can increase due to a number of circumstances such as a change in vegetation adjacent to the
stream, change in vegetation in the watershed, and below average rainfall associated with warm weather.
Stream temperature has an inverse relationship with the dissolved oxygen (D.O.) holding capacity of water and
each has a lethal threshold for fish. The lethal water temperature limit for salmon (adult and fry) is considered
to be 24oC (75
o F). Ideal water temperatures for salmon are between 10 and 18
oC (50 and 65
oF). According to
the Alaska State Water Quality Standards (DEC 2011) stream temperatures "may not exceed 20oF at any time"
and "the following maximum temperatures may not be exceeded, where applicable: Migration Routes 15oC,
Spawning Areas 13oC,Rearing Areas 15
oC, Egg and Fry Incubation 13
oC. For all other waters, the weekly
average temperatures may not exceed site-specific requirements needed to preserve normal species diversity or
to prevent appearance of nuisance organisms.
Water Temperature has been monitored on the North Fork of the Thorne River since 1998. The site is located
just downstream of the North Fork of the Thorne River bridge on the 3016000 road. Water temperatures taken
between 1998 and 2002 ranged from a low of –0.1oC to a high of 17.61
oC (Figure 6) [Walters and Prefontaine
2005]. Maximum daily water temperatures exceeding Alaska State Water Quality Standards for spawning
areas, and egg and fry incubation (13oC) have taken place from June through August. Average maximum daily
water temperatures exceeding 13oC occurred during mid-July to mid-August. Maximum daily water
temperatures exceeding Alaska State Water Quality Standards for migration routes and rearing areas (15oC) also
occurred during mid-July to mid-August.
Sediment
Sediment is water transported materials such as gravel, sand, and silt. Gravel and sand generally are transported
along the stream bottom as bedload. Silt is generally transported within the water column and is measured in
nephelometric turbidity units (NTU’s) [turbidity]. According to the Alaska State Water Quality Standards (DEC
2011) for growth and propagation of fish, shellfish, other aquatic life, and wildlife, turbidity "may not exceed 25
NTU above natural conditions. For all lake waters, turbidity may not exceed 5 NTU above natural conditions.
Turbidity measurements do not exist for any streams or lakes within the Project Area.
Stream sediment originates from natural geological processes and from land use activities. Within the Project
Area the primary processes that input sediment to streams are landslides, streambank erosion, erosion from
roads, and bedload scour. Fine sediment can reduce stream habitat quality, abraid the gills of fish, and fill in the
pores in gravels thus smothering incubating fish eggs.
Sediment Risk Assessment
A sediment risk assessment model (Gier 1998) was run on the watersheds in the North Thorne Project Area.
The model evaluates multiple, independent watersheds using a coarse-scale screening process based on percent
disturbance, mass movement potential, drainage efficiency, and other watershed characteristics.
Two risk indices are developed for each watershed, which evaluate characteristics related to sediment supply
and transport, and the extent of storage (depositional) streams. Generally, watersheds with high transport
potential have steeper slopes, more unstable soils, and higher stream densities. High gradient contained,
moderate gradient contained, and large contained channels are stream process groups that have high sediment
transport capacity due to steeper stream gradients.

34
Transitional stream process groups include moderate gradient mixed control and alluvial fan channels.
Transitional stream process groups have moderate sediment retention capacity and are considered lower risk
than depositional channels because they tend to retain less amount of fine sediment and gravel, and have higher
proportions of stable substrate. Moderate gradient mixed control channels can also provide good spawning and
rearing habitat in the lower gradient sections.
Watersheds with high storage potential (depositional) have higher densities of low gradient depositional streams
for medium and long-term sediment storage. Depositional stream process groups include floodplain, palustrine,
and alluvial fan channels. Depositional stream process groups have a high sediment retention capacity and have
higher impact risk due to low gradients.
The transport and storage indices are combined into an overall Sediment Risk Index (SRI) under the assumption
that watersheds with high combinations of storage potential and transport potential represent the highest level of
concern for management activities. Watersheds with a high SRI usually have steep, unstable valley walls which
drain into well developed, low gradient valley bottom channels.
Watershed morphology and disturbance history help identify and rank areas according to potential for sediment
production and deposition. The SRI does not provide yield estimates, sediment discharge estimates, nor
identify impact thresholds. It can indicate the location and potential significance of sediment sources and
depositional areas within the watershed on measured characteristics known to correlate with sediment transport
and deposition. The SRI calculations for watersheds in the North Thorne Project are displayed in Table 16.
Table 16. Selected Sediment Risk Index values for watersheds in the North Thorne Project Area. Data from USFS, Tongass
National Forest GIS Coverages.
Lava Ck Falls Ck Unnamed
Composite
West Fk
North
Thorne
Snakey
Lakes
Lowlands
East Fk
North
Thorne
Sediment
Risk Index
value
81 40 89 88 100 97
Sediment
Risk Index
rank
5th 6th 3rd 4th 1st 2nd
Potential
Impact
Index value
35 34 100 75 2 74
Potential
Impact
Index rank
4th 5th 1st 2nd 6th 3rd
Depositional
Stream
Index
26 6 54 38 100 44
Transitional
Stream
Index
43 35 100 45 36 75
Drainage
Efficiency
Index
79 73 58 76 60 100
Transport
Potential
Index
100 76 57 83 43 84
Storage
Potential
Index
29 9 61 40 100 49

35
The Snakey Lakes Lowlands, East Fork, Unnamed Composite, West Fork, Lava Creek, and Falls Creek
watersheds ranked one through six respectively for sediment risk. This makes sense since the topography of the
West Fork, East Fork, Unnamed Composite, and Snakey Lakes Lowlands do contain steep slopes that transport
sediment, but also contain valley bottoms that capture and store that sediment.
Uplands/Hillslope Condition
Hillslopes in North Thorne Project Area are source areas for stream energy, large wood, and sediment. As the
headwater areas in North Thorne Project Area erode, the streams evolve and supply varying sizes of sediment to
the mid-slope and valley bottoms. The upper elevations capture precipitation and transfer it downslope with
stream power along high gradient, moderately incised stream channels. Shallow soils overlying glacially
compacted till have low permeability, thus during heavy rainfall water is shed downslope over the compacted
soil layer. Heavy watering in low permeable soils causes saturation resulting in increased shear stress and
decreased shear resistance. Overland surface flow may occur if the soil is completely saturated or if gravity
moves the water faster downslope than it can permeate through the top layers of the soil. These topographic
and hydrologic characteristics contribute to the erosions processes in the watershed such as landslides and soil
creep. In many places streams become blocked by debris moving downstream and redirect the stream overland,
crossing roads were no culvert exists, or plugging up culverts downstream and inboard road ditches with high
volumes of debris and bedload.
A dominate feature in the coastal temperate rainforests of Southeast Alaska is the natural disturbance regime.
In steep forested terrain with high soil water levels, mass wasting (landslides) is the dominant erosional process
(Swanston 1991). Topographic, geologic, and soil conditions in combination with high rainfall events are the
major factors that contribute to landslide events in Southeast Alaska. Steep forested terrain occurs throughout
the northern portion of North Thorne Project Area. This results in landslides along hillslopes and headwater
streams in North Thorne Project Area.
This Project Area has a history of unstable slopes and high frequency of landslides. Landslides can transport
large amounts of sediment into streams. Increased landslide frequencies can overwhelm a stream system with
sediment and alter the sediment regime. The effects of these slides on the mainstem reaches of streams in the
Project Area vary depending on location. Nine hundred-thirty acres of landslides have occurred in North
Thorne Project Area, and 160 streams have been impacted by those landslides. Landslides that reach streams are
able to transport wood and sediment directly to the mainstem streams, those that do not reach the creek tend to
deposit on the foot slopes and result in secondary pulses of sedimentation downslope.
Mass movement index (MMI) hazard classes are used to group soil map units (SMU’s) that have similar
properties relative to the stability of natural slopes. Slope gradient is the primary site factor determining the
stability of slopes; however, soil type and soil drainage class may also play a role in specific locations. Four
categories of MMI soils hazard classes exist, MMI 1 (most stable) through MMI 4 (least stable). Table 17
displays acres of MMI hazard soils by watershed.
Table 17. Mass Movement Index (MMI) hazard soil acres, landslide acres, and landslide acres impacting streams by
watershed for the North Thorne Project Area, Prince of Wales Island, Alaska. . Data from USFS, Tongass National Forest
GIS Coverages.
Watershed Name MMI 1 MMI 2 MMI 3 MMI 4 Landslide
acres
No. streams
impacted by
landslides
Landslide
acres
impacting
streams
Lava Creek 3533.6 288.6 3028.5 160.2 71 27 54
Falls Creek 1333 87.5 1036.7 9.3 17 7 13
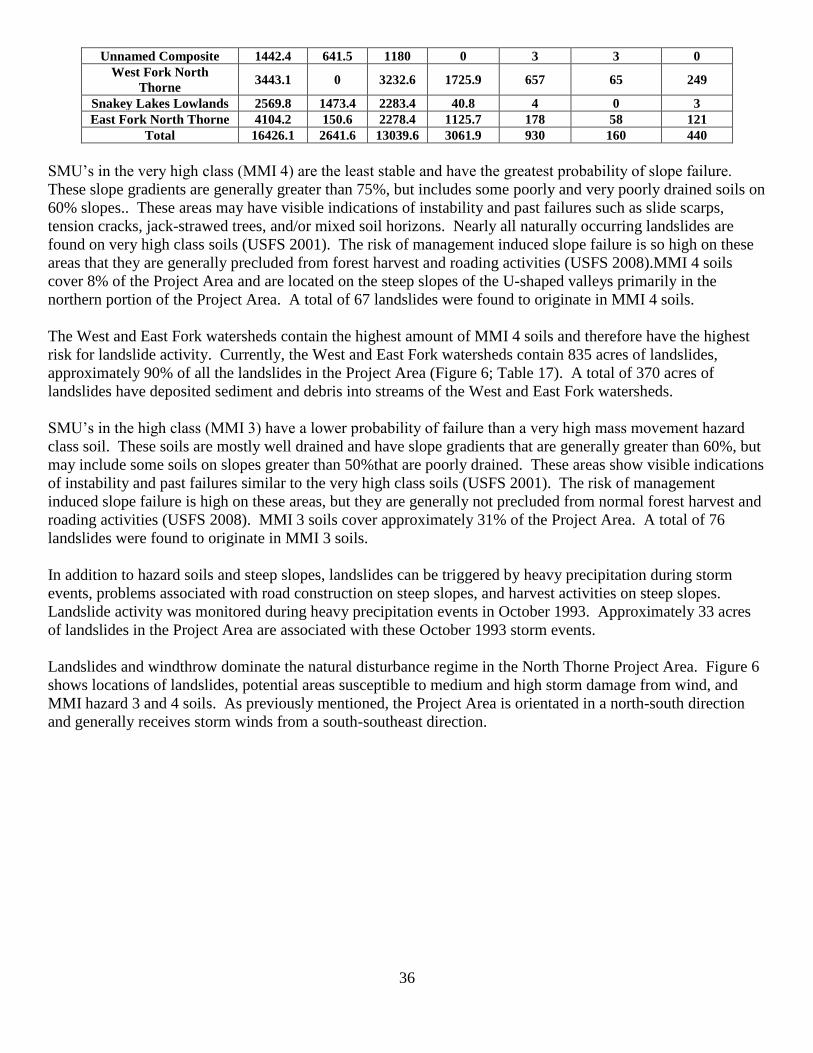
36
Unnamed Composite 1442.4 641.5 1180 0 3 3 0
West Fork North
Thorne 3443.1 0 3232.6 1725.9 657 65 249
Snakey Lakes Lowlands 2569.8 1473.4 2283.4 40.8 4 0 3
East Fork North Thorne 4104.2 150.6 2278.4 1125.7 178 58 121
Total 16426.1 2641.6 13039.6 3061.9 930 160 440
SMU’s in the very high class (MMI 4) are the least stable and have the greatest probability of slope failure.
These slope gradients are generally greater than 75%, but includes some poorly and very poorly drained soils on
60% slopes.. These areas may have visible indications of instability and past failures such as slide scarps,
tension cracks, jack-strawed trees, and/or mixed soil horizons. Nearly all naturally occurring landslides are
found on very high class soils (USFS 2001). The risk of management induced slope failure is so high on these
areas that they are generally precluded from forest harvest and roading activities (USFS 2008).MMI 4 soils
cover 8% of the Project Area and are located on the steep slopes of the U-shaped valleys primarily in the
northern portion of the Project Area. A total of 67 landslides were found to originate in MMI 4 soils.
The West and East Fork watersheds contain the highest amount of MMI 4 soils and therefore have the highest
risk for landslide activity. Currently, the West and East Fork watersheds contain 835 acres of landslides,
approximately 90% of all the landslides in the Project Area (Figure 6; Table 17). A total of 370 acres of
landslides have deposited sediment and debris into streams of the West and East Fork watersheds.
SMU’s in the high class (MMI 3) have a lower probability of failure than a very high mass movement hazard
class soil. These soils are mostly well drained and have slope gradients that are generally greater than 60%, but
may include some soils on slopes greater than 50%that are poorly drained. These areas show visible indications
of instability and past failures similar to the very high class soils (USFS 2001). The risk of management
induced slope failure is high on these areas, but they are generally not precluded from normal forest harvest and
roading activities (USFS 2008). MMI 3 soils cover approximately 31% of the Project Area. A total of 76
landslides were found to originate in MMI 3 soils.
In addition to hazard soils and steep slopes, landslides can be triggered by heavy precipitation during storm
events, problems associated with road construction on steep slopes, and harvest activities on steep slopes.
Landslide activity was monitored during heavy precipitation events in October 1993. Approximately 33 acres
of landslides in the Project Area are associated with these October 1993 storm events.
Landslides and windthrow dominate the natural disturbance regime in the North Thorne Project Area. Figure 6
shows locations of landslides, potential areas susceptible to medium and high storm damage from wind, and
MMI hazard 3 and 4 soils. As previously mentioned, the Project Area is orientated in a north-south direction
and generally receives storm winds from a south-southeast direction.
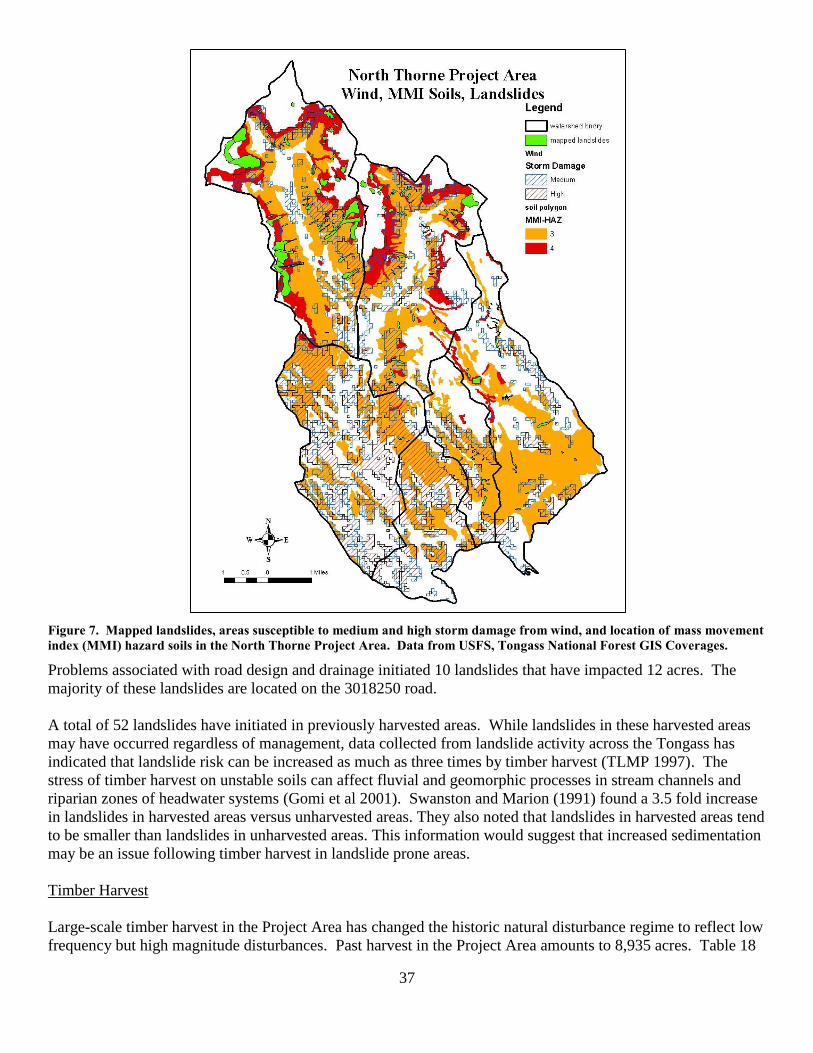
37
Figure 7. Mapped landslides, areas susceptible to medium and high storm damage from wind, and location of mass movement
index (MMI) hazard soils in the North Thorne Project Area. Data from USFS, Tongass National Forest GIS Coverages.
Problems associated with road design and drainage initiated 10 landslides that have impacted 12 acres. The
majority of these landslides are located on the 3018250 road.
A total of 52 landslides have initiated in previously harvested areas. While landslides in these harvested areas
may have occurred regardless of management, data collected from landslide activity across the Tongass has
indicated that landslide risk can be increased as much as three times by timber harvest (TLMP 1997). The
stress of timber harvest on unstable soils can affect fluvial and geomorphic processes in stream channels and
riparian zones of headwater systems (Gomi et al 2001). Swanston and Marion (1991) found a 3.5 fold increase
in landslides in harvested areas versus unharvested areas. They also noted that landslides in harvested areas tend
to be smaller than landslides in unharvested areas. This information would suggest that increased sedimentation
may be an issue following timber harvest in landslide prone areas.
Timber Harvest
Large-scale timber harvest in the Project Area has changed the historic natural disturbance regime to reflect low
frequency but high magnitude disturbances. Past harvest in the Project Area amounts to 8,935 acres. Table 18
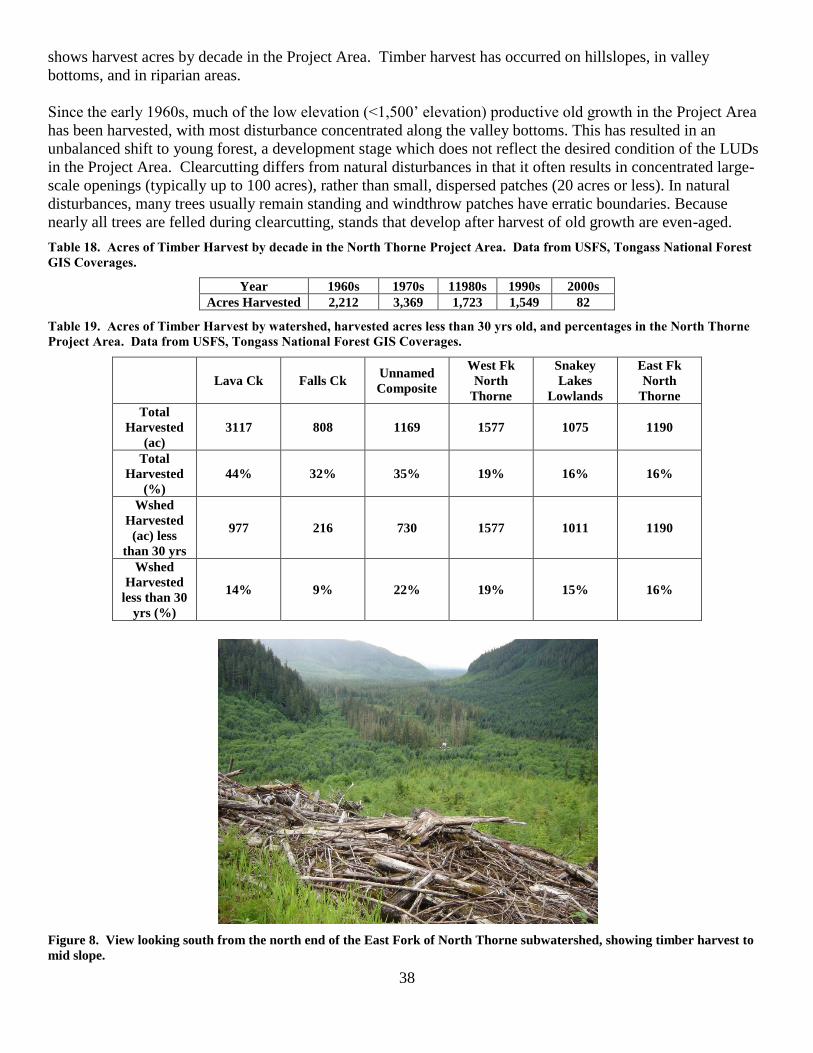
38
shows harvest acres by decade in the Project Area. Timber harvest has occurred on hillslopes, in valley
bottoms, and in riparian areas.
Since the early 1960s, much of the low elevation (<1,500’ elevation) productive old growth in the Project Area
has been harvested, with most disturbance concentrated along the valley bottoms. This has resulted in an
unbalanced shift to young forest, a development stage which does not reflect the desired condition of the LUDs
in the Project Area. Clearcutting differs from natural disturbances in that it often results in concentrated large-
scale openings (typically up to 100 acres), rather than small, dispersed patches (20 acres or less). In natural
disturbances, many trees usually remain standing and windthrow patches have erratic boundaries. Because
nearly all trees are felled during clearcutting, stands that develop after harvest of old growth are even-aged.
Table 18. Acres of Timber Harvest by decade in the North Thorne Project Area. Data from USFS, Tongass National Forest
GIS Coverages.
Year 1960s 1970s 11980s 1990s 2000s
Acres Harvested 2,212 3,369 1,723 1,549 82
Table 19. Acres of Timber Harvest by watershed, harvested acres less than 30 yrs old, and percentages in the North Thorne
Project Area. Data from USFS, Tongass National Forest GIS Coverages.
Lava Ck Falls Ck Unnamed
Composite
West Fk
North
Thorne
Snakey
Lakes
Lowlands
East Fk
North
Thorne
Total
Harvested
(ac)
3117 808 1169 1577 1075 1190
Total
Harvested
(%)
44% 32% 35% 19% 16% 16%
Wshed
Harvested
(ac) less
than 30 yrs
977 216 730 1577 1011 1190
Wshed
Harvested
less than 30
yrs (%)
14% 9% 22% 19% 15% 16%
Figure 8. View looking south from the north end of the East Fork of North Thorne subwatershed, showing timber harvest to
mid slope.

39
Roads
The Project Area has been extensively roaded, primarily in support of past timber harvest. There are 96 miles of
existing road within the Project Area, 93 miles of which are Forest Service roads. Further, there is an average
road density of 1.9 miles of road per square mile of watershed (Table 20). The road system connects the Project
Area to Thorne Bay, Craig, Klawock, and Hollis in the south and Coffman Cove, Naukati, and Whale Pass in
the north.
Table 20. Road Mileage and Road Density in the North Thorne Project Area. Data from USFS, Tongass National Forest GIS
Coverages.
Watershed Lava Ck Falls Ck Unnamed
Composite
West Fk
North Thorne
Snakey Lakes
Lowlands
East Fk North
Thorne
Road Mileage 30.8 9.8 14.4 11.7 15.1 14.3 96.1 (Total)
Road Density
(mi/mi2)
2.8 2.5 2.7 0.9 1.4 1.2 1.92 (Average)
Timber harvest and road construction can accelerate sediment production (USFS 2008b). Roads have been
found to contribute more sediment to streams than any other land management activity (Gucinski, and others
2001), and pose the greatest potential risk to watershed resources and fish habitat capabilities (Furniss and
others 1991, Ziemer 1997). The effects of roads on aquatic habitat and populations are well documented and
overwhelmingly negative. Fine-sediment, a common consequence of road-derived sediments entering streams,
has been linked to decreased fry emergence, decreased juvenile fish densities, loss of winter carrying capacity,
increased predation of fishes, and can reduce aquatic insect populations and algal production (Gucinski, and
others 2001).
Table 21. Number of Stream Crossings by Stream Class in the Project Area. *= Data from RCS surveys; **= Data from
USFS, Tongass National Forest GIS Coverages.
Stream Class Number
Class I 37*
Class II 69*
Class III 107**
Class IV 24**
Roads can affect watershed processes, modifying natural hillslope drainage and accelerate erosion (Furniss et al.
1991; Ziemer 1997). The disruption of stream flow connectivity can continue even after road storage and
culvert removal, it also may be corrected through culvert removal and proper road storage. Road construction
also has the potential to block fish migration and affect upstream fish passage through improper placement or
sizing of culverts. There are at least 237 stream crossings by road in the Project Area (Table 21).
Valley/Floodplain Conditions
Large Wood Dependent Channels
Large wood dependent channels (AF, FP, MM channel types) make up 20% of the channel types in the Project
Area, and total 49.5 miles of stream (Table 14). These channel types have the ability to capture and hold legacy
large wood and are mainly located in the Lava Creek watershed, and the West Fork, East Fork, and Snakey
Lakes subwatersheds.

40
Of all riparian areas, floodplains are some of the most productive sites for lowland timber, wildlife and fish on
the Tongass National Forest (USFS 2008b). Floodplains are composed of nutrient-rich sediments and are
typically found in broad, flat, alluvial U-shaped valleys. About 10% (24 miles) of the stream mileage in the
project area is floodplain channel, and 12% (596 acres) of riparian management area (RMA) is floodplain.
About 114 acres (19%) of floodplain RMA has been previously harvested. About 0.39 acres of landslides has
dispersed onto floodplain RMAs. Currently, 0.6 miles of road crosses floodplain channels, at the North Fork
Thorne River bridge (3016000), the Upper North Fork of Thorne River (3015000, two logs spanning stream,
undrivable), and at the East Fork bridge on the East Fork of North Fork Thorne River (3015000).
Riparian Vegetation
An important part of watershed health and function are the riparian areas. The Forest Plan (USFS 2008) defines
riparian areas as “…areas [which] encompass the zone of interaction between the aquatic and terrestrial
ecosystems, and include riparian stream sides, lakes, and floodplains with distinctive resource values and
characteristics.” Riparian areas have distinctive resource values and characteristics, and can be geographically
delineated. The vegetation condition plays a key role in the function of riparian management areas. Riparian
areas provide a source of large wood for input into streams. This is important in maintaining habitat complexity
for anadromous and resident fish in the form of pool habitat, spawning habitat and escape cover. The
vegetation in riparian areas provides stream bank stabilization via root masses. Trees in riparian areas also help
provide a broader shade canopy along streams, which is important for maintaining water quality, including
optimum water temperatures for the production of fish species.
Figure 9. Alder dominated riparian area due to harvest of Old Growth trees up to the streambank in the upper West Fork
subwatershed. Note also bedload aggregation due to lack of a stable channel.
The North Thorne Project Area has 5,020 acres of RMA along Class I, II, and III streams Past timber harvest
practices removed 1,311 acres (26%) of riparian vegetation to the stream bank within the Project Area. Fish
habitat has been most adversely affected in the streams where timber was harvested without leaving riparian
41
buffers. Generally, these areas lack large instream woody debris that is necessary for pool formation and other
fish habitat. Loss of trees along stream banks also leads to a loss of the roots that hold the banks together,
because roots decay after three to five years following harvest (Hartman et al 1996). The affected streams then
show signs of becoming wider and shallower, because the banks and channels have become unstable. Past
removal of riparian vegetation has affected sediment delivery, fish habitat, and stream productivity. Current
riparian Standards and Guidelines require no-harvest buffers along all Class I, II, and III streams.
In the 1980’s it was a common practice to remove LWD from stream channels as logjams were thought to cause
barriers to upstream movement of fish. While there is no direct documentation of LWD removal from streams
in the Project Area, LWD may have been removed from Falls Creek in particular (200 m segment of old road in
and adjacent to stream). LWD is important for capturing sediment and releasing slowly over time, rather than
in a “large burst”. LWD also sorts out bedload, creating spawning gravels for fish. LWD deflects flows,
helping to protect streambanks from excessive erosion, and forms low flow velocities along channel margins.
LWD helps create pools, and form off channel and channel margin habitat thus creating fish rearing habitat.
Total riparian thinning completed to date for Class I streams is 80 acres, and for Class II streams is 60 acres
(Table 22). Along Class III streams the total riparian thinning to date is 60 acres (Table 23).
Table 22. Stand number, Year originally harvested, and approximate acres of Class I and II stream riparian thinning
completed, and year thinned within the North Thorne Project Area (based on one side of stream, 100 ft wide riparian area).
Stand Number Year
Harvested
Watershed
Location
Acres Class I
stream
(100 ft wide, 1 side
only)
Acres Class II
stream
(100 ft wide, 1 side
only)
Year
Thinned
580010172 1976 West Fork 4.32 3.62 2009
580010501 1976 West Fork 6.01 0 2008
580010505 1976 West Fork 7.59 1.72 2005
580020511 1976 East Fork 12.62 0 2005
578010501 1977 West Fork 1.48 0 2008
579020506 1966 Lava & Falls
Creek
7.33 23.81 2004
579020507 1971 Lava Creek 0 10.54 2004
580010508 1977 West Fork 2.48 0 2005
580010509 1977 West Fork 14.97 0 2002
580010502 1979 West Fork 0 5.99 2008
580010511 1987 West Fork 0 3.66 2009
580010512 1986 East Fork 0 1.92 2009
580010521 1979 West Fork 4.32 8.59 2008
578010506 1987 Snakey Lks &
Unnamed
Composite
14.13 0 2007
578010511 1988 Snakey Lakes 4.33 0 2007
Total 80 60
Table 23. Stand number, Year originally harvested, and approximate acres of Class III stream riparian thinning completed,
and year thinned within the North Thorne Project Area (based on one side of stream, 100 ft wide riparian area).
Stand Number Year
Harvested
Watershed
Location
Acres Class III
stream
(100 ft wide, 1
side only)
Year
Thinned
579020506 1966 Lava & Falls
Creek 114.46 2004
579020507 1971 Lava Creek 64.72 2004
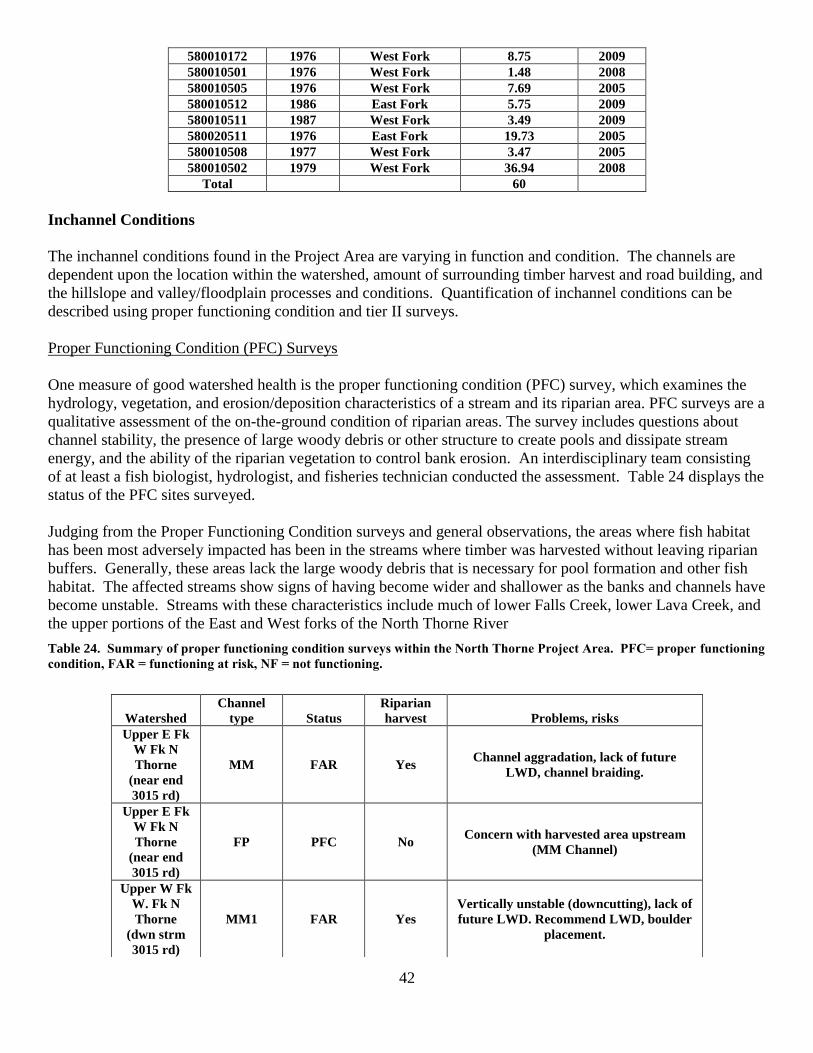
42
580010172 1976 West Fork 8.75 2009
580010501 1976 West Fork 1.48 2008
580010505 1976 West Fork 7.69 2005
580010512 1986 East Fork 5.75 2009
580010511 1987 West Fork 3.49 2009
580020511 1976 East Fork 19.73 2005
580010508 1977 West Fork 3.47 2005
580010502 1979 West Fork 36.94 2008
Total 60
Inchannel Conditions
The inchannel conditions found in the Project Area are varying in function and condition. The channels are
dependent upon the location within the watershed, amount of surrounding timber harvest and road building, and
the hillslope and valley/floodplain processes and conditions. Quantification of inchannel conditions can be
described using proper functioning condition and tier II surveys.
Proper Functioning Condition (PFC) Surveys
One measure of good watershed health is the proper functioning condition (PFC) survey, which examines the
hydrology, vegetation, and erosion/deposition characteristics of a stream and its riparian area. PFC surveys are a
qualitative assessment of the on-the-ground condition of riparian areas. The survey includes questions about
channel stability, the presence of large woody debris or other structure to create pools and dissipate stream
energy, and the ability of the riparian vegetation to control bank erosion. An interdisciplinary team consisting
of at least a fish biologist, hydrologist, and fisheries technician conducted the assessment. Table 24 displays the
status of the PFC sites surveyed.
Judging from the Proper Functioning Condition surveys and general observations, the areas where fish habitat
has been most adversely impacted has been in the streams where timber was harvested without leaving riparian
buffers. Generally, these areas lack the large woody debris that is necessary for pool formation and other fish
habitat. The affected streams show signs of having become wider and shallower as the banks and channels have
become unstable. Streams with these characteristics include much of lower Falls Creek, lower Lava Creek, and
the upper portions of the East and West forks of the North Thorne River
Table 24. Summary of proper functioning condition surveys within the North Thorne Project Area. PFC= proper functioning
condition, FAR = functioning at risk, NF = not functioning.
Watershed
Channel
type
Status
Riparian
harvest
Problems, risks
Upper E Fk
W Fk N
Thorne
(near end
3015 rd)
MM FAR Yes Channel aggradation, lack of future
LWD, channel braiding.
Upper E Fk
W Fk N
Thorne
(near end
3015 rd)
FP PFC No Concern with harvested area upstream
(MM Channel)
Upper W Fk
W. Fk N
Thorne
(dwn strm
3015 rd)
MM1 FAR Yes
Vertically unstable (downcutting), lack of
future LWD. Recommend LWD, boulder
placement.

43
Upper W Fk
W Fk N
Thorne (dwn
strm 3015
rd)
FP4 FAR Yes
Lack of future LWD, primarily alder.
Sediment aggregation, disturbances and
additional input could overload system.
Recommend LWD placement.
Lower W Fk
N Thorne
(upstrm
NThorne
bridge 3015
rd)
FP4 FAR One bank,
less on 2nd
Sediment aggregation. LWD low, most
piled up in two jams on meander. Future
LWD sources somewhat limited by
harvested bank.
Lower W Fk
N Thorne
(upstrm
NThorne
bridge 3016
rd)
FP4 PFC One bank,
less on 2nd
LWD low, future sources somewhat
limited.
Upper W Fk
E Fk N
Thorne
(below
3015640 rd)
FP4 PFC No
Minor downcutting. Lateral movement
from some deposition, but most deposition
is upstream. This stream segment is
functioning properly.
Upper W Fk
E Fk N
Thorne
(below
3015640 rd)
MM1 FAR Yes
Limited sources of future LWD, except
some in upstream area. Downcutting in
area above road where sediment loading
occurred. Some raw banks. Some conifer
release, thinning opportunities.
Upper E Fk
N Thorne
(above
3015640 rd)
MM1 PFC Yes
This stream segment is functioning
properly, but concerns with limited
sources of future LWD. Minor channel
constriction at road crossing.
Downcutting channel suggests some LWD
would capture bedload and distribute less
bedload to stream segment below 3015640
road.
Upper E Fk
N Thorne
(below
3015640 rd)
FP3 FAR Yes, part of
Concerns with limited sources of future
LWD. Sever bedload aggregation. Some
LWD placement.
Upper E Fk
N Thorne
(below
3015640 rd)
FP3 PFC Yes, part of
This stream segment is functioning
properly, but concerns with limited
sources of future LWD.
Lower E Fk
N Thorne
(above E Fk
bridge 3015
rd)
FP5 PFC No This stream segment is functioning
properly
Lower E Fk
N Thorne
(above/below
E Fk bridge
3015 rd)
FP5 PFC One bank
This stream segment is functioning
properly, but concerns with limited
sources of future LWD from harvested
bank.
Lower E Fk
N Thorne
(below E Fk
bridge 3015
rd)
FP5 PFC No This stream segment is functioning
properly
Lower Lava FP4 FAR Yes Lack of future LWD. Sediment

44
Ck (Thorne
River
upstrm to no
harv)
aggradation. Channel constrictions from
roadfill. Unstable banks and channels.
Recommend removal of fill, LWD and
boulder addition.
Lower Lava
Ck (no harv
area below
3017 rd)
MC3 PFC No
This stream segment is functioning
properly. Unknown effects from harvest
in rest of watershed.
Lower Lava
Ck (below
3017 rd)
MM2 FAR Yes
Little LWD in stream, lack of future
sources. Some downcutting, undercutting
of banks. Few pools or spawning gravels.
Recommend riparian thinning.
Upper Lava
Ck
(above 3017
rd)
LC2 PFC No Adequate LWD. Geologic containment
leads to stable channel.
Lower Falls
Ck (Thorne
River to
falls)
Primarily
MM1, with
small
sections
FP4, MC1
NF Yes
No LWD or future sources on harvested
section. Unstable, downcutting channels
in section. Sinuosity, width/depth out of
balance. Some past LWD placement,
could use more LWD.

45
Figure 10. Aggregrated bedload surrounding conifers in a side channel in the upper East Fork subwatershed below the
3015640 road crossing
Figure 11. Wide width-to-depth ratio in upper East Fork subwatershed below 3015640 road crossing.
Figure 12. Down-cut channel in upper East Fork subwatershed above 3015640 road crossing.

46
Tier II Surveys
Tier II surveys provide quantitative habitat measurements necessary to evaluate the condition of a stream
relative to riparian habitat management objectives. Measurements include macro pool frequency, total count of
large woody debris (LWD), average width and depth, substrate type, channel cross sectional, and fish species
observed for each channel type.Stream parameter measurements from Tier II surveys of over 100 streams on the
Tongass National Forest are summarize in Table 25.
Table 25. Mean and the 25th
, 50th
, and 75th
percentiles for total LWD/m, total key pieces LWD/m, and number of pools/km for
streams on the Tongass National Forest (USFS 2007).
Habitat
Attribute
Percentile Non
Harvested FP
Process
Group
Non
Harvested
MM Process
Group
Total
LWD/m
25th 0.26 0.27
50th 0.36 0.38
75th 0.50 0.50
Total Key
Pieces
LWD/m
25th 0.04 0.05
50th 0.10 0.12
75th 0.15 0.14
Number
Pools/km
25th 30 40
50th 45 60
75th 70 70
Table 26. Stream parameter measurements for Tier II surveys conducted on streams in the North Thorne Project Area. Data
based on field surveys. Grayed cells are below the 75th
percentile for a given parameter.
Habitat
Attribute
E Fk N
Thorne
near
3015640
rd
E Fk N
Thorne
below E
Fk bridge
(reach 1)
E Fk N
Thorne
near E Fk
bridge
(reach 2)
E Fk N
Thorne
above E
Fk bridge
(reach 3)
Upper W
Fk N
Thorne
near
3015000
Lower
Falls Ck
Lower
Lava Ck
Harvested Yes No Yes, 1
bank No Yes No Yes
Stream
Process
Group
FP FP FP FP FP MM FP
Stream
Reach
Length
135.6m 301m 300m 436m 290m 540m 374m
Total
LWD/m 0.75 0.64 0.447 0.729 0.39 0.376 0.294
Total Key
Pieces
LWD/m
0.22 0.050 0.063 0.075 0.045 0.024 0.019
Number
Pools/km 132.7 73.1 53.3 78 55.2 25.9 13.36

47
Table 26 shows results of tier II surveys. The tier II site on the East Fork of North Thorne near the 3015640
road crossing exceeded the 75th
percentiles for Total LWD/m, Total Key Pieces LWD/m, and Number of
Pools/km. Reach 1 of the East Fork of North Thorne below the East Fork Bridge was below the 50th
percentile
for Total Key Pieces LWD/m. Reach 2 of the East Fork of North Thorne near the East Fork Bridge was below
the50th
percentile for Total Key Pieces LWD/m, and below the 75th
percentile for Total LWD/m and Number of
Pools/km. Reach 3 of the East Fork of North Thorne above the East Fork Bridge was below the 50th
percentile
for Total Key Pieces LWD/m. The tier II site on the upper West Fork of North Thorne near the 3015000 bridge
road crossing (MP 11.94) was at the 50th
percentile for Total LWD/m, at the 25th
percentile for Total Key Pieces
LWD/m, and below the 75th
percentile for Number of Pools/km. The tier II site on Lower Falls Creek was at
the 50th
percentile for Total LWD/m, and below the 25th
percentile for Total Key Pieces LWD/m and Number of
Pools/km. The tier II site on Lower Lava Creek was at the 25th
percentile for Total LWD/m, and below the 25th
percentile for Total Key Pieces LWD/m and Number of Pools/km.
Road Condition Surveys (RCS)
RCS is an inventory of roads and their associated stream crossing structures. The survey can be utilized to
determine the status of roads, fish passage problems, sources of sediment, future potential for road failures, and
restoration opportunities.
The Project Area’s extensive road network is an important source of sediment delivery to streams. Roads
modify the natural hillslope drainage and accelerate erosion. Common causes of accelerated erosion from roads
include unstable road fills, over-steepened road cuts, intercepted and rerouted surface and subsurface water,
undersized and poorly placed culverts, and the diversion of streams at road crossings.
Abandoned or unmaintained roads in the Project Area have been shown consistently to pose long-term
problems. These roads are subject to fail during large storm events because road drainage features no longer
function as designed and culverts deteriorate or become clogged with debris. This results either in failure of the
road fill at the stream crossing or diversion of water from the stream channel and down the road to areas
unaccustomed to increased water discharge (Ziemer 1997)
Road Storage
Existing roads in the Project Area are eroding and generating sediment input into streams, thereby adversely
affecting fish and fish habitat. Not maintaining and properly storing roads has had negative impacts to fish and
fish habitat. Due to road storage opportunities, 16 miles of road has been properly stored in the Project Area
(Table 27). This has removed 14 red or gray fish crossings, allowing fish unimpeded access to upstream
habitat. Further, at least 145 other culverts (pipes) where removed and 107 waterbars where constructed,
restoring hydrologic connectivity and reducing sedimentation entering streams.
Table 27. Roads that have been currently stored in the North Thorne Project Area.
Road No. Begin
MP
End
MP
Total
Miles
Year
Stored Comments
3015000 9.16 12.6 3.44 2008 Removed 2 red pipes, landslide (2007), remove 58 other pipes,
add 8 waterbars.
3015200 0.5 2.7 2.2 2008 Removed 2 red pipes, 1 green pipe, remove 23 other pipes, add
31 waterbars
3015208 0 0.4 0.4 2008 Remove 3 pipes, add 4 waterbars
3015225 0 0.72 0.72 2008 Add 7 waterbars
3015230 0 1.2 1.2 2008 Remove 2 red pipes, 1 gray pipe, 6 other pipes, add 15
waterbars
3016100 0 0.23 0.23 2005 Remove 1 red pipe, add 10 waterbars

48
3017000 1.029 2.959 1.93 2005 Remove 1 red xing, 1gray crossing, 1 green xing, other log
culverts (unknown #), add waterbars (unknown #)
3017170 0 1.24 1.24 2007 Remove 22 pipes
3017350 0 1.514 1.514 2005/2008 Remove 4 red xings, 16 log culverts, add 3 waterbars
3015000_2.91R 0 0.37 0.37 2005 Remove 1 red pipe, add 17 waterbars
3015105_0.96L 0 0.43 0.43 2005 Removed 1 red pipe.
3015017_0.44L 0 0.26 0.26 2005 Remove 1 red pipe, 1 other pipe, add 6 waterbars
3015230_0.33R 0 0.97 0.97 2008 Remove 2 pipes, add 3 waterbars
3015208_0.26R 0 0.04 0.04 2008 Add 1 waterbar
3015200_1.28R 0 0.55 0.55 2008 Remove 3 pipes, add 3 waterbars
3015200_1.85L 0 0.21 0.21 2008 Add 2 waterbars
3015200_1.96R 0 0.312 0.312 2008 Add 2 waterbars
Total 16.016
Fish Passage
Fish require unhampered access up and down streams for access to appropriate spawning and rearing habitat,
available food, and adequate shelter. Providing for fish passage at stream and road intersections is an important
consideration when constructing or reconstructing forest roads. Road crossings commonly act as barriers to the
movement of fishes and other aquatic organisms (Furniss et al. 1991). Improperly located, installed, or
maintained stream crossing structures can restrict fish movement, thereby adversely affecting fish populations.
Culverts in the Project Area that are obstacles to upstream fish migration are characterized by vertical barriers,
debris blockages, and excessive water velocity caused by increased gradient during culvert installing and/or
constricting the stream channel through installing undersized culverts.
Guidelines for fish passage through culverts are specified in the Aquatic Habitat Management Handbook (USFS
2001, sect. 34.2: 22 to 31). These guidelines should be used in all proposed road storage, reconstruction, and
new road construction in this Project Area from this point in time forward. The guiding criteria for culvert
design is to allow for natural migration by adult and juvenile fish through the culvert during flows equal to or
less than the discharge predicted to occur two days before or after the mean annual flood flow.
A culvert is determined to be a blockage to fish passage if it fails to allow passage of a designated species and
life stage at or below a designated stream flow. The designated species, or design fish, for Class I (anadromous)
fish streams is a 55 mm juvenile coho salmon. The design species for a Class II (resident) fish streams is a
juvenile Dolly Varden char, rainbow trout, or cutthroat trout.
The Tongass National Forest has developed a juvenile fish passage evaluation criteria matrix with an
interagency group of interdisciplinary professionals. The evaluation matrix stratifies culverts by type, and
establishes criteria thresholds for culvert gradient, stream channel constriction, debris blockages, and vertical
barrier (or perch) at culvert outlet. The categories are:
Green: conditions that have a high certainty of meeting juvenile fish passage at all desired stream flows,
Gray: conditions are such that additional or more detailed analysis is required to determine their juvenile
fish passage ability. This additional analysis includes use of the FishXing analytical model developed by
the USFS and others (USFS 2003), and
Red: conditions that have a high certainty of not providing juvenile fish passage at all desired stream
flows.
About 112 stream crossings on Class I and II streams (fish streams) have been identified in the Project Area
using RCS, 63 green and 49 red (Table 28).
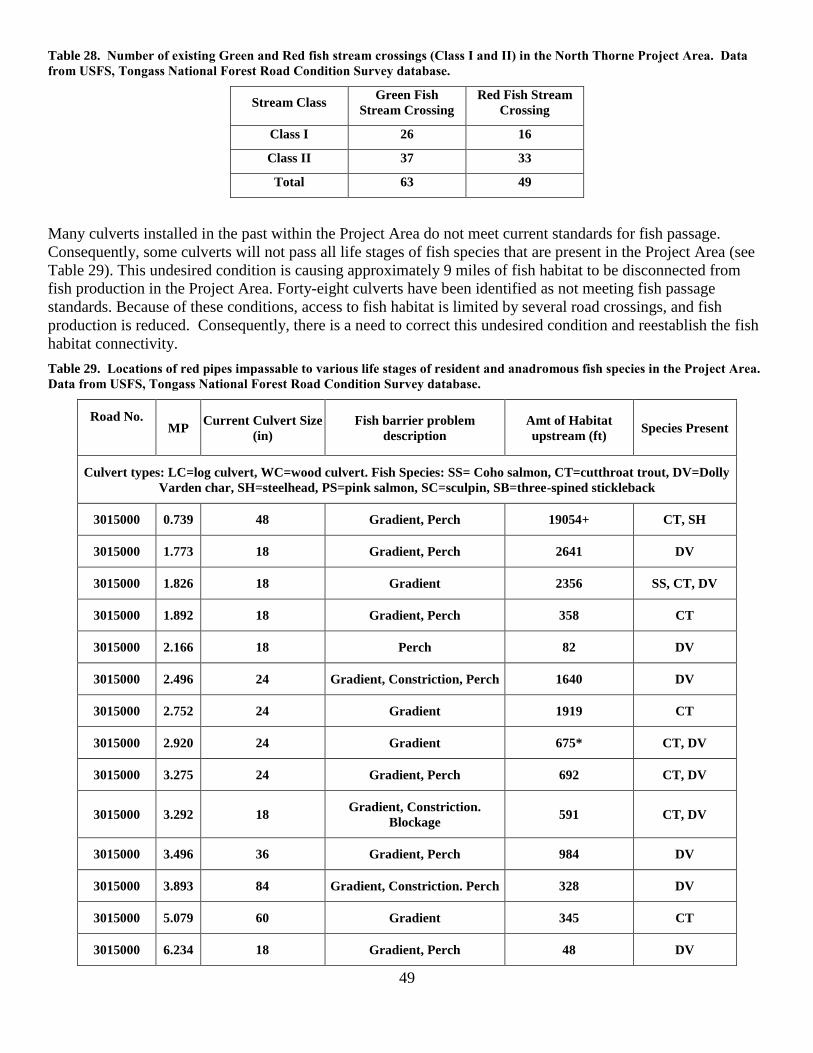
49
Table 28. Number of existing Green and Red fish stream crossings (Class I and II) in the North Thorne Project Area. Data
from USFS, Tongass National Forest Road Condition Survey database.
Stream Class Green Fish
Stream Crossing
Red Fish Stream
Crossing
Class I 26 16
Class II 37 33
Total 63 49
Many culverts installed in the past within the Project Area do not meet current standards for fish passage.
Consequently, some culverts will not pass all life stages of fish species that are present in the Project Area (see
Table 29). This undesired condition is causing approximately 9 miles of fish habitat to be disconnected from
fish production in the Project Area. Forty-eight culverts have been identified as not meeting fish passage
standards. Because of these conditions, access to fish habitat is limited by several road crossings, and fish
production is reduced. Consequently, there is a need to correct this undesired condition and reestablish the fish
habitat connectivity.
Table 29. Locations of red pipes impassable to various life stages of resident and anadromous fish species in the Project Area.
Data from USFS, Tongass National Forest Road Condition Survey database.
Road No.
MP
Current Culvert Size
(in)
Fish barrier problem
description
Amt of Habitat
upstream (ft) Species Present
Culvert types: LC=log culvert, WC=wood culvert. Fish Species: SS= Coho salmon, CT=cutthroat trout, DV=Dolly
Varden char, SH=steelhead, PS=pink salmon, SC=sculpin, SB=three-spined stickleback
3015000 0.739 48 Gradient, Perch 19054+ CT, SH
3015000 1.773 18 Gradient, Perch 2641 DV
3015000 1.826 18 Gradient 2356 SS, CT, DV
3015000 1.892 18 Gradient, Perch 358 CT
3015000 2.166 18 Perch 82 DV
3015000 2.496 24 Gradient, Constriction, Perch 1640 DV
3015000 2.752 24 Gradient 1919 CT
3015000 2.920 24 Gradient 675* CT, DV
3015000 3.275 24 Gradient, Perch 692 CT, DV
3015000 3.292 18 Gradient, Constriction.
Blockage 591 CT, DV
3015000 3.496 36 Gradient, Perch 984 DV
3015000 3.893 84 Gradient, Constriction. Perch 328 DV
3015000 5.079 60 Gradient 345 CT
3015000 6.234 18 Gradient, Perch 48 DV
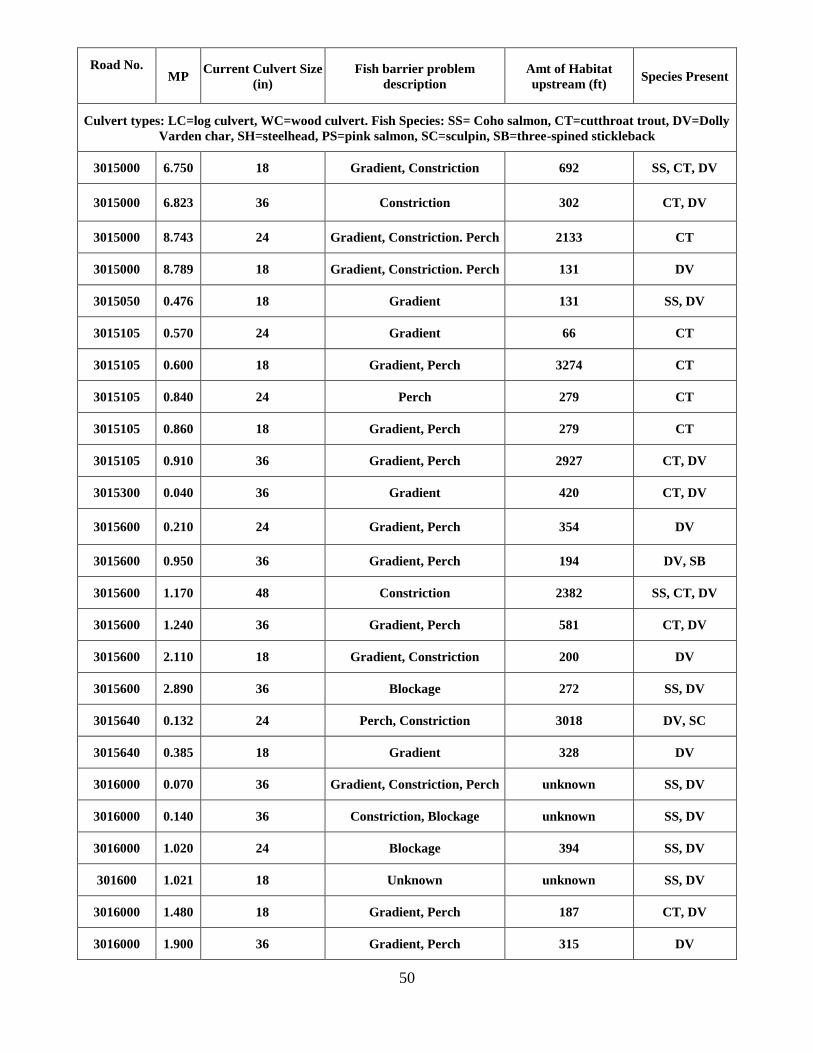
50
Road No.
MP
Current Culvert Size
(in)
Fish barrier problem
description
Amt of Habitat
upstream (ft) Species Present
Culvert types: LC=log culvert, WC=wood culvert. Fish Species: SS= Coho salmon, CT=cutthroat trout, DV=Dolly
Varden char, SH=steelhead, PS=pink salmon, SC=sculpin, SB=three-spined stickleback
3015000 6.750 18 Gradient, Constriction 692 SS, CT, DV
3015000 6.823 36 Constriction 302 CT, DV
3015000 8.743 24 Gradient, Constriction. Perch 2133 CT
3015000 8.789 18 Gradient, Constriction. Perch 131 DV
3015050 0.476 18 Gradient 131 SS, DV
3015105 0.570 24 Gradient 66 CT
3015105 0.600 18 Gradient, Perch 3274 CT
3015105 0.840 24 Perch 279 CT
3015105 0.860 18 Gradient, Perch 279 CT
3015105 0.910 36 Gradient, Perch 2927 CT, DV
3015300 0.040 36 Gradient 420 CT, DV
3015600 0.210 24 Gradient, Perch 354 DV
3015600 0.950 36 Gradient, Perch 194 DV, SB
3015600 1.170 48 Constriction 2382 SS, CT, DV
3015600 1.240 36 Gradient, Perch 581 CT, DV
3015600 2.110 18 Gradient, Constriction 200 DV
3015600 2.890 36 Blockage 272 SS, DV
3015640 0.132 24 Perch, Constriction 3018 DV, SC
3015640 0.385 18 Gradient 328 DV
3016000 0.070 36 Gradient, Constriction, Perch unknown SS, DV
3016000 0.140 36 Constriction, Blockage unknown SS, DV
3016000 1.020 24 Blockage 394 SS, DV
301600 1.021 18 Unknown unknown SS, DV
3016000 1.480 18 Gradient, Perch 187 CT, DV
3016000 1.900 36 Gradient, Perch 315 DV

51
Road No.
MP
Current Culvert Size
(in)
Fish barrier problem
description
Amt of Habitat
upstream (ft) Species Present
Culvert types: LC=log culvert, WC=wood culvert. Fish Species: SS= Coho salmon, CT=cutthroat trout, DV=Dolly
Varden char, SH=steelhead, PS=pink salmon, SC=sculpin, SB=three-spined stickleback
3016000 2.580 30 Gradient, Constriction, Perch 164 DV
3016000 2.750 48 Gradient, Perch 82 DV
3017000 3.089 18 Gradient, Constriction, Perch,
Blockage 459 DV
3017000 3.209 18 Gradient, Perch 240 DV
3017000 3.479 24 Gradient 633** DV
3017000 3.529 72 Constriction 1611 DV
3017000 3.639 18 Gradient, Constriction, Perch 423 DV
3017300 0.020 18 Gradient 187 DV
3017300 0.990 48 Gradient, Perch 243 CT, DV
3017400 0.060 18 Gradient, Constriction, Perch 354++ DV
Amount of upstream habitat in Project
Area for which fish passage is a problem
for juveniles and/or adult life stages of fish.
Total 9 miles
*= des habitat upstream of 3015000_2.19R - at MP 0.044; ++=includes habitat upstream of 3017300 - at MP
0.020; **= includes habitat upstream of 3017400 - at MP 0.060 ; +=includes sum of habitat upstream of red culverts
at 3015105 MP’s 0.570, 0.600, 0.840, 0.860, 0.910.
Remediated Red Pipes
Twenty-three red pipes have been remediated in the Project Area through replacement or removal due to road
storage opportunities and available funding sources. This has reopened approximately 7.4 miles of fish habitat
to unrestricted access for fish to spawning and rearing habitat, adequate shelter and cover, and available food
resources (Table 30).
Table 30. Remediated Red Pipes (replacement or removal for road storage) in the North Thorne Project Area.
Road No.
MP
Previous Culvert Size
(in)
New Culvert Size or
Total Removal due to
road storage
Amt of
Habitat
upstream (ft)
Species
Present
3015000 0.344 36 96x96 in. 4158 CT
3015000 2.641 36 79x117 in. arch 2986 SS, CT, DV

52
3015000 6.335 36 40 ft bridge 2973 SS, DV
3015000 6.830 18 72x72 in. 1631 SS, CT
3015000 11.090 48 Removal 23 DV
3015000 11.130 72 Removal 26 DV
3015000_2.91R 0.044 24 Removal 410 DV
3015105_0.96L 0.038 36 Removal 3281 CT, DV
3015200 2.336 36 Removal 4101 SS, CT, DV
3015200 2.404 78X109 Removal 2972 SS, CT,
DV, PS, SB
3015200 2.620 24 Removal 3773 SS, SH, SB
3015230 0.484 48 Removal 1627 CT, SB
3015230 0.520 36 Removal 115 SS, DV
3015230_0.33R 0.571 24 Removal 374 SS
3015250 0.030 48 91x142 in arch 3251 SS, CT, DV
3016015_0.44L 0.047 18 Removal 256 DV
3016100 0.18 24 Removal 591 DV
3017000 2.471 LC Removal 2962 DV
3017000 2.512 LC Removal 948 DV
3017350 0.477 LC Removal 1834 SS, DV
3017350 0.825 WC Removal 177 DV
3017350 0.931 WC Removal 400 DV
3017350 1.023 WC Removal 404 DV
Total 39273 ft
(7.4 miles)
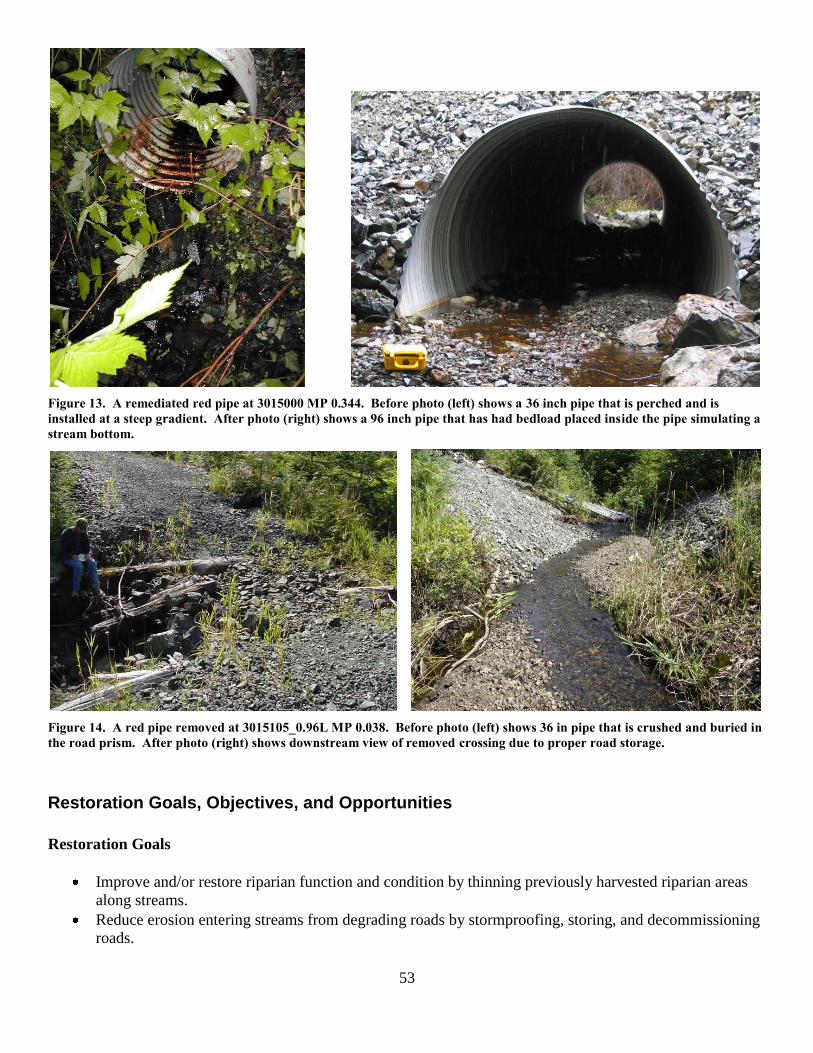
53
Figure 13. A remediated red pipe at 3015000 MP 0.344. Before photo (left) shows a 36 inch pipe that is perched and is
installed at a steep gradient. After photo (right) shows a 96 inch pipe that has had bedload placed inside the pipe simulating a
stream bottom.
Figure 14. A red pipe removed at 3015105_0.96L MP 0.038. Before photo (left) shows 36 in pipe that is crushed and buried in
the road prism. After photo (right) shows downstream view of removed crossing due to proper road storage.
Restoration Goals, Objectives, and Opportunities
Restoration Goals
Improve and/or restore riparian function and condition by thinning previously harvested riparian areas
along streams.
Reduce erosion entering streams from degrading roads by stormproofing, storing, and decommissioning
roads.
54
Improve and or restore hillslope hydrologic connectivity from roads by stormproofing, storing, and
decommissioning roads.
Improve, and/or restore fish passage at road crossings
Restoration Objectives
Improve and/or restore riparian function and condition by thinning previously harvested riparian areas along
streams.
Improve 75 acres of harvest riparian areas along Class I and Class II streams, and 81 acres of harvest of
riparian areas along Class III streams by riparian thinning.
Reduce erosion entering streams from degrading roads by stormproofing, storing, and decommissioning roads.
Stormproof, store, and decommission 38 miles of road.
Improve and or restore hillslope hydrologic connectivity from roads by stormproofing, storing, and
decommissioning roads.
Stormproof, store, and decommission 38 miles of road.
Improve, and/or restore fish passage at road crossings.
Restore access to about 5 miles of upstream fish habitat by replacing or removing MR1, MR2, and MR3
red pipes.
Improve, and/or restore instream large wood debris (LWD) and/or restore channel stability.
Install LWD and boulders into streams.
Restoration Opportunities
The National Research Council (NRC, 1992) defines restoration as a holistic process. It is “the return of an
ecosystem to a close approximation of its condition prior to disturbance. In restoration, ecological damage to
the resource is repaired. Both the structure and the functions of the ecosystem are recreated .... The goal is to
emulate a natural, functioning, self-regulating system that is integrated with the ecological landscape in which it
occurs.”
Restoration has also been defined as the reestablishment of the structure and function of an ecosystem,
including its natural diversity. A restored ecosystem is much more than just an assemblage of its components of
soil, water, air, and biota. Rather, a restored ecosystem displays the interactions among all these components.
Rehabilitation, reclamation, habitat creation, or mitigation can be achieved through manipulation of site-specific
or isolated elements of ecosystems, but restoration is a more complex process. Successful restoration means that
ecosystem structure and function are recreated or repaired and that natural ecosystem processes can operate
unimpeded. (Williams et al. 1997)
Restoration is an integral part of comprehensive watershed management and is used to recover fish habitat,
stabilize deteriorating watershed conditions, and speed recovery of the watershed towards healthy conditions.
Effective restoration has a watershed-level approach and includes upland, riparian, and instream components.
In other words, from the ridge top to the valley bottom. The upland component is used to control erosion,
stabilize roads, upgrade culverts for fish passage, maintain hydrologic connectivity, and manage watershed
uses. The riparian component restores functions of riparian vegetation by establishing mature conifers or other
appropriate vegetation. The instream component uses woody debris and other structures to retain spawning
gravels and create pools or other fish habitat features, and stabilize stream banks.
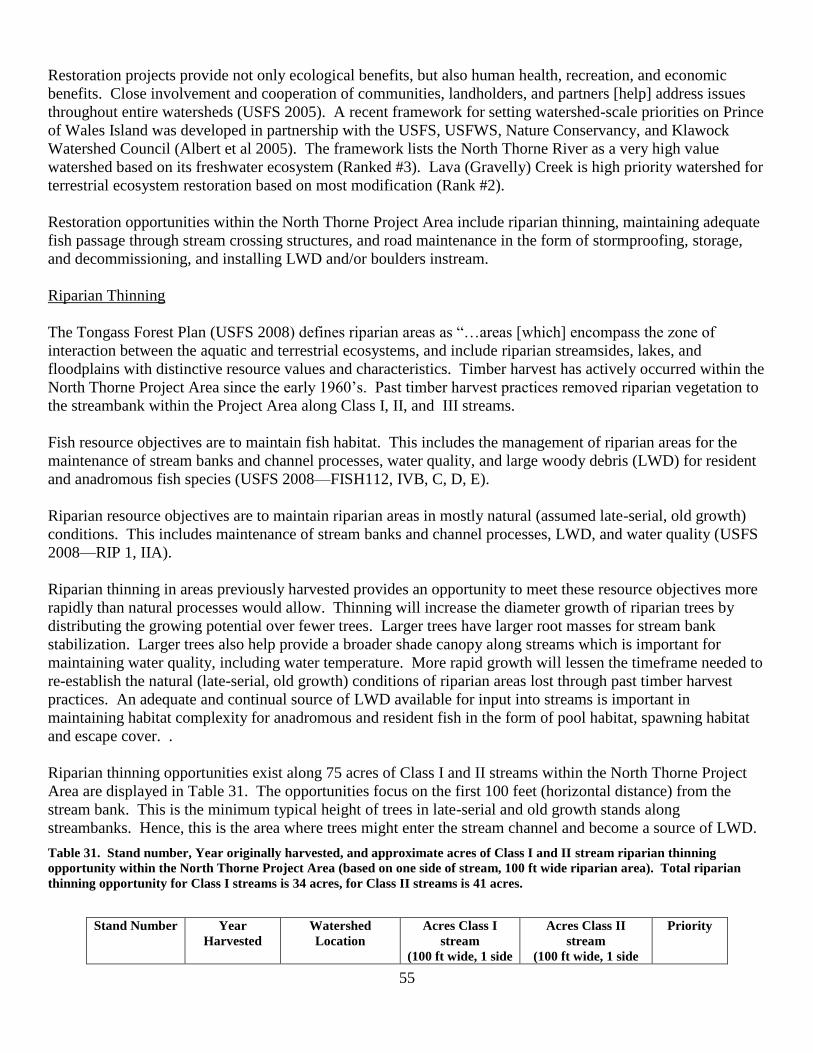
55
Restoration projects provide not only ecological benefits, but also human health, recreation, and economic
benefits. Close involvement and cooperation of communities, landholders, and partners [help] address issues
throughout entire watersheds (USFS 2005). A recent framework for setting watershed-scale priorities on Prince
of Wales Island was developed in partnership with the USFS, USFWS, Nature Conservancy, and Klawock
Watershed Council (Albert et al 2005). The framework lists the North Thorne River as a very high value
watershed based on its freshwater ecosystem (Ranked #3). Lava (Gravelly) Creek is high priority watershed for
terrestrial ecosystem restoration based on most modification (Rank #2).
Restoration opportunities within the North Thorne Project Area include riparian thinning, maintaining adequate
fish passage through stream crossing structures, and road maintenance in the form of stormproofing, storage,
and decommissioning, and installing LWD and/or boulders instream.
Riparian Thinning
The Tongass Forest Plan (USFS 2008) defines riparian areas as “…areas [which] encompass the zone of
interaction between the aquatic and terrestrial ecosystems, and include riparian streamsides, lakes, and
floodplains with distinctive resource values and characteristics. Timber harvest has actively occurred within the
North Thorne Project Area since the early 1960’s. Past timber harvest practices removed riparian vegetation to
the streambank within the Project Area along Class I, II, and III streams.
Fish resource objectives are to maintain fish habitat. This includes the management of riparian areas for the
maintenance of stream banks and channel processes, water quality, and large woody debris (LWD) for resident
and anadromous fish species (USFS 2008—FISH112, IVB, C, D, E).
Riparian resource objectives are to maintain riparian areas in mostly natural (assumed late-serial, old growth)
conditions. This includes maintenance of stream banks and channel processes, LWD, and water quality (USFS
2008—RIP 1, IIA).
Riparian thinning in areas previously harvested provides an opportunity to meet these resource objectives more
rapidly than natural processes would allow. Thinning will increase the diameter growth of riparian trees by
distributing the growing potential over fewer trees. Larger trees have larger root masses for stream bank
stabilization. Larger trees also help provide a broader shade canopy along streams which is important for
maintaining water quality, including water temperature. More rapid growth will lessen the timeframe needed to
re-establish the natural (late-serial, old growth) conditions of riparian areas lost through past timber harvest
practices. An adequate and continual source of LWD available for input into streams is important in
maintaining habitat complexity for anadromous and resident fish in the form of pool habitat, spawning habitat
and escape cover. .
Riparian thinning opportunities exist along 75 acres of Class I and II streams within the North Thorne Project
Area are displayed in Table 31. The opportunities focus on the first 100 feet (horizontal distance) from the
stream bank. This is the minimum typical height of trees in late-serial and old growth stands along
streambanks. Hence, this is the area where trees might enter the stream channel and become a source of LWD.
Table 31. Stand number, Year originally harvested, and approximate acres of Class I and II stream riparian thinning
opportunity within the North Thorne Project Area (based on one side of stream, 100 ft wide riparian area). Total riparian
thinning opportunity for Class I streams is 34 acres, for Class II streams is 41 acres.
Stand Number Year
Harvested
Watershed
Location
Acres Class I
stream
(100 ft wide, 1 side
Acres Class II
stream
(100 ft wide, 1 side
Priority

56
only) only)
579010044 1966 Falls Creek 0 5.51 1
579010045 1966 Falls Creek &
Unnamed
Composite
2.66 8.16 1
579010046 1966 Unnamed
Composite
5.53 3.25 1
579020512 1973 Lava Creek 7.78 9.5 1
586010504 1973 Lava Creek 5.4 0 1
597110503 1975 Unnamed
Composite
4.95 0 1
580020516 1986 East Fork 0 3.18 2
580020517 1986 East Fork 0 5.82 2
580020520 1987 East Fork 3.01 0 2
579010506 1988 Unnamed
Composite
4.25 5.59 2
Total 34 41
Riparian Thinning costs for75acres along Class I and Class II streams are estimated at $29,836 (Table 32).
Additional cost estimates for field review, contract preparation and inspection, and overhead are estimated at
$22,000.
Table 32. Estimated costs for riparian thinning along Class I and Class II streams in the North Thorne Project Area.
Stand Number
Total
Acres on
Class I
& II
stream
Thinning
Cost/acre
@
$400/acre
Fish/Hydro
field review
@ $500/day
Fish/Hydro
overhead @
$350/day
Silviculture
Inspection/Contract
Prep @ $500/day
Silviculture
Overhead
@ $350/day
579010044 5.51 $2,204 $500 $350 $1,000 $350
579010045 10.82 $4,328 $500 $350 $1,000 $350
579010046 8.78 $3,512 $500 $350 $1,000 $350
579020512 17.28 $6,912 $500 $350 $1,000 $350
586010504 5.4 $2,160 $500 $350 $1,000 $350
597110503 4.95 $1,980 $500 $350 $1,000 $350
580020516 3.18 $1,272 $500 $350 $1,000 $350
580020517 5.82 $2,328 $500 $350 $1,000 $350
580020520 3.01 $1,204 $500 $350 $1,000 $350
579010506 9.84 $3,936 $500 $350 $1,000 $350
Total 75 $29,836 $5000 $3500 $10,000 $3500
Riparian thinning opportunities along Class III streams within the North Thorne Project Area total 81acres
(Table 33). The opportunities focus on the first 100 feet (horizontal distance) from the stream bank. Again, this
is the typical height of trees in late-serial and old growth stands along streambanks. No riparian thinning
opportunities are proposed for Class IV streams as the Tongass Forest Plan treats these streams as part of the
hillslope process (USFS 2008).
Table 33. Stand number, Year originally harvested, and approximate acres of Class III stream riparian thinning opportunity
within the North Thorne Project Area (based on one side of stream, 100 ft wide riparian area).
Stand Number Year
Harvested
Watershed
Location
Acres Class III
stream
(100 ft wide, 1
side only)
Priority
579020516 1962 Lava Creek 5.36 2
579010042 1966 Unnamed 5.71 2

57
Composite
579010046 1966 Unnamed
Composite 15.35 1
579020512 1973 Lava Creek 0.85 1
586010504 1973 Lava Creek 8.55 1
580020027 1975 East Fork 2.96 1
580020029 1976 East Fork 0.15 1
580010507 1980 West Fork 3.00 1
580020516 1986 East Fork 7.51 2
580020517 1986 East Fork 13.66 2
580020520 1987 East Fork 8.72 2
579010506 1988 Unnamed
Composite 6.81 2
580020531 1988 East Fork 2.46 2
Total 81
Riparian thinning costs for 81 acres along Class III streams is estimated at $58,324 (Table 34). Additional cost
estimates for field review, contract preparation and inspection, and overhead are estimated at $24,600.
Table 34. Estimated costs for riparian thinning along Class III streams in the North Thorne Project Area.
Stand Number
Total acres
along Class III
stream
Thinning
Cost/acre
@
$400/acre
Fish/Hy
dro field
review
@
$500/day
Fish/Hydro
overhead @
$350/day
Silviculture
Inspection/Cont
ract
Prep @
$500/day
Silviculture
Overhead @
$350/day
579020516 5.36 $2,144 $500 $350 $1,000 $350
579010042 5.71 $2,284 $500 $350 $1,000 $350
579010046 15.35 $6,140 $500 $350 $1,000 $350
579020512 0.85 $340 $500 $350 $1,000 $350
586010504 8.55 $3,420 $500 $350 $1,000 $350
580020027 2.96 $1,184 $500 $350 $1,000 $350
580020029 0.15 $60 $200 $200
580010507 3.00 $1,200 $500 $350 $1,000 $350
580020516 7.51 $3,004 $500 $350 $1,000 $350
580020517 13.66 $5,464 $500 $350 $1,000 $350
580020520 8.72 $3,488 $500 $350 $1,000 $350
579010506 6.81 $2,724 $500 $350 $1,000 $350
580020531 2.46 $984 $500 $350 $1,000 $350
Total 81 $58,324 $7200 $2100 $13,200 $2100
Road Storage
Roads pose a significant effect on water and stream quality, particularly if they are not maintained at stream
crossings. Existing roads in the Project Area are eroding and generating sediment input into streams, thereby
adversely affecting fish and fish habitat. Not maintaining and properly storing roads has had negative impacts
to fish and fish habitat.
Road condition surveys have identified that sediment generated from roads in the Project Area has been caused
by plugged culverts, road washouts, poor water drainage due to plugged ditch lines, and lack of adequate water
bars to direct water off the road prism. Placing currently open roads in storage would effectively reduce
potential erosion and sedimentation. Further, roads that have not been previously properly stored (culverts left
in place behind pulled bridges, culverts, tank traps, or vegetatively overgrown roads) need to be, so that
sedimentation into streams can be minimized. Roads placed into storage would reduce erosion, fill failure, and
diversion potential while restoring hydrologic connectivity. Removing red pipes would allow for adequate fish
passage upstream to available spawning and rearing habitat, food sources, and shelter. The overall effects
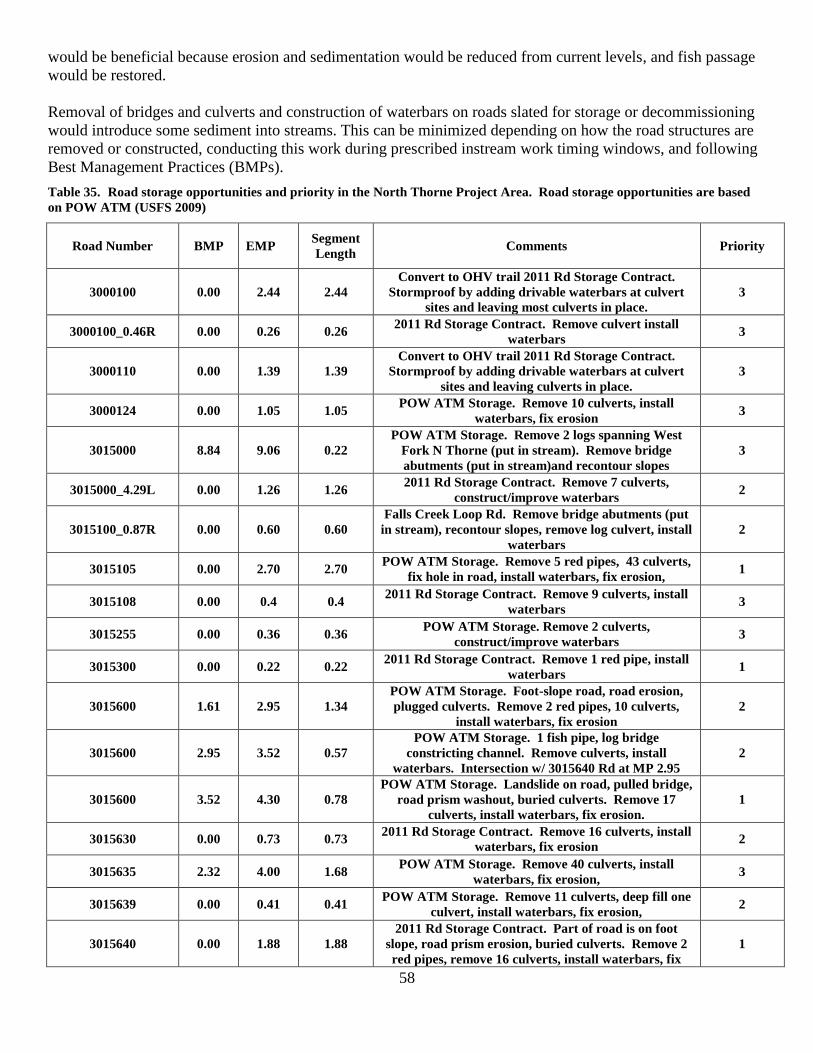
58
would be beneficial because erosion and sedimentation would be reduced from current levels, and fish passage
would be restored.
Removal of bridges and culverts and construction of waterbars on roads slated for storage or decommissioning
would introduce some sediment into streams. This can be minimized depending on how the road structures are
removed or constructed, conducting this work during prescribed instream work timing windows, and following
Best Management Practices (BMPs).
Table 35. Road storage opportunities and priority in the North Thorne Project Area. Road storage opportunities are based
on POW ATM (USFS 2009)
Road Number BMP EMP Segment
Length Comments Priority
3000100 0.00 2.44 2.44
Convert to OHV trail 2011 Rd Storage Contract.
Stormproof by adding drivable waterbars at culvert
sites and leaving most culverts in place.
3
3000100_0.46R 0.00 0.26 0.26 2011 Rd Storage Contract. Remove culvert install
waterbars 3
3000110 0.00 1.39 1.39
Convert to OHV trail 2011 Rd Storage Contract.
Stormproof by adding drivable waterbars at culvert
sites and leaving culverts in place.
3
3000124 0.00 1.05 1.05 POW ATM Storage. Remove 10 culverts, install
waterbars, fix erosion 3
3015000 8.84 9.06 0.22
POW ATM Storage. Remove 2 logs spanning West
Fork N Thorne (put in stream). Remove bridge
abutments (put in stream)and recontour slopes
3
3015000_4.29L 0.00 1.26 1.26 2011 Rd Storage Contract. Remove 7 culverts,
construct/improve waterbars 2
3015100_0.87R 0.00 0.60 0.60
Falls Creek Loop Rd. Remove bridge abutments (put
in stream), recontour slopes, remove log culvert, install
waterbars
2
3015105 0.00 2.70 2.70 POW ATM Storage. Remove 5 red pipes, 43 culverts,
fix hole in road, install waterbars, fix erosion, 1
3015108 0.00 0.4 0.4 2011 Rd Storage Contract. Remove 9 culverts, install
waterbars 3
3015255 0.00 0.36 0.36 POW ATM Storage. Remove 2 culverts,
construct/improve waterbars 3
3015300 0.00 0.22 0.22 2011 Rd Storage Contract. Remove 1 red pipe, install
waterbars 1
3015600 1.61 2.95 1.34
POW ATM Storage. Foot-slope road, road erosion,
plugged culverts. Remove 2 red pipes, 10 culverts,
install waterbars, fix erosion
2
3015600 2.95 3.52 0.57
POW ATM Storage. 1 fish pipe, log bridge
constricting channel. Remove culverts, install
waterbars. Intersection w/ 3015640 Rd at MP 2.95
2
3015600 3.52 4.30 0.78
POW ATM Storage. Landslide on road, pulled bridge,
road prism washout, buried culverts. Remove 17
culverts, install waterbars, fix erosion.
1
3015630 0.00 0.73 0.73 2011 Rd Storage Contract. Remove 16 culverts, install
waterbars, fix erosion 2
3015635 2.32 4.00 1.68 POW ATM Storage. Remove 40 culverts, install
waterbars, fix erosion, 3
3015639 0.00 0.41 0.41 POW ATM Storage. Remove 11 culverts, deep fill one
culvert, install waterbars, fix erosion, 2
3015640 0.00 1.88 1.88
2011 Rd Storage Contract. Part of road is on foot
slope, road prism erosion, buried culverts. Remove 2
red pipes, remove 16 culverts, install waterbars, fix
1
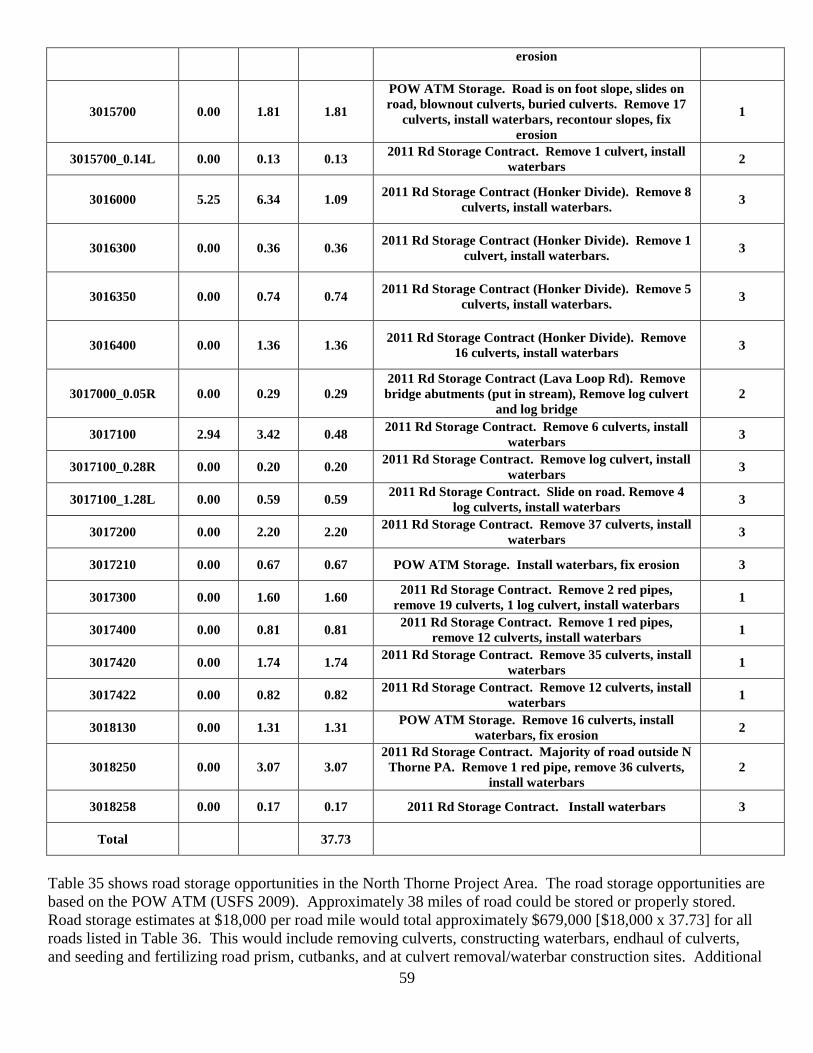
59
erosion
3015700 0.00 1.81 1.81
POW ATM Storage. Road is on foot slope, slides on
road, blownout culverts, buried culverts. Remove 17
culverts, install waterbars, recontour slopes, fix
erosion
1
3015700_0.14L 0.00 0.13 0.13 2011 Rd Storage Contract. Remove 1 culvert, install
waterbars 2
3016000 5.25 6.34 1.09 2011 Rd Storage Contract (Honker Divide). Remove 8
culverts, install waterbars. 3
3016300 0.00 0.36 0.36 2011 Rd Storage Contract (Honker Divide). Remove 1
culvert, install waterbars. 3
3016350 0.00 0.74 0.74 2011 Rd Storage Contract (Honker Divide). Remove 5
culverts, install waterbars. 3
3016400 0.00 1.36 1.36 2011 Rd Storage Contract (Honker Divide). Remove
16 culverts, install waterbars 3
3017000_0.05R 0.00 0.29 0.29
2011 Rd Storage Contract (Lava Loop Rd). Remove
bridge abutments (put in stream), Remove log culvert
and log bridge
2
3017100 2.94 3.42 0.48 2011 Rd Storage Contract. Remove 6 culverts, install
waterbars 3
3017100_0.28R 0.00 0.20 0.20 2011 Rd Storage Contract. Remove log culvert, install
waterbars 3
3017100_1.28L 0.00 0.59 0.59 2011 Rd Storage Contract. Slide on road. Remove 4
log culverts, install waterbars 3
3017200 0.00 2.20 2.20 2011 Rd Storage Contract. Remove 37 culverts, install
waterbars 3
3017210 0.00 0.67 0.67 POW ATM Storage. Install waterbars, fix erosion 3
3017300 0.00 1.60 1.60 2011 Rd Storage Contract. Remove 2 red pipes,
remove 19 culverts, 1 log culvert, install waterbars 1
3017400 0.00 0.81 0.81 2011 Rd Storage Contract. Remove 1 red pipes,
remove 12 culverts, install waterbars 1
3017420 0.00 1.74 1.74 2011 Rd Storage Contract. Remove 35 culverts, install
waterbars 1
3017422 0.00 0.82 0.82 2011 Rd Storage Contract. Remove 12 culverts, install
waterbars 1
3018130 0.00 1.31 1.31 POW ATM Storage. Remove 16 culverts, install
waterbars, fix erosion 2
3018250 0.00 3.07 3.07
2011 Rd Storage Contract. Majority of road outside N
Thorne PA. Remove 1 red pipe, remove 36 culverts,
install waterbars
2
3018258 0.00 0.17 0.17 2011 Rd Storage Contract. Install waterbars 3
Total
37.73
Table 35 shows road storage opportunities in the North Thorne Project Area. The road storage opportunities are
based on the POW ATM (USFS 2009). Approximately 38 miles of road could be stored or properly stored.
Road storage estimates at $18,000 per road mile would total approximately $679,000 [$18,000 x 37.73] for all
roads listed in Table 36. This would include removing culverts, constructing waterbars, endhaul of culverts,
and seeding and fertilizing road prism, cutbanks, and at culvert removal/waterbar construction sites. Additional

60
cost of mobilization to the sites is estimated at $10,000 per site for a total of $90,000. Fish
Biologist/Hydrologist field prep is estimated at $11,500. Fish Biologist/Hydrologist presence during
implementation is estimated at $18,500. Fish Biologist/Hydrologist overhead is estimated at $5,250.
Table 36. Estimated costs for road storage by road segment in the North Thorne Project Area.
Road Number Segment
Length
Road Storage
Estimate@
$18,000/mi
Mobilization
Estimate
@$10,000/ rd
group
location
Fish/Hydro
field prep
(stake/flag
sites)
@$500/day
Fish/Hydro
implementatio
n presence
@$500/day
Fish/Hydro
Overhead
costs@$350/day
3000100 2.44 $43,920
$10,000
$500 $1,000 $350
3000100_0.46R 0.26 $4,680
3000110 1.39 $25,020 $500 $500
$350
3000124 1.05 $18,900 $500 $500
3015000 0.22 $3,960
$10,000
$500 $1,000 $350 3015000_4.29L 1.26 $22,680
3015100_0.87R 0.6 $10,800
3015105 2.7 $48,600
$500 $1,000 $350
3015108 0.4 $7,200
3015255 0.36 $6,480
$500 $500 $350
3015300 0.22 $3,960
3015600 1.34 $24,120
$10,000
$1,000 $2,000 $350 3015600 0.57 $10,260
3015600 0.78 $14,040
3015630 0.73 $13,140
$1,000 $1,500 $350 3015635 1.68 $30,240
3015639 0.41 $7,380
3015640 1.88 $33,840 $500 $1,000 $350
3015700 1.81 $32,580
$10,000 $500 $1,000 $350
3015700_0.14L 0.13 $2,340
3016000 1.09 $19,620
$10,000 $1,000 $1,500 $350
3016300 0.36 $6,480
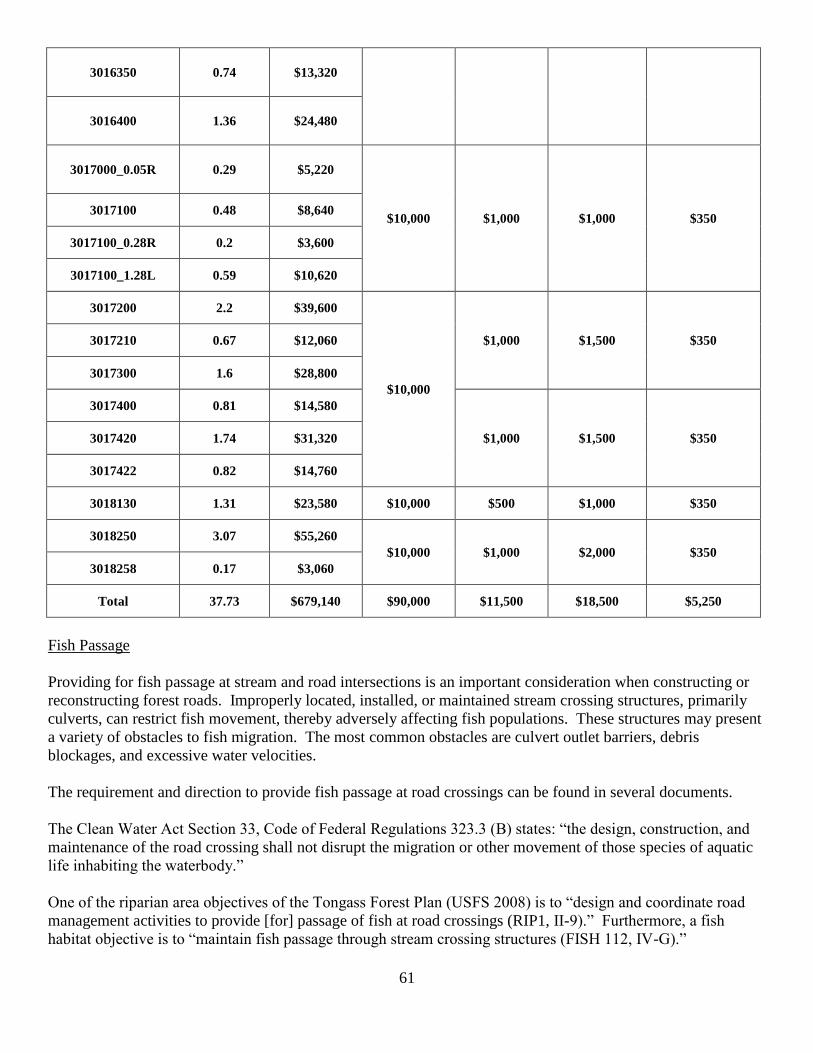
61
3016350 0.74 $13,320
3016400 1.36 $24,480
3017000_0.05R 0.29 $5,220
$10,000 $1,000 $1,000 $350 3017100 0.48 $8,640
3017100_0.28R 0.2 $3,600
3017100_1.28L 0.59 $10,620
3017200 2.2 $39,600
$10,000
$1,000 $1,500 $350 3017210 0.67 $12,060
3017300 1.6 $28,800
3017400 0.81 $14,580
$1,000 $1,500 $350 3017420 1.74 $31,320
3017422 0.82 $14,760
3018130 1.31 $23,580 $10,000 $500 $1,000 $350
3018250 3.07 $55,260
$10,000 $1,000 $2,000 $350
3018258 0.17 $3,060
Total 37.73 $679,140 $90,000 $11,500 $18,500 $5,250
Fish Passage
Providing for fish passage at stream and road intersections is an important consideration when constructing or
reconstructing forest roads. Improperly located, installed, or maintained stream crossing structures, primarily
culverts, can restrict fish movement, thereby adversely affecting fish populations. These structures may present
a variety of obstacles to fish migration. The most common obstacles are culvert outlet barriers, debris
blockages, and excessive water velocities.
The requirement and direction to provide fish passage at road crossings can be found in several documents.
The Clean Water Act Section 33, Code of Federal Regulations 323.3 (B) states: “the design, construction, and
maintenance of the road crossing shall not disrupt the migration or other movement of those species of aquatic
life inhabiting the waterbody.”
One of the riparian area objectives of the Tongass Forest Plan (USFS 2008) is to “design and coordinate road
management activities to provide [for] passage of fish at road crossings (RIP1, II-9).” Furthermore, a fish
habitat objective is to “maintain fish passage through stream crossing structures (FISH 112, IV-G).”

62
Additionally, in a Supplemental Memorandum of Understanding between the U. S. Forest Service and the
Alaska Department of Fish and Game, both agencies agreed to “[provide] efficient fish passage (SMOU 1998).”
Red Pipe Remediation Prioritization
RCS inventory of culverts on the Tongass National Forest has identified many cuverts that do not meet the
current fish passage standards. An interagency group developed a process to categorize culverts for repair or
replacement. Two teams were assembled to prioritize culverts for repair or replacement in the North Thorne
Project Area to test this process (Aho et al 2006). Each team consisted of a U.S. Forest Service fish biologist,
hydrologist, and road engineer, and at least one representative from an outside agency (ADF&G, NMFS, and
USFWS). The two teams were asked to assign one of five alternative management recommendations to each
culvert ranging from replace the culvert to acceptable to be a permanent barrier to fish passage. Table 37
summarizes the two teams recommendations for replacement or not. The recommendation shown is a
combination of the two teams input showing the most liberal interpretation of the two recommendations.
Table 37. Team Recommendation for remediation of red pipes impassable to various life stages of resident and anadromous
fish species in the North Thorne Project Area (see also Table 26). Upstrm Hab= Upstream Habitat.
Road No. MP Management
Recommendation
Estimated Cost
To Replace Comments
3015000 0.739 5 $109,560
10 ft waterfall short distance
upstream. Downstream of 5 red
culverts on 3015105. Upstrm
Hab=19,054+ ft
3015000 1.773 3 $58,340 Upstrm Hab=2,641 ft
3015000 1.826 1 $44,715 Upstrm Hab=2,356 ft
3015000 1.892 5 $86,320 Upstrm Hab=358 ft
3015000 2.166 5 $86,320 Upstrm Hab=82 ft
3015000 2.496 3 $109,560 Upstrm Hab=1,640 ft
3015000 2.752 3 $39,480 Upstrm Habitat=1,919 ft
3015000 2.920 3 $44,715 Upstrm Hab=675 ft
3015000 3.275 4 $86,320 Upstrm Hab=692 ft
3015000 3.292 3 $39,480 Upstrm Hab=591 ft
3015000 3.496 5 $109,560 Upstrm Hab=984 ft
3015000 3.893 5 $135,000 Upstrm Hab=328 ft
3015000 5.079 5 $62,724 Upstrm Hab=345 ft
3015000 6.234 5 $58,340 Upstrm Hab=48 ft
3015000 6.750 1 $39,480 Upstrm Hab=692 ft
3015000 6.823 5 Unknown Upstrm Hab=302 ft
3015000 8.743 1 $44,715 Upstrm Hab=2,133 ft
3015000 8.789 5 Unknown Upstrm Hab=131 ft
3015050 0.476 2 $34,252 Upstrm Hab=131 ft
3015105 0.570 4 Unknown
Upstream of 301500 MP 0.739
unique CT pop’n above waterfall
?? Upstrm Hab=66 ft

63
Road No. MP Management
Recommendation
Estimated Cost
To Replace Comments
3015105 0.600 1 $34,252
Upstream of 301500 MP 0.739
unique CT pop’n above waterfall
?? Upstrm Hab=3,274 ft
3015105 0.840 5 $86,320
Upstream of 301500 MP 0.739
unique CT pop’n above waterfall
?? Upstrm Hab=279 ft
3015105 0.860 5 Unknown Upstream of 301500 MP 0.739
unique CT pop’n above waterfall
?? Upstrm Hab=279 ft
3015105 0.910 1 $90,000
Upstream of 301500 MP 0.739
unique CT pop’n above waterfall
?? Upstrm Hab=2,927 ft
3015300 0.040 1 $39,480 Upstrm Hab=420 ft
3015600 0.210 5 $44,715 Upstrm Hab=354 ft
3015600 0.950 4 $43,354 Upstrm Hab=194 ft
3015600 1.170 1 $60,395 Upstrm Hab=2,382 ft
3015600 1.240 5 $34,252 Upstrm Hab=581 ft
3015600 2.110 5 Unknown Upstrm Hab=200 ft
3015600 2.890 4 $54,976 Upstrm Hab=272 ft
3015640 0.132 1 $43,354 Remove during Road Storage est.
cost <$1500 Upstrm Hab=3,018 ft
3015640 0.385 1 $34,252 Remove during Road Storage est.
cost <$1500 Upstrm Hab=328 ft
3016000 0.070 1 $58,340 Upstrm Hab=unknown
3016000 0.140 1 $60,395 Upstrm Hab=unknown
3016000 1.020 1 $63,531 Upstrm Hab=394 ft
301600 1.021 3 Unknown Upstrm Hab=unknown
3016000 1.480 5 $34,252 Upstrm Hab=187 ft
3016000 1.900 5 $132,800 Upstrm Hab=315 ft
3016000 2.580 5 $58,340 Upstrm Hab=164 ft
3016000 2.750 5 $132,800 Upstrm Hab=82 ft
3017000 3.089 5 $58,340 Upstrm Hab=459 ft
3017000 3.209 5 $58,340
Downstream of 3017300 MP 0.020
Upstrm Hab=240 ft (includes hab
from 3017300 MP 0.020
3017000 3.479 4 Unknown
Downstream of 3017000 MP 0.060
Upstrm Hab=633 ft (includes hab
from 3017000 MP 0.060
3017000 3.529 2 Unknown Upstrm Hab=1,611 ft
3017000 3.639 5 $86,320 Upstrm Hab=423 ft
3017300 0.020 1 $34,252 Remove during Road Storage est.
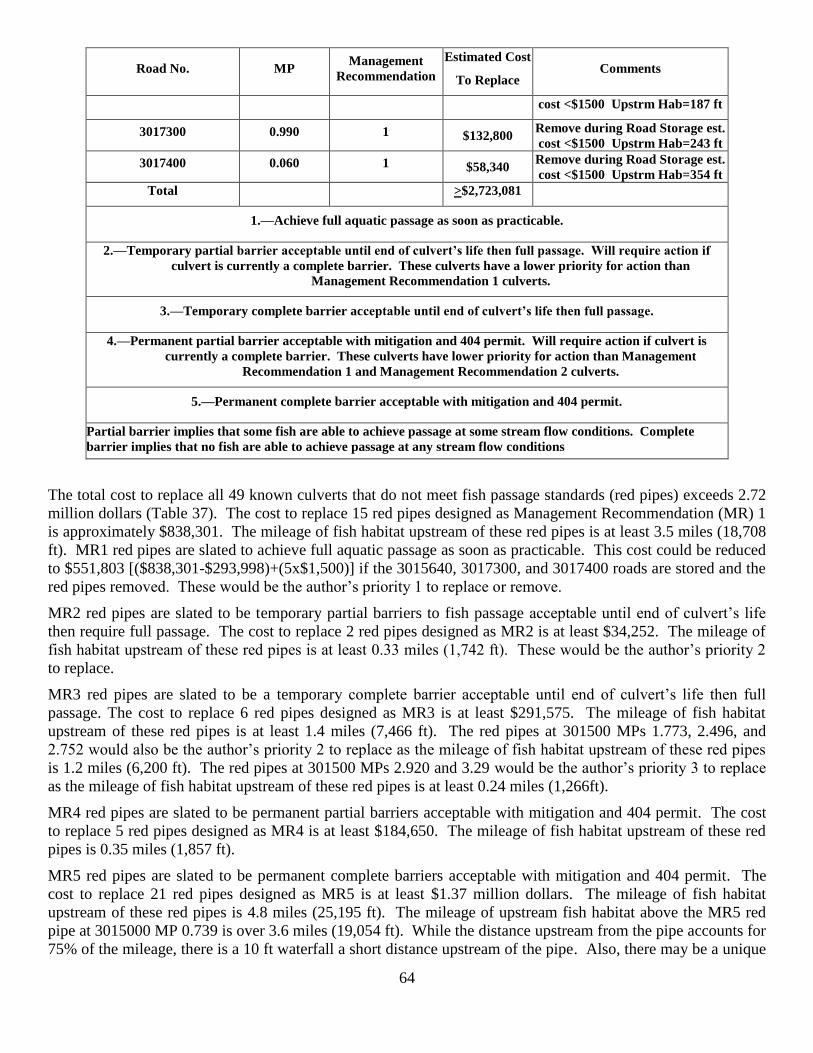
64
Road No. MP Management
Recommendation
Estimated Cost
To Replace Comments
cost <$1500 Upstrm Hab=187 ft
3017300 0.990 1 $132,800 Remove during Road Storage est.
cost <$1500 Upstrm Hab=243 ft
3017400 0.060 1 $58,340 Remove during Road Storage est.
cost <$1500 Upstrm Hab=354 ft Total >$2,723,081
1.—Achieve full aquatic passage as soon as practicable.
2.—Temporary partial barrier acceptable until end of culvert’s life then full passage. Will require action if
culvert is currently a complete barrier. These culverts have a lower priority for action than
Management Recommendation 1 culverts.
3.—Temporary complete barrier acceptable until end of culvert’s life then full passage.
4.—Permanent partial barrier acceptable with mitigation and 404 permit. Will require action if culvert is
currently a complete barrier. These culverts have lower priority for action than Management
Recommendation 1 and Management Recommendation 2 culverts.
5.—Permanent complete barrier acceptable with mitigation and 404 permit.
Partial barrier implies that some fish are able to achieve passage at some stream flow conditions. Complete
barrier implies that no fish are able to achieve passage at any stream flow conditions
The total cost to replace all 49 known culverts that do not meet fish passage standards (red pipes) exceeds 2.72
million dollars (Table 37). The cost to replace 15 red pipes designed as Management Recommendation (MR) 1
is approximately $838,301. The mileage of fish habitat upstream of these red pipes is at least 3.5 miles (18,708
ft). MR1 red pipes are slated to achieve full aquatic passage as soon as practicable. This cost could be reduced
to $551,803 [($838,301-$293,998)+(5x$1,500)] if the 3015640, 3017300, and 3017400 roads are stored and the
red pipes removed. These would be the author’s priority 1 to replace or remove.
MR2 red pipes are slated to be temporary partial barriers to fish passage acceptable until end of culvert’s life
then require full passage. The cost to replace 2 red pipes designed as MR2 is at least $34,252. The mileage of
fish habitat upstream of these red pipes is at least 0.33 miles (1,742 ft). These would be the author’s priority 2
to replace.
MR3 red pipes are slated to be a temporary complete barrier acceptable until end of culvert’s life then full
passage. The cost to replace 6 red pipes designed as MR3 is at least $291,575. The mileage of fish habitat
upstream of these red pipes is at least 1.4 miles (7,466 ft). The red pipes at 301500 MPs 1.773, 2.496, and
2.752 would also be the author’s priority 2 to replace as the mileage of fish habitat upstream of these red pipes
is 1.2 miles (6,200 ft). The red pipes at 301500 MPs 2.920 and 3.29 would be the author’s priority 3 to replace
as the mileage of fish habitat upstream of these red pipes is at least 0.24 miles (1,266ft).
MR4 red pipes are slated to be permanent partial barriers acceptable with mitigation and 404 permit. The cost
to replace 5 red pipes designed as MR4 is at least $184,650. The mileage of fish habitat upstream of these red
pipes is 0.35 miles (1,857 ft).
MR5 red pipes are slated to be permanent complete barriers acceptable with mitigation and 404 permit. The
cost to replace 21 red pipes designed as MR5 is at least $1.37 million dollars. The mileage of fish habitat
upstream of these red pipes is 4.8 miles (25,195 ft). The mileage of upstream fish habitat above the MR5 red
pipe at 3015000 MP 0.739 is over 3.6 miles (19,054 ft). While the distance upstream from the pipe accounts for
75% of the mileage, there is a 10 ft waterfall a short distance upstream of the pipe. Also, there may be a unique

65
population of cutthroat trout upstream of this waterfall (Kim Hastings, USFWS Biologist, personal
communication), but this is instantiated. Trying to remediate this red pipe plus the cost of fish passage over the
10 foot falls (by blasting or steeppass) is probably cost prohibitive. The two MR5 red pipes at 3015105 MPs
0.84 and 0.86, upstream of 3015000 MP 0.739, account for only 558 ft of upstream fish habitat. In fact, 20 of
the MR5 pipes (not including 3015000 MP 0.739, but including the two just mentioned) only accounts for 1.2
miles (6141 ft) of upstream habitat.
Instream structures
Instream problems that were observed in the North Thorne Project Area focused on areas where much of the
riparian area has been harvested. These areas offers little potential recruitment for LWD and hence have
streambank stability and bank erosion problems within floodplain channels. While conducting PFC surveys, the
need for instream structures at some sites was identified. Introduction of LWD and boulders was suggested to
help create pools and protect bank erosion. Table 38 displays the locations and actions proposed. Costs are not
estimated for these projects, as extensive field review and instream structure planning did not take place.
Table 38. Location, Action Proposed, Priority, and Access for instream structures in the North Thorne Project Area.
Location Action Proposed Priority Access
Upper W Fk of W Fk N Thorne
(below 3015 rd)
Add LWD, some boulder
structures
3 Poor, Road Stored
Upper W. Fk N. Thorne (adjacent
to 3015700, above 3015000
intersection
Add LWD above meander
channel
2 Fair
Upper E Fk (above 3015640 rd) Add LWD, capture bedload 1 Good
Upper E Fk (below 3015640 rd) Add LWD, reestablish channel 1 Good
Lower Lava Ck (below 3017000
rd)
Add LWD, bank stabilization,
some boulder structures
1 Good
Lower Lava Ck (above 30 rd) Add LWD, stabilize bank, some
boulder structures
2 Poor
Lower Falls Ck (above 30 rd) Add LWD, stabilize bank 2 Fair
Attempted restoration in part of Lower Falls Creek occurred in the late 1980’s by cabling wood, primarily alder
bundles, to the streambank. Many of the cabled alders have washed parallel to the streambank or out of water
during all but high flows. The 200m stretch of stream above the old road crossing could use some LWD, as
well as bank stablization as it appears that the channel was use as a corridor to haul wood by a steam donkey.
Project Sequencing
Implementation and sequencing time of projects identified in this document depends on funding, accessibility,
spatial distribution across the landscape, and management direction. Roads are key to access to a given area
proposed for restoration. Thus, road storage should take place after proposed timber harvest, riparian thinning,
or in-stream structures if that road provides access to these sites. Ranger and USFS Staff approval is essential
for all road projects that result in road storage. In other cases, the road may be cleared by all resource personnel
for storage immediately if no restoration projects are access from that road. All road storage opportunities in
this WRP are consistent with the POW ATM (USFS 2009). Remediation of red pipes would depend on
available funding. Riparian thinning should be combined with wildlife thinning and timber thinning in the same
stand. In-stream projects would benefit most from being done in a ‘top-down’ manner, ie store roads in the
headwaters, and then improve stream condition from headwaters down to the mainstem spatially across the
Project Area.

66
Project Monitoring and Evaluation
The North Thorne restoration effort supplements other restoration projects going on Prince of Wales Island and
elsewhere across the Tongass National Forest. These projects range from removal of stream crossing structures
along roads (road storage), replacing red pipes, riparian thinning, to addition of LWD instream to improve
stream and habitat conditions. All these efforts aim to improve watershed form and function, and increase
existing fish populations. While the effectiveness of hydrologic recovery may be simpler to monitor, increased
fish populations are far more difficult monitor. Oceanographic conditions and global climate change can
influence the presence, absence, or populations of salmonids in an area where watershed restoration takes place.
Thus, monitoring the effectiveness of restoration projects properly, and an expectation of direct results can be a
difficult challenge.
North Thorne restoration efforts should include project implementation monitoring and simple effectiveness
monitoring. The finer details of project effectiveness on fish populations will be tiered to previously established
efforts. The simple effectiveness monitoring should occur at varying intensities depending upon the project
objectives. The projects proposed in this restoration plan have one or multiple specific objectives. Simple
objectives such as hydrologic connectivity and large wood additions can be measured on a project by project
basis. For example, large wood additions can be monitored by sampling pieces of large wood prior to
restoration, then immediately following restoration and multiple years beyond. Hydrologic connectivity can be
measured immediately post restoration. For example, removing plugged structures along a road would result in
immediate restoration of hydrologic connectivity. As individual in-stream projects are proposed, specific
variables will be recommended for measuring success depending upon the funding available, the timeframe, and
level of effort, available to accomplish the work.
All restoration projects in this plan will include specific objectives and associated monitoring efforts to measure
project success. Road projects will be successful in terms of hydrologic connectivity if surface water flow
downslope and the risk of inhibited flow is eliminated at the road crossing. Fish passage would be evaluated by
evaluating for fish habitat access. For example, if the road storage project intended to store X miles of road and
improve access to Y miles of fish habitat, then post project monitoring would evaluate for these objectives.
Young growth riparian area objectives could be monitored by measuring diameter and height growth metrics
and utilizing the stand simulation models suggested in the Tongass Forest Riparian Thinning Strategy. This
information could be used to help predict the response to thinning and approximation of the desired future
condition.
In-stream projects will include project specific monitoring as mentioned above and will be tiered to the
objectives of the larger restoration working group. All in-stream projects should include pre and post photo
points, and Tier II monitoring. The information from the Tier II surveys will be used to evaluate the in-stream
success by comparison with the Region 10 physical channel metrics.
Project implementation should be summarized each fall in year-end project reports. Additional monitoring
should be documented in individual monitoring reports that will follow project implementation. The results of
specific project monitoring, and the results of the larger restoration picture across the Tongass National Forest,
should be used to improve restoration methods and prescriptions in future projects.
Recommendations
This WRP needs to be a “living” document, with the option to continually add to it in the future.
67
Need to avoid, if possible, additional harvest in the valley bottoms near Class I streams, especially the
North Fork of the Thorne River drainage (West Fork, East Fork, and Snakey Lakes). This area is a
prime producer of sportfish and salmon on the Tongass (ADF&G) and in the Project Area.
The West and East Fork watersheds contain the highest amount of MMI 4 soils and nearly 90% of the
landslides in the Project Area. There is high risk for landslides with additional harvest and road building
upslope of currently harvested areas. These areas should be avoided , if possible, for future harvest
consideration. Also, need to protect upper stream reaches of West and East Fork watersheds, lots of
bedload aggregation in floodplains downstream of these areas.
Need to be aggressive about storage and decommissioning roads in the Project Area. Need to properly
store roads, which includes removing all structures and providing necessary drainage.
Need to carefully design and properly construct roads, if truly needed, on mid to upper slopes.
Literature Cited
ADF&G 2007a. Alaska Department of Fish and Game Sportfish Statewide Harvest Survey. Data query July
2007. Steve McCurdy, ADF&G Sportfish Division, Craig, Alaska.
ADF&G 2007b. Alaska Department of Fish and Game Personal Use data. Data query April 2007. Scott
Walker, ADF&G Commercial Fish Division, Ketchikan, Alaska.
ADF&G 2011a. Alaska Department of Fish and Game Pink Salmon Escapement data. Data query July 2011.
Scott Walker, ADF&G Commercial Fish Division, Ketchikan, Alaska.
ADF&G 2011b. Personal Use definition. Alaska Department of Fish and Game.
http://www.adfg.alaska.gov/index.cfm?adfg=fishingPersonalUse.main
Albert, D., L. Baker, S. Howell, K.V. Koski. 2008. A Framework for Setting Watershed-Scale Priorities for
Forest and Freshwater Restoration on Prince of Wales Island. The Nature Conservancy, Alaska Field Office
Juneau, Alaska
Aho, D., J. Beard, J. Gier, B. Gubernick, C. Hartmann, K. Hastings, J. McDonell, M. Minnillo, J. Oien, and J.
Thompson. 2006. Test of a Process to Assign Fish Passage Remediation to Culverts in the North Thorne
Watershed. USFS Internal File. 26 pp.
Beard, J.M. 2006. Unpublished observation. Beard was a Fishery Biologists for Thorne Bay RD.
Beard, J.M., A. Prussian, and B. Baer 2006. Unpublished observation. Beard and Prussian were Fishery
Biologists for Thorne Bay RD, and Baer was a Fishery Biologist for the USFS Enterprise Team.
Beard, J.M., A. Prussian, S. Howell 2008. Unpublished observation. Beard and Prussian were Fishery
Biologists for Thorne Bay RD, and Howell was Restoration Coordinator for POW Island.
DEC. 2011. Alaska Department of Environmental Conservation, 18 AAC 70. Water Quality Standards, as
amended May 26, 2011.
http://www.dec.state.ak.us/water/wqsar/wqs/pdfs/18_AAC_70_as_Amended_Through_May_26_2011.pdf
68
Flanders, L., J. Sherburne, T. Paul, M. Kirchoff, S. Elliot, K. Brownlee, B. Schroeder, and M. Turek. 1998.
Tongass Fish and Wildlife Resource Assessment. Alaska Department of Fish and Game, Technical Bulletin
No. 98-4. 38 pp.
Furniss, M.J., T.D. Roelofs, and C.S. Yee. 1991. Chapter 8: Road construction and Maintenance. Pages 297-323. In:
Meehan, William R., editor Influence of forest and rangeland management on salmonid fishes and their habitats.
American Fisheries Society Special Publication 19. American Fisheries Society, Bethesda, Maryland. 751 p.
FWS. 2011. Federal Subsistence Use definition. Federal Subsistence Board, Office of Subsistence
Management. U.S. Fish and Wildlife Service, Anchorage, Alaska.
http://alaska.fws.gov/asm/pdf/fishregs11/define.pdf
Gier, T.W. 1998. A proposal for a two-tiered sediment risk assessment for potential fish habitat impacts from
forest management in Southeast Alaska. USDA Forest Service, Tongass National Forest, Ketchikan, Alaska.
21pp.
Gomi, T., R. C. Sidle, M. D. Bryant, and R. D. Woodsmith. 2001. The characteristics of woody debris and
sediment distribution in headwater streams, southeastern Alaska. Canadian Journal of Forest Research
31:1386–1399
Gucinski, H., M.J. Furniss, R.R. Ziemer, and M.H. Brookes. 2001. Forest Roads: A Synthesis of
Scientific Information. USDA Forest Service, Pacific Northwest Research Station, Portland,
Oregon. General Technical Report PNW-GTR-509. 108 p.
Harding, R.D. 2008. Southeast Alaska Steelhead and Dolly Varden Management. Alaska Department of Fish
and Game, Special Publication No. 08-21, Anchorage.
Harris, A.S. 1989. Wind in the forests of southeast Alaska and guides for reducing damage. General Technical
Report PNW-GTR-244. U.S. Department of Agriculture Forest Service, Pacific Northwest Research Station.
Portland, OR. 63 pp.
Hastings, Kim. personal communication. USFWS Biologist, Juneau, Alaska.
Hartman, G.F., J.C. Scrivener, M.J. Miles. 1996. Impacts of logging in Carnation Creek, a high energy
coastalstream in British Columbia, and their implications for restoring fish habitat. Canadian Journal of
Fisheries and Aquatic Sciences 53(Suppl. 1): 237-251.
Jones, S.H., and Fahl, C.B. 1994. Magnitude and Frequency of Floods in Alaska and Conterminous Basins of
Canada. U.S. Geological Survey Water-Resources Investigations Report 93-4179, Plate 2.
McDonell, John. 2003. Personal communication. Assistant Tongass National Forest Fish Biologist, U.S.
Forest Service, Petersburg, Alaska.
National Research Council. 1992. Committee on restoration of aquatic ecosystems – science, technology, and
public policy. Restoration of aquatic ecosystems. National Academy Press, Washington, D.C.
Novak, P. 1975. Revised Anadromous Stream Catalog of Southeastern Alaska, Appendix B, District 2, Volume
V, North End Survey Data. Alaska Department of Fish and Game, Technical Data Report No. 23. Juneau.
69
Nowacki, G, et al. 2001. Ecological Subsections of Southeastern Alaska and Neighboring Areas of Canada.
U.S. Department of Agriculture, Forest Service, Alaska Region. Technical Publication No. R10-TP-75.
Nowacki, G.J., and M.G. Kramer. 1988. The Effects of Wind Disturbance on Temperate Rain Forest Structure
and Dynamics of Southeast Alaska. General Technical Report PNW-GTR-421. U.S. Department of
Agriculture Forest Service, Pacific Northwest Research Station. Portland, OR. 25 pp.
OWEB 1999. Oregon Watershed Assessment Manual. Oregon Watershed Enhancement Board. Salem,
Oregon.
http://oregon.gov/OWEB/docs/pubs/wa_manual99/fundamentals.pdf
Rinella, D.J., D.L. Bogan, K. Kishaba, and B. Jessup 2005. Development of a Macroinvertebrate biological
assessment for Alexander Archepelgo streams – Final Report, Appendix 3 and 4. Prepared for Alaska
Department of Environmental Conservation Division of Air and Water Quality. Anchorage, Alaska. Final
Report, Appendix 3, Appendix 4, Appendix 5, Appendix 6.
Slayton, M. 2008. Outfitter Guide Use summaries for active touring, assisted use, big game hunting, camping,
fishing, and passive touring on Prince of Wales Island, 2002 to 2006. Data contained in Thorne Bay Ranger
District files.
Swanston, D.N. 1991. Natural Processes, pages 139-180. In Meehan, W.R. 1991. Influences of Forest and
Rangeland Management on Salmonid Fishes and their Habitats. American Fisheries Society Special
Publication 19. Bethesda, Maryland. 751 pp.
Swanston, D. N, and D. A. Marion. 1991. Proceedings of the Fifth Federal Interagency Sedimentation
Conference. Volume 2. 10-49 p
Tierney, Patrick. 2003. Personal communication. Silviculturalist, U.S. Forest Service, Thorne Bay Ranger
District.
USFS 1998. Tongass National Forest Land and ResourceManagement Plan Implementation Policy
Clarification (August 1998). Forest Service, Alaska Region. Tongass National Forest, Ketchikan, Alaska. 17p.
USFS 2000a. Strategic Plan (2000 Revision)
http://www.fs.fed.us/plan/stratplan.pdf
http://fsweb.r10.fs.fed.us/rpa/
USFS 2000b. Watershed Delination, Terminology, and GIS. Kelliher, D., S. Paustian, and G.Cross. U.S.
Forest Service, Tongass National Forest. 7 p.
USFS 2000c. Priority Watershed Selection Process by D.Kelliher, J.Thompson, and M.Dudzak. Tongass
National Forest. Document in the files, Fisheries Department, Thorne Bay Ranger District.
USFS 2001. Ketchikan Area Soil Survey User Guide. U.S. Forest Service, Tongass National Forest,
Ketchikan, Alaska. 261pp.
USFS 2001a. Aquatic Habitat Management Handbook. FSH 2090.21 Alaska Region (Region 10), Juneau,
Alaska.
70
USFS 2002a. Alaska Region Emphasis Areas.
http://fsweb.r10.fs.fed.us/r10_priorities.shtml
USFS 2005. Ridge Top to Valley Bottom, Restoring Whole Watersheds. U.S. Department of Agriculture,
Forest Service. R6-NR-WFW-05-05. Pacific Northwest Region, Portland, OR. 24 pp.
USFS 2008. Tongass National Forest Land and Resource Management Plan and Final Environmental Impact
Statement. U.S. Department of Agriculture, Forest Service, Alaska Region. R10-MB-603b&c.
USFS 2008a. U.S. Forest Service, Tongass National Forest Priority Watersheds. North Thorne River.
http://fsweb.tongass.r10.fs.fed.us/tongass/mains/wfew%20files/priority_wsheds_0808.jpg
USFS 2008b. U.S. Forest Service Federal Subsistence Use Data. Data query 2008. Jeff Reeves, Subsistence
Fishery Biologist, Craig, Alaska.
USFS 2009. Prince of Wales (POW) Access and Travel Management (ATM) Plan. Decision Memo.
http://fsweb.tongass.r10.fs.fed.us/tongass/nepa/NEPA_Documents/docs_tbrd/09_POW_ATM/09_T090309_EA
_DM_DR_POW_ATM.pdf
Walters, D. and B. Prefontaine. 2005. Stream Temperature Monitoring Report 1997-2002 Prince of Wales
Island, Alaska. Tongass NF, Thorne Bay Ranger District.
http://fsweb.tongass.r10.fs.fed.us/tongass/wfew/streamtemp.pdf
Woolsey, S., Capelli, F., Gonser, T., Hoehn, E., Hostmann, M., Junker, B., Roulier, C., Schweizer, S., Tiegs, S.,
Tockner, K, Weber, C. and P. Armin. 2007. A Strategy to Assess River Restoration Success. Freshwater Biology.
Volume 52. Issue 4. Pages 752-769.
Zadina, T.P., M.H. Haddix, and M.A. Cartwright. 1995. Production Potential of Sockeye Salmon Nursery
Lakes in Southern Southeast Alaska. Alaska Department of Fish and Game, Regional Information Report No.
5J95-03. Juneau.
Ziemer, Robert R. 1997. Chapter 6: Temporal and Spatial Scales. Pages 80-95 in: J.E. Williams, C.A. Wood,
and M.P. Dombeck editors. Watershed Restoration:Principles and Practices. American Fisheries Society,
Bethesda, Maryland.

71
APPENDIX A
8.5” x 14” Maps of Riparian Thinning Opportunities in
the North Thorne Project Area

72
APPENDIX B
8.5” x 14” Maps of Roads and Road Storage Opportunities
in the North Thorne Project Area

73
APPENDIX C
8.5” x 14” Maps of PFC and Tier II Sites
in the North Thorne Project Area

74
APPENDIX D
8.5” x 14” Maps of Potential Instream LWD Opportunities
in the North Thorne Project Area