
North-REP Socio Economic Baseline report
48
Republic of the Marshall Islands North-REP Socio Economic Baseline report
Transcript of North-REP Socio Economic Baseline report

Republ i c of the Marsha l l I s lands
North-REP Socio EconomicBaseline report
North-REP Republic of the Marshall IslandsSecretariat of the Paci�c Community
C/- Ministry of Resources and DevelopmentP.O Box 4090, Majuro, RMI 96960
Tel: +692 456 0706Email: [email protected]
Website: www.spc.int/northrepFacebook: www.facebook.com/northrep/
Secretariat of the Paci�c Community2nd Floor, Lotus Building, Nabua,Private Mail Bag, Suva, FijiTel: +679 337 0733 | Fax: +679 337 0146Email: [email protected]: http://www.spc.int/edd


North-REP Socio EconomicBaseline report
Republic of the Marshall Islands
Prepared by the Economic Development DivisionSecretariat of the Pacific Community
Suva, Fiji2014
© Copyright Secretariat of the Pacific Community (SPC), 2014
All rights for commercial / for profit reproduction or translation, in any form, reserved. SPC authorises the partial reproduction or translation of this material for scientific, educational or research purposes, provided that SPC and the source document are properly acknowledged. Permission to reproduce the document and/or translate in whole, in any form, whether for commercial / for profit or non-profit purposes, must be requested in writing. Original SPC artwork may not be altered or separately published without permission.
Original text: English
Secretariat of the Pacific Community Cataloguing-in-publication data
North-REP Socio Economic Baseline report: Republic of the Marshall Islands/prepared by the Economic Development Division, Secretariat of the Pacific Community
1. Marshall Islands — Economic aspects.
2. Marshall Islands — Social aspects.
3. Energy – Marshall Islands.
4. Power resources – Marshall Islands.
I. Title II. Secretariat of the Pacific Community
333.79099683 AACR2
ISBN: 978-982-00-0683-6

Contents
List of tables ............................................................................................................................................................. vi
List of figures ........................................................................................................................................................... vii
Introduction ............................................................................................................................................................... 1
1.1 Overview .................................................................................................................................................... 1
1.2 Country background ................................................................................................................................... 2
1.3 Energy sector.............................................................................................................................................. 2
1.4 Past experience .......................................................................................................................................... 3
Project background.................................................................................................................................................. 4
2.1 Activities and expected results ................................................................................................................. 4
Socio-economic baseline assessment ................................................................................................................ 5
3.1 Survey design ............................................................................................................................................. 5
3.2 Community meetings ................................................................................................................................. 5
3.3 Socio-economic household survey results ................................................................................................ 7
3.4 Economic benefits .................................................................................................................................... 18
3.5 Ability and willingness to pay ................................................................................................................. 18
3.6 Expected ongoing costs ........................................................................................................................... 18
Conclusion ............................................................................................................................................................... 21
Annex 1: RMI North-REP logical framework ............................................................................................................. 22
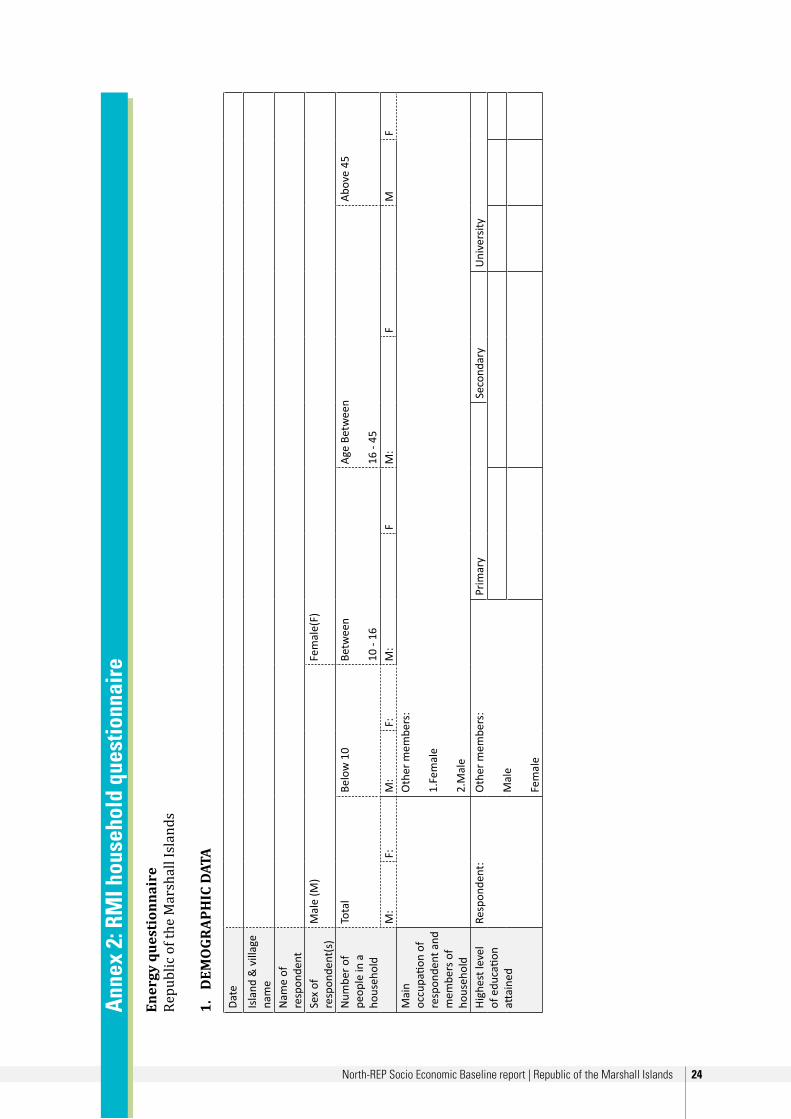
Annex 2: RMI household questionnaire..................................................................................................................... 24

VI North-REP Socio Economic Baseline report | Republic of the Marshall Islands
List of tables
Table 1: Number of households surveyed by atoll ...................................................................................................... 7
Table 2: Population count of households surveyed by atoll ....................................................................................... 7
Table 3: Age-sex distribution of the population ......................................................................................................... 8
Table 4: Main occupations of household members .................................................................................................... 9
Table 5: Energy access by type ................................................................................................................................. 12
Table 6: Impact of access to solar energy on disposable battery use ...................................................................... 12
Table 7: Impact of access to solar energy on car battery use .................................................................................. 14
Table 8: Method of charging car battery .................................................................................................................. 15
Table 9: What devices do you connect to the car battery? ...................................................................................... 16
Table 10: Appliances named as being desired in the future .................................................................................... 16
Table 11: Appliances named as being desired now with adequate capacity .......................................................... 19
Table 12: Annual net cost of the system not covered by revenue at various tariff/collection rates ....................... 20

North-REP Socio Economic Baseline report | Republic of the Marshall Islands VII
List of figures
Figure 1: Household size distribution.......................................................................................................................... 8
Figure 2: Main occupations of men .......................................................................................................................... 10
Figure 3: Main occupations of women ..................................................................................................................... 10
Figure 4: Energy access by type ................................................................................................................................ 11
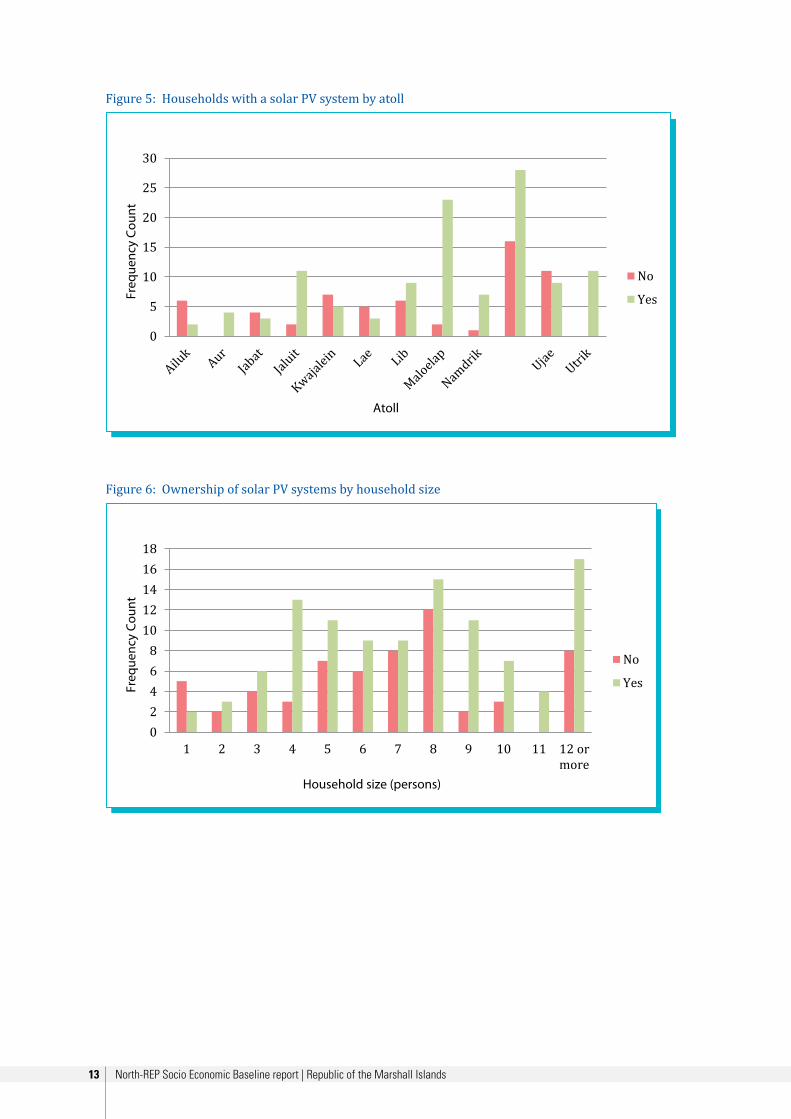
Figure 5: Households with a solar PV system by atoll ............................................................................................. 13
Figure 6: Ownership of solar PV systems by household size ................................................................................... 13
Figure 7: Number of lights powered by solar system ............................................................................................... 14
Figure 8: Satisfaction levels with the amount of electricity provided by solar PV systems .................................... 15
Figure 9: Gender comparison of desired appliances ................................................................................................ 17

1 North-REP Socio Economic Baseline report | Republic of the Marshall Islands
Introduction 1.1 Overview
This report summarises the results of household surveys undertaken in outer islands of the Republic of the Marshall Islands (RMI) to provide a baseline against which to measure the socio-economic impact of the North Pacific ACP Renewable Energy and Energy Efficiency Project (North-REP). Analysis of the impacts at household and community level will not only enable an assessment of the project’s benefits, but will also add to the evidence base for the socio-economic value of this type of investment in renewable energy and energy efficiency in remote areas that have not previously had access to grid-connected electricity.
Many rural households on the outer islands of RMI do not have access to safe, clean and affordable electricity. This has wide socio-economic consequences, on employment opportunities, for example, and on health and education services; children cannot study in the evening and medicines cannot be refrigerated. Access to affordable and reliable sources of energy is therefore considered one of the key enablers of sustainable livelihoods and progress towards the Millennium Development Goals.1 Furthermore, reliance on imported petroleum products reduces energy security, and increasing the energy mix is considered a key priority of energy policies throughout Pacific Island countries and territories (PICTs).
To tackle this and spur economic development, the stated purpose of the North-REP project is: ‘improve the overall efficiency of the energy sector through energy efficiency and grid connected renewable energy (RMI, FSM and Palau) and increase access of remote populations to reliable renewable electricity services (RMI and FSM)’ (see Annex 1). The project will provide households, schools and dispensaries in the outer islands with access to grid-connected electricity for the first time; train staff at government ministries and utilities companies on energy efficiency; and set up maintenance programmes to ensure that the equipment can be maintained and repaired and that the investments work for their intended life.
In order to monitor success of the project and evaluate its impacts, a logical framework was developed, setting out specific, measurable objectives. A socio-economic assessment will determine the extent to which the key results have been achieved. This report will provide baseline data to be used in an ex post evaluation of effects, and also assess the effects expected prior to implementation. It will also assess the ability of the project to sustain itself in the long run after European Development Fund (EDF) support is withdrawn, when it must fund its on-going costs from its own revenue.
The baseline data were predominantly obtained through household surveys that collected data on population demographics, current energy usage, attitudes to improved access to electricity, and how households anticipate making use of it. By way of further surveys after the project activities and infrastructure installation, and gathering of data on actual use of electricity, the effect of the project on socio-economic variables in the project areas can be assessed through an ex-post assessment. This report does not attempt to perform a comprehensive cost benefit analysis, as investment costs are borne by donor funding and will be evaluated elsewhere; this report provides an analysis of socio-economic conditions in order to assess the effects of the project at community level.
1 UNDP, (2005). Energy Services for the Millennium Development Goals, http://www.unmillenniumproject.org/documents/MP_Energy_Low_Res.pdf

North-REP Socio Economic Baseline report | Republic of the Marshall Islands 2
1.2 Country background
The Republic of the Marshall Islands consists of two chains of coral atolls and islands – Ralik in the west and Ratak to the east – located in the western Pacific Ocean. Twenty-two of the 29 atolls and four of the five raised coral islands are inhabited. The islands are typically several kilometres long and rarely over 200 metres wide. In 2010, RMI’s population was estimated to be 54,439. The isolated location of the country and the small, sparsely distributed population mean that RMI suffers the common obstacles to development experienced by other small island states (SIS); a small domestic market; difficulty in achieving economies of scale in production, large distances from import and export markets and associated high transportation costs, high transportation costs domestically, and very high energy costs. Energy intensity, a measure of the efficiency of the energy sector by the amount of energy required to produce a dollar of output, is almost twice that of the average for SIS: 15 MJ per US dollar of GDP, starkly highlighting the challenge to competitiveness in RMI.
The islands have few natural resources and are therefore heavily reliant on imports; agricultural production is primarily of subsistence nature; and small-scale industry is limited to handicrafts, tuna processing and copra. Tourism provides a small source of foreign exchange, but is not as well developed as in several other Pacific Island countries, and currently employs less than 10% of the labour force. RMI is heavily dependent on external assistance; since independence, grants have averaged 60% of government revenue. A Compact of Free Association signed in 1986 and renewed in 2003 guarantees annual financial aid from the US until 2023.
In 2009, 99.96% of energy consumption in RMI came from imported fossil fuels: diesel, petrol, kerosene and liquefied petroleum gas (LPG). The dependence on imported fuel has critical implications both for the economy and quality of life. RMI is at the mercy of world oil prices and this, coupled with high transportation costs, means that the country faces some of the highest fuel prices globally. Fuel imports accounted for 26.6% of GDP in 2009 and, in 2008, some of the aid funds allocated for capital projects were redirected to finance fuel imports, constraining future economic development. The high prices for imported petroleum – coupled with large price increases for electricity, transportation and rice – resulted in inflation of 29.4% in the third quarter of 2008 compared to the same period in 2007. This was the highest inflation rate in the Pacific, reflecting the manner in which RMI’s remote location and import dependence make it vulnerable to price fluctuations for resources.
1.3 The energy sector
The Marshall’s Energy Company (MEC) currently supplies electricity on Majuro, Jaluit and Wotje. Majuro dominates MEC operations, accounting for approximately 95% of its customers. The second largest power system in RMI is the Kwajalein Atoll Joint Utility Resource (KAJUR). KAJUR operates mainly on Ebeye, the county’s second urbanised island, on Kwajalein atoll. 72% of households in RMI are connected to the electricity grid provided by MEC and KAJUR. As the remaining atolls do not have access to grid-connected electricity, access in rural areas is around 32% overall. Contributions from renewable energy sources in 2009 were mainly from the solar photovoltaic (PV) units installed by the REP-5 programme funded by the European Union, which generated around 0.15 GWh of electricity – only 0.22% of total electricity supply.
At the time of the 1999 census, 63% of all RMI households used diesel‐generated electricity for lighting, 31% used kerosene and 5% relied on solar PV systems. Nearly 90% of urban households had electric lighting compared to only 13% in outer islands, 71% of which used kerosene. By 2006, the urban electrification rate had reached 93% in Majuro and 97% in Ebeye and, according to a 2006 community survey, approximately 40% of all households had a refrigerator and 38% a deep freezer, increasing to about 50% of each in Majuro and Ebeye.2 The pattern of appliance ownership suggests that a very high percentage of demand for household electricity use is for cooling. This is particularly pronounced in urban households, where large amounts of electricity are used for air conditioning. In Majuro, buildings account for well over half of all MEC electricity consumption, mainly for cooling and lighting.
2 Economic Policy, Planning and Statistics Office. 2006. Republic of the Marshall Islands 2006 Community and Socio-Economic Survey: Summary of Key Findings. Office of the President. Retrieved 9 January 2012 from http://www.spc.int/prism/country/mh/ stats/Publications/Surveys/mhcombinedkeyfindingsdoc.pdf

3 North-REP Socio Economic Baseline report | Republic of the Marshall Islands
The average tariff of 0.37 (USD/kWh) in RMI is slightly above the average for SIS. To offset the relatively high costs of electricity in RMI, electricity use has been subsidised since before Independence in 1986. While making electricity more affordable, this also encourages inefficient use and the infrastructure struggles to meet demand. Therefore, action is needed both to increase supply, particularly in areas that currently do not have access to electricity, while also increasing efficiency in other areas and reducing the demand for fuel and the strain on generation capacity. The Asian Development Bank’s (ADB) 2008 Rapid Energy Assessment concluded that there were significant cost‐effective opportunities for improved energy efficiency but that renewable energy investments in urban electricity production would require capital grants to compete with petroleum fuelled electricity, at least in the short term.3
1.4 Past experience
Previous donor-funded projects have installed renewable energy technologies, predominantly solar PV systems, solar water heaters or hydroelectricity.4 In RMI, most of the solar home systems (SHS) installed up until 1990 were funded by an Alternative Energy Fund, supported by the US and the Pacific Islands Forum Secretariat (PIFS). These systems provided many homes with convenient and reliable lighting.5 Prior to North-REP, the 9th European Development Fund (EDF) REP-5 project provided renewable energy solutions and energy efficiency expertise, expressly to reduce poverty through improved access to electricity. This was largely achieved through the installation of solar PV systems in households, schools and dispensaries of outer islands.
Long term results have been mixed and, prior to EDF support, donor-funded renewable energy projects in RMI had often not succeeded due to lack of maintenance and spare parts and to inappropriate design for the harsh marine tropical environment. This North-REP project has incorporated these lessons and addresses them by extending the user-pays mechanisms introduced by REP-5 to ensure that investments made by the project are sustainable and that funding is available for ongoing maintenance.6
Evaluations of REP-5 have found positive effects and the electrification of schools was found to have increased educational provision through the evening use of libraries in the Federated States of Micronesia. The provision of electricity to dispensaries has had a positive effect on access to health services, allowing evening surgeries and emergencies to be treated at night.7
The effect on gender equality has been reported as positive. Women have reported that the better light provided by SHS, compared to that obtained from generators or kerosene, has enabled them to make mats and baskets in the evening. This has resulted in then being able to double or even treble their output.8 In areas where there are widespread gender disparities, the distribution of the benefits of the project need to be considered to assess whether they are shared across the community, or tend to flow only to certain members. Looking only at headline statistics can give a misleading picture of the actual effect on communities if there is significant inequality in the ability of different groups to benefit.
3 Johnston, P. and Wade, H. 2008. Background notes and explanation of conclusions: Rapid energy assessment for the Marshall Islands. Prepared for the Republic of the Marshall Islands Government.4 Marconnet, M. 2007. Integrating renewable energy in Pacific Island countries. Unpublished thesis. Wellington, New Zealand. Victoria University of Wellington. p. 13. Retrieved 16 January 2012 from http://researcharchive.vuw.ac.nz/bitstream/ handle/10063/491/thesis.pdf?sequence=1 5 Wade, H. and Johnston, P. 2005. Pacific regional energy assessment 2004: An assessment of the key energy issues, barriers to the development of renewable energy to mitigate climate change and capacity development needs to removing the barriers: Marshall Islands National Report (Vol. 6). Apia, Samoa. Secretariat of the Pacific Regional Environment Programme. p. 35. Retrieved 9 January 2012 from http://www.sprep.org/att/publication/000483_PIREP_Marshall_NatiRpt.pdf6 Wade, H., Johnston, P. and Vos, J. 2004. Pacific regional energy assessment 2004: An assessment of the key energy issues, barriers to the development of renewable energy to mitigate climate change, and capacity development needs to removing the barri ers: Regional overview report (Vol. 1). Apia, Samoa. Secretariat of the Pacific Regional Environment Programme. p. 58–59. Retrieved 9 January 2012 from http://www.sprep.org/att/publication/000480_Regional_Overview_Rpt_Vol.1.pdf7 Resources and Logistics. 2011. Final evaluation of Support to the Energy Sector in Five ACP Pacific Island Countries REP-5. Draft Report. Prepared for the European Community. p. 7. 8 ibid., p. 6
North-REP Socio Economic Baseline report | Republic of the Marshall Islands 4
Project background 2.1 Activities and expected results
The specific purpose of the North-REP project is to: ’improve the overall efficiency of the energy sector through energy efficiency and grid-connected renewable energy … and increase access of remote populations to reliable renewable electricity services’ (see Annex 1). This supports the wider objective of ‘improvement of life on the outer islands and reduced dependency on fossil fuel’. It also aims to increase in-country capacity to promote, deliver and sustain renewable energy and energy efficiency programmes so that the benefits are not lost when the project ends and capacity exists to continue and expand renewable energy (RE) services.
This objective will be achieved by specific improvements implemented by the project including:i. improvements to health and educational facilities by providing electricity access for the first time;ii. providing grid-connected electricity to remote rural areas for the first time;iii. reductions in greenhouse gas emissions (CO2);iv. savings in fuel used for electricity production;v. cost savings for households benefitting from energy efficiency (EE) measures.
North-REP has a comprehensive plan of activities to achieve these objectives to create a change in the energy sector. They include:
➢ refining of national and state energy policies and strategies;➢ training and establishing permanent RE/EE staff in utilities and government;➢ promotion of RE and EE through awareness campaigns and training programmes;➢ setting up permanent in-country training programmes;➢ electrification of households, schools and health centres with PV systems, incorporating the installation
of user-pays systems;➢ implementing long-term maintenance programmes.
Specific targets have been made for these objectives, against which the project will be evaluated, as described in the logical framework in Annex 1. Many of these objectives are discrete and can easily be assessed to monitor implementation, such as the number of schools electrified. The value of this report is to also provide an evidence base to measure the socio-economic effect of the project at individual and community level, in order that it can be evaluated not only in terms of successful implementation, but also for the measurable impact of the activities on livelihoods and energy use by looking at indicators such as employment, and use of electric appliances. This baseline report therefore provides an assessment of current socio-economic indicators before intervention, against which the outcomes can be compared by further surveys after completion of the project activities.

5 North-REP Socio Economic Baseline report | Republic of the Marshall Islands
Socio-economic baseline assessment 3.1 Survey design
Using the information provided by the Ministry of Resources and Development (MRD) and MEC on project locations, an energy survey template was designed by the energy specialist in coordination with MRD and MEC staff and SPC’s energy economist. The energy survey trip was funded by the ADMIRE Project that is housed in MRD and the survey team included representatives from the Ministry of Resources & Development (MRD), Office of Environmental Planning and Policy Coordination (OEPPC), Marshall Islands Conservation Society (MICS), Marshalls Energy Company (MEC) and SPC North-REP.
The purpose of this socio-economic survey was to obtain data not available by other means to provide a representative sample of current demographics and energy usage in project locations. Around 15–20% of households on each island were selected for the survey, which was considered sufficient coverage to be representative. The analysis is based on both quantitative and, where appropriate, qualitative data. While cost data can be quantified precisely, based on estimates of operational maintenance and other on-going costs, many of the benefits of the project are qualitative, such as the expected uses of electricity. Therefore, the survey was designed to collect primary data in the following areas:
➢ demographics➢ current access to energy sources➢ current energy consumption➢ household ability and willingness to pay for electricity➢ expected benefits from increased access to electricity.
The outer island energy survey collected data on energy usage in rural communities located on atolls and surrounding islets, firstly on Jabot, Namu, Ujae, Lae, Mejatto and Kwajalein and, later, on Ailuk, Utrik, Maloelap and Aur. In nearly all of these rural communities, most households have not until now been provided with SHS, and basic energy services are provided by batteries, biomass and fossil fuels.
Following on from installations made under the REP-5 project and other donor-funded projects, the Government of RMI through the Ministry of Resources and Development and the Marshall’s Energy Company identified approximately 1500 households that did not have access to electricity and therefore would benefit from SHS systems to provide reliable renewable energy services. A scoping study was carried out alongside the socio-economic survey to count the total number of households on each island and ensure that the buildings were durable and met the minimum guidelines for a SHS. For example, thatched roof buildings were not considered for SHS.
3.2 Community meetings
The survey visits were an opportunity to not only gather socio-economic data but also to spread awareness of the project: survey teams distributed brochures with information in the Marshallese language on the North-REP project to all community members. Community meetings were held to engage community members on the project and discuss pertinent issues, particularly regarding implementation capacity and payment mechanisms. These meetings were arranged with the mayors of all targeted islands/atolls and were attended by community leaders, including traditional and church leaders, and local government council members.
Community meetings were a good opportunity to assess what support would be necessary to ensure the sustainability of the project. The availability of facilities for storage of SHS before installation was discussed, as was the local labor force, local accommodation for MEC technical staff, availability of local skilled workers to be involved and trained during the installation phase, and the availability of local transportation for moving SHS equipment.
The payment mechanisms, which are crucial for the sustainability of project, were discussed in detail at the community meetings. The current monthly payment process was raised as a concern on every island surveyed. Outer Island SHS owners are directly affected by this issue because they are required to make their monthly USD 5 payment to the MEC office located on Majuro, and infrequent transport services are a significant obstacle

North-REP Socio Economic Baseline report | Republic of the Marshall Islands 6
to this. Communities were keen to impress that the current monthly payment process, which includes payment directly made to the MEC office, be modified or completely changed and government put in place a workable collection method of monthly payments that addresses transportation and communication challenges.
On Jabot, Namu, Lib, Ujae and Lae, residents proposed that the Energy Planning Division and MEC develop an understanding or agreement with the Tobolar copra processing Plant for a payment/barter system. It was proposed by many residents across all five islands that individual copra accounts be created, so that the payment by Tobolar to copra producers would be deposited into individual accounts, from which direct monthly payments would be processed from Tobolar accounts to MEC, making payments far simpler.
The island of Santo, Mejatto and all the surveyed islets of Kwajalein are in a different position as the majority of the residents on these islets are working either for the USAKA Army Base or Kwajalein local government. Thus, they proposed that a monthly payment process be created with the Bank of the Marshall Islands, where a certain amount of their bi-weekly/monthly wages or savings account will be allocated as allotments to MEC to meet monthly payments.
In the second round of household surveys on Ailuk, Utrik, Maloelap and Aur, similar sentiments were expressed regarding making it easier to make payments to MEC, given the communication and transport challenges. Several ideas were put forward, and the use of handicraft sales was a popular option since this is a major form of employment. Residents on Kaben Island suggested working through the Maloelap mayor and local council to identify a focal point on Majuro to whom the locals can send their handicrafts and other local products to be sold to cover the monthly fee. Alternatively, middlemen could be identified through local stores on Kaben who can facilitate this arrangement for a minimum profit. Women on Ailuk were also interested in using handicrafts to pay the monthly fee and be part of the annual trade fair that is normally held in Kwajalein. Residents here raised the idea of an arrangement with the Marshall Islands Marine Resources Authority (MIMRA) to use fish sales to make payments on electricity accounts, as well as an arrangement with the Tobolar Copra processing plant.
Aur residents expressed concern about paying the monthly fee to the MEC local technician due to inconsistent transport and communication services between Aur and Majuro and lack of guarantee that these fees actually reach the MEC office. Complaints were raised that the MEC technician could turn off the SHS if customers have not paid the monthly fee, as affordability is not an issue – the issue is the collection method, and this has to be dealt with first by government. There was also a request that customers who have not paid their monthly fees be given a grace period of three months to update their payments.
Despite these issues, residents of all surveyed outer islands foresaw no problems with the suggestion of a future increment of monthly payments from USD 5 to USD 20 or more, provided that a clear and simple payment process is developed, and also urged government to ensure that spare parts are readily available to them. This provides reassurance that revenues will be forthcoming to support the ongoing costs of the project, although collection rates will only be clear at the evaluation stage. The suggestion of creating automated payment out of their wages would not only make it simpler for residents to make payments, but also reduce opportunities for payment to be withheld.

7 North-REP Socio Economic Baseline report | Republic of the Marshall Islands
3.3 Socio-economic household survey results
This section presents analysis of the data collected during the household surveys conducted specifically for the socio-economic analysis. Table 1 summarises the number of households surveyed by atoll. As can be seen over half the households surveyed were on the atolls of Maloelap, Namu and Ujae. Households were generally large and living arrangements communal; the average household size was 7.9 persons and only a very small proportion of households contained three persons or fewer (See figure 1).
In summary:
➢ A sample of 181 households was surveyed across 12 atolls for the socio-economic impact assessment.➢ These households contained a total of 1319 individuals.➢ Eight persons was the most frequent household size in the survey sample, the next most frequent was
12 or more.
Table 1: Number of households surveyed by atoll
Number of households surveyed by atoll
Atoll Count % of Total
Ailuk 8 4%
Aur 4 2%
Jabat 9 5%
Jaluit 13 7%
Kwajalein 13 7%
Lae 8 4%
Lib 15 8%
Maloelap 25 14%
Namdrik 8 4%
Namu 47 26%
Ujae 20 11%
Utrik 11 6%
Total 181 100%
Table 2: Population count of households surveyed by atoll
Population count of households surveyed by atoll
Atoll Count % of Total
Ailuk 47 4%
Aur 20 2%
Jabat 52 4%
Jaluit 94 7%
Kwajalein 109 8%
Lae 81 6%
Lib 142 11%
Maloelap 102 8%

North-REP Socio Economic Baseline report | Republic of the Marshall Islands 8
Namdrik 55 4%
Namu 378 29%
Ujae 125 9%
Utrik 114 9%
Total 1319 100%
Figure 1: Household size distribution
05
1015202530
1 person 3 persons5 persons 7 persons9 persons 11 persons
HH size
Age-Sex composition
The survey asked respondents the age and sex of all people living in the house. ➢ The population is young, 89% of people being 45 years old or younger.➢ The two largest groups are 16-45 year-olds (41%) and under 10 year-olds (33%). ➢ 51.5% of the population was male and 48.5% female, which is in line with official census estimates of
slightly more males.➢ The majority of respondents themselves were male, accounting for 69% of individuals surveyed,
meaning that the survey dataset includes 49 responses from women.
Table 3: Age-sex distribution of the population
Distribution of population across age-sex groups
Age Group Male Female Total % of total
<10 97 102 199 32%
10-16 66 34 100 16%
16-45 131 127 258 41%
>45 32 35 67 11%
Total* 549 518
*Note that the totals do not sum to the same figure when adding the numbers of males/females by age, or the number that was recorded in a separate question. This is due to blank responses received.
Given the disproportionate number of surveys that were conducted with a male member of the household we must be careful to disaggregate the data where possible in order to assess whether there are significant differences in male and female attitudes. Looking only at the aggregate data would risk introducing a bias towards male responses in the analysis, in particular in considering the expected benefits to communities of the projects and how respondents anticipate using electricity. We must also consider that respondents may not necessarily have given their own preferences, but expressed their perception of the preferences of the head

9 North-REP Socio Economic Baseline report | Republic of the Marshall Islands
of the household, who would be making the decisions. On completion of the project the impact on gender equality will be fully evaluated.
It should also be noted that survey responses had low levels of completion and most did not answer all the questions. This means that for many areas the analysis includes only a subset of those questioned.
Employment
Those surveyed were asked both their own main occupation, and that of other members of the household. This data can be used to compare employment before and after the project activities, and assess whether access to electricity has any short-term effect on employment and income-earning opportunities. Households on the atolls covered are predominantly low-income, mainly reliant on copra and handicraft sales to sustain their livelihoods.
➢ The two most common occupations were Copra making which accounted for 36% of employment, and housewives which were 14% of respondents
➢ The only other occupations to account for a substantial proportion of respondents were teaching and handicraft making each of which 11% of the respondents reported as their main occupation.
Table 4: Main occupations of household members
Main occupation of respondent and members of household
Profession Respondent Other members % of total
Copra maker 53 13 36%
Housewife 21 4 14%
Teacher 16 4 11%
Handicraft maker 12 8 11%
Councilman/council woman 12 1 7%
Retiree 8 3 6%
Policeman 8 3 6%
Health Assistant 5 1 3%
Reverend 3 2%
Acting mayor 1 1%
Air mike 1 1%
Boss 1 1%
Fisherman 1 1%
Electoral officer 1 1%
Environmental Protection Agency 1 1%
IA 1 1%
Diver 1 1%
Unemployed 1 1%
Total 147 37 100%
North-REP Socio Economic Baseline report | Republic of the Marshall Islands 10
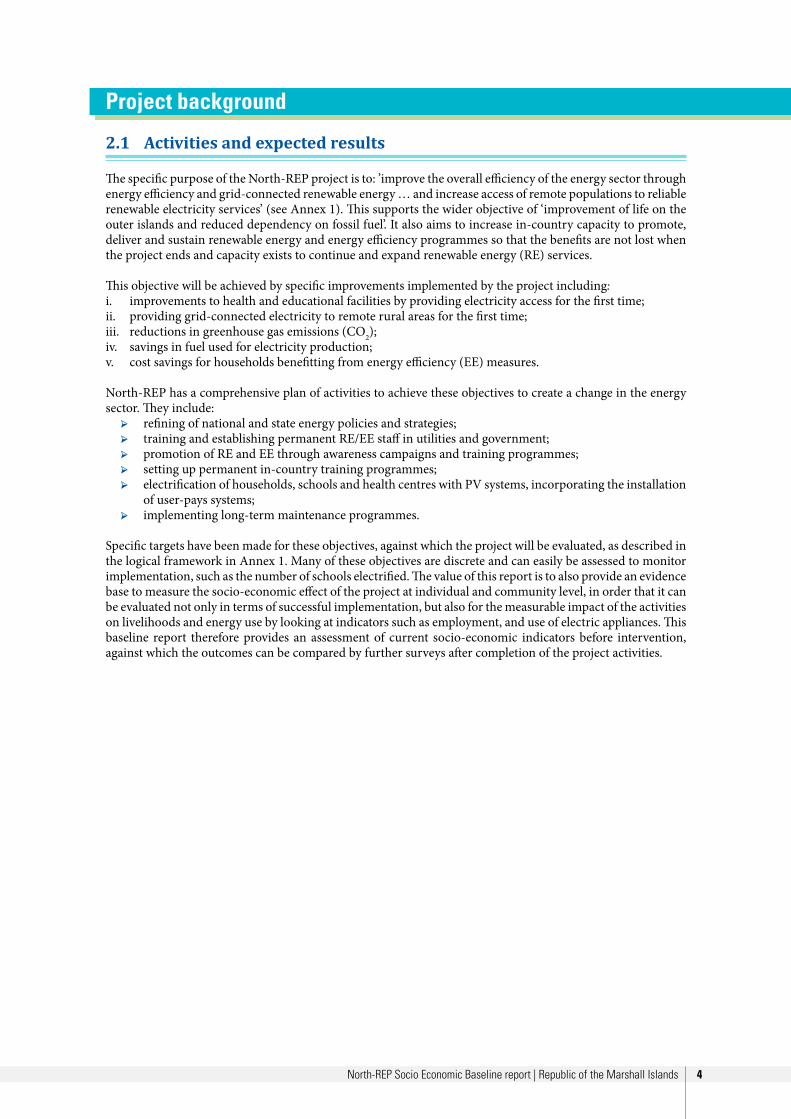
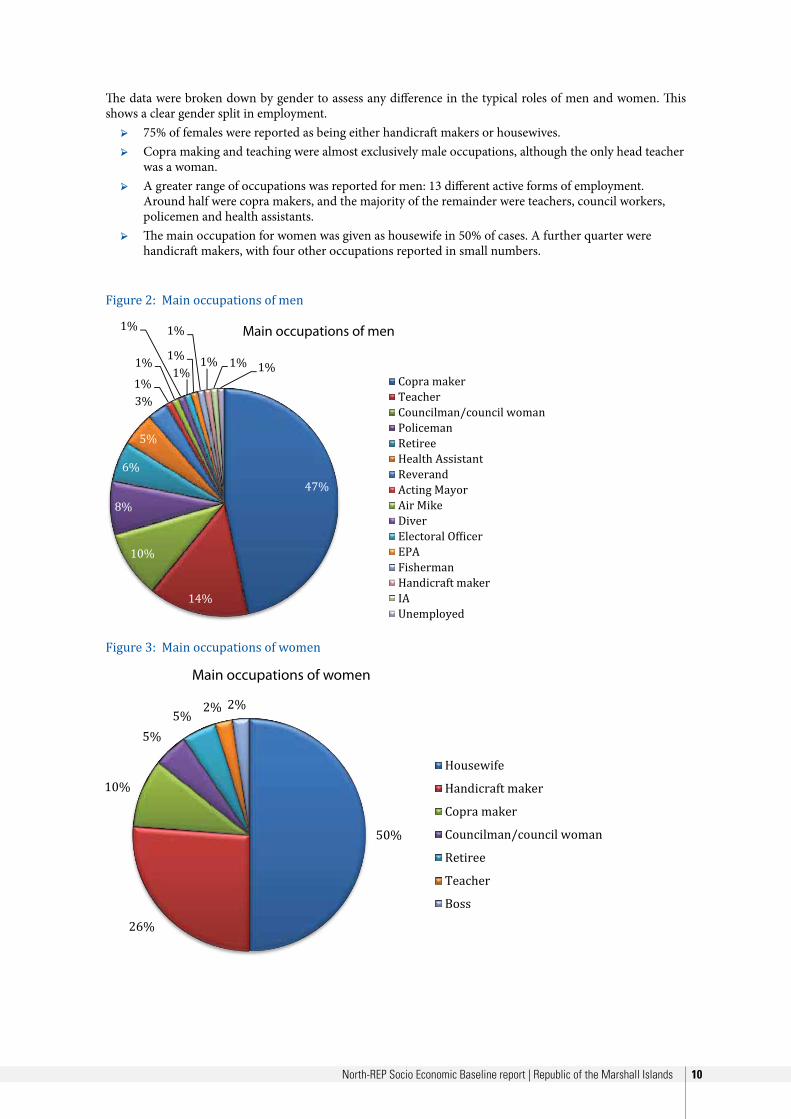
The data were broken down by gender to assess any difference in the typical roles of men and women. This shows a clear gender split in employment.
➢ 75% of females were reported as being either handicraft makers or housewives.➢ Copra making and teaching were almost exclusively male occupations, although the only head teacher
was a woman. ➢ A greater range of occupations was reported for men: 13 different active forms of employment.
Around half were copra makers, and the majority of the remainder were teachers, council workers, policemen and health assistants.
➢ The main occupation for women was given as housewife in 50% of cases. A further quarter were handicraft makers, with four other occupations reported in small numbers.
Figure 2: Main occupations of men
Figure 3: Main occupations of women
11 North-REP Socio Economic Baseline report | Republic of the Marshall Islands
It might be expected that electrification of households that do not currently have access to electricity will enable an increase in opportunities for women to participate in paid employment, particularly in handicrafts, as the power will enable more hours of work at more times of day. This, however, assumes that there is a demand for these goods that is not currently being fulfilled due to the lack of electricity.
Energy access
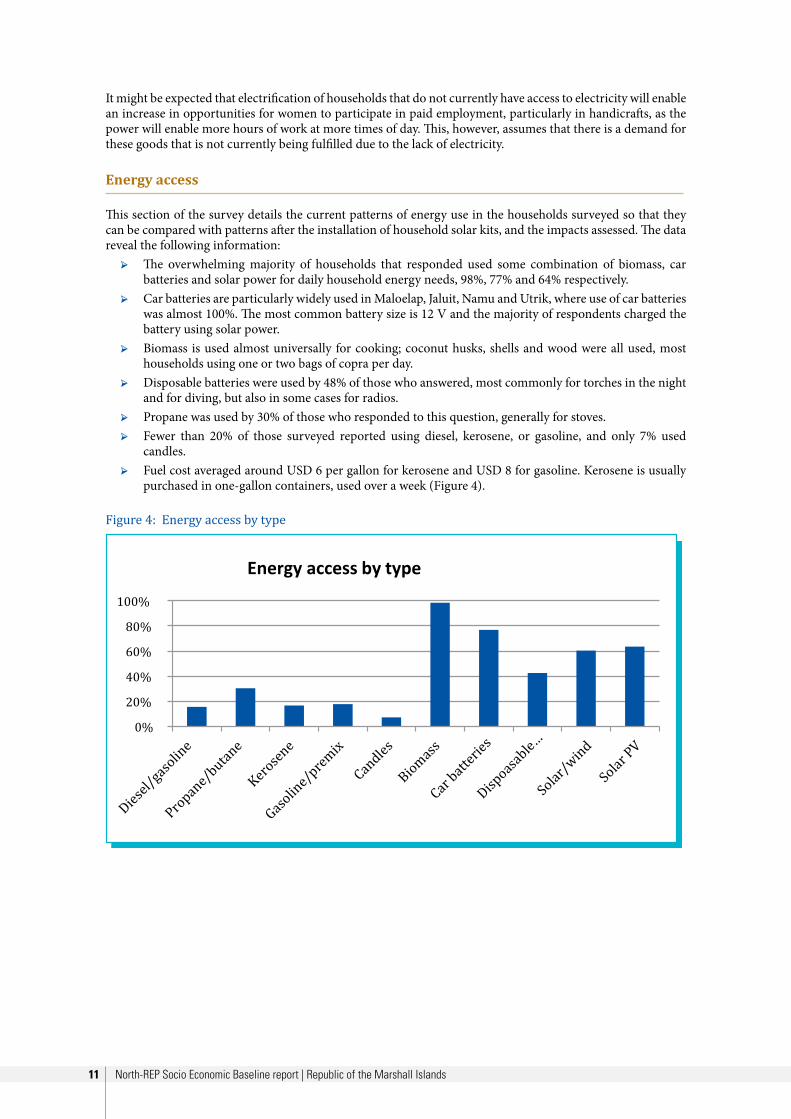
This section of the survey details the current patterns of energy use in the households surveyed so that they can be compared with patterns after the installation of household solar kits, and the impacts assessed. The data reveal the following information:
➢ The overwhelming majority of households that responded used some combination of biomass, car batteries and solar power for daily household energy needs, 98%, 77% and 64% respectively.
➢ Car batteries are particularly widely used in Maloelap, Jaluit, Namu and Utrik, where use of car batteries was almost 100%. The most common battery size is 12 V and the majority of respondents charged the battery using solar power.
➢ Biomass is used almost universally for cooking; coconut husks, shells and wood were all used, most households using one or two bags of copra per day.
➢ Disposable batteries were used by 48% of those who answered, most commonly for torches in the night and for diving, but also in some cases for radios.
➢ Propane was used by 30% of those who responded to this question, generally for stoves.➢ Fewer than 20% of those surveyed reported using diesel, kerosene, or gasoline, and only 7% used
candles.➢ Fuel cost averaged around USD 6 per gallon for kerosene and USD 8 for gasoline. Kerosene is usually
purchased in one-gallon containers, used over a week (Figure 4).
Figure 4: Energy access by type
0%
20%
40%
60%
80%
100%
Energy access by type

North-REP Socio Economic Baseline report | Republic of the Marshall Islands 12
We would expect that, following the installation of SHS, the number of people using fuel for their energy needs will fall further. Although data were limited, the survey results suggest that those homes that had access to SHS were less likely to use disposable batteries, and slightly less likely to use kerosene. The result that use of disposable batteries was most sensitive to access to SHS should be expected as these were used by a larger number of households than kerosene, for example, and were used for similar purposes. Interestingly, individuals who used SHS were more likely to use car batteries than those without SHS (Table 6). As will be seen later, the two are often used as complements rather than solar power substituting for car battery power.
Table 5: Impact of access to solar energy on disposable battery use
Impact of access to solar energy on disposable battery use
Without solar energy With solar energy
People who do not use disposable batteries
45% 56%
People who do use disposable batteries
55% 44%
Total 100% 100%
Table 6: Impact of access to solar energy on car battery use
Proportion of respondents without solar PV, who use car batteries
Proportion of respondents with solar PV, who use car batteries
Count % of total Count % of totalNo 21 35% 18 16%Yes 39 65% 97 84%No response 0 0% 0 0%Total 60 100% 115 100%
Access to renewable energy
This section of the survey gathered information on current use of and attitudes towards solar power. This will enable an assessment of how much the North-REP project expands access, and whether the SHS installed by the project provide greater generation capacity and more reliability of supply.
➢ Of the households surveyed, 64% of respondents reported they had a solar PV system, and 60% a solar/wind system.
➢ This result was not uniform across the atolls. The majority of respondents who reported owning a solar PV system were disproportionately distributed on the atolls of Aur, Jaluit, Maloelap, Namdrik and Utrik, where 85% or more reported having a solar system. Conversely, on Aikuk, Jabat, Kwajalein, Lae and Ujae, around 40% or less of respondents reported having a solar system.
➢ No particular correlation was found between household size and ownership of a solar PV system.➢ Solar home systems were used mostly for powering lights, and 83% of those who provided an answer,
connected one or two lights to the system.➢ Only 16 respondents named other appliances connected to the solar PV system; the majority of these
were radios and some also mentioned TVs or DVD players.➢ 81% of those with solar PV used solar panels to charge car batteries.
13 North-REP Socio Economic Baseline report | Republic of the Marshall Islands
Figure 5: Households with a solar PV system by atoll
Figure 6: Ownership of solar PV systems by household size

North-REP Socio Economic Baseline report | Republic of the Marshall Islands 14
Figure 7: Number of lights powered by solar system
Car batteries were generally charged daily, and an interesting observation is that 81% of households that answered the question on how they charge their car batteries stated that they use solar panels and it is these car batteries that power light, radios and some other appliances. Very few SHS powered lights or appliances directly. It is not clear from the survey or the final evaluation of REP-5 how this model became prevalent amongst SHS owners.
Table 7: Method of charging car battery
Method of charging car battery
Count % of TotalSolar power 70 81%Generator 1 1%
No response 15 17%
86 100%
Satisfaction with the solar PV system
Users were asked how satisfied they are with their solar PV systems to get an assessment of the reliability and ease of maintenance, which are crucial to long-term success of the project.
➢ 90% of those who responded to the question answered that they were satisfied with maintenance of the system.
➢ Over 80% of respondents reported that they maintained their systems themselves. ➢ The majority of those who did not self-maintain equipment themselves reported using MEC.
Responses to the question of whether the solar PV system always provides sufficient electricity were, however, more mixed.
➢ Just below 60% of respondents said that the system did provide sufficient or adequate electricity.➢ 32% of respondents said that it did not provide sufficient electricity.➢ 10% of respondents stated that they would prefer more panels.

15 North-REP Socio Economic Baseline report | Republic of the Marshall Islands
Figure 8: Satisfaction levels with the amount of electricity provided by solar PV systems
Energy usage
Data on energy usage was limited for households using traditional methods of generation as few households were using diesel generators, propane, kerosene and gasoline. Only 18 households stated appliances powered by diesel generators, 16 kerosene, 4 gasoline and 3 propane. Where answers were given, generally generators were used to power appliances, in particular laundry, and lights; while kerosene was used for lighting and stoves, and gasoline for boats.
The main source of energy for powering appliances is car batteries, as noted earlier,. Their pattern of use gives some insight into what households currently prioritise in their energy needs, and will help us better interpret the responses to the question of what additional appliances people would like to use in future. Given that we know that households are using solar power to charge car batteries, this also gives information on how households that currently do not have access to SHS, might use it. Batteries were currently being used in households as follows.
➢ Three fifths (60%) of households used them to power lighting, overwhelmingly the most common use of car batteries. In line with this finding, batteries were most commonly used for 10–12 hours a day from around 7 p.m.
➢ The only other appliances reported as being used by more than 10% of households were TVs and radios – including radios for entertainment as well as communication.
➢ Very few households had a washing machine, or either a fridge or freezer; given what we know of patterns of energy use where people have electricity, these are likely to be appliances households would be keen to use if they could. It may be, however, that affordability of the appliance is an obstacle to the use of these appliances, as well as electricity access.
Table 8: What devices do you connect to the car battery
What devices do you connect to the car battery
Count % of TotalLights 92 59%Radio 24 15%TV 19 12%DVD 7 4%Washing machine 3 2%Refrigerator 2 1%Fan 2 1%Freezer 2 1%Sewing machine 1 1%Laptop 1 1%Fix wires 1 1%
Regulator 1 1%
Boat 1 1%
Does the solar PV system always provide sufficient electricity?

North-REP Socio Economic Baseline report | Republic of the Marshall Islands 16
Expected impacts/benefits
To assess the expected impact of the project on communities, those surveyed were asked what appliances they would like to use in the future and, separately, what extra appliances they would connect to their solar system if they could. As we have seen, most households are already prioritising the energy they have access to for their lighting needs, so appliances named here should be viewed as additional to this in the majority of cases.
➢ 61% of those who responded reported that they would like to use additional appliances.➢ By far the most commonly desired appliance was a washing machine, named by almost half of
respondents to this question. As seen previously, very few households were currently powering laundry appliances with their power.
➢ Around 10% of respondents named TVs and lights as appliances they would like to use in the future, and fridges and hardware tools were the next most commonly named appliances in answer to both questions.
It is interesting that fridges and freezers were named by only a small minority of households, even though very few households have these appliances at present. It suggests that they are not viewed as a priority, despite the evidence from previous community surveys noted earlier.
Table 9: Appliances named as being desired in the future
What appliances do you want to use in future? Count % of TotalWashing machine 56 45%TV 15 12%Lights 12 10%Refrigerator 8 6%Fan 7 6%Hardware tools 7 6%Radio 4 3%DVD 4 3%Sewing machine 2 2%Rice cooker 2 2%Handicraft trimmer 2 2%Laptop 1 1%Inverter 1 1%Household appliances 1 1%Fix wires 1 1%Regulator 1 1%Freezer 1 1%Total 125 100%
Table 10: Appliances named as being desired now with adequate capacity
What appliances would you connect to solar/wind if it could provide it? Count % of TotalWashing machine 18 36%Hardware tools 5 10%TV 4 8%Lights 4 8%Refrigerator 4 8%

17 North-REP Socio Economic Baseline report | Republic of the Marshall Islands
Fan 4 8%DVD 3 6%Freezer 3 6%Rice cooker 1 2%Radio 1 2%Keyboard 1 2%Computer 1 2%Regulator 1 2%Total 50 100%
The responses were broken down by the sex of respondent to assess any differences in the types of appliances desired by gender. This is particularly important as men were over-represented in the survey, so disaggregation by gender provides a clearer picture of what the population would like to use electricity for. The analysis showed that:
➢ while the two most commonly named appliances remained laundry devices and TVs in both groups, over half the women who responded (54%) expressed a preference for laundry appliances compared to 34% of men. Conversely, a greater proportion of men (19%) stated a desire for a television, compared to 13% of women.
➢ for men, the third most commonly stated appliance was hardware tools, which 10% of men named. No women named hardware tools; their third most common was lighting, named by 10% of women, compare to 7% of men.
Figure 9: Gender Comparison of desired Appliances
Desired appliances by gender

North-REP Socio Economic Baseline report | Republic of the Marshall Islands 18
3.4 Economic benefits
The household survey was not able to explore the potential income benefits of increased access to electricity, and indeed the indicators for the project do not include economic effects, as they are likely to materialise over the longer term and are difficult to attribute directly to the project. The evaluation carried out on the REP-5 project did, however, identify a number of benefits arising from improving access to electricity through solar home systems. In Ailinglaplap, women were reported to have increased their production of handicrafts as solar lighting enabled them to also make handicrafts in the evening, whereas previously kerosene or generators provided insufficient lighting. This increase in productive activity resulted in demonstrated increases in income.
It is important, however, to note that this effect was most pronounced where islands have easy access to markets, so it is not certain whether this effect will be seen in the islands included in this survey. For there to be an income effect, a market with unfulfilled demand for products must exist, one that can satisfy any increase in production. Furthermore, the islands need to be able to access this market. It is also quite possible that, if there is such an effect, it will be over a longer term than the initial evaluation period.
Aside from the possible increased sales of handicrafts, it is not expected that North-REP will have significant effects on poverty alleviation. Due to the subsistence nature of these communities, there is little opportunity for electrification to increase existing avenues of income or create new opportunities for economic enterprise. The benefits are therefore expected to be in improvements in the quality of life for communities that have received SHS. However, there could be long term effects from improved education and health facilities, which lead to increased productivity and greater earning potential, coupled with access to electricity overcoming a huge constraint in starting up any business venture.
3.5 Ability and willingness to pay
As has already been noted, for the long-term success and sustainability of the project, it is necessary that sufficient revenue is raised to cover ongoing costs. Given the subsistence nature of the economy, it is important that tariffs are set at a realistic rate, appropriate to income levels, both to prevent hardship and to encourage payment.
Although the survey did not collect information on ability or willingness to pay, it did find that individuals who used kerosene were spending on average around USD 6 per week, or USD 25 per month. The proposed tariffs were also directly addressed at the community meetings, where, as noted, a positive response was received about the potential for increases in the tariff up to USD 20 and possibly higher. It is important, however, that increases are well communicated ahead of their introduction so that households have time to prepare and factor this into their budget. It may be that there will be a strong objection to tariffs substantially above these rates.
3.6 Expected ongoing costs
The failure of past attempts to introduce small-scale electricity generation in locations such as RMI has often been attributed to the lack of consideration of the maintenance required over the life of the project to keep it functioning. Ensuring this is in place so that the equipment functions for its expected useful life requires investment both in parts and in training and labour to ensure local capacity to maintain and repair equipment.
To provide for this, this project proposes expanding the existing user-pays system for homes connected to solar systems to one that also raises revenue to fund the up-keep of the infrastructure. For the system to be self-sustaining, the revenue needs to be sufficient to cover all ongoing costs to ensure maintenance of the solar system, as well as replacement of batteries and other essential hardware necessary for operation over the lifetime of the system, which has been fixed at 20 years. Installation costs are not considered in the analysis here, since these are funded by EDF. Furthermore, since the decision to install equipment has already been taken, this is outside of this analysis; it has already been decided that the benefits of electricity are worth these costs.

19 North-REP Socio Economic Baseline report | Republic of the Marshall Islands
To assess the system sustainability over its expected life, estimates of ongoing costs were developed by MEC and North-REP energy adviser, based on the number of labourers that would be required for maintenance, and the expected cost of replacing parts at set intervals, based on expert knowledge of the lifetime of parts. The expected cost of solar electrification was then compared with revenue under several scenarios, using different tariff and collection rates.
Break-even analysis was used to assess the tariff and collection rates at which revenue would cover costs. The break-even point is the point at which cost or expenses and revenue are equal so that there is no net loss or gain. Assumptions made in the analysis were that:
➢ batteries and controllers need to be replaced every five years, and their costs increase at the rate of inflation;
➢ panels need to be replaced every 20 years at the end of their useful life;➢ 71 technicians are required; two on most atolls but six to eight on the larger atolls;➢ A USD 100 one-time connection fee is paid by households on installation;
The inflation rate for prices of replacement parts was based on the average rate of inflation in RMI and Guam over the last five years. Inflation in the region has fluctuated significantly over the recent period, heavily influenced by fuel prices, making accurate forecasting of future rates difficult. As inflation in RMI averaged 2.4%, and in Guam 2.65%, an average rate of 2.5% was used. As the rate of inflation used includes energy costs, which have driven higher rates of inflation seen in some recent periods, it is likely that using this average rate will produce cost estimates on the high side of what should be expected, especially since the price of solar equipment has been falling in recent years. It is important, however, to be aware of the potential impact of price rises on long-term costs, and this remains a low assumed level of inflation.
The analysis indicates that at the lowest user contribution of USD 5 per month at a collection rate of 40 per cent, meeting the ongoing costs will require an additional cash flow of approximately USD 975,000 per year. This represents approximately 0.6% of annual GDP. By way of comparison, at the proposed USD 20 tariff, at an 80% collection rate the subsidy is USD 440,000 per year and USD 290,000 per year at a 100% collection rate – 0.3% and 0.2% of GDP respectively.
If collection rates of 100% could be achieved, the break-even fee is just under USD 28 per month so, on the assumption the fee could be expected to rise over a 20 year period, we may expect that the scheme will finance its own ongoing costs. At a collection rate of 60%, the break-even tariff is USD 46 but, given the positive community reaction and willingness to make payments directly from wages, a higher collection rate is anticipated.
Different scenarios tested are shown in Table 14.
Table 11: Annual subsidy required for on-going cost recovery at various tariff and collection rates
ANNUAL GOVERNMENT SUBSIDY REQUIRED TO COVER ONGOING COSTS USD MONTHLY COLLECTION RATE
MONTHLY TARIFF PER INSTALLATION (USD) 40% 50% 60% 80% 100%
5 974,214 955,195 936,175 898,137 860,09910 898,137 860,099 822,060 745,984 669,907
12 867,706 822,060 776,414 685,122 593,831
20 745,984 669,907 593,831 441,677 289,52428 624,855 518,496 412,137 199,419 –13,29946 350,385 175,409 433 –349,520 – 699,472
North-REP Socio Economic Baseline report | Republic of the Marshall Islands 20
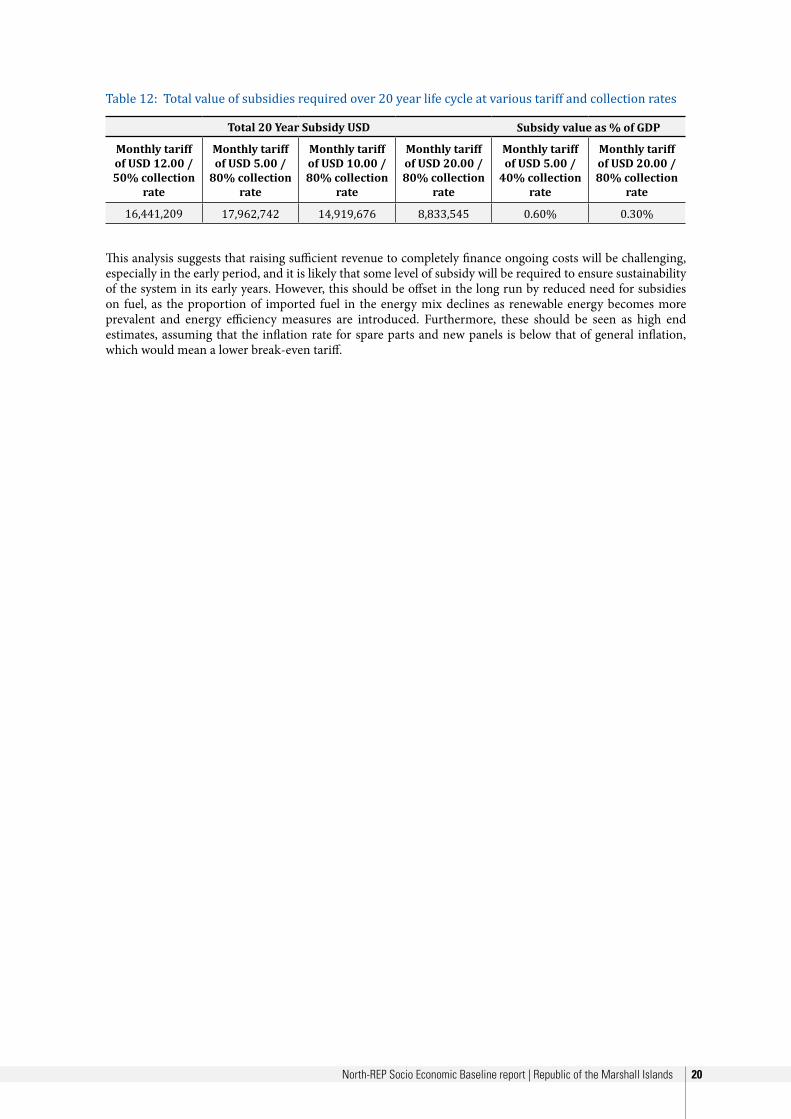
Table 12: Total value of subsidies required over 20 year life cycle at various tariff and collection rates
Total 20 Year Subsidy USD Subsidy value as % of GDP
Monthly tariff of USD 12.00 / 50% collection
rate
Monthly tariff of USD 5.00 /
80% collection rate
Monthly tariff of USD 10.00 / 80% collection
rate
Monthly tariff of USD 20.00 / 80% collection
rate
Monthly tariff of USD 5.00 /
40% collection rate
Monthly tariff of USD 20.00 / 80% collection
rate
16,441,209 17,962,742 14,919,676 8,833,545 0.60% 0.30%
This analysis suggests that raising sufficient revenue to completely finance ongoing costs will be challenging, especially in the early period, and it is likely that some level of subsidy will be required to ensure sustainability of the system in its early years. However, this should be offset in the long run by reduced need for subsidies on fuel, as the proportion of imported fuel in the energy mix declines as renewable energy becomes more prevalent and energy efficiency measures are introduced. Furthermore, these should be seen as high end estimates, assuming that the inflation rate for spare parts and new panels is below that of general inflation, which would mean a lower break-even tariff.

21 North-REP Socio Economic Baseline report | Republic of the Marshall Islands
Conclusion This report has set out the results of household surveys conducted on 12 atolls in the Republic of the Marshall Islands in order to provide a baseline against which effects of the North-REP project can be compared. The primary household data are necessary for an assessment of the direct effect of the project, and the effect on household behaviour, which is not possible with higher level aggregate data on energy use. Other objectives of the project are more easily verifiable as they can be measured by discrete changes in indicators, such as whether a certain number of people have been trained by the project, and whether energy efficiency workshops have been introduced.
The survey data show that, at present, the majority of people living in these communities are only meeting their most basic of energy needs of cooking and lighting, and are restricted in the number of lights they can use, with consequent effects for all members of the household on participation in the economy, on education and on health care. Health centres can operate only limited hours and do not have electricity to power fridges to chill medicines.
Furthermore, other elements of the project that should increase energy efficiency will reduce the demand on generators, increasing their reliability, and also bring benefits of reduced fuel bills and greenhouse gas emissions. These savings can be quantified at the evaluation stage, when data for changes in energy use are available. Data will also be available for tariff collection rates and actual ongoing costs, allowing an assessment of the viability of the systems in the long run, and for a comparison of these costs with those benefits that can be quantified, such as fuel savings.
There are elements that were not given sufficient coverage in these household surveys and that must be considered fully when evaluating the scheme. A detailed gender analysis should be conducted to accurately assess the effect of the project across different members of communities, and whether the project is having the intended effect of increasing opportunities for women in these communities. It would also be desirable to collect information on schooling habits, and how many hours school pupils are using light at home for studying. An assessment from teachers and households will provide evidence on the effect of electricity on education, not only in schools, but also in the work students can complete at home, which could have substantial long-term benefits by increasing average educational attainment.
It is clear that if the project is to have a long term effect on improving livelihoods, care needs to be taken in making it as easy as possible for people to pay their bills by setting up new arrangements. The difficulties in making payment in Majuro due to poor transport links were a common concern and, given the importance of revenue collection to the long-term success of this project, needs to be addressed, especially if higher tariffs are going to be introduced and the target collection rate of 70% achieved.

North-REP Socio Economic Baseline report | Republic of the Marshall Islands 22
Ann
ex 1
: RM
I Nor
th R
EP lo
gica
l fra
mew
ork
No
rth
-RE
P c
ou
ntr
y lo
gic
al f
ram
ew
ork
s
co
mp
lem
en
t

23 North-REP Socio Economic Baseline report | Republic of the Marshall Islands
North-REP Socio Economic Baseline report | Republic of the Marshall Islands 24
Ann
ex 2
: RM
I hou
seho
ld q
uest
ionn
aire
Ener
gy q
uest
ionn
aire
Repu
blic
of t
he M
arsh
all I
slan
ds
1.
DEM
OGR
APH
IC D
ATA
Date
Isla
nd &
vill
age
nam
eN
ame
of
resp
onde
ntSe
x of
re
spon
dent
(s)
Mal
e (M
)Fe
mal
e(F)
Num
ber o
f pe
ople
in a
ho
useh
old
Tota
lBe
low
10
Betw
een
10 -
16
Age
Betw
een
16 -
45
Abov
e 45
M:
F:
M
:F:
M:
FM
:F
MF
Mai
n oc
cupa
tion
of
resp
onde
nt a
nd
mem
bers
of
hous
ehol
d
Oth
er m
embe
rs:
1.Fe
mal
e
2.M
ale
High
est l
evel
of
edu
catio
n att
aine
d
Resp
onde
nt:
Oth
er m
embe
rs:
Mal
e
Fem
ale
Prim
ary
Seco
ndar
yU
nive
rsity

25 North-REP Socio Economic Baseline report | Republic of the Marshall Islands
2.
ENER
GY U
SAGE
– D
IESE
L/GA
SOLI
NE
GEN
ERAT
OR
Do y
ou h
ave
acce
ss to
a d
iese
l/ga
solin
e ge
nera
tor?
Yes
No
If th
e an
swer
to th
e qu
estio
n ab
ove
is Ye
s, w
ho o
wns
the
gene
rato
r?
MEC
Fam
ilyLo
cal G
over
nmen
tO
ther
s
Deta
ils o
f the
gen
erat
orSi
ze (k
W)
Size
(hp)
Mak
e/M
odel
Date
/Pla
ce p
urch
ased
Cost
Type
of p
rem
ises i
t is p
rovi
ding
po
wer
toHo
useh
old
num
ber
Shop
Scho
ols
Tariff
/Am
ount
Cha
rged
Char
ge ty
pe (M
onth
ly/
kWh,
etc
.)
Spec
ifica
tions
of g
ener
ator
Fuel
cos
t per
mon
thM
aint
enan
ce c
osts
per
m
onth
New
/sec
ond-
hand
Gene
rato
r age
Expe
cted
life
Aver
age
daily
hou
r of
oper
ation
s
Oth
er in
form
ation
Aver
age
no. o
f day
s per
w
eek
No.
of b
reak
dow
ns
(mon
th)
Aver
age
cost
of r
epai
r ($
/mon
th)
Cost
of d
iese
l/gas
olin
e (p
er li
tre/
gallo
n)Pl
ace
whe
re g
asol
ine/
dies
el is
bou
ght f
rom
North-REP Socio Economic Baseline report | Republic of the Marshall Islands 26
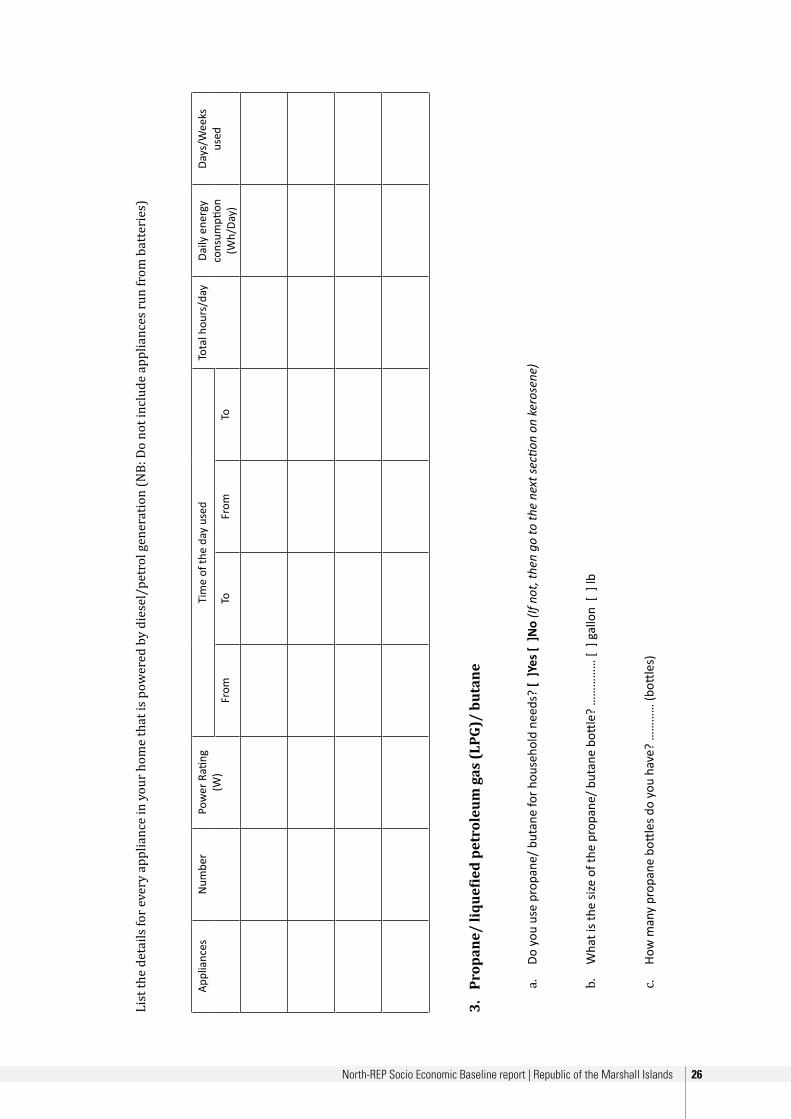
List
the
deta
ils fo
r eve
ry a
pplia
nce
in y
our h
ome
that
is p
ower
ed b
y di
esel
/pet
rol g
ener
atio
n (N
B: D
o no
t inc
lude
app
lianc
es ru
n fr
om b
atte
ries
)
Appl
ianc
esN
umbe
rPo
wer
Rati
ng
(W)
Tim
e of
the
day
used
Tota
l hou
rs/d
ayDa
ily e
nerg
y co
nsum
ption
(W
h/Da
y)
Days
/Wee
ks
used
From
ToFr
omTo
3.
Prop
ane/
liqu
efie
d pe
trol
eum
gas
(LPG
)/ b
utan
e
a.
Do y
ou u
se p
ropa
ne/ b
utan
e fo
r hou
seho
ld n
eeds
? [
]Yes
[ ]N
o (If
not
, the
n go
to th
e ne
xt se
ction
on
kero
sene
)
b.
Wha
t is t
he si
ze o
f the
pro
pane
/ but
ane
bott
le?
……
……
… [
] ga
llon
[ ]
lb
c. Ho
w m
any
prop
ane
bott
les d
o yo
u ha
ve?
……
……
(bott
les)

27 North-REP Socio Economic Baseline report | Republic of the Marshall Islands
d.
Wha
t is t
he c
ost o
f refi
lling
one
pro
pane
bott
le?
$ …
……
……
. per
fill
e.
Fuel
cos
t (as
per
last
dat
ed in
voic
e) :
……
…($
per
gal
lon)
f. La
st d
ate
of fu
el d
eliv
ery
to th
e ou
ter i
sland
.....
......
......
..
g.
How
ofte
n do
you
buy
a re
fill?
……
. pe
r [ ]
wee
k [
] m
onth
[ ]
yea
r
h.
Prop
ane/
But
ane
appl
ianc
es u
sed
(incl
ude
only
thos
e fo
r hou
seho
ld u
se)
Appl
ianc
eN
umbe
rTi
me
of th
e da
y us
edTo
tal H
ours
/Day
Size
e.g
. sto
ve
with
2 b
urne
rs /
4 bu
rner
s with
ove
n,
etc
Days
/Wee
k U
sed
From
ToFr
omTo

North-REP Socio Economic Baseline report | Republic of the Marshall Islands 28
4.
Kero
sene
a.
Do y
ou u
se k
eros
ene
in y
our h
ouse
hold
? [
]Yes
[ ]N
o (If
not
, the
n go
to th
e ne
xt se
ction
on
petr
ol/p
re-m
ix)
b.
Amou
nt o
f ker
osen
e us
ed: …
……
……
…..
(gal
lon)
wee
k [
] m
onth
[ ]
c. Co
st o
f ker
osen
e: $
……
……
…(p
er g
allo
n)
d.
Fuel
cos
t (as
per
last
dat
ed in
voic
e) :
$…
……
(per
gal
lon)
e.
Last
dat
e of
fuel
del
iver
y to
the
oute
r isla
nd...
......
......
....
f. Ke
rose
ne a
pplia
nces
use
d
Appl
ianc
eN
umbe
rDe
scrip
tion
How
ofte
n re
fille
d pe
r wee
kTi
me
of d
ay u
sed
Tota
l hou
rs/d
ayDa
ys/W
eek
used
From
ToFr
omTo

29 North-REP Socio Economic Baseline report | Republic of the Marshall Islands
5.
Gaso
line
/ Pr
e-m
ix
a.
Do y
ou u
se g
asol
ene
pre-
mix
in y
our h
ouse
hold
? (N
B. In
clud
e fis
hing
boa
t ow
ned
by h
ouse
hold
hea
d) [
] Ye
s [ ]
No.
(If n
ot, t
hen
go to
the
next
secti
on o
n ca
ndle
s)
b.
Amou
nt o
f gas
olin
e / p
re-m
ix u
sed:
……
……
…..
(gal
lon)
wee
k [
] m
onth
[ ]
c. Co
st o
f gas
olin
e / p
re-m
ix: $
……
……
… (p
er g
allo
n)
d.
Gaso
line
/ pre
-mix
app
lianc
es u
sed
Appl
ianc
eN
umbe
rDe
scrip
tion
How
ofte
n re
fille
d (w
ks)
Tim
e of
day
use
dTo
tal h
ours
/day
Days
/Wee
k us
ed
From
ToFr
omTo

North-REP Socio Economic Baseline report | Republic of the Marshall Islands 30
6.
Cand
les
a.
Do y
ou u
se c
andl
es in
you
r hou
seho
ld?
[ ]Y
es [
]No
(If n
ot, t
hen
go to
the
next
secti
on o
n bi
omas
s)
b.
Num
ber u
sed:
……
……
……
……
(can
dles
) per
[ ]
Wee
k [
] M
onth
[ ]
Yea
r
c. Co
st: $
……
……
……
……
…pe
r pac
k of
……
……
… c
andl
es
7.
Biom
ass
Biom
ass i
nclu
des w
ood/
drift
woo
d, ri
ce h
usks
, dun
g, c
ocon
ut, c
ocon
ut h
usk,
coc
onut
shel
l, ch
arco
al.
a.
Do
you
burn
bio
mas
s in
your
hou
seho
ld?
[ ]Y
es [
]No
(If n
ot, t
hen
go to
the
next
secti
on o
n ba
tterie
s)
Type
Purp
ose
e.g.
for c
ooki
ng
3 m
eals
per d
ay (p
rovi
de
det
ails)
Am
ount
use
d (l
b/d
ay o
r oth
er
units
)So
urce
(s)
Cos
t ($/
lb o
r bun
dle
)

31 North-REP Socio Economic Baseline report | Republic of the Marshall Islands
8.
Batt
erie
s
Incl
ude
lead
-aci
d ba
tterie
s tha
t are
not
per
man
ently
con
nect
ed to
a so
lar s
yste
m.
a.
Do y
ou u
se c
ar b
atter
ies?
[ ]Y
es [
]No
(If n
ot, t
hen
go to
que
stion
b)
(i)
Wha
t is t
he si
ze o
f the
batt
ery?
……
……
……
……
…..…
……
. (Ah
)
(ii)
Are
ther
e m
ore
batte
ries t
hat y
ou o
wn
and
use?
……
……
… b
atter
ies
(Indi
cate
size
and
feat
ures
of a
dditi
onal
batt
erie
s.)…
……
……
……
……
……
…
(iii)
Wha
t is t
he c
ost o
f the
batt
ery?
$…
……
……
……
……
(per
batt
ery)
(iv)
Whe
re is
the
batte
ry b
ough
t fro
m?
......
......
......
......
......
......
......
......
......
.
(v)
How
long
doe
s one
batt
ery
last
?..…
……
……
……
……
……
…
(vi)
How
do
you
char
ge th
e ba
ttery
? …
……
……
……
……
……
……
……
..
......
......
......
......
......
......
......
......
......
......
......
......
......
......
......
......
......
......
......
...
(vii)
W
hat i
s the
cos
t of c
harg
ing
the
batte
ry ($
/cha
rge)
?……
……
…

North-REP Socio Economic Baseline report | Republic of the Marshall Islands 32
(viii
) Ho
w o
ften
is th
e ba
ttery
cha
rged
? …
……
…..…
……
……
……
……
..
Appl
ianc
es
run
from
car
ba
tterie
s
Num
ber
Pow
er c
on-
sum
ption
ratin
g (W
)
Tim
e of
day
use
dTo
tal h
ours
/day
Daily
ene
rgy
cons
umpti
on
(Wh/
Day)
Days
/Wee
k us
edFr
omTo
From
To
b.
Do y
ou u
se d
ispos
able
batt
erie
s? [
]Yes
[ ]N
o (If
not
, the
n go
to th
e ne
xt se
ction
on
PV so
lar s
yste
ms)
Size
/Rati
ng-v
olta
geCo
st ($
/batt
ery)
Num
ber/
mon
thPu
rpos
e
33 North-REP Socio Economic Baseline report | Republic of the Marshall Islands
9.
Sola
r PV
/ w
ind
elec
tric
sys
tem
Do n
ot in
clud
e le
ad-a
cid
batte
ry sy
stem
s tha
t are
cha
rged
by
othe
r mea
ns th
an so
lar P
V.
c. Do
you
hav
e a
sola
r/ w
ind
elec
tric
syst
em?
[ ]Y
es [
]No
(If n
ot, t
hen
go to
secti
on 9
on
futu
re e
nerg
y us
e)
(i)
Wha
t is t
he si
ze o
f the
mod
ule/
turb
ine,
and
how
man
y (to
tal W
p)?…
(ii)
Wha
t is t
he si
ze o
f the
batt
ery?
……
……
..……
……
……
……
……
. (Ah
)
(iii)
Wha
t is t
he ra
ting
of th
e co
ntro
ller?
……
……
……
……
……
……
……
.. (A
)
(iv)
How
man
y lig
hts a
re c
onne
cted
to th
e sy
stem
?
…
……
……
……
. lig
hts r
ated
……
……
……
Watt
s
…
……
……
……
. lig
hts r
ated
……
……
……
Watt
s
(v)
Wha
t oth
er a
pplia
nces
are
con
nect
ed to
you
r sol
ar P
V/ w
ind
syst
em?

North-REP Socio Economic Baseline report | Republic of the Marshall Islands 34
Appl
ianc
es ru
n fr
om so
lar P
V sy
stem
Num
ber
Pow
er c
on-
sum
ption
ra
ting
(W)
Tim
e of
day
use
dTo
tal h
ours
/da
yDa
ily e
nerg
y co
nsum
ption
(W
h/Da
y)
Days
/Wee
k us
edFr
omTo
From
To
(vi)
Do y
ou o
wn
the
sola
r PV/
win
d sy
stem
? [
]Yes
[ ]N
o (If
no,
go
to v
ii)
i. W
hat i
s the
cos
t of t
he sy
stem
? $
……
……
……
……
……
.
ii.
Who
mai
ntai
ns th
e sy
stem
? …
……
……
……
……
……
……
……
.
Di
d yo
u ha
ve a
ny tr
oubl
e w
ith th
e sy
stem
at a
ny ti
me?
.....
......
.……
……
……
……
……
……
……
……
……
……
……
……
……
……
.
W
hat a
re y
our y
early
mai
nten
ance
cos
ts o
f the
sola
r PV/
win
d sy
stem
? $
……
…..
for …
.……
……
……
……
……
……
……
.
iii.
How
muc
h do
you
pay
per
mon
th?
$
…..…
……
……
……
……
……
…
iv.
Is th
e m
aint
enan
ce o
f you
r PV/
win
d sy
stem
satis
fact
ory?
……
……
……
…
v. Do
es y
our S
olar
PV/
win
d sy
stem
alw
ays p
rovi
de y
ou w
ith su
ffici
ent e
lect
ricity
?……
……
……
……
……
……
……
……
……
……
……
……
……
…
vi.
Wha
t oth
er a
pplia
nces
wou
ld y
ou c
onne
ct if
the
sola
r PV/
win
d sy
stem
cou
ld p
rovi
de it
?……
……
……
……
..……
……
……
……
…..
35 North-REP Socio Economic Baseline report | Republic of the Marshall Islands
10. F
utur
e en
ergy
use
1.
Do y
ou in
tend
to p
urch
ase
any
appl
ianc
es in
the
futu
re if
ele
ctric
ity is
ava
ilabl
e? [
]Yes
[ ]N
o (if
No,
ple
ase
go to
secti
on 1
0)
……
……
……
……
……
……
……
……
……
……
……
……
……
……
……
……
……
……
……
……
…...
......
......
......
......
......
......
......
......
......
......
......
......
......
.....
……
……
……
……
……
……
……
……
……
……
……
……
……
……
……
……
……
……
……
……
…...
......
......
......
......
......
......
......
......
......
......
......
......
......
....
Appl
ianc
eN
umbe
rHo
w lo
ng w
ill it
be
from
tim
e of
ge
tting
ele
ctric
ityEx
pect
ed c
ost (
$/Ap
plia
nce)
Sour
ce o
f fun
ds

North-REP Socio Economic Baseline report | Republic of the Marshall Islands 36
11. F
inal
rem
arks
Kind
ly th
ank
the
resp
onde
nt fo
r his/
her ti
me
and
atten
tion
to th
is en
ergy
surv
ey. A
sk th
e re
spon
dent
if th
ere
is an
ythi
ng e
lse h
e/sh
e w
ould
like
to a
dd o
r rem
ark
……
……
……
……
……
……
……
……
……
……
……
……
……
……
……
……
……
……
……
……
…...
......
......
......
......
......
......
......
......
......
......
......
......
......
......
......
......
......
......
......
......
......
......
......
....
……
……
……
……
……
……
……
……
……
……
……
……
……
……
……
……
……
……
……
……
…...
......
......
......
......
......
......
......
......
......
......
......
......
......
......
......
......
......
......
......
......
......
......
......
...

Mar
shal
l Isl
ands


Republ i c of the Marsha l l I s lands
North-REP Socio EconomicBaseline report
North-REP Republic of the Marshall IslandsSecretariat of the Paci�c Community
C/- Ministry of Resources and DevelopmentP.O Box 4090, Majuro, RMI 96960
Tel: +692 456 0706Email: [email protected]
Website: www.spc.int/northrepFacebook: www.facebook.com/northrep/
Secretariat of the Paci�c Community2nd Floor, Lotus Building, Nabua,Private Mail Bag, Suva, FijiTel: +679 337 0733 | Fax: +679 337 0146Email: [email protected]: http://www.spc.int/edd


