North Carolina Regional Leadership Academies
153
North Carolina Regional Leadership Academies Final 2013 Activity Report Author: Kathleen M. Brown University of North Carolina at Chapel Hill Contributors: Nicolle Stewart and Elizabeth D’Amico Carolina Institute Public Policy University of North Carolina at Chapel Hill March 2014 Consortium for Educational Research and Evaluation– North Carolina
Transcript of North Carolina Regional Leadership Academies

North Carolina
Regional Leadership Academies
Final 2013 Activity Report
Author:
Kathleen M. Brown
University of North Carolina at Chapel Hill
Contributors:
Nicolle Stewart and Elizabeth D’Amico
Carolina Institute Public Policy
University of North Carolina at Chapel Hill
March 2014
Consortium for Educational Research and Evaluation–North Carolina

North Carolina Leadership Academies: Final 2012 Report
March 2014
Consortium for Educational Research and Evaluation–North Carolina
Table of Contents
Executive Summary ........................................................................................................................ 3
Introduction ..................................................................................................................................... 6
Purpose of the Regional Leadership Academies Evaluation ...................................................... 6
Purpose of this Report and Methodological Approach ............................................................... 7
North Carolina’s Regional Leadership Academies ......................................................................... 8
Northeast Leadership Academy (NELA) .................................................................................... 8
Piedmont Triad Leadership Academy (PTLA) ........................................................................... 9
Sandhills Leadership Academy (SLA) ...................................................................................... 10
Evaluation Procedures .................................................................................................................. 12
Data ........................................................................................................................................... 12
Administrative Data ............................................................................................................... 12
Survey .................................................................................................................................... 12
Observations .......................................................................................................................... 12
Interviews .............................................................................................................................. 13
Method ...................................................................................................................................... 13
Findings......................................................................................................................................... 14
Research Question 1a: Do RLAs Effectively Recruit, Relative to the Alternatives? ............... 14
Research Question 2: What Impact Does each RLA’s Selection Criteria have on Program
Effectiveness?............................................................................................................................ 16
Selectivity .............................................................................................................................. 16
RLA Selection Processes ....................................................................................................... 17
Results of the Selection Process ............................................................................................ 18
Research Question 1b: Do RLAs Effectively Train, Relative to the Alternatives? .................. 21
Research Question 3: Do RLA Graduates Find Placements in Targeted Schools/Districts? ... 24
Research Question 4: Are RLAs Cost-Effective Relative to Alternative Programs? ............... 27
Conclusions and Next Steps.......................................................................................................... 28
References ..................................................................................................................................... 31
List of Appendices ........................................................................................................................ 34
Appendix A. NCDPI and Z. Smith Reynolds Request for Proposals: Principal Leadership
Academies ..................................................................................................................................... 35
Appendix B. Regional Leadership Academies Biannual Participant Survey ............................... 42
Appendix C. RLA Evaluators’ Observation Log .......................................................................... 47
North Carolina Leadership Academies: Final 2013 Report
March 2014
Consortium for Educational Research and Evaluation–North Carolina 2
Appendix D. Regional Leadership Academies Scope of Work and Logic Map of Initiative ....... 53
Appendix E. Cohort 1, Cohort 2, and Cohort 3 RLA Participants and Internship Placement
Schools .......................................................................................................................................... 59
Appendix F. Summary Statistics for Cohort 1’s, Cohort 2’s, and Cohort 3’s Internship Placement
Schools .......................................................................................................................................... 68
Appendix G. Raw Statistics for Cohort 1’s, Cohort 2’s, and Cohort 3’s Internship Placement
Schools .......................................................................................................................................... 77
Appendix H. Job Placements for RLA Cohort 1 and Cohort 2 ....................................................113
Appendix I. Summary Statistics for Cohort 1’s and Cohort 2’s Job Placement Schools.............119
Appendix J. Raw Statistics for Cohort 1’s and Cohort 2’s Job Placement Schools ................... 125

North Carolina Leadership Academies: Final 2013 Report
March 2014
Consortium for Educational Research and Evaluation–North Carolina 3
NORTH CAROLINA REGIONAL LEADERSHIP ACADEMIES:
FINAL 2013 ACTIVITY REPORT
Executive Summary
Developing school leaders who are equipped with the knowledge, skills, and dispositions needed
to effectively lead low-performing schools has become a critical goal for local education
agencies (LEAs)1 intent on dramatically improving student outcomes. North Carolina’s Race to
the Top (RttT) plan acknowledges the pressing need for high-quality leadership in low-achieving
schools; the component of the plan that focuses on ensuring equitable distribution of high-quality
teachers and leaders identifies, among other things, a need for “increasing the number of
principals qualified to lead transformational change in low-performing schools in both rural and
urban areas” (NCDPI, 2010, p.10). To accomplish this in North Carolina, the state has
established three Regional Leadership Academies (RLAs), each of which has laid out a clear set
of principles about leadership in general, leadership development in particular, and leadership
development for high-need schools most specifically.
North Carolina’s Regional Leadership Academies
The policy objective of the RLA initiative is to increase the number of principals qualified to
lead transformational change in low-performing schools in both rural and urban areas (i.e., to
prepare approximately 185 turnaround leaders). NC RttT funds support three RLA programs that
serve collaboratives of partnering LEAs:
Northeast Leadership Academy (NELA)—Established in 2010 (one year before RttT funding
was available) and serving 14 LEAs in northeast North Carolina;
Piedmont Triad Leadership Academy (PTLA)—serving four LEAs in north-central North
Carolina; and
Sandhills Leadership Academy (SLA)—serving 13 LEAs in south-central North Carolina.
Findings
All three RLAs utilize essential features of effective leadership preparation programs as
organizing principles in designing and delivering their individual principal preparation
programs. The content, pedagogy, and experiences reflect best practices for developing
leaders who can facilitate high-quality teaching and learning for all children.
Fidelity of implementation of program designs (i.e., the degree to which the interventions
have been delivered as intended) has been strong (e.g., each RLA has recruited and prepared
over 60 “turnaround principal” candidates).
1 LEA is North Carolina’s term for traditional school districts and charter schools.
North Carolina Leadership Academies: Final 2013 Report
March 2014
Consortium for Educational Research and Evaluation–North Carolina 4
Participants in every cohort in each RLA have found internship placements in targeted
schools and LEAs (i.e., low-performing schools, though not always schools on the list of the
5% of lowest-achieving schools in the State).
The year-long internship experience for the principal candidates has consistently provided
them with mentoring and coaching that the candidates believe will enhance their
effectiveness as principals.
Cohort 1 and Cohort 2 graduates have found employment in low-performing schools and
LEAs (19 as principals, 79 as assistant principals, 8 as central office leaders, and 9 as teacher
leaders/facilitators).2 On average (based on data from 2008-09 through 2011-12, prior to the
new 2012-13 assessment results), their employing schools host high numbers of lower-
income students (68.2% receive free or reduced-price lunch) and exhibit low achievement
rates (e.g., the Reading/English I pass rate is 62.6%; the Mathematics/Algebra I pass rate is
72.3%).
Recommendations
RLA directors should focus more time and attention on:
Working more assertively with LEAs to ensure that the leaders who matriculate from the
programs are placed in and then supported in their efforts to lead transformational change in
high-need schools; and
Critically reviewing the recruitment, training, and matching processes of mentors and
coaches for the principal candidates, as well as replacement plans for mentors and coaches
who are not effective.
Next Steps
The ongoing evaluation will probe deeper into three specific program areas:
1. Sustainability. How prepared is each RLA to sustain this project after the grant funding ends?
2. Mentor selection and training. What is each RLA doing to ensure good intern/mentor/school
site matches? What ongoing training do mentor principals receive?
3. Induction support. What is each RLA doing to provide ongoing support, mentoring, and
advice through job placement?
Targeted Findings for the Final Report
Data on the long-term and distal outcomes of the RLAs are not yet available. The Evaluation
Team will seek to assess the impact the RLAs have on principal preparation for high-need
schools over the course of the remainder of the RttT grant period (through 2014). To that end,
the final report will present some student testing results for schools with RLA-prepared
2 However, their employment often is as assistant principals or in other administrative roles that may lead to
principalships, and is not always in initially-targeted schools that participate in the state’s RttT-funded Turning
Around Lowest-Achieving Schools initiative.
North Carolina Leadership Academies: Final 2013 Report
March 2014
Consortium for Educational Research and Evaluation–North Carolina 5
principals and assistant principals (as well as other measures of principal effectiveness) to
estimate preliminary evidence of the RLAs on student achievement (e.g., via comparisons of and
contrasts between average three-year growth trajectories in these schools prior to and after RLA
hires).

North Carolina Leadership Academies: Final 2013 Report
March 2014
Consortium for Educational Research and Evaluation–North Carolina 6
Introduction
The importance of strong school leadership, particularly in low-achieving schools, has long been
recognized by researchers and practitioners alike. As Crawford (1998) notes, “Almost all
educational reform reports have come to the conclusion that the nation cannot attain excellence
in education without effective school leadership” (p. 8). Waters, Marzano, and McNulty (2003)
add, “Just as leaders can have a positive impact on achievement, they can also have a marginal,
or worse, a negative impact on achievement” (p. 5).
North Carolina’s Race to the Top (RttT) plan acknowledges the pressing need for high-quality
leadership in low-achieving schools. The component of the plan that focuses on ensuring an
equitable distribution of high-quality teachers and leaders identifies, among other things, a need
for “increasing the number of principals qualified to lead transformational change in low-
performing schools in both rural and urban areas” (NCDPI, 2010, p.10). To meet this need, the
state’s RttT proposal includes the development of Regional Leadership Academies (RLAs),
programs that are “approved for certifying principals [and] designed to . . . provide a new model
for the preparation, early career support, and continuous professional development of school
leaders” (NCDPI, 2010, p.10).
Purpose of the Regional Leadership Academies Evaluation
North Carolina’s RttT proposal also includes a commitment to an independent evaluation of each
initiative.3 The roles of the RttT Evaluation Team are to (1) document the activities of the RttT
initiatives; (2) provide timely, formative data, analyses, and recommendations to help the
initiative teams improve their ongoing work; and (3) provide summative evaluation results
toward the end of the grant period to determine whether the RttT initiatives met their goals and
to inform future policy and program decisions to sustain, modify, or discontinue initiatives after
the grant-funded period.
As part of this overall evaluation effort, the Evaluation Team is documenting RLA activities and
collecting data about participation in, satisfaction with, and the impact of RLA activities through
observations, surveys, focus groups, and interviews with RLA participants and facilitators;
additionally, the Evaluation Team is analyzing longitudinal education data on students, teachers,
leaders, and schools. The study provides detailed information about the implementation and
impact of the RLAs in order to determine if the initiative as implemented has had the intended
outcomes on school leader practice, their schools’ culture/climate of achievement, and,
potentially, teacher and student performance.
The evaluation of the NC RttT RLAs is guided by the following evaluation questions:
3 The evaluation is being conducted by the Consortium for Educational Research and Evaluation–North Carolina
(CERE–NC), a partnership of the SERVE Center at the University of North Carolina at Greensboro, the Carolina
Institute of Public Policy at the University of North Carolina at Chapel Hill, and the Friday Institute for Educational
Innovation at North Carolina State University.

North Carolina Leadership Academies: Final 2013 Report
March 2014
Consortium for Educational Research and Evaluation–North Carolina 7
Research Question 1: Do RLAs effectively (a) recruit and (b) train, relative to the
alternatives?
Research Question 2: What impact does each RLA’s selection criteria have on program
effectiveness?
Research Question 3: Do RLA graduates find placements in targeted schools/districts?
North Carolina’s RLAs are supported for four years by RttT funding, but there is no guarantee of
funding beyond the grant period. Thus, in addition to these questions, the evaluation of the RLAs
includes a fourth question:
Research Question 4: Are RLAs cost-effective relative to the alternatives?
Purpose of this Report and Methodological Approach
The purpose of this second activity report is to continue to address the first three evaluation
questions by describing the program components of each RLA in detail.4 The report begins with
an overview of each of the three RLAs (including information about partners, outcomes, and
timelines), followed by a description of the methodology and procedures the Evaluation Team
used to determine each RLA’s fidelity of implementation to the aspects outlined in the original
Request for Proposals (Appendix A).5 Based on reviews of the literature on leading
transformational change and principal training programs, the Team selected a mixed-methods
approach, with qualitative methods as the primary methods of analysis.
To determine the extent to which each RLA meets or exceeds expectations based on their initial
design proposal (i.e., the extent to which the enacted program matches the espoused theory), the
report then investigates each RLA’s fidelity to implementation elements. Finally, the report
outlines a plan for the final summative evaluation, which is expected to be completed in spring
2014.
4 The fourth evaluation question regarding cost-effectiveness of the initiative will be addressed in a separate report
that will include cost-effectiveness analyses for several RttT initiatives (anticipated completion date: early spring
2014). This report was preceded by two other RttT evaluation reports: Regional Leadership Academies Cost
Effectiveness Framework, which outlined the plan for addressing the fourth evaluation question
(http://cerenc.org/wp-content/uploads/2011/10/RLA_cost_effectiveness_framework_3-1-12.pdf), and NC RLA Final
2012 Activity Report (http://cerenc.org/wp-content/uploads/2011/10/RLA_First-Year-Report-03-04-13.pdf). 5 The RFP was designed jointly by the North Carolina Department of Public Instruction (NCDPI) and the Z. Smith
Reynolds Foundation. The RLAs are supported by RttT funds. It is important to note that the development of one of
the three RLAs—the Northeast Leadership Academy (NELA)—was not actually in response to this RFP. NELA
began operations as a pilot program one year prior to North Carolina’ receipt of RttT funds. As a result, there is an
ongoing question as to whether and to what extent the RFP language pertains to NELA.

North Carolina Leadership Academies: Final 2013 Report
March 2014
Consortium for Educational Research and Evaluation–North Carolina 8
North Carolina’s Regional Leadership Academies
The policy objective of the RLA initiative is to increase the number of principals qualified to
lead transformational change in low-performing schools in both rural and urban areas. NC RttT
funds support three RLA programs serving three regions of North Carolina. One RLA (Northeast
Leadership Academy, or NELA) was established one year before RttT funding was available,
and two others (Piedmont Triad Leadership Academy [PTLA] and Sandhills Leadership
Academy [SLA]) were created following a selection process that included proposal submission
to a selection committee composed of North Carolina educational leaders.
The NC RttT RLAs serve collaboratives of partnering local education agencies (LEAs)6 and
directly address the need to recruit, prepare, and support leaders of transformational change in
challenging school contexts. The RLAs provide talented individuals with the tools they need to
lead high-need school. Following a rigorous selection process, they provide full-time internships,
contextualized leader development opportunities, intensive coaching, and ongoing support. The
RLAs are designed to be consistent with literature on executive development, adult learning
theory, and educational leadership (e.g., Brown, 2006; Davis, Darling-Hammond, LaPointe, &
Meyerson, 2005; Hale & Moorman, 2003; New Leaders for New Schools, 2009).
The program meets North Carolina regulations regarding alternative principal licensure. A brief
description of each of the RLAs follows.
Northeast Leadership Academy (NELA)
The first RLA, NELA, began serving North Carolina’s northeast region during the fall of 2010.
NELA is based at North Carolina State University’s (NCSU) College of Education and serves
the following 14 partner LEAs: Bertie, Edgecombe, Franklin, Granville, Halifax, Hertford,
Martin, Nash-Rocky Mount, Northampton, Roanoke Rapids, Vance, Warren, Washington, and
Weldon City (total of 70,348 students served). It was established to serve a cluster of low-
achieving rural schools,
NELA is a two-year program that involves part-time study during Year 1 and full-time
study—including a full-time, year-long internship—during Year 2.
Successful NELA candidates are granted NC Principal Licensure and a Master of School
Administration (MSA), conferred by NCSU.
NELA selected and inducted 24 members into Cohort 1 in the summer of 2010; 21 members
of this group (87.5%) completed the program in May 2012 and are receiving continuing early
career support through 2014. Cohort 1 internships were supported by NC RttT funds.
o Most (81%) Cohort 1 members are now employed as educational leaders in the
surrounding LEAs (six of the 21 as principals, eight as assistant principals, three in
Central Office positions, two as teachers/facilitators, and two have left the NELA
Region).
6 LEA is North Carolina’s term for traditional school districts and charter schools.

North Carolina Leadership Academies: Final 2013 Report
March 2014
Consortium for Educational Research and Evaluation–North Carolina 9
Cohort 2 members were selected and inducted in the fall of 2011. These 21 participants
completed their internships and the program in May 2013 and have career support through
2014.
o Most (90%) Cohort 2 members are now employed as educational leaders in the
surrounding LEAs (18 of the 21 as assistant principals, one in a Central Office position,
and two as teachers/facilitators).
Cohort 3 members were selected and inducted in the fall of 2012 and these 20 participants
will complete the program in May 2014. They are completing their internships now.
NELA participants make a three-year agreement to work in northeastern NC schools.
NELA has been established by and embedded in Friday Institute for Educational Innovation,
a division of NCSU’s College of Education.
Piedmont Triad Leadership Academy (PTLA)
PTLA is based at the University of North Carolina at Greensboro (UNCG) and is a partnership
between the Piedmont Triad Education Consortium (PTEC) and the following four LEAs:
Alamance-Burlington, Asheboro City, Guilford, and Winston-Salem/Forsyth (total of 150,616
students served). It is a one-year program.
Successful PTLA graduates are granted NC Principal Licensure and can earn up to 24 credits
toward a UNCG Post Masters Certificate in School Administration or an MSA degree from
the Department of Educational Leadership and Cultural Foundations.
PTLA selected and inducted 21 members into Cohort 1 in the summer of 2011; 21 members
of this group (100%) completed the program in June 2012 and are receiving continued career
support through 2014.
o Most (86%) Cohort 1 members are now employed as educational leaders in the
surrounding LEAs (three of the 21 as principals, 14 as assistant principals, one in a
Central Office position, two as teachers/facilitators, and two have left the PTLA Region).
Cohort 2 members were selected and inducted in the summer of 2012. These 20 participants
completed their internships and the program in June 2013 and are receiving continued career
support through 2014.
o Most (75%) Cohort 2 members are now employed as educational leaders in the
surrounding LEAs (13 of the 20 as assistant principals, two in Central Office positions,
and five as teachers/facilitators).
Cohort 3 members were selected in the summer of 2013 and these 22 participants will
complete the program in June 2014. They are completing their internships now.
PTLA participants commit to three years of service in partnering LEAs upon program
completion.
PTLA has been established by UNCG faculty in partnership with LEAs and a regional
education consortium.

North Carolina Leadership Academies: Final 2013 Report
March 2014
Consortium for Educational Research and Evaluation–North Carolina 10
Sandhills Leadership Academy (SLA)
SLA was founded by the Sandhills Regional Education Consortium (SREC) and serves the
following 13 LEAs: Anson, Bladen, Columbus, Cumberland, Harnett, Hoke, Lee, Montgomery,
Moore, Richmond, Robeson, Scotland, and Whiteville City (total of 158,979 students served). It
is a one-year program.
Fayetteville State University (FSU), the University of North Carolina at Pembroke (UNCP),
and the North Carolina Center for the Advancement of Teaching (NCCAT) are partners in
SLA.
Successful SLA graduates are granted NC Principal Licensure and can earn up to 18
graduate-level credits at UNCP or FSU.
SLA selected 21 members and inducted 20 members into Cohort 1 in the summer of 2011; 20
members of this group (95%) completed the program in June 2012 and are receiving
continued career support through 2013.
o Most (90%) Cohort 1 members are now employed as educational leaders in the
surrounding LEAs (eight of the 20 as principals, nine as assistant principals, one in a
Central Office position, and two have left the SLA Region).
Cohort 2 members were selected and inducted in the summer of 2012. These 21 participants
completed their internships and the program in June 2013 and are receiving continued career
support through 2014.
o Most (90%) Cohort 1 members are now employed as educational leaders in the
surrounding LEAs (two of the 21 as principals, 17 as assistant principals, and two as
teachers/facilitators).
Cohort 3 members were selected in the summer of 2013 and these 20 participants will
complete the program in June 2014. They will receive continued support through 2015. They
are completing their internships now.
SLA participants commit to serving in the Sandhills region for a minimum of four years
following program completion.
SLA has been established by the SREC LEAs in partnership with two universities and
NCCAT.
The RLAs were created independently to meet the school leadership needs of three vastly
different and very distinct regions of North Carolina (including “large, urban” and “small,
rural”); thus, each RLA is a unique program with its own partnerships, program philosophy,
curriculum, coursework, and fieldwork. Figure 1 (following page) shows the LEAs that are
partnering with each RLA. Each RLA has followed its own path to implementation, and
evaluators have been engaged in collecting and analyzing data related to that process since April
2011.

North Carolina Leadership Academies: Final 2013 Report
March 2014
Consortium for Educational Research and Evaluation–North Carolina 11
Figure 1. Regions Served by the North Carolina Regional Leadership Academies

North Carolina Leadership Academies: Final 2013 Report
March 2014
Consortium for Educational Research and Evaluation–North Carolina 12
Evaluation Procedures
Data
The evaluation is informed by a variety of data sources, including document reviews,
observations, interviews, focus groups, surveys, accounting data, and administrative data. Data
sources used for this report are detailed here.
Administrative Data
In an effort to describe the characteristics of RLA internships and job placements, the Evaluation
Team obtained school-level administrative data from a longitudinal database maintained by the
Carolina Institute for Public Policy (CIPP) and assembled from NCDPI administrative records.
These data include school characteristics—school level (elementary, middle, or high), type
(traditional or charter), region, and locale classification (i.e., urbanicity)—as well as
demographic characteristics of the student population (free or reduced-price lunch,
race/ethnicity, students with disabilities, and English language learners).
Survey
The Team designed a biannual participant survey (Appendix B) describing actions and traits that
are specific, evidence-based recommendations for quickly and dramatically improving student
achievement in high-need, low-performing schools. The purpose of this survey, administered
each December and June, is to track RLA participants’ level of exposure to and experience with
these key elements via their Leadership Academy.7 Note that the survey is bound by (and
participants are protected by) Institutional Review Board protocols regarding research on human
subjects. As such, not all RLA participants participated in the survey, but most did; the response
rate has been close to 90%.
Observations
Evaluators observed each RLA’s selection processes and candidate cohort experiences, including
internships and support efforts. These activities helped evaluators understand the support and
guidance provided to each RLA participant. Evaluators conducted a total of 86 formal RLA
observations (for over 230 hours) and attended and/or presented at 26 formal RLA meetings
between March 2011 and October 2013. The goal of the evaluation is to visit each RLA at least
once a month and to observe a variety of activities (e.g., site visits, guest panels, specialized
trainings, weekly content seminars, Advisory Board meetings, mentor principal meetings, LEA
selection processes, induction support sessions, conference presentations, etc.). Please see
Appendix C for the Evaluators’ Observation Log.
7 See RttT evaluation report, Turning Around North Carolina’s Lowest Achieving Schools (2006-2010),
https://publicpolicy.unc.edu/research/TurnaroundSchoolReport_Dec5_Final.pdf.

North Carolina Leadership Academies: Final 2013 Report
March 2014
Consortium for Educational Research and Evaluation–North Carolina 13
Interviews
Between March 2011 and October 2013, evaluators interacted with and interviewed the RLA
Directors, Executive Coaches, and the majority of participants from each RLA (n=200+) several
times. Evaluators also interviewed a random, convenience-sampled selection of mentor
principals and participant supervisors from each RLA during this same timeframe. Formal and
informal conversations occurred during every formal observation and meeting (n=110+).
Likewise, information was gathered daily via phone calls, emails, and listserv updates. A
standardized format was not used for these discussions. Instead, open-ended questions were the
norm. Most conversations were related to either how the RLA was progressing overall and/or
specifically how the exercise at hand related to the participants’ preparation to be leaders in high-
need schools. Detailed notes were recorded and analyzed after each exchange. These activities
helped evaluators gather a wide range of perspectives on the RLAs for qualitative analyses.
Method
Creswell’s (2009) mixed-methods approach is most appropriate for this evaluation, given the
multiple data collection methods and mixed modes of analysis. Evaluators analyzed each RLA’s
recruitment and selection efforts, curricular and pedagogical techniques, induction and support
strategies, and RLA internal evaluation methods. Artifacts (planning documents, presentations,
dissemination materials, curriculum plans, scopes and sequences, websites, news articles, etc.)
and observational data were analyzed using relevant qualitative methodologies and computer
software when appropriate. These activities helped evaluators understand how candidates are
recruited, selected, inducted, and trained. Please see Appendix D for the Scope of Work and
Logic Map of this initiative.

North Carolina Leadership Academies: Final 2013 Report
March 2014
Consortium for Educational Research and Evaluation–North Carolina 14
Findings
This section includes findings for each of the specific evaluation questions outlined earlier (i.e.,
RQs 1, 2 and 3). Note that Research Question 1: Do RLAs effectively recruit and train, relative to
the alternatives? has been separated into Research Question 1a: Do RLAs effectively recruit,
relative to the alternatives? and Research Question 1b: Do RLAs effectively train, relative to the
alternatives? In this way, the constructs of recruiting and training can be examined separately.
Also, RQ 2 and RQ 1b are answered out of order to preserve a review of the RLAs that follows
internal initiative continuity: recruitment (RQ 1a), followed by selection (RQ 2), followed by
training (RQ 1b).
Research Question 1a: Do RLAs Effectively Recruit, Relative to the Alternatives?
Knapp and his colleagues concluded that conventional leadership preparation programs have not
attracted enough high-quality candidates to work in high-poverty, low-performing schools,
which are traditionally the schools that are the hardest to staff (Knapp, Copeland & Talbert,
2003). At the same time, Darling-Hammond and her colleagues asserted that recruiting
committed candidates and comprehensively preparing them for the unique realities of leading in
challenging contexts are keys to stabilizing principal turnover in addition to fostering high-
quality teaching and learning (Darling-Hammond, Meyerson, Lapointe & Orr, 2010).
As such, the RLAs have each engaged in careful recruitment and selection processes to ensure
that program participants have the expertise, commitment, and dispositions to serve as
transformational school leaders. Each RLA has worked together with its partner LEA leaders to
identify and recruit individuals who, in their assessment, are deeply committed to improving
low-achieving schools and who are willing to make multiyear, post-academy commitments to
work in said schools and LEAs.
In line with widely recognized alternative principal preparation programs (e.g., New Leaders for
New Schools [NLNS] and New York City Leadership Academy [NYCLA]), each RLA employs
a plan for the deliberate, aggressive recruitment of outstanding school leadership candidates. A
team of LEA members, in conjunction with the RttT grant-funded Executive Directors and
Coaches, developed and conducted broad-based recruitment and selective admissions processes
that have resulted in the identification and selection of RLA participants who present
demonstrable leadership skills and personal academic excellence.8
Table 1 (following page) provides a comparative overview of criteria used by each RLA, by
alternative preparation programs, and by traditional MSA programs in North Carolina to recruit
candidates into their individual pre-service leadership program. As noted, the RLAs do
effectively recruit, relative to the alternatives.
8 For a full description of each RLA’s program-specific method of recruitment, please see North Carolina Regional
Leadership Academies: Final 2012 Activity Report, pp. 12-16 (http://cerenc.org/wp-
content/uploads/2011/10/RLA_First-Year-Report-03-04-13.pdf).

North Carolina Leadership Academies: Final 2013 Report
March 2014
Consortium for Educational Research and Evaluation–North Carolina 15
Table 1. RLA Recruitment Criteria in Comparison to Other Leadership Preparation Programs
Recruitment Criteria NELA PTLA SLA
Other
Alternative
Preparation
Programs (e.g.,
NYCLA, NLNS)
NC
Tradi-
tional
MSA*
1. Established reputation (i.e.,
known entity, word of mouth,
graduates, etc.)
Yes Yes Yes Yes Yes
2. Brochures and informational
materials Yes Yes Yes Yes ^
3. “Tapping” process in LEAs in
which people are encouraged to
apply
Yes Yes Yes Yes ^
4. Website information Yes Yes Yes Yes Yes
5. Email blasts and LEA updates Yes Yes Yes Yes ^
6. Local, state and national
presentations Yes Yes Yes Yes ^
7. Newspaper accounts, media
coverage and various public
relations press releases throughout
the year (including promotional
videos)
Yes Yes Yes Yes ^
8. Collaboration with partnering
LEAs Yes Yes Yes Yes ^
9. LEA based information sessions Yes Yes Yes Yes ^
10. Superintendent endorsement Yes Yes Yes ^ No
11. Superintendent meeting updates Yes Yes Yes ^ No
12. School Board presentations Yes Yes Yes ^ No
13. Partnerships with organizations
(e.g., NC Education Consortiums,
Teach For America, Historically
Black Colleges/Universities, etc.)
Yes Yes Yes Yes ^
14. Commitment (initially and
ongoing) to changing, improving,
and transforming schools
Yes Yes Yes Yes ^
15. Willingness to make multi-year,
post-academy commitment Yes Yes Yes ^
^ (PFs
+ do)
Notes:
*MSA=Master’s in School Administration
^=The extent to which certain programs do and/or do not implement these recruitment criteria varies widely
from none (i.e., not at all) to some. +PF=North Carolina Principal Fellows agree to a 4-year leadership commitment post-graduation.
The RLA process of intentionally identifying and recruiting outstanding candidates (i.e.,
experienced teachers with strong teaching and leadership skills who are committed to
educational change) benefitted from strategic exposure tactics and publicity campaigns in
partnering LEAs. As a result of these efforts, a large number of people expressed interest and
North Carolina Leadership Academies: Final 2013 Report
March 2014
Consortium for Educational Research and Evaluation–North Carolina 16
completed the application process over the past three years (189 participants selected from a total
of 962 applications yields an overall acceptance rate of less than 20%).
Overall, the recruitment efforts for each RLA are to be commended. Advertisement has been
good and the RLAs have yielded a fairly high number of applicants (whether of sufficient high
quality and quantity to fill necessary slots in the schools is yet to be determined). Responses on
the biannual survey indicate that the majority of Cohort 1, Cohort 2, and Cohort 3 members left a
position in education (most as classroom teachers) to become RLA participants.
Research Question 2: What Impact Does each RLA’s Selection Criteria have on Program
Effectiveness?9
Impact is difficult to assess at this stage of the initiative, and a more complete response to this
research question may not be possible until more extensive measures of program effectiveness
are available (e.g., after a critical mass of cohort members have completely transitioned from
their programs and into leadership positions in their schools). What can be assessed at this point,
however, are the degree to which the programs have been selective, and the mechanisms through
which that selectivity occurs.
Selectivity
The recruitment and selection process of each RLA yielded fairly selective and competitive
acceptance rates (Table 2, following page). The RLA’s overall acceptance rate of 31% is
comparable to nationally recognized programs such as NYCLA and NLNS. They are also much
lower than traditional MSA programs in North Carolina, some of which have few applicants
(less than 25 applicants for 20 slots) and/or report high acceptance rates (75% or higher). The
Principal Fellows Program in North Carolina (NC PFP) had an acceptance rate of 56% in 2011
(60 recipients from 107 applicants), an acceptance rate of 72% in 2012 (56 recipients from 78
applicants), and an acceptance rate of 60% in 2013 (33 recipients from 55 applicants). The
average acceptance rate for the NC PFP over the past three years has been 63%. In fairness to all
of these programs, a larger number of potential participants do inquire, but after asking about
minimum requirements (e.g., tuition costs, prior teaching experience, undergraduate GPA, etc.),
decide not to formally apply. Unfortunately, there is not a valid way of tracking such numbers.
9 Research Questions 2 and 1b are answered out of order to preserve a review of the RLAs that follows internal
initiative continuity: recruitment (RQ 1a), followed by selection (RQ 2), followed by training (RQ 1b).

North Carolina Leadership Academies: Final 2013 Report
March 2014
Consortium for Educational Research and Evaluation–North Carolina 17
Table 2. Number of Participants who were Accepted Versus Number of Candidates who Applied
RLA
2011–12 Cohort 1
Acceptance Rate
2012–13 Cohort 2
Acceptance Rate
2013–14 Cohort 3
Acceptance Rate
NELA 24/38 = 63%* 21/41 = 51% 20/28 = 71%**
PTLA 21/173 = 12% 20/169 = 12% 22/197 = 11%
SLA 20/110 = 18% 21/79 = 27% 20/127 = 16%
* For NELA’s Cohort 1, 38 individuals were recommended by their superintendents. Twenty-four were admitted
and twenty-one graduated. NELA dismissed three of the participants from the program. From a quality assurance
perspective, they were not performing at an acceptable level. NELA’s Cohort 2 went through the multi-tier selection
process. Even at that, NELA has a significantly higher acceptance rate than PTLA and SLA. With such a smaller
initial candidate pool, two questions surface: 1) Is NELA able to identify enough high-quality applicants/
candidates?; and 2) What can/is being done to increase the number of candidates who apply to NELA?
** For NELA’s Cohort 3 (2013-14), the superintendents from the 14 partnering counties were asked to send only
their very best and brightest. NELA worked closely with the superintendents to identify the characteristics of
candidates that would be a good fit. As a result, they feel as though they started with a better/deeper pool. Twenty
participants from a pool of twenty-eight were selected.
RLA Selection Processes
Each RLA created “an innovative selection process that is fair and rigorous, assesses more than a
candidate’s experience and education, and adds a new component that enables interviewers to
measure a candidate’s core beliefs” (Huckaby, 2012, p. 31). For a full description of each RLA’s
program-specific selection process, please see North Carolina Regional Leadership Academies:
Final 2012 Activity Report (pp. 16-21).
Of the three RLAs, NELA’s is the most university-centered. This is appropriate as participants
are applying for and will receive an MSA degree from NCSU. The selection processes for PTLA
and SLA are more decentralized (i.e., more decisions are made at the LEA level). Each RLA has
made modifications based on experiences with Cohorts 1 and 2. Of the three RLAs’ selection
criteria, one is not necessarily better than the other. All three contain some similarities and some
differences, all three use multiple measures, and all three allow for deeper analyses into an
applicant’s qualifications. However, in comparison to the selection processes of most university-
based principal preparation programs nationwide, the RLAs collectively are much more
deliberate and intentionally focused, more intricately involved, and more thorough in their
selection criteria. For example, most colleges and universities (not all, as there are exceptions
across the nation) only require standard paperwork (e.g., resume, transcripts, letters of
recommendation, GRE/MAT scores, background check and perhaps a statement of purpose). In
person, face-to-face interactions and/or interviews are rare and are not required for application
and/or admission. MSA faculty members usually review the materials via a standard rubric, and
assign points based on minimum qualifications such as years of classroom teaching experience
(without regard to and/or knowledge of whether that educational experience was deemed good or
bad, effective or detrimental).
Table 3 (following page) provides a comparative overview of criteria used by each RLA, by
alternative preparation programs, and by traditional MSA programs in North Carolina to select
candidates into their individual pre-service leadership program. As noted, the RLA selection
criteria are more robust and rigorous relative to the alternatives.

North Carolina Leadership Academies: Final 2013 Report
March 2014
Consortium for Educational Research and Evaluation–North Carolina 18
Table 3. RLA Selection Criteria in Comparison to Other Leadership Preparation Programs
Selection Criteria NELA PTLA SLA
Other
Alternative
Preparation
Programs (e.g.,
NYCLA, NLNS)
NC
Tradi-
tional
MSA*
1. Application form (including transcripts,
scores, and criminal background check) Yes Yes Yes Yes Yes
2. Resume of professional experience (some
minimal requirements) Yes Yes Yes Yes Yes
3. Letters of recommendation Yes Yes Yes Yes ^
4. Purpose statements/Letters of interest Yes Yes Yes Yes ^
5. Writing sample/educational essay Yes Yes Yes Yes ^
6. Master’s degree with minimum 3.0 GPA No No No Yes No
7. Superintendent’s nomination Yes Yes Yes ^ No
8. A homework assignment (e.g., 2- to 3-
minute videotaped presentation on “Why I
want to be a leader in a high needs school”)
No Yes Yes ^ No
9. Completion of self-assessment surveys
(e.g., grit/perseverance/passion and
leadership responsibilities)
Yes No No ^ No
10. Assessment Day (including role play,
timed writing activity, scenario-based
simulations, team decision making process,
presentations, and response to scenarios)
Yes Yes Yes ^ No
11. Group Q&A sessions and interviews
with panel of LEA partners Yes Yes Yes ^ No
12. One-on-one Interviews Yes Yes Yes ^ No
13. Commitment to closing the achievement
gap, professional resilience, strong
communication, willingness/ability to be
self-reflective, possession of instructional
knowledge/expertise, commitment to
continuous learning, professional integrity
Yes Yes Yes ^ ^
14. Commitment to multi-year, post-
academy employment/leadership position Yes Yes Yes Yes No
Note: ^=the extent to which certain programs do and/or do not implement these selection criteria varies widely from
none (i.e., not at all) to some.
Results of the Selection Process
Overall, the RLA selection process for Cohort 1 (n=65) yielded a fairly diverse group of
participants. Two-thirds (68%) are female, half (50%) are Caucasian, and two-fifths (42%) are
African-American. Half (54%) possess a master’s degree already (seven in education, five in
reading, four in school administration, four in special education, and the rest in a range of
subjects from Curriculum and Instruction to counseling). One-third (32%) were elementary
education majors during their undergraduate studies, while one-sixth (15%) were English majors.
Generally speaking, NELA participants are slightly younger (33 years old compared to the RLA

North Carolina Leadership Academies: Final 2013 Report
March 2014
Consortium for Educational Research and Evaluation–North Carolina 19
Cohort 1 average of 37 years old), more likely to be female (76% compared to the RLA Cohort 1
average of 68%), and less likely to have master’s degrees (33% compared to the RLA Cohort 1
average of 58%). This is not surprising since NELA is a two-year principal preparation program
leading to an MSA degree. Relative to the cohort average, a larger proportion of the SLA
participants are Caucasian (66% compared to the RLA Cohort 1 average of 50%), and more have
advanced degrees (75% compared to the RLA Cohort 1 average of 58%). Table 4 includes
descriptive statistics for Cohort 1.
Table 4. Demographic Data for RLA Cohort 1
Demographic
Characteristic
All Cohort 1
Interns NELA PTLA SLA
Age Range 25-54 25–48 29-47 28–54
Age Median 35 33 36 36
Male 30% 24% 29% 38%
Female 70% 76% 71% 63%
Black 45% 52% 57% 27%
White 46% 33% 38% 66%
Asian 3% 10% 0% 0%
American Indian 2% 0% 0% 7%
Other Ethnicity 4% 5% 5% 0%
Master’s Degree 60%
(37/62)
33%
(7/21)
71%
(15/21)
75%
(15/20)
Overall, the RLA selection process for Cohort 2 (n=62) again yielded a fairly diverse group of
participants: two-thirds are Caucasian (66%), over two-thirds are female (69%), and a third
(42%) are African-American. Two-fifths (42%) possess a master’s degree already (in a range of
subjects from education to reading, administration, special education, and even counseling).
One-third (36%) were elementary education majors during their undergraduate studies.
As was the case in Cohort 1, NELA participants are slightly younger (36 years old compared to
the RLA Cohort 2 average of 38 years old) and less likely to have master’s degrees (14%
compared to the RLA Cohort 2 average of 42%). Once again, relative to the cohort average, a
larger proportion of the SLA participants are Caucasian (81% compared to the RLA Cohort 2
average of 69%), but unlike Cohort 1, a larger proportion of SLA participants also are female
(81% compared to the RLA Cohort 2 average of 69%). A larger proportion of the PTLA
participants are African-American (45% compared to the RLA average of 32%) and have
advanced degrees (75% compared to the RLA Cohort 2 average of 42%). Table 5 (following
page) includes descriptive statistics for Cohort 2.

North Carolina Leadership Academies: Final 2013 Report
March 2014
Consortium for Educational Research and Evaluation–North Carolina 20
Table 5. Demographic Data for RLA Cohort 2
Demographic
Characteristic
All Cohort 2
Interns NELA PTLA SLA
Age Range 25-59 26-53 25-59 27-51
Age Median 38 36 39 39
Male 31% 38% 35% 19%
Female 69% 62% 65% 81%
Black 32% 33% 45% 19%
White 66% 67% 55% 77%
Asian 0% 0% 0% 0%
American Indian 2% 0% 0% 4%
Other Ethnicity 0% 0% 0% 0%
Master’s Degree 42%
(26/62)
14%
(3/21)
75%
(15/20)
38%
(8/21)
The RLA selection process for Cohort 3 (n=62) once more yielded a fairly diverse group of
participants. Three-fourths (75%) are female, two-fifths (61%) are Caucasian, one third (35%)
are African-American, and half (50%) possess a master’s degree already. Once again, NELA
participants are slightly younger (35 years old compared to the RLA Cohort 3 average of 36
years old), more likely to be female (85% compared to the RLA Cohort 3 average of 75%), and
less likely to have master’s degrees (35% compared to the RLA Cohort 3 average of 50%). More
of the SLA participants are slightly older (37 years old compared to the RLA Cohort 3 average
of 36 years old) and Caucasian (70% compared to the RLA Cohort 3 average of 61%). More of
the PTLA participants are male (36% compared to the RLA Cohort 3 average of 25%) and have
advanced degrees (59% compared to the RLA Cohort 3 average of 50%). Table 6 includes
descriptive statistics for Cohort 3, and Table 7 (following page) includes descriptive statistics for
all three Cohorts combined. In comparison to other traditional MSA programs in North Carolina,
the RLA participants tend to be slightly older, slightly more racially diverse, and much more
likely to already have a master’s degree. In some regards, this makes sense, since traditional
MSA programs in North Carolina are Master’s degree-granting programs.
Table 6. Demographic Data for RLA Cohort 3
Demographic
Characteristic
All Cohort 3
Interns NELA PTLA SLA
Age Range 26-49 26-48 26-49 27-48
Age Median 36 35 36 37
Male 25% 15% 36% 25%
Female 75% 85% 64% 75%
Black 35% 40% 41% 25%
White 61% 60% 54% 70%
Asian 0% 0% 0% 0%
American Indian 0% 0% 0% 0%
Other Ethnicity 4% 0% 5% 5%
Master’s Degree 50%
(31/62)
35%
(7/20)
59%
(13/22)
55%
(11/20)

North Carolina Leadership Academies: Final 2013 Report
March 2014
Consortium for Educational Research and Evaluation–North Carolina 21
Table 7. Demographic Data for RLA Cohorts 1, 2, and 3
Demographic
Characteristic
All Cohort
Interns
NELA
(Cohorts
1, 2, and 3)
PTLA
(Cohorts
1, 2, and 3)
SLA
(Cohorts
1, 2, and 3)
Age Range 25-59 25-53 25-59 27-54
Age Median 36 35 37 37
Male 29% 26% 33% 27%
Female 71% 74% 67% 73%
Black 38% 42% 48% 24%
White 58% 53% 49% 71%
Asian 1% 3% 0% 0%
American Indian 1% 0% 0% 3%
Other Ethnicity 2% 2% 3% 2%
Master’s Degree 50%
(94/186)
27%
(17/62)
68%
(43/63)
56%
(34/61)
Research Question 1b: Do RLAs Effectively Train, Relative to the Alternatives?10
The three essential features of effective leadership preparation programs are: (1) having a
program philosophy that clearly articulates a theory of action, (2) having a strong curriculum
focused on instruction and school improvement, and (3) having well-designed and integrated
coursework and field work (Orr, O’Doherty, & Barber, 2012). Each RLA has committed to
designing and implementing a fully comprehensive leadership preparation program that
incorporates these features by including the following research-based program elements
(Darling-Hammond, LaPointe, Meyerson, Orr, & Cohen, 2007; Davis, Darling-Hammond,
LaPointe, & Meyerson, 2005; Taylor, Cordeiro, & Chrispeels, 2009; Young, Crow, Ogawa, &
Murphy, 2009):
Rigorous recruitment and selection
Cohorts and internships
o Cohort-based experiences
o Weekly, full-cohort, continued learning during the residency year
o Full-time, year-long clinical residency experiences
Curricula and seminars
o An action-research, case-study curriculum focus
10
Note: Research Questions 2 and 1b are answered out of order to preserve a review of the RLAs that follows
internal initiative continuity: recruitment (RQ 1a), followed by selection (RQ 2), followed by training (RQ 1b).

North Carolina Leadership Academies: Final 2013 Report
March 2014
Consortium for Educational Research and Evaluation–North Carolina 22
Support systems (coaching, mentoring, and supervising)
o Multi-faceted support structures
o Dynamic feedback and improvement loops
Structures for evaluation and improvement
Job placement and induction support
The degree to which each RLA addresses the first of these elements (recruitment and selection)
has been addressed in previous sections, and the degree to which each RLA addresses the final
element (job placement and induction) will be addressed in a later section.11
Darling-Hammond, Meyerson, Lapointe and Orr (2010) note that, historically, principal
preparation programs have been heavily weighted toward technical considerations:
organizational management, administrative requirements, logistical and legal matters. At the
same time, much less attention has been given to questions of teaching and learning. Likewise,
few programmatic resources have been dedicated to explicit considerations regarding issues of
power and privilege, and how they lead to disparate educational opportunities and access (Oakes,
Lipton, Anderson & Stillman, 2012). Yet, according to Marshall and Oliva (2010),
deconstructing the ways that economic, racial, and political conditions shape schools’ potential
to interrupt patterns of inequality is central to cultivating schools that advance principles of
social justice.
The RLAs are actually doing this. They are intentionally and singularly focused on training a
new kind of leader for high-needs schools (i.e., candidates knowingly and willingly committed to
equity, candidates with a sense of urgency and personal accountability for student learning,
candidates with the will and the skill to turnaround failing schools). Schools entering turnaround
(i.e., demonstrated low student achievement for multiple years) face significantly more
challenges than typical schools in the state. McFarland and Preston (2010) report that in North
Carolina,
on average, turnaround schools had significantly lower performance composites and
graduation rates, and slightly lower percentages of teachers with full licensure than typical
high schools. Suspension rates, the percentage of students eligible for free or reduced-price
lunch, and the percentages of non-white students were all significantly higher in turnaround
schools (p.2).
Unique circumstances like these warrant specialized contextual knowledge and unique
dispositions on the part of the leader to turn the tide from negative trajectories to positive ones.
All three RLAs are deliberately working to equip their candidates with instructional leadership
skills, with resiliency skills, and with transformational change skills. Throughout each RLA, the
emphasis on high-need schools and the strategies needed to turnaround low performance is
prominent and palpable.
11
Fidelity of implementation of each of the other elements is addressed in the North Carolina Regional Leadership
Academies: Final 2012 Activity Report, pp. 21-55.
North Carolina Leadership Academies: Final 2013 Report
March 2014
Consortium for Educational Research and Evaluation–North Carolina 23
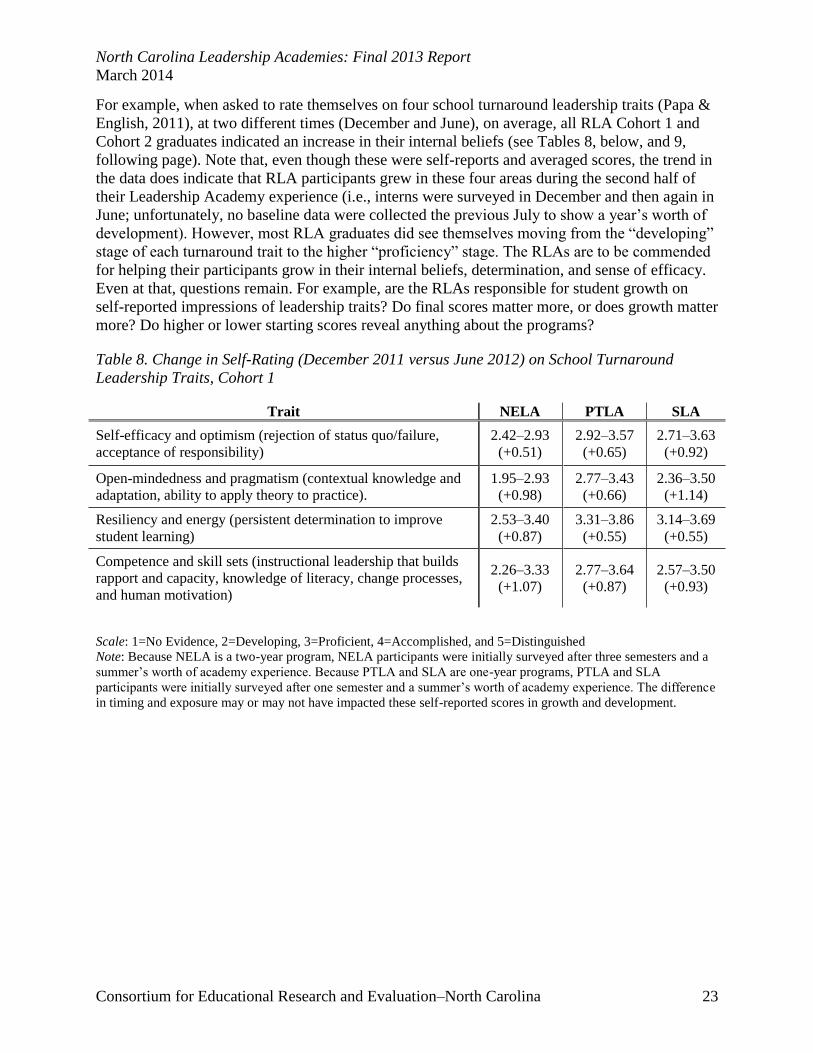
For example, when asked to rate themselves on four school turnaround leadership traits (Papa &
English, 2011), at two different times (December and June), on average, all RLA Cohort 1 and
Cohort 2 graduates indicated an increase in their internal beliefs (see Tables 8, below, and 9,
following page). Note that, even though these were self-reports and averaged scores, the trend in
the data does indicate that RLA participants grew in these four areas during the second half of
their Leadership Academy experience (i.e., interns were surveyed in December and then again in
June; unfortunately, no baseline data were collected the previous July to show a year’s worth of
development). However, most RLA graduates did see themselves moving from the “developing”
stage of each turnaround trait to the higher “proficiency” stage. The RLAs are to be commended
for helping their participants grow in their internal beliefs, determination, and sense of efficacy.
Even at that, questions remain. For example, are the RLAs responsible for student growth on
self-reported impressions of leadership traits? Do final scores matter more, or does growth matter
more? Do higher or lower starting scores reveal anything about the programs?
Table 8. Change in Self-Rating (December 2011 versus June 2012) on School Turnaround
Leadership Traits, Cohort 1
Trait NELA PTLA SLA
Self-efficacy and optimism (rejection of status quo/failure,
acceptance of responsibility)
2.42–2.93
(+0.51)
2.92–3.57
(+0.65)
2.71–3.63
(+0.92)
Open-mindedness and pragmatism (contextual knowledge and
adaptation, ability to apply theory to practice).
1.95–2.93
(+0.98)
2.77–3.43
(+0.66)
2.36–3.50
(+1.14)
Resiliency and energy (persistent determination to improve
student learning)
2.53–3.40
(+0.87)
3.31–3.86
(+0.55)
3.14–3.69
(+0.55)
Competence and skill sets (instructional leadership that builds
rapport and capacity, knowledge of literacy, change processes,
and human motivation)
2.26–3.33
(+1.07)
2.77–3.64
(+0.87)
2.57–3.50
(+0.93)
Scale: 1=No Evidence, 2=Developing, 3=Proficient, 4=Accomplished, and 5=Distinguished
Note: Because NELA is a two-year program, NELA participants were initially surveyed after three semesters and a
summer’s worth of academy experience. Because PTLA and SLA are one-year programs, PTLA and SLA
participants were initially surveyed after one semester and a summer’s worth of academy experience. The difference
in timing and exposure may or may not have impacted these self-reported scores in growth and development.

North Carolina Leadership Academies: Final 2013 Report
March 2014
Consortium for Educational Research and Evaluation–North Carolina 24
Table 9. Change in Self-Rating (December 2012 versus June 2013) on School Turnaround
Leadership Traits, Cohort 2
Trait NELA PTLA SLA
Self-efficacy and optimism (rejection of status quo/failure,
acceptance of responsibility)
2.63-3.45
(+0.82)
2.72-3.25
(+0.53)
3.20-3.81
(+0.61)
Open-mindedness and pragmatism (contextual knowledge and
adaptation, ability to apply theory to practice).
2.89-3.20
(+0.31)
2.56-3.10
(+0.54)
2.80-3.52
(+0.72)
Resiliency and energy (persistent determination to improve
student learning)
2.95-3.80
(+0.85)
2.89-3.40
(+0.51)
3.33-3.81
(+0.48)
Competence and skill sets (instructional leadership that builds
rapport and capacity, knowledge of literacy, change processes,
and human motivation)
2.42-3.20
(+0.78)
2.11-3.20
(+1.09)
2.80-3.62
(+0.82)
Scale: 1=No Evidence, 2=Developing, 3=Proficient, 4=Accomplished, and 5=Distinguished
Note: Because NELA is a two-year program, NELA participants were initially surveyed after three semesters and a
summer’s worth of academy experience. Because PTLA and SLA are one-year programs, PTLA and SLA
participants were initially surveyed after one semester and a summer’s worth of academy experience. The difference
in timing and exposure may or may not have impacted these self-reported scores in growth and development.
Research Question 3: Do RLA Graduates Find Placements in Targeted Schools/Districts?
The goal of the RLAs is to increase the number of principals qualified to lead transformational
change in low-performing schools in both rural and urban areas. As such, RLA interns receive
job placement support, provided by the Leadership Academy in conjunction with participating
LEAs, to ensure appropriate matches of aspiring leaders to the schools in which they are placed
(see Appendices E, F, and G for Cohort 1’s, 2’s, and 3’s Internship Placement Schools plus
Summary and Raw Statistics for these schools). Table 10 (following page) indicates that interns
from each of the three cohorts, and from each of the three RLAs, have been placed in high-needs
schools where, on average, two-thirds (66.2%) of the student populations are eligible for free or
reduced lunch, where overall average Reading/English I scores are less than 63%, and where
overall average Mathematics/Algebra I scores hover around the 72% mark.

North Carolina Leadership Academies: Final 2013 Report
March 2014
Consortium for Educational Research and Evaluation–North Carolina 25
Table 10. RLA Internship Placements: Free/Reduced Lunch, Size, English, and Mathematics
Scores
Placement Site
Characteristic RLA
Internship Year Average
for Cohorts
1, 2, & 3
Cohort 1
(2011-2012)
Cohort 2
(2012-2013)
Cohort 3
(2013-2014)
% Students
Free/Reduced Lunch
NELA
PTLA
SLA
68.7%
75.8%
68.5%
60.2%
66.6%
63.3%
62.5%
72.4%
57.8%
63.8%
71.6%
63.2%
Overall 71.0% 63.4% 64.2% 66.2%
School Size
NELA
PTLA
SLA
550
579
615
668
739
711
520
679
662
579
666
663
Overall 581 706 620 636
Reading/English I
Scores
NELA
PTLA
SLA
59.7%
55.6%
64.6%
64.8%
60.9%
66.8%
66.7%
58.1%
69.3%
63.7%
58.2%
66.9%
Overall 59.9% 64.2% 64.7% 62.9%
Mathematics/Algebra
I Scores
NELA
PTLA
SLA
74.0%
67.3%
70.1%
74.8%
71.1%
71.8%
71.1%
72.2%
78.6%
73.3%
70.2%
73.5%
Overall 70.5% 72.6% 74.0% 72.4%
According to the original RFP for the RLAs, the expectation is that “successful candidates will
be placed and serve in high-needs schools” (i.e., high-poverty and low-performing NC schools).
Table 11 indicates that graduates from the first two cohorts from each of the three RLAs have
been placed in leadership positions.
Table 11. RLA Graduate Job Placements
Cohort NELA Graduates PTLA Graduates SLA Graduates Overall
Cohort 1
– June
2012
n=21
6 Principals
8 Assistant Princ
3 Central Office
2 Teacher/Facilitator
2 Left RLA Region
n=21
3 Principals
14 Assistant Princ
1 Central Office
1 Teacher/Facilitator
2 Left RLA Region
n=20
8 Principals
9 Assistant Princ
1 Central Office
0 Teacher/Facilitator
2 Left RLA Region
17 Principals
31 Assistant Princ
5 Central Office
0 Teacher/Facilitator
6 Left RLA Region
n=62
Cohort 2
– June
2013
n=21
0 Principals
18 Assistant Princ
1 Central Office
2 Teacher/Facilitator
0 Left RLA Region
n=20
0 Principals
13 Assistant Princ
2 Central Office
5 Teacher/Facilitator
0 Left RLA Region
n=21
2 Principals
17 Assistant Princ
0 Central Office
2 Teacher/Facilitator
0 Left RLA Region
2 Principals
48 Assistant Princ
3 Central Office
9 Teacher/Facilitator
0 Left RLA Region
n=62
TOTALS
(as of
October
2013)
n=42
6 Principals
26 Assistant Princ
4 Central Office
4 Teacher/Facilitator
2 Left RLA Region
n=41
3 Principals
27 Assistant Princ
3 Central Office
6 Teacher/Facilitator
2 Left RLA Region
n=41
10 Principals
26 Assistant Princ
1 Central Office
2 Teacher/Facilitator
2 Left RLA Region
19 Principals
79 Assistant Princ
8 Central Office
9 Teacher/Facilitator
6 Left RLA Region
n=124
(15%)
(64%)
(6%)
(10%)
(5%)

North Carolina Leadership Academies: Final 2013 Report
March 2014
Consortium for Educational Research and Evaluation–North Carolina 26
Table 12 indicates that graduates from the first two cohorts from each of the three RLAs are
serving in high-need schools (see Appendices H, I, and J for Cohort 1’s and 2’s Job Placement
Schools plus Summary and Raw Statistics for these schools).
Table 12. RLA Job Placements: Free and Reduced Lunch, School Size, English, and
Mathematics Scores
Placement Site
Characteristic RLA
Job Placements
Overall
Cohort 1
(Fall 2013)
Cohort 2
(Fall 2013)
% Students
Free/Reduced
Lunch
NELA
PTLA
SLA
77.9%
74.7%
67.4%
60.8%
61.7%
66.6%
69.3%
68.2%
67.0%
Overall 73.3% 63.0% 68.2%
School Size
NELA
PTLA
SLA
480
692
770
572
804
724
526
748
747
Overall 647 700 674
English Scores
NELA
PTLA
SLA
55.9%
55.3%
65.8%
66.0%
67.8%
65.2%
60.9%
61.6%
65.5%
Overall 59.0% 66.3% 62.6%
Mathematics
Scores
NELA
PTLA
SLA
66.4%
68.9%
76.3%
75.1%
74.3%
72.7%
70.7%
71.6%
74.5%
Overall 70.5% 74.0% 72.3%
Trends in the data for the past three years indicate that Cohort 1 and Cohort 2 graduates acquired
jobs in schools that are struggling and where, on average, more than two-thirds (68.2%) of the
students receive free or reduced-price lunch, where the proportion of at- or above-grade level
Reading/English I scores hover around 62.6%, and where the proportion of at- or above-grade
level Mathematics/Algebra I scores hover just above the 72% mark. The range of scores and the
range of growth in these schools are great. These data are in line with high-need, low-performing
schools. Looking back and charting demographic and test score data, most job placement schools
reveal a trend of steady, positive growth (albeit small, in many cases). Some schools had
phenomenal growth (+60.3% increase in Reading/English I scores in one school, and +50.0%
increase in Mathematics/Algebra I scores in another), while others have shown little to no
growth (less than 5% increase). Some schools revealed percentage gains of more than 10% to
15% in one subject but not in the other. A few of the schools where RLA graduates secured jobs
actually reported a three-year trend of negative growth (12% decrease in Reading/English I
scores in one school, and 15.4% decrease in Mathematics/Algebra I scores in another). This is
not necessarily as alarming for job placements as it was for internship placements. In fact, since
the stated purpose of the RLAs is to “increase the number of principals qualified to lead
transformational change in low-performing schools in both rural and urban areas” (NCDPI,
2010, p.10), one could argue that these are exactly the type of schools where RLA graduates
should obtain job placements (e.g., DST schools).

North Carolina Leadership Academies: Final 2013 Report
March 2014
Consortium for Educational Research and Evaluation–North Carolina 27
Even though 95% of RLA graduates are individuals who claim to be deeply committed to
improving persistently low-achieving schools and make a three-year, post-degree commitment to
work in high-need schools throughout North Carolina, actually securing administrative positions
has been a challenge for some. For example, for SLA, although there is strong collaboration and
tangible commitment to leadership development by the 13 partnering LEAs and a real
willingness to sustain SLA beyond RttT funding, job placements do not happen without some
SLA coaxing and negotiating. Likewise, for PTLA, conversations are constantly ongoing to
revitalize interest and support of PTLA, while re-emphasizing the goals and outcomes outlined
by the RttT grant in terms of the hiring of PTLA graduates in assistant principal/principal
positions. The placement situation is similar for NELA where each LEA signs a MOU
(Memorandum of Understanding) stating that the LEA will “utilize Leadership Academy
graduates as the first line of replacements for assistant principal and principal openings in LEAs’
high needs schools.” The fact that this has been difficult is worthy of note. Aspects to consider
moving forward include: (1) the strength of the partnerships with certain LEAs (Are some LEAs
more committed than others? Why? How?); (2) the politics of the region (Who hires whom?
Why? How? When? Where?); and (3) the strengths and background of the RLA graduate (Does
the RLA graduate feel ready, willing, and able to assume a critical leadership position right
now?).
Through their RLA experience, Cohort 1 and Cohort 2 members should now have the
knowledge, skills, and dispositions to be effective leaders of change, using data to focus on
results and reflect on practice. Having said that, several questions about the placement of RLA
graduates still remain:
1. How much influence does each RLA actually have in the hiring process for individual LEAs?
2. Even though RLA participants are specifically prepared to lead in high-need schools, should
every graduate be placed in a high-poverty, low-performing NC school?
3. Research indicates that it takes between three to six years to turn around failing schools. How
should the RLA evaluation track/assess this?
The answers to these and similar questions are beyond the scope of this evaluation. Further
evaluation will continue to monitor, observe, and track the placements of RLA participants and
graduates. Descriptive data regarding their schools will also be collected, disaggregated, and
analyzed; however, others in positions of authority and those with decision-making power will
need to wrestle with and address such questions moving forward. The final question goes well
beyond the timeframe of the RttT grant and evaluation.
Research Question 4: Are RLAs Cost-Effective Relative to Alternative Programs?
As noted above, the Evaluation Team is preparing a cost-effectiveness analysis of the RLAs,
relative to extant comparable leadership development programs. This analysis will be part of a
separate report (expected to be completed in early spring 2014) that will include cost-
effectiveness analyses of several other RttT initiatives. When completed, this analysis will
provide a basis for value comparisons between RLAs and other models.

North Carolina Leadership Academies: Final 2013 Report
March 2014
Consortium for Educational Research and Evaluation–North Carolina 28
Conclusions and Next Steps
Because data on the long-term and distal outcomes of the RLAs are not yet available, the
purpose of this 2013 activity report is to continue to address the evaluation questions by
describing the program components of each RLA in detail. The report first assessed fidelity of
implementation to the aspects outlined in the original Request for Proposal, with the conclusion
that the RLAs have been designed to be consistent with literature on executive development,
adult learning theory, and educational leadership. Aspiring principals in each RLA have been led
through a preparation program (aligned to the North Carolina Standards for School Executives)
designed around several research-based components (e.g., cohort-based experiences; full-time,
year-long clinical residency experience; job placement and induction support; etc.).
With a better understanding of the high degree to which each RLA’s actual implementation
matches its initial proposed design, the ongoing evaluation will continue to document fidelity of
implementation and track intern and graduate placements, and in addition, it will probe deeper
into three specific program areas:
1. Sustainability. RttT funding ends in 2014. A required and competitive priority from the
original RFP included a “commitment to and plan for project sustainability beyond the
funding period.” In their response, RLAs were asked to define sustainability measures. The
question going forward is: How will each RLA sustain this project after the grant funding
ends? To that end, the process has begun for the RLAs individually and collectively.
Collectively, multiple presentations and collaborative efforts by each RLA and their
graduates to the North Carolina Department of Instruction (NCDPI), to the State Board of
Education (SBE and to the General Assembly of North Carolina (GA) have garnered lots of
interest and some support. For example, HB 990, sponsored by Representatives Blackwell,
Moffitt, and Queen, earmarked two million dollars ($2,000,000) for the 2014-2015 fiscal
years to establish the Western Regional Leadership Academy. “The purpose of the academy
is to increase the number of principals and assistant principals qualified to lead
transformational change in schools in both rural and urban areas, including, without
limitation, lowest-achieving schools in nine counties.” Similarly, Section 3.5 of HB 393
entitled Regional Leadership Academies stated the following:
There is appropriated from the General Fund to the Department of Public Instruction the
sum of eight million dollars ($8,000,000) for the 2014-2105 fiscal year to provide
recurring funding for Regional Leadership Academies. These funds shall be used to
increase the number of principals prepared to lead transformational change in the
State’s lowest achieving schools by continuing to fund the Northeast, Sandhills, and
Piedmont Triad Academies.
Individually, NELA has been more successful at securing funds than PTLA and SLA. All
three RLAs are hopeful that NELA’s selection for the federal School Leadership Program
(SLP) grant will provide momentum at the state level to possibly provide financial assistance
for the RLAs in 2014.

North Carolina Leadership Academies: Final 2013 Report
March 2014
Consortium for Educational Research and Evaluation–North Carolina 29
NELA
o Submitted a grant proposal for a 2013 USED School Leadership Program; awarded
$4.7 million over next five years to continue NELA 2.0. SLP grants “support the
development, enhancement, and expansion of innovative programs to recruit, train,
and mentor principals and assistant principals for high-need schools and districts.
Grantees include school districts, institutes of higher education and non-profit
organizations. These five-year grants help prepare individuals to meet state
certification requirements to become principals or assistant principals. Projects also
provide professional development to current principals and assistant principals in
high-need school districts.”
o Crafted and received MOUs from most of the 14 partnering LEAs served by NELA
committing to fund up to $93,000 for each future NELA member.
o Seeking approval from NCDPI and the SBE to be included in any RttT extension of
funds if North Carolina is provided an extension.
o Established a “Sustainability” Committee, including partnering LEAs, that meets
regularly to discuss and explore possible funding agencies and future opportunities.
PTLA
o Submitted a grant proposal for a 2013 USED School Leadership Program but was
not funded.
o Seeking approval from NCDPI and the SBE to be included in any RttT extension of
funds if North Carolina is provided an extension.
o Established a “Sustainability” Committee, including partnering LEAs, that meets
regularly to discuss and explore possible funding agencies and future opportunities.
SLA
o Seeking approval from NCDPI and the SBE to be included in any RttT extension of
funds if North Carolina is provided an extension.
o Established a “Sustainability” Committee, including partnering LEAs, that meets
regularly to discuss and explore possible funding agencies and future opportunities.
2. Mentor and Coach selection and training. The original RLA RFP describes “multi-faceted
support structures, involving a mentor with extensive successful school leadership
experience, a Leadership Academy supervisor, and potentially, an executive coach. Although
the roles may be blended or otherwise modified according to the plan, all coaches, mentors,
and supervisors will be carefully selected and provided with initial training and ongoing
support . . . Interns will complete full-time, year-long clinical residency experiences
including the recruitment, training, and supervision of candidate mentors and coaches.” As
such, what is each RLA doing to ensure “good intern/mentor/coach/school site matches?”
What do mentor principals and coaches receive with regard to ongoing training? And, are
ineffective mentors and coaches replaced? If so, how, when, and why? If not, why not?
3. Induction support. Job placement and induction support in the original RFP entails the RLAs
“working with the participating school districts to ensure appropriate matches of aspiring

North Carolina Leadership Academies: Final 2013 Report
March 2014
Consortium for Educational Research and Evaluation–North Carolina 30
leaders to the schools in which they are placed and to continue professional development
through a two-year induction period, during which Leadership Academy principals continue
to engage with their cohort, mentor, and coach in furthering their leadership skills.”
Therefore, what is each RLA doing to provide ongoing support, mentoring, and advice
through job placement?

North Carolina Leadership Academies: Final 2013 Report
March 2014
Consortium for Educational Research and Evaluation–North Carolina 31
References
Brown, K. (2006). Leadership for social justice and equity: Evaluating a transformative
framework and andragogy. Educational Administration Quarterly, XLII(5), 700–745.
Clark, D. C., & Clark, S. N. (1996). Better preparation of educational leaders. Educational
Researcher, 25(8), 18–20.
Cordeiro, P., & Smith-Sloan, E. (1995, April). Apprenticeships for administrative interns:
Learning to talk like a principal. Paper presented at the annual meeting of the American
Educational Research Association, San Francisco, CA.
Crawford, J. (1998). Changes in administrative licensure: 1991–1996. UCEA Review, 39(3), 8–
10.
Creswell, J.W. (2009). Research design: Qualitative, quantitative, and mixed methods
approaches (3rd
ed.). Los Angeles, CA: Sage Publications.
Crow, G., & Matthews, L. (1998). Finding one’s way: How mentoring can lead to dynamic
leadership. Thousand Oaks, CA: Corwin Press.
Darling-Hammond, L., LaPointe, M., Meyerson, D., Orr, M. T., & Cohen, C. (2007). Preparing
school leaders for a changing world: Lessons from exemplary leadership development
programs. Stanford, CA: Stanford University, Stanford Educational Leadership Institute.
Darling-Hammond, L., Meyerson, D., Lapointe, M., & Orr, M. (2010). Preparing principals for
a changing world: Lessons from effective school leadership programs. San Francisco,
CA: John Wiley & Sons, Inc.
Davis, S., Darling-Hammond, L., LaPointe, M., & Meyerson, D. (2005). School leadership
study: Developing effective principals—Phase one: Review of research. Stanford, CA:
Stanford Educational Leadership Institute.
Dorn, S. M., Papalewis, R., & Brown, R. (1995). Educators earning their doctorates: Doctoral
student perceptions regarding cohesiveness and persistence. Education, 116(2), 305–314.
Hale, E. L., & Moorman, H. N. (2003). Preparing school principals: A national perspective on
policy and program innovations. Washington, D.C.: Institute for Educational Leadership.
Huckaby, D. (2012). Hiring for attitude. School Administrator, 7(69), 30–35.
Knapp, M., Copeland, M., & Talbert, J. (2003). Leading for learning: Reflective tools for school
and district leaders (research report). Seattle, WA: Center for the Study of Teaching and
Policy.

North Carolina Leadership Academies: Final 2013 Report
March 2014
Consortium for Educational Research and Evaluation–North Carolina 32
Kolb, D. A., & Boyatzis, R. E. (1999). Experiential learning theory: Previous research and new
directions. In R. J. Sternberg, & L. F. Zhang (Eds.), Perspectives on cognitive learning and
thinking styles. Mahwah, NJ: Lawrence Erlbaum Associates.
Marshall, C., & Oliva, M. (Eds.). (2010). Leadership for social justice: Making revolutions in
education. Boston, MA: Allyn & Bacon.
McFarland, J., & Preston, J. (2010). Evaluating the effectiveness of turnaround efforts in low-
performing high schools. Raleigh, NC: North Carolina State Board of Education and North
Carolina Department of Public Instruction.
Mezirow, J. (1997). Transformative learning: Theory to practice. New Directions for Adult and
Continuing Education, 74, 5–12.
Murphy, J. (Ed.). (1993). Preparing tomorrow’s school leaders: Alternative designs. University
Park, PA: University Council for Educational Administration.
Murphy, J. (2002, April). Reculturing the profession of educational leadership: New blueprints.
Educational Administration Quarterly, 38(3), 176–191.
Murphy, J. (2006). Preparing school leaders. Lanham, MD: Rowman & Littlefield Education.
Muth, R., & Barnett, B. (2001). Making the case for professional preparation: Using research
program improvement and political support. Educational Leadership and Administration:
Teaching and Program Development, 13, 109–120.
New Leaders for New Schools (NLNS) (2009). Principal effectiveness: A new principalship to
drive student achievement, teacher effectiveness, and school turnaround. New York, NY:
New Leaders for New Schools.
North Carolina Department of Public Instruction (NCDPI) (2010). North Carolina RttT
Proposal. Raleigh, NC: Department of Public Instruction.
Oakes, J., Lipton, M., Anderson, L., & Stillman, J. (2012). Teaching to change the world (4th
edition). Boulder, CO: Paradigm Publishers.
Orr, M. T., O’Doherty, A., and Barber, M. (2012). Designing Purposeful and Coherent
Leadership Preparation Curriculum: A Curriculum Mapping Guide. Charlottesville, VA:
University Council for Educational Administration.
Papa, R., & English, F. (2011). Turnaround principals for underperforming schools. New York:
Rowman & Littlefield.
Taylor, D.L., Cordeiro, P., & Chrispeels, J.H. (2009). Pedagogy. In M.D. Young, G.M. Crow, J.
Murphy, & R.T. Ogawa (Eds.), Handbook of research on the education of school leaders
(pp. 319-370). New York, NY: Routledge.

North Carolina Leadership Academies: Final 2013 Report
March 2014
Consortium for Educational Research and Evaluation–North Carolina 33
Waters, J. T., Marzano, R. J., & McNulty, B. A. (2003). Balanced leadership: What 30 years of
research tells us about the effect of leadership on student achievement. Aurora, CO: Mid-
continent Research for Education and Learning.
Young, M. D., Crow, G., Ogawa, R., & Murphy, J. (2009). The handbook of research on the
education of school leaders. New York, NY: Routledge.

North Carolina Leadership Academies: Final 2013 Report
March 2014
Consortium for Educational Research and Evaluation–North Carolina 34
List of Appendices
Appendix A. NCDPI and Z. Smith Reynolds Request for Proposals: Principal Leadership
Academies
Appendix B. Regional Leadership Academies Biannual Participant Survey
Appendix C. RLA Evaluators’ Observation Log
Appendix D. Regional Leadership Academies Scope of Work and Logic Map of Initiative
Appendix E. Cohort 1, Cohort 2, and Cohort 3 RLA Participants and Internship Placement
Schools
Appendix F. Summary Statistics Cohort 1’s, Cohort 2’s, and Cohort 3’s Internship Placement
Schools
Appendix G. Raw Statistics for Cohort 1’s, Cohort 2’s, and Cohort 3’s Internship Placement
Schools
Appendix H. Job Placements for RLA Cohort 1 and Cohort 2
Appendix I. Summary Statistics for Cohort 1’s and Cohort 2’s Job Placement Schools
Appendix J. Raw Statistics for Cohort 1’s and Cohort 2’s Job Placement Schools

North Carolina Leadership Academies: Final 2013 Report
March 2014
Consortium for Educational Research and Evaluation–North Carolina 35
Appendix A. NCDPI and Z. Smith Reynolds Request for Proposals: Principal Leadership
Academies
I. Background Information
Effective school leadership is the key to school improvement (Fuller, Baker, Young, 2007;
Waters, Marzano, & McNulty, 2003). With an estimated 50% of NC’s current school leaders
becoming eligible for retirement in the next four years, policymakers have recognized a window
of opportunity and have zeroed in on improving school leadership as a crucial step toward
improving student achievement. In order to effect systemic change, NC is prepared to address
school leadership on three major fronts: Master’s of School Administration (MSA) programs
within the public university system, alternative licensure Leadership Academies, and high-
impact professional development for existing principals. Action on all three fronts is mutually
reinforcing, aligned with the newly adopted North Carolina Standards for School Executives, and
driven by a commitment to improving school leadership as a means to facilitating student
learning. This request for proposals addresses the creation and implementation of alternative
licensure Principal Leadership Academies.
Principal Leadership Academies
NC is committed to providing new and alternative pathways to school leadership. The NC
RttT/ZSR [Z. Smith Reynolds] Leadership Academies (LAs) will serve collaboratives of
partnering LEAs and directly address the need to recruit, prepare, and support leaders of
transformational change in challenging school contexts.
The first LA, the Northeast Leadership Academy (NELA), will begin during the fall of 2010 in
NC’s northeast region and will be a MSA program designed by NCSU to serve a cluster of low-
achieving rural schools. The locations of the other two RttT LAs will be determined through this
RFP process, and will be designed to prepare principals to lead low-performing and other high-need
schools. When fully operational by 2011-12, these Academies will prepare about 75 new principals
each year. These LAs will be demonstration sites that will both serve as models for additional LAs
and inform program development and improvement in other university-LEA partnerships.
The LA project is undergirded by the following beliefs about effective leaders. An effective
principal:
1. is a leader of learning in the school (all decisions and resources are aligned to the goal of
improving student outcomes);
2. develops the staff and promotes a culture of continuous, reflective professional learning;
3. cultivates distributive leadership so that authority and accountability are linked;
4. is a systems-thinker and is able to frame problems and potential problems by being a
reflective practitioner;
5. is able to identify leverage points within the system to push change efforts that improve
school outcomes;
6. understands, reads, predicts, and prevents challenges to the school climate; and
7. uses multiple forms of data to inform all decisions.

North Carolina Leadership Academies: Final 2013 Report
March 2014
Consortium for Educational Research and Evaluation–North Carolina 36
The LAs are designed to be consistent with literature on executive development, adult learning
theory and educational leadership (e.g., Davis et al., 2005; Hale & Moorman, 2003; New Leaders
for New Schools, 2008). Therefore, aspiring principals will be led through a preparation program
(aligned to the NC Standards for School Executives) that includes the following components:
Rigorous recruitment and selection, leveraging lessons learned from the NYC Leadership
Academy, the New Leaders for New Schools programs, and other programs;
Cohort-based experiences, with aspiring school leaders participating in cohorts of 20-25
peers, to enable the development of a meaningful professional learning community. Evidence
of the advantages of cohort models is provided by Davis et al., 2005; Dorn et al., 1995; Muth
& Barnett, 2001; and other researchers;
An action-research, case-study curriculum focus, which will engage participants in
addressing issues similar to those they will face on the job, working through relevant data,
problem identification, consideration of alternative solutions, and decision-making. The
action-research projects and cases will be aligned with the NC Standards for School
Executives and will be tied to educational leadership literature and research. This instruction
will occur in an intensive summer program designed to be delivered over one or two
summers. Such summer programs may be individually or collaboratively developed or may
depend on currently available models as demonstrated by organizations such as the New
York Academy or New Leaders for New Schools.
Full-time, year-long clinical residency experience, which will engage participants in
meaningful activities under the direction of an on-site principal mentor, a Leadership
Academy supervisor, and an executive coach. As a primary component of the LA experience,
supervised clinical residencies will allow aspiring school leaders to solidify their knowledge
by applying it to authentic situations (Cordeiro & Smith-Sloan, 1995; Murphy, 1992, 2002).
Weekly full-cohort, continued learning during the residency year that will provide just-in-
time learning for immediate problems and continue to develop aspiring leaders’ skills’;
Multi-faceted support structure, involving a mentor with extensive successful school
leadership experience, an LA supervisor, and potentially, an executive coach. Although the
roles may be blended or otherwise modified according to the plan, all coaches, mentors, and
supervisors will be carefully selected and provided with initial training and ongoing support;
Job placement and induction support, with the LA working with the participating school
districts to ensure appropriate matches of aspiring leaders to the schools in which they are
placed and to continue professional development through a two-year induction period, during
which LA principals continue to engage with their cohort, mentor and coach in furthering
their leadership skills. Support may result in district changes in the manner in which
principals are supervised and may result in varying levels of individual autonomy in order for
the new leaders to be successful. It is the strong expectation that successful candidates will be
placed and serve in high-need schools.
Dynamic feedback and improvement loops, involving a systematic evaluation of programs,
coursework, mentors, supervisors, coaches and student outcomes to ensure continuous and
evidence-driven improvement.

North Carolina Leadership Academies: Final 2013 Report
March 2014
Consortium for Educational Research and Evaluation–North Carolina 37
II. Program Eligibility Criteria
The following guidelines define the eligibility criteria for interested applicants:
A collaborative may consist of multiple districts united by proximity (geography) or a
common shared need or issue (school district size, urban, high poverty, etc.) that collectively
can demonstrate the need for enough new principals to support a leadership academy
collaborative. The size of the collaborative must be sufficient to support candidate cohort of
20-25 to maintain cost effectiveness.
A single large district may apply individually as long as it can justify a sufficient cohort size
based on need and define sustainability measures.
A Principal Leadership Academy may involve a partnership with an external partner such as
an IHE, RESA or other intermediary, but is not required to do so.
A Principal Leadership Academy may partner with an IHE to combine the licensure
development with a Masters of School Administration (MSA) program, but is not required to
do so.
Principal Leadership Academies seeking alternative licensure must obtain approval from the
North Carolina State Board of Education
III. Funds Available
Funds available through the grant will not exceed $XXX per Leadership Academy. The applicant
must demonstrate how any additional necessary funds will be supplied or raised.
IV. Overview of the Application Process
Following is a brief overview of the LA application process.
1. Getting Started
All interested applicants should first thoroughly review the information provided including:
Background information and purpose of the program
Eligibility guidelines
Required and competitive priorities
Budgetary requirements
Due dates
Application submission instructions
2. Completing and submitting your application
A complete application consists of the following components:
Part A: Application narrative
- Project Abstract
- Project Narrative
- Budget Narrative
- Appendix (as appropriate)

North Carolina Leadership Academies: Final 2013 Report
March 2014
Consortium for Educational Research and Evaluation–North Carolina 38
Part B: Forms
- Budget summary – submitted with Budget Narrative (Form 301)
- Line item Budget form - submitted with Budget Narrative (Form 302)
- Leadership Academy Partner Profile (Form 303)
- Leadership Academy Personnel Chart (Form 304)
- Project Activities/Timeline Chart (Form 305)
- Assurances (Form 306)
- MOU, if applicable
- Support letters (optional)
SUBMISSION: Each component is discussed in detail in the following pages of this
application package. Once the application is complete, it must be submitted electronically to
_________________.
DUE: All Leadership Academy applications must be received on or before October 15, 2010.
3. Addressing your questions/Technical Assistance
Questions regarding the application should be addressed to
____________at____________.
A technical assistance session for entities who are considering applying will be offered.
Technical assistance grants for assistance in detailed program development will be
available to collaboratives that attend the technical assistance session and submit a
Leadership Academy proposal.
A. Application Narrative Instructions:
Project Abstract Narrative
Project Narrative
Budget Narrative (includes line item budget form)
Appendix
1. Project Abstract Narrative is where you attach your one-two page project abstract
including:
a. Project Title, if applicable
b. Partners in the submitting collaborative or title of single LEA applicant, including
official contact for any application
c. Brief statement of need (number of high-need schools, low income students, expected
principal vacancies or difficulty in recruiting qualified candidates)
d. Brief description including project components and activities
e. Summary of project objectives and expected outcomes
f. Target number of potential principal candidates to be served
g. Target number of students potentially impacted
h. Any special project features
i. Commitment to participating in program evaluation and ongoing improvement of the
program

North Carolina Leadership Academies: Final 2013 Report
March 2014
Consortium for Educational Research and Evaluation–North Carolina 39
2. Project Narrative should include, in detail, the eligible applicant’s response to the
Required and Competitive priorities. Eligible applicants should address each of the
Required and Competitive priorities as appropriate since the application will be evaluated
and scored against these criteria.
Required and Competitive Priorities
a. Evidence supporting need for project
b. Demonstration of partner buy-in including resources obtained from other sources
(including in-kind support and additional outside technical support)
c. Evidence of collaborative capacity to plan and implement project proposal
including demonstrated support of local boards of education and county
commissioners.
d. Commitment to and plan for project sustainability beyond funding period
e. Comprehensive program including all research-based defined program elements
listed on pages 3-4 above.
f. Evidence of knowledge and skill in the area of adult learning
g. Clear scope of work with program definition, activities, timelines and deliverables
as well as defined LA personnel roles/responsibilities
h. Demonstration of best practice in teaching and learning as evidenced by problem-
based teaching and learning in project design.
Formatting
- A “page” is 8.5” x 11”, on one side only, with 1” margins at the top, bottom, and
both sides. Page numbers and an identifier may be within the 1” margin. Double
space (no more than three lines per vertical inch) all text in the application
narrative, including titles, headings, footnotes, quotations, references, captions, as
well as all text in charts, tables, and graphs. Use a font that is 12-point or larger.
Use one of the following fonts: Times New Roman, Courier, Courier New, or
Arial. Other fonts submitted will not be accepted.
Page Limits
- Eligible applicants are strongly encouraged to limit the project narrative to twenty
pages.
3. Budget Narrative includes the Budget Summary form (Form 301) and the detailed line
item budget form (Form 302) AND the accompanying detailed budget narrative
justification. Funds should be budgeted for the course of the grant. Eligible applicants
must also provide a detailed budget narrative that describes their proposed multiyear
project activities and the costs associated with those activities as well as all costs
associated with carrying out the proposed project. The budget should include only costs
that are allowable, reasonable, and necessary for the carrying out the objectives of the LA
project. In addition to the grant budget, the narrative should describe sources of funding
to be used in addition to the grant funds.

North Carolina Leadership Academies: Final 2013 Report
March 2014
Consortium for Educational Research and Evaluation–North Carolina 40
4. Appendix. Eligible applicants are encouraged to follow guidelines below in attaching
Appendices to the project proposal
Appendix A: Leadership Academy Profile document for each proposed collaborative
(Form 303)
Appendix B: Resumes of Key Personnel in each partner organization
Appendix C: Leadership Academy Personnel Chart (Form 304)
Appendix D: Letters of Support, optional
Appendix E: MOU, if applicable
Appendix F: Assurances (Form 306)
Appendix G: Other, if applicable
Application Narratives:
1. Project Abstract Narrative – see earlier guidelines
2. Project Narrative
Address the Eight Required and Competitive Priorities in your Project Narrative as
described above, page 6.
In addition, in your narrative, respond to the questions/directions listed below:
2a. Describe the evidence that supports your need for this collaborative. What need are you
trying to fill? What is the rationale behind your collaborative? If you are a single district, what is
your justification for establishing a leadership academy as a single district? Include district data
in your argument (number of principals, turnover, etc.)
2b. Readiness is considered as a measure of the partners’ individual track records; buy-in as an
actual statement of willingness to commit to the project (as evidenced by the support of district
and collaborative contributions in human, fiscal and time resources); and capacity as evidence of
the districts’/collaborative’s ability to both plan and implement the plan, With those definitions
in mind, describe evidence of your readiness, buy-in and capacity as it relates to this project.
2c. How will you use Technical Assistance in your planning and implementation process?
2d. Describe your collaborative’s governance structure.
2e. How will you sustain this project after the grant funding ends?
2f. How do you define this project’s success? What will your on-going evaluation process look
like? What data will you collect and how will you use it for continuous improvement?
2g. If seeking alternative licensure authority, demonstrate a clear pathway to licensure, to be
granted by the NC State Board of Education: addressing all required program components and a
detailed narrative on how you will address the seven administrator standards and twenty-one
competencies. Inclusion of a chart reflecting a ‘standards crosswalk’ showing how each standard
and dispensation will be addressed is encouraged. Additionally, describe how the different

North Carolina Leadership Academies: Final 2013 Report
March 2014
Consortium for Educational Research and Evaluation–North Carolina 41
program elements are aligned and coordinated. Required program components (see earlier
descriptions) include:
Rigorous recruitment and selection
Cohort-based experiences
An action-research, case-study curriculum focus delivered in an intensive summer
program designed for one or two summers
Full-time, year-long clinical residency experience including the recruitment, training
and supervision of candidate mentors and coaches.
Weekly full-cohort, continued learning during the residency year
Multi-faceted support structure
Job placement and induction support
Dynamic feedback and improvement loops
3. Budget Narrative/Summary Budget (Form 301) and Line Item Budget (Form 302). Budget Narrative includes the Budget summary form, detailed line item budget form AND
the accompanying detailed budget narrative justification. Funds should be budgeted for the
course of the grant.
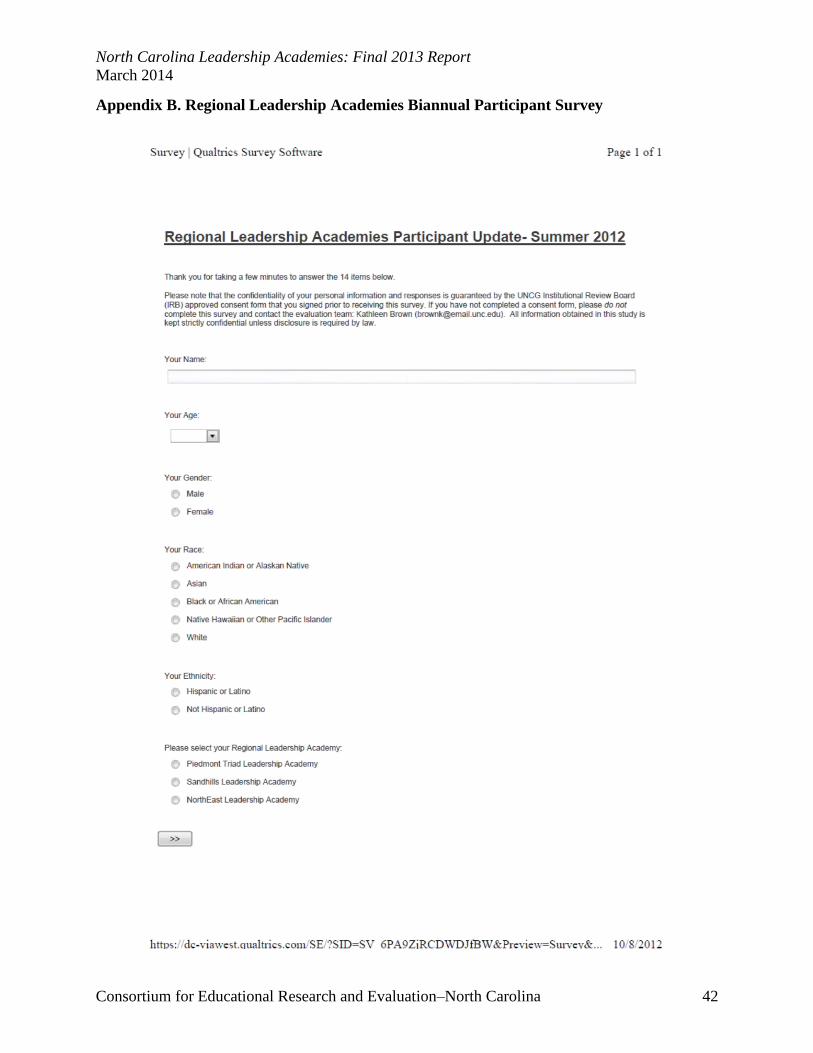
North Carolina Leadership Academies: Final 2013 Report
March 2014
Consortium for Educational Research and Evaluation–North Carolina 42
Appendix B. Regional Leadership Academies Biannual Participant Survey

North Carolina Leadership Academies: Final 2013 Report
March 2014
Consortium for Educational Research and Evaluation–North Carolina 43

North Carolina Leadership Academies: Final 2013 Report
March 2014
Consortium for Educational Research and Evaluation–North Carolina 44

North Carolina Leadership Academies: Final 2013 Report
March 2014
Consortium for Educational Research and Evaluation–North Carolina 45
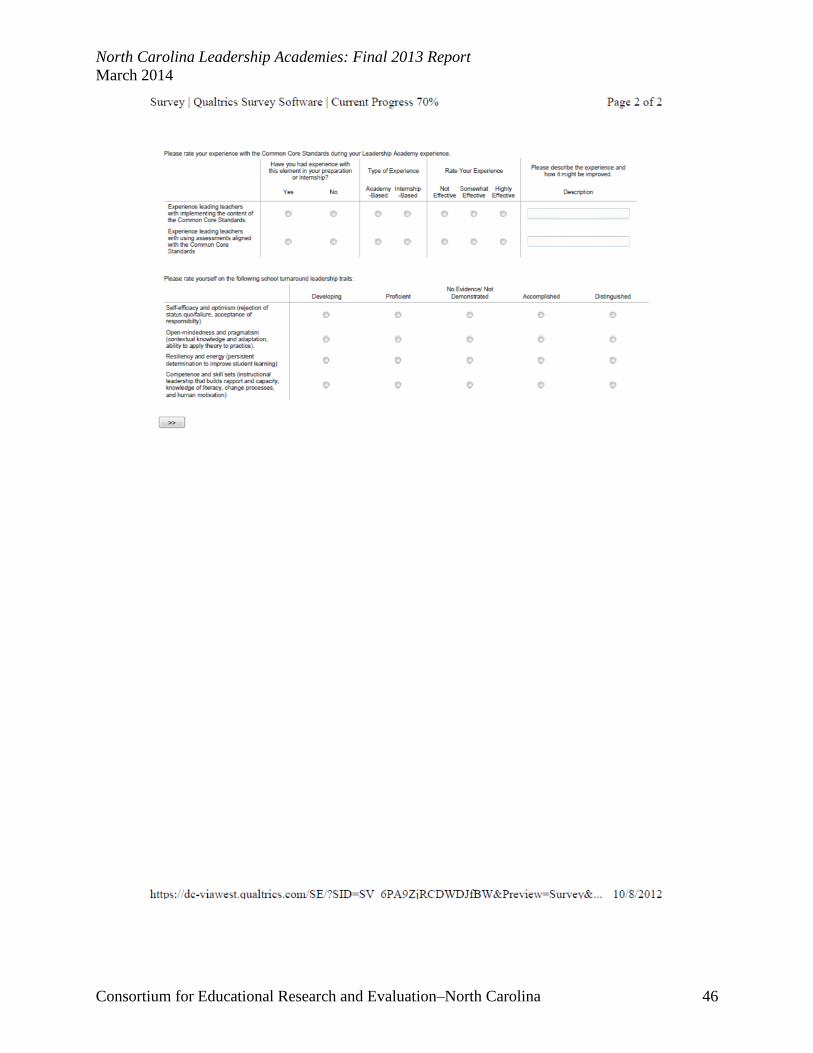
North Carolina Leadership Academies: Final 2013 Report
March 2014
Consortium for Educational Research and Evaluation–North Carolina 46

North Carolina Leadership Academies: Final 2013 Report
March 2014
Consortium for Educational Research and Evaluation–North Carolina 47
Appendix C. RLA Evaluators’ Observation Log
Date Time Place Purpose
Monday
March 21, 2011
11:30–
1:00 Abernathy
Attend meeting to discuss RLA with
Gary, Trip, and Adam—KB & AH
Monday
April 4, 2011
10:00–
2:00 CSLD
Attend meeting to discuss SOW with
Gary, Trip, and Laura—KB & AH
Monday
May 2, 2011 9:00–1:00 CSLD
Attend meeting with Executive Directors
of RLAs and Janice Davis
Saturday
April 30, 2011 8:00–3:00 Friday Institute Observe NELA selection process—KB
Thursday-Friday
May 5–6, 2011 9:00–3:00 Atlanta
Attend SREB Conference on Leadership
Academies—KB
Wednesday
May 11, 2011
11:00–
4:00
Longleaf
Southern Pines
Observe SLA curriculum development
with NYCLA reps—KB
Monday
May 16, 2011
4:00–
10:00
Fayetteville
ERC Observe SLA selection process—KB
Thursday
May 19, 2011
7:30–
12:30 UNCG
Observe PTLA Advisory Group
meeting—KB
Saturday
May 21, 2011
9:00–
12:00
Fayetteville
ERC Observe SLA selection process—AH
Monday
May 23, 2011
8:00–
Noon DPI
Present to June Atkinson’s cabinet
meeting (NCDPI)—KB
Wednesday
May 25, 2011
Noon–
5:00 SERVE
Attend/present on Fall RttT data
collection—KB & AH
Tuesday
May 31, 2011
11:30–
4:30 Friday Institute
Present to Quality Assurance
Committee—KB & AH
Wednesday
June 2, 2011
7:30–
12:30 UNCG
Observe PTLA Advisory Group
meeting—KB
Thursday
June 16, 2011 3:00–5:00 UNCG
Observe PTLA Advisory Group
meeting—AH
Thursday
June 23, 2011 2:00–8:00
Longleaf
Southern Pines
Observe SLA kick-off program and
information meeting—KB
Wednesday
July 6, 2011 8:00–2:30
UNCG
Piney Lake
Observe PTLA kick-off activities: Ropes
Course (Team Quest)—KB
Thursday
July 7, 2011 8:30–4:00 UNCG
Observe PTLA kick-off activities: Q&A,
Ropes Course follow-ups—AH
Wednesday
July 13, 2011
11:30–
4:30 UNCG
Observe PTLA Summer Ramp Up:
School Leadership Seminar—KB
Wednesday
July 20, 2011 8:30–4:00
NCCAT
Cullowhee Observe SLA Summer Institute—AH
Thursday
July 21, 2011 8:30–4:30 UNCG
Observe PTLA Summer Ramp Up:
School Leadership Seminar—AH
Tuesday
July 26, 2011
7:30–
12:30 UNCG
Observe PTLA Summer Ramp Up:
School Leadership Seminar—KB

North Carolina Leadership Academies: Final 2013 Report
March 2014
Consortium for Educational Research and Evaluation–North Carolina 48
Date Time Place Purpose
Tuesday
July 26, 2011
12:30–
5:00
Sandhills Com
College Observe SLA Summer Institute—KB
Wednesday
July 27, 2011
12:00–
9:00 Friday Institute
Attend/present RttT SOW impact
meeting—KB
Tuesday
August 2, 2011 9:00–3:00
Sandhills Com
College Observe SLA Summer Institute—AH
Friday
August 5, 2011 9:00–3:00 Raleigh
Observe NELA Mentor Principal and
Coach Training—AH
Monday
August 8, 2011 7:30–3:00 Friday Institute
Observe NELA Cohort II Orientation—
KB
Tuesday
August 9, 2011
9:00–
11:00 UNCG
Observe PTLA Advisory Team
meeting—AH
Wednesday
August 10, 2011 9:00–3:00
Pinckney Ac,
Carthage, NC
Observe SLA Mentor Principal
Training—KB
Thursday
August 18, 2011 8:30–3:30
UNCG
Room 401
Observe First Fall Session PTLA
Internship Seminar—AH
Friday
August 26, 2011 9:00–3:00 UNCG
Observe PTLA Curriculum Writing
Session (9-11)—KB & AH (RLA
planning session)
Tuesday
August 30, 2011 4:30–9:30
Friday
Institute
Present to Quality Assurance Committee
(QAC)—KB & AH
Tuesday
September 6, 2011 8:30–5:30
Rocky Mount,
NC
Observe NELA Distinguished Leaders in
Practice—KB
Monday
September 19, 2011
8:30–
11:00
Hunt Institute,
Durham
Attend/present RLA Quality Assurance
Committee (QAC) meeting—KB
Wednesday
September 21, 2011 8:00–5:00
Pinckney
Academy, NC
Observe SLA Intern Seminar: Guest
Speaker Richard Schwartz—KB
Thursday
September 22, 2011
Noon–
5:00
Triad Center
Greensboro
Observe PTLA Intern Seminar: EDUC
690—KB
Tuesday
October 11, 2011 8:00–6:00
Rocky Mount,
NC
Observe NELA Formative Assessments
of Fellows—KB
Wednesday
October 12, 2011 8:00–5:00
Pinckney
Academy, NC
Observe SLA: DPI Principal Evaluation
Trainers—KB
Thursday
October 13, 2011 8:00–4:00
Graham
Middle, ABSS
Observe PTLA School Site Visit #4—
KB
TOTAL = 32 formal observations plus 10
formal meetings attended or presented to
between November 2011 and October
2012
Tuesday
November 1, 2011 8:00–6:00
McKimmon
Center, NC
State, Raleigh
Attend/present RLA Quality Assurance
Committee (QAC)—KB & AH
Friday
November 4, 2011
11:00–
4:00
NCDPI,
Raleigh Attend/present RttT meeting—KB

North Carolina Leadership Academies: Final 2013 Report
March 2014
Consortium for Educational Research and Evaluation–North Carolina 49
Date Time Place Purpose
Friday
November 18, 2011 1:00–4:00 Pittsburgh, PA
Attend/present UCEA Conference
presentation regarding NC RLAs—KB
Thursday
December 15, 2011
8:00–
12:30
Kiser Middle
School,
Greensboro
Observe PTLA school site visit to Kiser
Middle School—AH
Friday
December 16, 2011
9:00–
12:30
Richmond
County,
Hamlet, NC
Observe SLA Intern Seminar: Switch
month info and gathering data—AH
December 20, 2011 1:30-5:00 Chapel Hill
Present Regional Leadership Academies
Cost-Effectiveness Framework Report—
KB & AH
Monday
January 9, 2012
12:30–
4:30
Moore County
District Office
Observe SLA Advisory Board meeting—
KB
Wednesday
January 18, 2012
9:00–
12:00 UNCG SOE
Observe PTLA Advisory Board
meeting—KB
Monday
January 30, 2012 8:45–1:30
Friday
Institute,
Raleigh, NC
Observe NELA Intern Seminar regarding
leadership and technology—KB
Monday
February 6, 2012 9:30–1:00
NC DPI
Raleigh
Present NCDPI presentation (RLA
CEA)—KB
Thursday
February 16, 2012
12:00–
5:00
Greensboro,
NC
Observe PTLA site visit at Hunter
Elementary—KB
Friday
February 17, 2012 8:00–1:00
Rocky Mount,
NC
Observe NELA Intern Session regarding
Facilitative Leadership—KB
Wednesday
February 22, 2012 8:00–1:00 Sanford, NC
Observe SLA site visit to JR Ingram
Elementary School—KB
Tuesday
February 28, 2012
12:30–
5:00 Durham, NC
Attend/present at QAC meeting at Hunt
Institute—KB
Thursday
March 8, 2012
12:00–
5:00
Greensboro,
NC
Observe PTLA intern session with
Superintendents—KB
Tuesday
March 13, 2012
5:00–
10:00 Sanford, NC
Observe SLA School Board presentation
at Lee County High School—KB
Friday
March 23, 2012 8:00–1:00 Raleigh, NC Observe NELA intern session—KB
Wednesday
April 25, 2012
8:00–
12:00 Moore County
Observe SLA intern session at Pickney
Academy (interviewing and resumes)—
KB
Thursday
April 26, 2012
Noon–
5:00
Alamance
County
Observe PTLA site visit to Haw River
Elementary School—KB
Monday
April 30, 2012 9:00–1:00
NC DPI
Raleigh Present to NCDPI—KB
Wednesday
May 2, 2012 8:00–2:00
Rocky Mount,
NC
Observe NELA intern session at
Gateway Technology—KB
June 24–29, 2012 9:00–5:00 Ocracoke
Island, NC
Observe SLA’s Week 5 of intensive
prep—KB
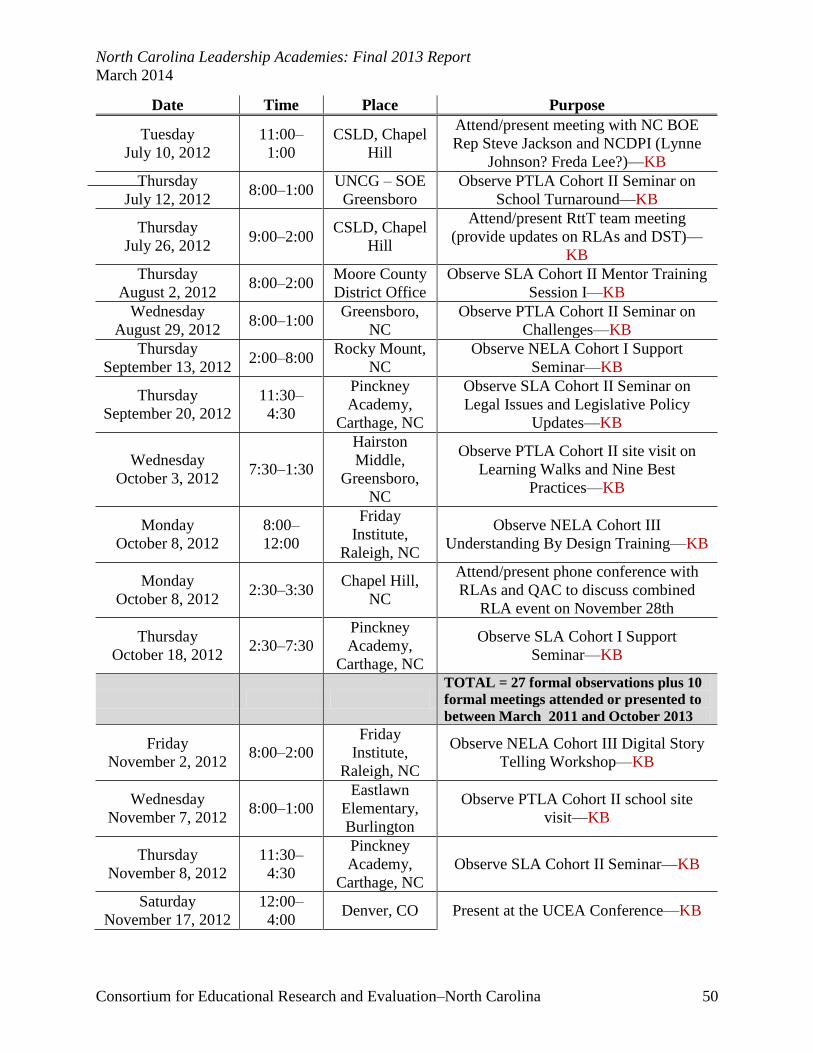
North Carolina Leadership Academies: Final 2013 Report
March 2014
Consortium for Educational Research and Evaluation–North Carolina 50
Date Time Place Purpose
Tuesday
July 10, 2012
11:00–
1:00
CSLD, Chapel
Hill
Attend/present meeting with NC BOE
Rep Steve Jackson and NCDPI (Lynne
Johnson? Freda Lee?)—KB
Thursday
July 12, 2012 8:00–1:00
UNCG – SOE
Greensboro
Observe PTLA Cohort II Seminar on
School Turnaround—KB
Thursday
July 26, 2012 9:00–2:00
CSLD, Chapel
Hill
Attend/present RttT team meeting
(provide updates on RLAs and DST)—
KB
Thursday
August 2, 2012 8:00–2:00
Moore County
District Office
Observe SLA Cohort II Mentor Training
Session I—KB
Wednesday
August 29, 2012 8:00–1:00
Greensboro,
NC
Observe PTLA Cohort II Seminar on
Challenges—KB
Thursday
September 13, 2012 2:00–8:00
Rocky Mount,
NC
Observe NELA Cohort I Support
Seminar—KB
Thursday
September 20, 2012
11:30–
4:30
Pinckney
Academy,
Carthage, NC
Observe SLA Cohort II Seminar on
Legal Issues and Legislative Policy
Updates—KB
Wednesday
October 3, 2012 7:30–1:30
Hairston
Middle,
Greensboro,
NC
Observe PTLA Cohort II site visit on
Learning Walks and Nine Best
Practices—KB
Monday
October 8, 2012
8:00–
12:00
Friday
Institute,
Raleigh, NC
Observe NELA Cohort III
Understanding By Design Training—KB
Monday
October 8, 2012 2:30–3:30
Chapel Hill,
NC
Attend/present phone conference with
RLAs and QAC to discuss combined
RLA event on November 28th
Thursday
October 18, 2012 2:30–7:30
Pinckney
Academy,
Carthage, NC
Observe SLA Cohort I Support
Seminar—KB
TOTAL = 27 formal observations plus 10
formal meetings attended or presented to
between March 2011 and October 2013
Friday
November 2, 2012 8:00–2:00
Friday
Institute,
Raleigh, NC
Observe NELA Cohort III Digital Story
Telling Workshop—KB
Wednesday
November 7, 2012 8:00–1:00
Eastlawn
Elementary,
Burlington
Observe PTLA Cohort II school site
visit—KB
Thursday
November 8, 2012
11:30–
4:30
Pinckney
Academy,
Carthage, NC
Observe SLA Cohort II Seminar—KB
Saturday
November 17, 2012
12:00–
4:00 Denver, CO Present at the UCEA Conference—KB
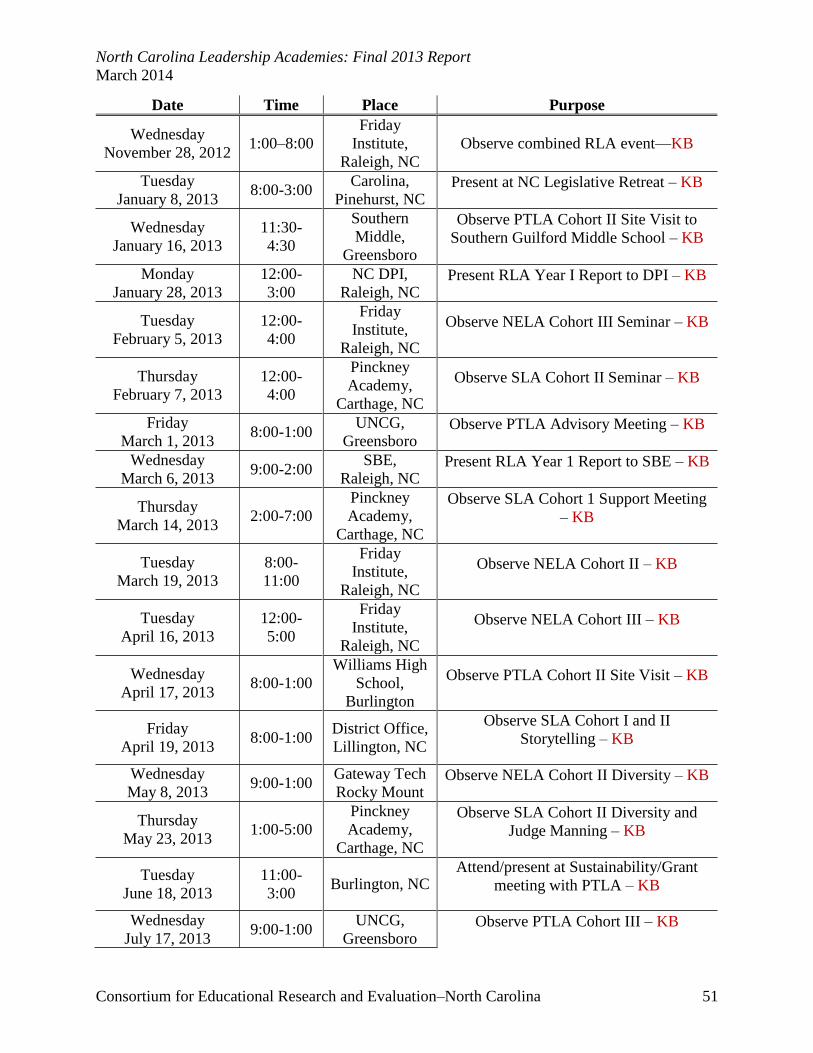
North Carolina Leadership Academies: Final 2013 Report
March 2014
Consortium for Educational Research and Evaluation–North Carolina 51
Date Time Place Purpose
Wednesday
November 28, 2012 1:00–8:00
Friday
Institute,
Raleigh, NC
Observe combined RLA event—KB
Tuesday
January 8, 2013 8:00-3:00
Carolina,
Pinehurst, NC Present at NC Legislative Retreat – KB
Wednesday
January 16, 2013
11:30-
4:30
Southern
Middle,
Greensboro
Observe PTLA Cohort II Site Visit to
Southern Guilford Middle School – KB
Monday
January 28, 2013
12:00-
3:00
NC DPI,
Raleigh, NC Present RLA Year I Report to DPI – KB
Tuesday
February 5, 2013
12:00-
4:00
Friday
Institute,
Raleigh, NC
Observe NELA Cohort III Seminar – KB
Thursday
February 7, 2013
12:00-
4:00
Pinckney
Academy,
Carthage, NC
Observe SLA Cohort II Seminar – KB
Friday
March 1, 2013 8:00-1:00
UNCG,
Greensboro Observe PTLA Advisory Meeting – KB
Wednesday
March 6, 2013 9:00-2:00
SBE,
Raleigh, NC Present RLA Year 1 Report to SBE – KB
Thursday
March 14, 2013 2:00-7:00
Pinckney
Academy,
Carthage, NC
Observe SLA Cohort 1 Support Meeting
– KB
Tuesday
March 19, 2013
8:00-
11:00
Friday
Institute,
Raleigh, NC
Observe NELA Cohort II – KB
Tuesday
April 16, 2013
12:00-
5:00
Friday
Institute,
Raleigh, NC
Observe NELA Cohort III – KB
Wednesday
April 17, 2013 8:00-1:00
Williams High
School,
Burlington
Observe PTLA Cohort II Site Visit – KB
Friday
April 19, 2013 8:00-1:00
District Office,
Lillington, NC
Observe SLA Cohort I and II
Storytelling – KB
Wednesday
May 8, 2013 9:00-1:00
Gateway Tech
Rocky Mount Observe NELA Cohort II Diversity – KB
Thursday
May 23, 2013 1:00-5:00
Pinckney
Academy,
Carthage, NC
Observe SLA Cohort II Diversity and
Judge Manning – KB
Tuesday
June 18, 2013
11:00-
3:00 Burlington, NC
Attend/present at Sustainability/Grant
meeting with PTLA – KB
Wednesday
July 17, 2013 9:00-1:00
UNCG,
Greensboro Observe PTLA Cohort III – KB

North Carolina Leadership Academies: Final 2013 Report
March 2014
Consortium for Educational Research and Evaluation–North Carolina 52
Date Time Place Purpose
Thursday
July 18, 2013 9:00-1:00
Pinckney
Academy,
Carthage, NC
Observe SLA Cohort III – KB
Wednesday
July 31, 2013
10:00-
2:00
Gateway
Technology
Center, Rocky
Mount, NC
Observe NELA Cohort III – KB
Thursday
September 5, 2013
11:00-
4:00
Friday
Institute,
Raleigh, NC
Present RLA info at RttT Evaluation
Meeting – KB
Tuesday
September 10, 2013
11:00-
5:00
Gateway
Technology
Center, Rocky
Mount, NC
Observe NELA Cohort III – KB
Thursday
September 12, 2013 Noon-4:00
Pinckney
Academy,
Carthage, NC
Observe SLA Cohort III – KB
Wednesday
September 25, 2013 Noon-5:00
Hunter
Elementary,
Greensboro
Observe PTLA Cohort III Site Visit –
KB
Tuesday
October 1, 2013 Noon-4:00
Garner Middle,
Raleigh
Observe NELA Cohort III Site Visit –
KB
Wednesday
October 16, 2013 9:00-1:00
UNCG,
Greensboro Observe PTLA Cohort III – KB
Thursday
October 31, 2013 Noon-4:00
Pinckney
Academy,
Carthage, NC
Observe SLA Cohort III – KB
TOTAL = 27 formal observations plus 6
formal meetings attended or presented to
between November 2012 and October
2013
GRAND
TOTAL
86 formal observations plus
26 formal meetings attended or
presented to between March 2011 and
October 2013

North Carolina Leadership Academies: Final 2013 Report
March 2014
Consortium for Educational Research and Evaluation–North Carolina 53
Appendix D. Regional Leadership Academies Scope of Work and Logic Map of Initiative
Overview
The evaluation of the Race to the Top Regional Leadership Academies (RLA) initiative will
gauge the success of the RLAs in the following areas:
Recruiting, selecting, and training school leaders;
Program participants’ placement within high poverty and low-performing NC schools; and
Relative cost-effectiveness of RLAs as compared to alternative programs.
The evaluation approach will combine qualitative analyses (including document reviews,
observations, interviews, and focus groups) with an analysis of participant survey data,
administrative data, accounting data, and school leadership movement data. Overriding goals of
the evaluation will be to determine whether the RLAs are successful in fulfilling North
Carolina’s school leadership needs and, if so, whether they have met these needs in a fashion that
is cost-effective and deserving of continued financial support.
RttT Initiative Context
Policy Objective(s)/Purpose(s) of the Initiative
● Increase the number of principals qualified to lead transformational change in low-
performing schools in both rural and urban areas.
Initiative Activities
Leadership academy and LEA leaders work together to identify and recruit selective and
committed candidates.
Curriculum employs an action-research, case-study focus, which engages participants in
addressing issues similar to those they will face on the job and which is aligned with the NC
Standards for School Executives.
Workshops and seminars are co-led by teams of university faculty, exemplary LEA
leadership practitioners, and others with extensive school leadership experience.
Aspiring school leaders participate in cohorts of 20 to 25 peers, to enable the development of
a meaningful professional learning community.
The RLA experience for candidates will include:
○ Site visits to high-performing, high-poverty schools, with student populations similar to
those in which the participants will be placed;
○ Full-time, year-long, clinical residency experience, during their second year in the
program, under the direction of an on-site principal mentor, a leadership academy
supervisor, and an executive coach;
○ Weekly full-cohort, continued learning during the residency year that will provide just-in-
time learning for immediate problems and ongoing skill development;

North Carolina Leadership Academies: Final 2013 Report
March 2014
Consortium for Educational Research and Evaluation–North Carolina 54
○ Coordination with the NCDPI District and School Transformation Initiative, to ensure
consistency and coordination when working in the same districts and schools;
○ Job placement support, provided by the leadership academy in conjunction with
participating LEAs to ensure appropriate matches of aspiring leaders to the schools in
which they are placed;
○ Induction support, involving ongoing professional development through a two-year
induction period after the participant assumes a school leadership role, during which
leadership academy principals will continue to engage with their cohort, coaches,
mentors, and supervisors in furthering their leadership skills; and
○ Incentives for participants, including tuition toward a Master’s degree in School
Administration, release time to participate, hiring preference with the participating LEAs,
travel costs for site visits, early career support, and program materials.
Evaluation Goal(s)/Purpose(s) of the Evaluation
● Determine whether RLA implementation has increased the number of principals prepared
to lead transformational change in high-need schools.
● Discern the cost-effectiveness of RLA efforts to recruit and train these principals
Overall Approach to Evaluation
Mixed-method: Collection and analysis of qualitative and quantitative data will be integrated to
address evaluation questions. A case study model will be used to better understand RLA design,
implementation, and possible impacts.

North Carolina Leadership Academies: Final 2013 Report
March 2014
Consortium for Educational Research and Evaluation–North Carolina 55

North Carolina Leadership Academies: Final 2013 Report
March 2014
Consortium for Educational Research and Evaluation–North Carolina 56
Research Questions and Anticipated Data Sources
Document/
Course
Review
Educator
Eval Tool
Results
Observations (Classroom/
Institute/
Workshop/
Other)
Interviews (Teacher/
Admin/
Other)
Focus
Groups (Student/
Teacher/
Other)
Surveys (Student/
Teacher/
Other) Quant
Analysis
Administra-
tive Data
Review
Accounting
Data Review Projected/Proposed Analysis Tool
Evaluation Question
Major/Overall Questions
What is the nature and quality of the experience: a) for students and b) for
participating teachers? X X X
Are these initiatives cost-effective and sustainable?
X
To what extent do the initiatives meet critical needs for teachers and principals and improve equitable access to higher-quality teachers and
leaders in targeted geographic and content areas?
X
Specific Questions
Do RLAs effectively recruit, relative to the alternatives?
Measures: candidate acceptance rates, program completion rates, multi-
step selection process implementation, candidate cohort characteristics, candidate and RLA planning group process-related feedback
X X
Do RLAs effectively train, relative to the alternatives?
Measures: fidelity of implementation of research-based training
methodologies, curriculum analysis, candidate and candidate mentor, coach, and supervisor feedback
X
X X X
X
What impact does each RLA’s selection criteria have on program
effectiveness?
Measures: candidate, mentor, and candidate supervisor feedback relative to
the purpose of the RLAs
X
X X X
Do RLA graduates find placements in targeted schools/districts?
X
X
X
Are RLAs cost-effective relative to the alternatives?
X

North Carolina Leadership Academies: Final 2013 Report
March 2014
Consortium for Educational Research and Evaluation–North Carolina 57
Evaluation Activities
NorthEast Leadership Academy (NELA) is based at North Carolina State University and serves
the following school districts: Edgecombe, Franklin, Granville, Martin, Nash-Rocky Mount,
Vance, and Washington. NELA will select and induct its second cohort in the summer of 2011.
Cohort 1 was inducted prior to NC RttT funding in the summer of 2010. Successful NELA
matriculates will be granted Licensure and a Masters of School Administration.
Piedmont Triad Leadership Academy (PTLA) is based at The University of North Carolina at
Greensboro and serves the Piedmont Triad Education Consortium and the following school
districts: Alamance-Burlington, Asheboro City, Guilford, and Winston-Salem/Forsyth. PTLA
selected and will induct its first cohort in the summer of 2011. Successful PTLA matriculates
will be granted Licensure.
Sandhills Leadership Academy (SLA) was founded by the Sandhills Regional Education
Consortium and serves the following school districts: Anson, Columbus, Cumberland, Harnett,
Hoke, Lee, Montgomery, Moore, Richmond, Robeson, Scotland, and Whiteville. Fayetteville
State University, The University of North Carolina at Pembroke, and the North Carolina Center
for the Advancement of Teaching are partners to the SLA. SLA will select and induct its first
cohort in the summer of 2011. Successful SLC matriculates will be granted Licensure.
Each RLA is a unique program created independently to meet the school leadership needs of
three distinct regions of North Carolina. As each program followed its own path to
implementation and its own timeline, evaluators have been engaged and involved as observers
collecting and analyzing data since April, 2011.
Anticipated Procedure:
Analyze:
o Evaluators will analyze each RLA’s recruitment efforts, curriculum, induction, and RLA
internal evaluation efforts. Artifacts (planning documents, presentations, dissemination
materials, websites, etc.) and observational data will be analyzed using relevant
qualitative methodologies and computer software when appropriate. These activities will
help evaluators understand how candidates are recruited, inducted, and trained.
o As noted above, the evaluation team will use a mixture of document-review,
observations, interviews, focus groups, survey, administrative data, and accounting data.
Creswell’s (2009)12
mixed-methods approach is most appropriate given multiple data
collection methods and mixed modes of analysis.
Observe:
o Evaluators will observe each RLA’s selection processes and candidate cohort
experiences, including internships and support efforts. These activities will help
evaluators understand the support and guidance provided to candidates.
12
Creswell, J. (2009). Research Design. Thousand Oaks: Sage Publications.

North Carolina Leadership Academies: Final 2013 Report
March 2014
Consortium for Educational Research and Evaluation–North Carolina 58
Interview:
o Evaluators will interview each RLA’s Director, participants, mentors, coaches, and
participant supervisors. These activities will help evaluators gather a wide range of
perspectives on the RLAs for qualitative analysis.
Analyze:
o Evaluators will analyze the cost-effectiveness of the RLAs relative to extant comparable
leadership development programs using Levin and McEwan’s (2001)13
‘ingredients-
based’ approach to cost-effectiveness analysis. This analysis will provide a basis for
value comparisons between RLAs and other models.
Anticipated Schedule:
● First stage (January 2011-July 2011):
○ During the first stage of the RLA evaluation, the evaluation team will visit each RLA
(n=3) to gather observational data and artifacts for review from: Executive RLA
Networking meetings, Quality Assurance Group meetings, each RLA’s curriculum and
planning meetings, and each RLA’s cohort candidate selection activities. Throughout
these activities the evaluation team will meet to discuss emerging themes, plan for future
analyses, and plan site visits and interviews to flexibly coincide with each RLA’s
developing calendar. Initial cost effectiveness analyses on extant comparable leadership
development programs will be performed and protocols for field observations and
interviews will be developed.
● Second stage (August 2011-June 2013)
○ Second stage evaluation activities will include continued visits to the RLAs to collect
observational data and artifacts for review during: kickoff activities, summer institutes
and training programs, mentor principal training sessions, and residencies and
internships. Additionally, interviews will be conducted with: RLA Directors, participants,
mentors, coaches, and participant supervisors. During this period, the second RttT-funded
cohort of candidates will be recruited, selected, and trained; evaluation activities will
include this second RttT cohort as well.
● Third stage (July 2013-June 2014)
o The third and final stage of the evaluation activities will focus on final data collection,
analyses and synthesis of findings, and report authoring. Data from observations,
artifact/document review, and interviews will be analyzed using themes based on evaluation
questions and those that emerge throughout evaluation and program activities. The cost-
effectiveness analysis will also be finalized during this stage. All evaluation activities result
in the authoring of the final RLA Evaluation Report to be delivered June, 2014.
Major Evaluation Deliverables
Final 2012 Activity Report 11/30/2012
Final 2013 Activity Report 11/30/2013
Final Report 4/30/2014
13
Levin, H. M., and P. J. McEwan. (2001). Cost-Effectiveness Analysis: Methods and Application, 2nd ed.
Thousand Oaks, CA: Sage.

North Carolina Leadership Academies: Final 2013 Report
March 2014
Consortium for Educational Research and Evaluation–North Carolina 59
Appendix E. Cohort 1, Cohort 2, and Cohort 3 RLA Participants and Internship
Placement Schools
Table E1. NELA Cohort 1 Internship Placements
Name Internship Placement LEA Mentor Principal
Mark Barfield Northampton High Northampton Pamela Chamblee
Annabel Bello Belmont Elementary Roanoke Rapids Kelvin Edwards
Melissa Harris-Rich Roanoke Rapids High Roanoke Rapids Robert Hurley
Ryan Hurley Mariam Boyd Elem Warren Canecca Davis
Demetra Lassiter Ahoskie Elementary Hertford Stan Warren
Mark Long Hertford High Hertford Greg Hogue
Douglas Miller Hollister Elementary Halifax Carla Amason
Carol Mizelle Bertie Middle Bertie Sandra Hardy
Sean Murphy South Johnston High Johnston Eddie Price
Tracey Neal South Warren Elem Warren Tony Cozart
Erin Swanson AB Combs Magnet Elem Wake Muriel T. Summers
Gonzalo Pitpit Bertie Middle School Bertie Sandra Hardy
Kim Scott Bearfield Primary Hertford Julie Shields
Ebony Spivey Jason Mariam Boyd Elem Warren Canecca Davis
Mae Rose Riverview Elementary Hertford Lori Morings
Erica Staine Shoulders Long Mill Elementary Franklin Kim Ferrell
Hope Walker Belmont Elementary Roanoke Rapids Kelvin Edwards
Yolanda Wiggins Hollister Elementary Halifax Carla D. Amason
Cecilya Williams Chaloner Middle Roanoke Rapids Thomas Davis
Christina Williams Central Elementary Northampton Catina Hoggard
Shelley Williams Hollister Elementary Halifax Carla D. Amason

North Carolina Leadership Academies: Final 2013 Report
March 2014
Consortium for Educational Research and Evaluation–North Carolina 60
Table E2. PTLA Cohort 1 Internship Placements
Name Internship Placement LEA Mentor Principal
Jamyle Acevedo Page High Guilford Marilyn Foley
Adrea Alexander Hunter Elementary Guilford Michelle Thompson
Michelle Breen Forest Park Elem Winston-Salem/Forsyth Constance Hash
Thomas Brookshire Atkins High Winston-Salem/Forsyth Joseph Childers
Jason Todd Cayton Wiley Elementary Guilford Dr. Shelia Gorham
Ronnie Christian Northwest Middle Winston-Salem/Forsyth Sharon Richardson
Amy Day Kiser Middle Guilford Sharon McCants
Melvin Diggs Graham Middle Alamance-Burlington Teresa Faucette
Cassandra Dobson Diggs-Latham Elem Winston-Salem/Forsyth Donna Cannon
Scarlet Evans North Hills Elem Winston-Salem/Forsyth Karen Morning-Cain
Keisha Gabriel Parkland High Winston-Salem/Forsyth Dr. Tim Lee
Shadonna Gunn Haw River Elem Alamance-Burlington Julie Jailall
Jusmar Maness Southern Middle Guilford Kevin Wheat
Charnelle Newkirk Oak Hill Elementary Guilford Patrice Faison
Ian Olsen Hill Magnet Middle Winston-Salem/Forsyth Ingrid Medlock
Stephanie Rakes Foust Elementary Guilford Merrie Conaway
Chameeka Smith Asheboro High Asheboro City Kemper Fitch
Ashley Triplett Vandalia Elementary Guilford Keisha McMillan
Weaver Walden Johnson St Global Guilford Trent Vernon
Cynthia White Jones Elementary Guilford Dr. Jake Henry
Hollis Wroblewski Grove Park Elem Alamance-Burlington Jennifer Reed
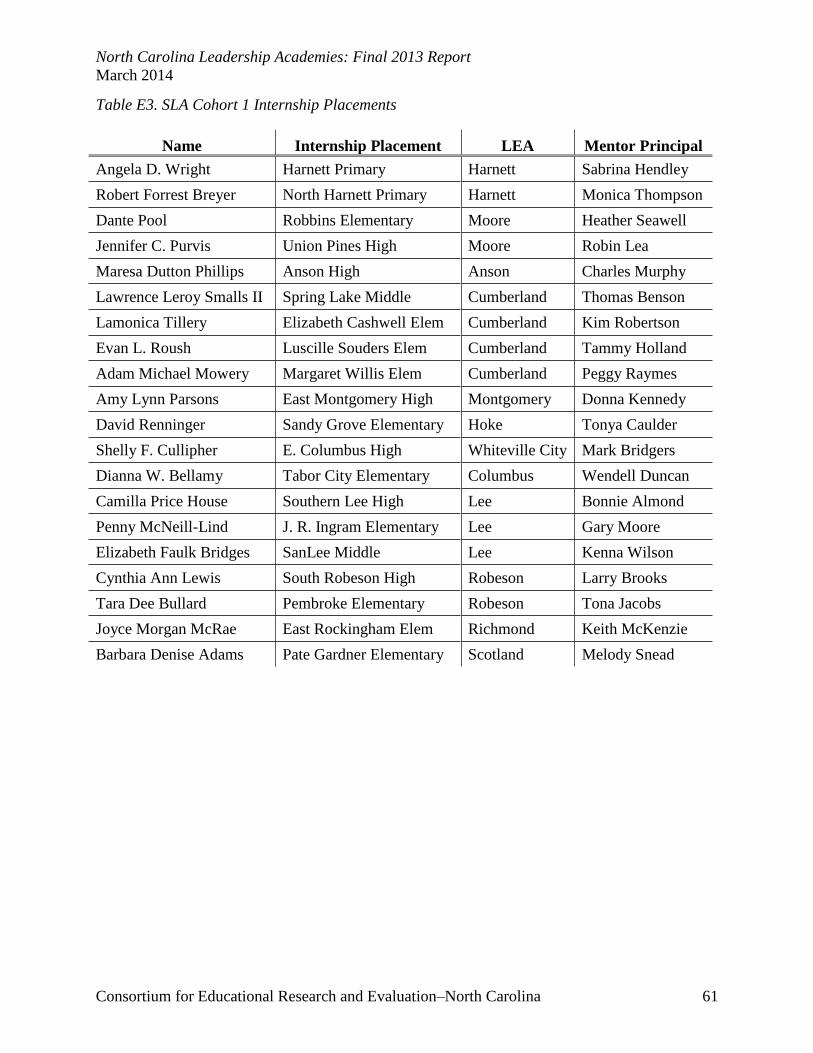
North Carolina Leadership Academies: Final 2013 Report
March 2014
Consortium for Educational Research and Evaluation–North Carolina 61
Table E3. SLA Cohort 1 Internship Placements
Name Internship Placement LEA Mentor Principal
Angela D. Wright Harnett Primary Harnett Sabrina Hendley
Robert Forrest Breyer North Harnett Primary Harnett Monica Thompson
Dante Pool Robbins Elementary Moore Heather Seawell
Jennifer C. Purvis Union Pines High Moore Robin Lea
Maresa Dutton Phillips Anson High Anson Charles Murphy
Lawrence Leroy Smalls II Spring Lake Middle Cumberland Thomas Benson
Lamonica Tillery Elizabeth Cashwell Elem Cumberland Kim Robertson
Evan L. Roush Luscille Souders Elem Cumberland Tammy Holland
Adam Michael Mowery Margaret Willis Elem Cumberland Peggy Raymes
Amy Lynn Parsons East Montgomery High Montgomery Donna Kennedy
David Renninger Sandy Grove Elementary Hoke Tonya Caulder
Shelly F. Cullipher E. Columbus High Whiteville City Mark Bridgers
Dianna W. Bellamy Tabor City Elementary Columbus Wendell Duncan
Camilla Price House Southern Lee High Lee Bonnie Almond
Penny McNeill-Lind J. R. Ingram Elementary Lee Gary Moore
Elizabeth Faulk Bridges SanLee Middle Lee Kenna Wilson
Cynthia Ann Lewis South Robeson High Robeson Larry Brooks
Tara Dee Bullard Pembroke Elementary Robeson Tona Jacobs
Joyce Morgan McRae East Rockingham Elem Richmond Keith McKenzie
Barbara Denise Adams Pate Gardner Elementary Scotland Melody Snead

North Carolina Leadership Academies: Final 2013 Report
March 2014
Consortium for Educational Research and Evaluation–North Carolina 62
Table E4. NELA Cohort 2 Internship Placements
Name Internship Placement LEA Mentor Principal
Amy Pearce Stocks Elementary Edgecombe Stephanie Alston
Vernedette Garland Winstead Avenue Elementary Nash/Rocky Mount Ella Batts
Kelly Shelton Mudd Southern Nash Middle Nash/Rocky Mount Carina Bryant
Tonya Little Riverside Middle Martin Ron Byrd
Kendrick Alston Coopers Elementary Nash/Rocky Mount Larry Catalano
Hugh Scott Southern Nash High Nash/Rocky Mount Mark Cockrell
Teicher Patterson Rocky Mount Senior High Halifax Leon Farrow
Lisa Pennington Long Mill Elementary Franklin Kim Ferrell
Jackson Olsen Zeb Vance Elementary Vance Anne Garrison
Kim Allison Wilton Elementary Granville Lauren Allen
Jennifer Lewis Baskerville Elementary Nash/Rocky Mount Ann Mitchell
Krista Fasioli Parker Middle Nash/Rocky Mount Anthony
Nottingham
Tim Mudd DS Johnson Elementary Nash/Rocky Mount Michelle Royster
Jennifer Berry Nashville Elementary Nash/Rocky Mount Margaret Sharpe
Zachary Marks Bailey Elementary Nash/Rocky Mount Amy Thornton
Erin Robbins JF Webb High Granville Calvin Timberlake
Angela Strother South Edgecombe Middle Edgecombe Michael Turner
Larry Hodgkins South Creek Middle Martin Jan Wagner
Darren Gemzik SouthWest Edgecombe High Edgecombe Marc Whichard
Elizabeth Payne Moran West Oxford Elementary Granville Melody Wilson
Lauren Greenhill Belmont Elementary Northampton Kevin Edwards

North Carolina Leadership Academies: Final 2013 Report
March 2014
Consortium for Educational Research and Evaluation–North Carolina 63
Table E5. PTLA Cohort 2 Internship Placements
Name Internship Placement LEA Mentor Principal
Kristen Gravely Williams High Alamance-Burlington Joe Ferrell
Thomas Kazimir Graham High Alamance-Burlington Charlotte Holmes
Dana Roseboro Eastlawn Elem Alamance-Burlington Whitney Oakley
Ben Cawley Montlieu Academy of
Technology Elem Guilford Gerald O’Donnell
Kevin Conaway Hairston Middle Guilford Rydell Harrison
Vernon Hall Ferndale Middle Guilford Angela Jackson
Darrell Harris Eastern Middle Guilford Sarah Matthews
Noel Keener Jones Elementary Guilford Dr. Jake Henry
Greta Martin Northeast Middle Guilford Karen Williams
Janiese McKenzie Mendenhall Middle Guilford Marshall Matson
Rashad Slade Johnson Street Guilford Trent Vernon
Chelsea Smith Ragsdale H Guilford Dr. Kathy Rogers
Toks Wall Southern Middle Guilford Kevin Wheat
Kimberly Ashby North Forsyth H Winston-Salem/Forsyth Rodney Bass
Kathy Bryant Konnoak E Winston-Salem/Forsyth Sheila Burnette
Johnathan Hegedus Griffith E Winston-Salem/Forsyth Debbie Hampton
Larnitha Hunter Ibraham E Winston-Salem/Forsyth Lee Koch
Nicole Kurtz Paisley Middle Winston-Salem/Forsyth Gary Cone
Susan Miller Middle Fork E Winston-Salem/Forsyth Donald Hampton
Colin Tribby Wiley Middle Winston-Salem/Forsyth Sean Galliard

North Carolina Leadership Academies: Final 2013 Report
March 2014
Consortium for Educational Research and Evaluation–North Carolina 64
Table E6. SLA Cohort 2 Internship Placements
Name Internship Placement LEA Mentor Principal
Elizabeth Cole Bladenboro Primary Bladen Deborah Guyton
Melissa Brewer B.T. Bullock Elementary Lee Pam Sutton
Lisa Hain J.R. Ingram Elementary Lee Gary Moore
Andrew Keller Southern Lee High Lee Bonnie Almond
Christy Bur-Sharpe SanLee Middle Lee Kenna Wilson
Matt Moore West Pine Middle Moore Candace Turk
Tracy Metcalf Elise Middle Moore Brenda Cassady
Katrina Fox Southern Pine Elementary Moore Marcy Cooper
Kelly Bullard Tabor City Elementary Columbus Wendell Duncan
Leslie Bailey West Hoke Middle Hoke Mary McCleod
Jennifer Spivey North Harnett Primary Harnett Monica Thompson
Pam Lewis Scotland High Scotland Beth Ammons
Matt McClean Elizabeth Cashwell Elem Cumberland Kim Robertson
Kisha Timber-Derr South View Middle Cumberland Terrence McAllister
Mike Picciano Doug Byrd High Cumberland Dan Krumanocker
Kristy West St. Pauls Elementary Robeson Robert Locklear
Anthony Barton Purnell Swett High Robeson Antonion Wilkins
Maxine Brown Rockingham Middle Richmond Pam Patterson
Jennifer Brach West Rockingham Elem Richmond Willette Surgeon
Joy Starlin Richmond Senior High Richmond Cory Satterfield

North Carolina Leadership Academies: Final 2013 Report
March 2014
Consortium for Educational Research and Evaluation–North Carolina 65
Table E7. NELA Cohort 3 Internship Placements
Name Internship Placement LEA Mentor Principal
Joey Briggs Roanoke Rapids High Roanoke Rapids Tammie Williams
Matt Smith SW Edgecombe High Egdecombe Marc Whichard
Tawanda Smallwood Bertie High Bertie Rickey Eley
Stephanie Cottle Bertie Middle Bertie William Peele
Chad Geary Chaloner Middle Roanoke Rapids Thomas Davis
Viola Gilbert Roanoke Valley Early
College Weldon City Chris Butler
Nafeesha Irby G.C. Hawley Middle Granville Frank Wiggins
Sophelia McMannen Wilton Elementary Granville Lauren Allen
Cindy Miller-Walker Youngsville Elementary Franklin Rick Smith
Michelle Mobley East End Elementary Martin Norris Parker
Allie Pearson Hertford Middle Hertford Vatara C. Slade
Karyn Pleasant Southeast Halifax High Halifax Martha Davis
Lauren Prudenti Tarboro High Egdecombe Michael Turner
Katie Row Windsor Elementary Bertie Mona Gilliam
Misty Rushing South Creek Middle Martin Jan Wagner
Karen Sharpe West Bertie Elementary Bertie Wesley Dudley
Melissa Strickland Manning Elementary Roanoke Rapids Michael Ferguson
Trena Sutton Mt. Energy Elementary Granville Julie Finch
Ronica Watford Bearfield Primary Hertford Julie Shields
Jennifer Wilker Warren New Tech High Warren Iris Castellon-
Dethmers

North Carolina Leadership Academies: Final 2013 Report
March 2014
Consortium for Educational Research and Evaluation–North Carolina 66
Table E8. PTLA Cohort 3 Internship Placements
Name Internship Placement LEA Mentor Principal
Melissa Allred North Asheboro
Middle Asheboro City Candace Call
Karen Anderson High Point Central
High Guilford Bob Christina
Aaron Bailey Hanes Magnet Winston-Salem/Forsyth Melita Wise
Clinton Baron Wiley Middle Winston-Salem/Forsyth Sean Gaillard
Adjoa Botwe-Rankin Allen Middle Guilford Dr. Shelia Gorham
Bennie Bradley Cone Elementary Guilford Chris Weikart
Curry E. Bryan, IV Graham Middle Alamance-Burlington Ronald Villines
Catherine Cecchini Hairston Middle Guilford Rydell Harrison
Tom Ehlers Montlieu Elementary Guilford Ged O’Donnell
Madison Hester Peeler Open
Elementary Guilford Mark Harris
Traci Horton Haw River Elementary Alamance-Burlington Jennifer Reed
Candace Hudson Hunter Elementary Guilford Michelle Thompson
Malinda Kerns Hall-Woodward Elem Winston-Salem/Forsyth Celena Tribby
Noelle Leslie Northeast High Guilford Fabby Wiliams
Duane Lewis Welborn Middle Guilford Naquita Brewington-
McCormick
Bobbie Lynch Walkertown Middle Winston-Salem/Forsyth Piper Hendrix
Barbara McRae Kiser Middle Guilford Sharon McCants
Yajaira Owens Loflin Elementary Asheboro City Paula Owens
Teresa Rose Kernersville
Elementary Winston-Salem/Forsyth Becky Carter
Christopher Scott Dudley High Guilford Jesse Pratt
Michelle Varoutsos Old Town Elementary Winston-Salem/Forsyth Rusty Hall
Ashley
Westmoreland Hillcrest Elementary Alamance-Burlington Julie Bethea

North Carolina Leadership Academies: Final 2013 Report
March 2014
Consortium for Educational Research and Evaluation–North Carolina 67
Table E9. SLA Cohort 3 Internship Placements
Name Internship Placement LEA Mentor Principal
Stephanie Norris Clarkton School of Discovery Bladen Stephanie Ensminger
Jimmy Price South Columbus High Columbus Eddie Beck
Rachel Smith Acme-Delco Elementary Columbus Janet Hedrick
Chad Barbour Elizabeth Cashwell Elem Cumberland Kim Robertson
Corine Warren Brentwood Elementary Cumberland Anne McFadyen
Grisel Cuadrado Highland Elementary Harnett Tina Miller
Kimberly Davis Highland Elementary Harnett Clara Clinton
Catherine Jones South Harnett Elementary Harnett Brian Graham
Chris Pearson Western Harnett High Harnett Stan Williams
Tonja McGill Sandy Grove Middle Hoke Erica Fortenberry
Angela Colvin Tramway Elementary Lee Anne Beal
Crystal Colwell Southern Lee High Lee Bonnie Almond
Wendy Perrell B. T. Bullock Elementary Lee Pam Sutton
Christopher Jonassen Montgomery County Montgomery Joan Frye
Julia Brown New Century Middle Moore Robin Calcutt
Clarkie Hussey Sandhills Farm Life Elem Moore Nora McNeill
Shaun Krencicki Union Pines High Moore Robin Lea
Jennifer Wiley Elise Middle Moore Seth Powers
Regina Hyde Peterson Elementary Robeson Kristen Stone
Kristi Maultsby Tabor City Elementary Whiteville City Wendell Duncan
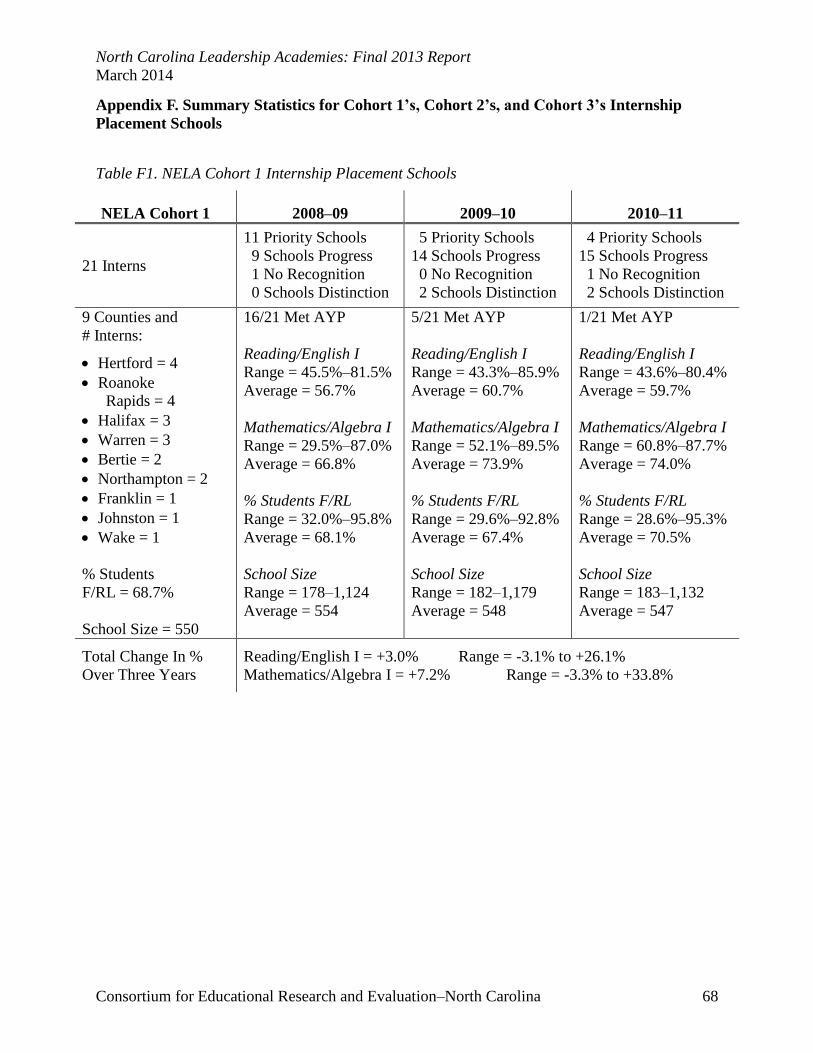
North Carolina Leadership Academies: Final 2013 Report
March 2014
Consortium for Educational Research and Evaluation–North Carolina 68
Appendix F. Summary Statistics for Cohort 1’s, Cohort 2’s, and Cohort 3’s Internship
Placement Schools
Table F1. NELA Cohort 1 Internship Placement Schools
NELA Cohort 1 2008–09 2009–10 2010–11
21 Interns
11 Priority Schools
9 Schools Progress
1 No Recognition
0 Schools Distinction
5 Priority Schools
14 Schools Progress
0 No Recognition
2 Schools Distinction
4 Priority Schools
15 Schools Progress
1 No Recognition
2 Schools Distinction
9 Counties and
# Interns:
Hertford = 4
Roanoke
Rapids = 4
Halifax = 3
Warren = 3
Bertie = 2
Northampton = 2
Franklin = 1
Johnston = 1
Wake = 1
% Students
F/RL = 68.7%
School Size = 550
16/21 Met AYP
Reading/English I
Range = 45.5%–81.5%
Average = 56.7%
Mathematics/Algebra I
Range = 29.5%–87.0%
Average = 66.8%
% Students F/RL
Range = 32.0%–95.8%
Average = 68.1%
School Size
Range = 178–1,124
Average = 554
5/21 Met AYP
Reading/English I
Range = 43.3%–85.9%
Average = 60.7%
Mathematics/Algebra I
Range = 52.1%–89.5%
Average = 73.9%
% Students F/RL
Range = 29.6%–92.8%
Average = 67.4%
School Size
Range = 182–1,179
Average = 548
1/21 Met AYP
Reading/English I
Range = 43.6%–80.4%
Average = 59.7%
Mathematics/Algebra I
Range = 60.8%–87.7%
Average = 74.0%
% Students F/RL
Range = 28.6%–95.3%
Average = 70.5%
School Size
Range = 183–1,132
Average = 547
Total Change In %
Over Three Years
Reading/English I = +3.0% Range = -3.1% to +26.1%
Mathematics/Algebra I = +7.2% Range = -3.3% to +33.8%
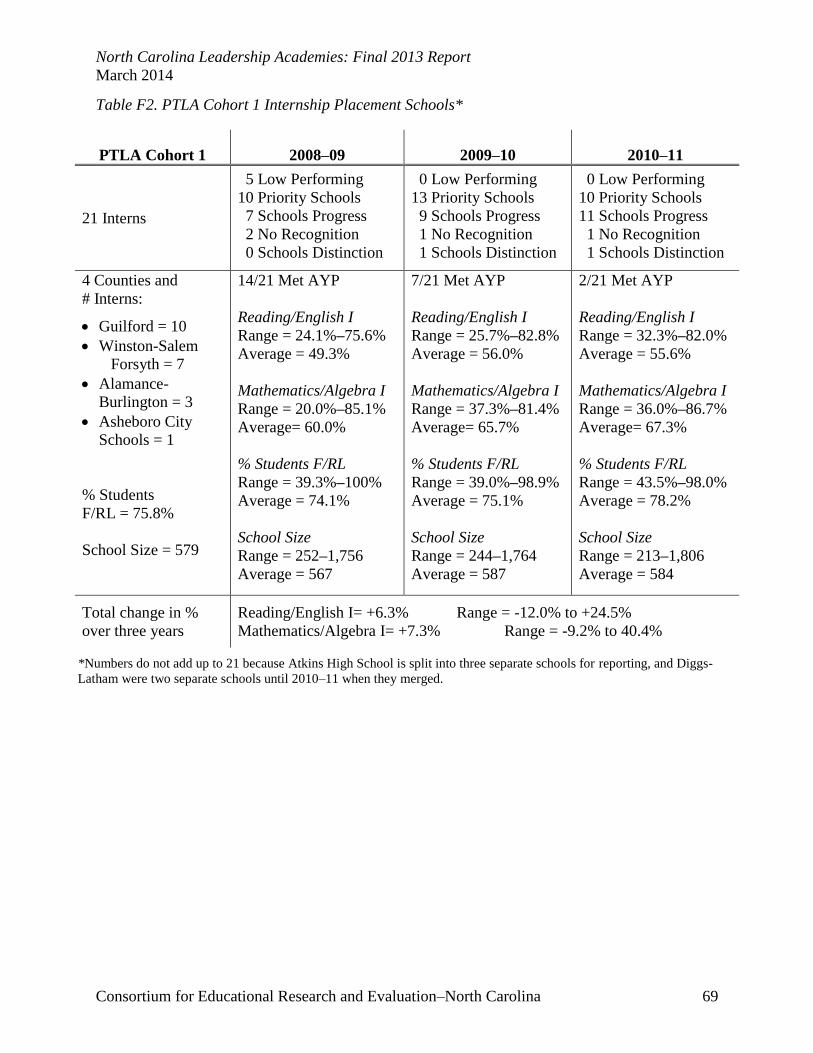
North Carolina Leadership Academies: Final 2013 Report
March 2014
Consortium for Educational Research and Evaluation–North Carolina 69
Table F2. PTLA Cohort 1 Internship Placement Schools*
PTLA Cohort 1 2008–09 2009–10 2010–11
21 Interns
5 Low Performing
10 Priority Schools
7 Schools Progress
2 No Recognition
0 Schools Distinction
0 Low Performing
13 Priority Schools
9 Schools Progress
1 No Recognition
1 Schools Distinction
0 Low Performing
10 Priority Schools
11 Schools Progress
1 No Recognition
1 Schools Distinction
4 Counties and
# Interns:
Guilford = 10
Winston-Salem
Forsyth = 7
Alamance-
Burlington = 3
Asheboro City
Schools = 1
% Students
F/RL = 75.8%
School Size = 579
14/21 Met AYP
Reading/English I
Range = 24.1%–75.6%
Average = 49.3%
Mathematics/Algebra I
Range = 20.0%–85.1%
Average= 60.0%
% Students F/RL
Range = 39.3%–100%
Average = 74.1%
School Size
Range = 252–1,756
Average = 567
7/21 Met AYP
Reading/English I
Range = 25.7%–82.8%
Average = 56.0%
Mathematics/Algebra I
Range = 37.3%–81.4%
Average= 65.7%
% Students F/RL
Range = 39.0%–98.9%
Average = 75.1%
School Size
Range = 244–1,764
Average = 587
2/21 Met AYP
Reading/English I
Range = 32.3%–82.0%
Average = 55.6%
Mathematics/Algebra I
Range = 36.0%–86.7%
Average= 67.3%
% Students F/RL
Range = 43.5%–98.0%
Average = 78.2%
School Size
Range = 213–1,806
Average = 584
Total change in %
over three years
Reading/English I= +6.3% Range = -12.0% to +24.5%
Mathematics/Algebra I= +7.3% Range = -9.2% to 40.4%
*Numbers do not add up to 21 because Atkins High School is split into three separate schools for reporting, and Diggs-
Latham were two separate schools until 2010–11 when they merged.

North Carolina Leadership Academies: Final 2013 Report
March 2014
Consortium for Educational Research and Evaluation–North Carolina 70
Table F3. SLA Cohort 1 Internship Placement Schools*
SLA Cohort 1 2008–09 2009–10 2010–11
20 Interns
2 Low Performing
3 Priority Schools
13 Schools Progress
1 No Recognition
0 Schools Distinction
1 Low Performing
3 Priority Schools
12 Schools Progress
1 No Recognition
2 Schools Distinction
1 Low Performing
2 Priority Schools
12 Schools Progress
3 No Recognition
2 Schools Distinction
12 Counties and
# Interns:
Harnett = 2
Moore = 2
Anson = 1
Cumberland = 4
Montgomery = 1
Hoke = 1
Whiteville City = 1
Columbus = 1
Lee = 3
Robeson = 2
Richmond = 1
Scotland = 1
% Students
F/RL = 68.5%
School Size = 615
11/19 Met AYP
Reading/English I
Range = 41.0%–71.7%
Average = 58.3%
Mathematics/Algebra I
Range = 33.9%–85.6%
Average = 68.9%
% Students F/RL
Range = 26.8%–87.8%
Average = 66.5%
School Size
Range = 186–1,162
Average = 638
8/19 Met AYP
Reading/English I
Range = 48.9%–83.9%
Average = 64.2%
Mathematics/Algebra I
Range = 26.1%–90.5%
Average = 72.1%
% Students F/RL
Range = 30.8%–91.9%
Average = 68.2%
School Size
Range = 160–1,174
Average = 607
3/20 Met AYP
Reading/English I
Range = 43.6%–88.5%
Average = 64.6%
Mathematics/Algebra I
Range = 22.1%–86.9%
Average = 70.1%
% Students F/RL
Range = 35.1%–88.2%
Average = 70.9%
School Size
Range = 159–1,181
Average = 600
Total change in %
over three years
Reading/English I= +6.3% Range = -12.2% to +18.9%
Mathematics/Algebra I= +1.2% Range = -21.0% to +25.8%
*Numbers do not add up to 20 because East Rockingham Elementary did not open until the 2010–11 school year;
also, North Harnett Primary does not have test score data after 2009 because it moved to K–2.

North Carolina Leadership Academies: Final 2013 Report
March 2014
Consortium for Educational Research and Evaluation–North Carolina 71
Table F4. NELA Cohort 2 Internship Placement Schools*
*Numbers do not add up to 21 because Winstead Avenue Elementary School is K–2 and does not have data and
Riverside Middle School just opened.
**Halifax, Warren, Bertie, Northampton, and Hertford Counties all had Interns before but do not now.
NELA Cohort 2 2008–09 2009–10 2010–11
21 Interns
1 Low Performing
3 Priority Schools
11 Schools Progress
3 No Recognition
1 School of Distinction
0 Low Performing
3 Priority Schools
11 Schools Progress
4 No Recognition
1 School of Distinction
0 Low Performing
2 Priority Schools
12 Schools Progress
2 No Recognition
3 School of Distinction
7 Counties and
# schools of hire:**
Roanoke
Rapids = 1
Franklin = 1
Nash = 10
Edgecombe=3
Granville= 3
Vance= 1
Martin = 2
% Students
F/RL = 60.2%
School Size = 668
14/19 Met AYP
Reading/English I
Range = 21.10%–
74.80%
Average = 61.05%
Mathematics/Algebra I
Range = 46.70%–
89.40%
Average = 71.65%
% Students F/RL
Range = 23.90%–
97.06%
Average = 55.92%
School Size
Range= 262 to 1,180
Average = 674.50
6/19 Met AYP
Reading/English I
Range = 37.40%–
77.30%
Average = 63.09%
Mathematics/Algebra I
Range = 46.30%–
92.40%
Average = 74.34%
% Students F/RL
Range = 33.33%–
99.75%
Average = 59.70%
School Size
Range = 256 to 1,184
Average = 667.25
2/19 Met AYP
Reading/English I
Range = 44.40%–
79.30%
Average = 64.78%
Mathematics/Algebra I
Range = 39.90%–
90.50%
Average = 74.80%
% Students F/RL
Range = 40.23%–
96.27%
Average = 65.03%
School Size
Range = 355 to 1,231
Average = 663.70
Total change in %
over three years
Reading/English I = +3.74% Range = -2.4% to +12.9%
Mathematics/Algebra I = +3.15% Range = -8.1% to +16.3%

North Carolina Leadership Academies: Final 2013 Report
March 2014
Consortium for Educational Research and Evaluation–North Carolina 72
Table F5. PTLA Cohort 2 Internship Placement Schools
PTLA Cohort 2 2008–09 2009–10 2010–11
20 Interns
4 Low Performing
4 Priority Schools
9 Schools Progress
3 No Recognition
0 School of Distinction
0 Low Performing
5 Priority Schools
11 Schools Progress
2 No Recognition
2 School of Distinction
0 Low Performing
5 Priority Schools
13 Schools Progress
1 No Recognition
1 School Distinction
4 Counties and
# Interns:
Guilford = 10
Winston-Salem
Forsyth = 7
Alamance-
Burlington = 3
% Students
F/RL = 66.6%
School Size = 739
10/20 Met AYP
Reading/English I
Range = 33.50%–
75.60%
Average = 56.16%
Mathematics/Algebra I
Range = 25.40%–
85.10%
Average = 63.37%
% Students F/RL
Range = 30.60%–
92.94%
Average = 64.06%
School Size
Range = 363 to 1,469
Average = 746.25
3/20 Met AYP
Reading/English I
Range = 38.80%–
81.30%
Average = 60.47%
Mathematics/Algebra I
Range = 40.00%–
87.00%
Average = 69.82%
% Students F/RL
Range = 31.30%–
97.30%
Average = 65.71%
School Size
Range = 343 to 1,386
Average = 728.95
1/20 Met AYP
Reading/English I
Range = 42.50%–
82.00%
Average = 60.95%
Mathematics/Algebra I
Range = 54.10%–
81.90%
Average = 71.14%
% Students F/RL
Range = 40.53%–
93.36%
Average = 69.91%
School Size
Range = 347 to 1,365
Average = 726.40
Total change in %
over three years
Reading/English I = +4.79% Range = -4.2% to +17.3%
Mathematics/Algebra I = +7.77% Range = -8.2% to +50.0%

North Carolina Leadership Academies: Final 2013 Report
March 2014
Consortium for Educational Research and Evaluation–North Carolina 73
Table F6. SLA Cohort 2 Internship Placement Schools*
SLA Cohort 2 2008–09 2009–10 2010–11
21 Interns
1 Low Performing
6 Priority Schools
11 Schools Progress
2 No Recognition
0 School of Distinction
1 Honor School of
Excellence
0 Low Performing
4 Priority Schools
13 Schools Progress
1 No Recognition
1 School of Distinction
1 Honor School of
Excellence
0 Low Performing
2 Priority Schools
12 Schools Progress
3 No Recognition
2 Schools Distinction
1 Honor School of
Excellence
10 Counties and
# Interns:
Bladen = 1
Harnett = 1
Moore = 4
Cumberland = 3
Hoke = 1
Columbus =1
Lee = 4
Robeson = 2
Richmond = 3
Scotland = 1
% Students
F/RL = 63.3%
School Size = 711
10/21 Met AYP
Reading/English I
Range = 30.00%–
85.90%
Average = 57.58%
Mathematics/Algebra I
Range = 8.70%–93.10%
Average = 63.46%
% Students F/RL
Range = 24.91%–
79.26%
Average = 61.36%
School Size
Range = 217 to 1,472
Average = 712.86
6/20 Met AYP
Reading/English I
Range = 10.00%–
87.50%
Average = 61.32%
Mathematics/Algebra I
Range = 25.00%–
93.70%
Average = 69.71%
% Students F/RL
Range = 25.00%–
84.69%
Average = 62.87%
School Size
Range = 205 to 1,619
Average = 703.45
0/20 Met AYP
Reading/English I**
Range = 53.30%–
86.80%
Average = 66.77%
Mathematics/Algebra
I
Range = 30.40 %–
92.40%
Average = 71.81%
% Students F/RL
Range = 24.30%–
85.23%
Average = 65.77%
School Size
Range = 210 to 1,615
Average = 716.68
Total change in %
over three years
Reading/English I = +9.19% Range = -1.9% to +51.3%
Mathematics/Algebra I = +8.35% Range = -2.9% to +38.2%
*Numbers do not add up to 21 because Scotland High School is split into two separate schools for reporting;
Southern Pines Primary School is K–2 so no test data, and North Harnett Primary School became K–2 in 2009–10
school year so no test data.
**Richmond County Senior High excluded from English analysis due to missing English scores for 2008–09 and
2009–10 school years.

North Carolina Leadership Academies: Final 2013 Report
March 2014
Consortium for Educational Research and Evaluation–North Carolina 74
Table F7. NELA Cohort 3 Internship Placement Schools
NELA Cohort 3 2009–10 2010–11 2011–12
20 Interns
4 Priority Schools
12 Schools of Progress
2 No Recognition
2 Schools Distinction
4 Priority Schools
9 Schools of Progress
2 No Recognition
4 Schools Distinction
1 Low Performing
4 Priority Schools
11 Schools of Progress
2 No Recognition
3 Schools Distinction
10 Counties and
# Interns:
Hertford = 2
Roanoke
Rapids = 3
Halifax = 1
Warren = 1
Bertie = 4
Edgecombe = 2
Franklin = 1
Granville = 3
Martin = 2
Weldon City = 1
% Students
F/RL = 62.5%
School Size = 520
11 Met AYP
Reading/English I
Range = 36.5%–80.5%
Average = 64.2%
Mathematics/Algebra I
Range = 20.7%–92.4%
Average = 71.5%
% Students F/RL
Range = 32.4%–89.8%
Average = 58.6%
School Size
Range = 64-931
Average = 526
3 Met AYP
Reading/English I
Range = 40%–80.6%
Average = 62.49%
Mathematics/Algebra I
Range = 6.3%–90.7%
Average = 69.2%
% Students F/RL
Range = 34.1%–92.2%
Average = 62.5%
School Size
Range = 112–914
Average = 530
7 Met AMO
(formerly AYP)
Reading/English I
Range = 44.4%–85.3%
Average = 66.7%
Mathematics/Algebra I
Range = 36.4%–94.1%
Average = 71.1%
% Students F/RL
Range = 30.8%–94.8%
Average = 66.3%
School Size
Range = 135–852
Average = 505
Total change in %
over three years
Reading/English I = +2.6% Range = -26.4% to + 26.5%
Mathematics/Algebra I = -0.4% Range = -26.2% to + 42.1%
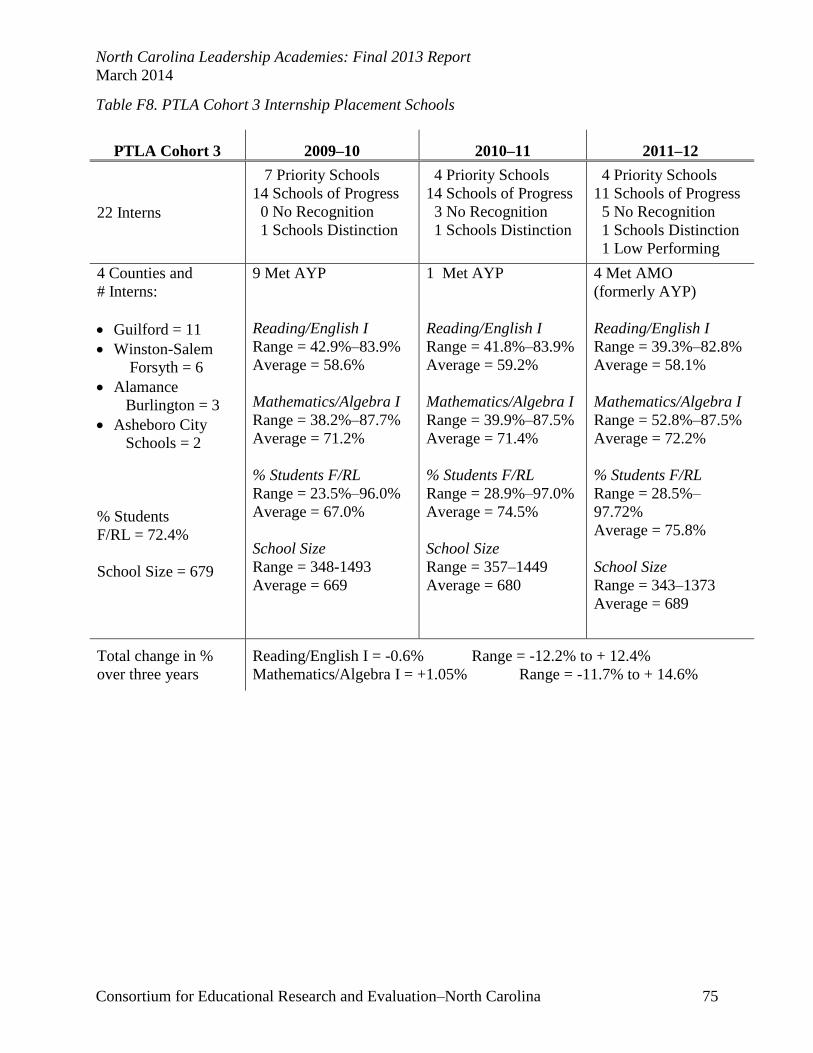
North Carolina Leadership Academies: Final 2013 Report
March 2014
Consortium for Educational Research and Evaluation–North Carolina 75
Table F8. PTLA Cohort 3 Internship Placement Schools
PTLA Cohort 3 2009–10 2010–11 2011–12
22 Interns
7 Priority Schools
14 Schools of Progress
0 No Recognition
1 Schools Distinction
4 Priority Schools
14 Schools of Progress
3 No Recognition
1 Schools Distinction
4 Priority Schools
11 Schools of Progress
5 No Recognition
1 Schools Distinction
1 Low Performing
4 Counties and
# Interns:
Guilford = 11
Winston-Salem
Forsyth = 6
Alamance
Burlington = 3
Asheboro City
Schools = 2
% Students
F/RL = 72.4%
School Size = 679
9 Met AYP
Reading/English I
Range = 42.9%–83.9%
Average = 58.6%
Mathematics/Algebra I
Range = 38.2%–87.7%
Average = 71.2%
% Students F/RL
Range = 23.5%–96.0%
Average = 67.0%
School Size
Range = 348-1493
Average = 669
1 Met AYP
Reading/English I
Range = 41.8%–83.9%
Average = 59.2%
Mathematics/Algebra I
Range = 39.9%–87.5%
Average = 71.4%
% Students F/RL
Range = 28.9%–97.0%
Average = 74.5%
School Size
Range = 357–1449
Average = 680
4 Met AMO
(formerly AYP)
Reading/English I
Range = 39.3%–82.8%
Average = 58.1%
Mathematics/Algebra I
Range = 52.8%–87.5%
Average = 72.2%
% Students F/RL
Range = 28.5%–
97.72%
Average = 75.8%
School Size
Range = 343–1373
Average = 689
Total change in %
over three years
Reading/English I = -0.6% Range = -12.2% to + 12.4%
Mathematics/Algebra I = +1.05% Range = -11.7% to + 14.6%

North Carolina Leadership Academies: Final 2013 Report
March 2014
Consortium for Educational Research and Evaluation–North Carolina 76
Table F9. SLA Cohort3 Internship Placement Schools*
SLA Cohort 3 2009–10 2010–11 2011–12
20 Interns
3 Priority Schools
9 Schools of Progress
2 No Recognition
5 Schools of Distinction
1 Priority Schools
6 Schools Progress
8 No Recognition
4 Schools of Distinction
1 Priority Schools
11 Schools Progress
4 No Recognition
2 Schools of Distinction
1 Honor School of
Excellence
9 Counties and
# Interns:
Bladen = 1
Harnett = 4
Moore = 4
Cumberland = 2
Hoke = 1
Columbus = 3
Lee = 3
Robeson = 1
Montgomery = 1
% Students
F/RL = 57.8%
School Size = 662
7 Met AYP
Reading/English I
Range = 48.8%–89.6%
Average = 67.9%
Mathematics/Algebra I
Range = 64.1%–94.8%
Average = 75.7%
% Students F/RL
Range = 24.0%–85.4%
Average = 56.9%
School Size
Range = 205–1348
Average = 669
1 Met AYP
Reading/English I
Range = 52.4%–88.5%
Average = 68.7%
Mathematics/Algebra I
Range = 65.6%–91.9%
Average = 76.4%
% Students F/RL
Range = 24.3%–91.1%
Average = 60.6%
School Size
Range = 210–1341
Average = 658
7 Met AMO
(formerly AYP)
Reading/English I
Range = 48.8%–93.5%
Average = 69.3%
Mathematics/Algebra I
Range = 57.4%–91.6%
Average = 78.6%
% Students F/RL
Range = 27.2%–92.8%
Average = 60.6%
School Size
Range = 209-1361
Average = 659
Total change in %
over three years
Reading/English I = +1.41% Range = -12.4% to + 8.6%
Mathematics/Algebra I = +3.0% Range = -9.4% to + 20.4%
*Numbers do not add up to two because Sandy Grove Middle is a new school in 2013-14, therefore has no data.

North Carolina Leadership Academies: Final 2013 Report
March 2014
Consortium for Educational Research and Evaluation–North Carolina 77
Appendix G. Raw Statistics for Cohort 1’s, Cohort 2’s, and Cohort 3’s Internship
Placement Schools
Cohort 1 Internships, 2008–2011
Table G1. RLA Cohort 1 Internships, NELA, Total Change in Percentages, 2008–2011
Name School of Placement LEA
Total Change in
Percentages
English I/ Reading
Algebra I/ Mathematics
Mark Barfield Northampton High School Northampton 26.10% 23.20%
Annabel Bello Belmont Elementary School Roanoke
Rapids 0.70% -0.50%
Melissa Harris
Richardson Roanoke Rapids High
School Roanoke
Rapids 7.30% 6.80%
Ryan Hurley Mariam Boyd Elementary
School Warren 4.20% 2.00%
DeMetra Lassiter Ahoskie Elementary School Hertford 5.90% 14.30%
Mark Long Hertford High School Hertford 5.20% 33.80%
Douglas Miller Hollister Elementary School Halifax -1.90% 4.00%
Carol Mizelle Bertie Middle School Bertie 0.90% 7.80%
Sean Murphy South Johnston High School Johnston -1.80% 1.50%
Tracey Neal South Warren Elementary
School Warren 2.90% 19.80%
Erin Swanson AB Combs Magnet
Elementary School Wake 2.60% 0.00%
Gonzalo Pitpit Bertie Middle School Bertie 0.90% 7.80%
Kim Scott Bearfield Primary School Hertford 5.10% 11.40%
Ebony Spivey
Jason Mariam Boyd Elementary
School Warren 4.20% 2.00%
Mae Rose Riverview Elementary
School Hertford -1.90% 2.50%
Erica Staine
Shoulders Long Mill Elementary
School Franklin 4.10% 4.30%
Hope Walker Belmont Elementary School Roanoke
Rapids 0.70% -0.50%
Yolanda Wiggins Hollister Elementary School Halifax -1.90% 4.00%
Cecilya Williams Chaloner Middle School Roanoke
Rapids 4.80% 6.80%
Christina Williams Central Elementary School Northampton -3.10% -3.30%
Shelley Williams Hollister Elementary School Halifax -1.90% 4.00%

North Carolina Leadership Academies: Final 2013 Report
March 2014
Consortium for Educational Research and Evaluation–North Carolina 78
Table G2. RLA Cohort 1 Internships, PTLA, Total Change in Percentages, 2008–2011
Name School of Placement LEA
Total Change in
Percentages
English I/ Reading
Algebra I/ Mathematics
Jamyle Acevedo
(“Kathy”) Page High School GCS 10.90% 12.00%
Adrea Alexander Hunter Elementary School GCS 24.50% 20.70%
Michelle Breen Forest Park Elementary School WSFC 8.70% 13.50%
Thomas Brookshire
(“Jeff”)
Atkins High School— Computer Technology
WSFC
13.20% 4.00%
Atkins High School— Pre-Engineering
2.60% -5.40%
Atkins High School— Biotechnology
16.90% 22.20%
Jason Cayton (“Todd”) Wiley Elementary School GCS 9.50% 16.30%
Ronnie Christian Northwest Middle School WSFC 0.20% 5.00%
Amy Day Kiser Middle School GCS 2.90% 0.30%
Melvin Diggs Graham Middle School ABS 1.90% 0.80%
Cassandra Dobson
Diggs-Latham Elementary
School—Diggs* WSFC
0.50% 5.90%
Diggs-Latham Elementary
School—Latham* 2.20% 3.40%
Scarlet Evans North Hills Elementary School WSFC 8.60% 8.80%
Keisha Gabriel Parkland High School WSFC 11.00% 27.00%
Shadonna Gunn Haw River Elementary School ABS 4.50% 3.10%
Jusmar Maness Southern Middle School GCS 2.90% 3.30%
Charnelle Newkirk Oak Hill Elementary School GCS 23.70% 40.40%
Ian Olsen Hill Magnet Middle School WSFC -5.30% 2.00%
Stephanie Rakes Foust Elementary School GCS 9.40% 6.00%
Chameeka Smith Asheboro High School ACS -0.30% -9.20%
Ashley Triplett Vandalia Elementary School GCS 14.50% 5.20%
Weaver Walden Johnson Street Global Studies GCS -2.10% 5.90%
Cynthia White Jones Elementary School GCS -3.80% -4.10%
Hollis Wroblewski
(“Holly”) Grove Park Elementary School ABS -12.00% -2.80%
*Diggs and Latham were separate schools; merged for the 2010–11 school year.
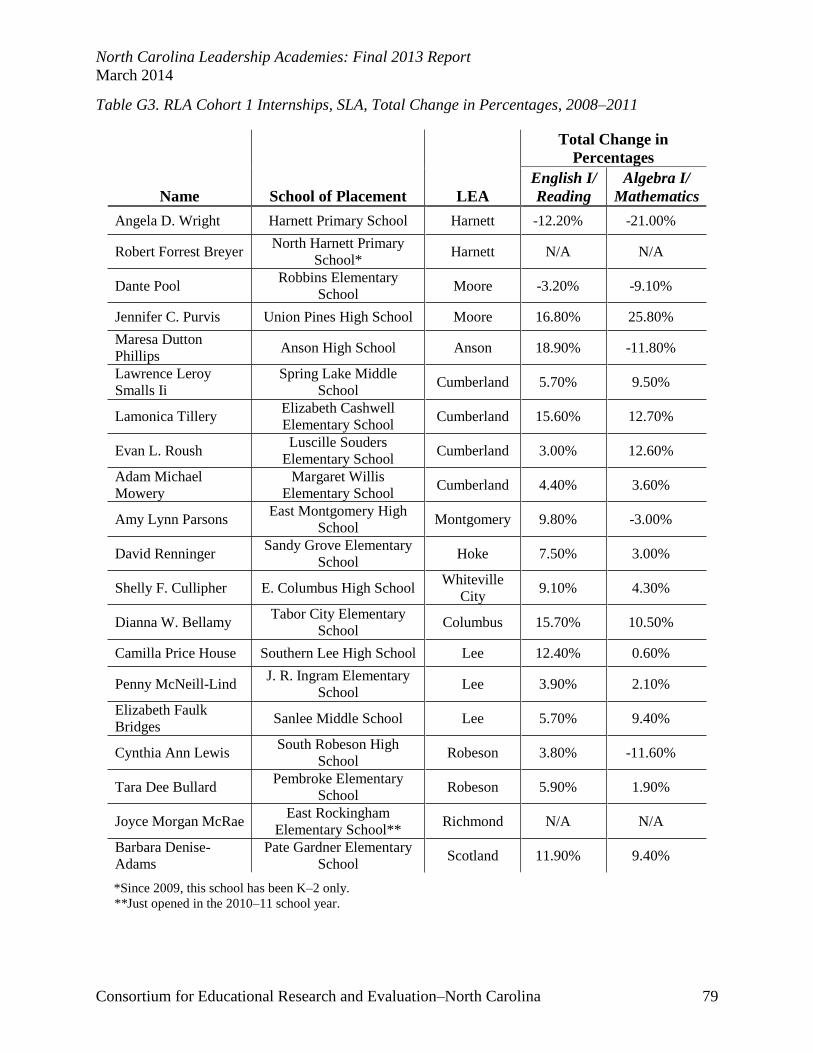
North Carolina Leadership Academies: Final 2013 Report
March 2014
Consortium for Educational Research and Evaluation–North Carolina 79
Table G3. RLA Cohort 1 Internships, SLA, Total Change in Percentages, 2008–2011
Name School of Placement LEA
Total Change in
Percentages
English I/
Reading
Algebra I/
Mathematics
Angela D. Wright Harnett Primary School Harnett -12.20% -21.00%
Robert Forrest Breyer North Harnett Primary
School* Harnett N/A N/A
Dante Pool Robbins Elementary
School Moore -3.20% -9.10%
Jennifer C. Purvis Union Pines High School Moore 16.80% 25.80%
Maresa Dutton
Phillips Anson High School Anson 18.90% -11.80%
Lawrence Leroy
Smalls Ii Spring Lake Middle
School Cumberland 5.70% 9.50%
Lamonica Tillery Elizabeth Cashwell
Elementary School Cumberland 15.60% 12.70%
Evan L. Roush Luscille Souders
Elementary School Cumberland 3.00% 12.60%
Adam Michael
Mowery Margaret Willis
Elementary School Cumberland 4.40% 3.60%
Amy Lynn Parsons East Montgomery High
School Montgomery 9.80% -3.00%
David Renninger Sandy Grove Elementary
School Hoke 7.50% 3.00%
Shelly F. Cullipher E. Columbus High School Whiteville
City 9.10% 4.30%
Dianna W. Bellamy Tabor City Elementary
School Columbus 15.70% 10.50%
Camilla Price House Southern Lee High School Lee 12.40% 0.60%
Penny McNeill-Lind J. R. Ingram Elementary
School Lee 3.90% 2.10%
Elizabeth Faulk
Bridges Sanlee Middle School Lee 5.70% 9.40%
Cynthia Ann Lewis South Robeson High
School Robeson 3.80% -11.60%
Tara Dee Bullard Pembroke Elementary
School Robeson 5.90% 1.90%
Joyce Morgan McRae East Rockingham
Elementary School** Richmond N/A N/A
Barbara Denise-
Adams Pate Gardner Elementary
School Scotland 11.90% 9.40%
*Since 2009, this school has been K–2 only.
**Just opened in the 2010–11 school year.

North Carolina Leadership Academies: Final 2013 Report
March 2014
Consortium for Educational Research and Evaluation–North Carolina 80
Table G4. RLA Cohort 1 Internships, NELA, 2008–09 School Data
School of
Placement English I/ Reading
Algebra
I/ Math-
ematics Designation AYP
Percentage
of Low-
Income
Students School
Size
Northampton High
School 53.20% 48.20% Priority School
Not Met
(6 of 13 Targets Met) 64.50% 451
Belmont
Elementary School 61.50% 78.60% School of Progress Met 19 of 19 Targets 59.00% 782
Roanoke Rapids
High School 73.10% 55.40% No Recognition
Not Met
(11 of 15 Targets Met) 32.60% 833
Mariam Boyd
Elementary School 55.90% 69.10% School of Progress Met 13 of 13 Targets 92.40% 367
Ahoskie
Elementary School 53.10% 64.00% Priority School Met 21 of 21 Targets 73.60% 480
Hertford High
School 62.10% 29.50% Priority School
Not Met
(9 of 15 Targets Met) 64.20% 900
Hollister
Elementary School 45.50% 62.70% Priority School Met 17 of 17 Targets 72.80% 234
Bertie Middle
School 46.70% 72.50% Priority School Met 21 of 21 Targets 80.10% 710
South Johnston
High School 81.50% 71.90% School of Progress
Not Met
(12 of 17 Targets Met) 32.00% 1124
South Warren
Elementary School 45.50% 57.60% Priority School Met 13 of 13 Targets 94.90% 188
AB Combs Magnet
Elementary School 73.10% 87.00% School of Progress Met 29 of 29 Targets 36.80% 828
Bertie Middle
School 46.70% 72.50% Priority School Met 21 of 21 Targets 80.10% 710
Bearfield Primary
School 47.50% 63.90% Priority School Met 15 of 15 Targets 90.40% 744
Mariam Boyd
Elementary School 55.90% 69.10% School of Progress Met 13 of 13 Targets 92.40% 367
Riverview
Elementary School 45.50% 58.30% Priority School
Not Met
(15 of 17 Targets Met) 95.80% 441
Long Mill
Elementary School 69.30% 82.40% School of Progress Met 17 of 17 Targets 40.70% 447
Belmont
Elementary School 61.50% 78.60% School of Progress Met 19 of 19 Targets 59.00% 782
Hollister
Elementary School 45.50% 62.70% Priority School Met 17 of 17 Targets 72.80% 234
Chaloner Middle
School 62.70% 80.90% School of Progress Met 21 of 21 Targets 48.40% 607
Central Elementary
School 58.60% 74.70% School of Progress Met 13 of 13 Targets 74.60% 178
Hollister
Elementary School 45.50% 62.70% Priority School Met 17 of 17 Targets 72.80% 234
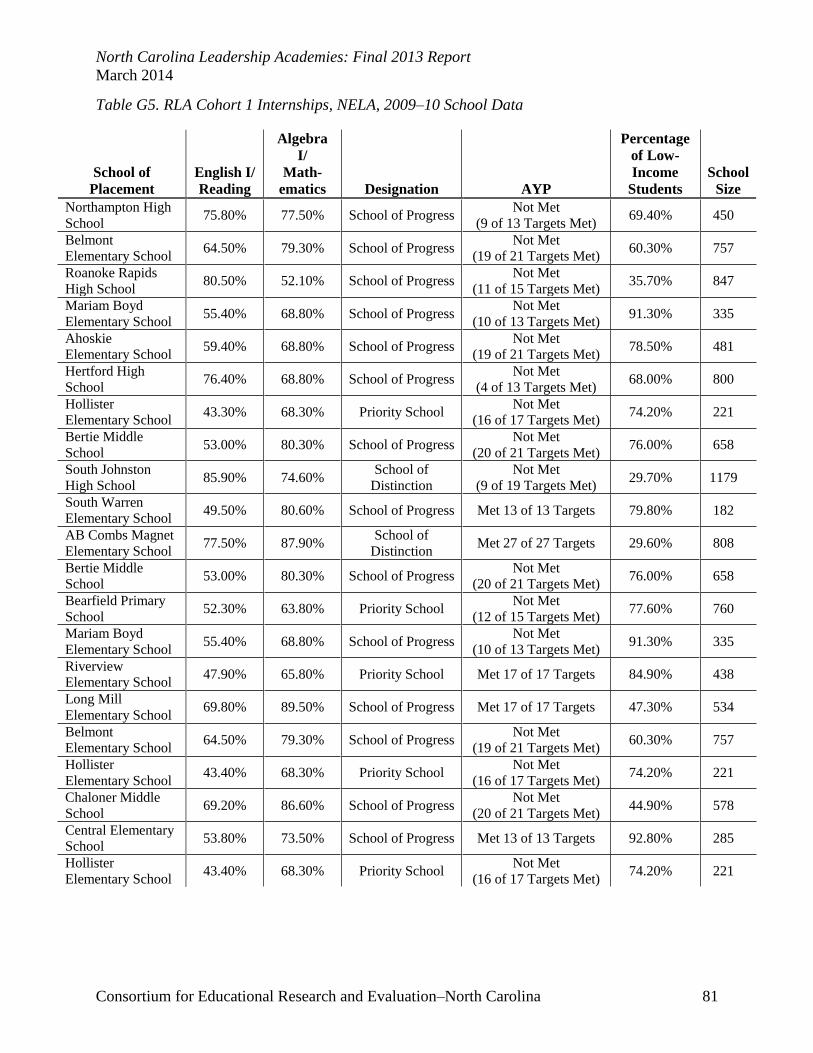
North Carolina Leadership Academies: Final 2013 Report
March 2014
Consortium for Educational Research and Evaluation–North Carolina 81
Table G5. RLA Cohort 1 Internships, NELA, 2009–10 School Data
School of
Placement English I/ Reading
Algebra
I/ Math-
ematics Designation AYP
Percentage
of Low-
Income
Students School
Size
Northampton High
School 75.80% 77.50% School of Progress
Not Met
(9 of 13 Targets Met) 69.40% 450
Belmont
Elementary School 64.50% 79.30% School of Progress
Not Met
(19 of 21 Targets Met) 60.30% 757
Roanoke Rapids
High School 80.50% 52.10% School of Progress
Not Met
(11 of 15 Targets Met) 35.70% 847
Mariam Boyd
Elementary School 55.40% 68.80% School of Progress
Not Met
(10 of 13 Targets Met) 91.30% 335
Ahoskie
Elementary School 59.40% 68.80% School of Progress
Not Met
(19 of 21 Targets Met) 78.50% 481
Hertford High
School 76.40% 68.80% School of Progress
Not Met
(4 of 13 Targets Met) 68.00% 800
Hollister
Elementary School 43.30% 68.30% Priority School
Not Met
(16 of 17 Targets Met) 74.20% 221
Bertie Middle
School 53.00% 80.30% School of Progress
Not Met
(20 of 21 Targets Met) 76.00% 658
South Johnston
High School 85.90% 74.60%
School of
Distinction
Not Met
(9 of 19 Targets Met) 29.70% 1179
South Warren
Elementary School 49.50% 80.60% School of Progress Met 13 of 13 Targets 79.80% 182
AB Combs Magnet
Elementary School 77.50% 87.90%
School of
Distinction Met 27 of 27 Targets 29.60% 808
Bertie Middle
School 53.00% 80.30% School of Progress
Not Met
(20 of 21 Targets Met) 76.00% 658
Bearfield Primary
School 52.30% 63.80% Priority School
Not Met
(12 of 15 Targets Met) 77.60% 760
Mariam Boyd
Elementary School 55.40% 68.80% School of Progress
Not Met
(10 of 13 Targets Met) 91.30% 335
Riverview
Elementary School 47.90% 65.80% Priority School Met 17 of 17 Targets 84.90% 438
Long Mill
Elementary School 69.80% 89.50% School of Progress Met 17 of 17 Targets 47.30% 534
Belmont
Elementary School 64.50% 79.30% School of Progress
Not Met
(19 of 21 Targets Met) 60.30% 757
Hollister
Elementary School 43.40% 68.30% Priority School
Not Met
(16 of 17 Targets Met) 74.20% 221
Chaloner Middle
School 69.20% 86.60% School of Progress
Not Met
(20 of 21 Targets Met) 44.90% 578
Central Elementary
School 53.80% 73.50% School of Progress Met 13 of 13 Targets 92.80% 285
Hollister
Elementary School 43.40% 68.30% Priority School
Not Met
(16 of 17 Targets Met) 74.20% 221
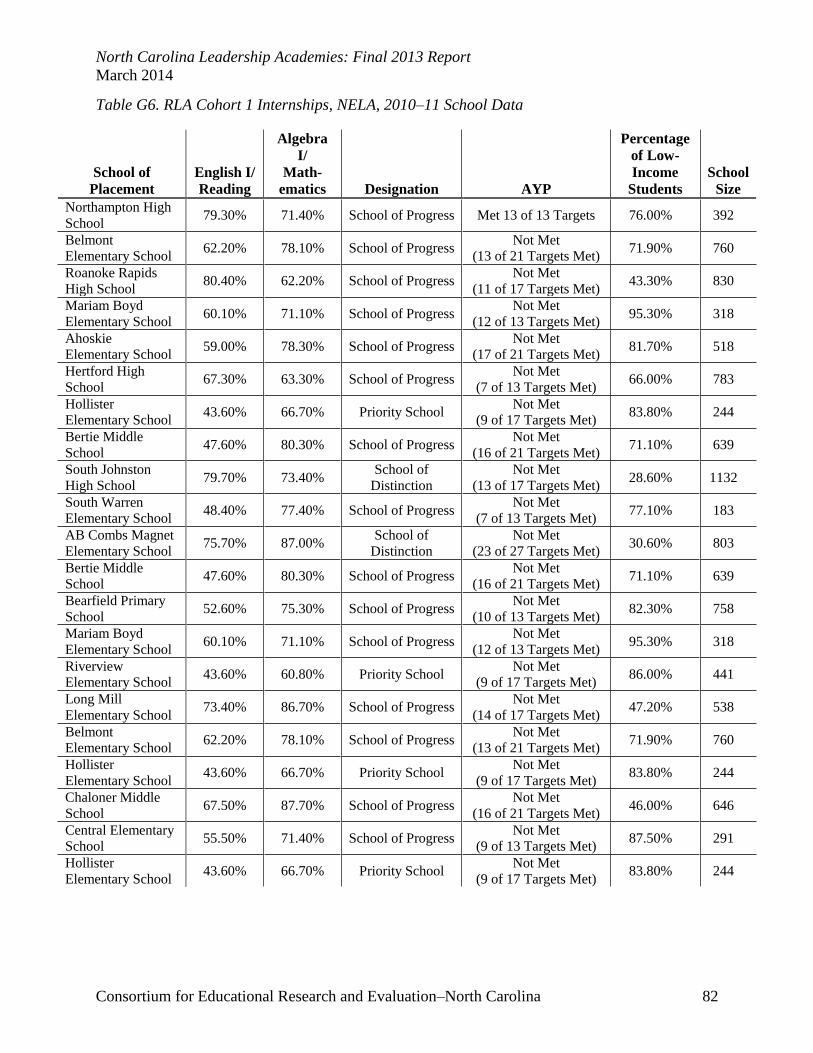
North Carolina Leadership Academies: Final 2013 Report
March 2014
Consortium for Educational Research and Evaluation–North Carolina 82
Table G6. RLA Cohort 1 Internships, NELA, 2010–11 School Data
School of
Placement English I/ Reading
Algebra
I/ Math-
ematics Designation AYP
Percentage
of Low-
Income
Students School
Size
Northampton High
School 79.30% 71.40% School of Progress Met 13 of 13 Targets 76.00% 392
Belmont
Elementary School 62.20% 78.10% School of Progress
Not Met
(13 of 21 Targets Met) 71.90% 760
Roanoke Rapids
High School 80.40% 62.20% School of Progress
Not Met
(11 of 17 Targets Met) 43.30% 830
Mariam Boyd
Elementary School 60.10% 71.10% School of Progress
Not Met
(12 of 13 Targets Met) 95.30% 318
Ahoskie
Elementary School 59.00% 78.30% School of Progress
Not Met
(17 of 21 Targets Met) 81.70% 518
Hertford High
School 67.30% 63.30% School of Progress
Not Met
(7 of 13 Targets Met) 66.00% 783
Hollister
Elementary School 43.60% 66.70% Priority School
Not Met
(9 of 17 Targets Met) 83.80% 244
Bertie Middle
School 47.60% 80.30% School of Progress
Not Met
(16 of 21 Targets Met) 71.10% 639
South Johnston
High School 79.70% 73.40%
School of
Distinction
Not Met
(13 of 17 Targets Met) 28.60% 1132
South Warren
Elementary School 48.40% 77.40% School of Progress
Not Met
(7 of 13 Targets Met) 77.10% 183
AB Combs Magnet
Elementary School 75.70% 87.00%
School of
Distinction
Not Met
(23 of 27 Targets Met) 30.60% 803
Bertie Middle
School 47.60% 80.30% School of Progress
Not Met
(16 of 21 Targets Met) 71.10% 639
Bearfield Primary
School 52.60% 75.30% School of Progress
Not Met
(10 of 13 Targets Met) 82.30% 758
Mariam Boyd
Elementary School 60.10% 71.10% School of Progress
Not Met
(12 of 13 Targets Met) 95.30% 318
Riverview
Elementary School 43.60% 60.80% Priority School
Not Met
(9 of 17 Targets Met) 86.00% 441
Long Mill
Elementary School 73.40% 86.70% School of Progress
Not Met
(14 of 17 Targets Met) 47.20% 538
Belmont
Elementary School 62.20% 78.10% School of Progress
Not Met
(13 of 21 Targets Met) 71.90% 760
Hollister
Elementary School 43.60% 66.70% Priority School
Not Met
(9 of 17 Targets Met) 83.80% 244
Chaloner Middle
School 67.50% 87.70% School of Progress
Not Met
(16 of 21 Targets Met) 46.00% 646
Central Elementary
School 55.50% 71.40% School of Progress
Not Met
(9 of 13 Targets Met) 87.50% 291
Hollister
Elementary School 43.60% 66.70% Priority School
Not Met
(9 of 17 Targets Met) 83.80% 244
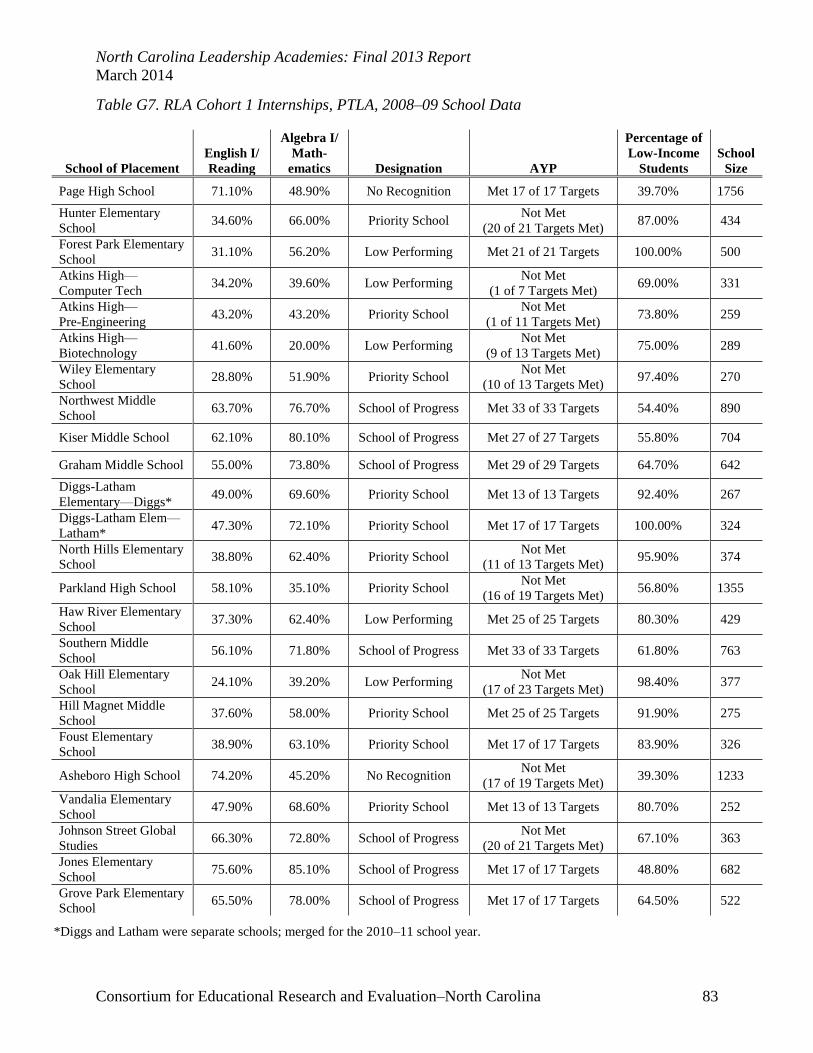
North Carolina Leadership Academies: Final 2013 Report
March 2014
Consortium for Educational Research and Evaluation–North Carolina 83
Table G7. RLA Cohort 1 Internships, PTLA, 2008–09 School Data
School of Placement
English I/
Reading
Algebra I/
Math-
ematics Designation AYP
Percentage of
Low-Income
Students
School
Size
Page High School 71.10% 48.90% No Recognition Met 17 of 17 Targets 39.70% 1756
Hunter Elementary
School 34.60% 66.00% Priority School
Not Met
(20 of 21 Targets Met) 87.00% 434
Forest Park Elementary
School 31.10% 56.20% Low Performing Met 21 of 21 Targets 100.00% 500
Atkins High—
Computer Tech 34.20% 39.60% Low Performing
Not Met
(1 of 7 Targets Met) 69.00% 331
Atkins High—
Pre-Engineering 43.20% 43.20% Priority School
Not Met
(1 of 11 Targets Met) 73.80% 259
Atkins High—
Biotechnology 41.60% 20.00% Low Performing
Not Met
(9 of 13 Targets Met) 75.00% 289
Wiley Elementary
School 28.80% 51.90% Priority School
Not Met
(10 of 13 Targets Met) 97.40% 270
Northwest Middle
School 63.70% 76.70% School of Progress Met 33 of 33 Targets 54.40% 890
Kiser Middle School 62.10% 80.10% School of Progress Met 27 of 27 Targets 55.80% 704
Graham Middle School 55.00% 73.80% School of Progress Met 29 of 29 Targets 64.70% 642
Diggs-Latham
Elementary—Diggs* 49.00% 69.60% Priority School Met 13 of 13 Targets 92.40% 267
Diggs-Latham Elem—
Latham* 47.30% 72.10% Priority School Met 17 of 17 Targets 100.00% 324
North Hills Elementary
School 38.80% 62.40% Priority School
Not Met
(11 of 13 Targets Met) 95.90% 374
Parkland High School 58.10% 35.10% Priority School Not Met
(16 of 19 Targets Met) 56.80% 1355
Haw River Elementary
School 37.30% 62.40% Low Performing Met 25 of 25 Targets 80.30% 429
Southern Middle
School 56.10% 71.80% School of Progress Met 33 of 33 Targets 61.80% 763
Oak Hill Elementary
School 24.10% 39.20% Low Performing
Not Met
(17 of 23 Targets Met) 98.40% 377
Hill Magnet Middle
School 37.60% 58.00% Priority School Met 25 of 25 Targets 91.90% 275
Foust Elementary
School 38.90% 63.10% Priority School Met 17 of 17 Targets 83.90% 326
Asheboro High School 74.20% 45.20% No Recognition Not Met
(17 of 19 Targets Met) 39.30% 1233
Vandalia Elementary
School 47.90% 68.60% Priority School Met 13 of 13 Targets 80.70% 252
Johnson Street Global
Studies 66.30% 72.80% School of Progress
Not Met
(20 of 21 Targets Met) 67.10% 363
Jones Elementary
School 75.60% 85.10% School of Progress Met 17 of 17 Targets 48.80% 682
Grove Park Elementary
School 65.50% 78.00% School of Progress Met 17 of 17 Targets 64.50% 522
*Diggs and Latham were separate schools; merged for the 2010–11 school year.

North Carolina Leadership Academies: Final 2013 Report
March 2014
Consortium for Educational Research and Evaluation–North Carolina 84
Table G8. RLA Cohort 1 Internships, PTLA, 2009–10 School Data
School of Placement
English
I/
Reading
Algebra I/
Math-
ematics Designation AYP
Percentage of
Low-Income
Students
School
Size
Page High School 82.80% 66.90% School of
Distinction Met 17 of 17 Targets 41.30% 1764
Hunter Elementary School 51.70% 72.90% Priority School Met 21 of 21 Targets 93.40% 408
Forest Park Elementary
School 31.20% 59.10% Priority School
Not Met
(12 of 21 Targets Met) 93.80% 520
Atkins High—
Computer Technology 55.90% 37.30% Priority School
Not Met
(3 of 12 Targets Met) 78.80% 284
Atkins High—
Pre-Engineering 72.10% 50.00% Priority School
Not Met
(2 of 5 Targets Met) 80.00% 247
Atkins High—
Biotechnology 65.10% 41.40% Priority School
Not Met
(4 of 7 Targets Met) 80.30% 272
Wiley Elementary School 25.70% 61.00% Priority School Not Met
(10 of 13 Targets Met) 98.90% 244
Northwest Middle School 66.60% 81.40% School of Progress Not Met
(30 of 31 Targets Met) 59.20% 895
Kiser Middle School 65.60% 78.20% School of Progress Not Met
(26 of 29 Targets Met) 54.10% 758
Graham Middle School 58.70% 76.00% School of Progress Not Met
(27 of 29 Targets Met) 71.30% 628
Diggs-Latham
Elementary—Diggs* 42.60% 61.40% Priority School
Not Met
(10 of 13 Targets Met) 80.60% 287
Diggs-Latham
Elementary—Latham* 47.70% 71.10% Priority School
Not Met
(16 of 17 Targets Met) 95.10% 287
North Hills Elementary
School 50.00% 75.00% Priority School Met 15 of 15 Targets 91.80% 366
Parkland High School 72.90% 64.50% School of Progress Not Met
(17 of 21 Targets Met) 62.80% 1295
Haw River Elementary
School 42.90% 66.70% Priority School Met 17 of 17 Targets 84.30% 395
Southern Middle School 56.90% 76.80% School of Progress Not Met
(33 of 35 Targets Met) 63.20% 798
Oak Hill Elementary
School 34.10% 59.50% Priority School Met 19 of 19 Targets 92.50% 389
Hill Magnet Middle
School 38.90% 53.00% Priority School
Not Met
(18 of 23 Targets Met) 96.00% 250
Foust Elementary School 42.40% 56.30% Priority School Not Met
(15 of 19 Targets Met) 91.10% 339
Asheboro High School 80.20% 56.00% No Recognition Not Met
(15 of 21 Targets Met) 39.00% 1247
Vandalia Elementary
School 58.00% 78.60% School of Progress Met 13 of 13 Targets 71.20% 253
Johnson Street Global
Studies 68.80% 77.60% School of Progress
Not Met
(20 of 21 Targets Met) 69.50% 343
Jones Elementary School 74.20% 80.40% School of Progress Not Met
(16 of 17 Targets Met) 47.60% 690
Grove Park Elementary
School 59.10% 76.00% School of Progress Met 17 of 17 Targets 67.60% 521
*Diggs and Latham were separate schools; merged for the 2010–11 school year.

North Carolina Leadership Academies: Final 2013 Report
March 2014
Consortium for Educational Research and Evaluation–North Carolina 85
Table G9. RLA Cohort 1 Internships, PTLA, 2010–11 School Data
School of Placement
English I/
Reading
Algebra I/
Math-
ematics Designation AYP
Percentage of
Low-Income
Students
School
Size
Page High School 82.00% 60.90% School of
Distinction
Not Met
(15 of 17 Targets Met) 43.50% 1806
Hunter Elementary
School 59.10% 86.70% School of Progress
Not Met
( 20 of 21 Targets Met) 95.80% 424
Forest Park
Elementary School 39.80% 69.70% Priority School
Not Met
(20 of 21 Targets Met) 97.70% 540
Atkins High—
Computer
Technology
47.40% 43.60% Priority School Not Met
(3 of 7 Targets Met) 81.60% 258
Atkins High—
Pre-Engineering 45.80% 37.80% Priority School
Not Met
(5 of 8 Targets Met) 82.70% 213
Atkins High—
Biotechnology 58.50% 42.20% Priority School
Not Met
(5 of 7 Targets Met) 83.00% 234
Wiley Elementary
School 38.30% 68.20% Priority School Met 13 of 13 Targets 98.00% 238
Northwest Middle
School 63.90% 81.70% School of Progress
Not Met 17 of 29
Targets Met) 62.60% 878
Kiser Middle School 65.00% 80.40% School of Progress Not Met
(21 of 29 Targets Met) 58.80% 824
Graham Middle
School 56.90% 74.60% School of Progress
Not Met
(17 of 29 Targets Met) 76.60% 628
Diggs-Latham
Elementary School* 49.50% 75.50% School of Progress
Not Met
(14 of 21 Targets Met) 89.50% 438
North Hills
Elementary School 47.40% 71.20% Priority School
Not Met
(9 of 15 Targets Met) 97.00% 359
Parkland High
School 69.10% 62.10% School of Progress Met 19 of 19 Targets 65.60% 1283
Haw River
Elementary School 41.80% 65.50% Priority School
Not Met
(13 of 23 Targets Met) 87.60% 433
Southern Middle
School 59.00% 75.10% School of Progress
Not Met
(25 of 35 Targets Met) 67.80% 783
Oak Hill Elementary
School 47.80% 79.60% School of Progress
Not Met
(19 of 21 Targets Met) 97.70% 415
Hill Magnet Middle
School 32.30% 60.00% Priority School
Not Met
(17 of 25 Targets Met) 95.90% 286
Foust Elementary
School 48.30% 69.10% Priority School
Not Met
(15 of 21 Targets Met) 91.70% 313
Asheboro High
School 73.90% 36.00% No Recognition
Not Met
(19 of 21 Targets Met) 47.10% 1228
Vandalia Elementary
School 62.40% 73.80% School of Progress
Not Met
(10 of 13 Targets Met) 79.30% 264
Johnson Street
Global Studies 64.20% 78.70% School of Progress
Not Met
(13 of 21 Targets Met) 73.10% 347
Jones Elementary
School 71.80% 81.00% School of Progress
Not Met
(12 of 17 Targets Met) 53.00% 699
Grove Park
Elementary School 53.50% 75.20% Priority School
Not Met
(14 of 21 Targets Met) 73.90% 540
*Diggs and Latham were separate schools; merged for the 2010–11 school year.
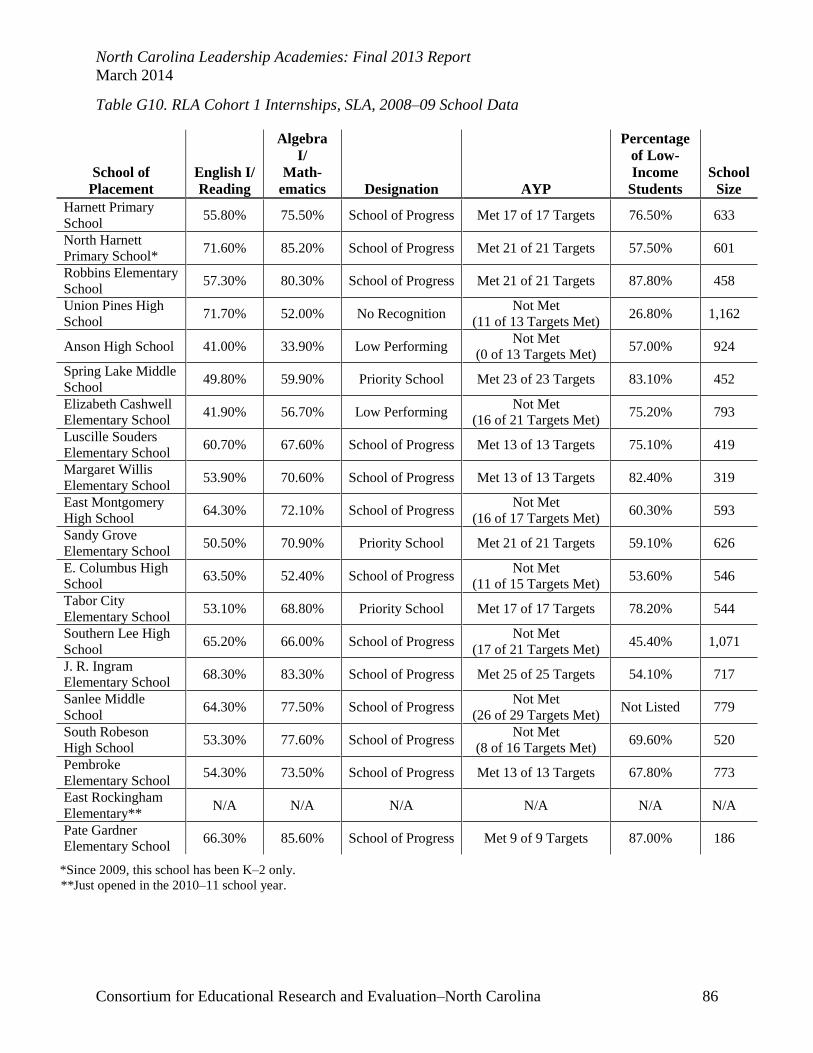
North Carolina Leadership Academies: Final 2013 Report
March 2014
Consortium for Educational Research and Evaluation–North Carolina 86
Table G10. RLA Cohort 1 Internships, SLA, 2008–09 School Data
School of
Placement English I/ Reading
Algebra
I/ Math-
ematics Designation AYP
Percentage
of Low-
Income
Students School
Size
Harnett Primary
School 55.80% 75.50% School of Progress Met 17 of 17 Targets 76.50% 633
North Harnett
Primary School* 71.60% 85.20% School of Progress Met 21 of 21 Targets 57.50% 601
Robbins Elementary
School 57.30% 80.30% School of Progress Met 21 of 21 Targets 87.80% 458
Union Pines High
School 71.70% 52.00% No Recognition
Not Met
(11 of 13 Targets Met) 26.80% 1,162
Anson High School 41.00% 33.90% Low Performing Not Met
(0 of 13 Targets Met) 57.00% 924
Spring Lake Middle
School 49.80% 59.90% Priority School Met 23 of 23 Targets 83.10% 452
Elizabeth Cashwell
Elementary School 41.90% 56.70% Low Performing
Not Met
(16 of 21 Targets Met) 75.20% 793
Luscille Souders
Elementary School 60.70% 67.60% School of Progress Met 13 of 13 Targets 75.10% 419
Margaret Willis
Elementary School 53.90% 70.60% School of Progress Met 13 of 13 Targets 82.40% 319
East Montgomery
High School 64.30% 72.10% School of Progress
Not Met
(16 of 17 Targets Met) 60.30% 593
Sandy Grove
Elementary School 50.50% 70.90% Priority School Met 21 of 21 Targets 59.10% 626
E. Columbus High
School 63.50% 52.40% School of Progress
Not Met
(11 of 15 Targets Met) 53.60% 546
Tabor City
Elementary School 53.10% 68.80% Priority School Met 17 of 17 Targets 78.20% 544
Southern Lee High
School 65.20% 66.00% School of Progress
Not Met
(17 of 21 Targets Met) 45.40% 1,071
J. R. Ingram
Elementary School 68.30% 83.30% School of Progress Met 25 of 25 Targets 54.10% 717
Sanlee Middle
School 64.30% 77.50% School of Progress
Not Met
(26 of 29 Targets Met) Not Listed 779
South Robeson
High School 53.30% 77.60% School of Progress
Not Met
(8 of 16 Targets Met) 69.60% 520
Pembroke
Elementary School 54.30% 73.50% School of Progress Met 13 of 13 Targets 67.80% 773
East Rockingham
Elementary** N/A N/A N/A N/A N/A N/A
Pate Gardner
Elementary School 66.30% 85.60% School of Progress Met 9 of 9 Targets 87.00% 186
*Since 2009, this school has been K–2 only.
**Just opened in the 2010–11 school year.
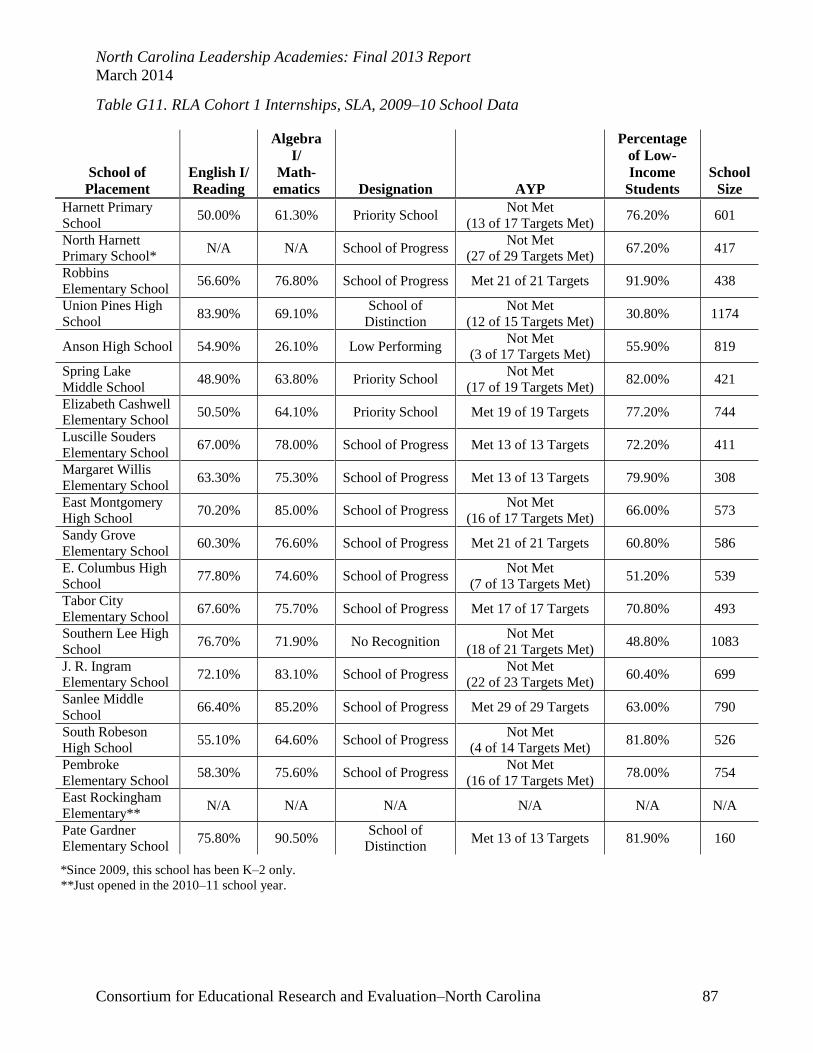
North Carolina Leadership Academies: Final 2013 Report
March 2014
Consortium for Educational Research and Evaluation–North Carolina 87
Table G11. RLA Cohort 1 Internships, SLA, 2009–10 School Data
School of
Placement English I/ Reading
Algebra
I/ Math-
ematics Designation AYP
Percentage
of Low-
Income
Students School
Size
Harnett Primary
School 50.00% 61.30% Priority School
Not Met
(13 of 17 Targets Met) 76.20% 601
North Harnett
Primary School* N/A N/A School of Progress
Not Met
(27 of 29 Targets Met) 67.20% 417
Robbins
Elementary School 56.60% 76.80% School of Progress Met 21 of 21 Targets 91.90% 438
Union Pines High
School 83.90% 69.10%
School of
Distinction
Not Met
(12 of 15 Targets Met) 30.80% 1174
Anson High School 54.90% 26.10% Low Performing Not Met
(3 of 17 Targets Met) 55.90% 819
Spring Lake
Middle School 48.90% 63.80% Priority School
Not Met
(17 of 19 Targets Met) 82.00% 421
Elizabeth Cashwell
Elementary School 50.50% 64.10% Priority School Met 19 of 19 Targets 77.20% 744
Luscille Souders
Elementary School 67.00% 78.00% School of Progress Met 13 of 13 Targets 72.20% 411
Margaret Willis
Elementary School 63.30% 75.30% School of Progress Met 13 of 13 Targets 79.90% 308
East Montgomery
High School 70.20% 85.00% School of Progress
Not Met
(16 of 17 Targets Met) 66.00% 573
Sandy Grove
Elementary School 60.30% 76.60% School of Progress Met 21 of 21 Targets 60.80% 586
E. Columbus High
School 77.80% 74.60% School of Progress
Not Met
(7 of 13 Targets Met) 51.20% 539
Tabor City
Elementary School 67.60% 75.70% School of Progress Met 17 of 17 Targets 70.80% 493
Southern Lee High
School 76.70% 71.90% No Recognition
Not Met
(18 of 21 Targets Met) 48.80% 1083
J. R. Ingram
Elementary School 72.10% 83.10% School of Progress
Not Met
(22 of 23 Targets Met) 60.40% 699
Sanlee Middle
School 66.40% 85.20% School of Progress Met 29 of 29 Targets 63.00% 790
South Robeson
High School 55.10% 64.60% School of Progress
Not Met
(4 of 14 Targets Met) 81.80% 526
Pembroke
Elementary School 58.30% 75.60% School of Progress
Not Met
(16 of 17 Targets Met) 78.00% 754
East Rockingham
Elementary** N/A N/A N/A N/A N/A N/A
Pate Gardner
Elementary School 75.80% 90.50%
School of
Distinction Met 13 of 13 Targets 81.90% 160
*Since 2009, this school has been K–2 only.
**Just opened in the 2010–11 school year.
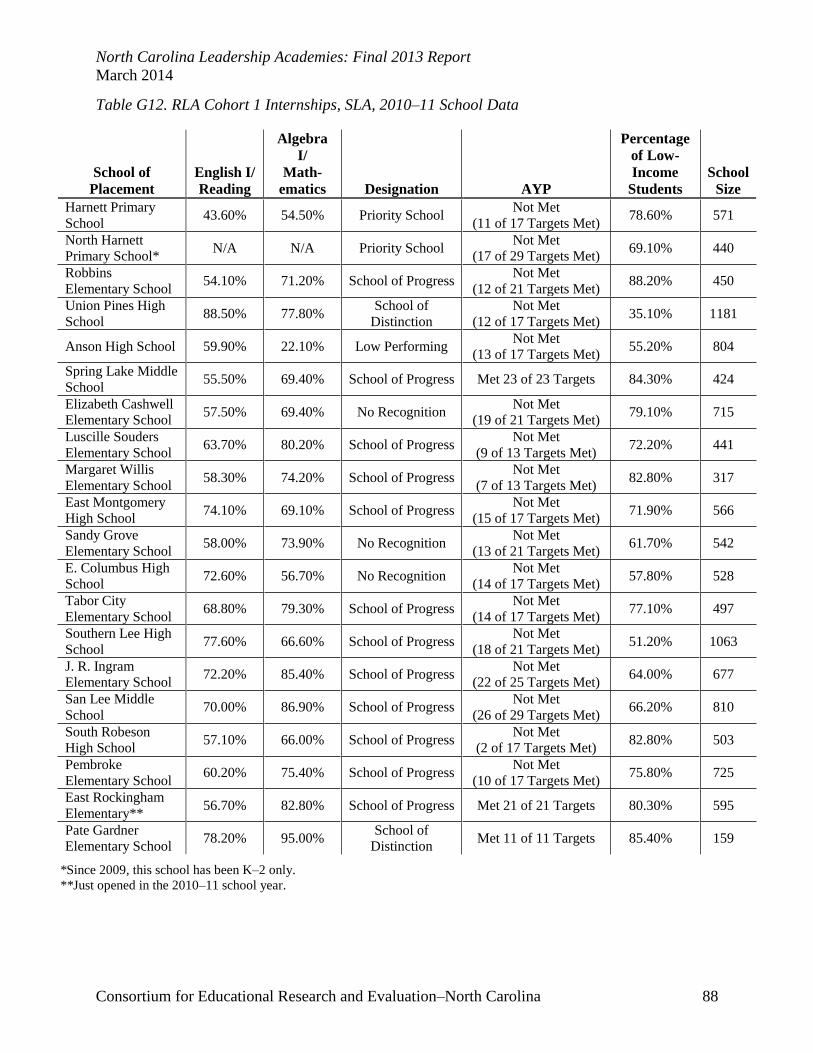
North Carolina Leadership Academies: Final 2013 Report
March 2014
Consortium for Educational Research and Evaluation–North Carolina 88
Table G12. RLA Cohort 1 Internships, SLA, 2010–11 School Data
School of
Placement English I/ Reading
Algebra
I/ Math-
ematics Designation AYP
Percentage
of Low-
Income
Students School
Size
Harnett Primary
School 43.60% 54.50% Priority School
Not Met
(11 of 17 Targets Met) 78.60% 571
North Harnett
Primary School* N/A N/A Priority School
Not Met
(17 of 29 Targets Met) 69.10% 440
Robbins
Elementary School 54.10% 71.20% School of Progress
Not Met
(12 of 21 Targets Met) 88.20% 450
Union Pines High
School 88.50% 77.80%
School of
Distinction
Not Met
(12 of 17 Targets Met) 35.10% 1181
Anson High School 59.90% 22.10% Low Performing Not Met
(13 of 17 Targets Met) 55.20% 804
Spring Lake Middle
School 55.50% 69.40% School of Progress Met 23 of 23 Targets 84.30% 424
Elizabeth Cashwell
Elementary School 57.50% 69.40% No Recognition
Not Met
(19 of 21 Targets Met) 79.10% 715
Luscille Souders
Elementary School 63.70% 80.20% School of Progress
Not Met
(9 of 13 Targets Met) 72.20% 441
Margaret Willis
Elementary School 58.30% 74.20% School of Progress
Not Met
(7 of 13 Targets Met) 82.80% 317
East Montgomery
High School 74.10% 69.10% School of Progress
Not Met
(15 of 17 Targets Met) 71.90% 566
Sandy Grove
Elementary School 58.00% 73.90% No Recognition
Not Met
(13 of 21 Targets Met) 61.70% 542
E. Columbus High
School 72.60% 56.70% No Recognition
Not Met
(14 of 17 Targets Met) 57.80% 528
Tabor City
Elementary School 68.80% 79.30% School of Progress
Not Met
(14 of 17 Targets Met) 77.10% 497
Southern Lee High
School 77.60% 66.60% School of Progress
Not Met
(18 of 21 Targets Met) 51.20% 1063
J. R. Ingram
Elementary School 72.20% 85.40% School of Progress
Not Met
(22 of 25 Targets Met) 64.00% 677
San Lee Middle
School 70.00% 86.90% School of Progress
Not Met
(26 of 29 Targets Met) 66.20% 810
South Robeson
High School 57.10% 66.00% School of Progress
Not Met
(2 of 17 Targets Met) 82.80% 503
Pembroke
Elementary School 60.20% 75.40% School of Progress
Not Met
(10 of 17 Targets Met) 75.80% 725
East Rockingham
Elementary** 56.70% 82.80% School of Progress Met 21 of 21 Targets 80.30% 595
Pate Gardner
Elementary School 78.20% 95.00%
School of
Distinction Met 11 of 11 Targets 85.40% 159
*Since 2009, this school has been K–2 only.
**Just opened in the 2010–11 school year.

North Carolina Leadership Academies: Final 2013 Report
March 2014
Consortium for Educational Research and Evaluation–North Carolina 89
Cohort 2 Internships, 2008–2011
Table G13. RLA Cohort 2 Internships, NELA, Total Change in Percentages, 2008–2011
Name School of Internship LEA
Total Change in
Percentages
English I/ Reading
Algebra I/ Mathematics
Amy Pearce Stocks Elementary School Edgecombe -0.30% 4.20%
Vernedette
Garland
Winstead Avenue
Elementary School* Nash/Rocky Mount N/A N/A
Kelly Shelton
Mudd
Southern Nash Middle
School Nash/Rocky Mount 4.90% 1.00%
Tonya Little Riverside Middle School** Martin N/A N/A
Kendrick Alston Coopers Elementary School Nash/Rocky Mount 2.40% 0.40%
Hugh Scott Southern Nash High School Nash/Rocky Mount 2.60% 0.00%
Teicher Patterson Rocky Mount Senior High
School Nash/Rocky Mount 12.90% 16.30%
Lisa Pennington Long Mill Elementary
School Franklin 4.10% 4.30%
Jackson Olsen Zeb Vance Elementary
School Vance 2.80% 0.80%
Kim Allison Wilton Elementary School Granville -1.10% 0.70%
Jennifer Lewis Baskerville Elementary
School Nash/Rocky Mount 12.90% 5.00%
Krista Fasioli Parker Middle School Nash/Rocky Mount -0.20% 6.80%
Tim Mudd DS Johnson Elementary
School Nash/Rocky Mount 2.30% -0.60%
Jennifer Berry Nashville Elementary School Nash/Rocky Mount 10.60% 2.90%
Zachary Marks Bailey Elementary School Nash/Rocky Mount 2.30% -5.50%
Erin Robbins JF Webb High School Granville -2.40% 12.10%
Angela Strother South Edgecombe Middle
School Edgecombe 5.70% 7.00%
Larry Hodgkins South Creek Middle
School*** Martin 8.90% 5.20%
Darren Gemzik Southwest Edgecombe High
School Edgecombe 1.50% -8.10%
Elizabeth Payne
Moran
West Oxford Elementary
School Granville 0.40% 7.90%
Lauren Greenhill Belmont Elementary School Roanoke Rapids
City Schools 0.70% -0.50%
*Grades K–2 only; no data.
**School just opened.
***In 2008–09, the school was named Roanoke Middle; renamed South Creek Middle in 2009–10 school year.

North Carolina Leadership Academies: Final 2013 Report
March 2014
Consortium for Educational Research and Evaluation–North Carolina 90
Table G14. RLA Cohort 2 Internships, PTLA, Total Change in Percentages, 2008–2011
Name School of Internship LEA
Total Change in
Percentages
English I/ Reading
Algebra I/ Mathematics
Kristen Gravely Williams High School ABSS 4.50% 7.20%
Thomas Kazimir Graham High School ABSS 15.70% 28.00%
Dana Roseboro Eastlawn Elementary School ABSS 10.80% -0.40%
Ben Cawley Montilieu Elementary School GCS 15.70% 21.70%
Kevin Conaway Hairston Middle School GCS 4.40% 1.60%
Vernon Hall Ferndale Middle School GCS 1.70% 1.20%
Darrell Harris Eastern Middle School GCS 1.70% 3.40%
Noel Keener Jones Elementary School GCS -3.80% -4.10%
Greta Martin Northeast Middle School GCS -0.20% -2.80%
Janiese Mckenzie Mendenhall Middle School GCS -1.80% -4.10%
Rashad Slade Johnson Street Global Studies GCS -2.10% 5.90%
Chelsea Smith Ragsdale High School GCS 17.30% 50.00%
Toks Wall Southern Middle School GCS 2.90% 3.30%
Kimberly Ashby North Forsyth High School WSFCS 3.00% 25.50%
Kathy Bryant Konnoak Elementary School WSFCS 3.90% -1.30%
Johnathan Hegedus Griffith Elementary School WSFCS 1.20% 3.20%
Larnitha Hunter Ibraham Elementary School WSFCS 2.50% -8.20%
Nicole Kurtz Paisley Middle School* WSFCS -4.20% 4.00%
Susan Miller Middle Fork Elementary School WSFCS 15.00% 19.90%
Colin Tribby Wiley Middle School WSFCS 7.60% 1.30%
*This is Paisley IB Magnet.

North Carolina Leadership Academies: Final 2013 Report
March 2014
Consortium for Educational Research and Evaluation–North Carolina 91
Table G15. RLA Cohort 2 Internships, SLA, Total Change in Percentages, 2008–2011
Name School of Internship LEA
Total Change in
Percentages
English I/ Reading
Algebra I/ Mathematics
Elizabeth Cole Bladenboro Primary School Bladen County -1.20% -6.60%
Melissa Brewer B.T. Bullock Elementary School Lee County 1.90% 4.00%
Lisa Hain J.R. Ingram Elementary School Lee County 3.90% 2.10%
Andrew Keller Southern Lee High School Lee County 12.40% 0.60%
Christy Burgess Sharpe Sanlee Middle School Lee County 5.70% 9.40%
Matt Moore West Pine Middle School Moore County 0.90% -0.70%
Tracy Metcalf Elise Middle School Moore County 1.00% 5.00%
Marci Houseman Southern Pines Primary School* Moore County N/A N/A
Katrina Fox Southern Pine Elementary
School Moore County -1.90% 2.70%
Kelly Bullard Tabor City Elementary School Columbus County 15.70% 10.50%
Leslie Bailey West Hoke Middle School Hoke County 11.30% 18.10%
Jennifer Spivey North Harnett Primary School** Harnett County N/A N/A
Pam Lewis
Scotland High—Math, Science,
& Tech*** Scotland County
32.50% 19.40%
Scotland High—Visual &
Performing Arts*** 51.30% 38.20%
Matt Mcclean Elizabeth Cashwell Elementary
School
Cumberland
County 15.60% 12.70%
Kisha Timberlake Derr South View Middle School Cumberland
County 4.00% 6.50%
Mike Picciano Doug Byrd High School Cumberland
County 2.40% -2.90%
Kristy West St. Pauls Elementary School Robeson County 8.60% 7.40%
Anthony Barton Purnell Swett High School Robeson County 7.40% 9.20%
Maxine Brown Rockingham Middle School Richmond County -0.40% 3.00%
Jennifer Brach West Rockingham Elementary
School Richmond County 3.50% 7.50%
Joy Starlin Richmond Senior High School Richmond County N/A 20.90%
*K–2 school so no test scores.
**K–2 since 2009–10 so no test data.
***No 2009–10 test score data due to five or few students in each category for English and Algebra.

North Carolina Leadership Academies: Final 2013 Report
March 2014
Consortium for Educational Research and Evaluation–North Carolina 92
Table G16. RLA Cohort 2 Internships, NELA, 2008–09 School Data
School of
Placement
English I/
Reading
Algebra I/
Math-
ematics Designation AYP
Percentage of
Low-Income
Students
School
Size
Stocks Elementary
School 45.90% 72.70% Priority School Met 17 of 17 Targets 70.72% 687
Winstead Avenue
Elementary* N/A N/A N/A N/A 54.56% 605
Southern Nash
Middle School 63.60% 79.30% School of Progress Met 29 of 29 Targets 54.89% 1054
Riverside Middle
School** N/A N/A N/A N/A N/A N/A
Coopers
Elementary School 72.90% 85.40% No Recognition Met 15 of 15 Targets 38.16% 645
Southern Nash
High School 65.40% 78.70% School of Progress
Not Met
(15 of 17 Targets Met) 44.74% 1180
Rocky Mount
Senior High School 59.90% 46.70% No Recognition
Not Met
(12 of 17 Targets Met) 49.79% 1176
Long Mill
Elementary School 69.30% 82.40% School of Progress Met 17 of 17 Targets 40.72% 447
Zeb Vance
Elementary School 65.20% 81.40% School of Progress Met 17 of 17 Targets 72.85% 499
Wilton Elementary
School 74.80% 89.40%
School of
Distinction Met 13 of 13 Targets 24.41% 620
Baskerville
Elementary School 52.60% 76.30% School of Progress Met 13 of 13 Targets 97.06% 406
Parker Middle
School 57.10% 63.90% School of Progress Met 21 of 21 Targets 69.91% 503
DS Johnson
Elementary School 42.10% 54.80% Low Performing Met 13 of 13 Targets 71.01% 421
Nashville
Elementary School 68.70% 87.60% School of Progress Met 21 of 21 Targets 44.27% 807
Bailey Elementary
School 69.40% 86.00% School of Progress Met 25 of 25 Targets 68.86% 654
JF Webb High
School 62.80% 50.70% School of Progress
Not Met
(16 of 17 Targets Met) 23.90% 830
South Edgecombe
Middle School 49.60% 63.90% Priority School Met 19 of 19 Targets 61.28% 379
South Creek
Middle School*** 62.60% 79.50% School of Progress Met 17 of 17 Targets Not Listed 262
Southwest
Edgecombe High 65.40% 48.00% No Recognition
Not Met
(10 of 17 Targets Met) 47.16% 927
West Oxford
Elementary School 51.10% 56.00% Priority School
Not Met
(17 of 23 Targets Met) 69.25% 606
Belmont
Elementary School 61.50% 78.60% School of Progress Met 19 of 19 Targets 58.98% 782
*Grades K–2 only; no data.
**School just opened.
***In 2008–09, the school was named Roanoke Middle; renamed South Creek Middle in 2009–10 school year.
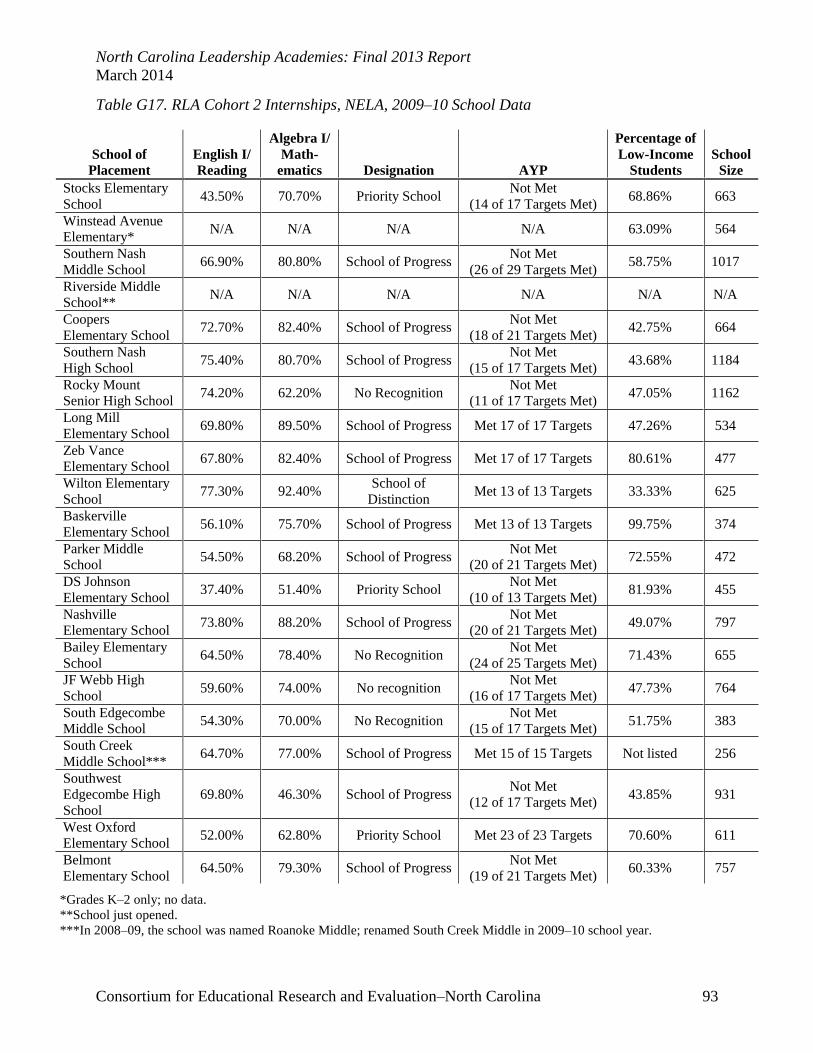
North Carolina Leadership Academies: Final 2013 Report
March 2014
Consortium for Educational Research and Evaluation–North Carolina 93
Table G17. RLA Cohort 2 Internships, NELA, 2009–10 School Data
School of
Placement
English I/
Reading
Algebra I/
Math-
ematics Designation AYP
Percentage of
Low-Income
Students
School
Size
Stocks Elementary
School 43.50% 70.70% Priority School
Not Met
(14 of 17 Targets Met) 68.86% 663
Winstead Avenue
Elementary* N/A N/A N/A N/A 63.09% 564
Southern Nash
Middle School 66.90% 80.80% School of Progress
Not Met
(26 of 29 Targets Met) 58.75% 1017
Riverside Middle
School** N/A N/A N/A N/A N/A N/A
Coopers
Elementary School 72.70% 82.40% School of Progress
Not Met
(18 of 21 Targets Met) 42.75% 664
Southern Nash
High School 75.40% 80.70% School of Progress
Not Met
(15 of 17 Targets Met) 43.68% 1184
Rocky Mount
Senior High School 74.20% 62.20% No Recognition
Not Met
(11 of 17 Targets Met) 47.05% 1162
Long Mill
Elementary School 69.80% 89.50% School of Progress Met 17 of 17 Targets 47.26% 534
Zeb Vance
Elementary School 67.80% 82.40% School of Progress Met 17 of 17 Targets 80.61% 477
Wilton Elementary
School 77.30% 92.40%
School of
Distinction Met 13 of 13 Targets 33.33% 625
Baskerville
Elementary School 56.10% 75.70% School of Progress Met 13 of 13 Targets 99.75% 374
Parker Middle
School 54.50% 68.20% School of Progress
Not Met
(20 of 21 Targets Met) 72.55% 472
DS Johnson
Elementary School 37.40% 51.40% Priority School
Not Met
(10 of 13 Targets Met) 81.93% 455
Nashville
Elementary School 73.80% 88.20% School of Progress
Not Met
(20 of 21 Targets Met) 49.07% 797
Bailey Elementary
School 64.50% 78.40% No Recognition
Not Met
(24 of 25 Targets Met) 71.43% 655
JF Webb High
School 59.60% 74.00% No recognition
Not Met
(16 of 17 Targets Met) 47.73% 764
South Edgecombe
Middle School 54.30% 70.00% No Recognition
Not Met
(15 of 17 Targets Met) 51.75% 383
South Creek
Middle School*** 64.70% 77.00% School of Progress Met 15 of 15 Targets Not listed 256
Southwest
Edgecombe High
School
69.80% 46.30% School of Progress Not Met
(12 of 17 Targets Met) 43.85% 931
West Oxford
Elementary School 52.00% 62.80% Priority School Met 23 of 23 Targets 70.60% 611
Belmont
Elementary School 64.50% 79.30% School of Progress
Not Met
(19 of 21 Targets Met) 60.33% 757
*Grades K–2 only; no data.
**School just opened.
***In 2008–09, the school was named Roanoke Middle; renamed South Creek Middle in 2009–10 school year.

North Carolina Leadership Academies: Final 2013 Report
March 2014
Consortium for Educational Research and Evaluation–North Carolina 94
Table G18. RLA Cohort 2 Internships, NELA, 2010–11 School Data
School of
Placement
English I/
Reading
Algebra I/
Math-
ematics Designation AYP
Percentage of
Low-Income
Students
School
Size
Stocks Elementary
School 45.60% 76.90% No Recognition
Not Met
(14 of 17 Targets Met) 75.49% 661
Winstead Avenue
Elementary* N/A N/A N/A N/A 67.50% 562
Southern Nash
Middle School 68.50% 80.30% School of Progress
Not Met
(24 of 33 Targets Met) 60.20% 1050
Riverside Middle
School** N/A N/A N/A N/A N/A N/A
Coopers
Elementary School 75.30% 85.80%
School of
Distinction
Not Met
(19 of 21 Targets Met) 48.48% 662
Southern Nash
High School 68.00% 78.70% No Recognition
Not Met
(21 of 24 Targets Met) 56.81% 1231
Rocky Mount
Senior High School 72.80% 63.00% School of Progress
Not Met
(14 of 17 Targets Met) 65.53% 1134
Long Mill
Elementary School 73.40% 86.70% School of Progress
Not Met
(14 of 17 Targets Met) 47.17% 538
Zeb Vance
Elementary School 68.00% 82.20% School of Progress
Not Met
(13 of 17 Targets Met) 80.66% 410
Wilton Elementary
School 73.70% 90.10%
School of
Distinction
Not Met
(13 of 17 Targets Met) 40.23% 627
Baskerville
Elementary School 65.50% 81.30% School of Progress Met 13 of 13 Targets 96.27% 355
Parker Middle
School 56.90% 70.70% School of Progress
Not Met
(13 of 21 Targets Met) 76.15% 453
DS Johnson
Elementary School 44.40% 54.20% Priority School
Not Met
(7 of 13 Targets Met) 80.20% 471
Nashville
Elementary School 79.30% 90.50%
School of
Distinction Met 21 of 21 Targets 51.11% 750
Bailey Elementary
School 71.70% 80.50% School of Progress
Not Met
(24 of 29 Targets Met) 77.86% 647
JF Webb High
School 60.40% 62.80% School of Progress
Not Met
(10 of 17 Targets Met) 49.12% 711
South Edgecombe
Middle School 55.30% 70.90% School of Progress
Not Met
(12 of 17 Targets Met) 63.68% 366
South Creek
Middle School*** 71.50% 84.70% School of Progress
Not Met
(17 of 21 Targets Met) 64.27% 390
Southwest
Edgecombe High
School
66.90% 39.90% School of Progress Not Met
(12 of 17 Targets Met) 51.86% 914
West Oxford
Elementary School 51.50% 63.90% Priority School
Not Met
(12 of 21 Targets Met) 76.07% 582
Belmont
Elementary School 62.20% 78.10% School of Progress
Not Met
(13 of 21 Targets Met) 71.86% 760
*Grades K–2 only; no data.
**School just opened.
***In 2008–09, the school was named Roanoke Middle; renamed South Creek Middle in 2009–10 school year.
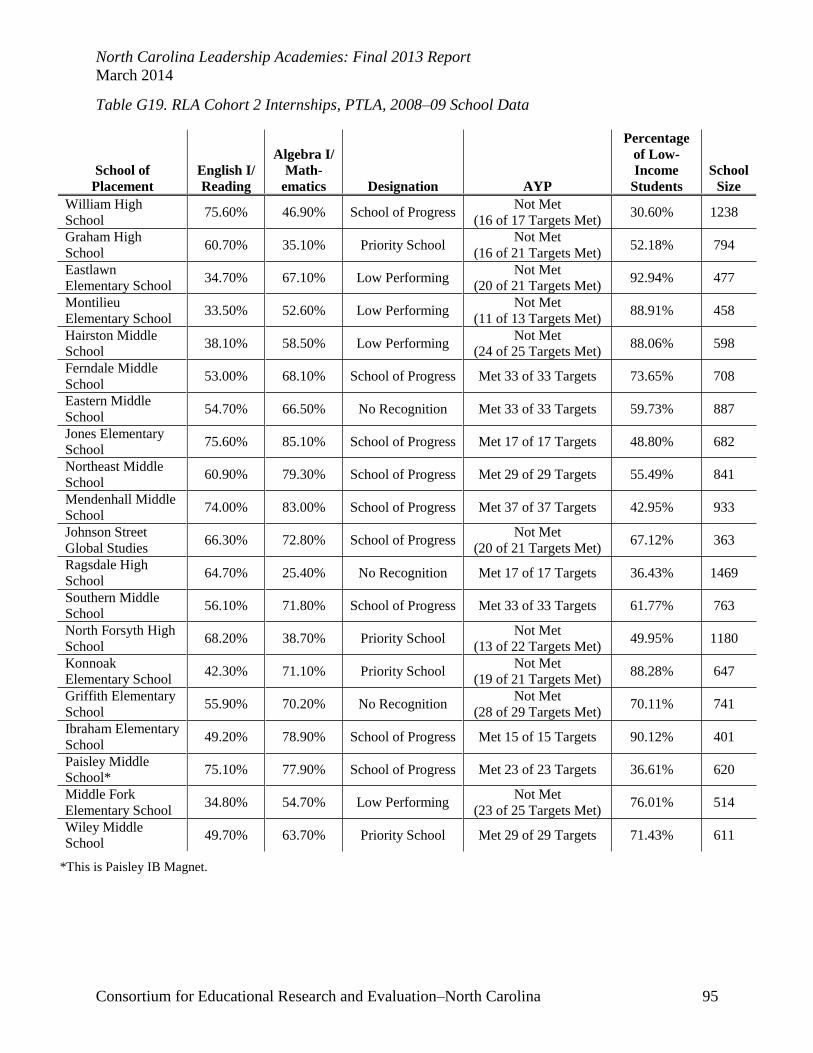
North Carolina Leadership Academies: Final 2013 Report
March 2014
Consortium for Educational Research and Evaluation–North Carolina 95
Table G19. RLA Cohort 2 Internships, PTLA, 2008–09 School Data
School of
Placement
English I/
Reading
Algebra I/
Math-
ematics Designation AYP
Percentage
of Low-
Income
Students
School
Size
William High
School 75.60% 46.90% School of Progress
Not Met
(16 of 17 Targets Met) 30.60% 1238
Graham High
School 60.70% 35.10% Priority School
Not Met
(16 of 21 Targets Met) 52.18% 794
Eastlawn
Elementary School 34.70% 67.10% Low Performing
Not Met
(20 of 21 Targets Met) 92.94% 477
Montilieu
Elementary School 33.50% 52.60% Low Performing
Not Met
(11 of 13 Targets Met) 88.91% 458
Hairston Middle
School 38.10% 58.50% Low Performing
Not Met
(24 of 25 Targets Met) 88.06% 598
Ferndale Middle
School 53.00% 68.10% School of Progress Met 33 of 33 Targets 73.65% 708
Eastern Middle
School 54.70% 66.50% No Recognition Met 33 of 33 Targets 59.73% 887
Jones Elementary
School 75.60% 85.10% School of Progress Met 17 of 17 Targets 48.80% 682
Northeast Middle
School 60.90% 79.30% School of Progress Met 29 of 29 Targets 55.49% 841
Mendenhall Middle
School 74.00% 83.00% School of Progress Met 37 of 37 Targets 42.95% 933
Johnson Street
Global Studies 66.30% 72.80% School of Progress
Not Met
(20 of 21 Targets Met) 67.12% 363
Ragsdale High
School 64.70% 25.40% No Recognition Met 17 of 17 Targets 36.43% 1469
Southern Middle
School 56.10% 71.80% School of Progress Met 33 of 33 Targets 61.77% 763
North Forsyth High
School 68.20% 38.70% Priority School
Not Met
(13 of 22 Targets Met) 49.95% 1180
Konnoak
Elementary School 42.30% 71.10% Priority School
Not Met
(19 of 21 Targets Met) 88.28% 647
Griffith Elementary
School 55.90% 70.20% No Recognition
Not Met
(28 of 29 Targets Met) 70.11% 741
Ibraham Elementary
School 49.20% 78.90% School of Progress Met 15 of 15 Targets 90.12% 401
Paisley Middle
School* 75.10% 77.90% School of Progress Met 23 of 23 Targets 36.61% 620
Middle Fork
Elementary School 34.80% 54.70% Low Performing
Not Met
(23 of 25 Targets Met) 76.01% 514
Wiley Middle
School 49.70% 63.70% Priority School Met 29 of 29 Targets 71.43% 611
*This is Paisley IB Magnet.

North Carolina Leadership Academies: Final 2013 Report
March 2014
Consortium for Educational Research and Evaluation–North Carolina 96
Table G20. RLA Cohort 2 Internships, PTLA, 2009–10 School Data
School of
Placement
English I/
Reading
Algebra I/
Math-
ematics Designation AYP
Percentage
of Low-
Income
Students
School
Size
William High
School 81.30% 48.90%
School of
Distinction
Not Met
(18 of 21 Targets Met) 31.30% 1184
Graham High
School 71.10% 61.50% School of Progress
Not Met
(19 of 21 Targets Met) 56.80% 773
Eastlawn
Elementary School 38.80% 62.90% Priority School
Not Met
(18 of 21 Targets Met) 97.30% 446
Montilieu
Elementary School 46.30% 71.20% Priority School Met 13 of 13 Targets 81.10% 418
Hairston Middle
School 44.70% 67.80% Priority School
Not Met
(24 of 25 Targets Met) 91.06% 544
Ferndale Middle
School 51.80% 64.60% No Recognition
Not Met
(32 of 33 Targets Met) 71.49% 757
Eastern Middle
School 55.10% 64.30% No Recognition
Not Met
(28 of 37 Targets Met) 61.02% 913
Jones Elementary
School 74.20% 80.40% School of Progress
Not Met
(16 of 17 Targets Met) 47.58% 690
Northeast Middle
School 63.00% 79.20% School of Progress
Not Met
(25 of 29 Targets Met) 57.48% 829
Mendenhall Middle
School 73.70% 81.80% School of Progress
Not Met
(32 of 37 Targets Met) 44.71% 965
Johnson Street
Global Studies 68.80% 77.60% School of Progress
Not Met
(20 of 21 Targets Met) 69.53% 343
Ragsdale High
School 76.70% 40.00% School of Progress
Not Met
(15 of 17 Targets Met) 38.50% 1,386
Southern Middle
School 56.90% 76.80% School of Progress
Not Met
(33 of 35 Targets Met) 63.19% 798
North Forsyth High
School 72.00% 63.20% School of Progress
Not Met
(10 of 21 Targets Met) 52.96% 1222
Konnoak
Elementary School 46.00% 74.20% Priority School
Not Met
(19 of 21 Targets Met) 89.23% 612
Griffith Elementary
School 63.40% 75.90% School of Progress
Not Met
(23 of 24 Targets Met) 78.07% 596
Ibraham Elementary
School 49.10% 78.30% School of Progress Met 17 of 17 Targets 89.38% 433
Paisley Middle
School* 75.30% 87.00%
School of
Distinction Met 25 of 25 Targets 44.59% 673
Middle Fork
Elementary School 46.30% 74.40% Priority School
Not Met
(23 of 25 Targets Met) 76.98% 448
Wiley Middle
School 54.90% 66.30% School of Progress
Not Met
(24 of 29 Targets Met) 71.85% 549
*This is Paisley IB Magnet.

North Carolina Leadership Academies: Final 2013 Report
March 2014
Consortium for Educational Research and Evaluation–North Carolina 97
Table G21. RLA Cohort 2 Internships, PTLA, 2010–11 School Data
School of
Placement
English I/
Reading
Algebra I/
Math-
ematics Designation AYP
Percentage
of Low-
Income
Students
School
Size
William High
School 80.10% 54.10% School of Progress
Not Met
(17 of 21 Targets Met) 40.53% 1140
Graham High
School 76.40% 63.10% School of Progress
Not Met
(19 of 21 Targets Met) 61.09% 753
Eastlawn
Elementary School 45.50% 66.70% Priority School
Not Met
(17 of 21 Targets Met) 93.36% 433
Montilieu
Elementary School 49.20% 74.30% Priority School
Not Met
(10 of 13 Targets Met) 88.44% 406
Hairston Middle
School 42.50% 60.10% Priority School
Not Met
(14 of 25 Targets Met) 90.93% 571
Ferndale Middle
School 54.70% 69.30% School of Progress
Not Met
(25 of 33 Targets Met) 73.82% 833
Eastern Middle
School 56.40% 69.90% School of Progress
Not Met
(27 of 33 Targets Met) 65.02% 943
Jones Elementary
School 71.80% 81.00% School of Progress
Not Met
(12 of 17 Targets Met) 62.53% 699
Northeast Middle
School 60.70% 76.50% School of Progress
Not Met
(17 of 27 Targets Met) 62.14% 835
Mendenhall Middle
School 72.20% 78.90% School of Progress
Not Met
(22 of 33 Targets Met) 47.84% 983
Johnson Street
Global Studies 64.20% 78.70% School of Progress
Not Met
(13 of 21 Targets Met) 73.08% 347
Ragsdale High
School 82.00% 75.40% School of Progress Met 17 of 17 Targets 43.88% 1365
Southern Middle
School 59.00% 75.10% School of Progress
Not Met
(25 of 35 Targets Met) 67.84% 783
North Forsyth High
School 71.20% 64.20% School of Progress
Not Met
(16 of 21 Targets Met) 58.65% 1194
Konnoak
Elementary School 46.20% 69.80% Priority School
Not Met
(13 of 21 Targets Met) 90.47% 625
Griffith Elementary
School 57.10% 73.40% No Recognition
Not Met
(13 of 25 Targets Met) 84.54% 547
Ibraham Elementary
School 51.70% 70.70% School of Progress
Not Met
(10 of 17 Targets Met) 92.97% 463
Paisley Middle
School* 70.90% 81.90%
School of
Distinction
Not Met
(21 of 29 Targets Met) 42.71% 729
Middle Fork
Elementary School 49.80% 74.60% Priority School
Not Met
(13 of 21 Targets Met) 84.56% 390
Wiley Middle
School 57.30% 65.00% School of Progress
Not Met
(19 of 29 Targets Met) 73.78% 489
*This is Paisley IB Magnet.
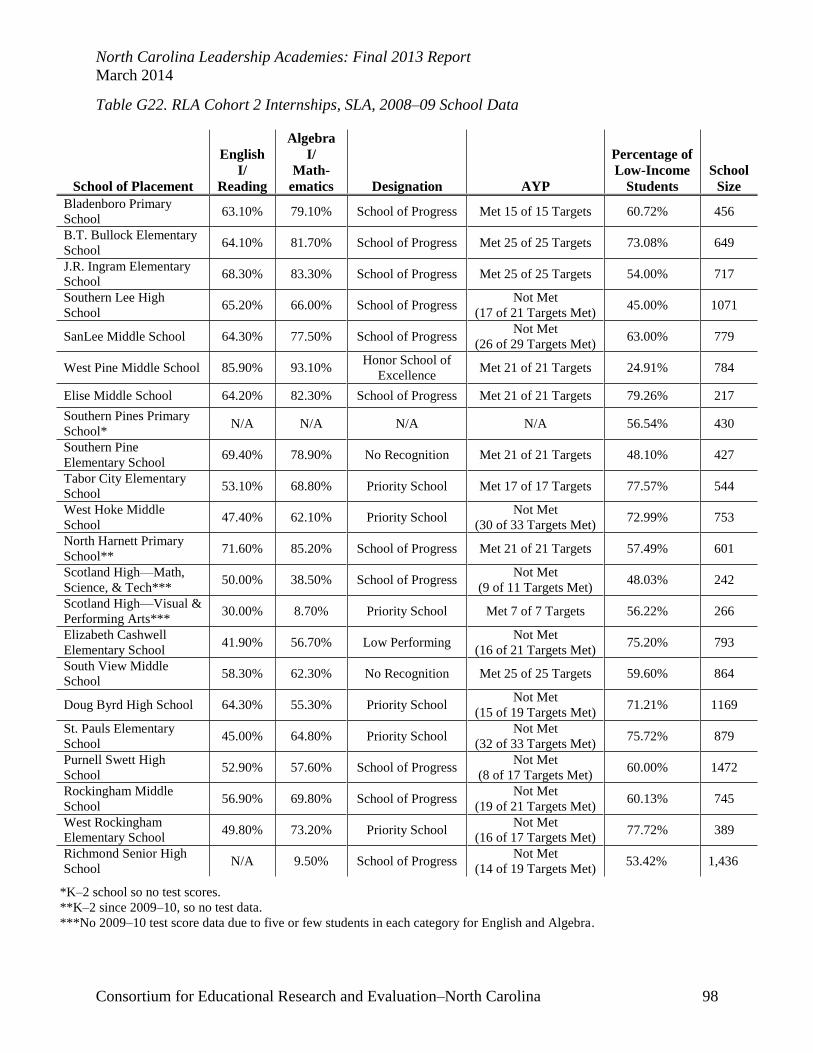
North Carolina Leadership Academies: Final 2013 Report
March 2014
Consortium for Educational Research and Evaluation–North Carolina 98
Table G22. RLA Cohort 2 Internships, SLA, 2008–09 School Data
School of Placement
English
I/
Reading
Algebra
I/
Math-
ematics Designation AYP
Percentage of
Low-Income
Students
School
Size
Bladenboro Primary
School 63.10% 79.10% School of Progress Met 15 of 15 Targets 60.72% 456
B.T. Bullock Elementary
School 64.10% 81.70% School of Progress Met 25 of 25 Targets 73.08% 649
J.R. Ingram Elementary
School 68.30% 83.30% School of Progress Met 25 of 25 Targets 54.00% 717
Southern Lee High
School 65.20% 66.00% School of Progress
Not Met
(17 of 21 Targets Met) 45.00% 1071
SanLee Middle School 64.30% 77.50% School of Progress Not Met
(26 of 29 Targets Met) 63.00% 779
West Pine Middle School 85.90% 93.10% Honor School of
Excellence Met 21 of 21 Targets 24.91% 784
Elise Middle School 64.20% 82.30% School of Progress Met 21 of 21 Targets 79.26% 217
Southern Pines Primary
School* N/A N/A N/A N/A 56.54% 430
Southern Pine
Elementary School 69.40% 78.90% No Recognition Met 21 of 21 Targets 48.10% 427
Tabor City Elementary
School 53.10% 68.80% Priority School Met 17 of 17 Targets 77.57% 544
West Hoke Middle
School 47.40% 62.10% Priority School
Not Met
(30 of 33 Targets Met) 72.99% 753
North Harnett Primary
School** 71.60% 85.20% School of Progress Met 21 of 21 Targets 57.49% 601
Scotland High—Math,
Science, & Tech*** 50.00% 38.50% School of Progress
Not Met
(9 of 11 Targets Met) 48.03% 242
Scotland High—Visual &
Performing Arts*** 30.00% 8.70% Priority School Met 7 of 7 Targets 56.22% 266
Elizabeth Cashwell
Elementary School 41.90% 56.70% Low Performing
Not Met
(16 of 21 Targets Met) 75.20% 793
South View Middle
School 58.30% 62.30% No Recognition Met 25 of 25 Targets 59.60% 864
Doug Byrd High School 64.30% 55.30% Priority School Not Met
(15 of 19 Targets Met) 71.21% 1169
St. Pauls Elementary
School 45.00% 64.80% Priority School
Not Met
(32 of 33 Targets Met) 75.72% 879
Purnell Swett High
School 52.90% 57.60% School of Progress
Not Met
(8 of 17 Targets Met) 60.00% 1472
Rockingham Middle
School 56.90% 69.80% School of Progress
Not Met
(19 of 21 Targets Met) 60.13% 745
West Rockingham
Elementary School 49.80% 73.20% Priority School
Not Met
(16 of 17 Targets Met) 77.72% 389
Richmond Senior High
School N/A 9.50% School of Progress
Not Met
(14 of 19 Targets Met) 53.42% 1,436
*K–2 school so no test scores.
**K–2 since 2009–10, so no test data.
***No 2009–10 test score data due to five or few students in each category for English and Algebra.

North Carolina Leadership Academies: Final 2013 Report
March 2014
Consortium for Educational Research and Evaluation–North Carolina 99
Table G23. RLA Cohort 2 Internships, SLA, 2009–10 School Data
School of Placement
English I/
Reading
Algebra I/
Math-
ematics Designation AYP
Percentage of
Low-Income
Students
School
Size
Bladenboro Primary
School 62.00% 72.10% School of Progress
Not Met
(14 of 17 Targets Met) 70.54% 447
B.T. Bullock
Elementary School 62.90% 78.40% School of Progress
Not Met
(25 of 27 Targets Met) 67.94% 645
J.R. Ingram
Elementary School 72.10% 83.10% School of Progress
Not Met
(22 of 23 Targets Met) 60.44% 699
Southern Lee High
School 76.70% 71.90% No Recognition
Not Met
(18 of 21 Targets Met) 48.79% 1083
SanLee Middle
School 66.40% 85.20% School of Progress Met 29 of 29 Targets 62.97% 790
West Pine Middle
School 87.50% 93.70%
Honor School of
Excellence Met 21 of 21 Targets 25.00% 823
Elise Middle School 64.80% 84.90% School of Progress Met 21 of 21 Targets 81.00% 205
Southern Pines
Primary School* N/A N/A N/A N/A 57.00% 442
Southern Pine
Elementary School 70.00% 83.50% School of Progress
Not Met
(20 of 21 Targets Met) 50.00% 421
Tabor City
Elementary School 67.60% 75.70% School of Progress Met 17 of 17 Targets 70.78% 493
West Hoke Middle
School 56.60% 75.50% School of Progress
Not Met
(30 of 33 Targets Met) 80.38% 796
North Harnett Primary
School** N/A N/A N/A N/A 67.19% 417
Scotland High—Math,
Science, & Tech*** N/A N/A School of Progress Met 5 of 5 Targets 47.15% 221
Scotland High—
Visual & Performing
Arts***
10.00% 25.00% Priority School Not Met
(9 of 13 Targets Met) 64.34% 268
Elizabeth Cashwell
Elementary School 50.50% 64.10% Priority School Met 19 of 19 Targets 77.23% 744
South View Middle
School 61.20% 66.00% School of Progress
Not Met
(23 of 25 Targets Met) 54.67% 723
Doug Byrd High
School 78.90% 66.60% School of Progress
Not Met
(15 of 19 Targets Met) 69.96% 1238
St. Pauls Elementary
School 45.90% 63.30% Priority School
Not Met
(24 of 31 Targets Met) 80.68% 882
Purnell Swett High
School 59.80% 58.20% School of Progress
Not Met
(8 of 17 Targets Met) 63.79% 1619
Rockingham Middle
School 60.10% 73.50% School of Progress
Not Met
(20 of 21 Targets Met) 39.58% 744
West Rockingham
Elementary School 50.80% 68.00% Priority School
Not Met
(14 of 17 Targets Met) 84.69% 368
Richmond Senior
High School N/A 35.80%
School of
Distinction
Not Met
(13 of 17 Targets Met) 59.00% 1408
*K–2 school so no test scores.
**K–2 since 2009–10, so no test data.
***No 2009–10 test score data due to five or few students in each category for English and Algebra.

North Carolina Leadership Academies: Final 2013 Report
March 2014
Consortium for Educational Research and Evaluation–North Carolina 100
Table G24. RLA Cohort 2 Internships, SLA, 2010–11 School Data
School of Placement
English I/
Reading
Algebra
I/
Math-
ematics Designation AYP
Percentage of
Low-Income
Students
School
Size
Bladenboro Primary
School 61.90% 72.50% School of Progress
Not Met
(10 of 17 Targets Met) 75.51% 449
B.T. Bullock
Elementary School 66.00% 85.70% School of Progress
Not Met
(24 of 25 Targets Met) 69.92% 630
J.R. Ingram
Elementary School 72.20% 85.40% School of Progress
Not Met
(22 of 25 Targets Met) 63.96% 677
Southern Lee High
School 77.60% 66.60% School of Progress
Not Met
(18 of 21 Targets Met) 51.24% 1063
SanLee Middle School 70.00% 86.90% School of Progress Not Met
(26 of 29 Targets Met) 66.17% 810
West Pine Middle
School 86.80% 92.40%
School of
Excellence
Not Met
(22 of 25 Targets Met) 24.30% 825
Elise Middle School 65.20% 87.30% School of Progress Not Met
(15 of 21 Targets Met) 82.32% 210
Southern Pines
Primary School* N/A N/A N/A N/A 56.05% 409
Southern Pine
Elementary School 67.50% 81.60% No Recognition
Not Met
(15 of 21 Targets Met) 53.18% 421
Tabor City Elementary
School 68.80% 79.30% School of Progress
Not Met
(14 of 17 Targets Met) 77.11% 497
West Hoke Middle
School 58.70% 80.20% School of Progress
Not Met
(28 of 33 Targets Met) 76.81% 855
North Harnett Primary
School** N/A N/A N/A N/A 69.10% 440
Scotland High—Math,
Science, & Tech*** 82.50% 57.90%
School of
Distinction
Not Met
(14 of 16 Targets Met) 44.38% 384
Scotland High—Visual
& Performing Arts*** 81.30% 46.90% Priority School
Not Met
(9 of 11 Targets Met) 70.18% 392
Elizabeth Cashwell
Elementary School 57.50% 69.40% No Recognition
Not Met
(19 of 21 Targets Met) 79.14% 715
South View Middle
School 62.30% 68.80% School of Progress
Not Met
(18 of 27 Targets Met) 59.11% 792
Doug Byrd High
School 66.70% 52.40% No Recognition
Not Met
(14 of 21 Targets Met) 70.33% 1223
St. Pauls Elementary
School 53.60% 72.20% Priority School
Not Met
(28 of 29 Targets Met) 85.23% 909
Purnell Swett High
School 60.30% 66.80% School of Progress
Not Met
(13 of 19 Targets Met) 69.02% 1615
Rockingham Middle
School 56.50% 72.80% School of Progress
Not Met
(14 of 21 Targets Met) 64.87% 745
West Rockingham
Elementary School 53.30% 80.70% School of Progress
Not Met
(13 of 17 Targets Met) 81.23% 358
Richmond Senior High
School 6.30% 30.40%
School of
Distinction
Not Met
(14 of 19 Targets Met) 57.82% 1348
*K–2 school, so no test scores.
**K–2 since 2009–10, so no test data.
***No 2009–10 test score data due to five or few students in each category for English and Algebra.
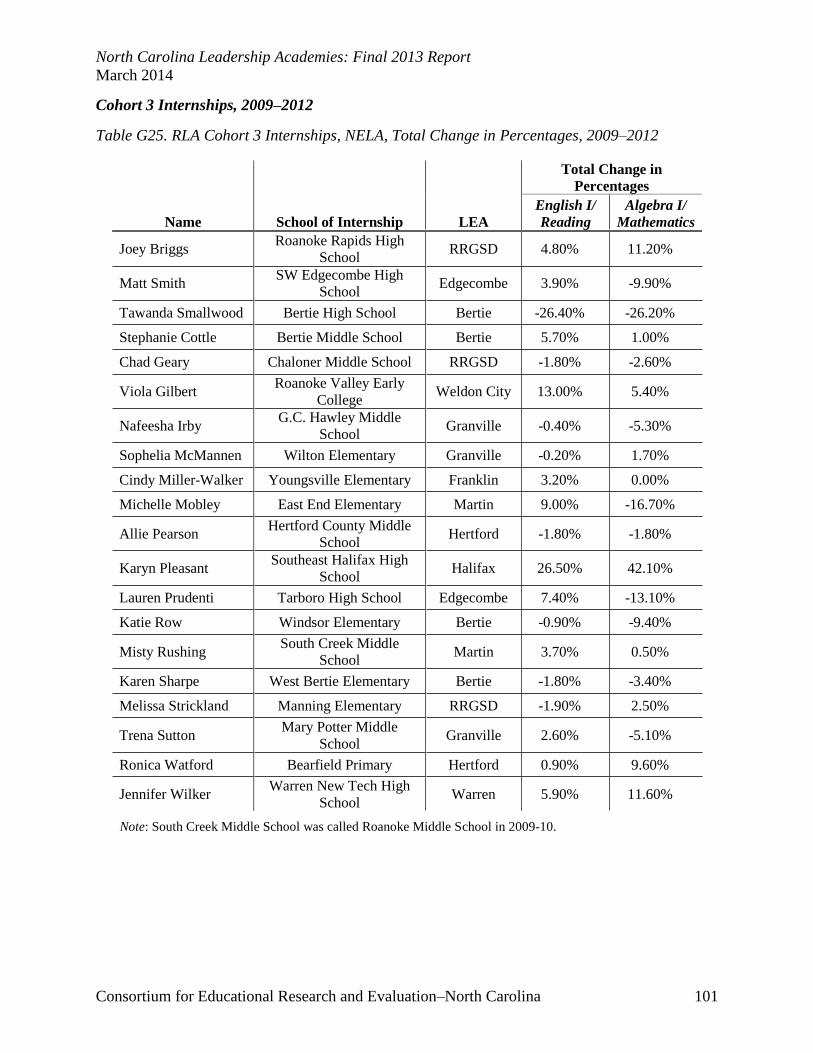
North Carolina Leadership Academies: Final 2013 Report
March 2014
Consortium for Educational Research and Evaluation–North Carolina 101
Cohort 3 Internships, 2009–2012
Table G25. RLA Cohort 3 Internships, NELA, Total Change in Percentages, 2009–2012
Name School of Internship LEA
Total Change in
Percentages
English I/ Reading
Algebra I/ Mathematics
Joey Briggs Roanoke Rapids High
School RRGSD 4.80% 11.20%
Matt Smith SW Edgecombe High
School Edgecombe 3.90% -9.90%
Tawanda Smallwood Bertie High School Bertie -26.40% -26.20%
Stephanie Cottle Bertie Middle School Bertie 5.70% 1.00%
Chad Geary Chaloner Middle School RRGSD -1.80% -2.60%
Viola Gilbert Roanoke Valley Early
College Weldon City 13.00% 5.40%
Nafeesha Irby G.C. Hawley Middle
School Granville -0.40% -5.30%
Sophelia McMannen Wilton Elementary Granville -0.20% 1.70%
Cindy Miller-Walker Youngsville Elementary Franklin 3.20% 0.00%
Michelle Mobley East End Elementary Martin 9.00% -16.70%
Allie Pearson Hertford County Middle
School Hertford -1.80% -1.80%
Karyn Pleasant Southeast Halifax High
School Halifax 26.50% 42.10%
Lauren Prudenti Tarboro High School Edgecombe 7.40% -13.10%
Katie Row Windsor Elementary Bertie -0.90% -9.40%
Misty Rushing South Creek Middle
School Martin 3.70% 0.50%
Karen Sharpe West Bertie Elementary Bertie -1.80% -3.40%
Melissa Strickland Manning Elementary RRGSD -1.90% 2.50%
Trena Sutton Mary Potter Middle
School Granville 2.60% -5.10%
Ronica Watford Bearfield Primary Hertford 0.90% 9.60%
Jennifer Wilker Warren New Tech High
School Warren 5.90% 11.60%
Note: South Creek Middle School was called Roanoke Middle School in 2009-10.

North Carolina Leadership Academies: Final 2013 Report
March 2014
Consortium for Educational Research and Evaluation–North Carolina 102
Table G26. RLA Cohort 3 Internships, PTLA, Total Change in Percentages, 2009–2012
Name School of Internship LEA
Total Change in
Percentages
English I/ Reading
Algebra I/ Mathematics
Melissa Allred North Asheboro Middle Asheboro
City -4.80% -5.30%
Karen Anderson High Point Central High
School Guilford 2.60% 1.60%
Aaron Bailey Hanes Magnet Middle Winston
Salem Forsyth -1.10% -2.30%
Clinton Baron Wiley Middle Winston
Salem Forsyth -2.60% -5.60%
Adjoa Botwe-Rankin Allen Middle Guilford -3.30% -2.50%
Bennie Bradley Cone Elementary Guilford -12.20% -9.70%
Curry E. Bryan, IV Graham Middle Alamance-
Burlington -3.40% 0.40%
Catherine Cecchini
Moreland Hairston Middle Guilford 1.90% -3.90%
Tom Ehlers Montlieu Elementary Guilford 12.40% 11.00%
Madison Hester Peeler Open Elementary Guilford -4.40% 2.20%
Traci Horton Haw River Elementary Alamance-
Burlington -1.60% -11.70%
Candace Hudson Hunter Elementary Guilford 3.10% 14.60%
Malinda Kerns Hall-Woodward
Elementary
Winston
Salem Forsyth -5.10% -4.10%
Noelle Leslie Northeast Guilford High
School Guilford -2.00% 7.90%
Duane Lewis Welborn Middle Guilford 2.90% 5.70%
Bobbie Lynch Walkertown Middle Winston
Salem Forsyth -4.20% -5.70%
Barbara McRae Kiser Middle Guilford -1.90% 0.40%
Yajaira Owens Loflin Elementary Asheboro
City 4.60% 2.80%
Teresa Rose Kernersville Elementary Winston
Salem Forsyth 7.60% 3.20%
Christopher Scott Dudley High School Guilford -3.10% 14.60%
Michelle Varoutsos Old Town Elementary Winston
Salem Forsyth -5.00% -1.20%
Ashley Westmoreland Hillcrest Elementary Alamance-
Burlington 7.10% 10.70%

North Carolina Leadership Academies: Final 2013 Report
March 2014
Consortium for Educational Research and Evaluation–North Carolina 103
Table G27. RLA Cohort 3 Internships, SLA, Total Change in Percentages, 2009–2012
Name School of Internship LEA
Total Change in
Percentages
English I/ Reading
Algebra I/ Mathematics
Stephanie Norris Clarkton School of
Discovery Bladen County -5.70% -2.20%
Jimmy Price South Columbus High
School Columbus County 3.90% 9.70%
Rachel Smith Acme-Delco
Elementary Columbus County -4.20% -4.70%
Chad Barbour Elizabeth Cashwell
Elementary Cumberland County 6.30% 10.70%
Corine Warren Brentwood
Elementary Cumberland County 8.10% 13.90%
Grisel Cuadrado-
Gabot Highland Elementary Harnett County 2.10% 4.70%
Kimberly Davis Lillington-Shawtown
Elementary Harnett County 2.70% -5.90%
Catherine Jones South Harnett
Elementary Harnett County 6.50% 7.20%
Chris Pearson Western Harnett High
School Harnett County 8.60% 2.10%
Tonja McGill Sandy Grove Middle Hoke County N/A N/A
Angela Colvin Tramway Elementary Lee County -6.90% -5.00%
Crystal Colwell Lee County High
School Lee County -12.40% -9.40%
Wendy Perrell B. T. Bullock
Elementary Lee County 3.50% 5.70%
Christopher Jonassen West Middle Montgomery County 4.60% 7.30%
Julia Brown New Century Middle Moore County -1.50% -0.70%
Clarkie Hussey Sandhills Farm Life
Elementary Moore County 0.60% 4.70%
Shaun Krencicki Union Pines High
School Moore County 7.70% 20.40%
Jennifer Wiley Elise Middle Moore County 4.10% -0.50%
Regina Hyde Peterson Elementary Robeson County 0.00% -1.20%
Kristi Maultsby Tabor City Elementary Columbus County -1.20% 0.00%
Note: Sandy Grove Middle opened in 2013-14.

North Carolina Leadership Academies: Final 2013 Report
March 2014
Consortium for Educational Research and Evaluation–North Carolina 104
Table G28. RLA Cohort 3 Internships, NELA, 2009–10 School Data
School of
Placement
English I/
Reading
Algebra I/
Math-
ematics Designation AYP
Percentage
of Low-
Income
Students
School
Size
Roanoke Rapids
High School 80.50% 52.10% School of Progress
Not Met
(11 of 15 Targets Met) 35.72% 847
SW Edgecombe
High School 69.80% 46.30% School of Progress
Not Met
(12 of 17 Targets Met) 43.85% 931
Bertie High School 75.20% 78.80% School of Progress Met 13 of 13 Targets 53.62% 666
Bertie Middle
School 53.00% 80.30% School of Progress
Not Met
(20 of 21 Targets Met) 75.95% 658
Chaloner Middle
School 69.20% 86.60% School of Progress
Not Met
(20 of 21 Targets Met) 44.87% 578
Roanoke Valley
Early College 64.50% 87.10% No Recognition Met 9 of 9 Targets 44.12% 64
G.C. Hawley
Middle School 72.50% 84.20% School of Progress Met 21 of 21 Targets 32.64% 632
Wilton Elementary 77.30% 92.40% School of
Distinction Met 13 of 13 Targets 33.33% 625
Youngsville
Elementary 79.20% 90.30%
School of
Distinction Met 17 of 17 Targets 37.23% 450
East End
Elementary 52.30% 70.90% Priority School Met 13 of 13 Targets 89.80% 295
Hertford County
Middle School 46.20% 65.20% Priority School
Not Met
(17 of 21 Targets Met) 66.80% 451
Southeast Halifax
High School 36.50% 20.70% Priority School
Not Met
(7 of 13 Targets Met) 77.93% 541
Tarboro High
School 75.40% 65.00% School of Progress Met 17 of 17 Targets 48.56% 700
Windsor
Elementary 50.90% 74.80% School of Progress
Not Met
(12 of 13 Targets Met) 80.42% 429
South Creek
Middle School 64.70% 77.00% School of Progress Met 15 of 15 Targets 77.24% 256
West Bertie
Elementary 56.10% 76.00% School of Progress Met 13 of 13 Targets 89.41% 375
Manning
Elementary 69.20% 82.90% School of Progress
Not Met
(19 of 21 Targets Met) 44.88% 667
Mary Potter Middle
School 61.10% 77.50% School of Progress Met 19 of 19 Targets 61.94% 434
Bearfield Primary 52.30% 63.80% Priority School Not Met
(12 of 15 Targets Met) 77.63% 760
Warren New Tech
High School 77.40% 58.60% No Recognition Met 5 of 5 Targets 56.56% 168
Note: South Creek Middle School was called Roanoke Middle School in 2009-10.

North Carolina Leadership Academies: Final 2013 Report
March 2014
Consortium for Educational Research and Evaluation–North Carolina 105
Table G29. RLA Cohort 3 Internships, NELA, 2010–11 School Data
School of
Placement English I/ Reading
Algebra
I/ Math-
ematics Designation AYP
Percentage
of Low-
Income
Students School
Size
Roanoke Rapids
High School 80.40% 62.20% School of Progress
Not Met
(11 of 17 Targets Met) 43.28% 830
SW Edgecombe
High School 66.90% 39.90% School of Progress
Not Met
(12 of 17 Targets Met) 51.86% 914
Bertie High School 53.80% 59.70% No Recognition Met 13 of 13 Targets 76.80% 565
Bertie Middle
School 47.60% 80.30% School of Progress
Not Met
(16 of 21 Targets Met) 71.10% 639
Chaloner Middle
School 67.50% 87.70% School of Progress
Not Met
(16 of 21 Targets Met) 45.97% 646
Roanoke Valley
Early College 70.20% 87.70%
School of
Distinction Met 9 of 9 Targets 44.12% 112
G.C. Hawley
Middle School 73.60% 87.30%
School of
Distinction
Not Met
(24 of 25 Targets Met) 34.07% 675
Wilton Elementary 73.70% 90.10% School of
Distinction
Not Met
(13 of 17 Targets Met) 40.23% 627
Youngsville
Elementary 80.60% 90.70%
School of
Distinction Met 17 of 17 Targets 40.61% 469
East End
Elementary 52.80% 65.30% Priority School
Not Met
(7 of 13 Targets Met) 92.23% 288
Hertford County
Middle School 47.00% 61.30% Priority School
Not Met
(12 of 21 Targets Met) 73.95% 426
Southeast Halifax
High School 40.00% 6.30% Low Performing
Not Met
(7 of 13 Targets Met) 87.71% 493
Tarboro High
School 77.00% 57.70% School of Progress
Not Met
(12 of 16 Targets Met) 58.86% 663
Windsor
Elementary 47.20% 62.30% Priority School
Not Met
(9 of 15 Targets Met) 84.62% 408
South Creek
Middle School 71.50% 84.70% School of Progress
Not Met
(17 of 21 Targets Met) 64.27% 390
West Bertie
Elementary 50.50% 68.40% Priority School
Not Met
(7 of 13 Targets Met) 91.78% 383
Manning
Elementary 69.40% 82.90% School of Progress
Not Met
(20 of 21 Targets Met) 47.27% 660
Mary Potter Middle
School 64.20% 71.60% School of Progress
Not Met
(12 of 21 Targets Met) 56.91% 434
Bearfield Primary 52.60% 75.30% School of Progress Not Met
(10 of 13 Targets Met) 82.25% 758
Warren New Tech
High School 63.20% 62.50% No Recognition
Not Met
(4 of 5 Targets Met) 62.94% 216
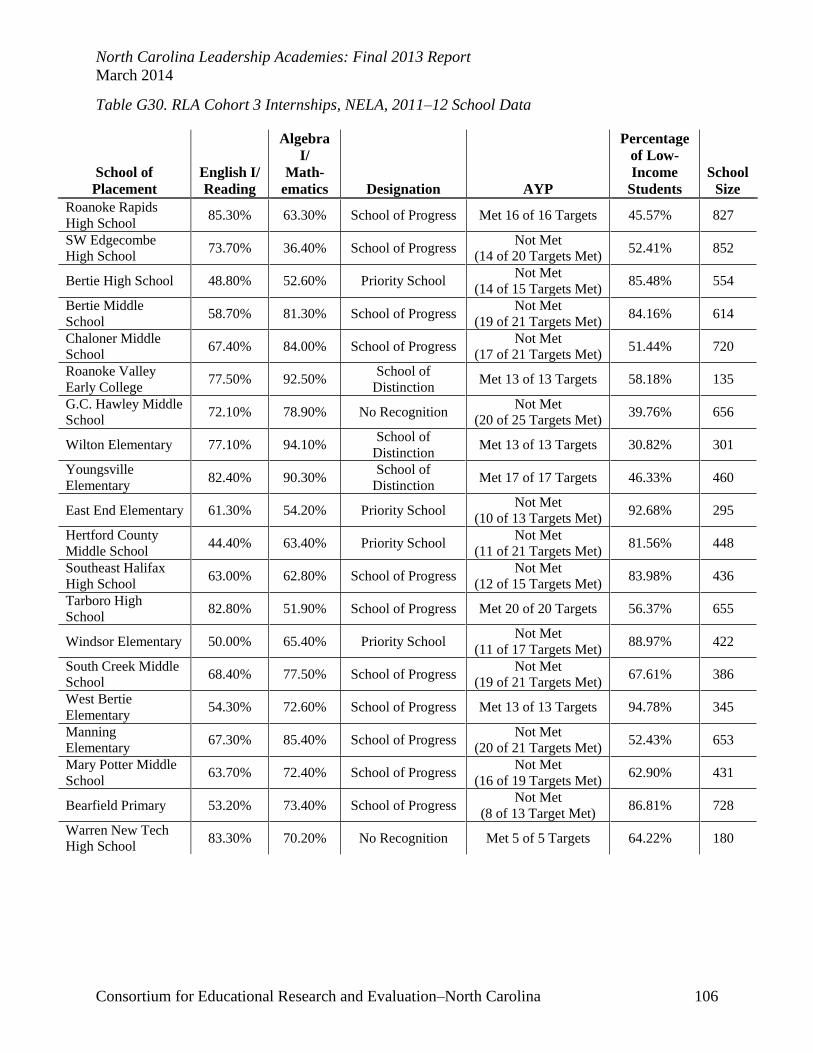
North Carolina Leadership Academies: Final 2013 Report
March 2014
Consortium for Educational Research and Evaluation–North Carolina 106
Table G30. RLA Cohort 3 Internships, NELA, 2011–12 School Data
School of
Placement English I/ Reading
Algebra
I/ Math-
ematics Designation AYP
Percentage
of Low-
Income
Students School
Size
Roanoke Rapids
High School 85.30% 63.30% School of Progress Met 16 of 16 Targets 45.57% 827
SW Edgecombe
High School 73.70% 36.40% School of Progress
Not Met
(14 of 20 Targets Met) 52.41% 852
Bertie High School 48.80% 52.60% Priority School Not Met
(14 of 15 Targets Met) 85.48% 554
Bertie Middle
School 58.70% 81.30% School of Progress
Not Met
(19 of 21 Targets Met) 84.16% 614
Chaloner Middle
School 67.40% 84.00% School of Progress
Not Met
(17 of 21 Targets Met) 51.44% 720
Roanoke Valley
Early College 77.50% 92.50%
School of
Distinction Met 13 of 13 Targets 58.18% 135
G.C. Hawley Middle
School 72.10% 78.90% No Recognition
Not Met
(20 of 25 Targets Met) 39.76% 656
Wilton Elementary 77.10% 94.10% School of
Distinction Met 13 of 13 Targets 30.82% 301
Youngsville
Elementary 82.40% 90.30%
School of
Distinction Met 17 of 17 Targets 46.33% 460
East End Elementary 61.30% 54.20% Priority School Not Met
(10 of 13 Targets Met) 92.68% 295
Hertford County
Middle School 44.40% 63.40% Priority School
Not Met
(11 of 21 Targets Met) 81.56% 448
Southeast Halifax
High School 63.00% 62.80% School of Progress
Not Met
(12 of 15 Targets Met) 83.98% 436
Tarboro High
School 82.80% 51.90% School of Progress Met 20 of 20 Targets 56.37% 655
Windsor Elementary 50.00% 65.40% Priority School Not Met
(11 of 17 Targets Met) 88.97% 422
South Creek Middle
School 68.40% 77.50% School of Progress
Not Met
(19 of 21 Targets Met) 67.61% 386
West Bertie
Elementary 54.30% 72.60% School of Progress Met 13 of 13 Targets 94.78% 345
Manning
Elementary 67.30% 85.40% School of Progress
Not Met
(20 of 21 Targets Met) 52.43% 653
Mary Potter Middle
School 63.70% 72.40% School of Progress
Not Met
(16 of 19 Targets Met) 62.90% 431
Bearfield Primary 53.20% 73.40% School of Progress Not Met
(8 of 13 Target Met) 86.81% 728
Warren New Tech
High School 83.30% 70.20% No Recognition Met 5 of 5 Targets 64.22% 180

North Carolina Leadership Academies: Final 2013 Report
March 2014
Consortium for Educational Research and Evaluation–North Carolina 107
Table G31. RLA Cohort 3 Internships, PTLA, 2009–10 School Data
School of
Placement English I/ Reading
Algebra I/ Math-
ematics Designation AYP
Percentage
of Low-
Income
Students School
Size
North Asheboro
Middle 56.90% 72.50% School of Progress
Not Met
(26 Of 27 Targets Met) 48.94% 456
High Point
Central High
School
69.90% 52.00% School of Progress Met 21 Of 21 Targets 60.57% 1287
Hanes Magnet
Middle 83.90% 87.70%
School of
Distinction Met 33 Of 33 Targets 38.37% 860
Wiley Middle
School 54.90% 66.30% School of Progress
Not Met
(24 Of 29 Targets Met) 71.85% 549
Allen Middle
School 57.20% 73.90% School of Progress
Not Met
(24 Of 29 Targets Met) 76.41% 660
Cone Elementary 51.50% 64.20% Priority School Not Met
(13 Of 17 Targets Met) 23.50% 420
Graham Middle
School 58.70% 76.00% School of Progress
Not Met
(27 Of 29 Targets Met) 71.30% 628
Hairston Middle
School 44.70% 67.80% Priority School
Not Met
(24 Of 25 Targets Met) 91.06% 544
Montlieu
Elementary 46.30% 71.20% Priority School Met 13 Of 13 Targets 81.10% 418
Peeler Open
Elementary 66.10% 77.40% School of Progress
Not Met
(16 Of 17 Targets Met) 48.96% 348
Haw River
Elementary 42.90% 66.70% Priority School Met 17 Of 17 Targets 84.30% 395
Hunter
Elementary 51.70% 72.90% Priority School Met 21 Of 21 Targets 93.44% 408
Hall-Woodward
Elementary 53.30% 81.70% School of Progress Met 21 Of 21 Targets 95.97% 771
Northeast
Guilford High
School
72.30% 55.80% School of Progress Not Met
(16 Of 17 Targets Met) 47.99% 1122
Welborn Middle
School 50.90% 71.70% School of Progress
Not Met
(20 Of 21 Targets Met) 72.41% 543
Walkertown
Middle School 63.30% 77.90% School of Progress
Not Met
(20 Of 21 Targets Met) 56.16% 594
Kiser Middle
School 65.60% 78.20% School of Progress
Not Met
(26 Of 29 Targets Met) 54.11% 758
Loflin
Elementary 54.60% 78.20% School of Progress Met 17 Of 17 Targets 70.02% 361
Kernersville
Elementary 62.40% 81.80% School of Progress Met 29 Of 29 Targets 59.88% 885
Dudley High
School 67.50% 38.20% Priority School
Not Met
(10 Of 17 Targets Met) 68.23% 1493
Old Town
Elementary 58.20% 80.60% School of Progress Met 21 Of 21 Targets 92.28% 625
Hillcrest
Elementary 57.50% 72.90% Priority School
Not Met
(26 Of 27 Targets Met) 67.50% 582

North Carolina Leadership Academies: Final 2013 Report
March 2014
Consortium for Educational Research and Evaluation–North Carolina 108
Table G32. RLA Cohort 3 Internships, PTLA, 20010–11 School Data
School of
Placement English I/ Reading
Algebra I/ Math-
ematics Designation AYP
Percentage
of Low-
Income
Students School
Size
North Asheboro
Middle 54.70% 74.10%
School of
Progress
Not Met
(20 of 29 Targets Met) 69.89% 503
High Point Central
High School 67.10% 48.50%
School of
Progress
Not Met
(15 of 23 Targets Met) 63.74% 1294
Hanes Magnet
Middle 83.90% 87.50%
School of
Distinction
Not Met
(30 of 37 Targets Met) 28.94% 1063
Wiley Middle
School 57.30% 65.00%
School of
Progress
Not Met
(19 of 29 Targets Met) 73.78% 489
Allen Middle
School 57.40% 68.90%
School of
Progress
Not Met
(21 of 29 Targets Met) 78.35% 686
Cone Elementary 46.90% 62.20% Priority School Not Met
(7 of 13 Targets Met) 94.41% 395
Graham Middle
School 56.90% 74.60%
School of
Progress
Not Met
(17 of 29 Targets Met) 76.62% 677
Hairston Middle
School 42.50% 60.10% Priority School
Not Met
(14 of 25 Targets Met) 90.03% 571
Montlieu
Elementary 49.20% 74.30% Priority School
Not Met
(10 of 13 Targets Met) 88.44% 406
Peeler Open
Elementary 70.90% 80.20%
School of
Progress Met 17 of 17 Targets 57.76% 357
Haw River
Elementary 41.80% 65.50% Priority School
Not Met
(13 of 23 Targets Met) 87.61% 433
Hunter Elementary 59.10% 86.70% School of
Progress
Not Met
(20 of 21 Targets Met) 95.75% 424
Hall-Woodward
Elementary 50.70% 79.20%
School of
Progress
Not Met
(11 of 21 Targets Met) 96.96% 782
Northeast Guilford
High School 71.20% 51.90% No Recognition
Not Met
(3 of 17 Targets Met) 52.51% 1097
Welborn Middle
School 55.80% 72.50%
School of
Progress
Not Met
(17 of 25 Targets Met) 79.38% 522
Walkertown Middle
School 65.50% 82.40%
School of
Progress
Not Met
(19 of 25 Targets Met) 58.19% 608
Kiser Middle
School 65.00% 80.40%
School of
Progress
Not Met
(21 of 29 Targets Met) 58.81% 824
Loflin Elementary 58.30% 79.80% School of
Progress
Not Met
(14 of 17 Targets Met) 78.40% 364
Kernersville
Elementary 61.70% 83.90%
School of
Progress
Not Met
(20 of 29 Targets Met) 62.85% 871
Dudley High
School 68.40% 39.90% No Recognition
Not Met
(16 of 17 Targets Met) 75.71% 1449
Old Town
Elementary 60.10% 79.90% No Recognition
Not Met
(14 of 21 Targets Met) 94.88% 614
Hillcrest
Elementary 58.10% 72.30%
School of
Progress
Not Met
(17 of 25 Targets Met) 76.78% 530

North Carolina Leadership Academies: Final 2013 Report
March 2014
Consortium for Educational Research and Evaluation–North Carolina 109
Table G33. RLA Cohort 3 Internships, PTLA, 2011–12 School Data
School of
Placement
English I/
Reading
Algebra I/
Math-
ematics Designation AYP
Percentage
of Low-
Income
Students
School
Size
North Asheboro
Middle 52.10% 67.20% Priority School
Not Met
(16 of 29 Targets Met) 77.19% 534
High Point Central
High School 72.50% 53.60%
School of
Progress
Not Met
(21 of 23 Targets Met) 63.11% 1367
Hanes Magnet
Middle 82.80% 85.40%
School of
Distinction
Not Met
(33 of 77 Targets Met) 28.48% 1078
Wiley Middle
School 52.30% 60.70% Priority School
Not Met
(19 of 29 Targets Met) 77.05% 462
Allen Middle
School 53.90% 71.40%
School of
Progress
Not Met
(20 of 29 Targets Met) 81.65% 692
Cone Elementary 39.30% 54.50% Low Performing Not Met
(7 of 13 Targets Met) 94.46% 402
Graham Middle
School 55.30% 76.40%
School of
Progress
Not Met
(20 of 29 Targets Met) 76.63% 644
Hairston Middle
School 46.60% 63.90% Priority School
Not Met
(15 of 25 Targets Met) 90.07% 626
Montlieu
Elementary 58.70% 82.20%
School of
Progress Met 13 of 13 Targets 88.78% 445
Peeler Open
Elementary 61.70% 79.60%
School of
Progress
Not Met
(18 of 21 Targets Met) 56.70% 376
Haw River
Elementary 41.30% 55.00% Priority School
Not Met
(14 of 23 Targets Met) 90.53% 467
Hunter Elementary 54.80% 87.50% School of
Progress
Not Met 18 of 21
Targets Met) 93.27% 438
Hall-Woodward
Elementary 48.20% 77.60% No Recognition
Not Met
(16 of 21 Targets Met) 96.88% 762
Northeast Guilford
High School 70.30% 63.70% No Recognition
Not Met
(21 of 23 Targets Met) 52.98% 1060
Welborn Middle
School 53.80% 77.40%
School of
Progress
Not Met
(20 of 25 Targets Met) 79.54% 508
Walkertown Middle
School 59.10% 72.20% No Recognition
Not Met
(14 of 25 Targets Met) 58.95% 686
Kiser Middle
School 63.70% 78.60% No Recognition
Not Met
(22 of 27 Targets Met) 58.10% 947
Loflin Elementary 59.20% 81.50% School of
Progress
Not Met
(13 of 17 Targets Met) 82.13% 343
Kernersville
Elementary 70.00% 85.00%
School of
Progress Met 29 of 29 Targets 67.46% 877
Dudley High
School 64.40% 52.80%
School of
Progress Met 16 of 16 Targets 77.83% 1373
Old Town
Elementary 53.20% 79.40% No Recognition
Not Met
(18 of 21 Targets Met) 97.72% 591
Hillcrest
Elementary 64.60% 83.60%
School of
Progress Met 21 of 21 Targets 78.56% 486

North Carolina Leadership Academies: Final 2013 Report
March 2014
Consortium for Educational Research and Evaluation–North Carolina 110
Table G34. RLA Cohort 3 Internships, SLA, 2009–10 School Data
School of Placement
English I/
Reading
Algebra I/
Math-
ematics Designation AYP
Percentage
of Low-
Income
Students
School
Size
Clarkton School of
Discovery 75.40% 81.90% School of Progress
Not Met
(16 of 17 Targets Met) 55.23% 324
South Columbus
High School 89.60% 76.80%
School of
Distinction
Not Met
(9 of 17 Targets Met) 49.36% 690
Acme-Delco
Elementary 66.50% 82.40% School of Progress Met 17 of 17 Targets 68.92% 352
Elizabeth Cashwell
Elementary 50.50% 64.10% Priority School Met 19 of 19 Targets 77.23% 744
Brentwood
Elementary 51.30% 64.30% Priority School
Not Met
(12 of 15 Targets Met) 76.94% 524
Highland Elementary 67.30% 72.80% No Recognition Not Met
(17 of 19 Targets Met) 35.96% 876
Lillington-Shawtown
Elementary 54.00% 73.90% School of Progress
Not Met
(15 of 17 Targets Met) 67.53% 598
South Harnett
Elementary 57.60% 65.80% No Recognition
Not Met
(19 of 23 Targets Met) 59.00% 444
Western Harnett
High School 71.10% 71.00% School of Progress
Not Met
(14 of 17 Targets Met) 48.11% 1209
Sandy Grove Middle
School N/A N/A N/A N/A N/A N/A
Tramway
Elementary 87.10% 94.80%
School of
Distinction Met 17 of 17 Targets 35.91% 683
Lee County High
School 76.60% 66.80% School of Progress Met 21 of 21 Targets 48.79% 1348
B. T. Bullock
Elementary 62.90% 78.40% School of Progress
Not Met
(25 of 27 Targets Met) 67.94% 645
West Middle School 57.50% 70.10% School of Progress Not Met
(18 of 21 Targets Met) 58.74% 463
New Century Middle 79.30% 88.00% School of
Distinction
Not Met
(24 of 25 Targets Met) 40.00% 905
Sandhills Farm Life
Elementary 78.90% 86.90%
School of
Distinction Met 13 of 13 Targets 24.00% 517
Union Pines High
School 83.90% 69.10%
School of
Distinction
Not Met
(12 of 15 Targets Met) 31.00% 1174
Elise Middle School 64.80% 84.90% School of Progress Met 21 of 21 Targets 81.00% 205
Peterson Elementary 48.80% 69.60% Priority School Not Met
(19 of 23 Targets Met) 85.44% 522
Tabor City
Elementary 67.60% 75.70% School of Progress Met 17 of 17 Targets 70.78% 493

North Carolina Leadership Academies: Final 2013 Report
March 2014
Consortium for Educational Research and Evaluation–North Carolina 111
Table G35. RLA Cohort 3 Internships, SLA, 2010–11 School Data
School of Placement
English I/
Reading
Algebra I/
Math-
ematics Designation AYP
Percentage
of Low-
Income
Students
School
Size
Clarkton School of
Discovery 74.00% 77.10% No Recognition
Not Met
(13 of 17 Targets Met) 61.61% 349
South Columbus
High School 72.20% 69.70% No Recognition
Not Met
(12 of 15 Targets Met) 58.43% 743
Acme-Delco
Elementary 64.30% 78.90% No Recognition
Not Met
(11 of 17 Targets Met) 73.85% 357
Elizabeth Cashwell
Elementary 57.50% 69.40% No Recognition
Not Met
(19 of 21 Targets Met) 79.14% 715
Brentwood
Elementary 52.40% 65.70% Priority School
Not Met
(7 of 13 Targets Met) 80.62% 516
Highland Elementary 66.50% 70.00% No Recognition Not Met
(15 of 21 Targets Met) 38.69% 874
Lillington-Shawtown
Elementary 53.60% 68.30% No Recognition
Not Met
(11 of 21 Targets Met) 69.44% 619
South Harnett
Elementary 61.60% 69.10% No Recognition
Not Met
(17 of 25 Targets Met) 64.81% 505
Western Harnett
High School 74.60% 74.10% School of Progress
Not Met
(17 of 21 Targets Met) 50.26% 1217
Sandy Grove Middle
School N/A N/A N/A N/A N/A N/A
Tramway
Elementary 84.70% 91.90%
School of
Distinction Met17 of 17 Targets 35.72% 691
Lee County High
School 75.80% 65.60% School of Progress
Not Met
(19 of 21 Targets Met) 51.24% 1341
B. T. Bullock
Elementary 66.00% 85.70% School of Progress
Not Met
(24 of 25 Targets Met) 69.92% 630
West Middle School 62.10% 70.50% School of Progress Not Met
(13 of 21 Targets Met) 67.17% 466
New Century Middle 80.50% 88.80% School of
Distinction
Not Met
(18 of 21 Targets Met) 39.96% 533
Sandhills Farm Life
Elementary 81.10% 89.60%
School of
Distinction
Not Met
(11 of 13 Targets Met) 24.29% 534
Union Pines High
School 88.50% 77.80%
School of
Distinction
Not Met
(12 of 17 Targets Met) 35.05% 1181
Elise Middle School 65.20% 87.30% School of Progress Not Met
(15 of 21 Targets Met) 82.32% 210
Peterson Elementary 55.50% 72.30% No Recognition Not Met
(18 of 25 Targets Met) 91.08% 529
Tabor City
Elementary 68.80% 79.30% School of Progress
Not Met
(14 of 17 Targets Met) 77.11% 497
Note: Sandy Grove Middle opened in 2013-14.

North Carolina Leadership Academies: Final 2013 Report
March 2014
Consortium for Educational Research and Evaluation–North Carolina 112
Table G36. RLA Cohort 3 Internships, SLA, 2011–12 School Data
School of Placement
English I/
Reading
Algebra I/
Math-
ematics Designation AYP
Percentage
of Low-
Income
Students
School
Size
Clarkton School of
Discovery 69.70% 79.70% No Recognition
Not Met
(15 of 17 Targets Met) 54.49% 357
South Columbus
High School 93.50% 86.50%
Honor School of
Excellence Met 19 of 19 Targets 60.52% 752
Acme-Delco
Elementary 62.30% 77.70% School of Progress
Not Met
(14 of 17 Targets 80.75% 360
Elizabeth Cashwell
Elementary 56.80% 74.80% School of Progress
Not Met
(17 of 21 Targets Met) 81.17% 679
Brentwood
Elementary 59.40% 78.20% School of Progress Met 13 of 13 Targets 77.85% 492
Highland Elementary 69.40% 77.50% School of Progress Not Met
(22 of 23 Targets Met) 39.22% 871
Lillington-Shawtown
Elementary 56.70% 68.00% School of Progress
Not Met
(12 of 21 Targets Met) 69.29% 598
South Harnett
Elementary 64.10% 73.00% School of Progress
Not Met
(19 of 25 Targets Met) 59.26% 526
Western Harnett
High School 79.70% 73.10% School of Progress
Not Met
(24 of 25 Targets Met) 48.24% 1194
Sandy Grove Middle
School N/A N/A N/A N/A N/A N/A
Tramway
Elementary 80.20% 89.80% No Recognition Met 21 of 21 Targets 39.16% 692
Lee County High
School 64.20% 57.40% School of Progress
Not Met
(21 of 25 Targets Met) 55.20% 1361
B. T. Bullock
Elementary 66.40% 84.10% School of Progress
Not Met
(24 of 25 Targets Met) 73.78% 643
West Middle School 62.10% 77.40% School of Progress Not Met
(21 of 25 Targets Met) 66.81% 497
New Century Middle 77.80% 87.30% School of
Distinction Met 21 of 21 Targets 34.03% 547
Sandhills Farm Life
Elementary 79.50% 91.60%
School of
Distinction Met 13 of 13 Targets 27.19% 545
Union Pines High
School 91.60% 89.50% No Recognition Met 16 of 16 Targets 35.58% 1150
Elise Middle School 68.90% 84.40% School of Progress Met 21 of 21Targets 77.56% 209
Peterson Elementary 48.80% 68.40% Priority School Not Met
(17 of 25 Targets Met) 92.82% 603
Tabor City
Elementary 66.40% 75.70% No Recognition
Not Met
(18 of 21 Targets Met) 79.30% 452
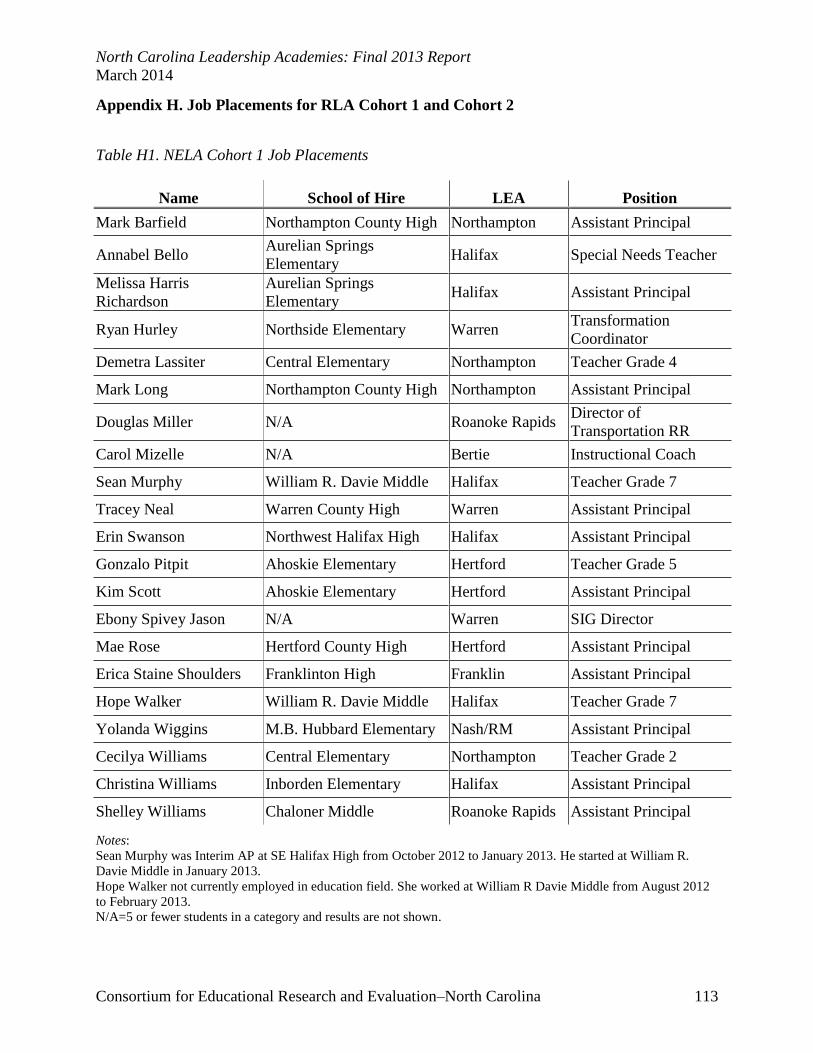
North Carolina Leadership Academies: Final 2013 Report
March 2014
Consortium for Educational Research and Evaluation–North Carolina 113
Appendix H. Job Placements for RLA Cohort 1 and Cohort 2
Table H1. NELA Cohort 1 Job Placements
Name School of Hire LEA Position
Mark Barfield Northampton County High Northampton Assistant Principal
Annabel Bello Aurelian Springs
Elementary Halifax Special Needs Teacher
Melissa Harris
Richardson
Aurelian Springs
Elementary Halifax Assistant Principal
Ryan Hurley Northside Elementary Warren Transformation
Coordinator
Demetra Lassiter Central Elementary Northampton Teacher Grade 4
Mark Long Northampton County High Northampton Assistant Principal
Douglas Miller N/A Roanoke Rapids Director of
Transportation RR
Carol Mizelle N/A Bertie Instructional Coach
Sean Murphy William R. Davie Middle Halifax Teacher Grade 7
Tracey Neal Warren County High Warren Assistant Principal
Erin Swanson Northwest Halifax High Halifax Assistant Principal
Gonzalo Pitpit Ahoskie Elementary Hertford Teacher Grade 5
Kim Scott Ahoskie Elementary Hertford Assistant Principal
Ebony Spivey Jason N/A Warren SIG Director
Mae Rose Hertford County High Hertford Assistant Principal
Erica Staine Shoulders Franklinton High Franklin Assistant Principal
Hope Walker William R. Davie Middle Halifax Teacher Grade 7
Yolanda Wiggins M.B. Hubbard Elementary Nash/RM Assistant Principal
Cecilya Williams Central Elementary Northampton Teacher Grade 2
Christina Williams Inborden Elementary Halifax Assistant Principal
Shelley Williams Chaloner Middle Roanoke Rapids Assistant Principal
Notes:
Sean Murphy was Interim AP at SE Halifax High from October 2012 to January 2013. He started at William R.
Davie Middle in January 2013.
Hope Walker not currently employed in education field. She worked at William R Davie Middle from August 2012
to February 2013.
N/A=5 or fewer students in a category and results are not shown.

North Carolina Leadership Academies: Final 2013 Report
March 2014
Consortium for Educational Research and Evaluation–North Carolina 114
Table H2. PTLA Cohort 1 Job Placements
Name School of Hire LEA Position
Jamyle Acevedo (“Kathy”) Union Hill Elementary Guilford ESL Teacher
Adrea Alexander High Point Central High Guilford Assistant Principal
Michelle Breen Forest Park Elementary Winston-Salem
Forsyth
Learning Team
Facilitator
Thomas Brookshire
(“Jeff”) Hanes Middle
Winston-Salem
Forsyth Assistant Principal
Jason Cayton (“Todd”) Eastern Middle Guilford Assistant Principal
Ronnie Christian WSFCS Career Center Winston-Salem
Forsyth Assistant Principal
Amy Day Reedy Fork Elementary Guilford Curriculum
Facilitator
Melvin Diggs Ray Street Academy Alamance-Burlington Assistant Principal
Cassandra Dobson Konnoak Elementary Winston-Salem
Forsyth Assistant Principal
Scarlet Evans Hall-Woodward
Elementary
Winston-Salem
Forsyth Assistant Principal
Keisha Gabriel Philo-Hill Magnet
Academy
Winston-Salem
Forsyth Assistant Principal
Shadonna Gunn Grove Park Elementary Alamance-Burlington
Principal
Jusmar Maness Southern Middle Guilford Assistant Principal
Charnelle Newkirk Oak Hill Elementary Guilford Assistant Principal
Ian Olsen Wiley Middle Winston-Salem
Forsyth Assistant Principal
Stephanie Rakes Ragsdale High Guilford Curriculum
Facilitator/Reading
Chameeka Smith Graham High Alamance-Burlington Assistant Principal
Ashley Triplett Aycock Middle Guilford Assistant Principal
Weaver Walden Ferndale Middle Guilford Assistant Principal
Cynthia White Jones Elementary Guilford Assistant Principal
Hollis Wroblewski
(“Holly”) Haw River Elementary Alamance-Burlington Assistant Principal
Notes:
Cassandra Dobson worked as an Instructional Coach at Speas Elementary from August 2012 – April 2013. She
started at Konnoak in April 2013.
Scarlet Evans worked as a Curriculum Coordinator at North Hills Elementary from August 2012 – December 2012. She
started at Hall-Woodward in January 2013.
Shadonna Gunn worked as the Assistant Principal at Eastlawn Elementary from August 2012 – December 2012. She
started at Grove Park in January 2013.

North Carolina Leadership Academies: Final 2013 Report
March 2014
Consortium for Educational Research and Evaluation–North Carolina 115
Table H3. SLA Cohort 1 Job Placements
Name School of Hire LEA Position
Angela D. Wright Boone Trail Elementary Harnett Assistant Principal
Robert Forrest Breyer Pinecrest High Moore Assistant Principal
Dante Pool Pinecrest High Moore Assistant Principal
Jennifer C. Purvis North Moore High Moore Principal
Maresa Dutton Phillips Lilesville Elementary Anson Principal
Lawrence L. Smalls II E.E. Smith High Cumberland Assistant Principal
LamonicaTillery Alderman Road Elementary Cumberland Assistant Principal
Evan L. Roush Cumberland Mills Elementary Cumberland Assistant Principal
Adam Michael Mowery Angier Elementary Harnett Assistant Principal
Amy Lynn Parsons Green Ridge Elementary Montgomery Assistant Principal
David Renninger Sandy Grove Elementary Hoke Assistant Principal
Shelly F. Cullipher Edgewood Elementary Whiteville City Principal
Dianna W. Bellamy Tabor City Middle Columbus Principal
Camilla Price House N/A Harnett Director Grades 3-5
Penny McNeill-Lind J.R. Ingram Elementary Lee Assistant Principal
Elizabeth Faulk Bridges SanLee Middle Lee Assistant Principal
Cynthia Ann Lewis Red Springs High Robeson Assistant Principal
Tara Dee Bullard Piney Grove Elementary Robeson Assistant Principal
Joyce Morgan McRae Richmond County Senior High Richmond Assistant Principal
Barbara Denise Adams I. Ellis Johnson Elementary Scotland Assistant Principal
Notes:
Jennifer Purvis worked as Principal of Vass Lakeview Elementary from June 2012 – October 2012.
She started at North Moore High in November 2012.
Shelly Cullipher worked as Principal at North Whiteville Academy from July 2012 – January 2013.
She started at Edgewood Elementary in January 2013.
N/A=5 or fewer students in a category and results are not shown.

North Carolina Leadership Academies: Final 2013 Report
March 2014
Consortium for Educational Research and Evaluation–North Carolina 116
Table H4. NELA Cohort 2 Job Placements
Name School of Hire LEA Position
Amy Pearce Stocks Elementary Edgecombe Assistant Principal
Vernedette Garland Nashville Elementary Nash-Rocky Mount Assistant Principal
Kelly Shelton Mudd Nash Central Middle Nash-Rocky Mount Assistant Principal
Tonya Little Riverside Middle Martin Assistant Principal
Kendrick Alston D.S. Johnson Elementary Nash-Rocky Mount Assistant Principal
Hugh Scott Southern Nash High Nash-Rocky Mount Assistant Principal
Teicher Patterson Everetts Elementary Halifax Assistant Principal
Lisa Pennington Long Mill Elementary Franklin Teacher Grade 3
Jackson Olsen Northern Vance High Vance Assistant Principal
Kimberly Allison Wilton Elementary Granville Assistant Principal
Jenifer Lewis Benvenue Elementary Nash-Rocky Mount Assistant Principal
Krista Fasioli Williford Elementary Nash-Rocky Mount Assistant Principal
Tim Mudd Southern Nash High Nash-Rocky Mount Assistant Principal
Jennifer Berry Red Oak Elementary Nash-Rocky Mount Assistant Principal
Jennifer Berry Swift Creek Elementary Nash-Rocky Mount Assistant Principal
Zachary Marks Nash Central Middle Nash-Rocky Mount Assistant Principal
Erin Robbins Tar River Elementary Granville Assistant Principal
Angela Strother N/A Edgecombe AIG Facilitator
Larry Hodgkins South Creek Middle Martin Assistant Principal
Darren Gemzik South Edgecombe
Middle Edgecombe
Teacher Grade 6
SS/Science
Elizabeth Payne
Moran
JF Webb High School of
Health and Life Sciences Granville Assistant Principal
Lauren Greenhill Manning Elementary Roanoke Rapids Assistant Principal
Notes:
N/A=5 or fewer students in a category and results are not shown.
Jennifer Berry is Assistant Principal of Red Oak Elementary and Swift Creek Elementary simultaneously.

North Carolina Leadership Academies: Final 2013 Report
March 2014
Consortium for Educational Research and Evaluation–North Carolina 117
Table H5. PTLA Cohort 2 Job Placements
Name School of Hire LEA Position
Kristen Gravely Graham High Alamance-Burlington Assistant Principal
Thomas Kazimir Graham High Alamance-Burlington Assistant Principal
Dana Roseboro Newlin Elementary Alamance-Burlington Media Specialist
Ben Cawley N/A Guilford County Mission Possible
Specialist
Kevin Conaway Southeast Guilford
Middle Guilford County Assistant Principal
Vernon Hall Ferndale Middle Guilford County Assistant Principal
Darrell Harris Eastern Guilford Middle Guilford County Assistant Principal
Noel Keener Northeast Guilford High Guilford County Assistant Principal
Greta Martin Jamestown Middle Guilford County Teacher Grade 7
Janiese
McKenzie Northern Guilford High Guilford County Assistant Principal
Rashad Slade N/A Guilford County Director of Instructional
Technology
Chelsea Smith Wiley Elementary Guilford County Assistant Principal
Toks Wall Rankin Elementary Guilford County Teacher Grade 5
Kimberly Ashby Walkertown High Winston-
Salem/Forsyth Assistant Principal
Kathy Bryant Bolton Elementary Winston-
Salem/Forsyth Assistant Principal
Jonathan
Hegedus Kernersville Elementary
Winston-
Salem/Forsyth Assistant Principal
Larnitha Hunter Ibraham Elementary Winston-
Salem/Forsyth Assistant Principal
Nicole Kurtz West Forsyth High Winston-
Salem/Forsyth Teacher English III
Susan T Miller Griffith Elementary Winston-
Salem/Forsyth
Learning Team
Facilitator
Colin Tribby The Downtown School Winston-
Salem/Forsyth Assistant Principal
Notes:
N/A=5 or fewer students in a category and results are not shown.
Nicole Kurtz worked as an English I Honors Teacher at Atkins Academic/Tech High from August 2013 – December
2013. She started at West Forsyth High in January 2014.

North Carolina Leadership Academies: Final 2013 Report
March 2014
Consortium for Educational Research and Evaluation–North Carolina 118
Table H6. SLA Cohort 2 Job Placements
Name School of Hire LEA Position
Marci Houseman Southern Pines Primary Moore Principal
Pam Lewis Washington Park Elementary Scotland Principal
Leslie Bailey Hawk Eye Elementary Hoke Assistant Principal
Anthony Barton Purnell Swett High Robeson Assistant Principal
Jennifer Brach L.J. Bell Elementary Richmond Assistant Principal
Maxine Brown Hamlet Middle Richmond Assistant Principal
Melissa Brewer East Lee Middle Lee Assistant Principal
Kelly Bullard Tabor City Middle Columbus Lead Teacher
Elizabeth Cole Elizabethtown Middle Bladen Assistant Principal
Kisha Derr SanLee Middle Lee Assistant Principal
Katrina Fox Southern Pines Elementary Moore Assistant Principal
Lisa Hain J. Glenn Edwards Elementary Lee Assistant Principal
Andrew Keller Lee County High Lee Assistant Principal
Matt McLean J.R. Ingram Elementary Lee Assistant Principal
Tracy Metcalf Union Pines High Moore Assistant Principal
Matt Moore Southern Middle Moore Assistant Principal
Mike Picciano Douglas Byrd Middle Cumberland Assistant Principal
Christy Sharpe Broadway Elementary Lee Teacher
Jennifer Spivey Boone Trail Elementary Harnett Assistant Principal
Joy Smart Scotland High Scotland Assistant Principal
Kristy West N/A Robeson Instructional Specialist
Note: N/A=5 or fewer students in a category and results are not shown.

North Carolina Leadership Academies: Final 2013 Report
March 2014
Consortium for Educational Research and Evaluation–North Carolina 119
Appendix I. Summary Statistics for Cohort 1’s and Cohort 2’s Job Placement Schools
Table I1. NELA Cohort 1 Job Placement Schools*
Counties/Schools
per Hire 2008-09 2009-10 2010-11 2011-12 2012-13^ Achievement Comparisons
Low Performing 5 4 4 1
Change from
2008-09 to
2011-12
Change from 2011-
12 to
2012-13^
Priority Schools 8 4 3 7
Schools of Progress 5 8 9 6
No Recognition 0 1 1 0
School of Distinction 0 1 1 4
Bertie = 1
Franklin = 1
Halifax = 6
Hertford = 3
Nash = 1
Northampton = 4
Roanoke Rapids = 2
Warren = 3
Average %
Students
F/RL = 75%
Average School
Size = 484
8/18 met AYP
Reading/English
I Range =
29.3%-75.7%
Average = 50%
Mathematics/Alg
ebra I Range =
18.1%-80.9%
Average =
53.2%
% students F/RL
Range = 38.9%-
93.9%
Average =
70.9%
School size
Range = 178-900
Average = 483.2
3/18 met AYP
Reading/English I
Range = 24.5%-
82.5%
Average = 56.5%
Mathematics/Alge
bra I Range =
29.4%-86.6%
Average = 62.5%
% students F/RL
Range = 38.9%-
92.8%
Average = 74.2%
School size Range
= 285-812
Average = 491.2
3/18 met AYP
Reading/English
I Range =
17.4%-80.4%
Average = 55.9%
Mathematics/Alg
ebra I Range =
28.5%-87.7%
Average = 62.1%
% students F/RL
Range = 41.3%-
97.3%
Average = 77%
School size
Range = 291-842
Average = 482.7
3/18 met 100%
AMO
Reading/English
I Range =
28.4%-84.5%
Average = 55.9%
Mathematics/Alg
ebra I Range =
33.7%-84%
Average = 66.4%
% students F/RL
Range = 46.7%-
93.4%
Average = 77.9%
School size
Range = 290-922
Average = 480.3
X/18 met X%
AYP or AMO
Reading/English I
Range = XX%-
XX%
Average = XX%
Mathematics/Alge
bra I Range =
XX%-XX%
Average = XX%
% students F/RL Range = XX%-
XX%
Average = XX%
School size Range
= XX%-XX%
Average = XX%
Reading/English I
Average:
+5.9% with Range:
-12.9% to +24%
Average between
years: +2%
Mathematics/
Algebra I
Average: +13.2%
with Range:
-8.3% to +39.6%
Average between years: +4.4%
Reading/English I
Change between
years: XX%
Range:
XX% to XX%
Mathematics/
Algebra I
Change between
years:
XX%
Range: XX% to XX%
* Three fellows have district-level positions, so school-specific data cannot be recorded. Therefore, this school-level data reflects 18 fellows and their job placements.
^Data not available at time of report.

North Carolina Leadership Academies: Final 2013 Report
March 2014
Consortium for Educational Research and Evaluation–North Carolina 120
Table I2. PTLA Cohort 1 Job Placement Schools*
Counties/Schools
per Hire 2008-09 2009-10 2010-11 2011-12 2012-13^ Achievement Comparisons
Low Performing 3 1 0 0
Change from 2008-
09 to
2011-12
Change from 2011-
12 to
2012-13^
Priority Schools 6 5 6 6
Schools of Progress 8 9 11 9
No Recognition 2 3 2 4
School of Distinction 0 1 1 1
Alamance-
Burlington = 4
Guilford = 10
Winston-Salem/
Forsyth = 7
Average %
Students
F/RL = 71.4%
Average School
Size = 670
12/20 met AYP
Reading/English
I Range =
17.1%-76.3%
Average =
50.7%
Mathematics/Algebra I Range =
25.4%-85.1%
Average =
62.4%
% students F/RL
Range = 32.7%-
100%
Average =
67.7%
School size
Range = 70-1469
Average = 651.8
8/19 met AYP
Reading/English I
Range = 31.2%-
83.9%
Average = 54.7%
Mathematics/Alge
bra I Range =
26.8%-87.7%
Average = 66.2%
% students F/RL
Range = 38.4%-
96%
Average = 70%
School size Range
= 64-1386
Average = 659.2
2/20 met AYP
Reading/English
I Range =
25.5%-83.9%
Average = 56.3%
Mathematics/Alg
ebra I Range =
34%-87.5%
Average = 70.1%
% students F/RL
Range = 28.9%-
97.7%
Average = 73.1%
School size
Range = 72-1365
Average = 677.3
2/20 met AMO
Reading/English
I Range =
19.2%-82.8%
Average = 55.3%
Mathematics/Alg
ebra I Range =
28%-86.8%
Average = 68.9%
% students F/RL
Range = 28.5%-
98.6%
Average = 74.7%
School size
Range = 112-
1367
Average = 692.3
X/20 met X%
AYP or AMO
Reading/English
I Range =
XX%-XX%
Average =
XX%
Mathematics/Algebra I Range =
XX%-XX%
Average =
XX%
% students F/RL
Range = XX%-
XX%
Average =
XX%
School size
Range
= XX%-XX%
Average =
XX%
Reading/English I
Average: +4.6 %
with Range:
-7.5% to +25.6%
Average between
years: +1.5%
Mathematics/
Algebra I Average:
+6.6% with Range:
-7.6% to +54.1%
Average between years: +2.2%
Reading/English I
Change between years: XX%
Range: XX% to XX%
Mathematics/
Algebra I
Change between
years: XX%
Range:
XX% to XX%
* One school did not have a designation for 2008-09 and 2009-10 or AYP for 2009-10. Another school does not administer state tests. This school-level data reflects 20
fellows and their job placements.
^Data not available at time of report.

North Carolina Leadership Academies: Final 2013 Report
March 2014
Consortium for Educational Research and Evaluation–North Carolina 121
Table I3. SLA Cohort 1 Job Placement Schools*
Counties/Schools
per Hire 2008-09 2009-10 2010-11 2011-12 2012-13^ Achievement Comparisons
Low Performing 0 0 0 0
Change from
2008-09 to
2011-12
Change from
2011-12 to
2012-13^
Priority Schools 4 1 2 2
Schools of Progress 13 11 8 8
No Recognition 2 4 3 7
School of Distinction 0 3 6 2
Anson = 1
Columbus = 1
Cumberland = 3
Harnett = 3
Hoke = 1
Lee = 2
Montgomery = 1
Moore = 3
Richmond = 1
Robeson = 2
Scotland = 1
Whiteville City = 1
Average %
Students
F/RL = 64.6%
Average School
Size = 766.4
10/19 met AYP
Reading/English
I Range =
49.5%-75.8%
Average =
61.9%
Mathematics/
Algebra I Range
= 9.5%-85.4%
Average =
60.5%
% students F/RL
Range = 27.2%-
94.9%
Average =
60.7%
School size
Range = 246-
1949
Average = 764.9
6/19 met AYP
Reading/English I
Range = 53.3%-
85.5%
Average = 65.6%
Mathematics/ Algebra I Range
= 35.8%-85.2%
Average = 73.6%
% students F/RL
Range = 28%-
93%
Average = 63.9%
School size
Range = 233-
1989
Average = 766.2
2/19 met AYP
Reading/English I
Range = 49.1%-
89.7%
Average = 65.9%
Mathematics/ Algebra I Range
= 30.4%-87.8%
Average = 74.2%
% students F/RL
Range = 31.2%-
95.8%
Average = 66.3%
School size
Range = 213-
2029
Average = 764.1
2/19 met AMO
Reading/English I
Range = 41%-
89.6%
Average = 65.9%
Mathematics/ Algebra I Range
= 41.3%-90.3%
Average = 76.3%
% students F/RL
Range = 33.8%-
94.6%
Average = 67.4%
School size
Range = 224-
1982
Average = 770.4
X/19 met X%
AYP or AMO
Reading/English
I Range =
XX%-XX%
Average =
XX%
Mathematics/
Algebra I Range
= XX%-XX%
Average =
XX%
% students F/RL
Range = XX%-
XX%
Average =
XX%
School size
Range = XX%-
XX%
Average =
XX%
Reading/
English I
Average: +4%
with Range:
-16.1% to +14.6%
Average between years: +1.3%
Mathematics/
Algebra I
Average: +15.8% with Range:
-11.3% to
+70.6%
Average between years: +5.3%
Reading/
English I
Change between years: XX%
Range: XX% to XX%
Mathematics/
Algebra I
Change between
years: XX%
Range: XX% to XX%
* One fellow has a district-level position, so school-specific data cannot be recorded. Therefore, this school-level data reflects 19 fellows and their job placements.
^Data not available at time of report.

North Carolina Leadership Academies: Final 2013 Report
March 2014
Consortium for Educational Research and Evaluation–North Carolina 122
Table I4. NELA Cohort 2 Job Placement Schools*
Counties/Schools
per Hire 2009-10 2010-11 2011-12 2012-13^ 2013-14^ Achievement Comparisons
Low Performing 0 1 2
Change from
2009-10 to
2012-13^
Change from
2012-13 to
2013-14^
Priority Schools 6 2 1
Schools of Progress 9 9 7
No Recognition 1 3 6
Schools of Distinction 4 4 4
Honor Sch .of Excel. 0 1 1
Edgecombe = 2
Franklin = 1
Granville = 3
Halifax = 1
Martin = 2
Nash = 10
RRGSD = 1
Vance = 1
Average %
Students
F/RL = %
Average School
Size =
6/20 met AYP
Reading/English I Range =
37.4%-85.1%
Average =
63.4%
Mathematics/Al
gebra I Range =
51.4%-92.9%
Average =
74.4%
% students F/RL
Range = 31.2%-
93.8%
Average =
57.5%
School size
Range = 256-
1184
Average =
603.9
2/20 met AYP
Reading/English I Range = 39.7%-
87.5%
Average = 63.9%
Mathematics/Algebra I Range =
46.2%-95%
Average = 76.1%
% students F/RL
Range = 31.7%-
94.1%
Average = 61.3%
School size
Range = 289-1231
Average = 607.4
9/21 met AYP
Reading/English I
Range = 37.7%-
91.4%
Average = 66%
Mathematics/Alge
bra I Range =
48%-94.1%
Average = 75.1%
% students F/RL
Range = 30.5%-
99.4%
Average = 60.8%
School size
Range = 289-1215
Average = 572.2
X/21 met AMO
Reading/English
I Range = XX%-
XX%
Average = XX%
Mathematics/Alg
ebra I Range =
XX%-XX%
Average = XX%
% students F/RL Range = XX%-
XX%
Average = XX%
School size
Range = XX%-
XX%
Average = XX%
X/21 met X%
AYP or AMO
Reading/English I Range =
XX%-XX%
Average =
XX%
Mathematics/Al
gebra I Range =
XX%-XX%
Average =
XX%
% students F/RL
Range = XX%-
XX%
Average =
XX%
School size
Range = XX%-
XX%
Average =
XX%
Reading/
English I
Average: XX%
with Range:
XX% to XX%
Average between years: XX%
Mathematics/
Algebra I
Average: XX%
with Range:
XX% to XX%
Average between
years: XX%
Reading/
English I
Change between years: XX%
Range: XX% to XX%
Mathematics/
Algebra I
Change between years:
XX%
Range:
XX% to XX%
* One fellow has a district-level position, so school-specific data cannot be recorded. Therefore, this school-level data reflects 21 fellows and their job placements. One
school did not open until 2011-12.
^Data not available at time of report.

North Carolina Leadership Academies: Final 2013 Report
March 2014
Consortium for Educational Research and Evaluation–North Carolina 123
Table I5. PTLA Cohort 2 Job Placement Schools*
Counties/Schools
per Hire 2009-10 2010-11 2011-12 2012-13^ 2013-14^ Achievement Comparisons
Low Performing 0 0 0
Change from
2009-10 to
2012-13^
Change from
2012-13 to
2013-14^
Priority Schools 3 3 2
Schools of Progress 9 8 6
No Recognition 2 2 5
Schools of Distinction 1 2 2
Honor Sch. of Excel. 2 2 3
Alamance-
Burlington = 3
Guilford = 8
Winston-Salem/
Forsyth = 7
Average %
Students
F/RL = %
Average School
Size =
6/17 met AYP
Reading/English
I Range =
25.7%-92.1%
Average =
64.6%
Mathematics/Alg
ebra I Range =
50%-95%
Average =
71.6%
% students F/RL
Range = 6.3%-
98.9%
Average =
58.9%
School size
Range = 244-
1950
Average = 809.8
4/17 met AYP
Reading/English
I Range = 38.3%-
95%
Average = 66.4%
Mathematics/Alg
ebra I Range =
51.9%-94.3%
Average = 74.3%
% students F/RL
Range = 8.5%-
98%
Average = 61.8%
School size
Range = 238-
1912
Average = 820.1
9/18 met AYP
Reading/English I
Range = 42.4%-
94.1%
Average = 67.8%
Mathematics/Alge
bra I Range =
47.4%-95%
Average = 74.3%
% students F/RL
Range = 9.7%-
96.6%
Average = 61.7%
School size
Range = 222-1953
Average = 804.2
X/18 met AMO
Reading/English
I Range = XX%-
XX%
Average = XX%
Mathematics/Alg
ebra I Range =
XX%-XX%
Average = XX%
% students F/RL Range = XX%-
XX%
Average = XX%
School size
Range = XX%-
XX%
Average = XX%
X/18 met X%
AYP or AMO
Reading/English
I Range =
XX%-XX%
Average =
XX%
Mathematics/Al
gebra I Range =
XX%-XX%
Average =
XX%
% students F/RL Range = XX%-
XX%
Average =
XX%
School size
Range = XX%-
XX%
Average =
XX%
Reading/English
I
Average: XX%
with Range:
XX% to XX%
Average between years: XX%
Mathematics/
Algebra I
Average: XX%
with Range:
XX% to XX%
Average between
years: XX%
Reading/English
I
Change between years: XX%
Range: XX% to XX%
Mathematics/
Algebra I
Change between years:
XX%
Range:
XX% to XX%
* Two fellows have district-level positions, so school-specific data cannot be recorded. Therefore, this school-level data reflects 18 fellows and their job placements.
One school did not open until 2011-12.
^Data not available at time of report.

North Carolina Leadership Academies: Final 2013 Report
March 2014
Consortium for Educational Research and Evaluation–North Carolina 124
Table I6. SLA Cohort 2 Job Placement Schools*
Counties/Schools per
Hire 2009-10 2010-11 2011-12 2012-13^ 2013-14^ Achievement Comparisons
Low Performing 0 0 0
Change from
2009-10 to
2012-13^
Change from
2012-13 to
2013-14^
Priority Schools 2 3 3
Schools of Progress 14 11 10
No Recognition 1 2 5
Schools of Distinction 2 3 2
Honor Sch. of Excel. 0 0 0
Bladen = 1
Columbus = 1
Cumberland = 1
Harnett = 1
Hoke = 1
Lee = 6
Moore = 4
Richmond = 2
Robeson = 1
Scotland = 2
Average %
Students
F/RL = %
Average School
Size =
7/19 met AYP
Reading/English
I Range =
37.4%-83.9%
Average =
64.3%
Mathematics/Alg
ebra I Range =
58.2%-90.3%
Average =
76.6%
% students F/RL
Range = 31%-
86.5%
Average = 63%
School size
Range = 233-
1619
Average = 678.4
0/19 met AYP
Reading/English
I Range =
41.3%-88.5%
Average = 64.1%
Mathematics/Alg
ebra I Range =
61.2%-91.3%
Average = 76.9%
% students F/RL
Range = 35.1%-
86.7%
Average = 65.2%
School size
Range = 213-
1615
Average = 672.5
4/20 met AYP
Reading/English I
Range = 47.3%-
91.6%
Average = 65.2%
Mathematics/Algeb
ra I Range =
50.9%-90.3%
Average = 72.7%
% students F/RL
Range = 35.6%-
91.6%
Average = 66.6%
School size
Range = 224-1647
Average = 724.1
X/20 met AMO
Reading/English
I Range =
XX%-XX%
Average =
XX%
Mathematics/Al
gebra I Range =
XX%-XX%
Average =
XX%
% students F/RL Range = XX%-
XX%
Average =
XX%
School size
Range = XX%-
XX%
Average =
XX%
X/20 met X%
AYP or AMO
Reading/English
I Range =
XX%-XX%
Average =
XX%
Mathematics/Al
gebra I Range =
XX%-XX%
Average =
XX%
% students F/RL Range = XX%-
XX%
Average =
XX%
School size
Range = XX%-
XX%
Average =
XX%
Reading/
English I
Average:
XX%
with Range: XX% to XX%
Average between
years: XX%
Mathematics/
Algebra I
Average:
XX%
with Range: XX% to XX%
Average between years: XX%
Reading/
English I
Change between
years: XX%
Range:
XX% to XX%
Mathematics/
Algebra I
Change between
years:
XX%
Range:
XX% to XX%
* One fellow has a district-level position, so school-specific data cannot be recorded. Therefore, this school-level data reflects 20 fellows and their job placements.
One school is K-2 only, so there is no testing data. One school merged from six learning academies into one high school in 2011-12; since data is incomplete from
learning academies, it is treated as a new school here, as of 2011-12. ^Data not available at time of report.

North Carolina Leadership Academies: Final 2013 Report
March 2014
Consortium for Educational Research and Evaluation–North Carolina 125
Appendix J. Raw Statistics for Cohort 1’s and Cohort 2’s Job Placement Schools
Table J1. RLA Cohort 1 Job Placements, NELA, Total Change in Percentages, 2008–2012
Name School of Hire LEA Position
Total Change in
Percentages
English I/
Reading
Algebra I/
Mathematics
Mark Barfield Northampton County
High School * Northampton Assistant Principal 19.00% 35.30%
Annabel Bello Aurelian Springs
Elementary Halifax
Special Needs
Teacher 7.40% 7.20%
Melissa Harris
Richardson
Aurelian Springs
Elementary Halifax Assistant Principal 7.40% 7.20%
Ryan Hurley Northside Elementary Warren Transformation
Coordinator 0.00% -6.60%
DeMetra Lassiter Central Elementary Northampton 4th Grade Teacher
-12.90% -6.10%
Mark Long Northampton County
High School * Northampton Assistant Principal 19.00% 35.30%
Douglas Miller N/A Roanoke Rapids Director of
Transportation RR N/A N/A
Carol Mizelle N/A Bertie Instructional Coach N/A N/A
Sean Murphy William R Davie Middle Halifax 7th Grade Teacher 6.60% 13.90%
Tracey Neal Warren County High
School Warren Assistant Principal 24.00% 35.80%
Erin Swanson Northwest Halifax High
School Halifax Assistant Principal 9.00% 20.40%
Gonzalo Pitpit Ahoskie Elementary Hertford 5th Grade Teacher 3.00% 13.50%
Kim Scott Ahoskie Elementary Hertford Assistant Principal 3.00% 13.50%
Ebony Spivey
Jason N/A Warren SIG Director N/A N/A
Mae Rose Hertford County High
School Hertford Assistant Principal 21.40% 39.60%
Erica Staine
Shoulders Franklinton High School Franklin Assistant Principal 8.80% 28.30%
Hope Walker William R Davie Middle Halifax 7th Grade Teacher 6.60% 13.90%
Yolanda Wiggins M.B. Hubbard
Elementary Nash Assistant Principal -6.20% -2.00%
Cecilya Williams Central Elementary Northampton 2nd
Grade Teacher -12.90% -6.10%
Christina Williams Inborden Elementary Halifax Assistant Principal -0.900% -8.30%
Shelley Williams Chaloner Middle School Roanoke Rapids Assistant Principal 4.70% 3.10%
Note: N/A=5 or fewer students in a category and results not shown. *Did not open until 2011–12; used to be Northampton High School East so that data is used.
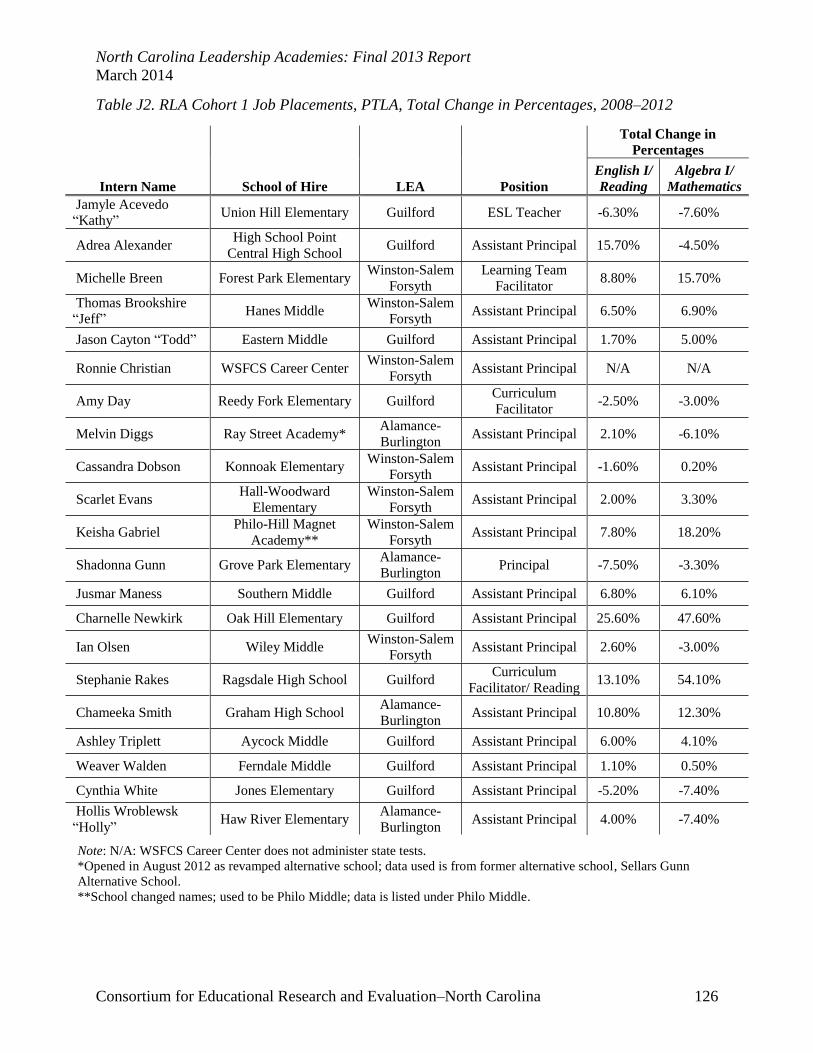
North Carolina Leadership Academies: Final 2013 Report
March 2014
Consortium for Educational Research and Evaluation–North Carolina 126
Table J2. RLA Cohort 1 Job Placements, PTLA, Total Change in Percentages, 2008–2012
Note: N/A: WSFCS Career Center does not administer state tests.
*Opened in August 2012 as revamped alternative school; data used is from former alternative school, Sellars Gunn
Alternative School.
**School changed names; used to be Philo Middle; data is listed under Philo Middle.
Intern Name School of Hire LEA Position
Total Change in
Percentages
English I/
Reading
Algebra I/
Mathematics
Jamyle Acevedo
“Kathy” Union Hill Elementary Guilford ESL Teacher -6.30% -7.60%
Adrea Alexander High School Point
Central High School Guilford Assistant Principal 15.70% -4.50%
Michelle Breen Forest Park Elementary Winston-Salem
Forsyth
Learning Team
Facilitator 8.80% 15.70%
Thomas Brookshire
“Jeff” Hanes Middle
Winston-Salem
Forsyth Assistant Principal 6.50% 6.90%
Jason Cayton “Todd” Eastern Middle Guilford Assistant Principal 1.70% 5.00%
Ronnie Christian WSFCS Career Center Winston-Salem
Forsyth Assistant Principal N/A N/A
Amy Day Reedy Fork Elementary Guilford Curriculum
Facilitator -2.50% -3.00%
Melvin Diggs Ray Street Academy* Alamance-
Burlington Assistant Principal 2.10% -6.10%
Cassandra Dobson Konnoak Elementary Winston-Salem
Forsyth Assistant Principal -1.60% 0.20%
Scarlet Evans Hall-Woodward
Elementary
Winston-Salem
Forsyth Assistant Principal 2.00% 3.30%
Keisha Gabriel Philo-Hill Magnet
Academy**
Winston-Salem
Forsyth Assistant Principal 7.80% 18.20%
Shadonna Gunn Grove Park Elementary Alamance-
Burlington Principal -7.50% -3.30%
Jusmar Maness Southern Middle Guilford Assistant Principal 6.80% 6.10%
Charnelle Newkirk Oak Hill Elementary Guilford Assistant Principal 25.60% 47.60%
Ian Olsen Wiley Middle Winston-Salem
Forsyth Assistant Principal 2.60% -3.00%
Stephanie Rakes Ragsdale High School Guilford Curriculum
Facilitator/ Reading 13.10% 54.10%
Chameeka Smith Graham High School Alamance-
Burlington Assistant Principal 10.80% 12.30%
Ashley Triplett Aycock Middle Guilford Assistant Principal 6.00% 4.10%
Weaver Walden Ferndale Middle Guilford Assistant Principal 1.10% 0.50%
Cynthia White Jones Elementary Guilford Assistant Principal -5.20% -7.40%
Hollis Wroblewsk
“Holly” Haw River Elementary
Alamance-
Burlington Assistant Principal 4.00% -7.40%

North Carolina Leadership Academies: Final 2013 Report
March 2014
Consortium for Educational Research and Evaluation–North Carolina 127
Table J3. RLA Cohort 1 Job Placements, SLA, Total Change in Percentages, 2008–2012
Name School of Hire LEA Position
Total Change in
Percentages
English I/
Reading
Algebra I/
Mathematics
Angela D. Wright Boone Trail
Elementary Harnett Assistant Principal -6.60% -11.30%
Robert Forrest Breyer Pinecrest High
School Moore Assistant Principal 13.80% 70.60%
Dante Pool Pinecrest High
School Moore Assistant Principal 13.80% 70.60%
Jennifer C. Purvis North Moore High
School Moore Principal 12.30% 38.10%
Maresa Dutton
Phillips Lilesville Elementary Anson Principal 4.80% 10.40%
Lawrence Leroy
Smalls II
E.E. Smith High
School Cumberland Assistant Principal 14.20% 39.20%
Lamonica Tillery Alderman Road
Elementary Cumberland Assistant Principal 1.70% 4.70%
Evan L. Roush Cumberland Mills
Elementary Cumberland Assistant Principal 14.60% 14.70%
Adam Michael
Mowery Angier Elementary Harnett Assistant Principal -16.10% -10.80%
Amy Lynn Parsons Green Ridge
Elementary Montgomery Assistant Principal -10.60% 0.40%
David Renninger Sandy Grove
Elementary Hoke Assistant Principal 0.30% 2.70%
Shelly F. Cullipher Edgewood
Elementary Whiteville City Principal -5.20% 2.60%
Dianna W. Bellamy Tabor City Middle Columbus Principal 12.30% 5.20%
Camilla Price House N/A Harnett Director of grades 3–
5 for LEA N/A N/A
Penny McNeill-Lind J.R. Ingram
Elementary Lee Assistant Principal -1.20% -2.60%
Elizabeth Faulk
Bridges SanLee Middle Lee Assistant Principal 10.80% 12.80%
Cynthia Ann Lewis Red Springs High
School Robeson Assistant Principal 7.80% 21.80%
Tara Dee Bullard Piney Grove
Elementary Robeson Assistant Principal 0.70% -0.40%
Joyce Morgan McRae Richmond County
Senior High School * Richmond Assistant Principal N/A 31.80%
Barbara Denise
Adams
I. Ellis Johnson
Elementary Scotland Assistant Principal 4.30% 0.40%
N/A=5 or fewer students in a category and results not shown.
* Richmond County Senior High School excluded from English analysis due to missing English Scores for 2008-09 and
2009-10 school years.

North Carolina Leadership Academies: Final 2013 Report
March 2014
Consortium for Educational Research and Evaluation–North Carolina 128
Table J4. RLA Cohort 1 Job Placements, NELA, 2008–09 School Data
School of
Placement
English I/
Reading
Algebra I/
Mathematics Designation AYP
Percentage
of Low-
Income
Students
School
Size
Northampton
County High
School*
53.20% 48.20% Priority School Not Met
(6 of 13 Targets Met) 64.52% 451
Aurelian Springs
Elementary 40.70% 58.20% Priority School Met 13 of 13 Targets 83.30% 388
Northside
Elementary 42.60% 60.10% Priority School
Not Met
(11 of 13 Targets Met) 93.92% 380
Central
Elementary 58.60% 74.70% School of Progress Met 13 of 13 Targets 74.62% 178
Warren County
High School 44.60% 18.10% Low Performing
Not Met
(8 of 13 Targets Met) 67.08% 645
Northwest Halifax
High School 43.40% 25.70% Low Performing
Not Met
(6 of 13 Targets Met) 63.15% 797
Ahoskie
Elementary 53.10% 64.00% Priority School Met 21 of 21 Targets 73.60% 480
Hertford County
High School 62.10% 29.50% Priority School
Not Met
(9 of 15 Targets Met) 64.24% 900
Franklinton High
School 75.70% 53.20% School of Progress
Not Met
(13 of 17 Targets Met) 38.91% 775
Inborden
Elementary 29.30% 42.00% Low Performing
Not Met
(12 of 13 Targets Met) 87.15% 375
Chaloner Middle 62.70% 80.90% School of Progress Met 21 of 21 Targets 48.44% 607
William R. Davie
Middle School 32.00% 41.00% Low Performing
Not Met
(15 of 17 Targets Met) 78.02% 344
M. B. Hubbard
Elementary 63.60% 75.60% School of Progress Met 17 of 17 Targets 64.49% 537
*Did not open until 2011–12; used to be Northampton High East so that data is used.

North Carolina Leadership Academies: Final 2013 Report
March 2014
Consortium for Educational Research and Evaluation–North Carolina 129
Table J5. RLA Cohort 1 Job Placements, NELA, 2009–10 School Data
School of
Placement
English I/
Reading
Algebra I/
Mathematics Designation AYP
Percentage
of Low-
Income
Students
School
Size
Northampton
County High
School*
75.80% 77.50% School of Progress Not Met
(9 of 13 Targets Met) 69.35% 450
Aurelian Springs
Elementary 45.50% 59.50% Priority School
Not Met
(10 of 13 Targets Met) 86.70% 418
Northside
Elementary 49.70% 66.30% Priority School Met 13 of 13 Targets 82.29% 363
Central
Elementary 53.80% 73.50% School of Progress Met 13 of 13 Targets 92.77% 285
Warren County
High School 71.10% 52.40% Priority School
Not Met
(12 of 13 Targets Met) 65.34% 529
Northwest Halifax
High School 49.30% 30.50% Low Performing
Not Met
(10 of 13 Targets Met) 65.43% 737
Ahoskie
Elementary 59.40% 68.80% School of Progress
Not Met
(19 of 21 Targets Met) 78.47% 481
Hertford County
High School 76.40% 68.80% School of Progress
Not Met
(4 of 13 Targets Met) 67.95% 800
Franklinton High
School 82.50% 77.60%
School of
Distinction
Not Met
(14 of 17 Targets Met) 38.87% 812
Inborden
Elementary 24.50% 29.40% Low Performing
Not Met
(7 of 13 Targets Met) 86.29% 376
Chaloner Middle
School 69.20% 86.60% School of Progress
Not Met
(20 of 21 Targets Met) 44.87% 578
William R. Davie
Middle School 35.00% 43.10% Low Performing
Not Met
(9 of 17 Targets Met) 80.94% 436
M. B. Hubbard
Elementary 55.00% 67.90% No Recognition
Not Met
(14 of 17 Targets Met) 67.79% 506
*Did not open until 2011–12; used to be Northampton High East so that data is used.

North Carolina Leadership Academies: Final 2013 Report
March 2014
Consortium for Educational Research and Evaluation–North Carolina 130
Table J6. RLA Cohort 1, NELA Job Placements, 2010–11 School Data
School of
Placement
English I/
Reading
Algebra I/
Mathematics Designation AYP
Percentage
of Low-
Income
Students
School
Size
Northampton
County High
School*
79.30% 71.40% School of Progress Met 13 of 13 Targets 76.04% 392
Aurelian Springs
Elementary 45.90% 57.70% Priority School
Not Met
(7 of 13 Targets Met) 84.87% 411
Northside
Elementary 46.30% 56.50% Priority School
Not Met
(7 of 13 Targets Met) 97.26% 362
Central
Elementary 55.50% 71.40% School of Progress
Not Met
(9 of 13 Targets Met) 87.50% 291
Warren County
High School 71.40% 56.30% No Recognition Met 13 of 13 Targets 67.09% 450
Northwest Halifax
High School 53.20% 28.50% Low Performing
Not Met
(7 of 13 Targets Met) 72.31% 647
Ahoskie
Elementary 59.00% 78.30% School of Progress
Not Met
(17 of 21 Targets Met) 81.67% 518
Hertford County
High School 67.30% 63.30% School of Progress
Not Met
(7 of 13 Targets Met) 65.96% 783
Franklinton High
School 80.40% 77.90%
School of
Distinction
Not Met
(11 of 17 Targets Met) 41.27% 842
Inborden
Elementary 17.40% 36.70% Low Performing
Not Met
(10 of 13 Targets Met) 88.16% 392
Chaloner Middle
School 67.50% 87.70% School of Progress
Not Met
(16 of 21 Targets Met) 45.97% 646
William R. Davie
Middle School 32.40% 43.00% Low Performing
Not Met
(9 of 17 Targets Met) 87.44% 427
M. B. Hubbard
Elementary 58.90% 67.60% School of Progress
Not Met
(14 of 21 Targets Met) 73.08% 488
*Did not open until 2011–12; used to be Northampton High East so that data is used.

North Carolina Leadership Academies: Final 2013 Report
March 2014
Consortium for Educational Research and Evaluation–North Carolina 131
Table J7. RLA Cohort 1 Job Placements, NELA, 20011–12 School Data
*Did not open until 2011–12; used to be Northampton High East so that data is used.
School of
Placement
English I/
Reading
Algebra I/
Mathematics Designation AYP
Percentage
of Low-
Income
Students
School
Size
Northampton
County High
School*
72.20% 83.50% School of
Distinction Met 15 of 15 Targets 77.55% 375
Aurelian Springs
Elementary 48.10% 65.40% Priority School
Not Met
(14 of 17 Targets Met) 87.42% 414
Northside
Elementary 42.60% 53.50% Priority School
Not Met
(7 of 13 Targets Met) 93.41% 344
Central
Elementary 45.70% 68.60% Priority School
Not Met
(8 of 13 Targets Met) 86.73% 290
Warren County
High 68.60% 53.90% School of Progress
Not Met
(14 of 15 Targets Met) 74.73% 455
Northwest Halifax
High School 52.40% 46.10% School of Progress
Not Met
(11 of 15 Targets Met) 73.32% 570
Ahoskie
Elementary 56.10% 77.50% School of Progress
Not Met
(14 of 21 Targets Met 82.59% 521
Hertford County
High 83.50% 69.10%
School of
Distinction
Not Met
(11 of 19 Targets Met) 67.70% 747
Franklinton High
School 84.50% 81.50%
School of
Distinction Met 20 of 20 Targets 46.73% 922
Inborden
Elementary 28.40% 33.70% Low Performing
Not Met
(10 of 13 Targets Met) 91.76% 365
Chaloner Middle 67.40% 84.00% School of Progress Not Met
(17 of 21 Targets Met) 51.44% 720
William R. Davie
Middle School 38.60% 54.90% Priority School
Not Met
(14 of 17 Targets Met) 79.34% 421
M. B. Hubbard
Elementary 57.40% 73.60% School of Progress
Not Met
(15 of 17 Targets Met 75.15% 481

North Carolina Leadership Academies: Final 2013 Report
March 2014
Consortium for Educational Research and Evaluation–North Carolina 132
Table J8. RLA Cohort 1 Job Placements, PTLA, 2008–09 School Data
*Opened in August 2012 as revamped alternative school; data used is from former alternative school, Sellars Gunn
Alternative School.
**School changed names; used to be Philo Middle; data is listed under Philo Middle.
School of
Placement
English I/
Reading
Algebra I/
Mathematics Designation AYP
Percentage
of Low-
Income
Students
School
Size
Union Hill
Elementary 51.60% 71.60% Priority School
Not Met
(12 of 13 Targets Met) 91.07% 307
High Point
Central High
School
56.80% 58.10% School of Progress Met 17 of 17 Targets 54.50% 1255
Forest Park
Elementary 31.10% 56.20% Low Performing Met 21 of 21 Targets 100.00% 500
Hanes Middle
School 76.30% 78.500% School of Progress
Not Met
(27 of 29 Targets Met) 43.77% 719
Eastern Middle
School 54.70% 66.50% No Recognition Met 33 of 33 Targets 59.73% 887
Reedy Fork
Elementary 61.00% 80.00% School of Progress Met 17 of 17 Targets 53.32% 442
Konnoak
Elementary 42.30% 71.10% Priority School
Not Met
(19 of 21 Targets Met) 88.28% 647
Hall-Woodward
Elementary 46.20% 74.30% Priority School Met21 of 21 Targets 94.710 770
Philo-Hill
Magnet
Academy**
29.90% 49.50% Priority School Not Met
(25 of 27 Targets Met) 90.95% 429
Grove Park
Elementary 65.50% 78.00% School of Progress Met 17 of 17 Targets 64.55% 522
Southern Middle
School 56.10% 71.80% School of Progress Met 33 of 33 Targets 32.74% 763
Oak Hill
Elementary 24.10% 39.200% Low Performing
Not Met
(17 of 23 Targets Met) 98.43% 377
Wiley Middle
School 49.70% 63.70% Priority School Met 29 of 29 Targets 71.43% 611
Ragsdale High
School 64.70% 25.40% No Recognition Met 17 of 17 Targets 36.43% 1469
Graham High
School 60.70% 35.10% Priority School
Not Met
(16 of 21 Targets Met) 52.18% 794
Aycock Middle
School 60.30% 78.40% School of Progress
Not Met
(32 of 33 Targets Met) 61.81% 655
Ferndale Middle 53.00% 68.10% School of Progress Met 33 of 33 Targets 73.65% 708
Jones Elementary 75.60% 85.10% School of Progress Met 17 of 17 Targets 48.80% 682
Haw River
Elementary 37.30% 62.40% Low Performing Met 25 of 25 Targets 80.33% 429
Ray Street
Academy* 17.10% 34.10%
No data on NC
Report Card
Not Met
(3 of 4 Targets Met) 57.69% 70

North Carolina Leadership Academies: Final 2013 Report
March 2014
Consortium for Educational Research and Evaluation–North Carolina 133
Table J9. RLA Cohort 1 Job Placements, PTLA, 2009–10 School Data
*Opened in August 2012 as revamped alternative school; data used is from former alternative school, Sellars Gunn
Alternative School.
**School changed names; used to be Philo Middle; data is listed under Philo Middle.
School of
Placement
English I/
Reading
Algebra I/
Mathematics Designation AYP
Percentage
of Low-
Income
Students
School
Size
Union Hill
Elementary 39.20% 57.30% Low Performing
Not Met
(11 of 17 Targets Met) 90.42% 441
High Point
Central High 69.90% 52.00% School of Progress Met 21 of 21 Targets 60.57% 1287
Forest Park
Elementary 31.20% 59.10% Priority School
Not Met
(12 of 21 Targets Met) 93.78% 520
Hanes Middle 83.90% 87.70% School of
Distinction Met 33 of 33 Targets 38.37% 860
Eastern Middle 55.10% 64.30% No Recognition Not Met
(28 of 37 Targets Met) 61.02% 913
Reedy Fork
Elementary 59.70% 78.40% No Recognition Met 21of 21 Targets 49.89% 482
Konnoak
Elementary 46.00% 74.20% Priority School
Not Met
(19 of 21 Targets Met) 89.23% 612
Hall-Woodward
Elementary 53.30% 81.70% School of Progress Met 21 of 21 Targets 95.97% 771
Philo-Hill
Magnet
Academy**
35.00% 64.20% Priority School Not Met
(19 of 25 Targets Met) 91.86% 357
Grove Park
Elementary 59.10% 76.00% School of Progress Met 17 of 17 Targets 67.60% 521
Southern Middle 56.90% 76.80% School of Progress Not Met
(33 of 35 Targets Met) 63.19% 798
Oak Hill
Elementary 34.10% 59.50% Priority School Met 19 of 19 Targets 92.51% 389
Wiley Middle 54.90% 66.30% School of Progress Not Met
(24 of 29 Targets Met) 71.85% 549
Ragsdale High 76.70% 40.00% School of Progress Not Met
(15 of 17 Targets Met) 38.50% 1386
Graham High 71.10% 61.50% School of Progress Not Met
(19 of 21 Targets Met) 56.80% 773
Aycock Middle 65.20% 85.80% School of Progress Met 33 of 33 Targets 68.03% 618
Ferndale Middle 51.80% 64.60% No Recognition Not Met
(26 of 33 Targets Met) 71.49% 757
Jones Elementary 74.20% 80.40% School of Progress Not Met
(16 of 17 Targets Met) 47.58% 690
Haw River
Elementary 42.90% 66.70% Priority School Met 17 of 17 Targets 84.30% 395
Ray Street
Academy* 34.10% 26.80%
No data on NC
Report Card
No data on NC Report
Card 67.45% 64
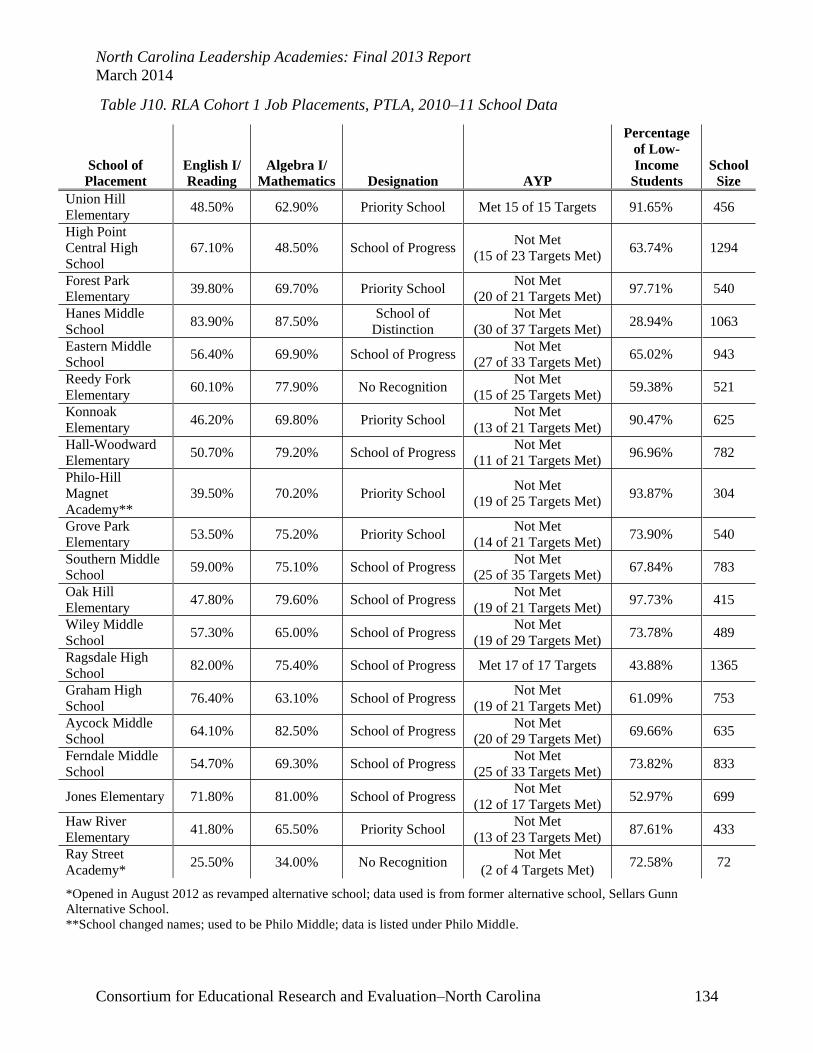
North Carolina Leadership Academies: Final 2013 Report
March 2014
Consortium for Educational Research and Evaluation–North Carolina 134
Table J10. RLA Cohort 1 Job Placements, PTLA, 2010–11 School Data
*Opened in August 2012 as revamped alternative school; data used is from former alternative school, Sellars Gunn
Alternative School.
**School changed names; used to be Philo Middle; data is listed under Philo Middle.
School of
Placement
English I/
Reading
Algebra I/
Mathematics Designation AYP
Percentage
of Low-
Income
Students
School
Size
Union Hill
Elementary 48.50% 62.90% Priority School Met 15 of 15 Targets 91.65% 456
High Point
Central High
School
67.10% 48.50% School of Progress Not Met
(15 of 23 Targets Met) 63.74% 1294
Forest Park
Elementary 39.80% 69.70% Priority School
Not Met
(20 of 21 Targets Met) 97.71% 540
Hanes Middle
School 83.90% 87.50%
School of
Distinction
Not Met
(30 of 37 Targets Met) 28.94% 1063
Eastern Middle
School 56.40% 69.90% School of Progress
Not Met
(27 of 33 Targets Met) 65.02% 943
Reedy Fork
Elementary 60.10% 77.90% No Recognition
Not Met
(15 of 25 Targets Met) 59.38% 521
Konnoak
Elementary 46.20% 69.80% Priority School
Not Met
(13 of 21 Targets Met) 90.47% 625
Hall-Woodward
Elementary 50.70% 79.20% School of Progress
Not Met
(11 of 21 Targets Met) 96.96% 782
Philo-Hill
Magnet
Academy**
39.50% 70.20% Priority School Not Met
(19 of 25 Targets Met) 93.87% 304
Grove Park
Elementary 53.50% 75.20% Priority School
Not Met
(14 of 21 Targets Met) 73.90% 540
Southern Middle
School 59.00% 75.10% School of Progress
Not Met
(25 of 35 Targets Met) 67.84% 783
Oak Hill
Elementary 47.80% 79.60% School of Progress
Not Met
(19 of 21 Targets Met) 97.73% 415
Wiley Middle
School 57.30% 65.00% School of Progress
Not Met
(19 of 29 Targets Met) 73.78% 489
Ragsdale High
School 82.00% 75.40% School of Progress Met 17 of 17 Targets 43.88% 1365
Graham High
School 76.40% 63.10% School of Progress
Not Met
(19 of 21 Targets Met) 61.09% 753
Aycock Middle
School 64.10% 82.50% School of Progress
Not Met
(20 of 29 Targets Met) 69.66% 635
Ferndale Middle
School 54.70% 69.30% School of Progress
Not Met
(25 of 33 Targets Met) 73.82% 833
Jones Elementary 71.80% 81.00% School of Progress Not Met
(12 of 17 Targets Met) 52.97% 699
Haw River
Elementary 41.80% 65.50% Priority School
Not Met
(13 of 23 Targets Met) 87.61% 433
Ray Street
Academy* 25.50% 34.00% No Recognition
Not Met
(2 of 4 Targets Met) 72.58% 72

North Carolina Leadership Academies: Final 2013 Report
March 2014
Consortium for Educational Research and Evaluation–North Carolina 135
Table J11. RLA Cohort 1 Job Placements, PTLA, 2011–12 School Data
*Opened in August 2012 as revamped alternative school; data used is from former alternative school, Sellars Gunn
Alternative School.
**School changed names; used to be Philo Middle; data is listed under Philo Middle.
School of
Placement
English I/
Reading
Algebra I/
Mathematics Designation AYP
Percentage
of Low-
Income
Students
School
Size
Union Hill
Elementary 45.30% 64.00% Priority School
Not Met
(10 of 15 Targets Met) 91.27% 483
High Point
Central High
School
72.50% 53.600% School of Progress Not Met
(21 of 23 Targets Met) 63.11% 1367
Forest Park
Elementary 39.90% 71.90% Priority School
Not Met
(17 of 21 Targets Met) 98.58% 573
Hanes Middle
School 82.80% 85.40%
School of
Distinction
Not Met
(33 of 37 Targets Met) 28.48% 1078
Eastern Middle
School 56.40% 71.500% School of Progress
Not Met
(22 of 33 Targets Met) 66.77% 83
Reedy Fork
Elementary 58.50% 76.30% School of Progress
Not Met
(21 of 25 Targets Met) 64.62% 522
Konnoak
Elementary 40.70% 71.30% Priority School
Not Met
(15 of 25 Targets Met) 92.45% 684
Hall-Woodward
Elementary 48.20% 77.60% No Recognition
Not Met
(16 of 21 Targets Met) 96.88% 762
Philo-Hill
Magnet
Academy**
37.70% 67.70% Priority School Not Met
(13 of 21 Targets Met) 93.02% 258
Grove Park
Elementary 58.00% 74.70% School of Progress
Not Met
(15 of 21 Targets Met) 74.46% 551
Southern Middle
School 62.90% 77.90% School of Progress
Not Met
(31 of 37 Targets Met) 72.43% 845
Oak Hill
Elementary 49.70% 86.80% School of Progress
Not Met
(18 of 21 Targets Met) 97.91% 431
Wiley Middle
School 52.30% 60.70% Priority School
Not Met
(19 of 29 Targets Met) 77.05% 462
Ragsdale High
School 77.80% 79.50% No Recognition Met 20 of 20 Targets 45.01% 1311
Graham High
School 71.50% 47.40% School of Progress Met 23 of 23 Targets 54.91% 785
Aycock Middle 66.30% 82.50% School of Progress Not Met
(29 of 33 Targets Met) 72.39% 588
Ferndale Middle 54.10% 68.60% No Recognition Not Met
(20 of 33 Targets Met) 74.67% 867
Jones Elementary 70.40% 77.70% School of Progress Not Met
(15 of 17 Targets Met) 54.83% 716
Haw River
Elementary 41.30% 55.00% Priority School
Not Met
(14 of 23 Targets Met) 90.53% 467
Ray Street
Academy* 19.20% 28.00% No Recognition
Not Met
(0 of 2 Targets Met) 83.95% 112

North Carolina Leadership Academies: Final 2013 Report
March 2014
Consortium for Educational Research and Evaluation–North Carolina 136
Table J12. RLA Cohort 1 Job Placements, SLA, 2008–09 School Data
*Richmond County Senior High excluded from English analysis due to missing English scores for 2008–09 and 2009–10
school years.
School of
Placement
English I/
Reading
Algebra I/
Mathematics Designation AYP
Percentage
of Low-
Income
Students
School
Size
Boone Trail
Elementary 56.40% 76.60% No Recognition Met 23 of 23 Targets 61.78% 602
Pinecrest High
School 75.80% 14.30%
School of
Progress
Not Met
(12 of 19 Targets Met) 27.23% 1949
North Moore High
School 68.50% 40.90% No Recognition
Not Met
(11 of 13 Targets Met) 47.47% 552
Lilesville
Elementary 52.20% 54.30% Priority School
Not Met
(15 of 17 Targets Met) 74.40% 337
E.E. Smith High
School 65.90% 36.40%
School of
Progress
Not Met
(8 of 13 Targets Met) 63.32% 1132
Alderman Road
Elementary 69.30% 79.50%
School of
Progress Met 21 of 21 Targets 54.97% 733
Cumberland Mills
Elementary 49.50% 64.20% Priority School Met 19 of 19 Targets 66.61% 637
Angier Elementary 57.10% 69.80% Priority School Not Met
(25 of 27 Targets Met) 56.25% 250
Green Ridge
Elementary 63.10% 79.80%
School of
Progress Met 21 of 21 Targets 81.96% 427
Sandy Grove
Elementary 50.50% 70.90% Priority School Met 21 of 21 Targets 59.12% 626
Edgewood
Elementary 72.20% 80.60%
School of
Progress Met 21 of 21 Targets 62.91% 554
Tabor City Middle
School 51.60% 75.40%
School of
Progress Met 17 of 17 Targets 75.21% 246
J.R. Ingram
Elementary 68.30% 83.30%
School of
Progress Met 25 of 25 Targets 54.00% 717
SanLee Middle
School 64.30% 77.50%
School of
Progress
Not Met
(26 of 29 Targets Met) 63.00% 779
Red Springs High
School 57.30% 58.20%
School of
Progress
Not Met
(5 of 17 Targets Met) 55.05% 655
Piney Grove
Elementary 53.80% 77.80%
School of
Progress Met 17 of 17 Targets 74.17% 590
Richmond County
Senior High* N/A 9.50%
School of
Progress
Not Met
(14 of 19 Targets Met) 53.42% 1436
I. Ellis Johnson
Elementary 62.00% 85.40%
School of
Progress Met 13 of 13 Targets 94.85% 362

North Carolina Leadership Academies: Final 2013 Report
March 2014
Consortium for Educational Research and Evaluation–North Carolina 137
Table J13. RLA Cohort 1 Job Placements, SLA, 2009–10 School Data
* Richmond County Senior High excluded from English analysis due to missing English scores for 2008–09 and 2009–10
school years.
School of
Placement
English I/
Reading
Algebra I/
Mathematics Designation AYP
Percentage
of Low-
Income
Students
School
Size
Boone Trail
Elementary 56.50% 70.50% No Recognition
Not Met
(19 of 23 Targets Met) 67.27% 569
Pinecrest High
School 85.50% 72.20%
School of
Distinction
Not Met
(10 of 19 Targets Met) 28.00% 1989
North Moore High
School 79.60% 69.70% No Recognition
Not Met
(12 of 13 Targets Met) 47.00% 567
Lilesville
Elementary 56.80% 70.50%
School of
Progress Met 17 of 17 Targets 75.00% 313
E.E. Smith High
School 73.50% 64.50% No Recognition
Not Met
(11 of 17 Targets Met) 62.29% 1056
Alderman Road
Elementary 71.50% 83.20%
School of
Progress
Not Met
(20 of 21 Targets Met) 61.05% 666
Cumberland Mills
Elementary 54.80% 62.90% Priority School
Not Met
(16 of 21 Targets Met) 67.50% 610
Angier Elementary 54.90% 75.50% School of
Progress
Not Met
(27 of 29 Targets Met) 63.41% 427
Green Ridge
Elementary 53.30% 77.10%
School of
Progress Met 21 of 21 Targets 86.76% 449
Sandy Grove
Elementary 60.30% 76.60%
School of
Progress Met 21 of 21 Targets 60.75% 586
Edgewood
Elementary 68.60% 80.90%
School of
Progress
Not Met
(18 of 21 Targets Met) 61.25% 538
Tabor City Middle
School 60.10% 80.30%
School of
Progress
Not Met
(16 of 17 Targets Met) 77.65% 233
J.R. Ingram
Elementary 72.10% 83.10%
School of
Progress
Not Met
(22 of 23 Targets Met) 60.44% 699
SanLee Middle
School 66.40% 85.20%
School of
Progress Met 29 of 29 Targets 62.97% 790
Red Springs High
School 58.90% 75.80%
School of
Progress
Not Met
(10 of 17 Targets Met) 73.37% 678
Piney Grove
Elementary 56.90% 77.30% No recognition Met 19 of 19 Targets 78.55% 620
Richmond County
Senior High
School*
N/A 35.80% School of
Distinction
Not Met
(13 of 17 Targets Met) 59.00% 1408
I. Ellis Johnson
Elementary 66.10% 84.70%
School of
Progress Met 13 of 13 Targets 92.95% 370

North Carolina Leadership Academies: Final 2013 Report
March 2014
Consortium for Educational Research and Evaluation–North Carolina 138
Table J14. RLA Cohort 1 Job Placements, SLA, 2010–11 School Data
* Richmond County Senior High excluded from English analysis due to missing English scores for 2008–09 and 2009–10
school years.
School of
Placement
English I/
Reading
Algebra I/
Mathematics Designation AYP
Percentage
of Low-
Income
Students
School
Size
Boone Trail
Elementary 49.10% 61.20% Priority School
Not Met
(13 of 23 Targets Met) 70.92% 545
Pinecrest High
School 89.70% 80.40%
School of
Distinction
Not Met
(9 of 19 Targets Met) 31.20% 2029
North Moore High
School 79.70% 80.80%
School of
Distinction
Not Met
(11 of 13 Targets Met) 48.91% 546
Lilesville
Elementary 57.10% 67.00% No Recognition
Not Met
(12 of 17 Targets Met) 72.33% 304
E.E. Smith High
School 75.90% 68.90%
School of
Distinction
Not Met
(15 of 19 Targets Met) 62.23% 1055
Alderman Road
Elementary 67.30% 84.10%
School of
Progress
Not Met
(16 of 21 Targets Met) 62.18% 680
Cumberland Mills
Elementary 56.70% 71.80%
School of
Progress Met 23 of 23 Targets 69.00% 598
Angier Elementary 51.60% 65.50% Priority School Not Met
(17 of 29 Targets Met) 69.61% 423
Green Ridge
Elementary 55.10% 75.90%
School of
Progress
Not Met
(13 of 21 Targets Met) 89.64% 453
Sandy Grove
Elementary 58.00% 73.90% No Recognition
Not Met
(13 of 21 Targets Met) 61.65% 542
Edgewood
Elementary 69.10% 83.10%
School of
Progress
Not Met
(17 of 21 Targets Met) 67.16% 526
Tabor City Middle 59.90% 79.30% School of
Progress
Not Met
(12 of 17 Targets Met) 80.25% 213
J.R. Ingram
Elementary 72.20% 85.40%
School of
Progress
Not Met
(22 of 25 Targets Met) 63.96% 677
SanLee Middle 70.00% 86.90% School of
Progress
Not Met
(26 of 29 Targets Met) 66.17% 810
Red Springs High
School 57.80% 72.00%
School of
Progress
Not Met
(13 of 17 Targets Met) 75.94% 715
Piney Grove
Elementary 55.00% 74.60% No Recognition
Not Met
(9 of 17 Targets Met) 83.99% 669
Richmond County
Senior High 6.30%* 30.40%
School of
Distinction
Not Met
(14 of 19 Targets Met) 57.82% 1348
I. Ellis Johnson
Elementary 71.80% 87.80%
School of
Distinction Met 13 of 13 Targets 95.76% 355

North Carolina Leadership Academies: Final 2013 Report
March 2014
Consortium for Educational Research and Evaluation–North Carolina 139
Table J15. RLA Cohort 1 Job Placements, SLA, 2011–12 School Data
* Richmond County Senior High excluded from English analysis due to missing English scores for 2008–09 and 2009–10
school years.
School of
Placement
English I/
Reading
Algebra I/
Mathematics Designation AYP
Percentage
of Low-
Income
Students
School
Size
Boone Trail
Elementary 49.80% 65.30% Priority School
Not Met
(14 of 21 Targets Met) 70.00% 540
Pinecrest High
School 89.60% 84.90% No Recognition
Not Met
(16 of 23Targets Met) 33.78% 1982
North Moore High
School 80.80% 79.00%
School of
Progress
Not Met
(9 of 15 Targets Met) 52.55% 566
Lilesville
Elementary 57.00% 64.70% No Recognition
Not Met
(10 of 17 Targets Met) 76.49% 329
E.E. Smith High
School 80.10% 75.60%
School of
Distinction
Not Met
(18 of 19 Targets Met) 60.11% 1133
Alderman Road
Elementary 71.00% 84.20%
School of
Progress Met 21 of 21 Targets 59.71% 636
Cumberland Mills
Elementary 64.10% 78.90%
School of
Progress
Not Met
(22 of 23 Targets Met) 67.28% 646
Angier Elementary 41.00% 59.00% Priority School Not Met
(15 of 29 Targets Met) 71.60% 420
Green Ridge
Elementary 52.50% 80.20%
School of
Progress
Not Met
(18 of 21 Targets Met) 89.54% 472
Sandy Grove
Elementary 50.80% 73.60% No recognition
Not Met
(15 of 21Targets Met) 67.08% 535
Edgewood
Elementary 67.00% 83.20%
School of
Progress
Not Met
(20 of 21 Targets Met) 72.13% 532
Tabor City Middle 63.90% 80.60% School of
Progress
Not Met
(15 of 17 Targets Met) 77.78% 224
J.R. Ingram
Elementary 67.10% 80.70% No Recognition
Not Met
(24 of 25 Targets Met) 64.53% 706
SanLee Middle 75.10% 90.30% School of
Distinction Met 29 of 29 Targets 67.07% 818
Red Springs High
School 65.10% 80.00%
School of
Progress
Not Met
(15 of 20 Targets Met) 83.20% 734
Piney Grove
Elementary 54.50% 77.40% No Recognition
Not Met
(19 of 23 Targets Met) 85.19% 683
Richmond County
Senior High* N/A 41.30%
School of
Progress
Not Met
(22 of 24 Targets Met) 54.04% 1359
I. Ellis Johnson
Elementary 66.30% 85.80% No Recognition
Not Met
(14 of 15 Targets Met) 94.60% 341

North Carolina Leadership Academies: Final 2013 Report
March 2014
Consortium for Educational Research and Evaluation–North Carolina 140
Table J16. RLA Cohort 2 Job Placements, NELA, Total Change in Percentages, 2009–2013
Name School of Hire LEA Position
Total Change in
Percentages^
English I/
Reading
Algebra I/
Mathematics
Amy Pearce Stocks Elementary Edgecombe Assistant Principal
Vernedette Garland Nashville Elementary Nash-Rocky Mount Assistant Principal
Kelly Shelton Mudd Nash Central Middle Nash-Rocky Mount Assistant Principal
Tonya Little Riverside Middle Martin Assistant Principal
Kendrick Alston D.S. Johnson
Elementary Nash-Rocky Mount Assistant Principal
Hugh Scott Southern Nash High
School Nash-Rocky Mount Assistant Principal
Teicher Patterson Everetts Elementary Halifax Assistant Principal
Lisa Pennington Long Mill Elementary Franklin Teacher Grade 3
Jackson Olsen Northern Vance High
School Vance Assistant Principal
Kimberly Allison Wilton Elementary Granville Assistant Principal
Jenifer Lewis Benvenue Elementary Nash-Rocky Mount Assistant Principal
Krista Fasioli Williford Elementary Nash-Rocky Mount Assistant Principal
Tim Mudd Southern Nash High
School Nash-Rocky Mount Assistant Principal
Jennifer Berry Red Oak Elementary Nash-Rocky Mount Assistant Principal
Jennifer Berry Swift Creek Elementary Nash-Rocky Mount Assistant Principal
Zachary Marks Nash Central Middle Nash-Rocky Mount Assistant Principal
Erin Robbins Tar River Elementary Granville Assistant Principal
Angela Strother N/A Edgecombe
AIG Facilitator
(Instruct. Admin-
Central office)
Larry Hodgkins South Creek Middle Martin Assistant Principal
Darren Gemzik South Edgecombe
Middle Edgecombe
Teacher Grade 6
SS/Science
Elizabeth Payne
Moran
J.F. Webb High School
of Health and Life
Sciences
Granville Assistant Principal
Lauren Greenhill Manning Elementary RRGSD Assistant Principal
Notes:
Riverside Middle was formerly known as Williamston Middle.
Red Oak Elementary is K-2 only so there is no testing data.
Jennifer Berry serves as AP at two schools.
Tar River Elementary opened in 2011-12.
N/A=5 or fewer students in a category and results not shown.
^Data not available at time of report.

North Carolina Leadership Academies: Final 2013 Report
March 2014
Consortium for Educational Research and Evaluation–North Carolina 141
Table J17. RLA Cohort 2 Job Placements, PTLA, Total Change in Percentages, 2009–2013
Name School of Hire LEA Position
Total Change in
Percentages^
English I/
Reading
Algebra I/
Mathematics
Kristen Gravely Graham High School Alamance-
Burlington Assistant Principal
Thomas Kazimir Graham High School Alamance-
Burlington Assistant Principal
Dana Roseboro Newlin Elementary Alamance-
Burlington Media Specialist
Ben Cawley N/A Guilford County Mission Possible
Specialist
Kevin Conaway Southeast Guilford Middle Guilford County Assistant Principal
Vernon Hall Ferndale Middle Guilford County Assistant Principal
Darrell Harris Eastern Guilford Middle Guilford County Assistant Principal
Noel Keener Northeast Guilford High
School Guilford County Assistant Principal
Greta Martin Jamestown Middle Guilford County 7th Grade SS Teacher
Janiese McKenzie Northern Guilford High
School Guilford County Assistant Principal
Rashad Slade N/A Guilford County Director of Instructional
Technology
Chelsea Smith Wiley Accel/Enrichment
Elementary Guilford County Assistant Principal
Toks Wall Rankin Elementary Guilford County 5th Grade Teacher
Kimberly Ashby Walkertown High School Winston-
Salem/Forsyth Assistant Principal
Kathy Bryant Bolton Elementary Winston-
Salem/Forsyth Assistant Principal
Jonathan Hegedus Kernersville Elementary Winston-
Salem/Forsyth Assistant Principal
Larnitha Hunter Ibraham Elementary Winston-
Salem/Forsyth Assistant Principal
Nicole Kurtz West Forsyth High School Winston-
Salem/Forsyth English III Teacher
Susan T Miller Griffith Elementary Winston-
Salem/Forsyth Learning Team Facilitator
Colin Tribby The Downtown School Winston-
Salem/Forsyth Assistant Principal
Notes:
Walkertown High School opened in 2011-2012.
Nicole Kurtz worked as an English I Honors Teacher at Atkins Academic/Tech High School from August 2013 to December 2013;
she started at West Forsyth High School in January 2014.
N/A=5 or fewer students in a category and results not shown.
^Data not available at time of report.

North Carolina Leadership Academies: Final 2013 Report
March 2014
Consortium for Educational Research and Evaluation–North Carolina 142
Table J18. RLA Cohort 2 Job Placements, SLA, Total Change in Percentages, 2009–2013
Name School of Hire LEA Position
Total Change in
Percentages^
English I/
Reading
Algebra I/
Mathematics
Marci Houseman Southern Pines Primary Moore Principal
Pam Lewis Washington Park
Elementary Scotland Principal
Leslie Bailey Hawk Eye Elementary Hoke Assistant Principal
Anthony Barton Purnell Swett High School Robeson Assistant Principal
Jennifer Brach L.J. Bell Elementary Richmond Assistant Principal
Maxine Brown Hamlet Middle Richmond Assistant Principal
Melissa Brewer East Lee Middle Lee Assistant Principal
Kelly Bullard Tabor City Middle Columbus Lead Teacher
Elizabeth Cole Elizabethtown Middle Bladen Assistant Principal
Kisha Derr SanLee Middle Lee Assistant Principal
Katrina Fox Southern Pines Elementary Moore Assistant Principal
Lisa Hain J. Glenn Edwards
Elementary Lee Assistant Principal
Andrew Keller Lee County High School Lee Assistant Principal
Matt McLean J.R. Ingram Elementary Lee Assistant Principal
Tracy Metcalf Union Pines High School Moore Assistant Principal
Matt Moore Southern Middle Moore Assistant Principal
Mike Picciano Douglas Byrd Middle Cumberland Assistant Principal
Christy Sharpe Broadway Elementary Lee Teacher
Jennifer Spivey Boone Trail Elementary Harnett Assistant Principal
Joy Smart Scotland High School Scotland Assistant Principal
Kristy West N/A Robeson Instructional
Specialist
Notes:
Southern Pines Primary is K-2 only so there is no testing data.
Scotland High School used to be made up of 6 learning academies but merged into one HS in 2011-2012; treating as new
school as of 2011-2012 since data is incomplete for learning academies from 2008-2011.
N/A=5 or fewer students in a category and results not shown.
^Data not available at time of report.

North Carolina Leadership Academies: Final 2013 Report
March 2014
Consortium for Educational Research and Evaluation–North Carolina 143
Table J19. RLA Cohort 2 Job Placements, NELA, 2009-10 School Data
Notes:
Riverside Middle was formerly known as Williamston Middle.
Red Oak Elementary is K-2 only so there is no testing data.
Tar River Elementary opened in 2011-2012.
N/A=5 or fewer students in a category and results not shown.
School of
Placement
English I/
Reading
Algebra I/
Mathematics Designation AYP
Percentage
of Low-
Income
Students
School
Size
Stocks
Elementary 43.50% 70.70% Priority School
Not Met
(14 of 17 Targets Met) 68.86% 663
Nashville
Elementary 73.80% 88.20% School of Progress
Not Met
(20 of 21 Targets Met) 49.07% 797
Nash Central
Middle 49.90% 63.70% Priority School
Not Met
(16 of 21 Targets Met) 70.00% 644
Riverside Middle 64.60% 76.60% School of Progress Not Met
(19 of 21 Targets Met) 59.43% 375
D.S. Johnson
Elementary 37.40% 51.40% Priority School
Not Met
(10 of 13 Targets Met) 81.93% 455
Southern Nash
High School 75.40% 80.70% School of Progress
Not Met
(15 of 17 Targets Met) 43.68% 1184
Everetts
Elementary 47.40% 52.00% Priority School
Not Met
(10 of 13 Targets Met) 81.38% 359
Long Mill
Elementary 69.80% 89.50% School of Progress Met 17 of 17 Targets 47.26% 534
Northern Vance
High School 84.90% 73.00% School of Progress
Not Met
(10 of 17 Targets Met) 52.44% 1059
Wilton
Elementary 78.60% 92.90%
School of
Distinction Met 13 of 13 Targets 33.33% 625
Benvenue
Elementary 61.50% 73.20% School of Progress
Not Met
(17 of 21 Targets Met) 65.37% 829
Williford
Elementary 44.90% 55.10% Priority School
Not Met
(12 of 15 Targets Met) 93.75% 491
Red Oak
Elementary N/A N/A
School of
Distinction Met 17 of 17 Targets 41.91% 308
Swift Creek
Elementary 73.80% 91.30%
School of
Distinction Met 17 of 17 Targets 43.53% 335
Tar River
Elementary N/A N/A N/A N/A N/A N/A
South Creek
Middle 64.70% 77.00% School of Progress Met 15 of 15 Targets 77.24% 256
South
Edgecombe
Middle
54.30% 70.00% No Recognition Not Met
(15 of 17 Targets Met) 51.75% 383
J.F. Webb HS of
Health and Life
Sciences
85.10% 80.00% School of
Distinction Met 5 of 5 Targets 31.21% 285
Manning
Elementary 69.20% 82.90% School of Progress
Not Met
(19 of 21 Targets Met) 44.88% 667
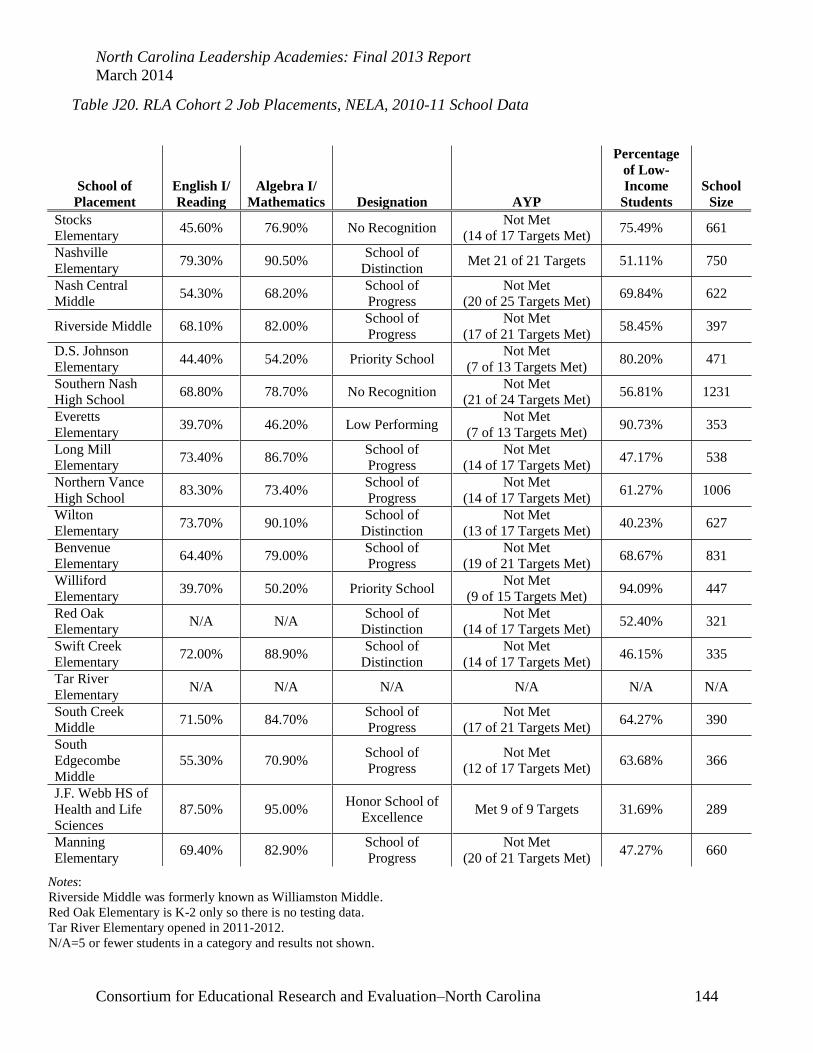
North Carolina Leadership Academies: Final 2013 Report
March 2014
Consortium for Educational Research and Evaluation–North Carolina 144
Table J20. RLA Cohort 2 Job Placements, NELA, 2010-11 School Data
Notes:
Riverside Middle was formerly known as Williamston Middle.
Red Oak Elementary is K-2 only so there is no testing data.
Tar River Elementary opened in 2011-2012.
N/A=5 or fewer students in a category and results not shown.
School of
Placement
English I/
Reading
Algebra I/
Mathematics Designation AYP
Percentage
of Low-
Income
Students
School
Size
Stocks
Elementary 45.60% 76.90% No Recognition
Not Met
(14 of 17 Targets Met) 75.49% 661
Nashville
Elementary 79.30% 90.50%
School of
Distinction Met 21 of 21 Targets 51.11% 750
Nash Central
Middle 54.30% 68.20%
School of
Progress
Not Met
(20 of 25 Targets Met) 69.84% 622
Riverside Middle 68.10% 82.00% School of
Progress
Not Met
(17 of 21 Targets Met) 58.45% 397
D.S. Johnson
Elementary 44.40% 54.20% Priority School
Not Met
(7 of 13 Targets Met) 80.20% 471
Southern Nash
High School 68.80% 78.70% No Recognition
Not Met
(21 of 24 Targets Met) 56.81% 1231
Everetts
Elementary 39.70% 46.20% Low Performing
Not Met
(7 of 13 Targets Met) 90.73% 353
Long Mill
Elementary 73.40% 86.70%
School of
Progress
Not Met
(14 of 17 Targets Met) 47.17% 538
Northern Vance
High School 83.30% 73.40%
School of
Progress
Not Met
(14 of 17 Targets Met) 61.27% 1006
Wilton
Elementary 73.70% 90.10%
School of
Distinction
Not Met
(13 of 17 Targets Met) 40.23% 627
Benvenue
Elementary 64.40% 79.00%
School of
Progress
Not Met
(19 of 21 Targets Met) 68.67% 831
Williford
Elementary 39.70% 50.20% Priority School
Not Met
(9 of 15 Targets Met) 94.09% 447
Red Oak
Elementary N/A N/A
School of
Distinction
Not Met
(14 of 17 Targets Met) 52.40% 321
Swift Creek
Elementary 72.00% 88.90%
School of
Distinction
Not Met
(14 of 17 Targets Met) 46.15% 335
Tar River
Elementary N/A N/A N/A N/A N/A N/A
South Creek
Middle 71.50% 84.70%
School of
Progress
Not Met
(17 of 21 Targets Met) 64.27% 390
South
Edgecombe
Middle
55.30% 70.90% School of
Progress
Not Met
(12 of 17 Targets Met) 63.68% 366
J.F. Webb HS of
Health and Life
Sciences
87.50% 95.00% Honor School of
Excellence Met 9 of 9 Targets 31.69% 289
Manning
Elementary 69.40% 82.90%
School of
Progress
Not Met
(20 of 21 Targets Met) 47.27% 660

North Carolina Leadership Academies: Final 2013 Report
March 2014
Consortium for Educational Research and Evaluation–North Carolina 145
Table J21. RLA Cohort 2 Job Placements, NELA, 2011-12 School Data
Notes:
Riverside Middle was formerly known as Williamston Middle.
Red Oak Elementary is K-2 only so there is no testing data.
N/A=5 or fewer students in a category and results not shown.
School of
Placement
English I/
Reading
Algebra I/
Mathematics Designation AYP
Percentage
of Low-
Income
Students
School
Size
Stocks
Elementary 52.60% 85.90% No Recognition Met 15 of 15 Targets 74.52% 628
Nashville
Elementary 81.20% 93.400%
School of
Distinction Met 21 of 21 Targets 51.67% 747
Nash Central
Middle 59.80% 67.80% No Recognition
Not Met
(13 of 15 Targets Met) 70.95% 608
Riverside Middle 69.70% 78.90% School of Progress Not Met
(16 of 21 Targets Met) 62.47% 408
D.S. Johnson
Elementary 43.70% 63.10% Priority School
Not Met
(10 of 13 Targets Met) 89.64% 473
Southern Nash
High School 78.00% 73.20% School of Progress
Not Met
(25 of 26 Targets Met) 49.10% 1215
Everetts
Elementary 46.30% 48.00% Low Performing
Not Met
(10 of 13 Targets Met) 92.62% 343
Long Mill
Elementary 72.70% 88.80%
School of
Distinction Met 17 of 17 Targets 48.89% 546
Northern Vance
High School 65.50% 44.70% School of Progress Met 20 of 20 Targets 63.87% 934
Wilton
Elementary 77.10% 76.70%
School of
Distinction Met 13 of 13 Targets 30.82% 301
Benvenue
Elementary 67.90% 76.70% No Recognition
Not Met
(18 of 21 Targets) 71.58% 748
Williford
Elementary 37.70% 48.10% Low Performing
Not Met
(7 of 13 Targets Met) 99.38% 427
Red Oak
Elementary N/A N/A No Recognition Met 17 of 17 Targets 50.78% 293
Swift Creek
Elementary 71.00% 87.60% No Recognition Met 17 of 17 Targets 47.54% 311
Tar River
Elementary 75.50% 90.70%
School of
Distinction Met 13 of 13Targets 36.29% 508
South Creek
Middle 68.40% 77.50% School of Progress
Not Met
(19 of 21Targets Met) 67.61% 386
South
Edgecombe
Middle
56.20% 72.90% School of Progress Not Met
(10 of 17 Targets Met) 65.77% 376
J.F. Webb HS of
Health and Life
Sciences
91.40% 84.80% Honor School of
Excellence Met 9 of 9 Targets 30.53% 289
Manning
Elementary 67.30% 85.40% School of Progress
Not Met
(20 of 21 Targets Met) 52.43% 653

North Carolina Leadership Academies: Final 2013 Report
March 2014
Consortium for Educational Research and Evaluation–North Carolina 146
Table J22. RLA Cohort 2 Job Placements, PTLA, 2009-10 School Data
School of
Placement
English I/
Reading
Algebra I/
Mathematics Designation AMO
Percentage
of Low-
Income
Students
School
Size
Graham High
School 71.10% 61.50%
School of
Progress
Not Met
(19 of 21 Targets Met) 56.80% 773
Newlin
Elementary 43.00% 64.30% Priority School
Not Met
(18 of 23 Targets Met) 87.40% 601
Southeast
Guilford Middle 73.20% 83.50%
School of
Progress
Not Met
(20 of 21 Targets Met) 31.49% 1024
Ferndale Middle 51.80% 64.60% No Recognition Not Met
(26 of 33 Targets Met) 71.49% 757
Eastern Guilford
Middle 55.10% 64.30% No Recognition
Not Met
(28 of 37 Targets Met) 61.02% 913
Northeast
Guilford High
School
72.30% 55.80% School of
Progress
Not Met
(16 of 17 Targets Met) 47.99% 1122
Jamestown
Middle 74.00% 85.50%
School of
Progress Met 37 of 37 Targets 47.02% 1032
Northern
Guilford High
School
91.50% 50.00% School of
Distinction
Not Met
(15 of 17 Targets Met) 17.06% 1158
Wiley
Accel/Enrichment
Elementary
25.70% 61.00% Priority School Not Met
(10 of 13 Targets Met) 98.88% 244
Rankin
Elementary 50.80% 75.90% Priority School
Not Met
(24 of 25 Targets Met) 88.32% 617
Walkertown High
School N/A N/A N/A N/A N/A N/A
Bolton
Elementary 60.30% 77.50%
School of
Progress Met 23 of 23 Targets 86.96% 628
Kernersville
Elementary 62.40% 81.80%
School of
Progress Met 29 of 29 Targets 59.88% 885
Ibraham
Elementary 49.10% 78.30%
School of
Progress Met 17 of 17 Targets 89.38% 433
West Forsyth
High School 91.50% 81.50%
Honor School of
Excellence Met 20 of 20 Targets 15.61% 1950
Griffith
Elementary 63.40% 75.90%
School of
Progress
Not Met
(23 of 24 Targets Met) 78.07% 596
The Downtown
School 92.10% 95.00%
Honor School of
Excellence Met 13 of 13 Targets 6.31% 261
Notes:
Walkertown High School opened in 2011-2012.
N/A=5 or fewer students in a category and results not shown.
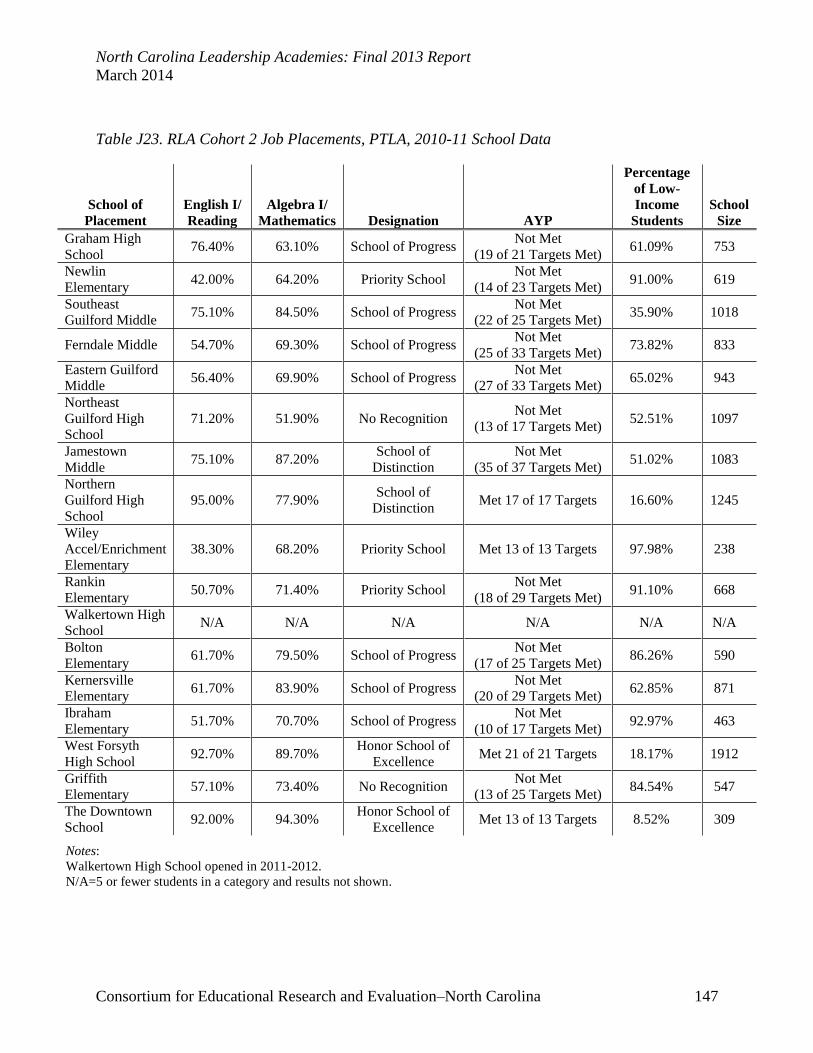
North Carolina Leadership Academies: Final 2013 Report
March 2014
Consortium for Educational Research and Evaluation–North Carolina 147
Table J23. RLA Cohort 2 Job Placements, PTLA, 2010-11 School Data
School of
Placement
English I/
Reading
Algebra I/
Mathematics Designation AYP
Percentage
of Low-
Income
Students
School
Size
Graham High
School 76.40% 63.10% School of Progress
Not Met
(19 of 21 Targets Met) 61.09% 753
Newlin
Elementary 42.00% 64.20% Priority School
Not Met
(14 of 23 Targets Met) 91.00% 619
Southeast
Guilford Middle 75.10% 84.50% School of Progress
Not Met
(22 of 25 Targets Met) 35.90% 1018
Ferndale Middle 54.70% 69.30% School of Progress Not Met
(25 of 33 Targets Met) 73.82% 833
Eastern Guilford
Middle 56.40% 69.90% School of Progress
Not Met
(27 of 33 Targets Met) 65.02% 943
Northeast
Guilford High
School
71.20% 51.90% No Recognition Not Met
(13 of 17 Targets Met) 52.51% 1097
Jamestown
Middle 75.10% 87.20%
School of
Distinction
Not Met
(35 of 37 Targets Met) 51.02% 1083
Northern
Guilford High
School
95.00% 77.90% School of
Distinction Met 17 of 17 Targets 16.60% 1245
Wiley
Accel/Enrichment
Elementary
38.30% 68.20% Priority School Met 13 of 13 Targets 97.98% 238
Rankin
Elementary 50.70% 71.40% Priority School
Not Met
(18 of 29 Targets Met) 91.10% 668
Walkertown High
School N/A N/A N/A N/A N/A N/A
Bolton
Elementary 61.70% 79.50% School of Progress
Not Met
(17 of 25 Targets Met) 86.26% 590
Kernersville
Elementary 61.70% 83.90% School of Progress
Not Met
(20 of 29 Targets Met) 62.85% 871
Ibraham
Elementary 51.70% 70.70% School of Progress
Not Met
(10 of 17 Targets Met) 92.97% 463
West Forsyth
High School 92.70% 89.70%
Honor School of
Excellence Met 21 of 21 Targets 18.17% 1912
Griffith
Elementary 57.10% 73.40% No Recognition
Not Met
(13 of 25 Targets Met) 84.54% 547
The Downtown
School 92.00% 94.30%
Honor School of
Excellence Met 13 of 13 Targets 8.52% 309
Notes:
Walkertown High School opened in 2011-2012.
N/A=5 or fewer students in a category and results not shown.

North Carolina Leadership Academies: Final 2013 Report
March 2014
Consortium for Educational Research and Evaluation–North Carolina 148
Table J24. RLA Cohort 2 Job Placements, PTLA, 2011-12 School Data
School of
Placement
English I/
Reading
Algebra I/
Mathematics Designation AYP
Percentage
of Low-
Income
Students
School
Size
Graham High
School 71.50% 47.40% School of Progress Met 23 of 23 Targets 54.91% 785
Newlin
Elementary 42.40% 62.40% Priority School
Not Met
(14 of 21 Targets Met) 91.43% 604
Southeast
Guilford Middle 74.60% 84.70%
School of
Distinction Met 25 of 25 Targets 37.85% 1033
Ferndale Middle 54.10% 68.60% No Recognition Not Met
(20 of 33 Targets Met) 74.67% 867
Eastern Guilford
Middle 56.40% 71.500% School of Progress
Not Met
(22 of 33 Targets Met) 66.77% 983
Northeast
Guilford High
School
70.30% 63.70% No Recognition Not Met
(21 of 23 Targets Met) 52.98% 1060
Jamestown
Middle 75.90% 89.40%
School of
Distinction Met 37 of 37 Targets 51.75% 1135
Northern
Guilford High
School
94.10% 90.60% Honor School of
Excellence Met 19 of 19 Targets 16.13% 1294
Wiley
Accel/Enrichment
Elementary
62.90% 86.60% School of Progress Met 13 of 13 Targets 96.62% 238
Rankin
Elementary 48.20% 71.60% Priority School
Not Met
(22 of 29 Targets Met) 92.12% 715
Walkertown High
School 82.20% 61.00% No Recognition
Not Met
(7 of 10 Targets Met) 57.79% 222
Bolton
Elementary 56.40% 76.10% School of Progress
Not Met
(18 of 21 Targets Met) 87.33% 573
Kernersville
Elementary 70.00% 85.00% School of Progress Met 29 of 29 Targets 67.46% 877
Ibraham
Elementary 50.60% 75.70% No Recognition
Not Met
(17 of 21 Targets Met) 92.95% 454
West Forsyth
High School 93.20% 82.60%
Honor School of
Excellence Met 25 of 25 Targets 19.78% 1953
Griffith
Elementary 59.20% 78.30% No Recognition
Not Met
(22 of 25 Targets Met) 85.04% 551
The Downtown
School 86.70% 95.00%
Honor School of
Excellence Met 13 of 13 Targets 9.74% 346

North Carolina Leadership Academies: Final 2013 Report
March 2014
Consortium for Educational Research and Evaluation–North Carolina 149
Table J25. RLA Cohort 2 Job Placements, SLA, 2009-10 School Data
School of
Placement
English I/
Reading
Algebra I/
Mathematics Designation AYP
Percentage
of Low-
Income
Students
School
Size
Southern Pines
Primary N/A N/A School of Progress
Not Met
(20 of 21 Targets Met) 57.00% 442
Washington Park
Elementary 77.00% 90.30%
School of
Distinction Met 17 of 17 Targets 61.60% 349
Hawk Eye
Elementary 37.40% 61.90% Priority School
Not Met
(8 of 13 Targets Met) 86.46% 411
Purnell Swett
High School 59.80% 58.20% School of Progress
Not Met
(8 of 17 Targets Met) 63.79% 1619
L.J. Bell
Elementary 69.00% 84.50% School of Progress Met 17 of 17 Targets 60.93% 518
Hamlet Middle 55.00% 70.10% School of Progress Not Met
(23 of 25 Targets Met) 71.30% 586
East Lee Middle 67.70% 80.40% School of Progress Not Met
(27 of 29 Targets Met) 57.97% 630
Tabor City
Middle 60.10% 80.30% School of Progress
Not Met
(16 of 17 Targets Met) 77.65% 233
Elizabethtown
Middle 50.20% 73.10% Priority School
Not Met
(20 of 25 Targets Met) 76.75% 481
SanLee Middle 66.40% 85.20% School of Progress Met 29 of 29 Targets 62.97% 790
Southern Pines
Elementary 70.00% 83.50% School of Progress
Not Met
(20 of 21 Targets Met) 50.00% 421
J. Glenn Edwards
Elementary 69.90% 87.90% School of Progress Met 25 of 25 Targets 74.96% 682
Lee County High
School 76.60% 66.80% School of Progress Met 21 of 21 Targets 40.71% 1348
J.R. Ingram
Elementary 72.10% 83.10% School of Progress
Not Met
(22 of 23 Targets Met) 60.44% 699
Union Pines High
School 83.90% 69.10%
School of
Distinction
Not Met
(12 of 15 Targets Met) 31.00% 1174
Southern Middle 65.50% 75.90% School of Progress Not Met
(22 of 25 Targets Met) 53.00% 712
Douglas Byrd
Middle 55.10% 74.10% School of Progress Met 25 of 25 Targets 74.15% 643
Broadway
Elementary 65.60% 83.10% School of Progress Met 21 of 21 Targets 69.18% 582
Boone Trail
Elementary 56.50% 70.50% No Recognition
Not Met
(19 of 23 Targets Met) 67.27% 569
Scotland High
School N/A N/A N/A N/A N/A N/A
Notes:
Southern Pines Primary is K-2 only so there is no testing data.
Scotland High School used to be made up of six learning academies but merged into one high school in 2011-2012;
treating as new school as of 2011-2012 since data is incomplete for learning academies from 2008-2011.

North Carolina Leadership Academies: Final 2013 Report
March 2014
Consortium for Educational Research and Evaluation–North Carolina 150
Table J26. RLA Cohort 2 Job Placements, SLA, 2010-11 School Data
School of
Placement
English I/
Reading
Algebra I/
Mathematics Designation AYP
Percentage
of Low-
Income
Students
School
Size
Southern Pines
Primary N/A N/A No Recognition
Not Met
(15 of 21 Targets Met) 56.05% 409
Washington Park
Elementary 72.30% 91.30%
School of
Distinction
Not Met
(16 of 17 Targets Met) 61.30% 319
Hawk Eye
Elementary 41.30% 68.80% Priority School
Not Met
(13 of 17 Targets Met) 86.68% 400
Purnell Swett
High School 60.30% 66.80% School of Progress
Not Met
(13 of 19 Targets Met) 69.02% 1615
L.J. Bell
Elementary 75.00% 85.30%
School of
Distinction
Not Met
(15 of 17 Targets Met) 60.97% 521
Hamlet Middle 58.40% 71.90% School of Progress Not Met
(16 of 21 Targets Met) 70.92% 576
East Lee Middle 67.40% 79.10% School of Progress Not Met
(20 of 29 Targets Met) 59.62% 649
Tabor City
Middle 59.90% 79.30% School of Progress
Not Met
(12 of 17 Targets Met) 80.25% 213
Elizabethtown
Middle 51.50% 69.20% School of Progress
Not Met
(14 of 25 Targets Met) 77.46% 419
SanLee Middle 70.00% 86.90% School of Progress Not Met
(26 of 29 Targets Met) 66.17% 810
Southern Pines
Elementary 67.50% 81.600% No Recognition
Not Met
(15 of 21 Targets Met) 53.18% 421
J. Glenn Edwards
Elementary 67.50% 86.40% School of Progress
Not Met
(24 of 25 Targets Met) 76.90% 686
Lee County High
School 75.80% 65.60% School of Progress
Not Met
(19 of 21 Targets Met) 43.29% 1341
J.R. Ingram
Elementary 72.20% 85.40% School of Progress
Not Met
(22 of 25 Targets Met) 63.96% 677
Union Pines
High School 88.50% 77.800%
School of
Distinction
Not Met
(12 of 17 Targets Met) 35.05% 1181
Southern Middle 68.20% 79.50% School of Progress Not Met
(23 of 25 Targets Met) 56.22% 713
Douglas Byrd
Middle 47.30% 66.80% Priority School
Not Met
(13 of 25 Targets Met) 78.19% 690
Broadway
Elementary 61.30% 81.00% School of Progress
Not Met
(13 of 21 Targets Met) 73.01% 593
Boone Trail
Elementary 49.10% 61.20% Priority School
Not Met
(13 of 23 Targets Met) 70.92% 545
Scotland High
School N/A N/A N/A N/A N/A N/A
Notes:
Southern Pines Primary is K-2 only so there is no testing data.
Scotland High School used to be made up of six learning academies but merged into one high school in 2011-2012;
treating as new school as of 2011-2012 since data is incomplete for learning academies from 2008-2011.

North Carolina Leadership Academies: Final 2013 Report
March 2014
Consortium for Educational Research and Evaluation–North Carolina 151
Table J27. RLA Cohort 2 Job Placements, SLA, 2011-12 School Data
School of
Placement
English I/
Reading
Algebra I/
Mathematics Designation AMO (formerly AYP)
Percentage of
Low-Income
Students
School
Size
Southern Pines
Primary N/A N/A School of Progress
Not Met
(19 of 21 Targets Met) 54.88% 447
Washington Park
Elementary 65.70% 87.40% School of Progress Met 17 of 17 Targets 64.29% 337
Hawk Eye
Elementary 47.30% 66.30% Priority School
Not Met
(14 of 17 Targets Met) 91.63% 356
Purnell Swett
High School 70.50% 64.10% School of Progress
Not Met
(13 of 16 Targets Met) 70.49% 1647
L.J. Bell
Elementary 80.60% 83.80%
School of
Distinction Met 17 of 17 Targets 64.42% 536
Hamlet Middle 60.40% 76.00% School of Progress Not Met
(15 of 21 Targets Met) 71.91% 569
East Lee Middle 61.50% 75.40% No Recognition Not Met
(17 of 29 Targets Met) 62.40% 682
Tabor City
Middle 63.90% 80.60% School of Progress
Not Met
(15 of 17 Targets Met) 77.78% 224
Elizabethtown
Middle 50.70% 63.00% Priority School
Not Met
(15 of 25 Targets Met) 79.86% 407
SanLee Middle 75.10% 90.30% School of
Distinction Met 29 of 29 Targets 67.07% 818
Southern Pines
Elementary 71.80% 82.40% School of Progress
Not Met
(19 of 21 Targets Met) 57.89% 399
J. Glenn
Edwards
Elementary
64.40% 80.50% No Recognition Not Met
(22 of 25 Targets Met) 79.30% 708
Lee County High
School 64.20% 57.40% School of Progress
Not Met
(21 of 25 Targets Met) 50.15% 1361
J.R. Ingram
Elementary 67.10% 80.70% No Recognition
Not Met
(24 of 25 Targets Met) 64.53% 706
Union Pines
High School 91.60% 89.50% No Recognition Met 16 of 16 Targets 35.58% 1150
Southern Middle 63.00% 76.90% School of Progress Not Met
(17 of 25 Targets Met) 58.19% 751
Douglas Byrd
Middle 52.90% 74.00% School of Progress
Not Met
(24 of 29 Targets Met) 80.23% 730
Broadway
Elementary 64.10% 82.20% School of Progress
Not Met
(19 of 21 Targets Met) 78.75% 558
Boone Trail
Elementary 49.80% 65.30% Priority School
Not Met
(14 of 21 Targets Met) 70.00% 540
Scotland High
School 74.00% 5.90% No Recognition
Not Met
(20 of 30 Targets Met) 53.10% 1555
Note: Southern Pines Primary is K-2 only so there is no testing data.

Contact Information:
Please direct all inquiries to Kathleen M. Brown
© 2014 Consortium for Educational Research and Evaluation–North Carolina