International Baccalaureate North Battleford Comprehensive High School.

NORTH BERGEN BOARD OF EDUCATION
COMPREHENSIVE ANNUAL FINANCIAL REPORT
FOR THE FISCAL YEAR ENDED JUNE 30, 2014
North Bergen, New Jersey

COMPREHENSIVE ANNUAL
FINANCIAL REPORT
of the
North Bergen Board of Education
North Bergen, New Jersey
For The Fiscal Year Ended June 30,2014
Prepared by
Business Office
NORTH BERGEN BOARD OF EDUCATION TABLE OF CONTENTS
INTRODUCTORY SECTION
Letter of Transmittal Organizational Chart Roster of Officials Consultants and Advisors
Independent Auditors' Report
FINANCIAL SECTION
REQUIRED SUPPLEMENTARY INFORMATION-PART I
Management's Discussion and Analysis
BASIC FINANCIAL STATEMENTS
A. District-wide Financial Statements
A-1 Statement ofNet Position A-2 Statement of Activities
B. Fund Financial Statements
Governmental Funds
i-iv v
Vl
Vll
1-3
4-16
17-18 19
B-1 Balance Sheet 20 B-2 Statement of Revenues, Expenditures, and Changes in Fund Balances 21 B-3 Reconciliation of the Statement of Revenues, Expenditures, and Changes in
Fund Balances of Governmental Funds to the Statement of Activities 22
Proprietary Funds B-4 Statement of Net Position 23 B-5 Statement of Revenues, Expenses, and Changes in Net Position 24 B-6 Statement of Cash Flows 25
Fiduciary Funds B-7 Statement of Fiduciary Net Position 26 B-8 Statement of Changes in Fiduciary Net Position 27
Notes to the Financial Statements 28-54
NORTH BERGEN BOARD OF EDUCATION TABLE OF CONTENTS
REQUIRED SUPPLEMENTARY INFORMATION- PART II
C. Budgetary Comparison Schedules
C-1 Budgetary Comparison Schedule - General Fund C-2 Budgetary Comparison Schedule- Special Revenue Fund C-3 Budgetary Comparison Schedule -
Notes to the Required Supplementary Information
OTHER SUPPLEMENTARY INFORMATION
D. School Level Schedules (Not Applicable)
E. Special Revenue Fund
E-1 Combining Schedule of Revenues and Expenditures Special Revenue Fund- Budgetary Basis
E-2 Preschool Education Aid- Schedule of Expenditures-Budgetary Basis
F. Capital Projects Fund
55-62 63
64
65-67
68
F-1 Summary Schedule of Project Expenditures 69-70 F-2 Summary Schedule of Revenues, Expenditures and Changes in Fund Balance 71 F-2a-F-2t Schedule of Project Revenues, Expenditures, Project Balances and Project Status 72-91
G. Proprietary Funds
Enterprise Fund G-1 Statement of Net Assets- N/ A G-2 Statement of Revenues, Expenses and Changes in
Net Assets- N/A G-3 Statement of Cash Flows- Nl A
H. Fiduciary Funds
H -1 Combining Statement of Agency Net Position H-2 Combining Statement of Changes in Fiduciary Net Position- N/ A H-3 Student Activity Agency Fund Schedule of Receipts and Disbursements H-4 Payroll Agency Fund Schedule of Receipts and Disbursements
92
92 92
93 94 94 94

NORTH BERGEN BOARD OF EDUCATION TABLE OF CONTENTS
REQUIRED SUPPLEMENTARY INFORMATION (Continued)
I. Long-Term Debt
I-1 Schedule of Serial Bonds I-2 Schedule of Obligations under Lease-Purchase Agreements I-3 Schedule of Sales/Leaseback Obligations Payable I-4 Debt Service Fund Budgetary Comparison Schedule
J. STATISTICAL SECTION (Unaudited)
J-1 Net Position by Component J-2 Changes in Net Position J-3 Fund Balances - Governmental Funds J-4 Changes in Fund Balances - Governmental Funds J-5 General Fund Other Local Revenue by Source J-6 Assessed Value and Actual Value of Taxable Property J-7 Property Tax Rates J-8 Principal Property Taxpayers J-9 Property Tax Levies and Collections J-10 Ratios of Outstanding Debt by Type J-11 Ratios of Net General Bonded Debt Outstanding J-12 Computation of Direct and Overlapping Debt J-13 Legal Debt Margin Information J-14 Demographic Statistics J-15 · Principal Employers J-16 Full-Time Equivalent District Employees by Function/Program J-17 Operating Statistics J-18 School Building Information J-19 Schedule of Required Maintenance for School Facilities J-20 Schedule of Insurance
95 96 97 98
99 100-101
102 103 104 105 106 107 108 109 110 111 112 113 114 115 116 117 118 119
K.
K-1
K-2
K-3 K-4 K-5
K-6 K-7
NORTH BERGEN BOARD OF EDUCATION TABLE OF CONTENTS
SINGLE AUDIT SECTION
Report on Internal Control Over Financial Reporting and on Compliance And Other Matters Based on an Audit of Financial Statements Performed in Accordance With Government Auditing Standards
Report on Compliance with Requirements that could have a Direct and Material Effect on Each Major Program and on Internal Control Over Compliance in Accordance with OMB Circular A-133 and New Jersey OMB Circular 04-04-Independent Auditor's Report
Schedule of Expenditures ofF ederal A wards Schedule of Expenditures of State Financial Assistance Notes to the Schedules of Expenditures of Federal Awards
and State Financial Assistance Schedule of Findings and Questioned Costs Summary Schedule of Prior Year Audit Findings
and Questioned Costs
120-121
122-124 125
126-127
128-129 130-134
135

INTRODUCTORY SECTION
~(Q)[RJIJ[}j] ~~[Rl@~~ BOARD OF EDUCATION
JULIO MARENGO PRESIDENT
MAUAENA LUZZI VICE PRESIDENT
7317 Kennedy Boulevard, North Bergen, New Jersey 07047 • (201) 868-1000
HUGO D. CABRERA BOARD SECRETARY
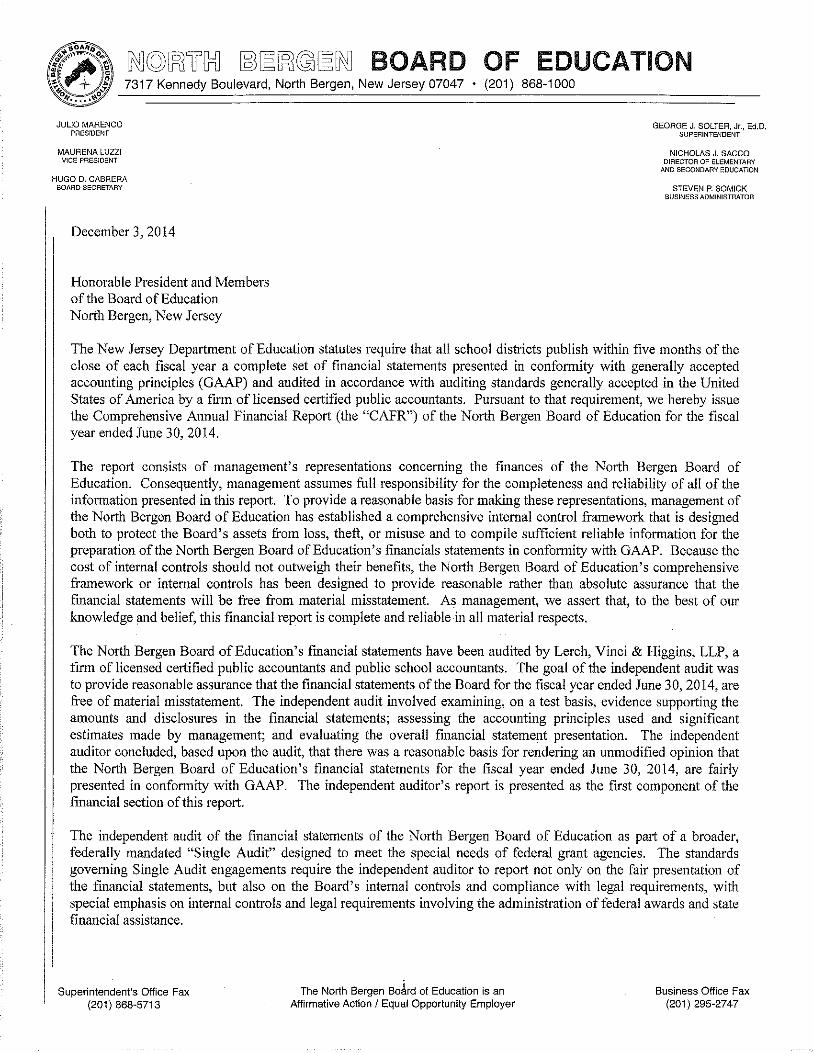
December 3, 2014
Honorable President and Members of the Board of Education North Bergen, New Jersey
GEORGE J. SOLTER, Jr., Ed. D. SUPERINTENDENT
NICHOLAS J. SACCO DIRECTOR OF ELEMENTARY
AND SECONDARY EDUCATION
STEVEN P. SOMICK BUSINESS ADMINISTRATOR
The New Jersey Department of Education statutes require that all school districts publish within five months of the close of each fiscal year a complete set of financial statements presented in conformity with generally accepted accounting principles (GAAP) and audited in accordance with auditing standards generally accepted in the United States of America by a firm of licensed certified public accountants. Pursuant to that requirement, we hereby issue the Comprehensive Annual Financial Report (the "CAFR") of the North Bergen Board of Education for the fiscal year ended June 30, 2014.
The report consists of management's representations concerning the finances of the North Bergen Board of Education. Consequently, management assumes full responsibility for the completeness and reliability of all of the information presented in this report. To provide a reasonable basis for making these representations, management of the North Bergen Board of Education has established a comprehensive internal control framework that is designed both to protect the Board's assets from Joss, theft, or misuse and to compile sufficient reliable information for the preparation of the North Bergen Board of Education's financials statements in conformity with GAAP. Because the cost of internal controls should not outweigh their benefits, the North Bergen Board of Education's comprehensive framework or internal controls has been designed to provide reasonable rather than absolute assurance that the financial statements will be free from material misstatement. As management, we assert that, to the best of our knowledge and belief, this fmancial report is complete and reliable in all material respects.
The North Bergen Board of Education's fmancial statements have been audited by Lerch, Vinci & Higgins, LLP, a firm of licensed certified public accountants and public school accountants. The goal of the independent audit was to provide reasonable assurance that the financial statements of the Board for the fiscal year ended June 30, 2014, are free of material misstatement. The independent audit involved examining, on a test basis, evidence supporting the amounts and disclosures in the financial statements; assessing the accounting principles used and significant estimates made by management; and evaluating the overall financial statement presentation. The independent auditor concluded, based upon the audit, that there was a reasonable basis for rendering an unmodified opinion that the North Bergen Board of Education's financial statements for the fiscal year ended June 30, 2014, are fairly presented in conformity with GAAP. The independent auditor's report is presented as the first component of the fmancial section of this report.
The independent audit of the financial statements of the North Bergen Board of Education as part of a broader, federally mandated "Single Audit" designed to meet the special needs of federal grant agencies. The standards governing Single Audit engagements require the independent auditor to report not only on the fair presentation of the financial statements, but also on the Board's internal controls and compliance with legal requirements, with special emphasis on internal controls and legal requirements involving the administration of federal awards and state financial assistance.
Superintendent's Office Fax (201) 868-5713
The North Bergen Bo~rd of Education is an Affirmative Action I Equal Opportunity Employer
Business Office Fax (201) 295-2747
GAAP requires that management provide a narrative introduction, overview and analysis to accompany the basic financial statements in the form of Management's Discussion and Analysis (MD&A). This letter of transmittal is designed to complement the MD&A and should be read in conjunction with it. North Bergen Board of Education's MD&A can be found immediately following the report of the independent auditors.
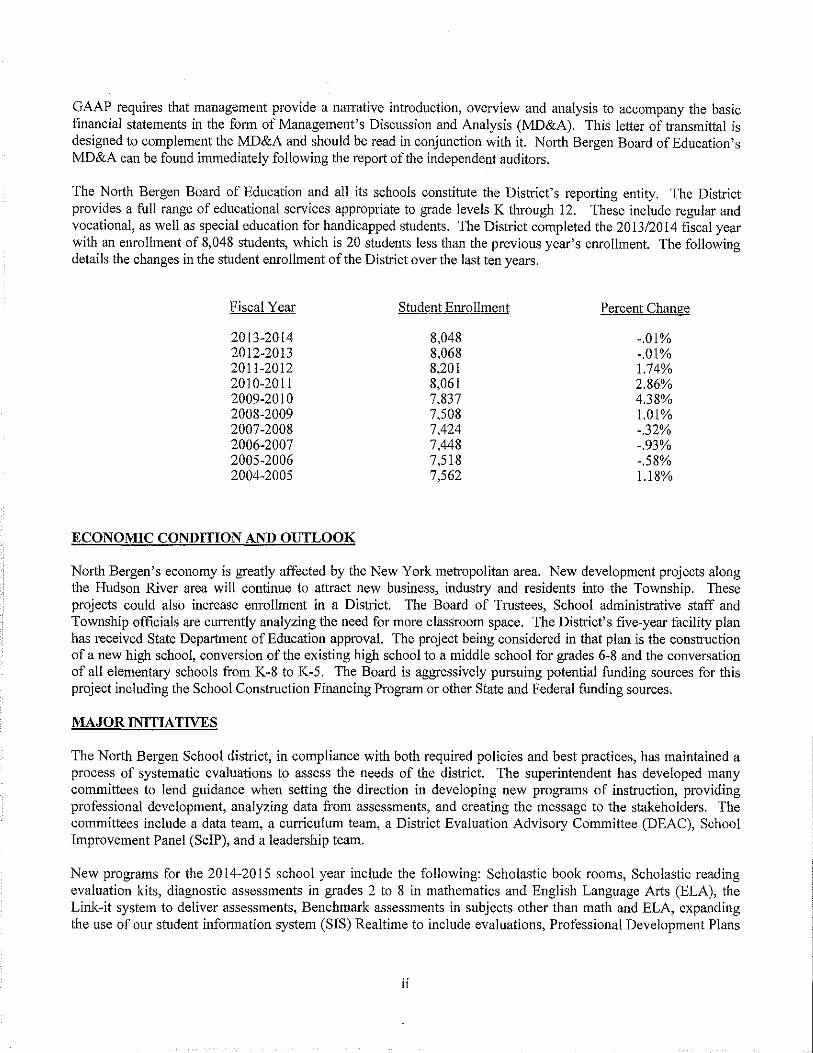
The North Bergen Board of Education and all its schools constitute the District's reporting entity. The District provides a full range of educational services appropriate to grade levels K through 12. These include regular and vocational, as well as special education for handicapped students. The District completed the 2013/2014 fiscal year with an enrolhnent of 8,048 students, which is 20 students less than the previous year's enrollment. The following details the changes in the student enrollment of the District over the last ten years.
Fiscal Year Student Enrollment Percent Change
2013-2014 8,048 -.01% 2012-2013 8,068 -.01% 2011-2012 8,201 1.74% 2010-2011 8,061 2.86% 2009-2010 7,837 4.38% 2008-2009 7,508 1.01% 2007-2008 7,424 -.32% 2006-2007 7,448 -.93% 2005-2006 7,518 -.58% 2004-2005 7,562 1.18%
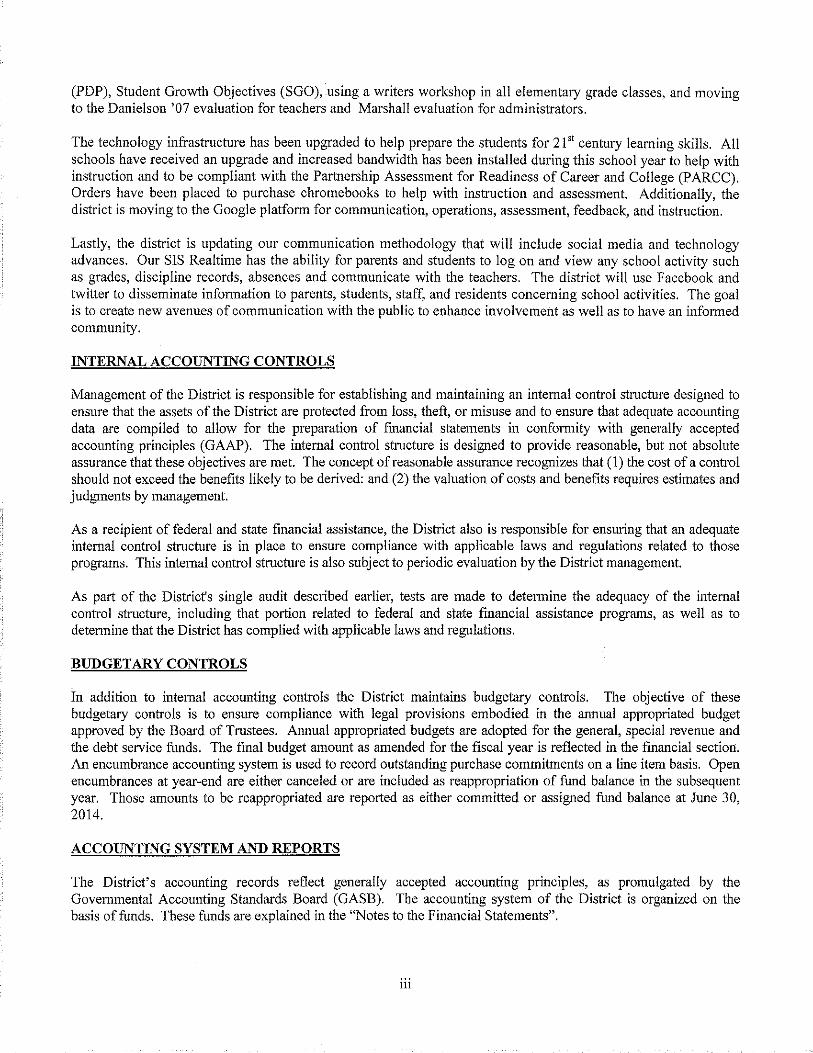
ECONOMIC CONDITION AND OUTLOOK
North Bergen's economy is greatly affected by the New York metropolitan area. New development projects along the Hudson River area will continue to attract new business, industry and residents into the Township. These projects could also increase enrollment in a District. The Board of Trustees, School administrative staff and Township officials are currently analyzing the need for more clasSroom space. The District's five-year facility plan has received State Department of Education approval. The project being considered in that plan is the construction of a new high school, conversion of the existing high school to a middle school for grades 6-8 and the conversation of all elementary schools from K-8 to K-5. The Board is aggressively pursuing potential funding sources for this project including the School Construction Financing Program or other State and Federal funding sources.
MAJOR INITIATIVES
The North Bergen School district, in compliance with both required policies and best practices, has maintained a process of systematic evaluations to assess the needs of the district. The superintendent has developed many committees to lend guidance when setting the direction in developing new programs of instruction, providing professional development, analyzing data from assessments, and creating the message to the stakeholders. The committees include a data team, a curriculum team, a District Evaluation Advisory Committee (DEAC), School Improvement Panel (SciP), and a leadership team.
New programs for the 2014-2015 school year include the following: Scholastic book rooms, Scholastic reading evaluation kits, diagnostic assessments in grades 2 to 8 in mathematics and English Language Arts (ELA), the Linl(-it system to deliver assessments, Benchmark assessments in subjects other than math and ELA, expanding the use of our student information system (SIS) Realtime to include evaluations, Professional Development Plans
ii
(PDP), Student Growth Objectives (SGO), using a writers workshop in all elementary grade classes, and moving to the Danielson '07 evaluation for teachers and Marshall evaluation for administrators.
The technology infrastructure has been upgraded to help prepare the students for 21" century learning skills. All schools have received an upgrade and increased bandwidth has been installed during this school year to help with instruction and to be compliant with the Partnership Assessment for Readiness of Career and College (PARCC). Orders have been placed to purchase chromebooks to help with instruction and assessment. Additionally, the district is moving to the Google platform for communication, operations, assessment, feedback, and instruction.
Lastly, the district is updating our communication methodology that will include social media and technology advances. Our SIS Realtime has the ability for parents and students to log on and view any school activity such as grades, discipline records, absences and communicate with the teachers. The district will use Facebook and twitter to disseminate information to parents, students, staff, and residents concerning school activities. The goal is to create new avenues of communication with the public to enhance involvement as well as to have an informed community.
INTERNAL ACCOUNTING CONTROLS
Management of the District is responsible for establishing and maintaining an internal control structure designed to ensure that the assets of the District are protected from loss, theft, or misuse and to ensure that adequate accounting data are compiled to allow for the preparation of financial statements in conformity with generally accepted accounting principles (GAAP). The internal control structure is designed to provide reasonable, but not absolute assurance that these objectives are met. The concept of reasonable assurance recognizes that (1) the cost of a control should not exceed the benefits likely to be derived: and (2) the valuation of costs and benefits requires estimates and judgments by management.
As a recipient of federal and state financial assistance, the District also is responsible for ensuring that an adequate internal control structure is in place to ensure compliance with applicable laws and regulations related to those programs. This internal control structure is also subject to periodic evaluation by the District management.
As part of the District's single audit described earlier, tests are made to determine the adequacy of the internal control structure, including that portion related to federal and state financial assistance programs, as well as to determine that the District has complied with applicable laws and regulations.
BUDGETARY CONTROLS
In addition to internal accounting controls the District maintains budgetary controls. The objective of these budgetary controls is to ensure compliance with legal provisions embodied in the annual appropriated budget approved by the Board of Trustees. Annual appropriated budgets are adopted for the general, special revenue and the debt service funds. The final budget amount as amended for the fiscal year is reflected in the financial section. An encumbrance accounting system is used to record outstanding purchase commitments on a line item basis. Open encumbrances at year-end are either canceled or are included as reappropriation of fund balance in the subsequent year. Those amounts to be reappropriated are reported as either committed or assigned fund balance at June 30, 2014.
ACCOUNTING SYSTEM AND REPORTS
The District's accounting records reflect generally accepted accounting principles, as promulgated by the Governmental Accounting Standards Board (GASB). The accounting system of the District is organized on the basis offunds. These funds are explained in the "Notes to the Financial Statements".
111

CASH MANAGEMENT
The investment policy of North Bergen is guided in large part by state statute as detailed in "Notes to the Financial Statements". The District has adopted a cash management plan which requires it to deposit public funds in public depositories protected from Joss under the provisions of the Govermnental Unit Deposit Protection Act ("GUDPA"). GUDPA was enacted in 1970 to protect Governmental Units from a Joss of funds on deposit with a failed banking institution in New Jersey. The Jaw requires governmental units to deposit public funds only in public depositories located in New Jersey where the funds are secured in accordance with the act.
RISK MANAGEMENT
The Board carries various forms of insurance, including but not limited to, general liability, automobile liability and comprehensive/collision, hazard and theft insurance on property and contents, and fidelity bonds.
OTHER INFORMATION
Independent Audit- State statutes require an annual audit by independent certified public accountants or registered municipal accountants. The accounting firm of Lerch, Vinci and Higgins, LLP, was selected by the Board. In addition to meeting the requirements set forth in state statutes, the audit also was designed to meet the requirements of the Single Audit Act as amended and the related OMB Circular A-133 and New Jersey OMB Circular 04-04. The auditor's report on the basic financial statements is included in the financial section of this report. The auditor's report related specifically to the single audit are included in the single audit section of this report.
ACKNOWLEDGEMENTS
We would like to express our appreciation to the members of the North Bergen School Board for their concern in providing fiscal accountability to the citizens and taxpayers of the school district and thereby contributing their full support to the development and maintenance of our fmancial operation. The preparation of this report could not have been accomplished without the efficient and dedicated services of the financial and accounting staff.
Steven Somick School Business Administrator
IV
-h~ ~~~ George J. Solter Superintendent of Schools

NORTH BERGEN BOARD OF EDUCATION
ORGANIZATIONAL CHART
I Board of Educatlon I I .
I I r Board Attorney l I Board Auditor I
-----------------------1 Superintendent of Schools I
r Board. Secretnry I I Dlrectoc Elemenfa(y rutd I I School 8ugines3 Arlminbtrntor I Sec011druy Bducatiou
I l I Supervi~1lr Technology l r Director Facilities / I Director of Athletic.~ Dlsrdct Dit:ector, Snpervlqors I H Director of Finance I (m:e detniled list below)
1 I I I I H 't'tensnrer School I Nl!dstnnt SupervJ.qor As!lstant Director ]
I I Technology FaciJitles Building Pdi!clpnl~ Director Special Services Moneys
I 1 1 I I I H I
r I I Iuremnl Auditor
Technology Support Maintenance,
r l Specialist Custodial Staff Buildhlg Vice Child Study Team Principals
I I H 'linnsportatlou I · I Director Security I Compatlics
r Building Supervisors Scltool Psychologist, I I H Food Service
I r SeCUt"Jty Slnff l Comp;my
I Toachenl, Aides, Conn~e!orn, NMes, Librarjaus I Bookkeeping Staff I
v
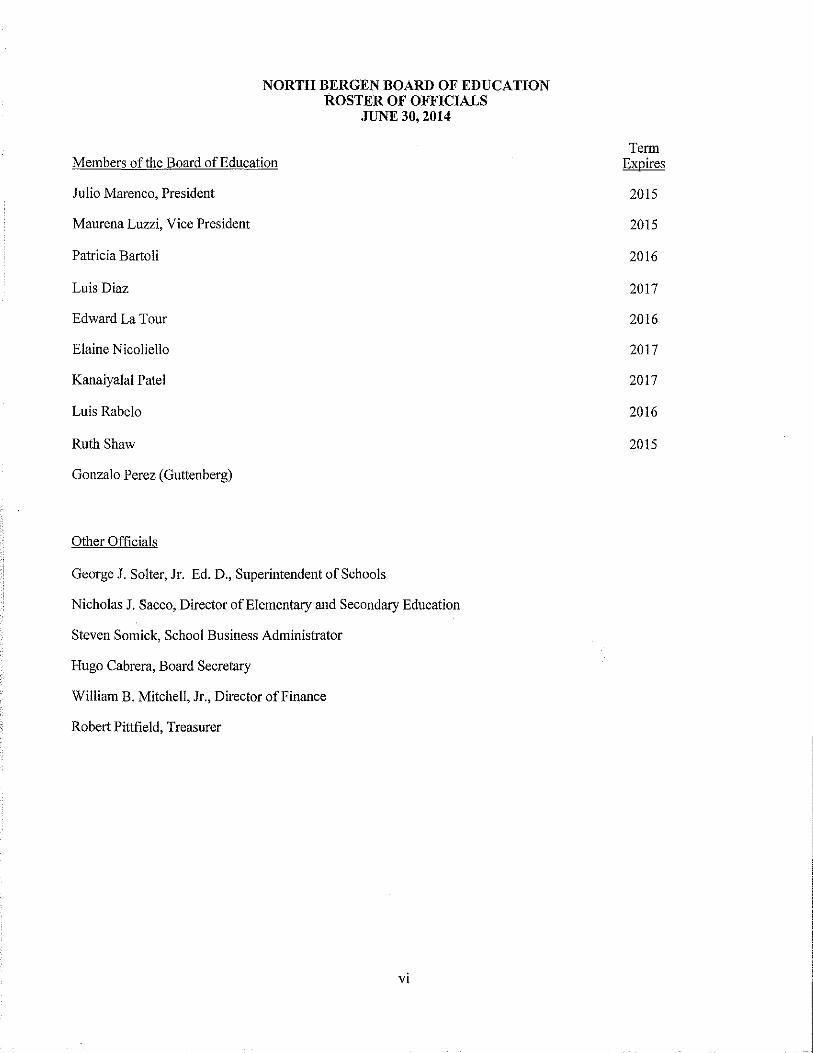
NORTH BERGEN BOARD OF EDUCATION ROSTER OF OFFICIALS
JUNE 30, 2014
Members of the Board of Education
Julio Marenco, President
Maurena Luzzi, Vice President
Patricia Bartoli
Luis Diaz
Edward La Tour
Elaine Nicoliello
Kanaiyalal Patel
Luis Rabelo
Ruth Shaw
Gonzalo Perez (Guttenberg)
Other Officials
George J. Solter, Jr. Ed. D., Superintendent of Schools
Nicholas J. Sacco, Director of Elementary and Secondary Education
Steven Somick, School Business Administrator
Hugo Cabrera, Board Secretary
William B. Mitchell, Jr., Director of Finance
Robert Pittfield, Treasurer
vi
Term Expires
2015
2015
2016
2017
2016
2017
2017
2016
2015
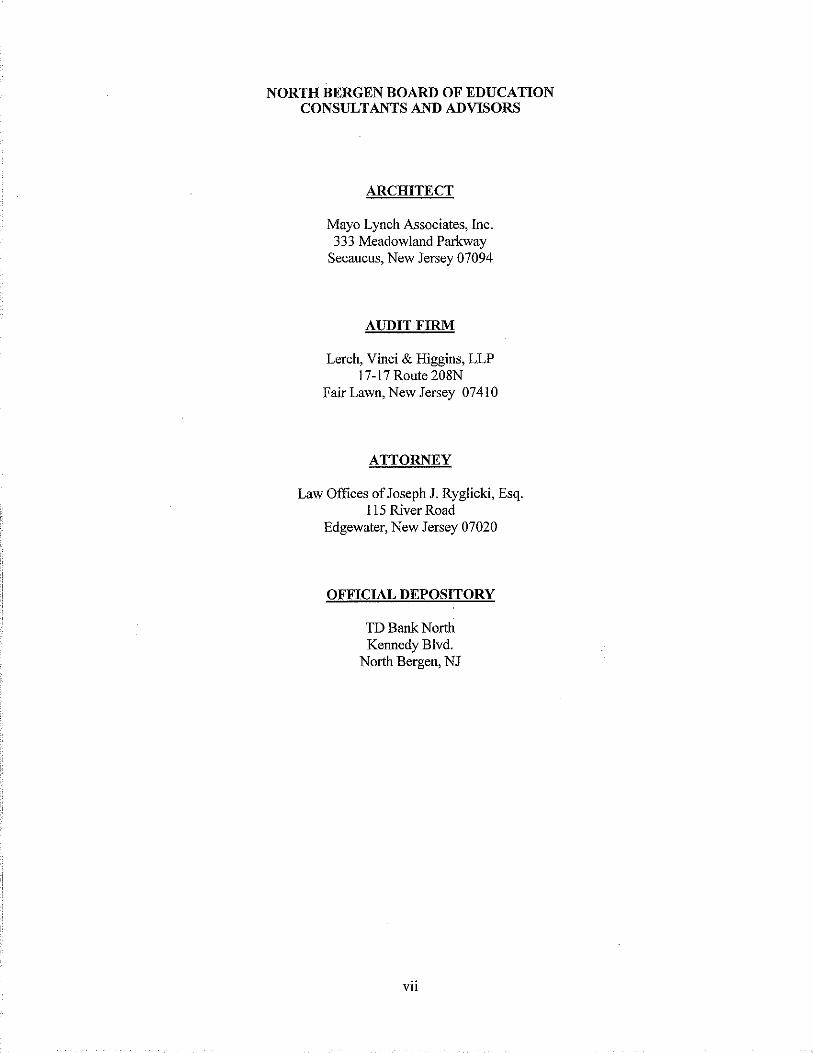
NORTH BERGEN BOARD OF EDUCATION CONSULTANTS AND ADVISORS
ARCHITECT
Mayo Lynch Associates, Inc. 333 Meadowland Parkway
Secaucus, New Jersey 07094
AUDIT FIRM
Lerch, Vinci & Higgins, LLP 17-17 Route 208N
Fair Lawn, New Jersey 07410
ATTORNEY
Law Offices of Joseph J. Ryglicki, Esq. 115 River Road
Edgewater, New Jersey 07020
OFFICIAL DEPOSITORY
TD Bank North Kennedy Blvd.
North Bergen, NJ
vii
FINANCIAL SECTION
LERCH, VINCI & HIGGINS,LLP CERTIFIED PUBLIC ACCOUNTANTS REGISTERED MUNICIPAL ACCOUNTANTS
DIETER P. LERCH, CPA, RMA, PSA
GARY J. VINCI, CPA, RMA, PSA
GARY W. HIGGINS, CPA, RMA, PSA
JEFFREY C. BUSS, CPA, RMA, PSA
PAULl. LERCH, CPA, RMA, PSA
DONNA L. JAPHET, CPA, PSA
JULIUS B. CONSONI, CPA, PSA
ELIZABETH A. SHICK, CPA, RMA, PSA
ANDREW PARENTE, CPA, RMA, PSA
ROBERT W. HAAG, CPA, PSA
DEBORAH K. LERCH, CPA, PSA
RALPH M. PICONE, CPA, RMA, PSA
Honorable President and Members of the Board of Trustees
North Bergen Board of Education North Bergen, New Jersey
Report on the Financial Statements
INDEPENDENT AUDITOR'S REPORT
DEBRA GOLLE, CPA
CINDY JANACEK, CPA, RMA
LORI T. MANUKIAN, CPA, PSA
MARK SACO, CPA
CHYNNA C. DESTEFANO, CPA, PSA
KEVIN LOMSK!. CPA
EDWARD P. MURPHY, CPA
We have audited the accompanying financial statements of the governmental activities, the business-type activities, each major fund, and the aggregate remaining fund information of the North Bergen Board of Education, as of and for the fiscal year ended June 30, 2014 and the related notes to the financial statements, which collectively comprise the Board of Education's basic financial statements as listed in the table of contents.
Management's Responsibility for the Financial Statements
Management is responsible for the preparation and fair presentation of these fmancial statements in accordance with accounting principles generally accepted in the United States of America; this includes the design, implementation, and maintenance of internal control relevant to the preparation and fair presentation of financial statements that are free from material misstatement, whether due to fraud or error.
Auditor's Responsibility
Our responsibility is to express opinions on these financial statements based on our audit. We conducted our audit in accordance with auditing standards generally accepted in the United States of America, the standards applicable to financial audits contained in the Government Auditing Standards, issued by the Comptroller General of the United States and audit requirements as prescribed by the Office of School Finance, Department of Education, State of New Jersey. Those standards require that we plan and perform the audit to obtain reasonable assurance about whether the financial statements are free of material misstatement.
An audit involves performing procedures to obtain audit evidence about the amounts and disclosures in the financial statements. The procedures selected depend on the auditor's judgment, including the assessment of the risks of material misstatement of the financial statements, whether due to fraud or error. In making those risk assessments, the auditor considers internal control relevant to the entity's preparation and fair presentation of the financial statements in order to design audit procedures that are appropriate in the circumstances, but not for the purpose of expressing an opinion on the effectiveness of the entity's internal control. Accordingly, we express no such opinion. An audit also includes evaluating the appropriateness of accounting policies used and the reasonableness of significant accounting estimates made by management, as well as evaluating the overall presentation of the financial statements.
We believe that the audit evidence we have obtained is sufficient and appropriate to provide a basis for our audit opinions.
17-17 ROUTE 208 o FAIR LAWN, NJ 07410 • TELEPHONE (201) 791-7100 • FACSIMILE (201) 791-3035
WWW.LV1CPA.COM
Opinions
In our opinion, the financial statements referred to previously present fairly, in all material respects, the respective financial position of the governmental activities, the business-type activities, each major fund, and the aggregate remaining fund information of the North Bergen Board of Education as of June 30, 2014, and the respective changes in financial position and, where applicable, cash flows thereof for the fiscal year then ended in accordance with accounting principles generally accepted in the United States of America.
Other Matters
Required Snpplementary Information
Accounting principles generally accepted in the United States of America require that the management's discussion and analysis and budgetary comparison information be presented to supplement the basic financial statements. Such information, although not a part of the basic financial statements, is required by the Governmental Accounting Standards Board, who considers it to be an essential part of financial reporting for placing the basic financial statements in an appropriate operational, economic, or historical context. We have applied certain limited procedures to the required supplementary information in accordance with auditing standards generally accepted in the United States of America, which consisted of inquiries of management about the methods of preparing the information and comparing the information for consistency with management's responses to our inquiries, the basic fmancial statements, and other knowledge we obtained during our audit of the basic financial statements. We do not express an opinion or provide any assurance on the information because the limited procedures do not provide us with sufficient evidence to express an opinion or provide any assurance.
Other Information
Our audit was conducted for the purpose of forming opinions on the financial statements that collectively comprise the North Bergen Board of Education's basic financial statements. The introductory section, combining fund financial statements, financial schedules, statistical section, schedule of expenditures of federal awards as required by U.S. Office of Management and Budget (OMB) Circular A-133, Audits of States. Local Governments, and Non-Profit Organizations and schedule of expenditures of state financial assistance as required by New Jersey OMB Circular 04-04, Single Audit Policy for Recipients of Federal Grants. State Grants and State Aid, are presented for purposes of additional analysis and are not a required part of the basic financial statements of the North Bergen Board of Education.
The combining fund financial statements, schedule of expenditures of federal awards and schedule of expenditures of state financial assistance are the responsibility of management and were derived from and relate directly to the underlying accounting and other records used to prepare the basic financial statements. Such information has been subjected to the auditing procedures applied in the audit of the basic financial statements and certain additional procedures, including comparing and reconciling such information directly to the underlying accounting and other records used to prepare the basic financial statements or to the basic financial statements themselves, and other additional procedures in accordance with auditing standards generally accepted in the United States of America. In our opinion, the fund financial statements, schedules of expenditures of federal awards and state financial assistance are fairly stated in all material respects in relation to the basic financial statements as a whole.
The introductory section, financial schedules and statistical section have not been subjected to the auditing procedures applied in the audit of the basic financial statements and, accordingly, we do not express an opinion or provide any assurance on them.
2
Other Reporting Required by Government Auditing Standards
In accordance with Government Auditing Standards, we have also issued our report dated December 3, 2014 on our consideration of the North Bergen Board of Education's internal control over financial reporting and on our tests of its compliance with certain provisions of laws, regulations, contracts, and grant agreements and other matters. The purpose of that report is to describe the scope of our testing of internal control over financial reporting and compliance and the results of that testing, and not to provide an opinion on internal control over financial reporting or on compliance. That report is an integral part of an audit performed in accordance with Government Auditing Standards in considering the North Bergen Board of Education's internal control over financial reporting and compliance.
f;k. d;._, .,JL.;:A, d LERCH, VINCI & ~S, LLP Certified Public Accountants Public School Accountants
a~~~
Fair Lawn, New Jersey December 3, 2014
3
Public School Accountant PSA Number CS00829
MANAGEMENT'S DISCUSSION AND ANALYSIS

NORTH BERGEN BOARD OF EDUCATION
Management's Discussion and Analysis
This section of North Bergen Board of Education's comprehensive annual financial report presents our discussion and analysis of the District's fmancial performance during the fiscal year that ended on June 30, 2014. Please read it in conjunction with the transmittal letter at the front of this report and the District's financial statements, which immediately follows this section.
FINANCIAL HIGHLIGHTS
Key fmancial highlights for the 2013-2014 fiscal year include the following:
• The assets and deferred outflows of resources of the North Bergen Board of Education exceeded its liabilities and deferred inflows of resources at the close of the fiscal year by $47,355,999 (net position).
• Overall District revenues were $126,774,232. General revenues accounted for $95,478,640 or 75% of all revenues. Program specific revenues in the form of charges for services and grants and contributions accounted for $31,295,592 or 25% of total revenues.
• The School District had $122,013,783 in expenses for govermnental activities; only $28,238,089 of these expenses were offset by program specific charges, grants or contributions. General revenues (predominantly property taxes and unrestricted State aid) of $95,478,509 were adequate to provide for these programs.
• As of the close of the current fiscal year, the District's govermnental funds reported a combined ending fund balance of $18,544,126 an increase of $4,556,842 when compared to the ending Fund balance at June 30,2013 of$13,987,284.
• The General Fund unassigned fund balance at June 30,2014 was in a deficit position of$4,726,127, a decrease of $1,409,117 when compared with the ending fund balance deficit of $3,317,010 at June 30, 2013.
• The General Fund unassigned budgetary fund balance at June 30, 2014 was $1,128,437 which represents a decrease of $1,329,965 when compared to the ending unassigned fund balance at June 30, 2013 of$2,458,402.
4

NORTH BERGEN BOARD OF EDUCATION
Management's Discussion and Analysis
OVERVIEW OF THE FINANCIAL STATEMENTS
The fmancial section of the annual report consists of four pm1s - Independent Auditor's Report, required supplementary information which includes the management's discussion and analysis (this section), the basic financial statements, and supplemental information. The basic financial statements include two kinds of statements that present different views of the District:
• The first two statements are district wide financial statements that provide both short-term and long-term information about the District's overall fmancial status.
• The remaining statements are fund financial statements that focus on individual parts of the District, reporting the District's operations in more detail than the district-wide statements.
The Governmental Funds statements tell how basic services were financed in the short term as well as what remains for future spending.
Proprietary Funds statements offer short-term and long-term financial information about the activities the district operated like businesses.
Fiduciary Funds statements provide information about the financial relationships in which the District acts solely as a trustee or agent for the benefit of others to whom the resources belong.
The fmancial statements also include notes that explain some of the information in the statements and provide more detailed data. The table below shows how the various parts of this armual report are arranged and related to one another.
Management's Discussion
and Analysis
Basic Financial
Statements
5
Required Supplementary
Information
NORTH BERGEN BOARD OF EDUCATION
Management's Discussion and Analysis
OVERVIEW OF THE FINANCIAL STATEMENTS (Continued)
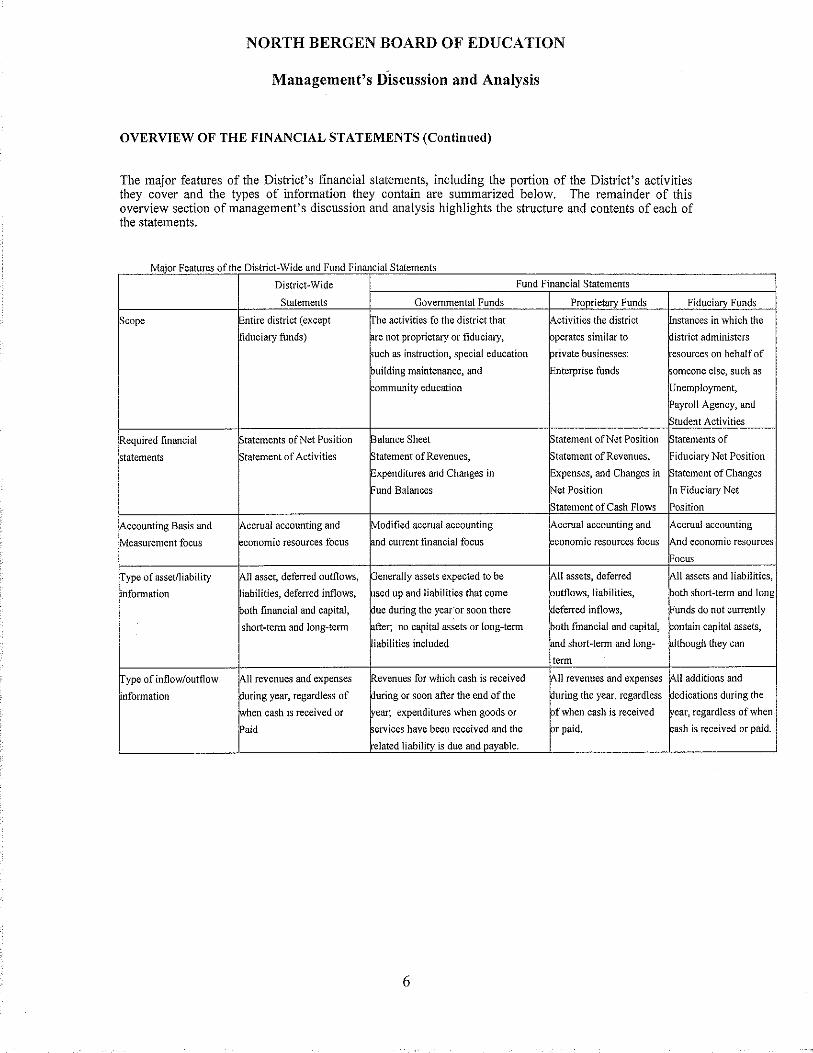
The major features of the District's financial statements, including the portion of the District's activities they cover and the types of information they contain are summarized below. The remainder of this overview section of management's discussion and analysis highlights the structure and contents of each of the statements.
-Major Features of the District Wide and Fund Financial Statements
District~Wide Fund Financial Statements
Statements Governmental Funds Proprietary Funds Fiduciary Funds
cope Entire district (except he activities fo the district that ~ctivities the district nstances in which the
fiduciary funds) re not proprietary or fiduciary, pperates similar to istrict administers
uch as instruction, special education ~rivate businesses: esources on behalf of
uilding maintenance, and Enterprise funds omeone else, such as
ommunity education Unemployment,
ayroll Agency, and
tudent Activities
Required financial ~tatements ofNet Position Balance Sheet tatement of Net Position tatements of
statements ~tatement of Activities tatement of Revenues, tatement of Revenues, Fiduciary Net Position
Expenditures and Changes in Expenses, and Changes in tatement of Changes
·und Balances Net Position n Fiduciary Net
tatement of Cash Flows Position
Accounting Basis and Accrual accounting and Modified accrual accounting Accrual accounting and Accrual accounting
Measurement focus conomic resources focus nd current financial focus conomic resources focus And economic resources
ocus
Type of asset/liability ~1 asset, deferred outflows, Generally assets expected to be All assets, deferred All assets and liabilities,
infonnation iabilities, deferred inflows, sed up and liabilities that come utflows, liabilities, oth short-term and long
~oth financial and capital, ue during the year·or soon there eferred inflows, Funds do not currently
short-term and long-tenn after; no capital assets or long-term both financial and capital, ontain capital assets,
iabilities included and short-tenn and long- !though they can
term
Type of inflow/outflow !All revenues and expenses Revenues for which cash is received All revenues and expenses All additions and
infonnation ~uring year, regardless of uring or soon after the end of the uring the year, regardless edications during the
F'hen cash is received or ear; expenditures when goods or fwhen cash is received ear, regardless of when
Paid ervices have been received and the r paid. ash is received or paid.
elated liability is due and oayable.
6
NORTH BERGEN BOARD OF EDUCATION
Management's Discussion and Analysis
District-Wide Financial Statements
The district-wide statements report information about the North Bergen Board of Education as a whole using accounting methods similar to those used by private-sector companies. The statement of net position includes all of the District's assets, deferred outflows of resources, liabilities and deferred inflows of resources. All of the current year's revenues and expenses are accounted for in the statement of activities regardless of when cash is received or paid.
The two district-wide statements report the District's net position and how it has changed. Net positionthe difference between the District's assets/deferred outflows and liabilities/deferred inflows -is one way to measure the District's financial health or position
• Over time, increases or decreases in the District's net position are an indicator of whether its fmancial position is improving or deteriorating, respectively.
• To assess the overall health of the District you need to consider additional non-financial factors such as changes in the District's property tax base and the condition of school buildings and other facilities.
In the district-wide financial statements the District's activities are shown in two categories:
• Governmental Activities - Most of the District's basic services are included here, such as regular instruction and special education, transportation, administration, and plant operation and maintenance. State and Federal Aids and tuition charged to other school districts fmance most of these activities.
• Business Type Activities- These funds are used to account for operations that are financed and operated in a manner similar to private business enterprises.
Fund Financial Statements
The fund fmancial statements provide more detailed information about the District's funds- focusing on its most significant or "major" funds - not the District as a whole. Funds are accounting devices the District uses to keep track of specific sources of funding and spending on particular programs:
• Some funds are required by State law and bond covenants.
• The District establishes other funds to control and manage money for particular purposes or to show that it is properly using certain revenues (federal and state grants).
7
NORTH BERGEN BOARD OF EDUCATION
Management's Discussion and Analysis
Fund Financial Statements (Continued)
The District has three kinds of funds:
• Governmental funds -Most of the District's basic services are included in governmental funds, which generally focus on (I) how cash and other financial assets that can readily be converted to cash flow in and out and (2) the balances left at year-end that are available for spending. Consequently, the governmental funds statements provide a detailed short-term view that helps to determine whether there are more or fewer financial resources that can be spent in the near future to finance the District's programs. Because this information does not encompass the additional long-term focus of the district-wide statements, we provide additional information at the bottom of the governmental funds statements that explains the relationship (or differences) between them.
• Proprietary funds - Services for which the District charges a fee are generally reported in proprietary funds. Proprietary funds are reported in the same way as the district-wide statements.
Enterprise Funds - This fund is established to account for operations that are financed and operated in a manner similar to private business enterprises. The stated intent is that costs of providing goods or services to the students on a continuing basis are financed or recovered primarily through user charges. The District currently has an enterprise fund for the food service operations.
• Fiduciary funds- The District is the trustee, or fiduciary, for assets that belong to others. The District is responsible for ensuring that the assets reported in these funds are used only for their intended purposes and by those to whom the assets belong. All of the District's fiduciary activities are reported in a separate statement of fiduciary net position and a statement of changes in fiduciary net position. We exclude these activities from the district-wide fmancial statements because the District cannot use these assets to finance its operations.
Notes to the Financial Statements
The notes provide additional information that is essential to a full understanding of the data provided in the district-wide and fund financial statements. The notes to the financial statements can be found following the fund financial statements.
Other Information
In addition to the financial statements and accompanying notes, this report also presents certain required supplementary information concerning the District's budget process. The District adopts an annual expenditure budget for the general, special revenue and debt service funds. A budgetary comparison statement has been provided for these funds as required supplementary information. The required supplementary information can be found following the notes to the financial statements.
Combining statements and schedules are presented immediately following the major budgetary comparisons if required.
8

NORTH BERGEN BOARD OF EDUCATION
Management's Discussion and Analysis
DISTRICT-WIDE FINANCIAL ANALYSIS
Net position may serve over time as a useful indicator of a government's financial position. In the case of the District, assets and deferred outflows of resources exceeded liabilities and deferred inflows of resources by $47,355,999 and $45,498,772 as of June 30, 2014 and 2013, respectively, as shown below.
By far the largest portion of the District's net position reflects its investment in capital assets (e.g., land and improvements, buildings and improvements, vehicles, furniture and equipment); less any related debt used to acquire those assets that are still outstanding. The District uses these capital assets to provide services to its students; consequently, these assets are not available for future spending. Although the District's investment in its capital assets is reported net of related debt, it should be noted that the resources needed to repay this debt must be provided from other sources, since the capital assets themselves cannot be used to liquidate these liabilities.
Net Position
as of June 30, 2014 and 2013
Governmental Business-Type Activities Activities Total
2014 2013 2014 2013 2014 2013 Assets Current and Other Assets $ 30,139,731 $ 21,476,363 $ 827,194 $ 754,471 $ 30,966,925 $ 22,230,834 Capital Assets 53,003,066 55,795,815 34,275 21,462 53,037,341 55,817,277
Total Assets 83,142,797 77,272,178 861,469 775,933 84,004,266 78,048, Ill
Deferred Outflows of Resources
Deferred Charges on Refunding 517,966 565,312 517,966 565,312
Total Deferred Outflows 517,966 565,312 517,966 565,312
Total Assets and Deferred Outflows 83,660,763 77,837,490 861,469 775,933 84,522,232 78,613,423
Liabilities Long-Term Liabilities 25,369,491 25,337,295 25,369,491 25,337,295 Other Liabilities 11,660,938 7,572,676 127,592 198,951 11,788,530 7,771,627
Total Liabilities 37,030,429 32,909,971 127,592 198,951 37,158,021 33,108,922
Deferred Inflows of Resources Deferred Commodities Revenue 8,212 5,729 8,212 5,729
Total Deferred Inflows 8,212 5,729 8,212 5,729
Total Liabilities and Deferred Inflows 37,030,429 32,909,971 135,804 204,680 37,166,233 33,114,651
Net Position Net Investment in Capital Assets 40,601,409 42,221,991 34,275 21,462 40,635,684 42,243,453
Restricted 14,765,943 10,814,307 14,765,943 10,814,307
Unrestricted (8,737,018) (8, I 08, 779) 691,390 549,791 (8,045,628) (7,558,988)
Total Net Position $ 46,630,334 $ 44,927,519 $ 725,665 $ 571,253 $ 47,355,999 $ 45,498,772
9
NORTH BERGEN BOARD OF EDUCATION
Management's Discussion and Analysis
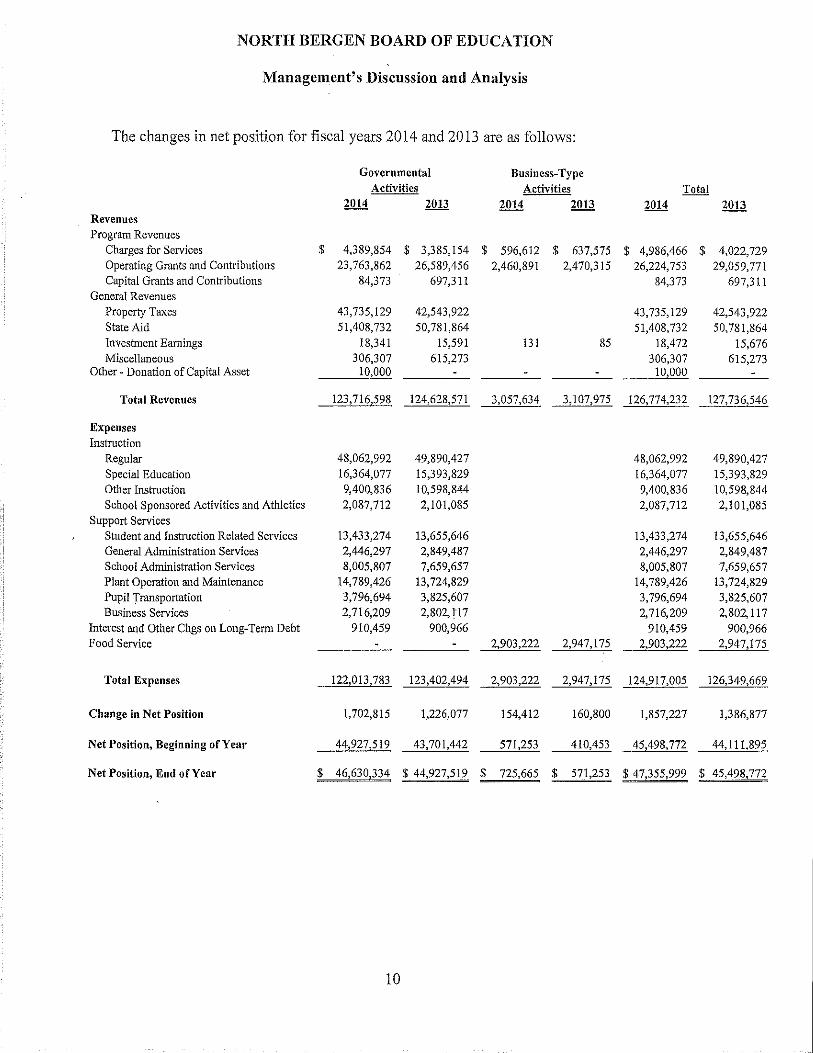
The changes in net position for fiscal years 2014 and 2013 are as follows:
Governmental Business-Type Activities Activities Total
2014 2013 2014 2013 2014 2013 Revenues Program Revenues
Charges for Services $ 4,389,854 $ 3,385,154 $ 596,612 $ 637,575 $ 4,986,466 $ 4,022,729 Operating Grants and Contributions 23,763,862 26,589,456 2,460,891 2,470,315 26,224,753 29,059,771 Capital Grants and Contributions 84,373 697,311 84,373 697,311
General Revenues Property Taxes 43,735,129 42,543,922 43,735,129 42,543,922 State Aid 51,408,732 50,781,864 51,408,732 50,781,864 Investment Earnings 18,341 15,591 131 85 18,472 15,676 Miscellaneous 306,307 615,273 306,307 615,273
Other w Donation of Capital Asset 10,000 10,000
Total Revenues 123,716,598 124,628,571 3,057,634 3,107,975 126,774,232 127,736,546
Expenses Instruction
Regular 48,062,992 49,890,427 48,062,992 49,890,427 Special Education 16,364,077 15,393,829 16,364,077 15,393,829 Other Instruction 9,400,836 10,598,844 9,400,836 10,598,844 School Sponsored Activities and Athletics 2,087,712 2,101,085 2,087,712 2,101,085
Support Services Student and Instruction Related Services 13,433,274 13,655,646 13,433,274 13,655,646 General Administration Services 2,446,297 2,849,487 2,446,297 2,849,487 School Administration Services 8,005,807 7,659,657 8,005,807 7,659,657 Plant Operation and Maintenance 14,789,426 13,724,829 14,789,426 13,724,829 Pupil Transportation 3,796,694 3,825,607 3,796,694 3,825,607 Business Services 2,716,209 2,802,117 2,716,209 2,802,117
Interest and Other Chgs on Long-Tenn Debt 910,459 900,966 910,459 900,966 Food Service 2,903,222 2,947,175 2,903,222 2,947 175
Total Expenses 122,013,783 123,402,494 2,903,222 2,947,175 124,917,005 126,349,669
Change in Net Position 1,702,815 1,226,077 154,412 160,800 1,857,227 1,386,877
Net Position, Beginning of Year 44,927 519 43,701,442 571,253 410,453 45,498,772 44,111,895
Net Position, End of Year $ 46,630 334 $ 44,927,519 $ 725,665 $ 571,253 $ 47,355,999 $ 45,498 772
10
NORTH BERGEN BOARD OF EDUCATION
Management's Discussion and Analysis
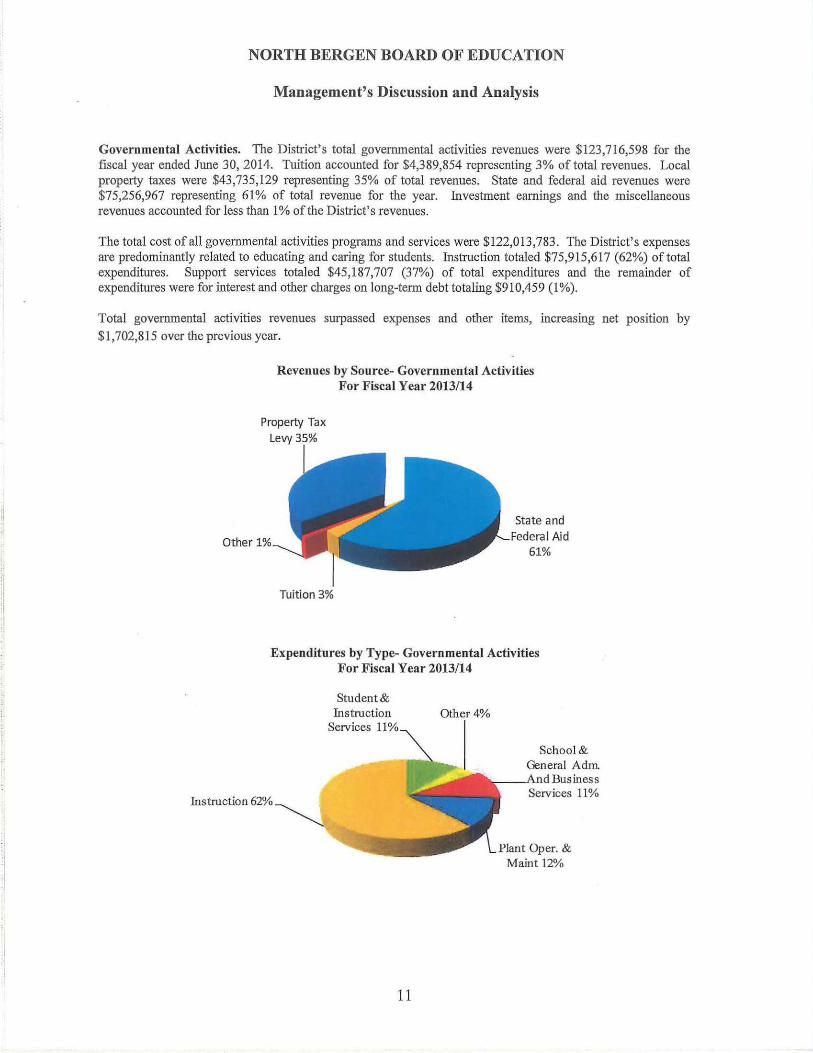
Governmental Activities. The District's total governmental activities revenues were $123,716,598 for the fiscal year ended June 30, 2014. Tuition accounted for $4,389,854 representing 3% of total revenues. Local property taxes were $43,735,129 representing 35% of total revenues. State and federal aid revenues were $75,256,967 representing 61% of total revenue for the year. Investment earnings and the miscellaneous revenues accounted for less than 1% of the District's revenues.
The total cost of all governmental activities programs and services were $122,013,783 . The District's expenses are predominantly related to educating and caring for students. Instruction totaled $75,915,617 (62%) oftotal expenditures. Support services totaled $45,187,707 (37%) of total expenditures and the remainder of expenditmes were for interest and other charges on long-term debt totaling $910,459 (1 %).
Total governmental activities revenues surpassed expenses and other items, increasing net position by $1,702,815 over the previous year.
Revenues by Source- Governmental Activities For Fiscal Year 2013/14
Property Tax
Levy 35%
Tuition 3%
State and Federal Aid
61%
Expenditures by Type- Governmental Activities For Fiscal Year 2013/14
Instruction 62% ~
Student& Instruction
Services 11%
11
Other4%
School&
Plant Oper. & Maint 12%
NORTH BERGEN BOARD OF EDUCATION
Management's Discussion and Analysis
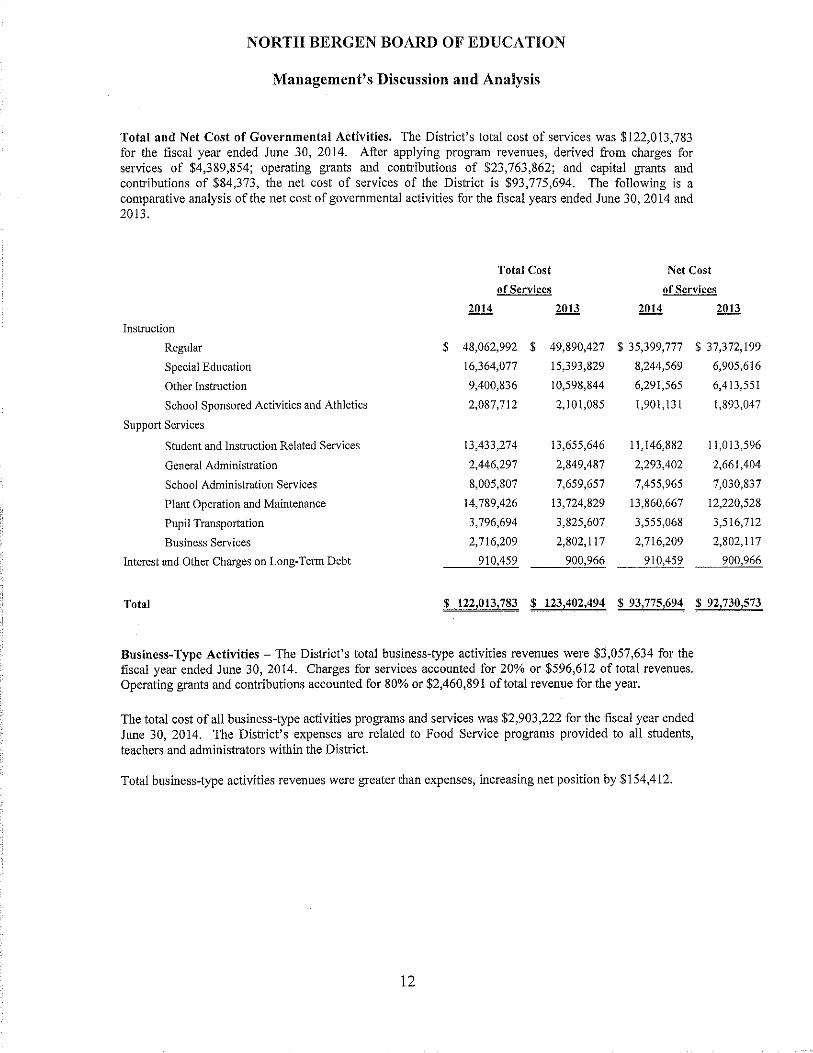
Total and Net Cost of Governmental Activities. The District's total cost of services was $122,013,783 for the fiscal year ended June 30, 2014. After applying program revenues, derived from charges for services of $4,389,854; operating grants and contributions of $23,763,862; and capital grants and contributions of $84,373, the net cost of services of the District is $93,775,694. The following is a comparative analysis of the net cost of governmental activities for the fiscal years ended June 30, 2014 and 2013.
Total Cost Net Cost
of Services of Services
2014 2013 2014
Instruction
Regular $ 48,062,992 $ 49,890,427 $ 35,399,777
Special Education 16,364,077 15,393,829 8,244,569
Other Instruction 9,400,836 10,598,844 6,291,565
School Sponsored Activities and Athletics 2,087,712 2,101,085 1,901,131
Support Services
Student and Instruction Related Services 13,433,274 13,655,646 11,146,882
General Administration 2,446,297 2,849,487 2,293,402
School Administration Services 8,005,807 7,659,657 7,455,965
Plant Operation and Maintenance 14,789,426 13,724,829 13,860,667
Pupil Transportation 3,796,694 3,825,607 3,555,068
Business Services 2,716,209 2,802,117 2,716,209
Interest and Other Charges on Long-Term Debt 910,459 900,966 910,459
Total $ 122,013,783 $ 123,402,494 $ 93,775,694
Business-Type Activities -The District's total business-type activities revenues were $3,057,634 for the fiscal year ended June 30, 2014. Charges for services accounted for 20% or $596,612 of total revenues. Operating grants and contributions accounted for 80% or $2,460,891 of total revenue for the year.
The total cost of all business-type activities programs and services was $2,903,222 for the fiscal year ended June 30, 2014. The District's expenses are related to Food Service programs provided to all students, teachers and administrators within the District.
Total business-type activities revenues were greater than expenses, increasing net position by $154,412.
12
2013
$ 37,372,199
6,905,616
6,413,551
1,893,047
11,013,596
2,661,404
7,030,837
12,220,528
3,516,712
2,802,117
900,966
$ 92,730,573

NORTH BERGEN BOARD OF EDUCATION
Management's Discussion and Analysis
FINANCIAL ANALYSIS OF THE DISTRICT'S FUNDS
As noted earlier, the District uses fund accounting to ensure and demonstrate compliance with financerelated legal requirements.
Governmental Funds
The focus of the District's governmental funds is to provide information on near-term inflows, outflows, and balances of spendable resources. Such information is useful in assessing the District's financing requirements. In particular, unreserved fund balance may serve as a useful measure of the District's net resources available for spending at the end of the fiscal year.
The financial performance of the District as a whole is reflected in its governmental funds as well. As the District completed the year, its governmental funds reported a combined fund balance of $18,544,126, an increase of$4,556,842 from last year's fund balance of$13,987,284.
Revenues for the District's governmental funds were $123,706,598, total expenditures were $121,759,883.
General Fund - The General Fund is the chief operating fund of the District and includes the primary operations in providing educational services to students.
The following schedule presents a comparison of General Fund Revenues.
Fiscal Fiscal Amount of
Year Ended Year Ended Increase
June 30, 2014 June 30, 2013 (Decrease) Percent
Local Sources:
Property Tax Levy $ 42,141,260 $ 41,061,340 $ 1,079,920 2.63%
Tuition 4,389,854 3,385,154 1,004,700 29.68%
Miscellaneous 324,648 630,864 (306,216) -48.54%
State/Federal
Sources 67,074,676 67,687,316 (612,640) -0.91%
Total General Fund Revenues $ 113,930,438 $ 112,764,674 $ 1,165,764 ~
Total General Fund Revenues increased by $1,165,764 or 1% over the previous year.
Local property taxes increased $1,079,920 over the previous year. State and federal aid decreased 1%, primarily due to the State of New Jersey decreasing their On-BehalfTPAF Funding to the District. Tuition charges increased $1,004,700.
13
NORTH BERGEN BOARD OF EDUCATION
Management's Discussion and Analysis
FINANCIAL ANALYSIS OF THE DISTRICT'S FUNDS (Continued)
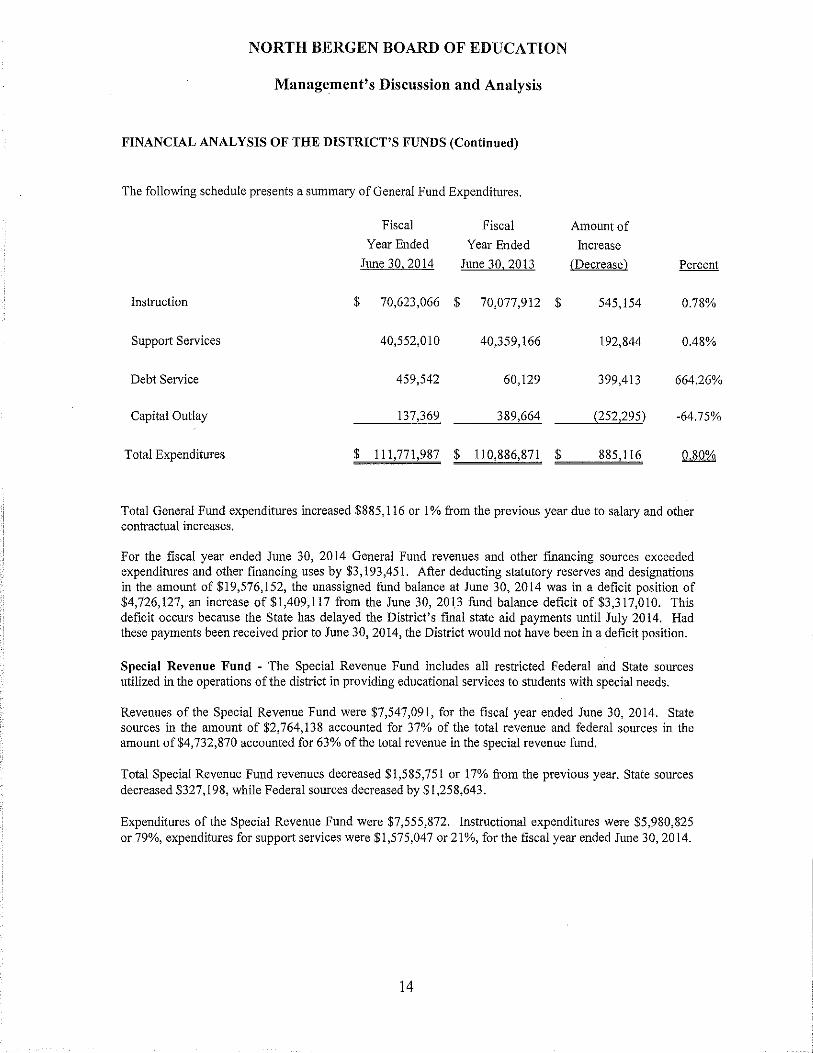
The following schedule presents a summary of General Fund Expenditures.
Fiscal Fiscal Amount of
Year Ended Year Ended Increase June 30,2014 June 30, 2013 (Decrease) Percent
Instruction $ 70,623,066 $ 70,077,912 $ 545,154 0.78%
Support Services 40,552,010 40,359,166 192,844 0.48%
Debt Service 459,542 60,129 399,413 664.26%
Capital Outlay 137,369 389,664 (252,295) -64.75%
Total Expenditures $ 111,771,987 $ 110,886,871 $ 885 116 0 80%
Total General Fund expenditures increased $885,116 or I% from the previous year due to salary and other contractual increases.
For the fiscal year ended June 30, 2014 General Fund revenues and other fmancing sources exceeded expenditures and other financing uses by $3,193,451. After deducting statutory reserves and designations in the amount of $19,576,152, the unassigned fund balance at June 30, 2014 was in a deficit position of $4,726,127, an increase of$1,409,117 from the June 30,2013 fund balance deficit of$3,317,010. This deficit occurs because the State has delayed the District's fmal state aid payments until July 2014. Had these payments been received prior to June 30, 2014, the District would not have been in a deficit position.
Special Revenue Fund - The Special Revenue Fund includes all restricted Federal and State sources utilized in the operations of the district in providing educational services to students with special needs.
Revenues of the Special Revenue Fund were $7,547,091, for the fiscal year ended June 30, 2014. State sources in the amount of $2,764,138 accounted for 37% of the total revenue and federal sources in the amount of$4,732,870 accounted for 63% of the total revenue in the special revenue fund.
Total Special Revenue Fund revenues decreased $1,585,751 or 17% from the previous year. State sources decreased $327,198, while Federal sources decreased by $1,258,643.
Expenditures of the Special Revenue Fund were $7,555,872. Instructional expenditures were $5,980,825 or 79%, expenditures for support services were $1,575,047 or 21%, for the fiscal year ended June 30, 2014.
14
NORTH BERGEN BOARD OF EDUCATION
Management's Discussion and Analysis
FINANCIAL ANALYSIS OF THE DISTRICT'S FUNDS (Continued)
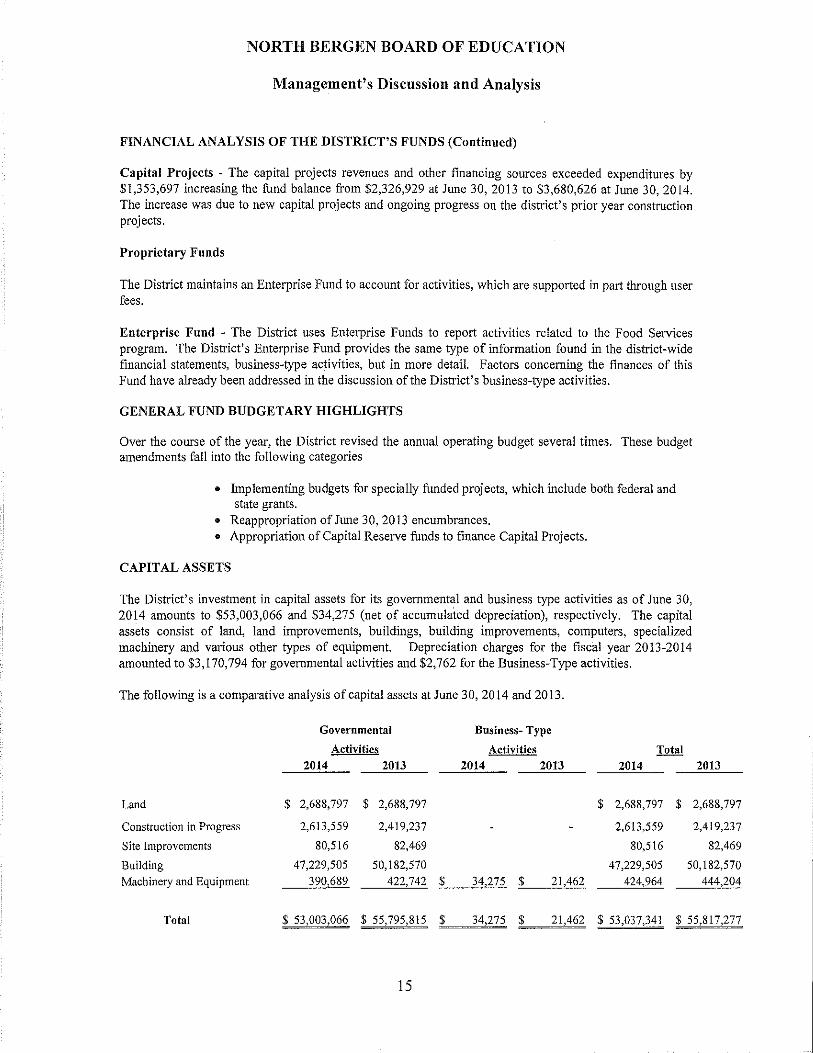
Capital Projects - The capital projects revenues and other financing sources exceeded expenditures by $1,353,697 increasing the fund balance from $2,326,929 at June 30, 2013 to $3,680,626 at June 30,2014. The increase was due to new capital projects and ongoing progress on the district's prior year construction projects.
Proprietary Funds
The District maintains an Enterprise Fund to account for activities, which are supported in part through user fees.
Enterprise Fund - The District uses Enterprise Funds to report activities related to the Food Services program. The District's Enterprise Fund provides the same type of information found in the district-wide financial statements, business-type activities, but in more detail. Factors concerning the fmances of this Fund have already been addressed in the discussion of the District's business-type activities.
GENERAL FUND BUDGETARY HIGHLIGHTS
Over the course of the year, the District revised the annual operating budget several times. These budget amendments fall into the following categories
• Implementing budgets for specially funded projects, which include both federal and state grants.
• Reappropriation of June 30, 2013 encumbrances. • Appropriation of Capital Reserve funds to finance Capital Projects.
CAPITAL ASSETS
The District's investment in capital assets for its governmental and business type activities as of June 30, 2014 amounts to $53,003,066 and $34,275 (net of accumulated depreciation), respectively. The capital assets consist of land, land improvements, buildings, building improvements, computers, specialized machinery and various other types of equipment. Depreciation charges for the fiscal year 2013-2014 amounted to $3,170,794 for governmental activities and $2,762 for the Business-Type activities.
The following is a comparative analysis of capital assets at June 30,2014 and 2013.
Governmental Business- Type
Activitie:! Activities Total
2014 2013 2014 2013 2014
Land $ 2,688,797 $ 2,688,797 $ 2,688,797 $
Construction in Progress 2,613,559 2,419,237 2,613,559
Site Improvements 80,516 82,469 80,516
2013
2,688,797
2,419,237
82,469
Building 47,229,505 50,182,570 47,229,505 50,182,570
Machinery and Equipment 390,689 422,742 $ 34,275 $ 21,462 424,964 444,204
Total $ 53,003,066 $ 55,795,815 $ 34,275 $ 21,462 $ 53,037,341 $ 55,817,277
15

NORTH BERGEN BOARD OF EDUCATION
Management's Discussion and Analysis
Additional information on the District's capital assets are presented in the Notes to the Financial Statements.
LONG TERM LIABILITIES
At June 30, 2014, the District's long-term liabilities consisted of compensated absences payable of $6,458,700, serial bonds of$4,439,109 (including unamortized premium), obligations under lease purchase agreements of $12,291,682 (net of unamortized discount) and Sales/Leaseback obligations of $2,180,000 totaling $25,369,491. This is in comparison to long-term liabilities at June 30, 2013 of $25,337,295, or an increase of$32, 196.
Additional information on the District's long-term liabilities are presented in the Notes to the Financial Statements.
ECONOMIC FACTORS AND NEXT YEAR'S BUDGET AND RATES
Many factors were considered by the District's administration during the process of developing the fiscal year 2013-2014 budget. The primary factors were the District's projected student population, anticipated state and federal aid as well as increasing salary and related benefit costs.
These indicators were also considered when adopting the budget for fiscal year 2014-2015. Budgeted expenditures in the General Fund increased in this year's school year to fund contractual salary increases and increases in the premiums for employee benefits.
CONTACTING THE DISTRICT'S FINANCIAL MANAGEMENT
This fmancial report is designed to provide our citizens, taxpayers, customers, and investors and creditors with a general overview of the District's fmances and to demonstrate the District's accountability for the money it receives. If you have questions about this report or need additional information contact the Business Office, North Bergen Board ofEdncation, 7317 Kennedy Boulevard, North Bergen, NJ 07047.
16

FINANCIAL STATEMENTS

NORTH BERGEN BOARD OF EDUCATION STATEMENT OF NET POSITION
AS OF JUNE 30, 2014
Governmental Business-Type Activities Activities
ASSETS
Cash and Cash Equivalents $ 13,562,960 $ 3,238 Receivables, Net 14,533,717 222,696 Internal Balances (557,639) 557,639 Other Receivables 24,782 3,295 Prepaid Items 10,000 Other Assets 20,000
Inventory 40,326
Restricted Assets Cash and Cash Equivalents 2,545,911
Capital Assets Not Being Depreciated 5,302,356 Being Depreciated, Net 47,700,710 34,275
Total Assets 83,142,797 861,469
DEFERRED OUTFLOWS OF RESOURCES
Deferred Charges on Refundings 517,966
Total Deferred Outflows of Resources 517,966
Total Assets and Deferred Outflows of Resources 83,660,763 861,469
LIABILITIES
Accounts Payable and Other Current Liabilities 3,946,970 127,592
Accrued Interest Payable 65,333
Payable to Other Governments 341,498
Unearned Revenue 7,307,137
Noncurrent Liabilities Due Within One Year 2,685,000 Due Beyond One Year 22,684,491
Total Liabilities 37,030,429 127,592
The accompanying Notes to the Financial Statements are an integral part of this statement. 17
EXHIBIT A-1
Total
$ 13,566,198 14,756,413
28,077 10,000 20,000 40,326
2,545,911
5,302,356 47,734,985
84,004,266
517,966
517,966
84,522,232
4,074,562 65,333
341,498 7,307,137
2,685,000 22,684,491
37,158,021
NORTH BERGEN BOARD OF EDUCATION STATEMENT OF NET POSITION
AS OF JUNE 30, 2014
Governmental Business-Type Activities Activities
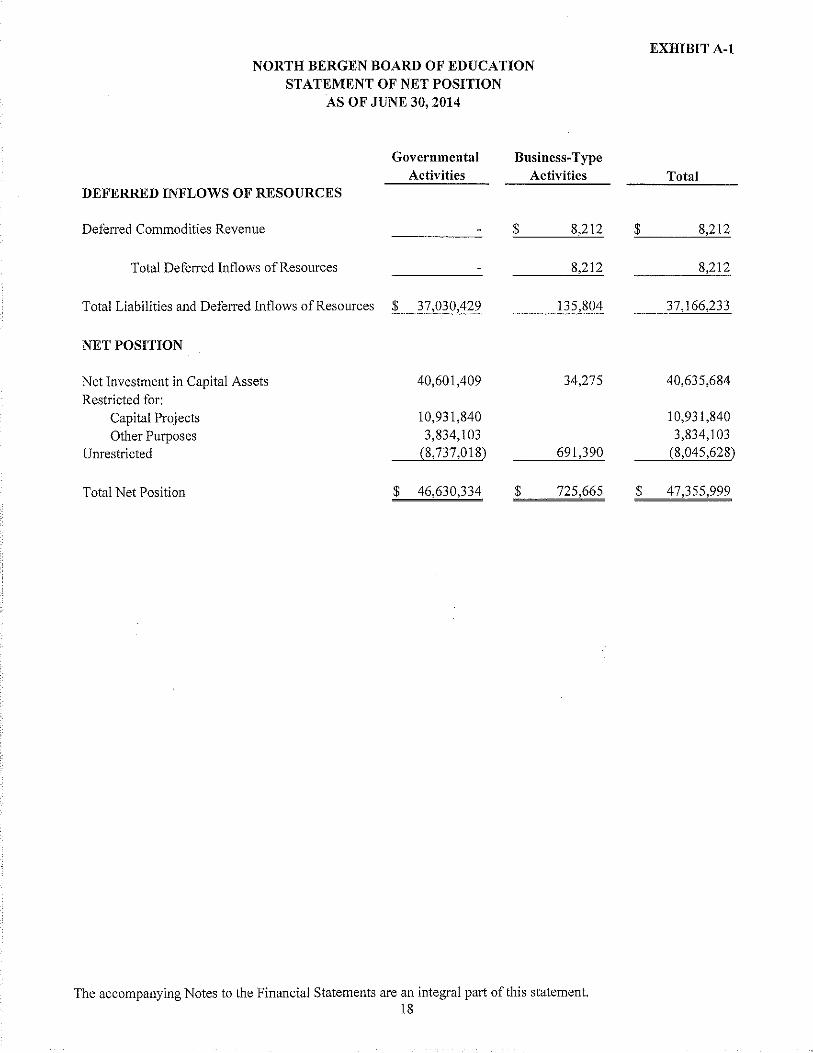
DEFERRED INFLOWS OF RESOURCES
Deferred Commodities Revenue $ 8,212
Total Deferred Inflows of Resources 8,212
Total Liabilities and Deferred Inflows of Resources $ 37,030,429 135,804
NET POSITION
Net Investment in Capital Assets 40,601,409 34,275
Restricted for: Capital Projects 10,931,840
Other Purposes 3,834,103
Unrestricted (8,737,018) 691,390
Total Net Position $ 46,630,334 $ 725,665
The accompanying Notes to the Financial Statements are an integral part of this statement. 18
EXHIBIT A-1
Total
$ 8,212
8,212
37,166,233
40,635,684
I 0,931,840 3,834,103
(8,045,628)
$ 47,355,999
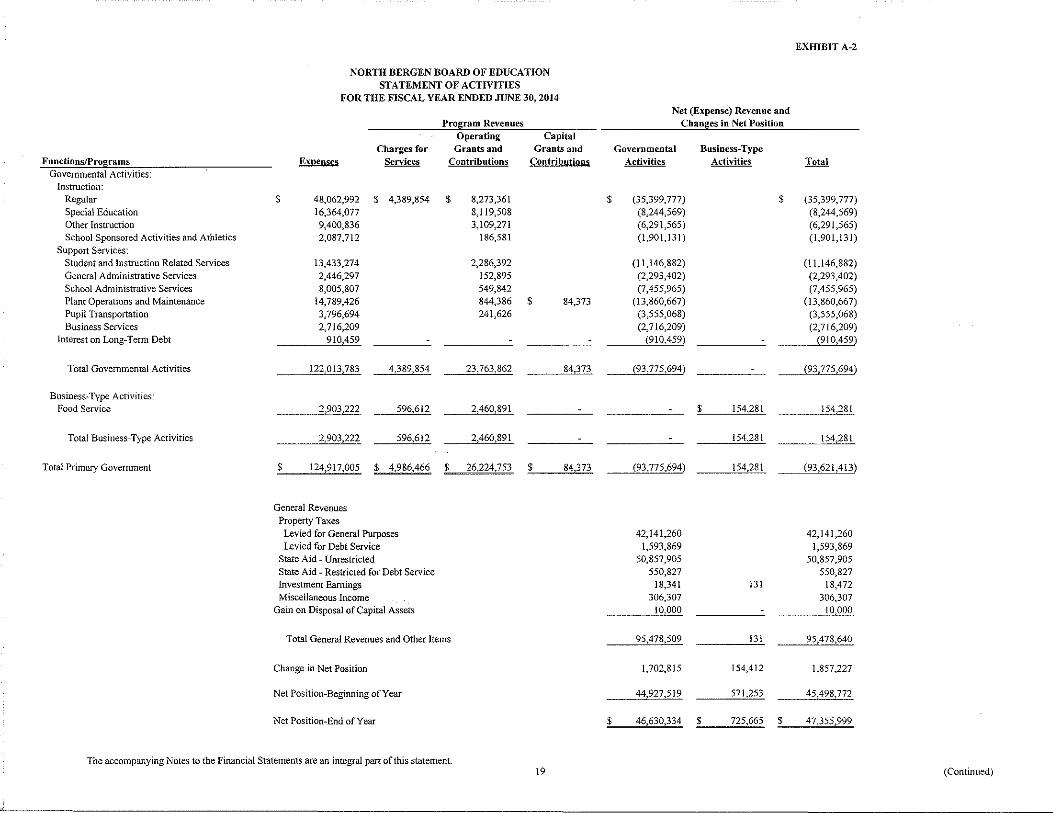
EXHIBIT A-2
NORTH BERGEN BOARD OF EDUCATION STATEMENT OF ACTIVITIES
FOR THE FISCAL YEAR ENDED JUNE 30, 2014 Net (Expense) Revenue and
Program Revenues Changes in Net Position Operating Capital
Charges for Grants and Grants and Governmental Business-Type Functions/Programs ~ Services Contributions ContribytiQn~ Activities Activities Total
Governmental Activities: Instruction:
Regular $ 48,062,992 $ 4,389,854 $ 8,273,361 $ (35,399,777) $ (35,399,777) Special Education 16,364,077 8,119,508 (8,244,569) (8,244,569) Other Instruction 9,400,836 3,109,271 (6,291,565) (6,291,565) School Sponsored Activities and Athletics 2,087,712 186,581 (1,901,131) (1,901,131)
Support Services: Student and Instruction Related Services 13,433,274 2,286,392 (11,146,882) (11,146,882) General Administrative Services 2,446,297 152,895 (2,293,402) (2,293,402) School Administrative Services 8,005,807 549,842 (7,455,965) (7,455,965) Plant Operations and Maintenance 14,789,426 844,386 $ 84,373 (13,860,667) (13,860,667) Pupil Transportation 3,796,694 241,626 (3,555,068) (3,555,068) Business Services 2,716,209 (2,716,209) (2, 716,209)
Interest on Long-Term Debt 910 459 (910,459) (910,459)
Total Governmental Activities 122,013,783 4,389,854 23,763,862 84,37;3 (93,775,694) (93,775,694)
Business-Type Activities: Food Service 2,903,222 596,612 2 460 891 $ 154,281 154,281
Total Business-Type Activities 2,903,222 596,612 2 460,891 154,281 154,281
Total Primary Government $ 124 917,005 $ 4,986,466 $ 26,224,753 $ 84 373 (93,775,694) 154,281 (93,621 413)
General Revenues Property Taxes Levied for General Purposes 42,141,260 42,141,260 Levied for Debt Service 1,593,869 1,593,869
State Aid - Unrestricted 50,857,905 50,857,905 State Aid - Restricted for Debt Service 550,827 550,827 Investment Earnings 18,341 131 18,472 Miscellaneous Income 306,307 306,307
Gain on Disposal of Capital Assets 10,000 10,000
Total General Revenues and Other Items 95,478,509 131 95,478,640
Change in Net Position 1,702,815 154,412 1,857,227
Net Position-Beginning of Year 44,927 519 571,253 45,498,772
Net Position-End of Year $ 46,630 334 $ 725,665 $ 47,355,999
The accompanying Notes to the Financial Statements are an integral part of this statement. 19 (Continued)
FUND FINANCIAL STATEMENTS

ASSETS Cash and Cash Equivalents
Receivables Prom Other Governments
Other Receivables
Prepaid Items
Other Assets
Due Prom Other Funds
Restricted Assets: Cash and Cash Equivalents with Fiscal Agent
Total Assets
LIABILITIES AND FUND BALANCES
Liabilities:
Accounts Payable
Unearned Revenue
PQyubles to Other Governments Other Payables
Due To Other Funds
Total Liabilities
Fund Balances:
Restricted
Capital Reserve
Capital Reserve-Designated tbr Subsequent Year's Budget
Maintenance Reserve
NORTH BERGEN BOARD OF EDUCATION
GOVERNMENTAL FUNDS
BALANCE SH E;;ET
AS m' JUNE 30, 2014
Special
General Revenue
Fund Fund
$ 11,386,085 $ 866,254 $
3,420,053 1,845,607
12,993
10,000
20,000
1,899,660
2,534,103
$ 19,282,894 $ 2,711,861 '
$ 3,436,688 102,171 $ 75,059 2,268,192
341,498 18,500
902,622
4,432,869 2,711,861
6,431,840
4,500,000
1,000,000
Capital
Projects
Fund
1,308,954
9,268,057
10,577 Oil
39,628
4,963,886
5,000
1,887 871
6,896,385
Maintenance Reserve-Designated for Subsequent Year's Budget
Emergency Reserve
300,000
1,000,000
Excess Surplus Designated for Subsequent Year's Budget
Legally Restricted - Sale/Leaseback Reserve
Capital ProJects Fund
Debt Service
Committed
Encumbrnnces
Assigned
Designated for Subsequent Year's Budget
Encumbrances Unassigned
General Fund
Total Fund Balances
Total Liabilities and Fund Balances
280,118
2,534,103
3,680,626
26,686
3,178,869
324,536
(4,726,127)
14,850,025 3,680,626
$ 19,282,894 ' 2,71!,861 $ 10,577 011
Amounts reported for governmental activities in the statement of
net position (A-I} are different because:
Capital assets used in governmental activities are not financial
resources and therefore are not reported in the funds. The cost
of the assets is $79,436,926 and the accumulated depreciation
is $26,433,860
The District has financed capital assets through the issuance
of serial bonds and long-term lease obligations. The interest
accrual at year end is:
Long-term liabilities are not due and payable in the current
period and therefore are not reported as
liabilities in the funds
Bonds Payable
Less: Deferred Amount on Re!Undings
Add: Unamortized Premium
Sale/Leaseback Obligations Payable
Certificates ot" Participation
Less: Deferred Amount on Refunding
Less: Unamortized Discount Compensated Absences
Net Position of Governmental Activities
The accompanying Notes to the Financial Statements are an integral part of this statement. 20
$
$
$
'
Debt
Scrvke
Fund
1,667
11,808
13,475
13,475
13,475
13,475
4,435,000
(32,737)
4,109
2,180,000
12,375,000
(485,229)
(83,318) 6,458,700
$
EXHIBIT B-1
Total
Govcmmcntal
Funds
\3,562,960
14,533,717
12,993
10,000
20,000
1,899,660
2,545,911
32,585,241
3,578,487
7,307,137
341,498 23,500
2,790,493
14,041,115
6,431,840
4,500,000
1,000,000
300,000
1,000,000
280,118
2,534,103
3,680,626
13,475
26,686
3,178,869
324,536
(4, 726, 127}
18,544,126
53,003,066
(65,333}
(24,851 ,525}
46,630,334
NORTH BERGEN BOARD OF EDUCATION GOVERNMENTAL FUNDS
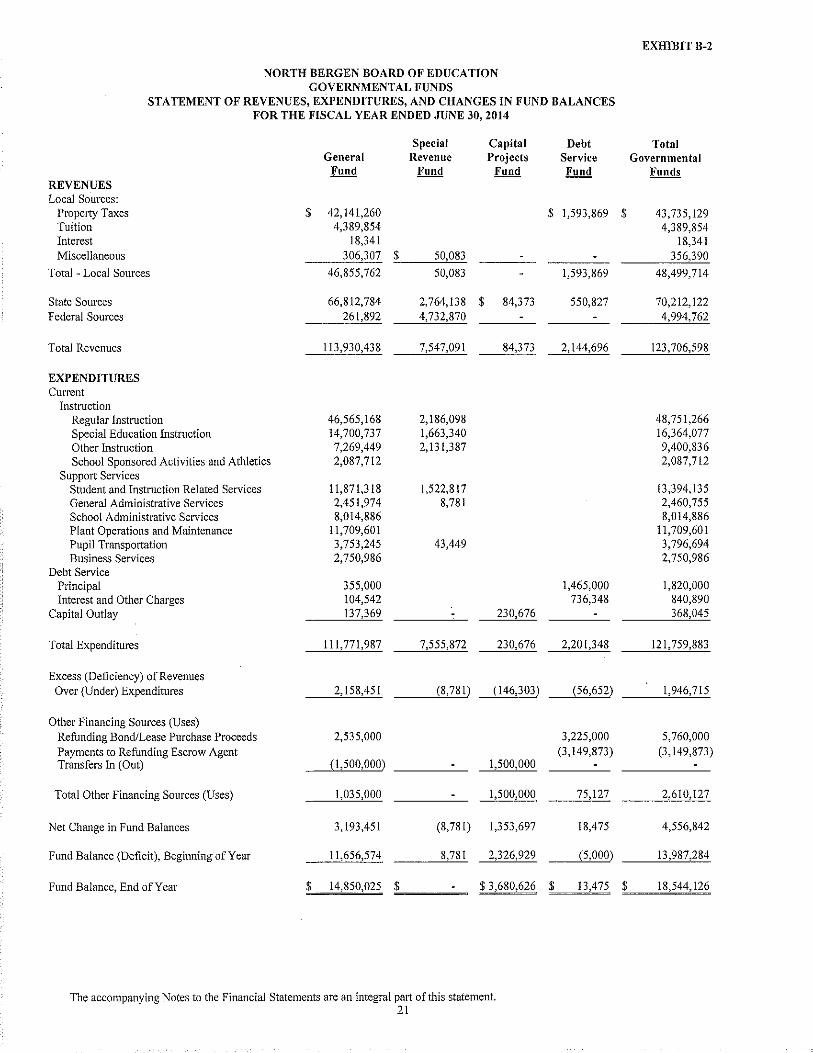
STATEMENT OF REVENUES, EXPENDITURES, AND CHANGES IN FUND BALANCES FOR THE FISCAL YEAR ENDED JUNE 30, 2014
Special Capital General Revenue Projects
Fund Fund Fund REVENUES Local Sources:
Property Taxes $ 42,141,260 Tuition 4,389,854 Interest 18,341 Miscellaneous 306,307 $ 50,083
Total - Local Sources 46,855,762 50,083
State Sources 66,812,784 2,764,138 $ 84,373 Federal Sources 261,892 4,732,870
Total Revenues 113,930,438 7,547,091 84,373
EXPENDITURES Current
Instruction Regular Instruction 46,565,168 2,186,098 Special Education Instruction 14,700,737 1,663,340 Other Instruction 7,269,449 2,131,387 School Sponsored Activities and Athletics 2,087,712
Support Services Student and Instruction Related Services 11,871,318 1,522,817 General Administrative Services 2,451,974 8,781 School Administrative Services 8,014,886 Plant Operations and Maintenance 11,709,601 Pupil Transportation 3,753,245 43,449 Business Services 2,750,986
Debt Service Principal 355,000 Interest and Other Charges 104,542
Capital Outlay 137,369 230,676
Total Expenditures 111,771,987 7,555,872 230,676
Excess (Deficiency) of Revenues Over (Under) Expenditures 2,158,451 (8, 781) (146,303)
Other Financing Sources (Uses) Refunding Bond/Lease Purchase Proceeds 2,535,000 Payments to Refunding Escrow Agent Transfers 1n (Out) (1,500,000) 1,500,000
Total Other Financing Sources (Uses) 1,035,000 1,500,000
Net Change in Fund Balances 3,193,451 (8,781) 1,353,697
Fund Balance (Deficit), Beginning of Year 11,656,574 8,781 2,326,929
Fund Balance, End of Year $ 14,850,025 $ $ 3,680,626
The accompanying Notes to the Financial Statements are an integral part of this statement. 21
Debt Service Fund
$ 1,593,869
1,593,869
550,827
2,144,696
1,465,000 736,348
2,201,348
(56,652)
3,225,000 (3,149,873)
75,127
18,475
(5,000)
$ 13,475
EXHIBITB-2
Total Governmental
Funds
$ 43,735,129 4,389,854
18,341 356,390
48,499,714
70,212,122 4,994,762
123,706,598
48,751,266 16,364,077 9,400,836 2,087,712
13,394,135 2,460,755 8,014,886
11,709,601 3,796,694 2,750,986
1,820,000 840,890 368,045
121,759,883
1,946,715
5,760,000 (3, 149,873)
2,610,127
4,556,842
13,987,284
$ 18,544,126
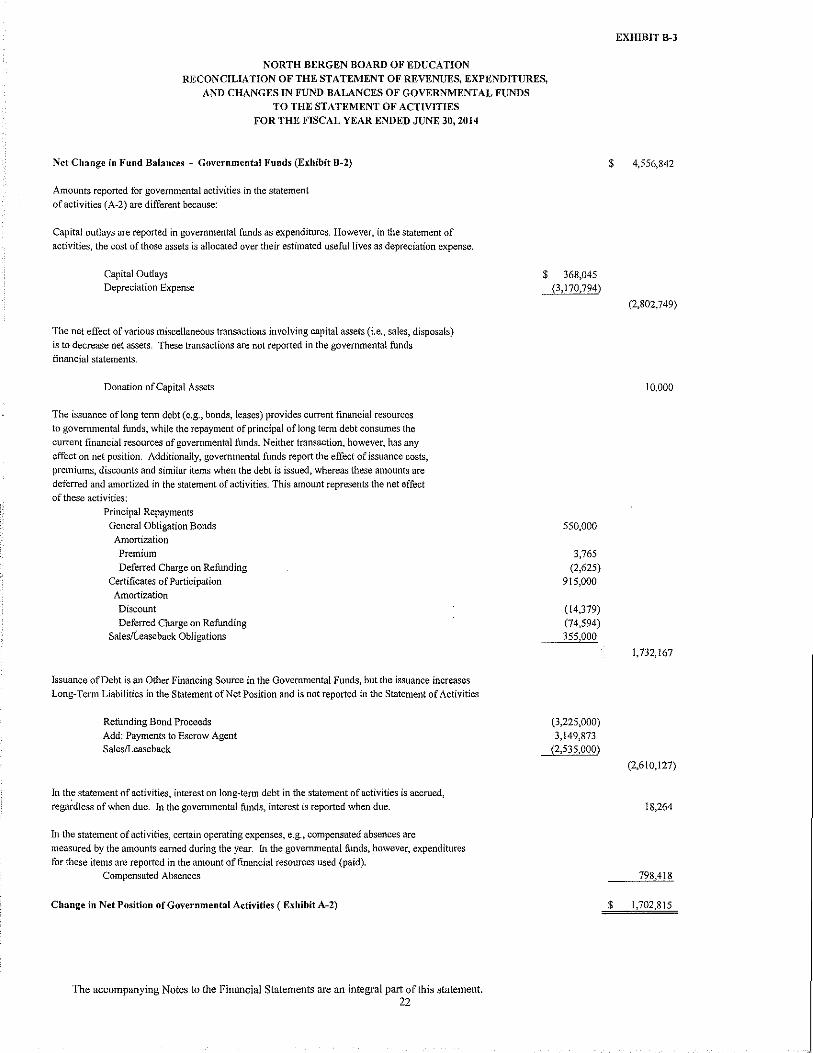
NORTH BERGEN BOARD OF EDUCATION
RECONCILIATION OF THE STATEMENT OF REVENUES, EXPENDITURES,
AND CHANGES IN FUND BALANCES OF GOVERNMENTAL FUNDS
TO THE STATEMENT OF ACTIVITIES
FOR THE FISCAL YEAR ENDED JUNE 30,2014
Net Change in Fund Balances - Governmental Funds (Exhibit B-2)
Amounts reported for governmental activities in the statement of activities (A-2) are different because:
Capital outlays are reported in governmental funds as expenditures. However, in the statement of activities, the cost of those assets is allocated over their estimated useful lives as depreciation expense.
Capital Outlays Depreciation Expense
$ 368,045
The net effect of various miscellaneous transactions involving capital assets (i.e., sales, disposals) is to decrease net assets. These transactions are not reported in the governmental funds financial statements.
Donation of Capital Assets
The issuance of long tenn debt (e.g., bonds, leases) provides current financial resources to governmental funds, while the repayment of principal of long term debt consumes the current financial resources of governmental funds. Neither transaction, however, has any effect on net position. Additionally, governmental funds report the effect of issuance costs, premiums, discounts and similar items when the debt is issued, whereas these amounts are deferred and amortized in the statement of activities. This amount represents the net effect of these activities:
Principal Repayments General Obligation Bonds Amortization Premium Deferred Charge on Refunding
Certificates of Participation Amortization Discount Deferred Charge on Refunding
Sales/Leaseback Obligations
Issuance of Debt is an Other Financing Source in the Governmental Funds, but the issuance increases Long~ Term Liabilities in the Statement of Net Position and is not reported in the Statement of Activities
Refunding Bond Proceeds Add: Payments to Escrow Agent Sales/Leaseback
In the statement of activities, interest on long·tenn debt in the statement of activities is accrued, regafdless of when due. In the governmental funds, interest is reported when due.
In the statement of activities, certain operating expenses, e.g., compensated absences are measured by the amounts earned during the year. In the governmental funds, however, expenditures for these items are reported in the amount of financial resources used (paid).
Compensated Absences
Change in Net Position of Governmental Activities (Exhibit A-2)
The accompanying Notes to the Financial Statements are an integral part of this statement. 22
(3,170,794)
550,000
3,765
(2,625) 915,000
(14,379)
(74,594) 355,000
(3,225,000)
3,149,873 (2,535,000)
EXHIBIT B-3
$ 4,556,842
(2,802,749)
10,000
1,732,167
(2,610,127)
18,264
798 418
$ 1,702,815

ASSETS
Cash and Cash Equivalents
Intergovernmental Receivable
State
Federal
Accounts Receivable
Inventories Due from Other Funds
Total Current Assets
Capital Assets
Equipment Accumulated Depreciation
Total Capital Assets
Total Assets
LIABILITIES
Current Liabilities Accounts Payable
Total Current Liabilities
NORTH BERGEN BOARD OF EDUCATION
PROPRIETARY FUND
FOOD SERVICE ENTERPRISE FUND
STATEMENT OF NET POSITION
AS OF JUNE 30,2014
DEFERRED INFLOWS OF RESOURCES Deferred Commodities Revenue
Total Deferred Inflows of Resources
Total Liabilities and Deferred Inflows of Resources
NET POSITION
Net Investment in Capital Assets Unrestricted
Total Net Position
The accompanying Notes to the Financial Statements are an integral part of this statement. 23
EXHIBITB-4
$ 3,238
5,074
217,622
3,295
40,326 557,639
827,194
132,236 (97,961)
34,275
861,469
127,592
127,592
8,212
8,212
135,804
34,275 691,390
$ 725,665
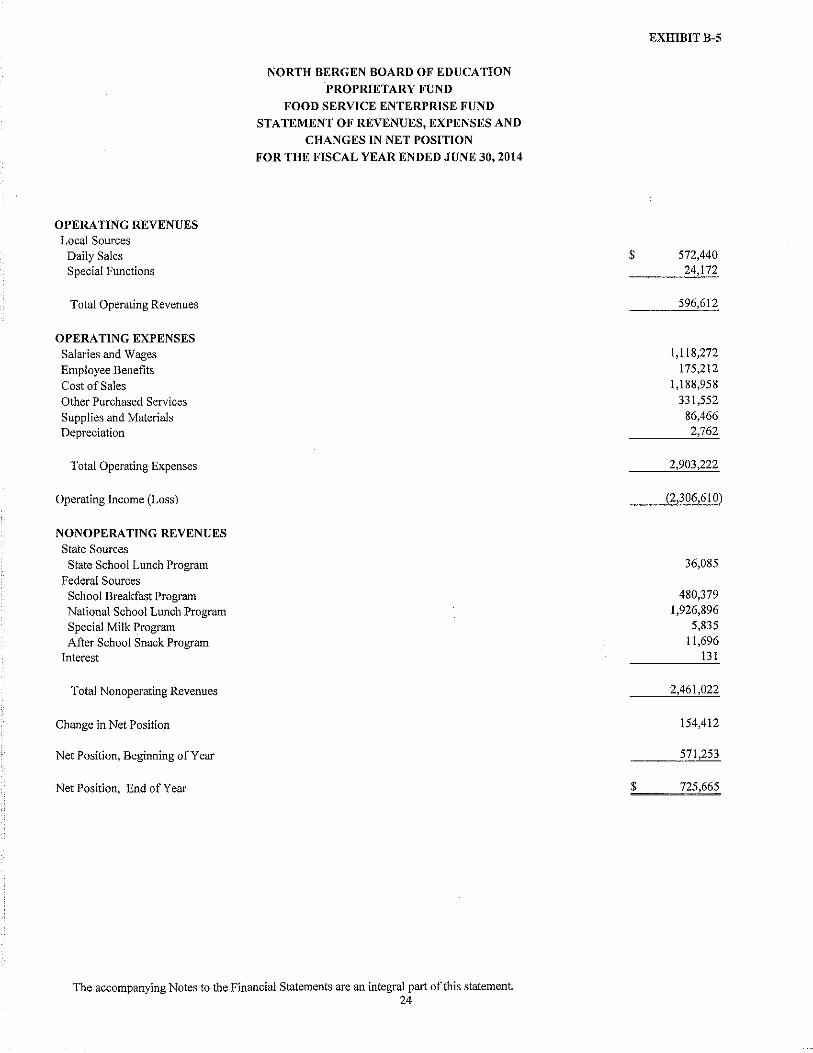
OPERATING REVENUES Local Sources
Daily Sales Special Functions
Total Operating Revenues
OPERATING EXPENSES Salaries and Wages Employee Benefits Cost of Sales Other Purchased Services Supplies and Materials Depreciation
Total Operating Expenses
Operating Income (Loss)
NONOPERATING REVENUES State Sources
State School Lunch Program Federal Sources
School Breakfast Program National School Lunch Program Special Milk Program After School Snack Program
Interest
Total Nonoperating Revenues
Change in Net Position
Net Position, Beginning of Year
Net Position, End of Year
NORTH BERGEN BOARD OF EDUCATION
PROPRIETARY FUND
FOOD SERVICE ENTERPRISE FUND
STATEMENT OF REVENUES, EXPENSES AND
CHANGES IN NET POSITION
FOR THE FISCAL YEAR ENDED JUNE 30,2014
The accompanying Notes to the Financial Statements are an integral part of this statement. 24
EXHIBIT B-5
$ 572,440 24,172
596,612
1,118,272 175,212
1,188,958 331,552
86,466 2,762
2,903,222
(2,306,610)
36,085
480,379 1,926,896
5,835 11,696
131
2,461,022
154,412
571,253
$ 725,665

NORTH BERGEN BOARD OF EDUCATION PROPRIETARY FUNDS
FOOD SERVICE ENTERPRISE FUND STATEMENT OF CASH FLOWS
FOR THE FISCAL YEAR ENDED JUNE 30, 2014
CASH FLOWS FROM OPERATING ACTIVITIES
Cash Received from Customers Cash Payments for Employees Salaries & Benefits Cash Payments to Suppliers for Goods and Services
Net Cash (Used) by Operating Activities
CASH FLOWS FROM NON CAPITAL FINANCING ACTIVITIES Cash Payments for Interfund Transactions Cash Received from State and Federal Subsidy Reimbursements
Net Cash Provided by Noncapital Financing Activities
CASH FLOWS FROM CAPITAL FINANCING ACTIVITIES Cash Payment for Acquisition of Capital Assets
Net Cash (Used) for Capital Financing Activities
CASH FLOWS FROM INVESTING ACTIVITIES
Interest Received on Deposits
Net Cash Provided by Investing Activities
Net Change in Cash and Cash Equivalents
Cash and Cash Equivalents, Beginning of Year
Cash and Cash Equivalents, End of Year
Reconciliation of Operating (Loss) to Net Cash (Used) by Operating Activities
Operating Income (Loss)
Adjustments to Reconcile Operating (Loss) to Net Cash (Used) by Operating Activities Depreciation Non-Cash Federal Assistance-Food Distribution Program Change in Assets and Liabilities (Increase)/Decrease in Accounts Receivable Increase/(Decrease) in Accounts Payable (Increase )/Decrease in Inventory Increase/(Decrease) in Deferred Commodities Revenue
Total Adjustments
Net Cash (Used) by Operating Activities
Non-Cash Investing, Capital and Financing Activities Value Received- Food Distribution Program
The accompanying Notes to the Financial Statements are an integral part of this statement. 25
EXHIBIT B-6
$ 600,001
(1 ,293,484)
(1,553,306)
(2,246,789)
(45,567)
2,310,997
2,265,430
(15,575)
(15,575)
131
131
3,197
41
$ 3,238
$ (2,306,61 0)
2,762 127,085
3,389 (71,359)
(4,539) 2,483
59,821
$ (2,246,789)
$ 129,568
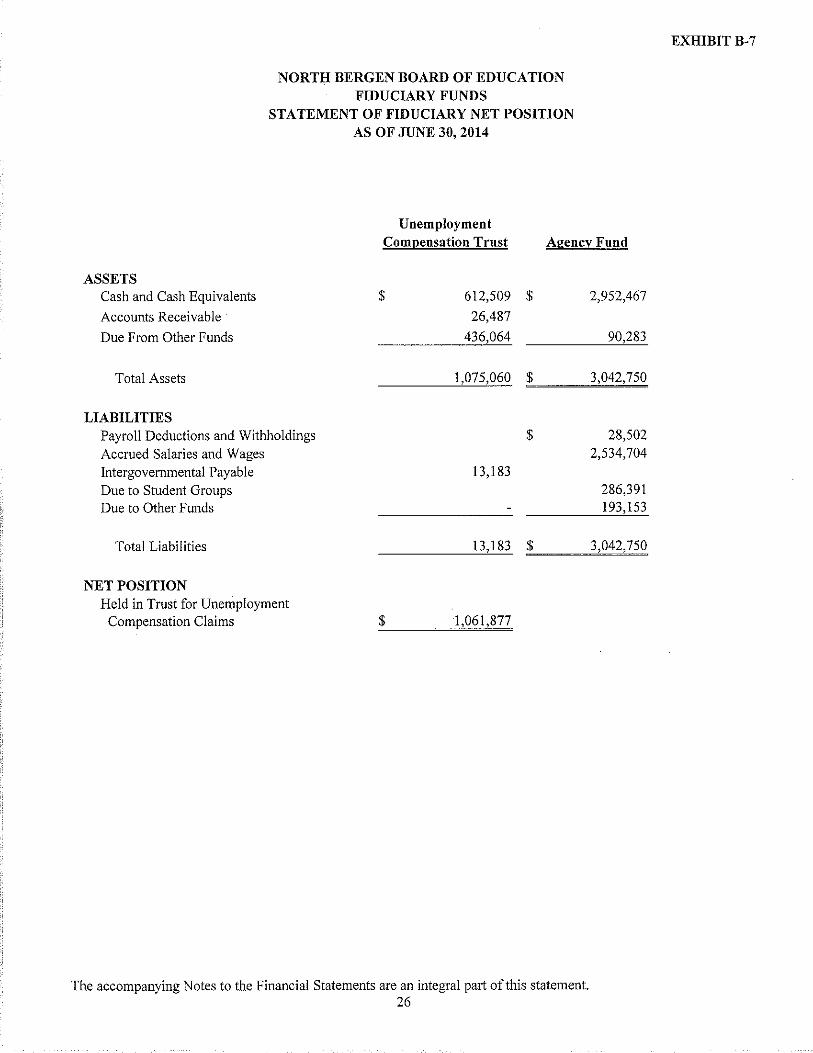
NORTH BERGEN BOARD OF EDUCATION FIDUCIARY FUNDS
STATEMENT OF FIDUCIARY NET POSITION AS OF JUNE 30, 2014
Unemployment Compensation Trust Agency Fund
ASSETS Cash and Cash Equivalents $ 612,509 $
Accounts Receivable · 26,487
Due From Other Funds 436,064
Total Assets 1,075,060 $
LIABILITIES Payroll Deductions and Withholdings $ Accrued Salaries and Wages Intergovernmental Payable 13,183 Due to Student Groups Due to Other Funds
Total Liabilities 13,183 $
NET POSITION Held in Trust for Unemployment
Compensation Claims $ 1,061,877
The accompanying Notes to the Financial Statements are an integral part of this statement. 26
2,952,467
90,283
3,042,750
28,502 2,534,704
286,391 193,153
3,042,750
EXHIBITB-7
NORTH BERGEN BOARD OF EDUCATION FIDUCIARY FUNDS
STATEMENT OF CHANGES IN FIDUCIARY NET POSITION FOR THE FISCAL YEAR ENDED JUNE 30,2014
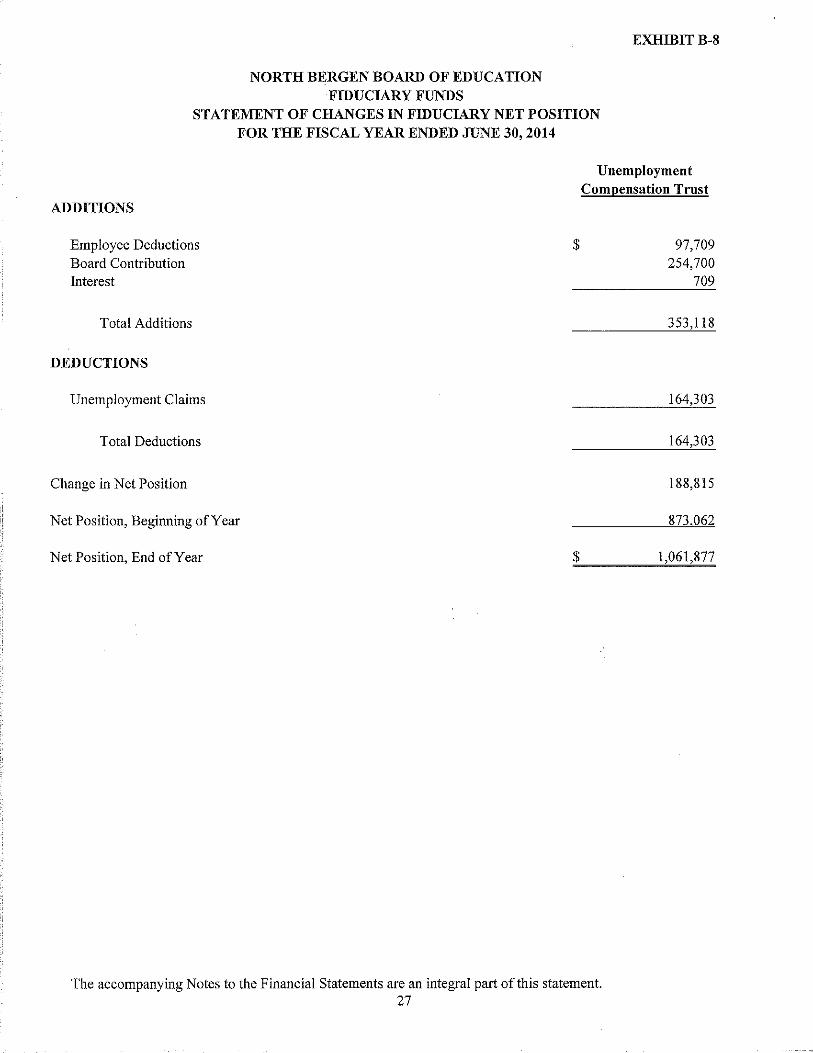
EXHIBITB-8
Unemployment Compensation Trnst
ADDITIONS
Employee Deductions Board Contribution Interest
Total Additions
DEDUCTIONS
Unemployment Claims
Total Deductions
Change in Net Position
Net Position, Beginning of Year
Net Position, End of Year
$
$
The accompanying Notes to the Financial Statements are an integral part of this statement. 27
97,709 254,700
709
353,118
164,303
164,303
188,815
873 062
1,061,877

NOTES TO THE FINANCIAL STATEMENTS

NORTH BERGEN BOARD OF EDUCATION NOTES TO THE FINANCIAL STATEMENTS FOR THE FISCAL YEAR ENDED JUNE 30, 2014
NOTE 1 SUMMARY OF SIGNIFICANT ACCOUNTING POLICIES
A. Reporting Entity
The North Bergen Board of Education (the "Board" or the "District") is an instrumentality of the State of New Jersey, established to function as an education institution. The Board consists of nine elected officials and one representative from the Guttenberg Board of Education. The Board is responsible for the fiscal control of the District. A superintendent is appointed by the Board and is responsible for the administrative control of the District. Under existing statutes, the Board's duties and powers include, but are not limited to, the development and adoption of a school program; the establishment, organization and operation of schools; and the acquisition, maintenance and disposition of school property.
The Board also has broad financial responsibilities, including the approval of the annual budget and the establishment of a system of accounting and budgetary controls.
The reporting entity is composed of the primary government, component units, and other organizations that are included to ensure that the financial statements of the District are not misleading. The primary government consists of all funds, departments, boards and agencies that are not legally separate from the District. For the North Bergen Board of Education this includes general operations, food service and student related activities of the District.
Component units are legally separate organizations for which the District is financially accountable. The District is financially accountable for an organization if the District appoints a voting majority of the organization's governing board and (I) the District is able to significantly influence the programs or services performed or provided by the organization; or (2) the District is legally entitled to or can otherwise access the organization's resources; the District is legally obligated or has otherwise assumed the responsibility to finance the deficits of, or provide financial support to, the organization; or the District is obligated for the debt of the organization. Component units may also include organizations that are fiscally dependent on the District in that the District approves the budget, the issuance of debt or the levying of taxes. Based on the foregoing criteria, the District has no component units. Furthermore, the District is not includable in any other reporting entity as a component unit.
B. New Accounting Standards
During fiscal year 2014, the District adopted the following GASB statement:
• GASB 66, Technical Corrections - 2012, an Amendment of GASB Statements 10 and 62. The objective of this Statement is to improve accounting and financial reporting for a governmental financial reporting entity by resolving conflicting guidance that resulted from the issuance of two pronouncements, Statements No. 54, Fund Balance Reporting and Governmental Fund Type Definitions and No. 62, Codification of Accounting and Financial Reporting Guidance Contained in Pre-November 30, 1989 FASB and AICP A Pronouncements.
Other accounting standards that the District is currently reviewing for applicability and potential impact on the financial statements include:
• GASB 68, Accounting and Financial Reporting for Pensions, will be effective beginning with the fiscal year ending June 30, 2015. The objective ofthis Statement is to improve accounting and financial reporting by state and local governments for pensions. It also improves information provided by state and local governmental employers about financial support for pensions that is provided by other entities. This Statement replaces the requirements of Statement No. 27, Accounting for Pensions by State and Local Governmental Employers, as well as the requirements of Statement No. 50, Pension Disclosures, as they relate to pensions that are provided through pension plans administered as trusts or equivalent arrangements that meet certain criteria.
28
NORTH BERGEN BOARD OF EDUCATION NOTES TO THE FINANCIAL STATEMENTS FOR THE FISCAL YEAR ENDED JUNE 30, 2014
NOTE 1 SUMMARY OF SIGNIFICANT ACCOUNTING POLICIES (Continued)
B. New Accounting Standards (Continued)
• GASB 69, Government Combinations and Disposals of Government Operations will be effective beginning with the fiscal year ending June 30, 2015. The objective of this Statement is to establish accounting and financial reporting standards for mergers, acquisitions, and transfers of operations (i.e., government combinations). The Statement also provides guidance on how to determine the gain or loss on a disposal of government operations. This Statement applies to all state and local governmental entities. The District does not expect this statement to impact its financial statements.
C. Basis of Presentation - Financial Statements
The financial statements include both district-wide financial statements (based on the District as a whole) and fund financial statements (based on specific District activities or objectives). Both the district-wide and fund fmancial statements categorize activities as either governmental activities or business-type activities. While separate district-wide and fund fmancial statements are presented, they are interrelated. In the district-wide financial statements, the governmental activities column incorporates data from governmental funds while business-type activities incorporate data from the District's enterprise funds. Fiduciary funds are excluded from the district-wide financial statements.
District-Wide Financial Statements
The district-wide financial statements (i.e., the statement of net position and the statement of activities) report information on all of the nonfiduciary activities of the Board of Education. All fiduciary activities are reported only in the fund financial statements. For the most part, the effect of interfund activity has been removed from these statements. Governmental activities, which normally are supported by property taxes and intergovernmental revenues, are reported separately from business-type activities, which rely to a significant extent on fees and charges for support. In the statement of net position, both the governmental and business-type activities columns (a) are presented on a consolidated basis by column, and (b) reflect on a full accrual economic resource basis, which incorporates long-term assets and receivables as well as long-term debt and obligations.
The statement of activities demonstrates the degree to which the direct expenses of a given function or segment are offset by program revenues. Direct expenses are those that are clearly identifiable with a specific function or segment. Program revenues include 1) charges to customers or other governmental entities, including other school districts, who purchase, use, or directly benefit from goods or services provided by a given function or segment and 2) grants and contributions that are restricted to meeting the operational or capital requirements of a particular function or segment. Property taxes, unrestricted state aid and other items not properly included among program revenues are reported instead as general revenues.
As a general rule the effect of interfund activity has been eliminated from the district-wide financial statements. Exceptions to this general rule are charges between the Board's proprietary and fiduciary funds since elimination of these charges would distort the direct costs and program revenues reported for the various functions concerned.
Fund Financial Statements
Separate fund financial statements are provided for governmental, proprietary, and fiduciary activities, even though the latter are excluded from the district-wide financial statements. The emphasis of fund financial statements is on major individual governmental and enterprise funds, each reported as separate columns in the fund fmancial statements. All remaining governmental and enterprise funds are aggregated and reported as nonmajor funds. The District considers all of its governmental and enterprise funds to be major funds.
29
NORTH BERGEN BOARD OF EDUCATION NOTES TO THE FINANCIAL STATEMENTS FOR THE FISCAL YEAR ENDED JUNE 30; 2014
NOTE 1 SUMMARY OF SIGNIFICANT ACCOUNTING POLICIES (Continued)
C. Basis of Presentation- Financial Statements (Continued)
Fund Financial Statements (Continued)
The District reports the following major governmental funds:
The general fund is the School District's primary operating fund. It accounts for all financial resources of the District, except those to be accounted for in another fund.
The special revenue fund accounts for the proceeds of specific revenue sources legally restricted to expenditures for specified purposes. This fund accounts for federal, state and local financial programs, with the exception of grants for major capital projects and the child nutrition programs.
The capital projects fund accounts for the proceeds from the sale of bonds, lease purchases and other revenues used for the acquisition or construction of capital facilities and other capital assets, other than those financed by the proprietary funds.
The debt service fund accounts for the accumulation of resources that are restricted, committed or assigned for the payment of principal and interest on long-term general obligation debt of governmental funds.
The District reports the following major proprietary fund which is organized to be self-supporting through user charges:
The food service fund accounts for the activities of the school cafeteria, which provides food service to students as well as a Ia carte and catering services for teachers and special events.
Additionally, the government reports the following fund types:
The fiduciary trust fund is used to account for resources legally held in trust for the state unemployment insurance claims, payroll related activities and student related activities which are supported and controlled by student organizations and clubs. All resources of the fund, including any earnings on invested resources, may be used to support the intended purpose. There is no requirement that any portion of these resources be preserved as capital.
Activity between funds that are representative of lending/borrowing arrangements outstanding at the end of the fiscal year are referred to as either "due to/from other funds" (i.e., the current portion of interfund loans) or "advances to/from other funds" (i.e., the non-current portion of interfund loans). All other outstanding balances between funds are reported as "due to/from other funds". Any residual balances outstanding between the governmental activities and business-type activities are reported in the district-wide financial statements as "internal balances".
Reclassifications
Certain amounts presented in the prior year data have been reclassified in order to be consistent with the current year's presentation.
D. Measurement Focus and Basis of Accounting
The accounting and financial reporting treatment is determined by the applicable measurement focus and basis of accounting. Measurement focus indicates the type of resources being measured such as current financial resources or economic resources. The basis of accounting indicates the timing of transactions or events for recognition in the financial statements.
30

NORTH BERGEN BOARD OF EDUCATION NOTES TO THE FINANCIAL STATEMENTS FOR THE FISCAL YEAR ENDED JUNE 30, 2014
NOTE 1 SUMMARY OF SIGNIFICANT ACCOUNTING POLICIES (Continued)
D. Measurement Focus and Basis of Accounting (Continued)
The district-wide financial statements are reported using the economic resources measurement focus aud the accrual basis of accounting, as are the proprietary fund and fiduciary fund financial statements with the exception of the agency fund which does not have a measurement focus. All assets, all liabilities aud all deferred outflows/inflows of resources associated with these operations (with the exception of the fiduciary funds) are included on the Statement of Net Position. Revenues are recorded when earned and expenses are recorded at the time liabilities are incurred, regardless of the timing of related cash flows. Property taxes are recognized as revenues in the year for which they are levied. Grauts and similar items are recognized as revenue as soon as all eligibility requirements imposed by the provider have been met.
Governmental fund financial statements are reported using the current fmaucial resources measurement focus and the modified accrual basis of accounting. Revenues are recognized when susceptible to accrual (i.e. when they are both measurable aud available). Revenues are considered to be available when they are collectible within the current period or soon enough thereafter to pay liabilities of the current period. For this purpose, the Board considers revenues to be available if they are collected within 60 days after year-end. Expenditures are recorded when a liability is incurred, as under accrual basis of accounting, with the exception of debt service expenditures as well as expenditures related to compensated absences and claims and judgments which are recorded only when payment is due. General capital asset acquisitions are reported as expenditures in governmental funds. Issuauce of long-term debt and acquisitions under capital leases are reported as other finaucing sources.
Property taxes, tuition, unrestricted state aid, aud interest associated with the current fiscal period are all considered to be susceptible to accrual and so have been recognized as revenues of the current fiscal period. Entitlements (formula-type grants and aid) are recorded as revenues when all eligibility requirements are met, including any time requirements, and the amount is received during the period or within the availability period for this revenue source. Expenditure-driven grants and similar awards (reimbursement-type grauts aud awards) are recognized as revenue when the qualifYing expenditures have been incurred and all other eligibility requirements imposed by the grantor or provider have been met, aud the amount is received during the period or within the availability period for this revei:me source. All other revenue items are considered to be measurable and available only when cash is received by the District.
When both restricted aud unrestricted resources are available for use, it is the government's policy to use restricted resources first, then unrestricted resources as they are needed.
E. Assets, Liabilities, Deferred Outflows/Inflows of Resources, and Net Position/Fund Balance
1. Cash, Cash Equivalents and Investments
Cash aud cash equivalents are considered to be cash on haud, demaud deposits, aud short-term investments with original maturities of three months or less from the date of acquisition.
Investments are reported at fair value and are limited by N.J.S.A. 18A:20-37.
2. Receivables
All receivables are reported at their gross value, aud where appropriate, are reduced by the estimated portion that is expected to be uncollectible.
31

NORTH BERGEN BOARD OF EDUCATION NOTES TO THE FINANCIAL STATEMENTS FOR THE FISCAL YEAR ENDED JUNE 30, 2014
NOTE 1 SUMMARY OF SIGNIFICANT ACCOUNTING POLICIES (Continued)
E. Assets, Liabilities, Deferred Outflows/Inflows of Resources, and Net Position/Fund Balance (Continued)
3. Inventories
The cost of inventories of the governmental fund types are recorded as expenditures at the time individual inventory items are purchased.
Food Service Fund inventories, exclusive of the federal commodities, are valued at cost, using the first-in first-out (FIFO) method and consist of food and expendable supplies. The cost of such inventories is recorded as expenses when consumed rather than when purchased. The United States Department of Agriculture (USDA) commodity portion of the Food Service Fund inventory consists of food donated by the USDA. It is valued at estimated market prices by the USDA. The amount of unused commodities at year-end is reported as deferred inflows of resources.
4. Prepaid Items
Certain payments to vendors reflect costs applicable to future accounting periods and are recorded as prepaid items in both district-wide and fund financial statements. The cost of prepaid items is recorded as expenditures/expenses when consumed rather than when purchased.
5. Restricted Assets
Certain assets are classified as restricted on the balance sheet because they are maintained in separate bank accounts and/ or their use is limited by state or county regulations for capital projects and/or Lease-Purchase Agreements for capital projects and/or certificates of participation, principal and interest.
6. Capital Assets
Capital assets, which include property, plant and equipment, are reported in the applicable governmental or business-type activities columns in the district-wide financial statements. Capital assets are defined by the Board as assets with an initial, individual cost of$2,000 and an estimated useful life in excess of two years. The District was able to estimate the historical cost for the initial reporting of these capital assets through back trending. As the District constructs or acquires additional capital assets each period, they are capitalized and reported at historical cost. Donated capital assets are recorded at estimated fair market value at the date of donation. The costs of normal maintenance and repairs that do not add to the value of the asset or materially extend its useful life are not capitalized.
Major outlays for capital assets and improvements are capitalized as projects are constructed. Interest incurred during the construction phase of capital assets of business-type activities is included as part of the capitalized value of the assets constructed.
Land and construction in progress are not depreciated. The other property, plant, and equipment of the District, as well as the component units, is depreciated using the straight line method over the following estimated useful lives:
Site Improvements Buildings Building Improvements Equipment and Furniture Computer Equipment
32
20 40 20
5-15 5
NORTH BERGEN BOARD OF EDUCATION NOTES TO THE FINANCIAL STATEMENTS FOR THE FISCAL YEAR ENDED JUNE 30,2014
NOTE 1 SUMMARY OF SIGNIFICANT ACCOUNTING POLICIES (Continued)
E. Assets, Liabilities, Deferred Outflows/Inflows of Resources, and Net Position/Fund Balance (Continued)
7. Deferred Ouiflowsllnjlows of Resources
In addition to assets, the statement of financial position will sometimes report a separate section for deferred outflows of resources. This separate financial statement element, deferred outflows of resources, represents a consumption of net position that applies to a future period and so will not be recognized as an outflow of resources (expense/expenditure) until then. The Board only has one item that qualifies for reporting in this category. It is the deferred amounts on refunding of debt which results from the loss on a debt refunding reported in the district-wide statement of net position. A deferred charge on debt refunding results from the loss on the transaction when the debt's reacquisition price is greater than the carrying value of the refunded debt. This amount is deferred and amortized over the shorter of the life of the refunded or refunding debt.
In additions to liabilities, the statement of financial position will sometimes report a separate section for deferred inflows of resources. This separate financial statement element, deferred inflows of resources, represents an acquisition of net position that applies to future periods and so will not be recognized as an inflow of resources (revenue) until that time. The Board has only one type of item, which arises only under the accrual basis of accounting that qualifies for reporting in this category. It is the deferred commodities revenue, reported in both the district-wide and the proprietary funds statements of net position. The deferred commodities revenue represents the estimated market value of the donated and unused Federal commodities at year end. This amount is deferred and recognized as an inflow of resources in the period the commodities are consumed.
8. Compensated Absences
It is the District's policy to permit employees to accumulate (with certain restrictions) earned but unused vacation, personal, and sick leave benefits. A long-term liability of accumulated vacation, personal and sick leave and salary related payments has been recorded in the governmental activities in the district-wide financial statements, representing the Board's commitment to fund such costs from future operations. Proprietary Funds do not permit the accrual of unused vacation, personal and sick leave. A liability is reported in the governmental funds only to the amount actually due at year end as a result of employee resignations and retirements.
9. Long-Term Obligations
In the district-wide financial statements, and proprietary fund types in the fund financial statements, long-term debt and other long-term obligations are reported as liabilities in the applicable governmental activities, business-type activities, or proprietary fund type statement of net position. Gains resulting from debt refundings are classified as deferred inflows of resources and losses are reported as deferred outflows or resources. Bond premiums and discounts are deferred and amortized over the life of the bonds using the effective interest method. Gains and losses resulting from debt refundings are also deferred and amortized over the life of the refunded bonds or new bonds whichever is less using the effective interest method. Bonds payable are reported net of the applicable bond premium or discount. Bond issuance costs (other than for prepaid insurance) are treated as an expense.
33

NORTH BERGEN BOARD OF EDUCATION NOTES TO THE FINANCIAL STATEMENTS FOR THE FISCAL YEAR ENDED JUNE 30, 2014
NOTE 1 SUMMARY OF SIGNIFICANT ACCOUNTING POLICIES (Continued)
E. Assets, Liabilities, Deferred Outflows/Inflows of Resources, and Net Position/Fund Balance (Continued)
9. Long-Term Obligations (Continued)
In the fund financial statements, governmental fund types recognize bond premiums and discounts, as well as bond issuance costs, during the current period. The face amount of debt issued is reported as other financing sources. Premiums received on debt issuances are reported as other financing sources while discounts on debt issuances are reported as other financing uses. Issuance costs, whether or not withheld from the actual debt proceeds received, are reported as debt service expenditures.
10. Net Position/Fund Balance
District-Wide Statements
In the district-wide statements, there are three classes of net position:
• Net Investment in Capital Assets- consists of net capital assets (cost less accumulated depreciation) reduced by outstanding balances of related debt obligations from the acquisition, construction or improvement of those assets. Deferred outflows of resources and deferred inflows of resources attributable to the acquisition, construction or improvement of those assets or related debt also should be included.
• Restricted Net Position- reports net position when constraints placed on the residual amount of noncapital assets are either externally imposed by creditors (such as through debt covenants), grantors, contributors, or laws or regulations of other governments, or imposed by law through constitutional provisions or enabling legislation.
• Unrestricted Net Position - any portion of net position not already classified as either net investment in capital assets or net position- restricted is classified as net position- unrestricted.
Governmental Fund Statements
Fund balance categories are designed to make the nature and extent of the constraints placed oii the District's fund balance more transparent. These categories are comprised of a hierarchy based primarily on the extent to which the District is bound to observe constraints inaposed upon the use of the resources reported in governmental funds.
Restricted Fund Balance- Amounts constrained to specific purposes by their providers (such as grantors, bondholders, and higher levels of government), through constitutional provisions, or by enabling legislation.
Capital Reserve- This restriction was created by the District in accordance with NJAC 6A:23A-14.1 to fund future capital expenditures (See Note 2.)
Capital Reserve - Desimated for Subsequent Year's Budget - This designation was created to dedicate the portion of capital reserve fund balance appropriated in the adopted 2014/2015 District budget certified for taxes.
Maintenance Reserve- This restriction was created by the Board in accordance with NJAC 6A:23A-14.2 to accumulate funds for the required maintenance of school facilities in accordance with the EFCA (NJSA 18A:7G-9) for a thorough and efficient education.
Jvfaintenance Reserve - Designated for Subsequent Year's Budget- This designation was created to dedicate the portion of maintenance reserve fund balance appropriated in the adopted 2014/2015 District budget certified for taxes.
34

NORTH BERGEN BOARD OF EDUCATION NOTES TO THE FINANCIAL STATEMENTS FOR THE FISCAL YEAR ENDED JUNE 30,2014
NOTE 1 SUMMARY OF SIGNIFICANT ACCOUNTING POLICIES (Continued)
E. Assets, Liabilities, Deferred Outflows/Inflows of Resources, and Net Position/Fund Balance (Continued)
10. Net Position/Fund Balance (Continued)
Governmental Fund Statements (Continued)
Restricted Fund Balance (Continued)
Emergency Reserve- This restriction was created in accordance with NJAC 6A:23A-14.4(A)l to accumulate funds in accordance with State statute to finance unanticipated general fund expenditures required for a thorough and efficient education.
Excess Surplus - Designated for Subsequent Year's Budget - This restriction was created in accordance with NJSA 18A:7F-7 to represent the June 30, 2013 audited excess surplus that was appropriated in the 2014/2015 original budget certified for taxes.
Legally Restricted- Sale/Lease Back Reserve- This restriction was created in accordance with NSJA 18A:7F-7( e) to represent the unexpended proceeds of a sale/lease back transaction.
Capital Proiects - Represents fund balance restricted specifically for capital acquisitions and improvements in the Capital Projects Fund.
Debt Service -Represents fund balance restricted specifically for the repayment of long-term debt principal and interest in the Debt Service Fund.
Committed Fund Balance - Amounts constrained to specific purposes by a government itself, using its highest level of decision-making authority; to be reported as committed, amounts cannot be used for any other purpose unless the government takes the same highest level action to remove or change the constraint.
Year-End Encumbrances- Represents outstanding purchase orders at year end for contracts awarded by formal action of the Board of Trustee's for specific purposes from available resources of the current year for which the goods and materials have not yet been received or the services have not yet been rendered at June 30.
Assigned Fund Balance - Amounts a government intends to use for a specific purpose; intent can be expressed by the governing body or by an official or body to which the governing body delegates the authority.
Designated fOr Subsequent Year's Budget - This designation was created to dedicate the portion of fund balance appropriated in the adopted 20 14/2015 District budget certified for taxes.
Year-End Encumbrances - Represent outstanding purchase orders for goods or services approved by management for specific purposes from available resources of the current year for which the goods and materials have not yet been received or the services have not yet been rendered at June 30.
Unassigned Fund Balance - Represents fund balance that has not been restricted, committed or assigned to specific purposes within the governmental funds.
35

NORTH BERGEN BOARD OF EDUCATION NOTES TO THE FINANCIAL STATEMENTS FOR THE FISCAL YEAR ENDED JUNE 30, 2014
NOTE 1 SUMMARY OF SIGNIFICANT ACCOUNTING POLICIES (Continued)
F. Revenues and Expenditures/Expenses
1. Program Revenues
Amounts reported as program revenues in the district-wide statement of activities include 1) charges to customers or applicants for goods or services, provided, 2) operating grants and contributions, and 3) capital grants and contributions. Internally dedicated resources are reported as general revenues rather than as program revenues. Likewise, general revenues include all property taxes, unrestricted state aid, investment earnings and miscellaneous revenues.
2. Property Taxes
Property taxes are levied pursuant to law and are collected by the municipality and are transferred to the District as requested. Property tax revenue is recognized in the year they are levied and become available. Property taxes collected in advance of the year-end for which they are levied and transferred to the District are reported as deferred inflows of resources. The tax bills are mailed annually in June by the municipal tax collector and are levied and due in four quarterly installments on August I, November I, February I and May 1 of the fiscal year. When unpaid, taxes or any other municipal lien, or part thereof, on real property, remains in arrears on April I" in the year following the calendar year levy when the same became in arrears, the tax collector of the municipality shall, subject to the provisions of New Jersey Statute, enforce the lien by placing the property on a tax sale. The municipality may institute annual "in rem" tax foreclosure proceedings to enforce the tax collection or acquisition oftitle to the property.
3. Tuition Revenues and Expenditures
Tuition Revenues - Tuition charges were established by the Board of Education based on estimated costs. The charges are subject to adjustment when the final costs are determined and certified by the State Department of Education.
Tuition Expenditures- Tuition charges for the fiscal years 2012-2013 and 2013-2014 were based on rates established by the receiving district. These rates are subject to change when the actual costs have been certified by the State Department of Education.
4. Proprietary Funds, Operating and Non-Operating Revenues and Expenses
Proprietary funds distinguish operating revenues and expenses from nonoperating items. Operating revenues and expenses generally result from providing services and producing and delivering goods in connection with a proprietary fund's principal ongoing operations. The principal operating revenues of the food service enterprise fund are charges to customers for sales and services. Operating expenses for enterprise fund include the cost of sales and services, administrative expenses, and depreciation on capital assets. All revenues and expenses not meeting this definition are reported as nonoperating revenues and expenses. Federal and State subsidies for the food service operation are considered nonoperating revenues.
NOTE 2 STEWARDSHIP, COMPLIANCE AND ACCOUNTABILITY
A. Budgetarv Information
In accordance with the requirements of the New Jersey Department of Education ("the Department"), the District annually prepares its operating budget for the forthcoming year. The budget, except for the general fund and special revenue fund, which is more fully explained below and in the notes to the required supplementary information, is prepared in accordance with accounting principles generally accepted in the United States of America and serves as a formal plan for expenditures and the proposed means for financing them. Capital lease transactions are accounted for on the GAAP basis.
36
NORTH BERGEN BOARD OF EDUCATION NOTES TO THE FINANCIAL STATEMENTS FOR THE FISCAL YEAR ENDED JUNE 30,2014
NOTE 2 STEWARDSHIP, COMPLIANCE AND ACCOUNTABILITY (Continued)
A. Budgetary Information (Continued)
The annual budget is adopted in the spring of the preceding year for the general, special revenue and debt service funds. The District is not required to adopt an annual budget for the capital projects fund. The budget is submitted to the county superintendent for review and approval prior to adoption. The annual budget is voted upon at the annual school election on the third Tuesday in April.
Budget adoptions and amendments are recorded in the District's board minutes. The budget is amended by the Board of Trustees as needed throughout the year. The budget for revenues, other resources, other uses, and fund balances is prepared by fund source and amount. The budget for expenditures is prepared by fund, program, function, object and amount. The legal level of budgetary control is established at the line item account within each fund. Line item accounts are defined as the lowest (most specific) level of detail as established pursuant to the minimum chart of accounts referenced in N.J.A.C. 6:20-2A.2(m)l. The Board approved several budget transfers during 2013/2014. Also, during 2013/2014 the Board increased the original budget by $3,'385,405. The increase was funded by Capital Reserve funds appropriated, grant awards and the reappropriation of prior year general fund encumbrances. During the fiscal year the Board authorized and approved the appropriation of$1,500,000 from the General Fund Capital Reserve.
Formal budgetary integration into the accounting system is employed as a management control device during the year. For governmental funds there are no substantial differences between the budgetary basis of accounting and accounting principles generally accepted in the United States of America, with the exception of the legally mandated revenue recognition of certain state aid payments for budgetary purposes only and the treatment of encumbrances in the special revenue fund as described in the Notes to Required Supplementary Information (RSI). Encumbrance accounting is also employed as an extension of formal budgetary integration in the governmental fund types. Unencumbered appropriations lapse at fiscal year end.
Encumbrance accounting is employed in the governmental funds. Under encumbrance accounting, purchase orders, contracts and other commitments for the expenditure of resources are recorded to reserve a portion of the applicable appropriation. Open encumbrances in governmental funds other than the special revenue fund are reported as committed and/or assigned fund balances at fiscal year end as they do not constitute expenditures or liabilities but rather commitments related to unperformed contracts for goods and services which are reappropriated and honored during the subsequent fiscal year.
B. Deficit Fund Equity
The District has an unassigned fund deficit of $4,726,127 in the General Fund as of June 30, 2014 as reported in the fund financial statements (modified accrual basis). NJSA 18A:22-44.2 provides that in the event a state school aid payment is not made until the following school budget year, districts must record these delayed state aid payments as revenue, for budget purposes only, in the current school budget year. The statute provides legal authority for school districts to recognize this revenue in the current budget year. GASB Statement No. 33, "Accounting and Financial Reporting for Nonexchange Transactions", requires that intergovernmental transactions (revenue, expenditure, asset, liability) should be recognized in symmetry (i.e., if one government recognizes an asset, the other government recognizes a liability). Since the State of New Jersey is recording certain 2013/2014 budgeted state aid payments in the subsequent fiscal year, the school district cannot recognize such payments on the GAAP (fund) financial statements until the year the State records the payable. Due to the timing difference of recording these delayed state aid payments, the General Fund deficit does uot alone indicate that the District is facing financial difficulties; however, unless the State of New Jersey budgets the delayed payments in future years, the District may also report fund deficits in the future.
Pursuant to NJSA 18A:22-44.2, any negative unreserved, undesignated (i.e., unassigned) general fund balance that is reported as a direct result of a delay in the payment of state aid until the following fiscal year, is not considered as a violation of New Jersey Statute or regulation and is not considered an item in need of corrective action. The District deficit in the GAAP (fund) financial statements of $4,726,127 in the General Fund is less than the delayed state aid payments.
37

NORTH BERGEN BOARD OF EDUCATION NOTES TO THE FINANCIAL STATEMENTS FOR THE FISCAL YEAR ENDED JUNE 30, 2014
NOTE 2 STEWARDSHIP, COMPLIANCE AND ACCOUNTABILITY (Continued)
C. Capital Reserve
A capital reserve account was established by the District on September 20, 2000. The accumulation of funds will be used for capital outlay expenditures in subsequent fiscal years. The capital reserve is maintained in the general fund and its activity is included in the general fund annual budget.
Funds placed in the capital reserve are restricted to capital projects in the district's approved Long Range Facilities Plan (LRFP). Upon submission of the LRFP to the Department, a district may increase the balance in the capital reserve by appropriating funds in the annual general fund budget certified for taxes or by transfer by board resolution at year end of any unanticipated revenue or unexpended line-item appropriation amounts or both. A district may also appropriate additional amounts when the express approval of the voters has been obtained either by a separate proposal at budget time or by a special question at one of the four special elections authorized pursuant to N.J.S.A. 19:60-2. Pursuant to N.J.A.C. 6:23A-14.l(g), the balance in the reserve cannot at any time exceed the local support costs of uncompleted capital projects in its approved LRFP.
The activity of the capital reserve for the fiscal year ended June 30, 2014 is as follows:
Balance, July 1, 2013
Increased by Deposits Approved by Board Resolution Cancelled Balances Restored to Reserve
Capital Outlay
Decreased by Budgeted Withdrawal in 2013-2014 Budget Withdrawn by Board Resolution
Balance, June 30, 2014
$ 4,000,000
1,326,314
1,400,000 1,500,000
Analysis of Restricted for Capital Reserve, June 30,2014
Capital Reserve
Capital Reserve - Designated for Subsequent Year's Budget
$ 8,505,526
5,326,314
13,831,840
2,900,000
$ I 0,931,840
$ 6,431,840
4,500,000
$ 10,931,840
The withdrawals from the capital reserve were for use in a department approved facilities project, consistent with the district's Long Range Facilities Plan.
38

NORTH BERGEN BOARD OF EDUCATION NOTES TO THE FINANCIAL STATEMENTS FOR THE FISCAL YEAR ENDED JUNE 30,2014
NOTE 3 DETAILED NOTES ON ALL FUNDS
A. Cash Deposits and Investments
Cash Deposits
The Board's deposits are insured through either the Federal Deposit Insurance Corporation (FDIC), Securities Investor Protection Corporation (SIPC) or New Jersey's Governmental Unit Deposit Protection Act (GUDPA). The Board is required to deposit their funds in a depository which is protecting such funds pursuant to GUDP A. The New Jersey Governmental Unit Deposit Protection Act requires all banks doing business in the State of New Jersey to pledge collateral equal to at least 5% of the average amount of its public deposits and 100% of the average amount of its public funds in excess of the lesser of 75% of its capital funds or $200 million for all deposits not covered by the FDIC.
Bank balances are insured up to $250,000 in the aggregate by the FDIC for each bank. SIPC replaces cash claims up to a maximum of $250,000 for each failed brokerage firm. At June 30, 2014, the book value of the Board's deposits were $19,677,085 and bank and brokerage firm balances of the Board's deposits amounted to $22,053,096. The Board's deposits which are displayed on the various fund balance sheets as "cash and cash equivalents" are categorized as:
Depository Account
Insured
Bank Balance
$ 22,053,096
Custodial Credit Risk- Deposits- Custodial credit risk is the risk that in the event of a bank failure, the government's deposits may not be returned to it. The Board does not have a policy for custodial credit risk. As of June 30, 2014 the Board's bank balances were not exposed to custodial credit risk.
Investments
The Board is permitted to invest public funds in accordance with the types of securities authorized by N.J.S.A. 18A:20-37. Examples of the allowable investments are bonds or other obligations of the United States or obligations guaranteed by the United States of America, Government Money Market Mutual Funds, bonds or other obligations of the school district or bonds or other obligations of the local unit or units within which the school district is located, Local Government investment pools, and agreements or the repurchase of fully collateralized securities, if transacted in accordance with the above statute.
As of June 30, 2014, the Board had no outstanding investments.
Investment and interest earnings in the Capital Projects Fund are assigned to the General Fund in accordance with Board policy.
39
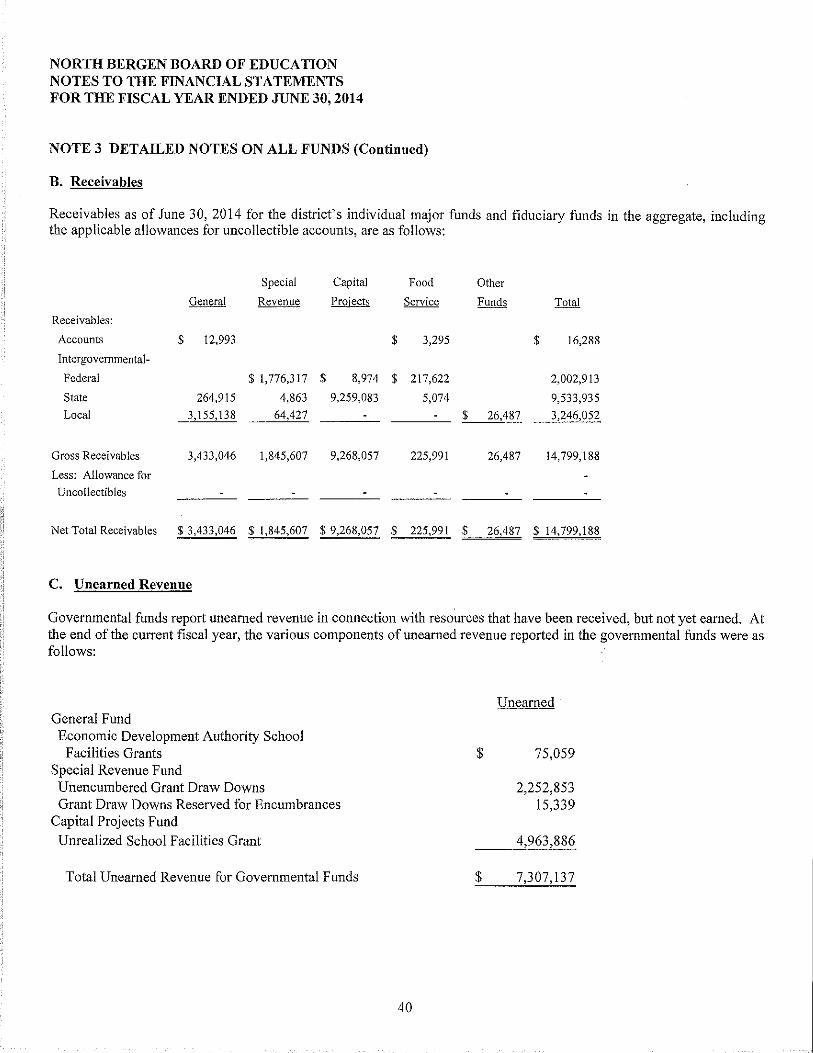
NORTH BERGEN BOARD OF EDUCATION NOTES TO THE FINANCIAL STATEMENTS FOR THE FISCAL YEAR ENDED JUNE 30,2014
NOTE 3 DETAILED NOTES ON ALL FUNDS (Continued)
B. Receivables
Receivables as of June 30, 2014 for the district's individual major funds and fiduciary funds in the aggregate, including the applicable allowances for uncollectible accounts, are as follows:
Special Capital Food Other
General Revenue Projects Service Funds Total
Receivables:
Accounts $ 12,993 $ 3,295 $ 16,288
Intergovernmental-
Federal $ 1,776,317 $ 8,974 $ 217,622 2,002,913
State 264,915 4,863 9,259,083 5,074 9,533,935
Local 3,155,138 64,427 $ 26,487 3,246,052
Gross Receivables 3,433,046 1,845,607 9,268,057 225,991 26,487 14,799,188
Less: Allowance for
Uncollectibles
Net Total Receivables $ 3,433,046 $ 1,845,607 $ 9,268,057 $ 225,991 $ 26,487 $ 14,799,188
C. Unearned Revenue
Governmental funds report unearned revenue in connection with resources that have been received, but not yet earned. At the end of the current fiscal year, the various components of unearned revenue reported in the governmental funds were as follows:
General Fund Economic Development Authority School
Facilities Grants Special Revenue Fund Unencumbered Grant Draw Downs Grant Draw Downs Reserved for Encumbrances
Capital Projects Fund Unrealized School Facilities Grant
Total Unearned Revenue for Governmental Funds
40
Unearned
$ 75,059
2,252,853 15,339
4,963,886
$ 7,307,137
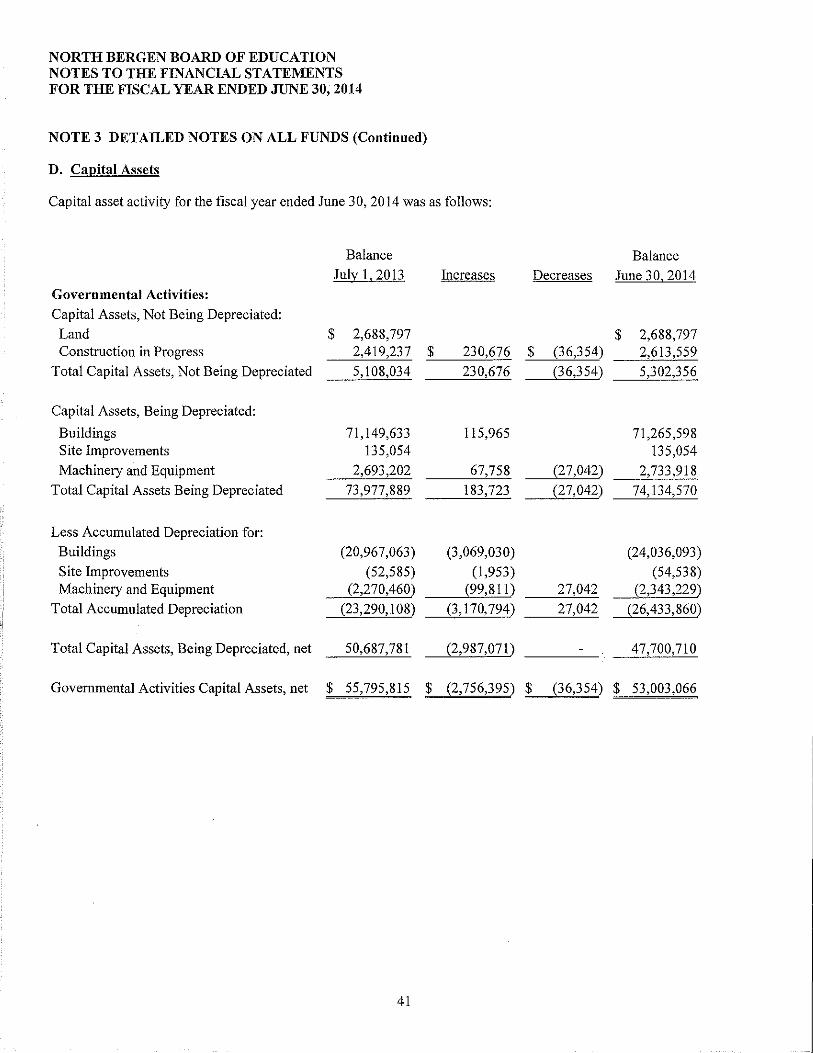
NORTH BERGEN BOARD OF EDUCATION NOTES TO THE FINANCIAL STATEMENTS FOR THE FISCAL YEAR ENDED JUNE 30, 2014
NOTE 3 DETAILED NOTES ON ALL FUNDS (Continued)
D. Capital Assets
Capital asset activity for the fiscal year ended June 30,2014 was as follows:
Balance Balance July 1, 2013 Increases Decreases June 30,2014
Governmental Activities:
Capital Assets, Not Being Depreciated:
Land $ 2,688,797 $ 2,688,797 Construction in Progress 2,419,237 $ 230,676 $ (36,354) 2,613,559
Total Capital Assets, Not Being Depreciated 5,108,034 230,676 (36,354) 5,302,356
Capital Assets, Being Depreciated:
Buildings 71,149,633 115,965 71,265,598 Site Improvements 135,054 135,054
Machinery and Equipment 2,693,202 67,758 (27,042) 2,733,918 Total Capital Assets Being Depreciated 73,977,889 183,723 (27,042) 74,134,570
Less Accumulated Depreciation for:
Buildings (20,967,063) (3,069,030) (24,036,093)
Site Improvements (52,585) (1,953) (54,538) Machinery and Equipment (2,270,460) (99,811) 27,042 (2,343,229)
Total Accumulated Depreciation (23,290, I 08) (3,170,794) 27,042 (26,433,860)
Total Capital Assets, Being Depreciated, net 50,687,781 (2,987,071) 47,700,710
Governmental Activities Capital Assets, net $ 55,795,815 $ (2, 756,395) $ (36,354) $ 53,003,066
41

NORTH BERGEN BOARD OF EDUCATION NOTES TO THE FINANCIAL STATEMENTS FOR THE FISCAL YEAR ENDED JUNE 30, 2014
NOTE 3 DETAILED NOTES ON ALL FUNDS (Continued)
D. Capital Assets (Continued)
Balance July 1, 2013
Business-Type Activities: Capital Assets, Being Depreciated:
Machinery and Equipment $ 116,661 Total Capital Assets Being Depreciated 116,661
Less Accumulated Depreciation for: Machinery and Equipment (95, 199) $
Total Accumulated Depreciation (95,199)
Total Capital Assets, Being Depreciated, net 21,462
Business-Type Activities Capital Assets, net $ 21,462 $
Increases Decreases
15,575 15,575
(2, 762) (2,762)
12,813
12,813 $
Depreciation expense was charged to functions/programs of the District as follows:
Governmental Activities: Instruction
Regular
Total Instruction
Support Services Support Services-Students and Instruction Related School Administration Operations and Maintenance of Plant Business Services
Total Support Services
Total Govermnental Funds
Business-Type Activities: Food Service Fund
42
Balance June 30,2014
$
$
$
132,236 132,236
(97,961) (97,961)
34,275
34,275
8,465
8,465
39,139 42,913
3,079,825 452
3,162,329
$ 3,170,794
$ 2,762
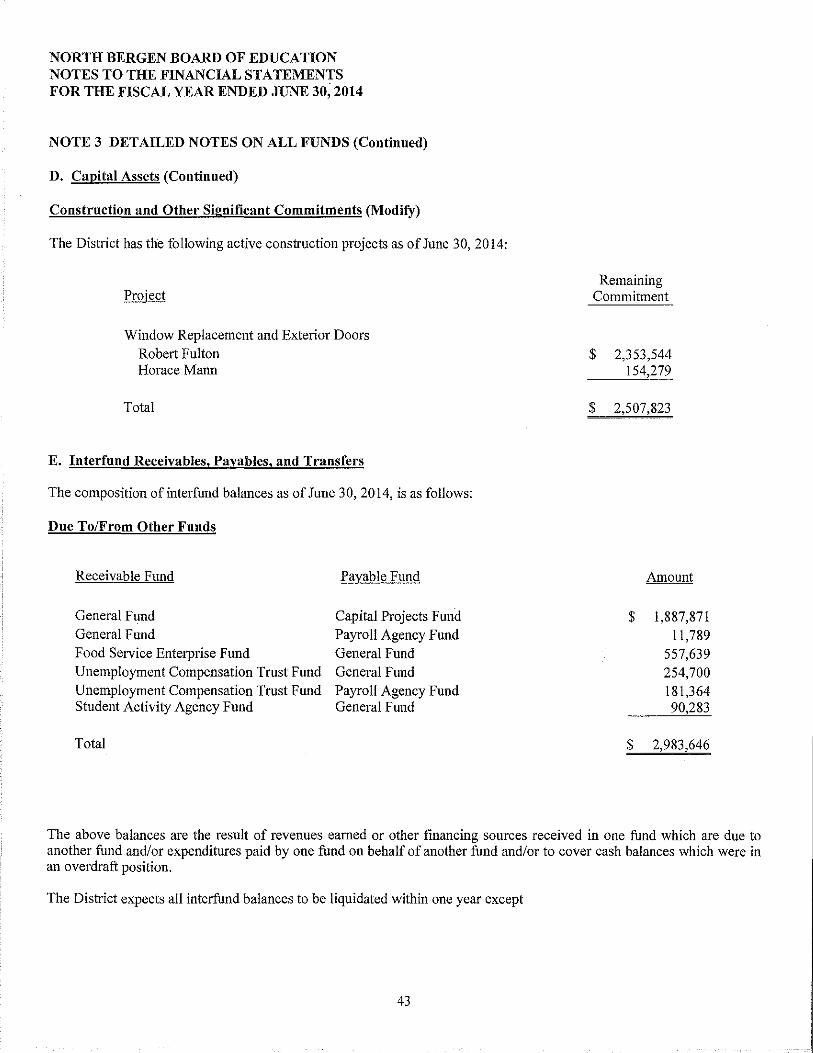
NORTH BERGEN BOARD OF EDUCATION NOTES TO THE FINANCIAL STATEMENTS FOR THE FISCAL YEAR ENDED JUNE 30, 2014
NOTE 3 DETAILED NOTES ON ALL FUNDS (Continued)
D. Capital Assets (Continued)
Construction and Other Significant Commitments (Modify)
The District has the following active construction projects as of June 30, 2014:
Project
Window Replacement and Exterior Doors Robert Fulton Horace Mann
Total
E. Interfund Receivables, Payables, and Transfers
The composition ofinterfund balances as of June 30,2014, is as follows:
Due To/From Other Funds
Receivable Fund
General Fund General Fund Food Service Enterprise Fund Unemployment Compensation Trust Fund Unemployment Compensation Trust Fund Student Activity Agency Fund
Total
Payable Fund
Capital Projects Fund Payroll Agency Fund General Fund General Fund Payroll Agency Fund General Fund
Remaining Commitment
$ 2,353,544 154,279
$ 2,507,823
Amount
$ 1,887,871 II, 789
557,639 254,700 181,364 90,283
$ 2,983,646
The above balances are the result of revenues earned or other financing sources received in one fund which are due to another fund and/or expenditures paid by one fund on behalf of another fund and/or to cover cash balances which were in an overdraft position.
The District expects all interfund balances to be liquidated within one year except
43

NORTH BERGEN BOARD OF EDUCATION NOTES TO THE FINANCIAL STATEMENTS FOR THE FISCAL YEAR ENDED JUNE 30,2014
NOTE 3 DETAILED NOTES ON ALL FUNDS (Continued)
E. Interfund Receivables, Payables, and Transfers (Continued)
Interfund Transfers
Transfer Out
General Fund
Transfer In
Capital Projects
$ 1,500,000
The above transfers are the result of capital reserve monies in the General Fund appropriated to finance projects in the Capital Projects Fund.
F. Leases
Sale/Leaseback
The District has entered into a contract for the sale/leaseback of textbooks totaling $2,535,000. The contract is for a term of 5 years. The sale/leaseback contract is being issued to finance the acquisition and improvement of real property for school purposes.
The future minimum sale/leaseback obligations and the net present value of these minimum sale/leaseback payments as of June 30, 2014 were as follows.
Fiscal Year Ending June 30
2015 2016 2017 2018 2019
Total Minimum Lease Payments
Less: Amount Representing Interest
Present Value of Minimum Lease Payments
44
Governmental Activities
$
$
500,896 528,447 545,535 547,277 135,520
2,257,675
(77,675)
2,180,000

NORTH BERGEN BOARD OF EDUCATION NOTES TO THE FINANCIAL STATEMENTS FOR THE FISCAL YEAR ENDED JUNE 30, 2014
NOTE 3 DETAILED NOTES ON ALL FUNDS (Continued)
F. Leases (Continued)
Lease Purchase Agreements
The District has entered into lease purchase agreements and issued certificates of participation ("COPS") as follows:
Date of Certificates Series Issuance Issued Lessor Agent
Improvements to Various Schools 8/1/98 $9,000,000 FFL Savings Corp Trust Company ofNJ Improvements to Various Schools 115100 10,000,000 FFL Savings Corp Trust Company ofNJ
On February 1, 2005 and July 1, 2011 the District refunded a portion of the original certificates issued.
The unexpended proceeds from the sale of the certificates, including interest earned on balances which remain on deposit are held with the respective agents. The following is a summary of balances by account type as of June 30, 2014:
Debt Service Reserve Cash and Cash Equivalents
Capital Projects Fund
$11,808
821.041
$832 849
The maturity schedule of the remaining lease payments for principal and interest is as follows:
Governmental Activities:
Fiscal Year Ended Certificates ofPartici!)ation
June 30. Princi!)al Interest Total
2015 $ 950,000 $ 450,963 $ 1,400,963 2016 990,000 420,037 1,410,037 2017 1,030,000 387,360 1,417,360 2018 1,075,000 351,241 1,426,241 2019 1,520,000 303,156 1,823,156
2020-2024 6,810,000 563,500 7,373,500
$ 12,375,000 $ 2,476,257 $ 14,851,257
45
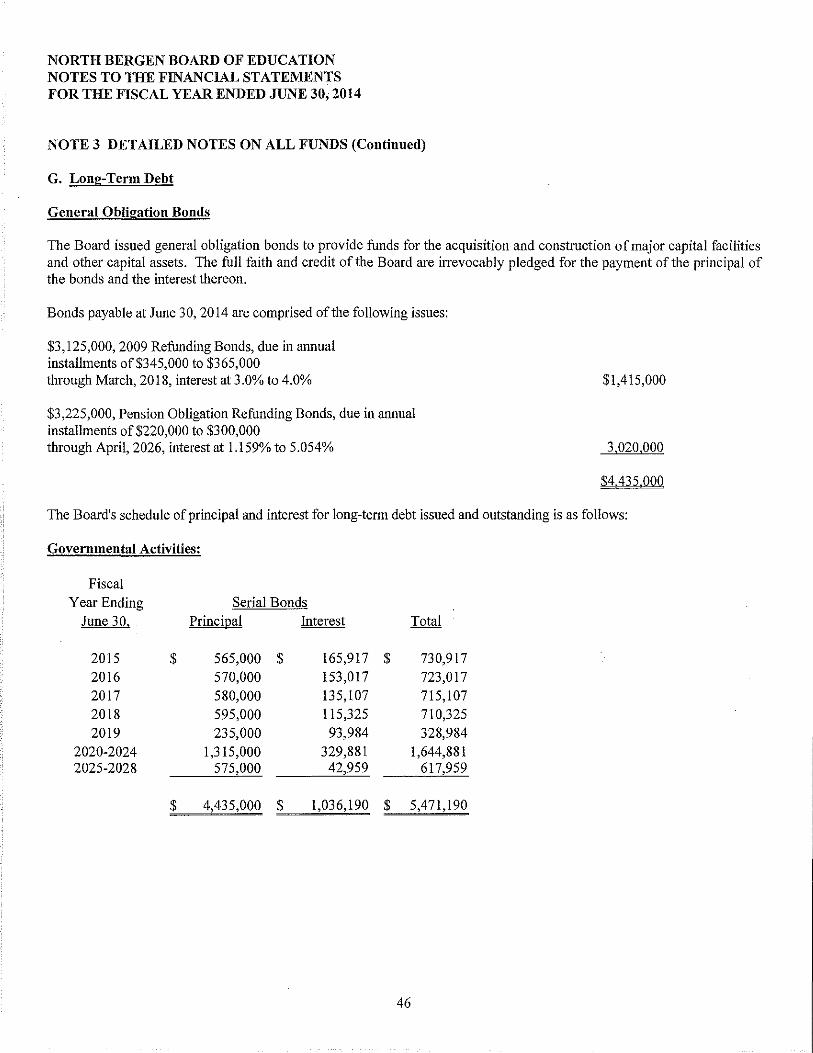
NORTH BERGEN BOARD OF EDUCATION NOTES TO THE FINANCIAL STATEMENTS FOR THE FISCAL YEAR ENDED JUNE 30,2014
NOTE 3 DETAILED NOTES ON ALL FUNDS (Continued)
G, Long-Term Debt
General Obligation Bonds
The Board issued general obligation bonds to provide funds for the acquisition and construction of major capital facilities and other capital assets. The full faith and credit of the Board are irrevocably pledged for the payment of the principal of the bonds and the interest thereon.
Bonds payable at June 30, 2014 are comprised of the following issues:
$3,125,000, 2009 Refunding Bonds, due in annual installments of$345,000 to $365,000 througb March, 2018, interest at 3.0% to 4.0%
$3,225,000, Pension Obligation Refunding Bonds, due in annual installments of$220,000 to $300,000 through April, 2026, interest at 1.159% to 5.054%
$1,415,000
3,020,000
$4.435.000
The Board's schedule of principal and interest for long-term debt issued and outstanding is as follows:
Governmental Activities:
Fiscal Year Ending Serial Bonds
June 30, Principal Interest Total
2015 $ 565,000 $ 165,917 $ 730,917 2016 570,000 153,017 723,017 2017 580,000 135,107 715,107 2018 595,000 115,325 710,325 2019 235,000 93,984 328,984
2020-2024 1,315,000 329,881 1,644,881 2025-2028 575,000 42,959 617,959
$ 4,435,000 $ 1,036,190 $ 5,471,190
46
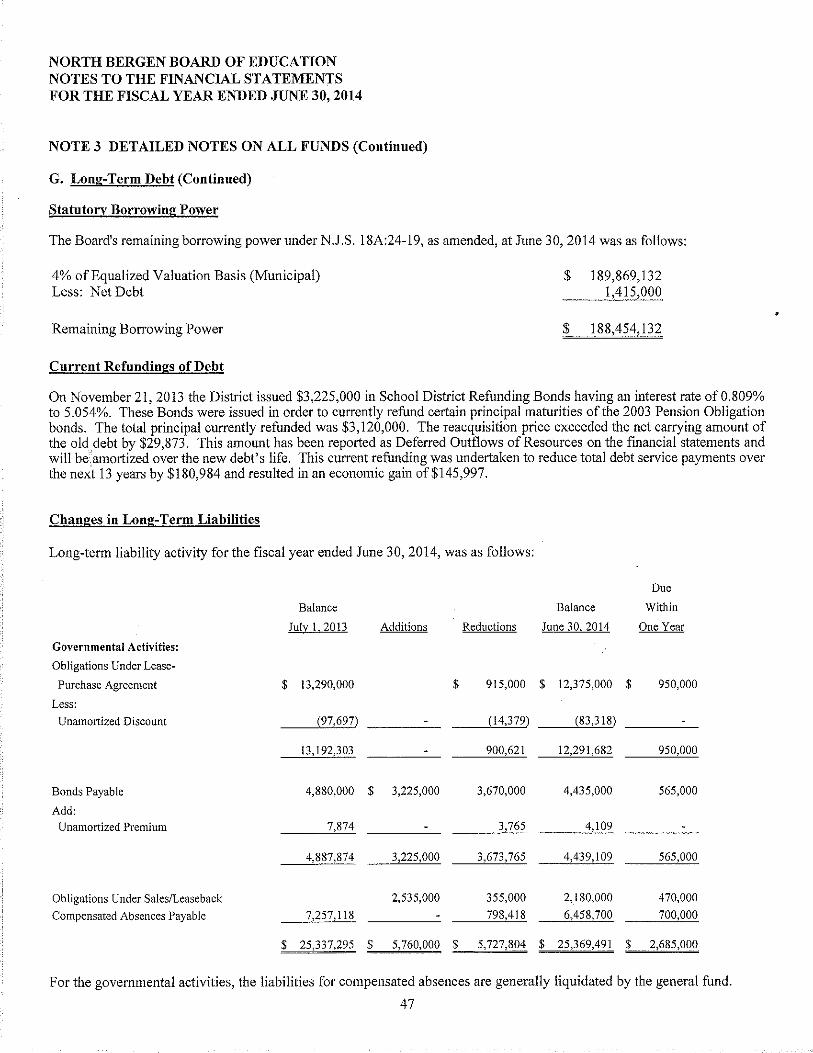
NORTH BERGEN BOARD OF EDUCATION NOTES TO THE FINANCIAL STATEMENTS FOR THE FISCAL YEAR ENDED JUNE 30, 2014
NOTE 3 DETAILED NOTES ON ALL FUNDS (Continued)
G. Long-Term Debt (Continued)
Statutory Borrowing Power
The Board's remaining borrowing power under N.J.S. 18A:24-19, as amended, at June 30, 2014 was as follows:
4% of Equalized Valuation Basis (Municipal) Less: Net Debt
Remaining Borrowing Power
Current Refundings of Debt
$ 189,869,132 1,415,000
$ 188,454,132
On November 21,2013 the District issued $3,225,000 in School District Refunding Bonds having an interest rate of0.809% to 5.054%. These Bonds were issued in order to currently refund certain principal maturities of the 2003 Pension Obligation bonds. The total principal currently refunded was $3,120,000. The reacquisition price exceeded the net carrying amount of the old debt by $29,873. This amount has been reported as Deferred Outflows of Resources on the financial statements and will be. amortized over the new debt's life. This current refunding was undertaken to reduce total debt service payments over the next 13 years by $180,984 and resulted in an economic gain of$145,997.
Changes in Long-Term Liabilities
Long-term liability activity for the fiscal year ended June 30, 2014, was as follows:
Due
Balance Balance Within
July I, 2013 Additions Reductions June 30, 2014 One Year
Governmental Activities:
Obligations Under Lease-
Purchase Agreement $ 13,290,000 $ 915,000 $ 12,375,000 $ 950,000
Less: Unamortized Discount (97,697) (14,379) (83,318)
13,192,303 900,621 12,291,682 950,000
Bonds Payable 4,880,000 $ 3,225,000 3,670,000 4,435,000 565,000
Add:
Unamortized Premium 7,874 3,765 4,109
4,887,874 3,225,000 3,673,765 4,439,109 565,000
Obligations Under Sales/Leaseback 2,535,000 355,000 2,180,000 470,000
Compensated Absences Payable 7,257,118 798,418 6,458,700 700,000
$ 25,337,295 $ 5,760,000 $ 5,727,804 $ 25,369,491 $ 2,685,000
For the governmental activities, the liabilities for compensated absences are generally liquidated by the general fund.
47
•
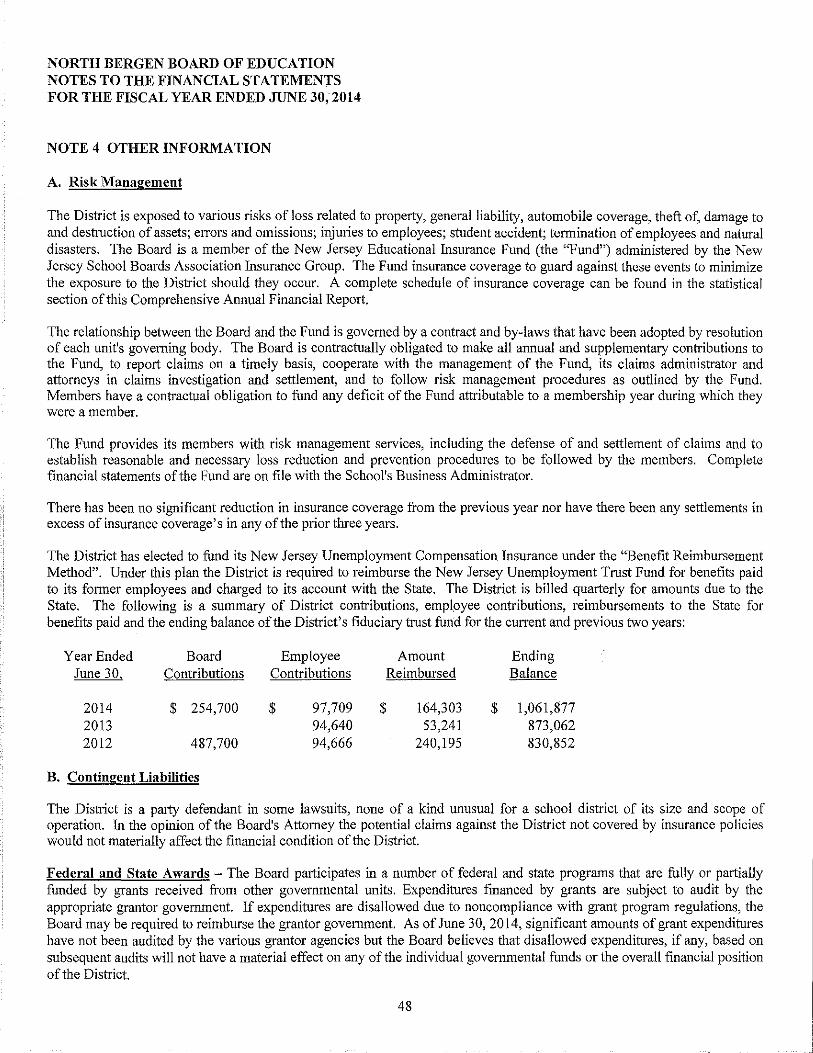
NORTH BERGEN BOARD OF EDUCATION NOTES TO THE FINANCIAL STATEMENTS FOR THE FISCAL YEAR ENDED JUNE 30, 2014
NOTE 4 OTHER INFORMATION
A. Risk Management
The District is exposed to various risks of loss related to property, general liability, automobile coverage, theft of, damage to and destruction of assets; errors and omissions; injuries to employees; student accident; termination of employees and natural disasters. The Board is a member of the New Jersey Educationallnsurance Fund (the "Fund") administered by the New Jersey School Boards Association Insurance Group. The Fund insurance coverage to guard against these events to minimize the exposure to the District should they occur. A complete schedule of insurance coverage can be found in the statistical section of this Comprehensive Annual Financial Report.
The relationship between the Board and the Fund is governed by a contract and by-laws that have been adopted by resolution of each unit's governing body. The Board is contractually obligated to make all annual and supplementary contributions to the Fund, to report claims on a timely basis, cooperate with the management of the Fund, its claims administrator and attorneys in claims investigation and settlement, and to follow risk management procedures as outlined by the Fund. Members have a contractual obligation to fund any deficit of the Fund attributable to a membership year during which they were a member.
The Fund provides its members with risk management services, including the defense of and settlement of claims and to establish reasonable and necessary loss reduction and prevention procedures to be followed by the members. Complete financial statements of the Fund are on file with the School's Business Administrator.
There has been no significant reduction in insurance coverage from the previous year nor have there been any settlements in excess of insurance coverage's in any of the prior three years.
The District has elected to fund its New Jersey Unemployment Compensation Insurance under the "Benefit Reimbursement Method". Under this plan the District is required to reimburse the New Jersey Unemployment Trust Fund for benefits paid to its former employees and charged to its account with the State. The District is billed quarterly for amounts due to the State. The following is a summary of District contributions, empl.oyee contributions, reimbursements to the State for benefits paid and the ending balance of the District's fiduciary trust fund for the current and previous two years:
Year Ended Board Employee Amount Ending June 30. Contributions Contributions Reimbursed Balance
2014 $ 254,700 $ 97,709 $ 164,303 $ 1,061,877 2013 94,640 53,241 873,062 2012 487,700 94,666 240,195 830,852
B. Contingent Liabilities
The District is a party defendant in some lawsuits, none of a kind unusual for a school district of its size and scope of operation. In the opinion of the Board's Attorney the potential claims against the District not covered by insurance policies would not materially affect the financial condition of the District.
Federal and State Awards - The Board participates in a number of federal and state programs that are fully or partially funded by grants received from other governmental units. Expenditures financed by grants are subject to audit by the appropriate grantor government. If expenditures are disallowed due to noncompliance with grant program regulations, the Board may be required to reimburse the grantor government. As of June 30, 2014, significant amounts of grant expenditures have not been audited by the various grantor agencies but the Board believes that disallowed expenditures, if any, based on subsequent audits will not have a material effect on any of the individual governmental funds or the overall financial position of the District.
48
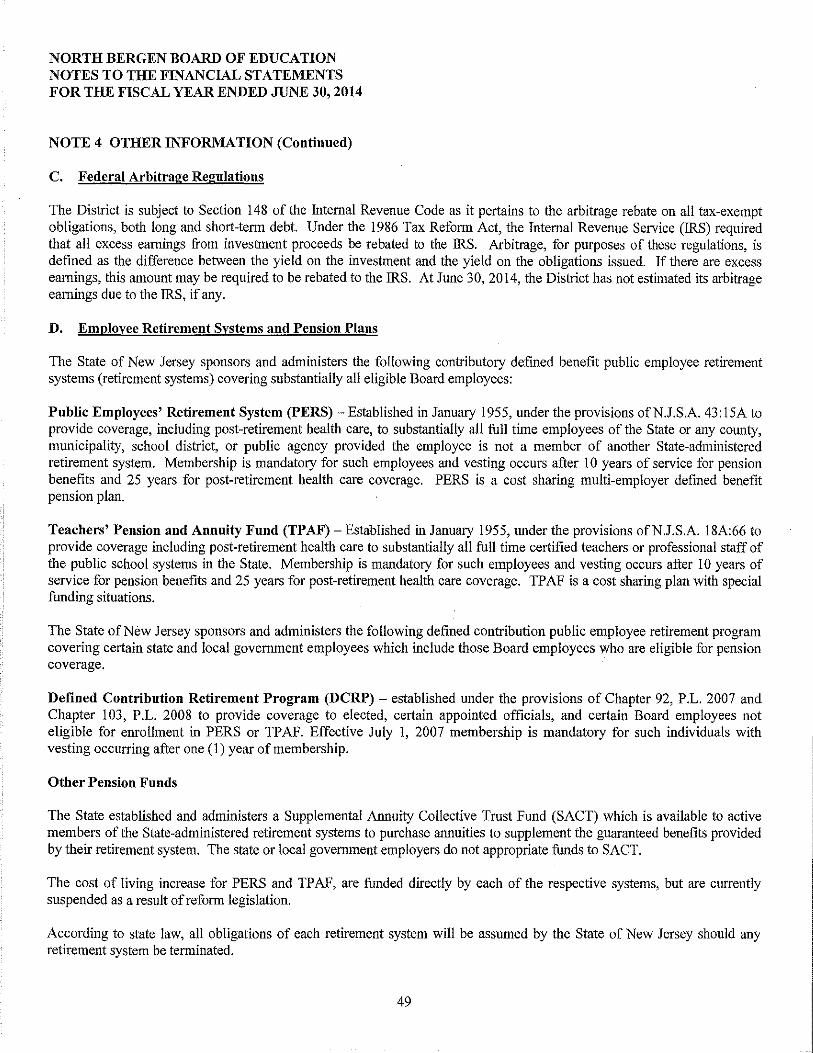
NORTH BERGEN BOARD OF EDUCATION NOTES TO THE FINANCIAL STATEMENTS FOR THE FISCAL YEAR ENDED JUNE 30,2014
NOTE 4 OTHER INFORMATION (Continued)
C. Federal Arbitrage Regulations
The District is subject to Section 148 of the Internal Revenue Code as it pertains to the arbitrage rebate on all tax-exempt obligations, both long and short-term debt. Under the 1986 Tax Reform Act, the Internal Revenue Service (IRS) required that all excess earnings from investment proceeds be rebated to the IRS. Arbitrage, for purposes of these regulations, is defined as the difference between the yield on the investment and the yield on the obligations issued. If there are excess earnings, this amount may be required to be rebated to the IRS. At June 30,2014, the District has not estimated its arbitrage earnings due to the IRS, if any.
D. Employee Retirement Systems and Pension Plans
The State of New Jersey sponsors and administers the following contributory defined benefit public employee retirement systems (retirement systems) covering substantially all eligible Board employees:
Public Employees' Retirement System (PERS)- Established in January 1955, under the provisions ofN.J.S.A. 43:15A to provide coverage, including post-retirement health care, to substantially all full time employees of the State or any county, municipality, school district, or public agency provided the employee is not a member of another State-administered retirement system. Membership is mandatory for such employees and vesting occurs after I 0 years of service for pension benefits and 25 years for post-retirement health care coverage. PERS is a cost sharing multi-employer defined benefit pension plan.
Teachers' Pension and Annuity Fund (TPAF)- Established in January 1955, under the provisions ofN.J.S.A. 18A:66 to provide coverage including post-retirement health care to substantially all full time certified teachers or professional staff of the public school systems in the State. Membership is mandatory for such employees and vesting occurs after 10 years of service for pension benefits and 25 years for post-retirement health care coverage. TP AF is a cost sharing plan with special funding situations.
The State ofNew Jersey sponsors and administers the following defined contribution public employee retirement program covering certain state and local government employees which include those Board employees who are eligible for pension coverage.
Defined Contribution Retirement Program (DCRP)- established under the provisions of Chapter 92, P.L. 2007 and Chapter 103, P.L. 2008 to provide coverage to elected, certain appointed officials, and certain Board employees not eligible for enrollment in PERS or TPAF. Effective July I, 2007 membership is mandatory for such individuals with vesting occurring after one (1) year of membership.
Other Pension Funds
The State established and administers a Supplemental Armuity Collective Trust Fund (SACT) which is available to active members of the State-administered retirement systems to purchase annuities to supplement the guaranteed benefits provided by their retirement system. The state or local government employers do not appropriate funds to SACT.
The cost of living increase for PERS and TPAF, are funded directly by each of the respective systems, but are currently suspended as a result of reform legislation.
According to state law, all obligations of each retirement system will be assumed by the State of New Jersey should any retirement system be terminated.
49
NORTH BERGEN BOARD OF EDUCATION NOTES TO THE FINANCIAL STATEMENTS FOR THE FISCAL YEAR ENDED JUNE 30, 2014
NOTE 4 OTHER INFORMATION (Continued)
D. Employee Retirement Systems and Pension Plans (Continued)
Other Pension Funds (Continued)
The State of New Jersey, Department of the Treasury, Division of Pensions and Benefits, issues publicly available financial reports that include tbe financial statements and required supplementary information of each of the above systems. The financial reports may be accessed via the New Jersey, Division of Pensions and Benefits, website at www .state.n j. us/treasury/pensions.
Basis of Accounting
The financial statements of the retirement systems are prepared ou the accrual basis of accounting. Employer contributions are recognized when payable to the retirement systems. Benefits or refunds are recognized when due and payable in accordance witb the terms oftbe retirement systems.
Significant Legislation
P.L. 2011, c.78, effective June 28, 2011, made various changes to the manner in which TPAF and PERS operate and to the benefit provisions of those systems.
The legislation's provisions impacting employee pension and health benefits include:
• For new members ofTPAF and PERS hired on or after June 28,2011 (Tier 5 members), the years of creditable service needed for early retirement benefits increased from 25 to 30 years and the early retirement age increased from 55 to 65.
• The eligibility age to qualifY for a service retirement in the TP AF and PERS increased from age 62 to 65 for Tier 5 members.
• It increased the TPAF and PERS active member rates from 5.5 percent of annual compensation to 6.5 percent plus an additional I percent phased-in over 7 years for members hired or reappointed on or after June 28, 2011. For Fiscal Year 2012, the member contribution rates increased in October 2011. The phase-in of the additional incremental member contributions for TP AF and PERS members takes place in July of each subsequent fiscal year.
• The payment of automatic cost-of-living adjustment (COLA) additional increases to current and future retirees and beneficiaries was suspended. COLA increases may be reactivated at a future date as permitted by this law.
• It changed tbe method for amortizing the pension system's unfunded accrued liability (from a level percent of pay method to a level dollar of pay method).
Investment Valuation
Investments are reported at fair value. Securities traded on a national or international exchange are valued at the last reported sales price at current exchange rates. Mortgages are valued on the basis of future principal and interest payments, and are discounted at prevailing interest rates for similar instruments. The fair value of real estate investments is based on independent appraisals. Investments that do not have an established market are reported at estimated fair values.
The State of New Jersey, Department of the Treasury, Division of Investment, issues publicly available financial reports that include the financial statements of the State of New Jersey Cash Management Fund. The financial reports may be obtained in writing to tbe State of New Jersey, Department of the Treasury, Division of Investment, P.O. Box 290, Trenton, New Jersey 08625-0290.
50

NORTH BERGEN BOARD OF EDUCATION NOTES TO THE FINANCIAL STATEMENTS FOR THE FISCAL YEAR ENDED JUNE 30, 2014
NOTE 4 OTHER INFORMATION (Continued)
D. Employee Retirement Systems and Pension Plans (Continued)
Funding Status and Funding Progress
As of July 1, 2012, the most recent actuarial valuation date, the aggregate funded ratio for all the State administered retirement systems including TPAF and PERS, is 64.5 percent with an unfunded actuarial accrued liability of $47.2 billion. The aggregate funded ratio and unfunded accrued liability for the State-funded systems is 56.7 percent and $34.4 billion, and the aggregate funded ratio and unfunded accrued liability for local PERS and Police and Firemen's Retirement System ("PFRS") is 76.1 percent and $12.8 billion.
The funded status and funding progress of the retirement systems is based on actuarial valuations which involve estimates of the value of reported amounts and assumptions about the probability of events far into the future. These amounts are subject to continual revision as actual results are compared to past expectations and new estimates are made about the probability of future events.
Actuarial calculations reflect a long-term perspective and are based on the benefits provided under the terms of the retirement systems in effect at the time of each valuation and also consider the pattern of the sharing of costs between the employer and members at that point in time. The projection of benefits for financing reporting purposes does not explicitly incorporate the potential effects of legal or contractual funding limitations on the pattern of cost sharing between the employer and members in the future.
Actuarial Methods and Assumptions
In the July 1, 2012 actuarial valuation, the projected unit credit was used as the actuarial cost method, and the five year average of market value was used as the asset valuation method for the retirement systems. The actuarial assumptions included (a) an investment rate of return for the retirement systems from 7.95 percent to 7.90 percent and (b) projected salary increases of 4.22 percent for the PERS and 3.51 % percent for TP AF.
Employer and Employee Pension Contributions
The contribution policy is set by laws of the State of New Jersey and contributions are required by active members and participating employers. Plan member and employer contributions may be amended by State of New Jersey legislation with the amount of contributions by the State of New Jersey contingent upon the Annual Appropriations Act. As defined, the retirement systems require employee contributions based on 6.6% for PERS, 6.6% for TP AF and 5.50% for DCRP of the employee's annual compensation.
Annual Pension Costs (APC)
Per the requirements of GASB Statement No. 27 Accounting for Pensions by State and Local Government Employees, for the fiscal year ended June 30, 2014 for TPAF, which is a cost sharing plan with special funding situations, the annual pension cost differs from the annual required contribution. For PERS, which is a cost sharing multi-employer defined benefit pension plan, the annual pension cost equals contributions made. TP AF employer contributions are made annually by the State of New Jersey to the pension system on behalf of the Board. PERS employer contributions are made annually by the Board to the pension system in accordance with Chapter 114, P.L. 1997. In the DCRP, which is a defined contribution plan, member contributions are matched by a 3% employer contribution.
51

NORTH BERGEN BOARD OF EDUCATION NOTES TO THE FINANCIAL STATEMENTS FOR THE FISCAL YEAR ENDED JUNE 30, 2014
NOTE 4 OTHER INFORMATION (Continued)
D. Employee Retirement Systems and Pension Plans (Continued)
During the fiscal years ended June 30, 2014, 2013 and 2012 the Board was required to contribute for PERS and DCRP and the State of New Jersey was required to contribute for TP AF for normal cost pension and accrued liability contributions (including non-contributory group life insurance (NCGI)) the following amounts:
Fiscal Year Ended On-Behalf
June 30, PERS TPAF DCRP
2014 $ 1,051,611 $ 2,281,041 $ 3,257 2013 1,042,411 3,403,239 1,134 2012 1,019,459 1,630,387
During fiscal year 2013/2014 the State did not contribute to the TPAF for accrued liability but did contribute $2,281,041 for normal cost pension and NCGI premium. For fiscal years 2012/2013 and 2011/2012, the state contributed $3,403,239 and $1,630,387, respectively for normal cost pension, accrued liability and the NCGI premium.
Also, in accordance with N.J.S.A. 18A:66-66 the State of New Jersey reimbursed the Board $3,941,948 during the fiscal year ended June 30, 2014 for the employer's share of social security contributions for TPAF members as calculated on their base salaries. This amount, along with the on-behalf TPAF pension contribution, has been included in the district-wide financial statements and the fund financial statements as a revenue and expenditure in accordance with GASB No. 24.
E. Post-Retirement Medical Benefits
The State of New Jersey sponsors and administers the post-retirement health benefit program plans for school districts. The Plans are classified as either single employer plans or cost sharing multiple employer defined benefit plans depending on the plan the eligible employee is covered under.
As a result of implementing Governmental Accounting Standards Board (GASB) Statement No. 43, Financial Reporting for Post-employment Benefit Plans Other than Pension Plans (OPEB), effective for Fiscal Year 2007, the State Health Benefits Program (SHBP), and the Prescription Drug Program (PDP), and Post-Retirement Medical (PRM) of the PERS and TP AF are combined and reported as Pension and Other employee Benefit Trust Funds in the State's Comprehensive Annual Financial Report (CAFR). Specifically, SHBP-State, and the PRM of the PERS are combined and reported as a Health Benefits Program Fund - State classified as a single employer plan. The SHBP-Local, PDP-Local, and the PRM of the TP AF-Local are combined and reported as Health Benefits Program Fund -Local Government classified as a cost-sharing multiple-employer plan in the State's CAFR. The post-retirement benefit programs had a total of 585 state and local participating employers and contributing entities for Fiscal Year 2013.
The State of New Jersey sponsors and administers the following health benefit programs covering certain state and local government employees, including those Board employees and retirees eligible for coverage.
52

NORTH BERGEN BOARD OF EDUCATION NOTES TO THE FINANCIAL STATEMENTS FOR THE FISCAL YEAR ENDED JUNE 30, 2014
NOTE 4 OTHER INFORMATION (Continued)
E. Post-Retirement Medical Benefits (Continued)
Health Benefits Program Fund (HBPF) - Local Education (including Prescription Drug Program Fund) - The State of New Jersey provides paid coverage to members of the Teachers' Pension and Annuity Fund who retire from a board of education or county college with 25 years of service or on a disability retirement. Under the provisions of P.L. 1992, c.l26, the State also provides paid coverage to members of the Public Employees' Retirement System and Alternate Benefits Program who retire from a board of education or county college with 25 years of service or on a disability retirement if the member's employer does not provide this coverage. Certain local participating employers also provide post-retirement medical coverage to their employees. Retirees who are not eligible for state paid health coverage at retirement can continue in the program if their employer participates in this program or if they are participating in the health benefits plan of their former employer and are enrolled in Medicare parts A and B by paying the cost of the insurance for themselves and their covered dependents. Also, education employees are eligible for the PDP coverage after 60 days of employment.
The State of New Jersey, Department of the Treasury, Division of Pensions and Benefits, issues publicly available financial reports that include the financial statements and required supplementary information of the above Fund. The financial reports may be accessed via the State of New Jersey, Department of the Treasury, Division of Pensions and Benefits, website at www.state.nj.us/treasury/pensions.
Basis of Accounting
The financial statements of the health benefit programs are prepared on the accrual basis of accounting. Employer contributions are recognized when payable to the health benefit programs. Benefits or refunds are recognized when due and payable in accordance with the terms of the health benefit programs.
Significant Legislation
P.L. 2011, c.78, effective October 2011, sets new employee contribution requirements towards the cost of employerprovided health benefit coverage. Employees are required to contribute a certain percentage of the cost of coverage. The rate of contribution is determined based on the employee's annual salary and the selected level of coverage. The increased employee contributions will be phased in over a 4-year period for those employed prior to this new legislation's effective date with a minimum contribution required to be at least 1.5% of salary.
Investment Valuation
Investments are reported at fair value. Investments that do not have an established market are reported at estimated fair values.
Funded Status and Funding Progress
As of July 1, 2012, the most recent actuarial valuation date, the State had a $51.5 billion unfunded actuarial accrued liability for other post-employment benefits (OPEB) which is made up to $19.3 billion for state active and retired members and $32.2 billion for education employees and retirees that become the obligation of the State ofNew Jersey upon retirement.
53
NORTH BERGEN BOARD OF EDUCATION NOTES TO THE FINANCIAL STATEMENTS FOR THE FISCAL YEAR ENDED JUNE 30, 2014
NOTE 4 OTHER INFORMATION (Continued)
E. Post-Retirement Medical Benefits (Continued)
Funded Status and Fuudiug Progress (Continued)
The funded status and funding progress of the OPEB includes actuarial valuations which involve estimates of the value of reported amounts and assumptions about the probability of events far into the future. These amounts are subject to continual revision as actual results are compared to past expectations and new estimates are made about the probability of future events.
Actuarial calculations reflect a long-term perspective and are based on the benefits provided under the terms of the OPEB in effect at the time of each valuation and also consider the pattern of the sharing of costs between the employer and members at the point in time. The projection of benefits for financial reporting purposes does not explicitly incorporate the potential effects of legal or contractual funding limitations on the pattern of cost sharing between the employer and members in the future.
Actuarial Methods and Assumptions
In the July I, 2012, OPEB actuarial valuation, the projected unit credit was used as the actuarial cost method. The actuarial assumptions included an assumed investment rate of return of 4.50 percent.
Post-Retirement Medical Benefits Contributions
P.L. 1987, c. 384 and P.L. 1990, c.6 required the Teachers' Pension and Annuity Fund (TPAF) and Public Employees' Retirement System (PERS), respectively to fund post-retirement medical benefits for those State employees and education employees who retire after accumulating 25 years of credited service or on a disability retirement. As of June 30, 2013, there were 100,134, retirees receiving post-retirement medical benefits and the State contributed $1.07 billion on their behalf. The cost of these benefits is funded through contributions by the State and in accordance with P.L. 1994, c.62. Funding of postretirement medical benefits changed from a pre-funding basis to a pay-as-you-go basis beginning in Fiscal Year 1994.
The State is also responsible for the cost attributable to P.L. 1992, c.126, which provides paid health benefits to members of PERS and the Alternate Benefit Program who retired from a board of education or county college with 25 years of service. The State paid $173.8 million toward Chapter 126 benefits for 17,356 eligible retired members in Fiscal Year 2013.
The State sets the contribution rate based on a pay as you go basis and not on the annual required contribution of the employers (ARC), an amount actuarially determined in accordance with the parameters of GASB Statement 45. The ARC represents a level of funding that, if paid on an ongoing basis, is projected to cover normal cost each year and amortize any unfunded actuarial liabilities (or funding excess) of the plan over a period not to exceed thirty years. The State's contributions to the State Health Benefits Program Fund for TPAF retirees' post-retirement benefits on behalf of the School District for the fiscal years ended June 30, 2014, 2013 and 2012 were $3,740,050, $3,848,203 and $3,277,502, respectively, which equaled the required contributions for each year. The State's contributions to the State Health Benefits Program Fund for PERS retirees' post-retirement benefits on behalf of the School District was not determined or made available by the State ofNew Jersey.
54
BUDGETARY COMPARISON SCHEDULES
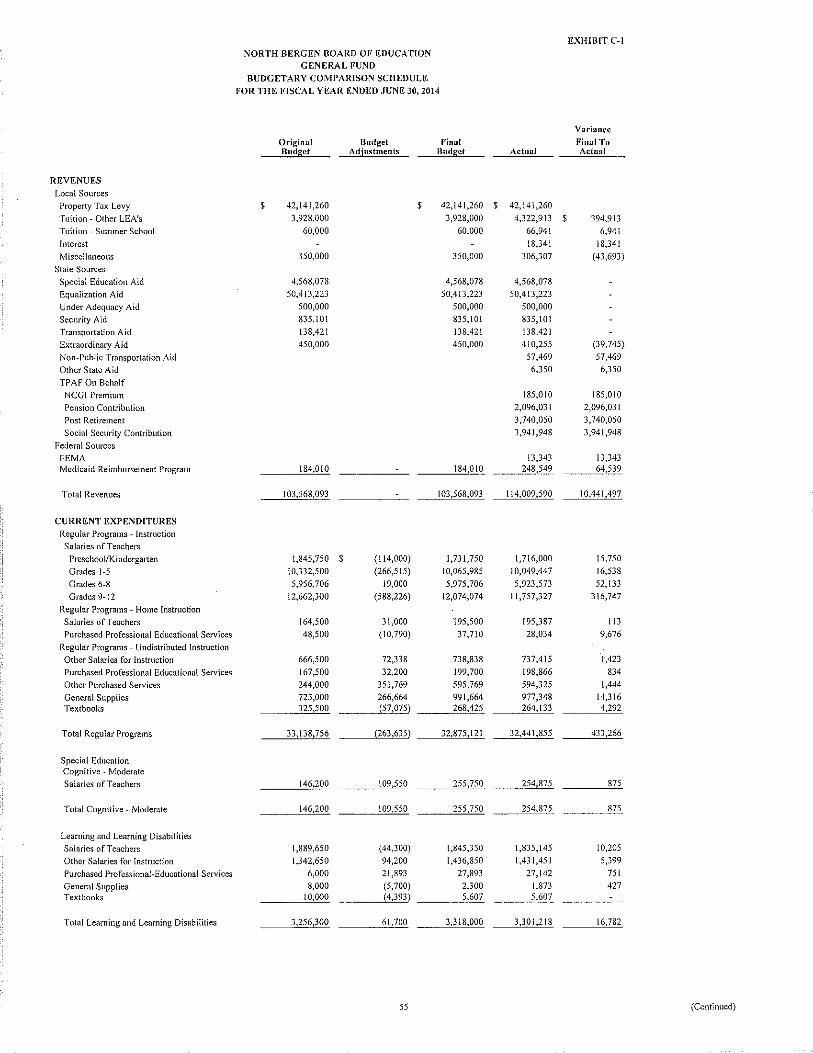
EXHIBITC-1
NORTH BERGEN BOARD OF EDUCATION GENERAL FUND
BUDGETARY COMPARISON SCHEDULE
FOR THE FISCAL YEAR ENDED JUNE 30,2014
Variance
Original Budget Final Final To Budget Adjustments Budget Actual Actual
REVENUES Local SoUl'ces
Property Tax Levy $ 42,141,260 $ 42,!41,260 $ 42,141,260
Tuition- Other LEA's 3,928,000 3,928,000 4,322,913 $ 394,913
Tuition- Summer School 60,000 60,000 66,941 6,941 Interest 18,341 I 8,341
Miscellaneous 350,000 350,000 306,307 (43,693) State Sources
Special Education Aid 4,568,078 4,568,078 4,568,078 Equalization Aid 50,413,223 50,413,223 50,413,223
Under Adequacy Aid 500,000 500,000 500,000
Security Aid 835,101 835,101 835,101 Transportation Aid 138,421 138,42 I !38,421 Extraordinmy Aid 450,000 450,000 410,255 {39,745)
Non-Public Transportation Aid 57,469 57,469
Other State Aid 6,350 6,350
TP AF On Behalf NCO! Premium 185,010 185,010
Pension Contribution 2,096,031 2,096,031
Post Retirement 3,740,050 3,740,050 Social Security Contribution 3,941,948 3,941,948
Federal Sources FEMA !3,343 13,343 Medicaid Reimbursement Program 184,0!0 184,010 248,549 64,539
Total Revenues 103,568,093 103,568,093 I 14,009,590 10,441,497
CURRENT EXPENDITURES Regular Programs - Instruction Salaries of Teachers
Preschool/Kindergarten 1,845,750 $ (114,000) 1,731,750 1,716,000 15,750 Grades 1-5 10,332,500 (266,515) 10,065,985 10,049,447 16,538 Grades 6-8 5,956,706 19,000 5,975,706 5,923,573 52,133 Grades 9-12 12,662,300 (588,226) 12,074,074 11,757,327 316,747
Regular Programs - Home Instruction Salaries of Teachers 164,500 31,000 195,500 195,387 113 Purchased Professional Educational Services 48,500 (10,790) 37,710 28,034 9,676
Regu1at· Programs- Undistributed Instruction Other Salaries for Instruction 666,500 72,338 738,838 737,415 1,423 Purchased Professional Educational Services 167,500 32,200 199,700 198,866 834
Other Purchased Services 244,000 351,769 595,769 594,325 1,444
General Supplies 725,000 266,664 991,664 977,348 14,316 Textbooks 325,500 {57,075) 268,425 264,133 4,292
Total Regular Programs 33,138,756 (263,635) 32,875,121 32,441,855 433,266
Special Education Cognitive- Moderate Salaries ofTeachet·s 146,200 109,550 255,750 254,875 875
Total Cognitive- Moderate 146,200 109,550 255,750 254,875 875
Learning and Learning Disabilities Salaries of Teachers 1,889,650 (44,300) 1,845,350 1,835,145 10,205
Other Salaries for Instruction 1,342,650 94,200 1,436,850 1,431,451 5,399
Purchased Professional-Educational Services 6,000 21,893 27,893 27,142 751
General Supplies 8,000 (5,700) 2,300 1,873 427 Textbooks 10,000 (4,393) 5,607 5,607
Total Learning and Learning Disabilities 3,256,300 61,700 3,318,000 3,301,218 16,782
55 (Continued)
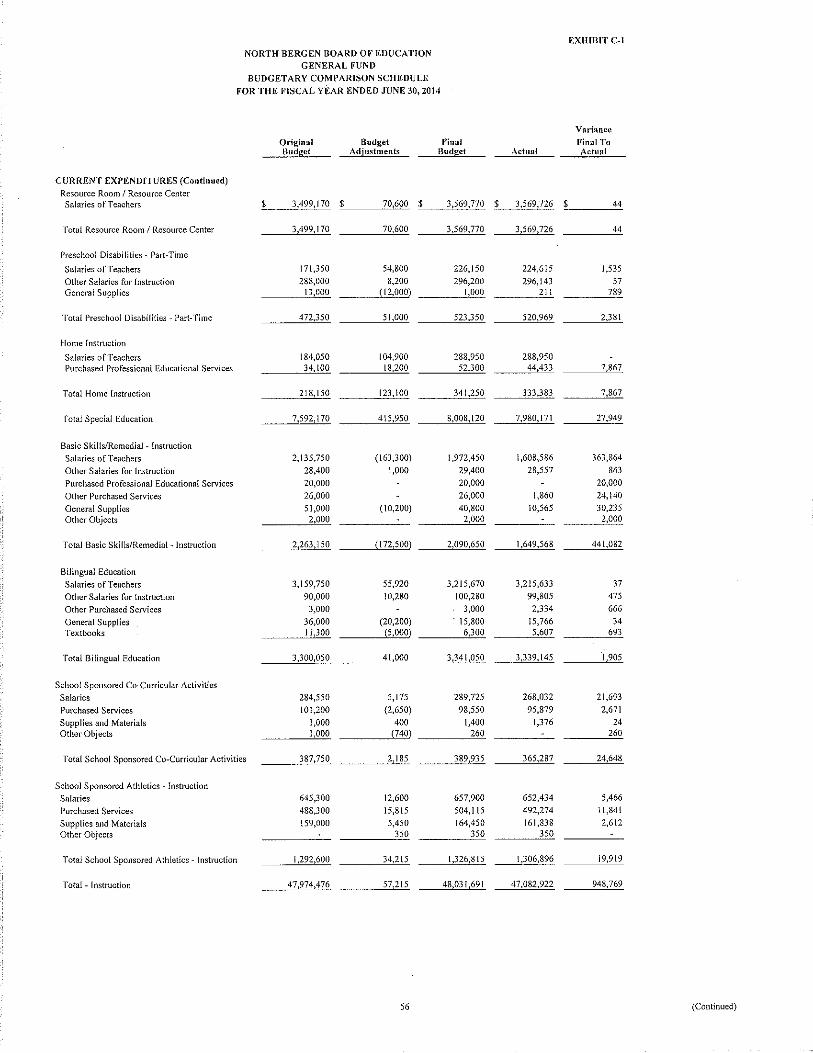
EXHIBITC-1
NORTH BERGEN BOARD OF EDUCATION GENERAL FUND
BUDGETARY COMPARISON SCHEDULE
FOR THE FISCAL YEAR ENDED JUNE 30,2014
Variance Original Budget Final Final To Budget Adjustments Budget Actual Actual
CURRENT EXPENDITURES (Continued) Resource Room I Resource Center Salaries of Teachers $ 3,499,170 $ 70,600 $ 3,569,770 $ 3,569,726 $ 44
Total Resource Room I Resource Center 3,499,170 70,600 3,569,770 3,569,726 44
Preschool Disabilities- Part-Time
Salaries of Teachers 171,350 54,800 226,150 224,6!5 I ,535
Other Salaries for Instruction 288,000 8,200 296,200 296,!43 57 General Supplies 13,000 (12,000) 1,000 21l 789
Total Preschool Disabilities- Part-Time 472,350 51,000 523,350 520,969 2,381
Home lnstt·uction
Salaries of Teachers 184,050 !04,900 288,950 288,950 Purchased Professional Educational Services 34,!00 !8,200 52,300 44,433 7,867
Total Home Instruction 218, !50 !23, 100 341,250 333,383 7,867
Total Special Education 7,592,170 4\5,950 8,008,120 7,980,171 27,949
Basic Skills/Remedial- Instruction
Salaries of Teachers 2,135,750 (163,300) 1,972,450 1,608,586 363,864
Other Salaries for Instruction 28,400 1,000 29,400 28,557 843
Purchased Professional Educational Services 20,000 20,000 20,000
Other Purchased Services 26,000 26,000 1,860 24,140
General Supplies 51,000 (10,200) 40,800 10,565 30,235 Other Objects 2,000 2,000 2,000
Total Basic Skills/Remedial- Instruction 2,263,150 (172,500) 2,090,650 I ,649,568 441,082
Bilingual Education
Salaries of Teachers 3,159,750 55,920 3,215,670 3,215,633 37
Other Salaries for Instruction 90,000 \0,280 100,280 99,805 475
Other Purchased Services 3,000 3,000 2,334 666
General Supplies 36,000 (20,200) 15,800 15,766 34 Textbooks 11,300 (5,000) 6,300 5,607 693
Total Bilingual Education 3,300,050 41,000 3,341,050 3,339,145 1,905
School Sponsored Co-Curricular Activities
Salaries 284,550 5,175 289,725 268,032 21,693
Purchased Services 101,200 (2,650) 98,550 95,879 2,671
Supplies and Materials 1,000 400 1,400 1,376 24 Other Objects 1,000 (740) 260 260
Total School Sponsored Co-Curricular Activities 387,750 2,185 389,935 365,287 24,648
School Sponso1·ed Athletics- Instruction
Salaries 645,300 12,600 657,900 652,434 5,466
Purchased Services 488,300 15,815 504,115 492,274 11,84!
Supplies and Materials 159,000 5,450 164,450 161,838 2,612 Other Objects 350 350 350
Total School Sponsored Athletics- Instruction I ,292,600 34,215 1,326,815 1,306,896 19,919
Total- Instruction 47,974,476 57,215 48,03 !,69! 47,082,922 948,769
56 (Continued)

EXHIBIT C~I NORTH BERGEN BOARD OF EDUCATION
GENERAL FUND
BUDGETARY COMPARISON SCHEDULE FOR THE FISCAL YEAR ENDED JUNE 30,2014
Variance Original Budget Final final To Budget Adjustments Budget Actual Actual
CURRENT EXPENDlTURES (Continued)
Undistributed Expenditures
Instruction Tuition- Other LEA's Within State- Regular $ 13,412 $ 13,4\2 $ 12,071 $ 1,341
Tuition- Other LEA's Within State- Special $ 523,200 28,518 551,718 394,119 157,599
Tuition to County Vocational Schoo!/Dist.-Reg. 14,900 (14,900)
Tuition to CSSD & Reg. Day Schools 1,859,000 736,280 2,595,280 2,584,663 10,617 Tuition to Private Schools Disabled W/1 State 1,589,766 {!' 114,407) 475,359 340,622 134,737
Tuition- State Facilities 56,000 11,230 67,230 67,230 Tuition- Other 174,700 (40,314) 134,386 6,360 128,026
Total Undistributed Expenditures- Instruction 4,217,566 (380,!81) 3,837,385 3,405,065 432,320
Attendance and Social Work Services
Salaries 695,550 39,700 735,250 617,984 1 !7,266
Other Purchased Services 1,700 1,700 820 880 Supplies and Materials 400 400 400
Total Attendance and Social Work Services 697,650 39,700 737,350 618,804 1 !8,546
Health Services
Salaries 1,004,070 (10,200) 993,870 975,176 18,694
Purchased Professional Technical Services 17,600 17,600 15,698 1,902
Other Purchased Services 7,300 7,300 4,337 2,963 Supplies and Materials 30,000 30,000 18,844 11,156
Total Health Services 1,058,970 (10,200) 1,048,770 1,014,055 34,715
Other Support Services-Speech, OT, PT and Related
Salaries 125,850 9,800 135,650 130,261 5,389
Purchased Professional Educational Services 468,200 (15,400) 452,800 313,945 138,855 Supplies and Materials 6,000 6,000 6,000
Total Other Support Services 600,050 (5,600) 594,450 444,206 150,244
Other Support Services- Students- Extra Serv.
Salaries 730,000 (5,400) 724,600 597,009 127,591 Purchased Professional Educational Services 300,000 28,555 328,555 269,061 59,494
Total Other Support Services- Students-
Extra Serv.- !,030,000 23,155 1,053,155 866,070 187,085
Guidance
Salaries of Other Professional Staff 1,314,000 37,800 1,351,800 1,338,054 13,746
Salaries of Secretarial and Clerical Assistants 149,950 149,950 147,516 2,434
Purchased Professional-Educational Services 10,000 (10,000)
Other Purchased Pro[ and Tech. Services 25,000 25,000 24,812 188
Other Purchased Services 25,000 25,000 16,401 8,599 Supplies and Materials 15,000 15,000 5,012 9,988
Total Guidance 1,513,950 52,800 1,566,750 1,53!,795 34,955
57 (Continued)

EXHIBITC-1
NORTH BERGEN BOARD OF EDUCATION
GENERAL FUND BUDGETARY COMPARISON SCHEDULE
FOR THE FISCAL YEAR ENDED .JUNE 30, 2014
Variance
Original Budget Final Final To Hudget Adjustments Budget Actual Actual
CURRENT EXPENDITURES (Continued)
Undistributed Expenditures (Continued)
Othe1· Support Services- Child Study Team
Salaries of Other Professional Staff $ 1,919,650 $ 80,075 $ 1,999,725 $ !,987,470 $ 12,255
Salaries of Secretarial and Clerical Assistants 268,350 17,000 285,350 264,684 20,666
Other Purchased Professional/Technical Services 108,800 108,800 92,950 15,850
Residential Costs 11,300 (10,775) 525 525
Misc. Purchased Services 18,000 24,700 42,700 42,276 424 Supplies and Materials 9,500 9,500 7,912 1,588
Total Other Support Services- Child Study Team 2,335,600 111,000 2,446,600 2,395,292 51,308
Improvement of Instruction Services
Salaries of Supervisors of Instruction 386,200 ( 1 79,560) 206,640 170,046 36,594
Salaries of Other Professional Staff 777,050 90,560 867,610 787,803 79,807
Purchased Prof. Educational Services 600 600 600
Other Purchased Professional/Technical Services 900 900 900
Other Purchased Services 2,000 2,000 61 1,939 Supplies and Materials 1,000 1,000 1,000
Total Improvement of Instruction Services 1,167,750 (89,000) 1,078,750 957,910 120,840
Educational Media Services/School Library
Salaries !66,400 68,6!5 235,015 223,865 11,150
Other Purchased Services 18,400 (15,000) 3,400 12 3,388 Supplies and Materials 54,200 (15,000) 39,200 36,832 2,368
Total Educational Media Services/School Library 239,000 38,6!5 277,615 260,709 16,906
Instructional Staff Training Services
Salaries of Other Professional Staff 541,300 11,200 552,500 542,413 10,087
Salaries of Secretarial and Clerical Assist. 3,200 3,200 2,500 700
Purchased Professional-Educational Serv. 85,400 23,000 108,400 80,639 27,761
Other Purchased Professional and Tech Svcs 4,000 (3,000) 1,000 250 750
Other Purchased Services 19,000 (15,000) 4,000 4,000
Supplies and Materials 11,000 (10,000) 1,000 1,000 Other Objects 10,000 (6,200) 3,800 3,800
Total instructional Staff Training Services 673,900 673,900 625,802 48,098
Support Services General Administration
Salaries I ,025,850 (59,250) 966,600 754,281 212,319
Legal Services 630,100 82,862 712,962 622,998 89,964
Audit Fees 100,000 1,500 !01,500 101,311 189
Expenditure and Internal Control Audit Fees 5,000 5,000 5,000
Architectural/Engineering Services 200,000 42,231 242,231 200,875 41,356
Other Purchased Pmfessional Services 211,000 4,088 215,088 175,736 39,352
Communications/Telephone 266,000 (20,910) 245,090 I 11,842 133,248
BOE Other Purchased Services 12,000 12,000 3,511 8,489
Other Purchased Services 97,400 (656) 96,744 47,000 49,744
Supplies and Materials 56,000 1,600 57,600 57,531 69
BOE In-House Training/Meeting Supplies 1,500 1,500 1,500
Judgments Against The School District 30,300 30,300 30,300
Miscellaneous Expenditures 7,600 7,600 2,446 5,154 BOE Membership Dues and Fees 60,000 60,000 35,573 24,427
Total Support Services General Administration 2,702,750 51,465 2,754,215 2,113,104 641,111
58 (Continued)
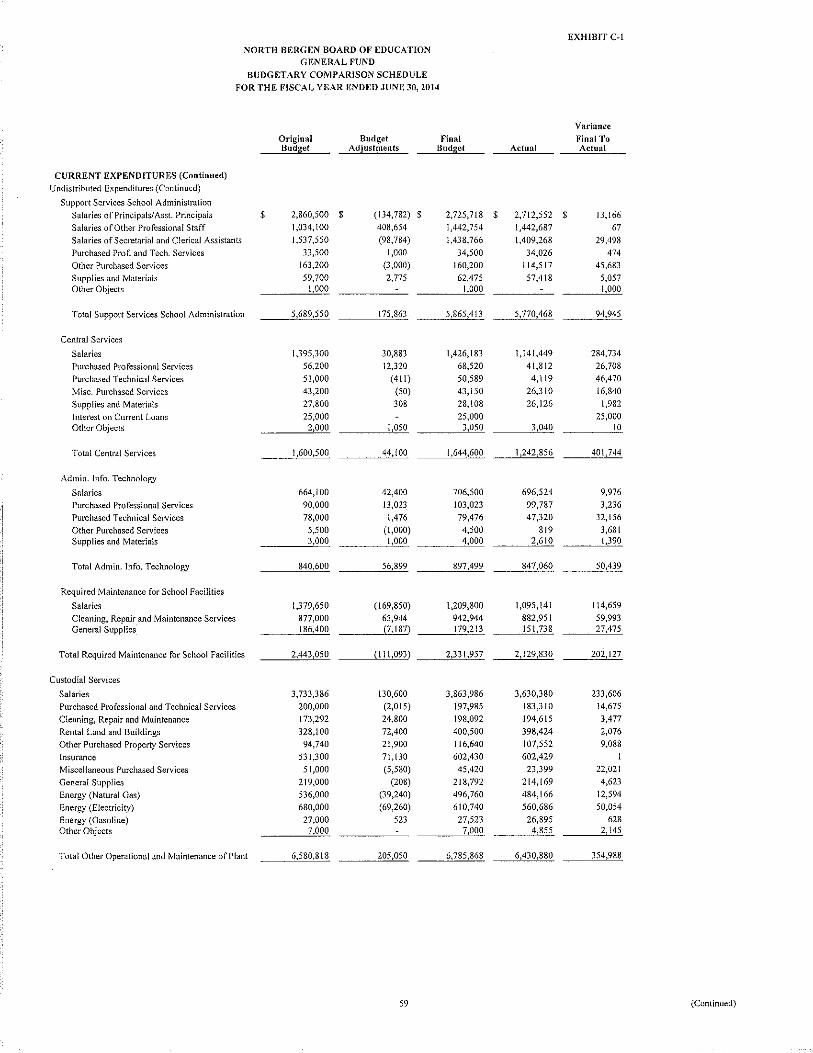
EXHIBIT C-1
NORTH BERGEN BOARD OF EDUCATION GENERAL FUND
BUDGETARY COMPARISON SCHEDULE
FOR THE FISCAL YEAR ENDED JUNE 30,2014
Variance
Original Budget Final Final To Budget Adjustments Budget Actual Actual
CURRENT EXPENDITURES (Continued)
Undistributed Expenditures (Continued}
Support Services School Administration
Salaries of Principals/Asst. Principals $ 2,860,500 $ (J34,782) 2,725,718 $ 2,712,552 $ 13,166
Salaries of Other Professional Staff 1,034,100 408,654 1,442,754 1,442,687 67
Salaries of Secretarial and Clerical Assistants I ,537,550 (98,784) l ,438,766 1,409,268 29,498 Purchased Prof. and Tech. Services 33,500 1,000 34,500 34,026 474
Other Purchased Services 163,200 (3,000) 160,200 114,517 45,683 Supplies and Materials 59,700 2,775 62,475 57,418 5,057 Other Objects 1,000 1,000 1,000
Total Support Services School Administration 5,689,550 175,863 5,865,413 5,770,468 94,945
Central Services
Salaries 1,395,300 30,883 1,426,183 1,141,449 284,734 Purchased Professional Services 56,200 12,320 68,520 41,812 26,708
Purchased Technical Services 51,000 (411) 50,589 4,119 46,470
Misc. Purchased Services 43,200 (50) 43,150 26,310 16,840
Supplies and Materials 27,800 308 28,108 26,126 1,982 !ntet·est on Current Loans 25,000 25,000 25,000 Other Objects 2,000 !,050 3,050 3,040 10
Total Central Services l ,600,500 44,100 1,644,600 1,242,856 40!,744
Admin. Info. Technology
Salaries 664,100 42,400 706,500 696,524 9,976 Purchased Professional Services 90,000 13,023 103,023 99,787 3,236
Purchased Technical Services 78,000 1,476 79,476 47,320 32,156
Other Purchased Services 5,500 (1,000) 4,500 819 3,681 Supplies and Materials 3,000 1,000 4,000 2,610 1,390
Total Admin. Info. Technology 840,600 56,899 897,499 847,060 50,439
Required Maintenance for School Facilities
Salaries 1,379,650 (169,850) 1,209,800 1,095,141 114,659
Cleaning, Repair and Maintenance Services 877,000 65,944 942,944 882,951 59,993 General Supplies 186,400 (7, 187) 179,213 151,738 27,475
Total Required Maintenance for School Facilities 2,443,050 (111,093) 2,33\,957 2,129,830 202,127
Custodial Services
Salaries 3,733,386 130,600 3,863,986 3,630,380 233,606 Purchased Professional and Technical Services 200,000 (2,015) 197,985 183,310 14,675
Cleaning, Repair and Maintenance 173,292 24,800 198,092 194,615 3,477
Rental Land and Buildings 328,100 72,400 400,500 398,424 2,076
Other Purchased Property Services 94,740 2!,900 116,640 107,552 9,088
Insurance 531,300 71,130 602,430 602,429
Miscellaneous Purchased Services 51,000 (5,580) 45,420 23,399 22,021
Genera! Supplies 219,000 (208) 218,792 214,169 4,623
Energy (Natural Gas) 536,000 (39,240) 496,760 484,166 12,594 Energy (Electricity) 680,000 (69,260) 610,740 560,686 50,054 Energy (Gasoline) 27,000 523 27,523 26,895 628 Other Objects 7,000 7,000 4,855 2,145
Total Other Operational and Maintenance of Plant 6,580,818 205,050 6,785,868 6,430,880 354,988
59 (Continued)

EXHIBIT C~l NORTH BERGEN BOARD OF IWUCATION
GENERAL FUND
BUDGETARY COMPARISON SCHEDULE FOR THE FISCAL YEAR ENDED JUNE 30, 2014
Variance Original Budget Final Filial To Budget Adjustments Budget Actual Actual
CURRENT EXPENDITURES (Continued) Undistributed Expenditures (Continued)
Care and Upkeep of Grounds Salaries $ 115,900 $ 1 !5,900 $ 10,379 $ 105,52! Purchased Professional and Technical Services 45,000 $ 221 45,221 40,613 4,608 Cleaning, Repair and Maintenance 6,206 (221) 5,985 2,795 3,190 General Supplies 1,500 1,500 1,202 298
Total Care and Upkeep of Grounds 168,606 168,606 54,989 113,617
Security Salaries 1,0!4,800 1,014,800 988,156 26,644 Purchased Professional and Technical Services 16,750 (3,240) 13,510 9,009 4,501 Cleaning, Repair and Maintenance 7,850 (5,750) 2,100 2,020 80 General Supplies 23,300 17,740 41,040 35,927 5,113
Total Security 1,062,700 8,750 1,071,450 1,035,! 12 36,338
Student Transportation Services Salaries for Pupil Transportation
(Between Home and School). Regular 97,700 97,700 72,540 25,160 Salaries for Pupil Transportation
(Between Home and School)- Special 65,750 65,750 57,808 7,942 Other Purchased Prof. and Tech. Sent. 13,000 13,000 13,000 Cleaning, Repair and Maintenance 23,700 1,719 25,419 10,911 14,508 Contracted Services (Between Home
and School)- Vendors I, 108,000 26,002 I, 134,002 l, 105,351 28,651 Contracted Services (Between Home
and School)- Joint Agreements 103,350 (11,702) 91,648 76,447 15,201 Contracted Services {Other Than Between Home
and School)- Vendors 155,600 22,198 177,798 88,424 89,374 Contracted Services (Spec Ed)-Vendors 736,900 228,020 964,920 945,063 19,857 Contracted Services (Spec Ed)-Joint Agreements 1,246,700 (36,800) 1,209,900 987,875 222,025 Misc. Purchased Services- Transportation 1,000 1,000 353 647 General Supplies 8,000 (1,600) 6,400 6,400 Transportation Supplies 9,500 1,60! 11,101 10,357 744 Aid in Lieu ofPaym.ents- Nonpublic School 462,861 (10,000) 452,861 341,067 111,794 Aid in Lieu of Payments- Charter Schools 30,789 {10,000) 20,789 10,166 10,623
Total Student Transpottation Services 4,062,850 209,438 4,272,288 3,706,362 565,926
Unallocated Benefits Group Insurance 3,\00 17,400 20,500 19,533 967 Social Security Contributions 1,219,000 35,300 1,254,300 1,254,258 42 Other Retirement Contributions~PERS 1,229,938 (1 ,225,253) 4,685 3,257 1,428 Other Retirement Contributions-ERIP 53,000 53,000 41,152 1 !,848 Other Retirement Contributions- Regular 1,175,315 1,175,315 1,034,026 141,289 Unemployment Compensation 254,700 254,700 254,700 Workmen's Compensation 520,000 (23,062) 496,938 493,891 3,047 Health Benefits 15,087,649 (195,700) 14,891,949 14,447,024 444,925 Other Employee Benefits 776,600 17,000 793,600 793,286 314
Total Unallocated Benefits 19,143,987 (199,000) 18,944,987 18,341,127 603,860
TP AF On Behalf
NCO! Premium 185,010 (185,010)
Pension Contribution 2,096,031 (2,096,031) Post Retirement 3,740,050 (3,740,050) Social Security Contribution 3,941,948 (3,94\,948)
Total On-Behalf Contributions 9,963,039 (9,963,039)
Total Undistributed Expenditures 57,829,847 221,761 58,051,608 63,754,535 (5,702,927)
Total Current Expenditures 105,804,323 278,976 106,083,299 110,837,457 {4,754,158)
60 (Continued)

EXHIBIT C-1 NORTH BERGEN BOARD OF EDUCATION
GENERAL FUND BUDGETARY COMPARISON SCHEDULE
FOR THE FISCAL YEAR ENDED JUNE 30,2014
Variance
Original Budget Final Final To Budget Adjustments Budget Actual Actual
CAPITAL OUTLAY Equipment
Grades 1-5 $ 15,000 $ 15,000 $ 10,080 $ 4,920
Grades 6-8 15,000 $ (15,000)
Grades 9-12 20,000 20,000 11,045 8,955
Basic Skills/Remedial- Instruction
Undistributed Expenditures
General Administration 15,000 15,000 15,000
School Administration
Central Services 10,000 10,000 \0,000
Admin. Info. Tech. 10,000 10,000 \0,000
Required Maintenance 45,185 5,000 50,185 49,712 473
Custodial
Care and Upkeep 8,500 8,500 8,500
Security 15,000 27,6! I 42,611 32,611 10,000
School Buses 12,600 12,600 12,600
Total Equipment 166,285 17,611 183,896 103,448 80,448
Facilities Acquisition and Construction Services
Legal Services 5,000 5,000 5,000
Arch itecturai/Engineeri ng 37,000 55,942 92,942 1,200 91,742
Construction Services 1,400,000 413 1,400,413 47,000 1,353,413
Land and Improvements 600,000 600,000 600,000 Assessment tOr Debt Service on SDA Funding 92,716 92,716 92,716
Total Facilities Acquis. and Const. Services 2,134,716 56,355 2,191,071 140,916 2,050,155
Total Capital Outlay 2,301,001 73,966 2,374,967 244,364 2,130,603
SPECIAL SCHOOLS Summer School· Instruction
Salaries of Teachers 350,650 38,053 388,703 388,703 Other Salaries for Instruction 63,900 33,583 . 97,483 97,483
Total Summer School· Instruction 414,550 71,636 486,186 486,\86
Summer School· Support Services Salaries of Teachers 29,900 [13,700) 16,200 !6,200
Total Summer School· Support Services 29,900 {13,700) 16,200 !6,200
Total Special Schools 444,450 57,936 502,386 502,386
Transfer of Funds To Charter Schools 183,681 11,700 195,381 187,780 7,60!
61 (Continued)
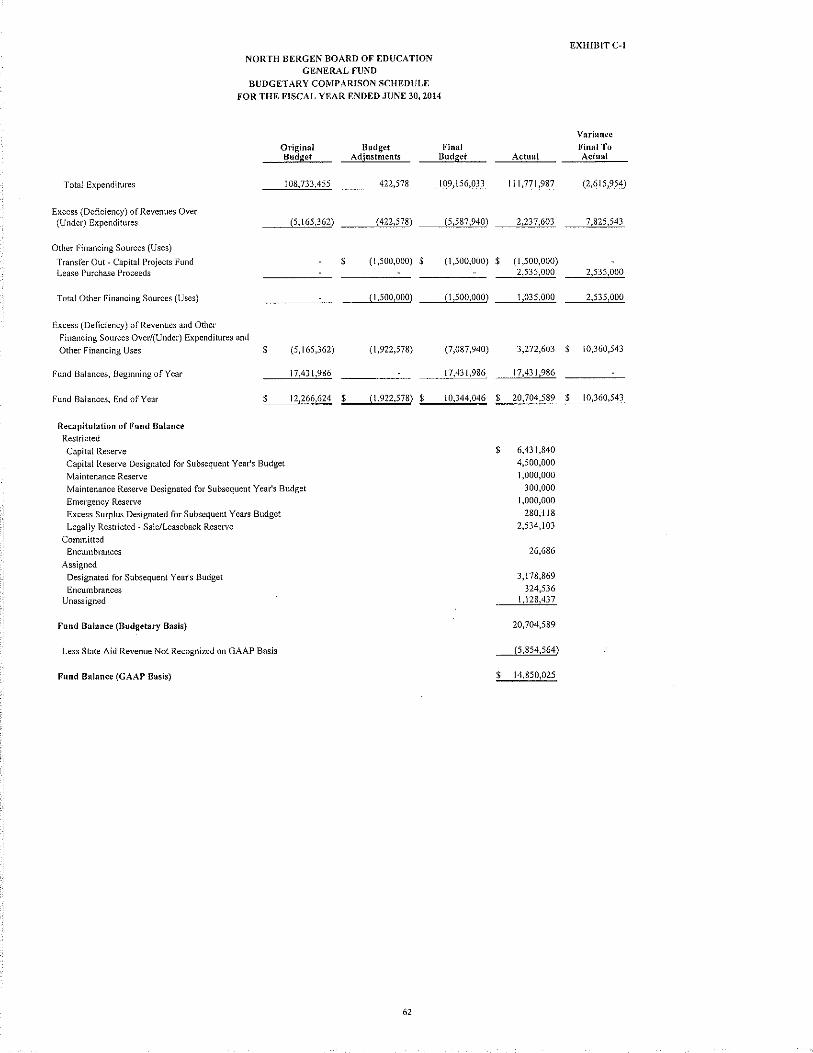
NORTH BERGEN BOARD OF EDUCATION GENERAL FUND
BUDGETARY COMPARISON SCHEDULE
FOR THE FISCAL YEAR ENDED JUNE 30, 2014
Original Budget
Total Expenditures
Excess (Deficiency) of Revenues Over (Under) Expenditures
Other Financing Sources (Uses)
Transfer Out- Capital Projects Fund Lease Purchase Proceeds
Total Other Financing Sources (Uses)
Excess (Deficiency) of Revenues and Other Financing Sources Over/(Under) Expenditures and
Other Financing Uses
Fund Balances, Beginning of Year
Fund Balances, End of Year
Recapitulation of Fund Balance Restricted
Capital Reserve
$
$
Capital Reserve Designated for Subsequent Year's Budget
Maintenance Reserve
108,733,455
(5,165,362)
(5,165,362)
17,431,986
12,266,624
Maintenance Reserve Designated for Subsequent Year's Budget
Emergency Reserve Excess Surplus Designated for Subsequent Years Budget
Legally Restricted- Sale/Leaseback Reserve
Committed Encumbrances
Assigned Designated fot' Subsequent Year's Budget
Encumbrances Unassigned
Fund Balance (Budgetary Basis)
Less State Aid Revenue Not Recognized on GAAP Basis
Fund Balance (GAAP Basis)
Budget Final Adjustments Budget
422,578 109,156,033
(422,578) (5,587,940)
$ (!,500,000) $ (1,500,000)
( 1 ,500,000) (1,500,000)
( 1 ,922,578) (7,087,940)
17,431,986
$ (I ,922,578) $ 10,344,046
62
EXHIBITC-1
Variance
Final To Actual Actual
111,771,987 (2,615,954)
2,237,603 7,825,543
$ (1,500,000) 2,535,000 2,535,000
1,035,000 2,535,000
3,272,603 $ 10,360,543
17,431,986
$ 20,704,589 $ 10,360,543
$ 6,431,840
4,500,000 1,000,000
300,000
1,000,000 280,118
2,534,103
26,686
3,178,869 324,536
1,128,437
20,704,589
(5,854,564)
$ 14,850,025
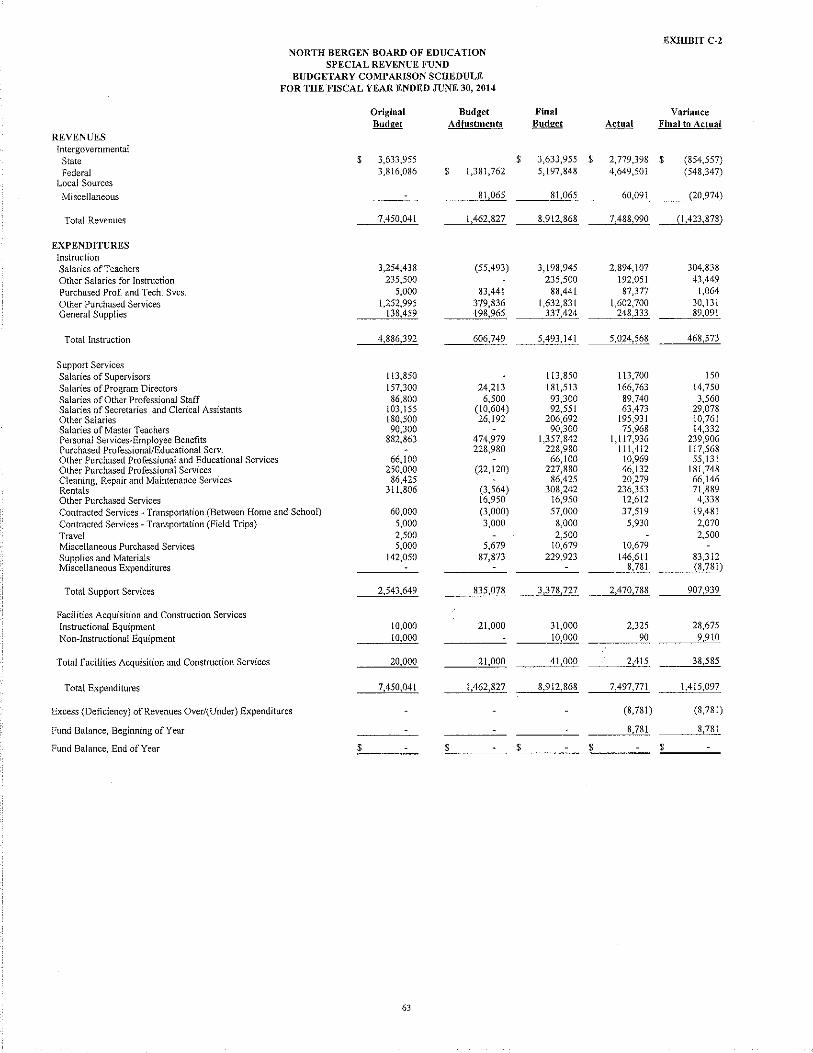
EXHIBIT C·2 NORTH BERGEN BOARD OF EDUCATION
SPECIAL REVENUE FUND BUDGETARY COMPARISON SCHEDULE
FOR THE 'FISCAL YEAR ENDED .ruNE 30,2014
Original Budget Final Variance Budget Adjustments Budget Actual Final to Actual
REVENUES Intergovernmental
State $ 3,633,955 $ 3,633,955 $ 2,779,398 $ (854,557)
Federal 3,816,086 $ 1,381,762 5,197,848 4,649,501 (548,347) Local Sources
Miscellaneous 81,065 81,065 60,091 (20,974)
Total Revenues 7,450,041 1,462,827 8,912,868 7,488,990 (l,423,878)
EXPENDITURES Instruction Salaries of Teachers 3,254,438 (55,493) 3,198,945 2,894,107 304,838
Other Salaries for Instruction 235,500 235,500 192,051 43,449
Purchased Prof. and Tech. Svcs. 5,000 83,441 88,441 87,377 1,064
Other Purchased Services [,252,995 379,836 1,632,831 1,602,700 30,\31 General Supplies [38,459 198,965 337,424 248,333 89,091
Total Instruction 4,886,392 606,749 5,493,141 5,024,568 468,573
Support Services Salaries of Supervisors 113,850 113,850 113,700 150 Salaries of Program Directors 157,300 24,213 181,513 166,763 14,750 Salaries of Other Professional Staff 86,800 6,500 93,300 89,740 3,560 Salaries of Secretaries and Clerical Assistants 103,155 (10,604) 92,551 63,473 29,078 Other Salaries [80,500 26,192 206,692 195,931 10,761 Salaries of Master Teachers 90,300 90,300 75,968 14,332 Personal Services· Employee Benefits 882,863 474,979 1,357,842 1,117,936 239,906 Purchased Professional/Educational Serv. 228,980 228,980 111,412 117,568 Other Purchased Professional and Educational Services 66,100 66,100 10,969 55,131 Other Purchased Professional Services 250,000 (22,120) 227,880 46,132 181,748 Cleaning, Repair and Maintenance Services 86,425 86,425 20,279 66,146 Rentals 311,806 (3,564) 308,242 236,353 71,889 Other Purchased Services 16,950 16,950 12,612 4,338
Contracted Services· Transportation (Between Home and School) 60,000 (3,000) 57,000 37,519 19,481
Contracted Services· Transportation (Field Trips) 5,000 3,000 8,000 5,930 2,070 Travel 2,500 2,500 2,500 Miscellaneous Purchased Services 5,000 5,679 10,679 10,679
Supplies and Materials 142,050 87,873 229,923 146,611 83,312 Miscellaneous Expenditures 8,781 (8,78l)
Total Support Services 2,543,649 835,078 3,378,727 2,470,788 907,939
Facilities Acquisition and Construction Services Instructional Equipment lO,OOO 21,000 31,000 2,325 28,675
Non· Instructional Equipment 10,000 !0,000 90 9,910
Total Facilities Acquisition and Construction Services 20,000 21,000 41,000 2,415 38,585
Total Expenditures 7,450,04[ 1,462,827 8,912,868 7,497,77l 1,4!5,097
Excess (Deficiency) of Revenues Over/(Under) Expenditures (8,78l) (8,78!)
Fund Balance, Beginning of Year 8,78[ 8,781
Fund Balance, End of Year $ $ $ $ $
63

NORTH BERGEN BOARD OF EDUCATION REQUIRED SUPPLEMENTARY INFORMATION
BUDGETARY COMPARISON SCHEDULE NOTES TO THE REQUIRED SUPPLEMENTARY INFORMATION
FOR THE FISCAL YEAR ENDED JUNE 30, 2014
EXHIBIT C-3
Formal budgetary integration into the accounting system is employed as a management control device during the year. For governmental funds there are no substantial differences between the budgetary basis of accounting and accounting principles generally accepted in the United States of America, with the exception of the legally mandated revenue recognition of certain state aid payments for budgetary purposes only and the treatment of encumbrances in the special revenue fund as described below. Encumbrance accounting is also employed as an extension of formal budgetary integration of the govemmental fund types. Unencumbered appropriations lapse at fiscal year end.
The accounting records of the Special Revenue Funds are maintained on the grant accounting budgetary basis. The grant accounting budgetary basis differs from GAAP in that the grant accounting budgetary basis recognizes encumbrances as expenditures and also recognizes the related revenues, whereas the GAAP basis does not. Sufficient supplemental records are maintained to allow for the presentation of GAAP basis financial reports.
The following presents a reconciliation of the General and Special Revenue Funds from the budgetary basis of accounting as presented in the Budgetary Comparison Schedule- General Fund and Special Revenue Fund to the GAAP basis of accounting as presented in the Statement of Revenues, Expenditures and Changes in Fund Balance- Governmental Funds.
Sources/Inflows of Resources Actual amounts (budgetary basis) 11 revenues11
from the budgetary comparison schedule (Exhibits C-l,C-2)
Difference- budget to GAAP: State Aid payments recognized for budgetary purposes, not recognized
for GAAP statements (2013-20!4) State Aid payment recognized for GAAP statements, not recognized
for budgetary purposes (2012-2013) Grant accounting budgetary basis differs from GAAP in that encumbrances are recognized as expenditures, and the related revenue is recognized.
Encumbrances, June 30, 2014
Encumbrances, June 30, 2013 (net of cancellations)
Total revenues as reported on the statement of revenues, expenditures and changes in fund balances -governmental funds (Exhibit B-2)
Uses/Outflows of Resources Actual amounts (budgetary basis) 11total outflows!! from the
budgetary comparison schedule (Exhibits C-1, C-2)
Differences - budget to GAAP Encumbrances for supplies and equipment ordered but
not received are reported in the year the order is placed for budgetary purposes, but in the year the supplies are received for financial reporting purposes.
Encumbrances, June 30, 2014
Encumbrances, June 30, 2013 (net of cancellations)
Total expenditures as reported on the statement of revenues, expenditures, and changes in fund balances - governmental funds (Exhibit B-2)
64
General Fund
$ 114,009,590 $
(5,854,564)
5,775,412
Special Revenue
Fund
7,488,990
(25,347)
83,448
$ 113,930,438 ;:,.$ ~7:_,;.5;;;:4~7,:;;;09~1
$ 111,771,987 $ 7,497,771
(25,347)
83,448
$ 1!1,77!,987 ;;;,$ ~7"',5"'5"'5,;;,;87,;;,2

SPECIAL REVENUE FUND
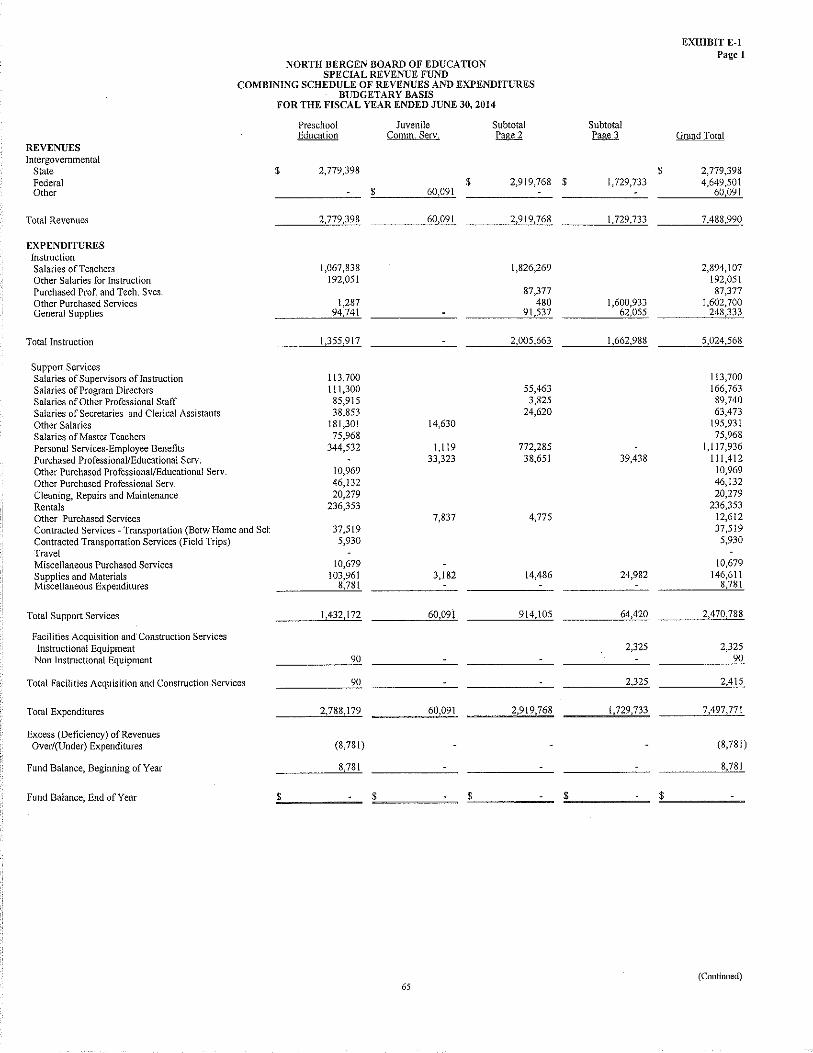
EXHIBIT E·l Page 1
NORTH BERGEN BOARD OF EDUCA TlON SPECIAL REVENUE FUND
COMBINING SCHEDULE OF REVENUES AND EXPENDITURES BUDGETARY BASIS
FOR THE FISCAL YEAR ENDED JUNE 30, 2014
Preschool Juvenile Subtotal Subtotal Education Comm. Serv. Page 2 Page 3 Grand Total
REVENUES Intergovernmental
State $ 2,779,398 $ 2,779,398 Federal $ 2,919,768 $ 1,729,733 4,649,501 Other $ 60,091 60,091
Total Revenues 2,779,398 60,091 2919768 1,729,733 7,488,990
EXPENDITURES Instruction Salaries of Teachers 1,067,838 1,826,269 2,894,107 Other Salaries for Instruction 192,051 192,051 Purchased Prof. and Tech. Svcs. 87,377 87,377 Other Purchased Services 1,287 480 1,600,933 1,602,700 General Supplies 94,741 91,537 62,055 248,333
Total Instruction 1,355,917 2,005,663 1,662,988 5,024,568
Support Services Salaries of Supervisors oflnstruction 113,700 113,700 Salaries of Program Directors 111,300 55,463 166,763 Salaries of Other Professional Staff 85,915 3,825 89,740 Salaries of Secretaries and Clerical Assistants 38,853 24,620 63,473
Other Salaries 181,301 14,630 195,931 Salaries of Master Teachers 75,968 75,968 Personal Services· Employee Benefits 344,532 1,119 772,285 1,117,936
Purchased Professional/Educational Serv. 33,323 38,651 39,438 111,412 Other Purchased Professional/Educational Serv. 10,969 10,969
Other Purchased Professional Serv. 46,132 46,132 Cleaning, Repairs and Maintenance 20,279 20,279
Rentals 236,353 236,353 Other Purchased Services 7,837 4,775 12,612 Contracted Services · Transportation (Betw Home and Set 37,519 37,519 Contracted Transportation Services (Field Trips) 5,930 5,930 Travel Misce!laneous Purchased Services 10,679 10,679 Supplies and Materials 103,961 3,182 14,486 24,982 146,611 Miscellaneous Expenditures 8,781 8,781
Total Support Services 1,432,172 60,09\ 914,105 64,420 2,470,788
Facilities Acquisition and" Construction Services Instructional Equipment 2,325 2,325
Non Instructional Equipment 90 90
Total Facilities Acquisition and Construction Services 90 2,325 2,415
Total Expenditures 2,788,179 60,091 2,919,768 1,729,733 7,497,771
Excess (Deficiency) of Revenues Over/(Under) Expenditures (8,781) (8,781)
Fund Balance, Beginning of Year 8,781 8,781
Fund Balance, End of Year $ $ $ $ $
(Continued) 65
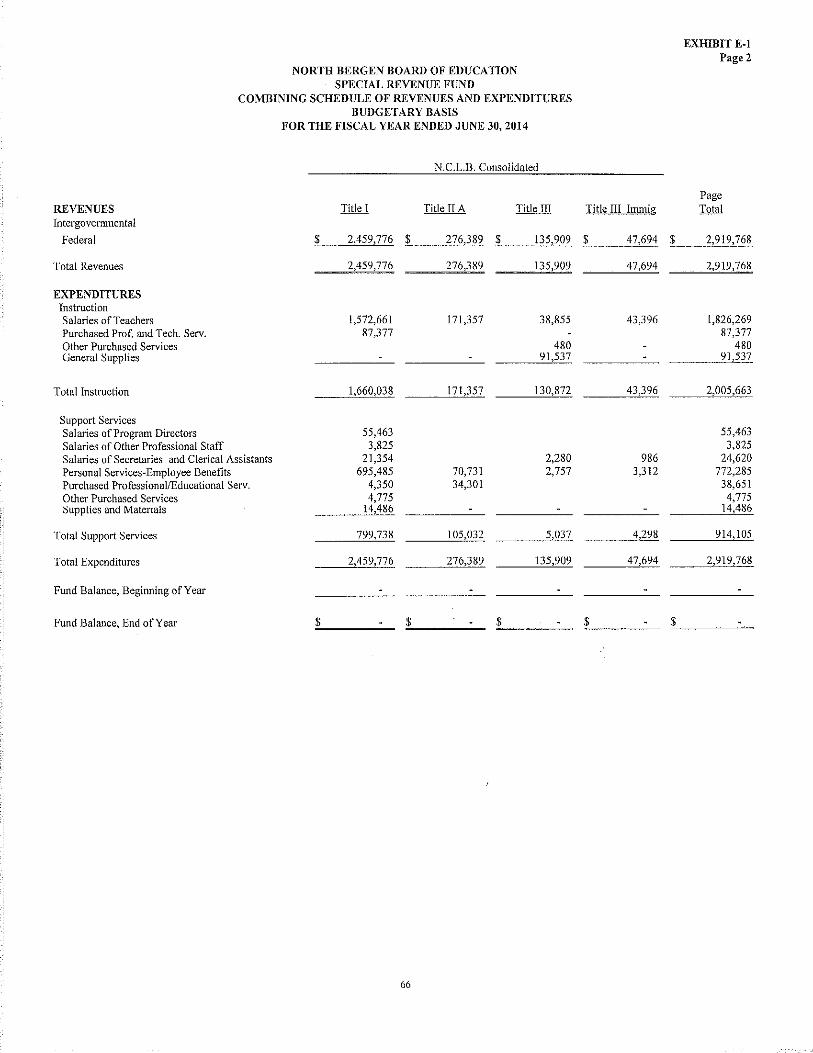
EXHIBIT E-1 Page 2
NORTH BERGEN BOARD OF EDUCATION SPECIAL REVENUE FUND
COMBINING SCHEDULE OF REVENUES AND EXPENDITURES BUDGETARY BASIS
FOR THE FISCAL YEAR ENDED JUNE 30, 2014
N.C.L.B. Consolidated
Page REVENUES Title 1 Title II A Title III Title III Irnmig Total Intergovernmental
Federal $ 2,459,776 $ 276,389 $ 135,909 $ 47,694 $ 2,919,768
Total Revenues 2,459,776 276,389 135,909 47,694 2,919,768
EXPENDITURES Instruction Salaries of Teachers 1,572,661 171,357 38,855 43,396 1,826,269 Purchased Prof. and Tech. Serv. 87,377 87,377 Other Purchased Services 480 480 General Supplies 91,537 91,537
Total Instruction 1,660,Q38 171,357 130,872 43,396 2,005,663
Support Services Salaries of Program Directors 55,463 55,463 Salaries of Other Professional Staff 3,825 3,825 Salaries of Secretaries and Clerical Assistants 21,354 2,280 986 24,620 Personal Services-Employee Benefits 695,485 70,731 2,757 3,312 772,285 Purchased Professional/Educational Serv. 4,350 34,301 38,65 I
Other Purchased Services 4,775 4,775 Supplies and Materials 14,486 14,486
Total Support Services 799,738 105,032 5,037 4,298 914,105
Total Expenditures 2,459,776 276,389 135,909 47,694 2,919,768
Fund Balance, Beginning of Year
Fund Balance, End of Year $ $ $ $ $
66
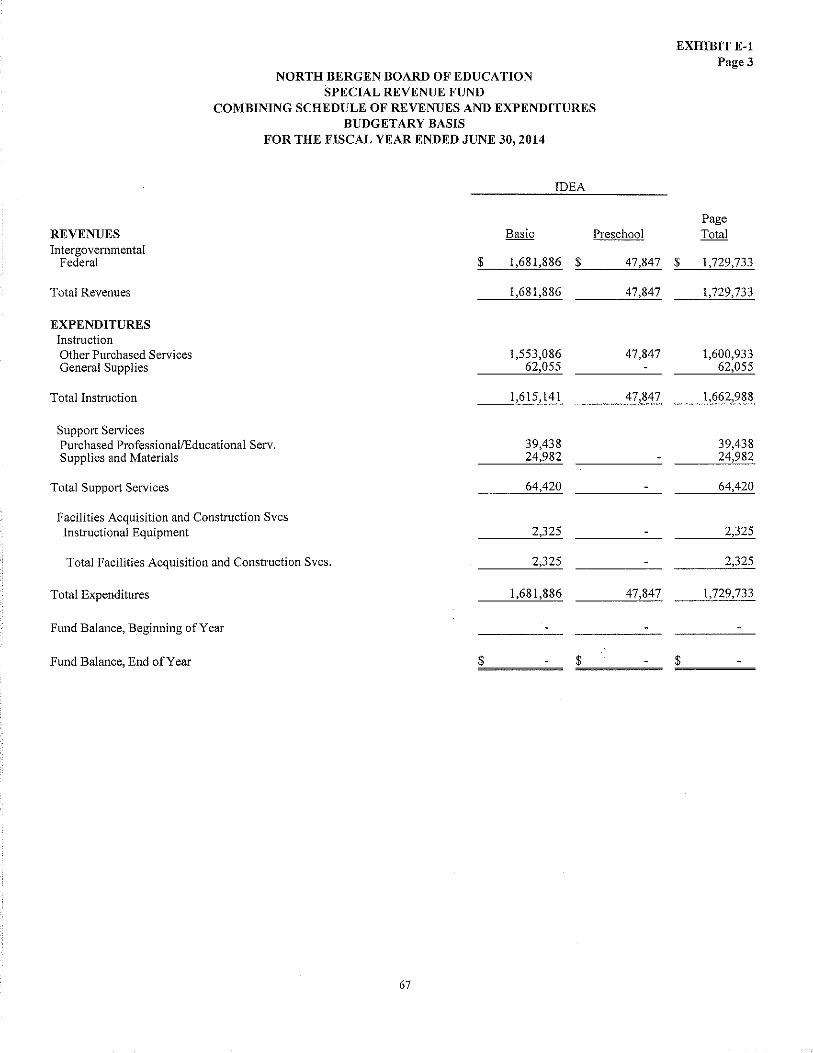
NORTH BERGEN BOARD OF EDUCATION SPECIAL REVENUE FUND
COMBINING SCHEDULE OF REVENUES AND EXPENDITURES BUDGETARY BASIS
FOR THE FISCAL YEAR ENDED JUNE 30, 2014
IDEA
REVENUES Intergovernmental
Federal
Basic Preschool
Total Revenues
EXPENDITURES Instruction Other Purchased Services General Supplies
Total Instruction
Support Services Purchased Professional/Educational Serv. Supplies and Materials
Total Support Services
Facilities Acquisition and Construction Svcs Instructional Equipment
Total Facilities Acquisition and Construction Svcs.
Total Expenditures
Fund Balance, Beginning of Year
Fund Balance, End of Year
67
$
$
1,681,886
1,681,886
1,553,086 62,055
1,615,141
39,438 24,982
64,420
2,325
2,325
1,681,886
$ 47,847
47,847
47,847
47,847
47,847
$
EXHIBIT E-1 Page 3
$
$
Page Total
1,729,733
1,729,733
1,600,933 62,055
1,662,988
39,438 24,982
64,420
2,325
2,325
1,729,733

NORTH BERGEN BOARD OF EDUCATION SPECIAL REVENUE FUND
PRESCHOOL EDUCATION AID
SCHEDULE OF EXPENDITURES- BUDGETARY BASIS FOR THE FISCAL YEAR ENDED JUNE 30, 2014
District-Wide Total
Budgeted
EXPENDITURES Instruction
Salaries of Teachers $ I ,267,200 Other Salaries of Instruction 235,500 Other Purchased Services 11,900 General Supplies 95,220
Total Instruction I ,609,820
Support Services Salaries of Supervisors I \3,850 Salaries of Program Directors 126,050 Salaries of Other Professional Staff 86,800 Salaries of Secretaries and Clerical Assistants 67,050 Other Salaries 181,500 Salaries of Master Teachers 90,300 Personal Services - Employee Benefit: 450,324 Other Purchased Professional Educational Services 66,100 Other Purchased Professional Services 227,880 Cleaning, Repairs and Maintenance 86,425 Rentals 308,242 Contracted Transportation Services (Between Home and School) 57,000 Contracted Transportation Services (Field Trips) 8,000 Travel 2,500 Miscellaneous Purchased Services 10,679 Supplies and Materials 121,435 Miscellaneous Expenditures
Total Support Services 2,004,135
Facilities Acquisition and Construction Services
Instructional Equipment 10,000
Non Instructional Equipment 10,000
Total Facilities Acquisition and Construction Services 20,000
Total Expenditures $ 3,633,955
Total Revised 2013-20 14 Preschool Education Aid Allocation Actual Preschool Education Aid Carryover (June 30, 20 13) Add: Prior Year Adjustment
Total Preschool Education Aid Funds Available for 2013-2014 Budget Less: 2013-2014 Budgeted Preschool Education Aid
(including Prior Year Budgeted Carryover)
Available & Unbudgeted Preschool Education Aid Funds as of June 30, 2014
Add: 2013-2014 Unexpended Preschool Education Aid
2013-2014 Carryover- Preschool Education Aid/Preschool
20 13~20 14 Preschool Education Aid Carryover Budgeted for Preschool Programs 20 14-15
68
EXHIBIT E-2
Variance
$ I ,067,838 $ 199,362 192,051 43,449
1,287 10,613 94,741 479
I ,355,917 253,903
I 13,700 150 Ill ,300 14,750 85,915 885 38,853 28,197
181,301 199 75,968 14,332
344,532 105,792 10,969 55,131 46,132 181,748 20,279 66,146
236,353 71,889 37,519 19,481
5,930 2,070 2,500
10,679 103,961 17,474
8,781 (8,781)
1,432,172 571,963
10,000
90 9,910
90 19,910
$ 2,788,179 $ 845,776
$ 3,181,245 1,758,668
8,781
4,948,694
3,633,955
1,314,739
845,776
$ 2,160,515
$ I, 758,668

CAPITAL PROJECTS FUND

NORTH BERGEN BOARD OF EDUCATION CAPITAL PROJECTS FUND
SUMMARY SCHEDULE OF PROJECT EXPENDITURES FOR THE FISCAL YEAR ENDED JUNE 30,2014
ExQenditures to Date Modified
Issue/Project Title Appropriations Prior Years Current Year
Lease Purchase 1998- Various Impvts. $ 9,000,000 $ 8,313,951 Lease Purchase 1999- Various Impvts. 10,120,852 9,985,860
SDA Projects: Franklin Elementary School Rehabilitation-
Window Replacement 1,184,585 1,184,401 Lincoln Elementary School Rehabilitation-
Window Replacement 1,032,766 1,032,583 North Bergen High School Addition and Rehabilitation-
Guidance and Health Suites 1,646,557 1,473,724 $ 2,690 North Bergen High School Rehabilitation-
Brick Fayade Repair and Restoration 820,513 735,994 33,664
Horace Mann Elementary School Rehabilitation-Window Replacement and Exterior Doors 2,504,644 2,264,313 86,585
Robert Fulton Elementary School Rehabilitation-Window Replacement and Exterior Doors 2,474,430 110,424 10,462
McKinley Elementary School Rehabilitation-Window Replacement 1,110,046 78,357
McKinley Elementary School Rehabilitation-Exterior Masonry, Fayade, and Sealants 280,810 6,318 Robert Fulton Elementary School Rehabilitation-
Roof Replacement and Masonry Repairs 776,450 2,295 Robert Fulton Elementary School Rehabilitation-
Basement Foundation and Exterior Walls 131,971 North Bergen High School Rehabilitation 159,540 North Bergen High School Rehabilitation
Fire Alarm System Upgrades 1,890,785
Lincoln Elementary School Rehabilitation-Exterior Masonry, Fayade, and Sealants 507,539 7,875
Horace Mann Elementary School Rehabilitation-Roof Replacement and Masonry Repairs 738,650 2,430
McKinley Elementary School Rehabilitation-Security Camera Installation 148,107
Lincoln Elementary School Rehabilitation-Security Camera Installation 221,656
John F. Kennedy Elementary School Security Camera Installation 153,322
Horace Mann Elementary School Rehabilitation-Security Camera Installation 171,904
Franklin Elementary School Rehabilitation-Security Camera Installation 151,603
Robert Fulton Elementary School Rehabilitation-Security Camera Installation 205,485
$ 35,432,215 $ 25,101,250 $ 230,676
69
EXHIBIT F-1
Balance, .June 30, 2014
$ 686,049
134,992
184
183
170,143
50,855
153,746
2,353,544
1,031,689
274,492
774,155
131,971
159,540
1,890,785
499,664
736,220
148,107
221,656
153,322
171,904
151,603
205,485
$ 10,100,289

NORTH BERGEN BOARD OF EDUCATION CAPITAL PROJECTS FUND
SUMMARY SCHEDULE OF PROJECT EXPENDITURES FOR THE FISCAL YEAR ENDED JUNE 30,2014
Reconciliation of Project Balances to Fund Balance Project Balances at June 30,2014 Less: Unrealized Transfer from Capital Reserve
Budgeted in 2014/2015
Fund Balance, Budgetary Basis Less: Unrealized Revenue SDA Grants
Fund Balance (GAAP)
Recapitulation of Fund Balance Restricted for Capital Projects
Year-End Encumbrances Available for Capital Projects
Total Fund Balance- Restricted for Capital Projects
70
EXHIBIT F-1
$ 10,100,289
(1,455,777)
$ 8,644,512 (4,963,886)
$ 3,680,626
$ 2,726,142 954,484
$ 3,680,626
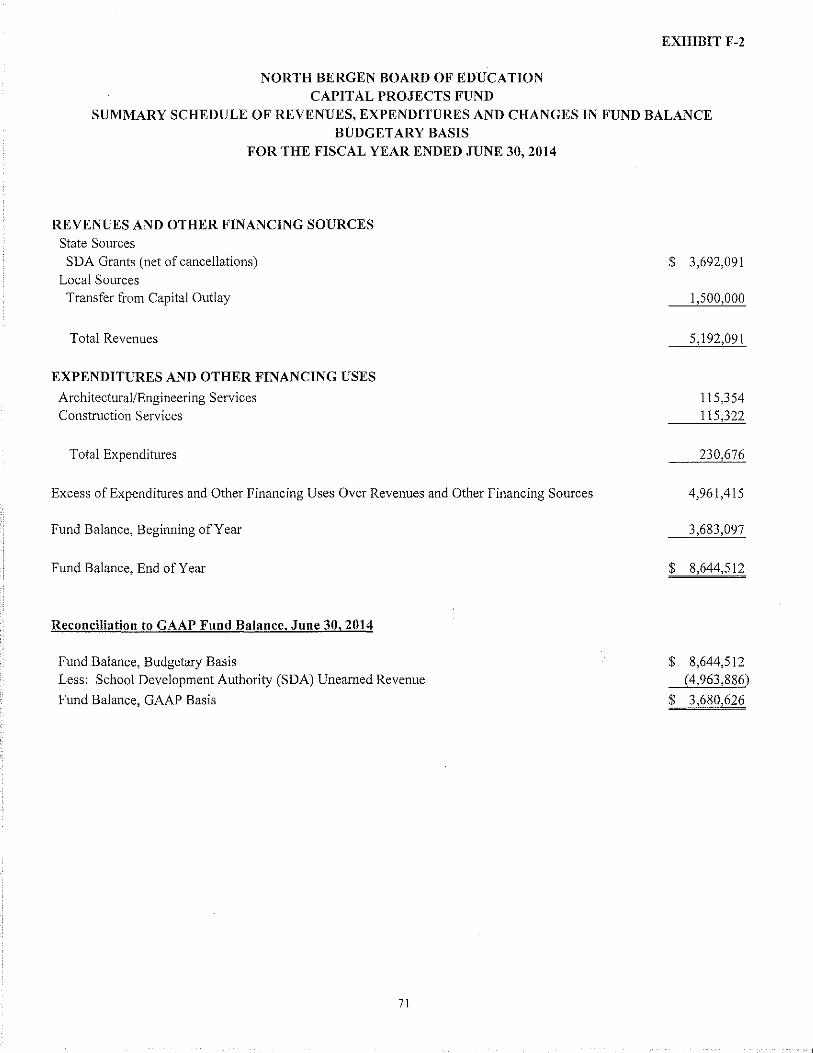
NORTH BERGEN BOARD OF EDUCATION CAPITAL PROJECTS FUND
EXHIBIT F-2
SUMMARY SCHEDULE OF REVENUES, EXPENDITURES AND CHANGES IN FUND BALANCE BUDGETARY BASIS
FOR THE FISCAL YEAR ENDED JUNE 30, 2014
REVENUES AND OTHER FINANCING SOURCES State Sources
SDA Grants (net of cancellations)
Local Sources Transfer from Capital Outlay
Total Revenues
EXPENDITURES AND OTHER FINANCING USES
Architectural/Engineering Services Construction Services
Total Expenditures
Excess of Expenditures and Other Financing Uses Over Revenues and Other Financing Sources
Fund Balance, Beginning of Year
Fund Balance, End of Year
Reconciliation to GAAP Fund Balance, June 30, 2014
Fund Balance, Budgetary Basis Less: School Development Authority (SDA) Unearned Revenue
Fund Balance, GAAP Basis
71
$ 3,692,091
1,500,000
5,192,091
115,354 115,322
230,676
4,961,415
3,683,097
$ 8,644,512
$ 8,644,512 (4,963,886)
$ 3,680,626

NORTH BERGEN BOARD OF EDUCATION CAPITAL PROJECTS FUND
EXHIBIT F-2a
SCHEDULE OF PROJECT REVENUES, EXPENDITURES, PROJECT BALANCES AND PROJECT STATUSFRANKLIN ELEMENTARY SCHOOL REHABILITATION- WINDOW REPLACEMENT
FROM INCEPTION THROUGH THE FISCAL YEAR ENDED JUNE 30, 2014
Revenues and Other Financing Sources State Sources - SDA Grant Local Sources
Total Revenues
Expenditures and Other Financing Uses Architectural/Engineering Services Construction Services
Total Expenditures and Other Financing Uses
$
Prior Periods
687,461 497,124
1,184,585
168,627 1,015,774
1,184,401
Excess (Deficiency) of Revenues Over (Under) Expenditures $
Additional Project Information: Project Number Grant Date Original Authorized Cost Adjustment Revised Authorized Cost
Percentage Increase over Original Authorized Cost
Percentage Completion Original Target Completion Date Revised Target Completion Date
3610-060-09-1008 May 1, 2009
1,751,403 (566,818)
1,184,585
-32% 100%
February 1, 2011 February I, 2013
72
Current Year
$ $
$
Totals
687,461 497,124
1,184,585
168,627 1,015,774
1,184,401
$
Revised Authorized
Cost
687,461 497,124
1,184,585
142,150 1,042,435
1,184,585
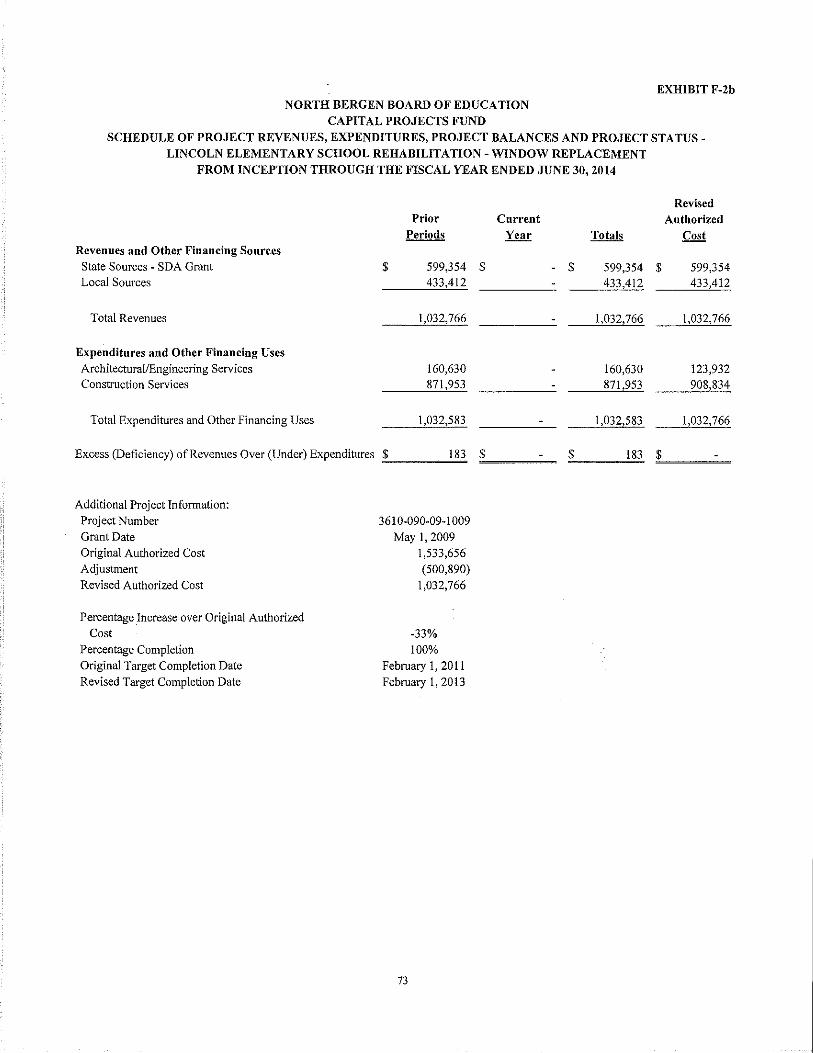
NORTH BERGEN BOARD OF EDUCATION CAPITAL PROJECTS FUND
EXHIBIT F-2b
SCHEDULE OF PROJECT REVENUES, EXPENDITURES, PROJECT BALANCES AND PROJECT STATUSLINCOLN ELEMENTARY SCHOOL REHABILITATION- WINDOW REPLACEMENT
FROM INCEPTION THROUGH THE FISCAL YEAR ENDED JUNE 30, 2014
Revenues and Other Financing Sources State Sources - SDA Grant Local Sources
Total Revenues
Expenditures and Other Financing Uses ArchitecturaVEngineering Services Construction Services
Total Expenditures and Other Financing Uses
$
Prior Periods
599,354 433,412
1,032,766
160,630 871,953
1,032,583
Excess (Deficiency) of Revenues Over (Under) Expenditures $
Additional Project Infonnation:
Project Number Grant Date
Original Authorized Cost Adjustment Revised Authorized Cost
Percentage Increase over Original Authorized
Cost
Percentage Completion Original Target Completion Date
Revised Target Completion Date
3610-090-09-1009
May 1, 2009 1,533,656
(500,890)
1,032,766
-33%
100% February 1, 2011
February 1, 2013
73
Current Year Totals
$ $ 599,354 433,412
1,032,766
160,630 871,953
1,032,583
$ 183
Revised Authorized
Cost
$ 599,354 433,412
1,032,766
123,932 908,834
1,032,766
$

NORTH BERGEN BOARD OF EDUCATION CAPITAL PROJECTS FUND
EXHIBIT F-2c
SCHEDULE OF PROJECT REVENUES, EXPENDITURES, PROJECT BALANCES AND PROJECT STATUSNORTH BERGEN HIGH SCHOOL ADDITION AND REHABILITATION
FROM INCEPTION THROUGH THE FISCAL YEAR ENDED JUNE 30, 20I4
Revenues and Other Financing Sources State Sources - SDA Grant Local Sources
Total Revenues
Expenditures and Other Financing Uses Architectural/Engineering Services Construction Services
Total Expenditures and Other Financing Uses
Excess (Deficiency) of Revenues Over (Under) Expenditures
Additional Project Information:
Project~urnber
Grant Date
Original Authorized Cost
Additional Authorized Cost Revised Authorized Cost
Percentage Increase over Original Authorized
Cost
Percentage Completion Original Target Completion Date
Revised Target Completion Date
Prior Periods
$ 827,591 818,966
1,646,557
236,820 1,236,904
1,473,724
$ 172,833
3610-050-09-1010
July 29,2009 1,499,212
147,345
1,646,557
10% 89%
December 15,2010
December 31,2013
74
Current Year Totals
$ 827,591 $ 818 966
1,646,557
2,690 239,510 1,236 904
2,690 1,476 414
$ (2,690) $ 170,143
Revised Authorized
Cost
$ 827,591 818,966
1,646,557
197,587 1,448,970
1,646,557
$
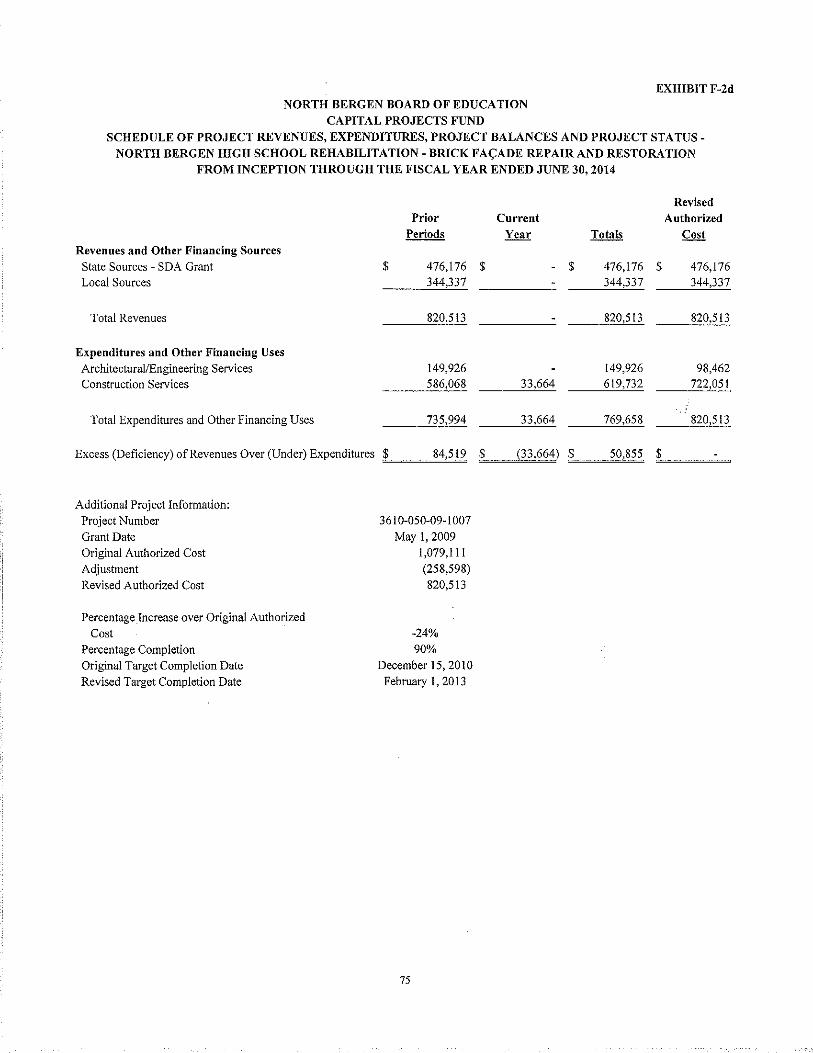
NORTH BERGEN BOARD OF EDUCATION CAPITAL PROJECTS FUND
EXHIBIT F-2d
SCHEDULE OF PROJECT REVENUES, EXPENDITURES, PROJECT BALANCES AND PROJECT STATUSNORTH BERGEN HIGH SCHOOL REHABILITATION- BRICK FAcADE REPAIR AND RESTORATION
FROM INCEPTION THROUGH THE FISCAL YEAR ENDED JUNE 30, 2014
Revenues and Other Financing Sources State Sources - SDA Grant Local Sources
Total Revenues
Expenditures and Other Financing Uses Architectural/Engineering Services Construction Services
Total Expenditures and Other Financing Uses
$
Prior Periods
476,176 $ 344,337
820,513
149,926 586,068
735,994
Excess (Deficiency) of Revenues Over (Under) Expenditures $ 84,519 $
Additional Project Information:
Project~urnber
Grant Date
Original Authorized Cost
Adjustment Revised Authorized Cost
Percentage Increase over Original Authorized
Cost
Percentage Completion Original Target Completion Date
Revised Target Completion Date
3610-050-09-1007
May 1, 2009 1,079,111
(258,598)
820,513
-24%
90% December 15,2010
February 1, 2013
75
Current Year
33,664
33,664
$
(33,664) $
476,176 $ 344,337
820,513
149,926 619,732
769,658
Revised Authorized
Cost
476,176 344,337
820,513
98,462 722,051
820,513
50,855 ;:;.$ ~~~~
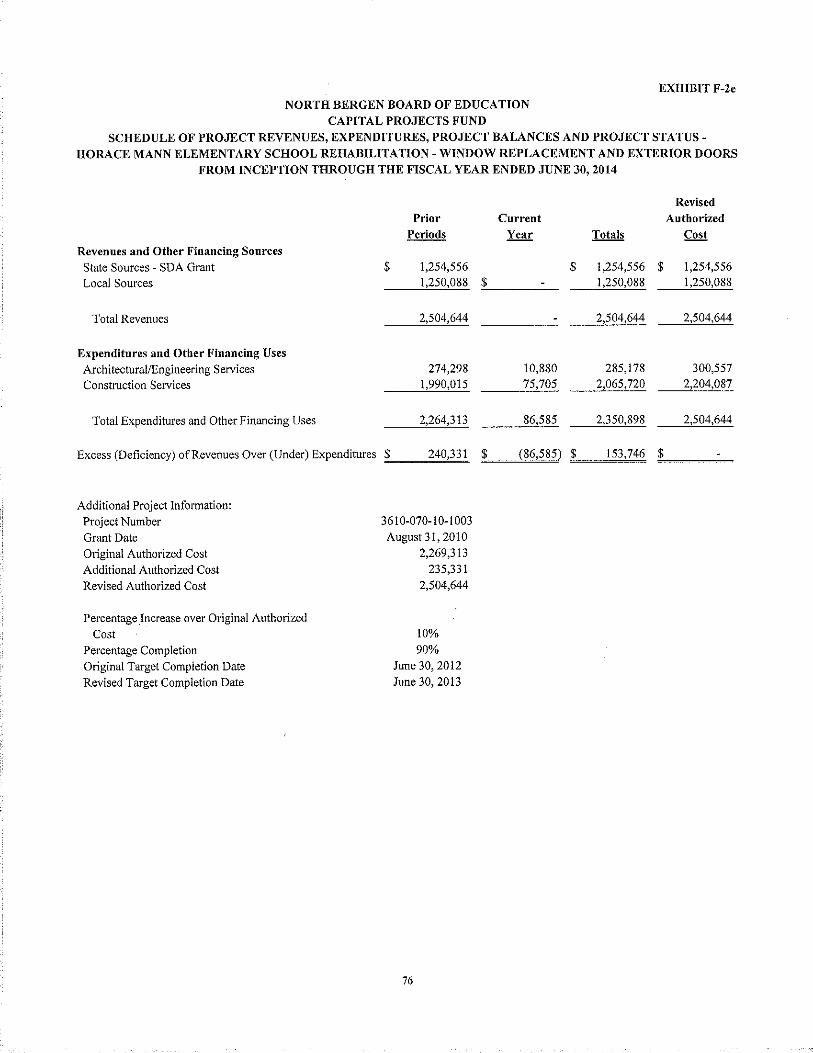
NORTH BERGEN BOARD OF EDUCATION CAPITAL PROJECTS FUND
EXHIBIT F-2e
SCHEDULE OF PROJECT REVENUES, EXPENDITURES, PROJECT BALANCES AND PROJECT STATUSHORACE MANN ELEMENTARY SCHOOL REHABILITATION -WINDOW REPLACEMENT AND EXTERIOR DOORS
FROM INCEPTION THROUGH THE FISCAL YEAR ENDED JUNE 30, 2014
Revenues and Other Financing Sources State Sources- SDA Grant $
Prior Periods
1,254,556
Current Year
Revised Authorized
Cost
Local Sources 1,250,088 :!:_$ ___ _
$ I ,254,556 $ 1,250,088
1,254,556 1,250,088
Total Revenues
Expenditures and Other Financing Uses Architectural/Engineering Services Construction Services
Total Expenditures and Other Financing Uses
2,504,644
274,298 1,990,015
2,264,313
Excess (Deficiency) ofRevenues Over (Under) Expenditures $ 240,331 $
Additional Project Information:
Project Number Grant Date Original Authorized Cost Additional Authorized Cost Revised Authorized Cost
Percentage Increase over Original Authorized Cost
Percentage Completion Original Target Completion Date Revised Target Completion Date
3610-070-10-1003 August31,2010
2,269,313 235,331
2,504,644
10% 90%
June 30, 2012 June 30, 2013
76
10,880 75,705
86,585
(86,585) $
2,504,644
285,178 2,065,720
2,350,898
2,504,644
300,557 2,204,087
2,504,644
153,746 ;:;_$ ~~___;;,.~
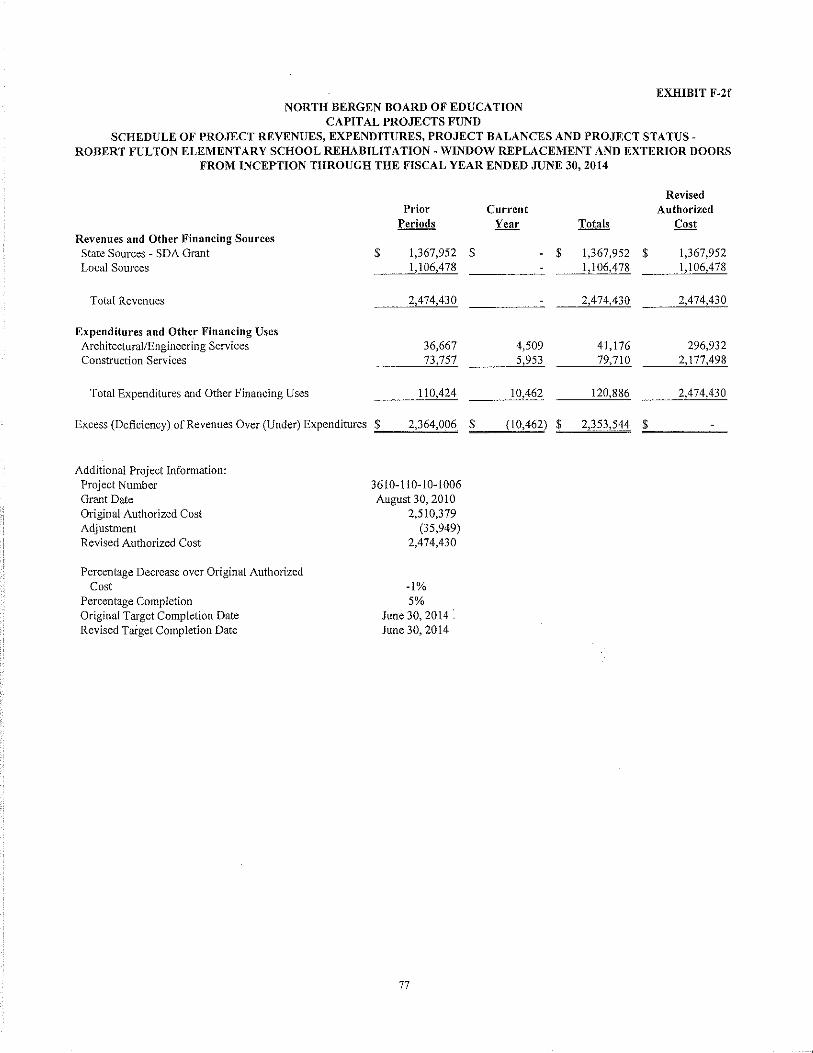
NORTH BERGEN BOARD OF EDUCATION CAPITAL PROJECTS FUND
EXHIBIT F-2f
SCHEDULE OF PROJECT REVENUES, EXPENDITURES, PROJECT BALANCES AND PROJECT STATUSROBERT FULTON ELEMENTARY SCHOOL REHABILITATION- WINDOW REPLACEMENT AND EXTERIOR DOORS
FROM INCEPTION THROUGH THE FISCAL YEAR ENDED JUNE 30, 2014
Revenues and Other Financing Sources State Sources - SDA Grant Local Sources
Total Revenues
Expenditures and Other Financing Uses Architectural/Engineering Services Construction Services
Total Expenditures and Other Financing Uses
$
Prior Periods
1,367,952 $ 1,106,478
2,474,430
36,667 73,757
110,424
Excess (Deficiency) of Revenues Over (Under) Expenditures $ 2,364,006 $
Additional Project Information: Project Number Grant Date Original Authorized Cost Adjustment Revised Authorized Cost
Percentage Decrease over Original Authorized Cost
Percentage Completion Original Target Completion Date Revised Tafget Completion Date
3610-110-10-1006 August 30,2010
2,510,379 (35,949)
2,474,430
-1% 5%
June 30,2014: June 30,2014
77
Current Year
4,509 5,953
10,462
$ 1,367,952 $ 1,106,478
2,474,430
41,176 79,710
120,886
Revised Authorized
Cost
1,367,952 1,106,478
2,474,430
296,932 2,177,498
2,474,430
(10,462) $ 2,353,544 "-$~~~~~
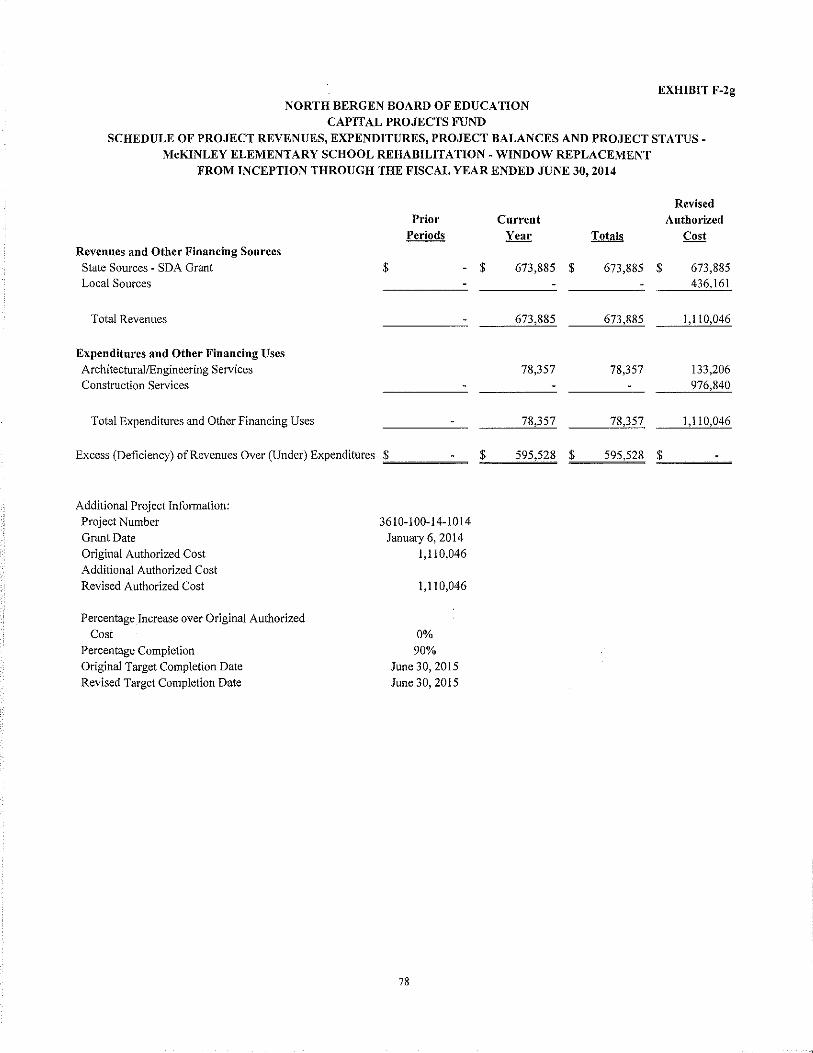
NORTH BERGEN BOARD OF EDUCATION CAPITAL PROJECTS FUND
EXHIBIT F-2g
SCHEDULE OF PROJECT REVENUES, EXPENDITURES, PROJECT BALANCES AND PROJECT STATUSMcKINLEY ELEMENTARY SCHOOL REHABILITATION- WINDOW REPLACEMENT
FROM INCEPTION THROUGH THE FISCAL YEAR ENDED JUNE 30,2014
Revenues and Other Financing Sources State Sources- SDA Grant Local Sources
Total Revenues
Expenditures and Other Financing Uses Architectural/Engineering Services Construction Services
Total Expenditures and Other Financing Uses
Prior Periods
$
Excess (Deficiency) of Revenues Over (Under) Expenditures ;;;$~~~~~~
Additional Project Information:
Project~umber
Grant Date
Original Authorized Cost Additional Authorized Cost
Revised Authorized Cost
Percentage Increase over Original Authorized
Cost
Percentage Completion Original Target Completion Date
Revised Target Completion Date
3610-100-14-1014
January 6, 2014
1,110,046
1,110,046
0% 90%
June 30, 2015
June 30, 2015
78
$
$
Revised Current Authorized
Year Totals Cost
673,885 $ 673,885 $ 673,885 436,161
673,885 673,885 1,110,046
78,357 78,357 133,206 976,840
78,357 78,357 1,110,046
595,528 $ 595,528 O:C$~~~~

NORTH BERGEN BOARD OF EDUCATION CAPITAL PROJECTS FUND
EXHIBIT F-2h
SCHEDULE OF PROJECT REVENUES, EXPENDITURES, PROJECT BALANCES AND PROJECT STATUS
McKINLEY ELEMENTARY SCHOOL REHABILITATION- EXTERIOR MASONRY, FAC,:ADE, AND SEALANTS
FROM INCEPTION THROUGH THE FISCAL YEAR ENDED JUNE 30,2014
Revenues and Other Financing Sources State Sources - SDA Grant Local Sources
Total Revenues
Expenditures and Other Financing Uses Architectural/Engineering Services Construction Services
Total Expenditures and Other Financing Uses
Prior Periods
$
Excess (Deficiency) of Revenues Over (Under) Expenditures ~$-----~
Additional Project Information:
Project Number Grant Date Original Authorized Cost Additional Authorized Cost Revised Authorized Cost
Percentage Increase over Original Authorized Cost
Percentage Completion Original Target Completion Date Revised Target Completion Date
3610-100-14-1025 January 6, 2014
280,810
280,810
0% 2%
June 30, 2015 June 30,2015
79
Current Year
$ 170,474 $
170,474
6,318
6,318
$ 164,156 $
Totals
170,474 $
170 474
6,318
6,318
Revised Authorized
Cost
170,474 110,336
280,810
33,697 247,113
280,810
164156 '"$~~~~
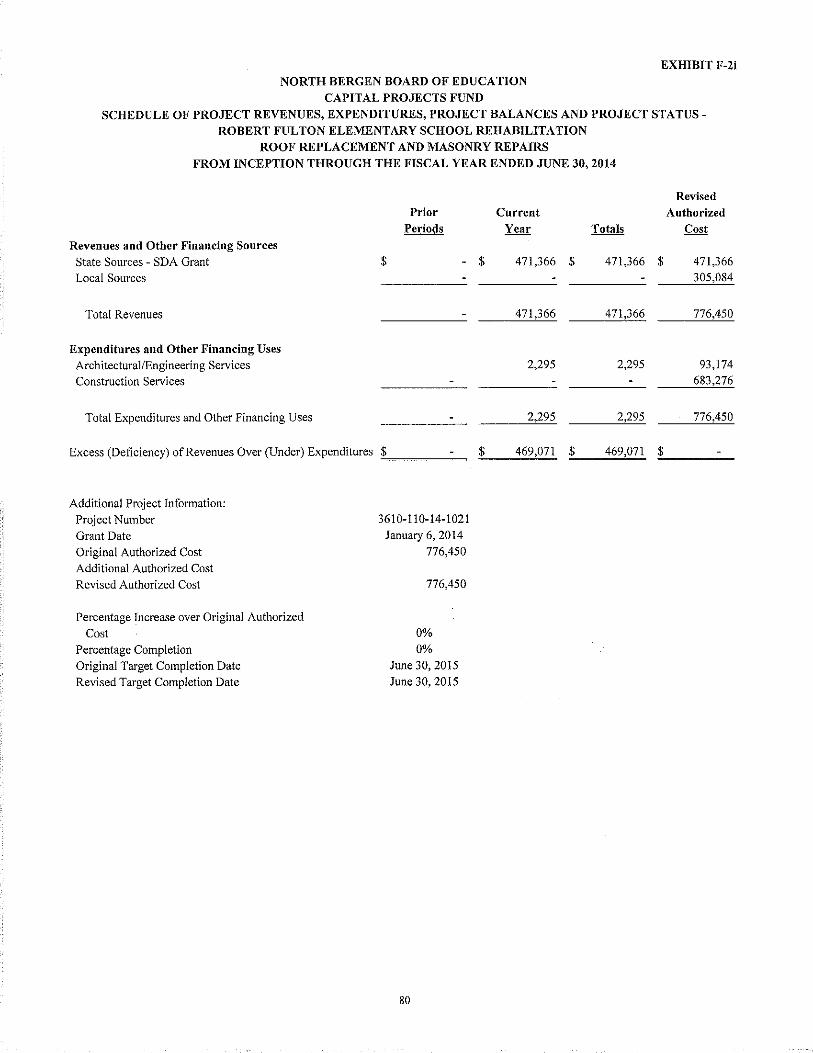
NORTH BERGEN BOARD OF EDUCATION CAPITAL PROJECTS FUND
EXHIBIT F-21
SCHEDULE OF PROJECT REVENUES, EXPENDITURES, PROJECT BALANCES AND PROJECT STATUSROBERT FULTON ELEMENTARY SCHOOL REHABILITATION
ROOF REPLACEMENT AND MASONRY REPAIRS FROM INCEPTION THROUGH THE FISCAL YEAR ENDED JUNE 30, 2014
Revenues and Other Financing Sources State Sources - SDA Grant
Local Sources
Total Revenues
Expenditures and Other Financing Uses Architectural/Engineering Services Construction Services
Total Expenditures and Other Financing Uses
Prior Periods
$
Excess (Deficiency) of Revenues Over (Under) Expenditures ~$~~~~~~
Additional Project Information:
Project Number Grant Date
Original Authorized Cost
Additional Authorized Cost
Revised Authorized Cost
Percentage Increase over Original Authorized
Cost
Percentage Completion
Original Target Completion Date
Revised Target Completion Date
3610-110-14-1021
January 6, 2014
776,450
776,450
0%
0%
June 30, 2015
June 30, 2015
80
Current Year
$ 471,366 $
471,366
2,295
2,295
$ 469,071 $
Totals
471,366 $
471,366
2,295
2,295
Revised Authorized
Cost
471,366 305,084
776,450
93,174 683,276
776,450
469,071 ;:;_$ ~~~~
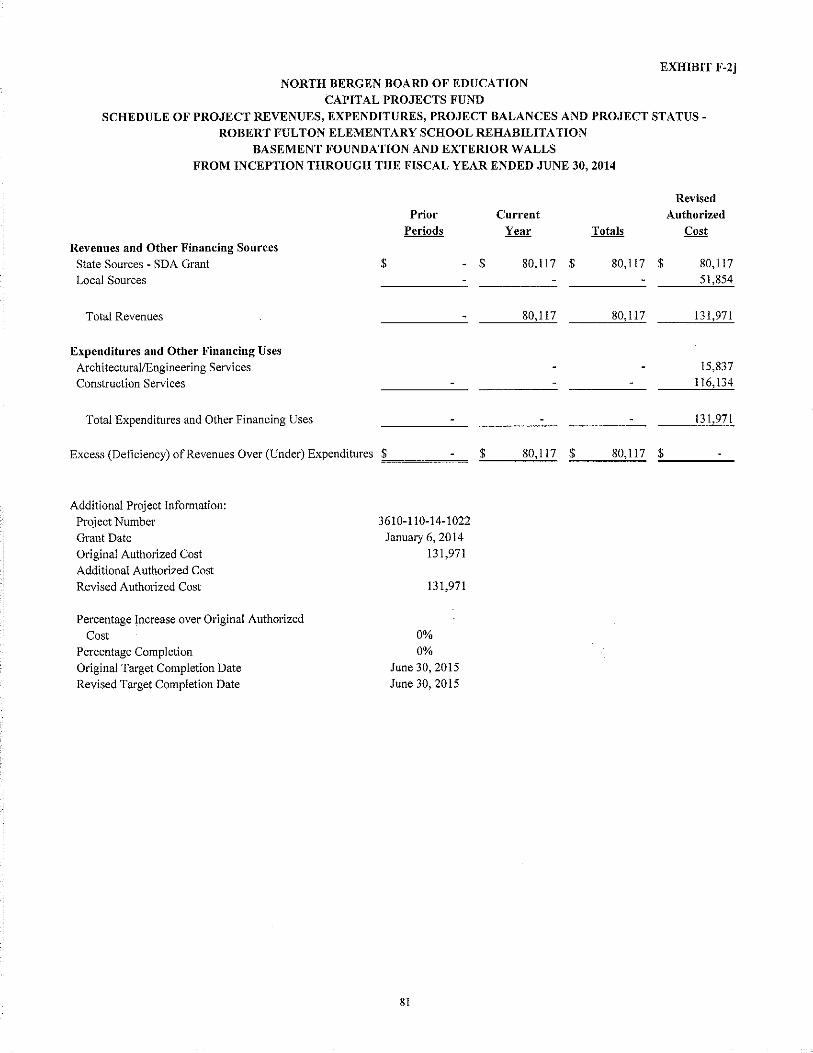
NORTH BERGEN BOARD OF EDUCATION CAPITAL PROJECTS FUND
EXHIBIT F-2j
SCHEDULE OF PROJECT REVENUES, EXPENDITURES, PROJECT BALANCES AND PROJECT STATUSROBERT FULTON ELEMENTARY SCHOOL REHABILITATION
BASEMENT FOUNDATION AND EXTERIOR WALLS FROM INCEPTION THROUGH THE FISCAL YEAR ENDED JUNE 30, 2014
Revenues and Other Financing Sources State Sources - SDA Grant Local Sources
·Total Revenues
Expenditures and Other Financing Uses Architectural/Engineering Services Construction Services
Total Expenditures and Other Financing Uses
Prior Periods
$
Excess (Deficiency) of Revenues Over (Under) Expenditures :::.$~~~~~~
Additional Project Infmmation:
Project Number Grant Date Original Authorized Cost Additional Authorized Cost
Revised Authorized Cost
Percentage Increase over Original Authorized
Cost Percentage Completion Original Target Completion Date Revised Target Completion Date
3610-110-14-1022
January 6, 2014 131,971
131,971
0% 0%
June 30, 2015 June 30, 2015
81
Current Year
$ 80,117 $
80,117
$ 80,117 $
Totals
80,117 $
80,117
Revised Authorized
Cost
80,117 51,854
131,971
15,837 116,134
131,971
80,117 :::.$~~~~
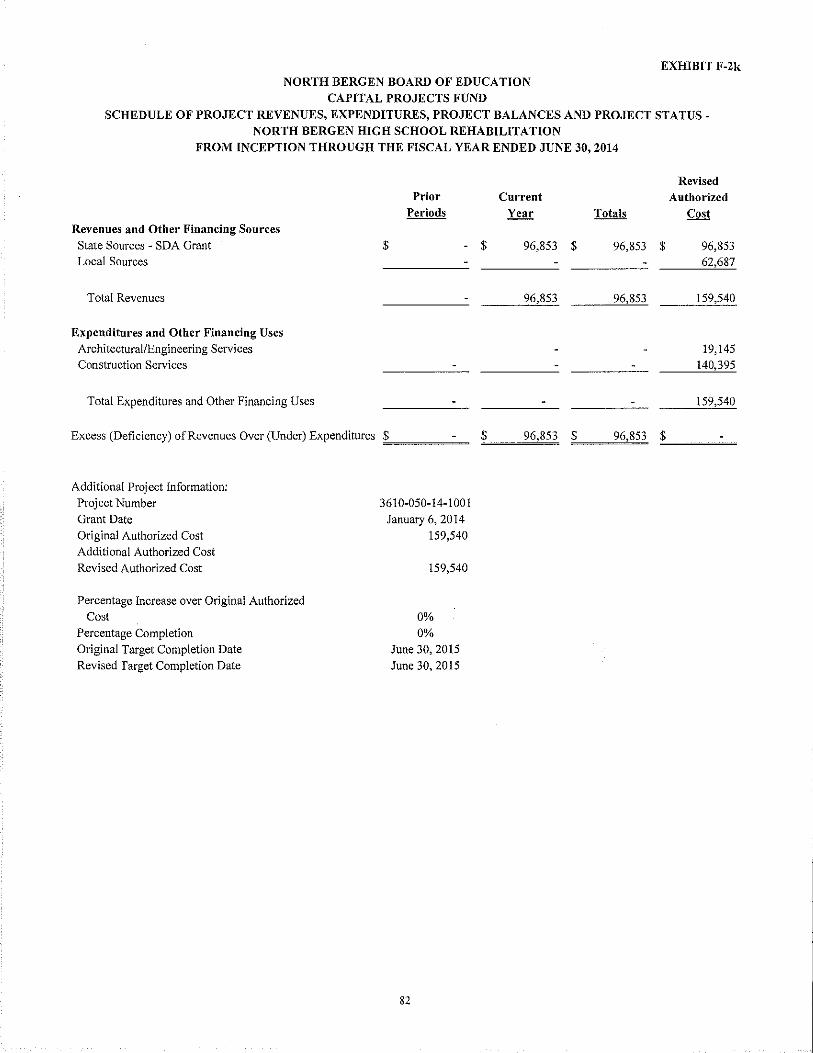
NORTH BERGEN BOARD OF EDUCATION CAPITAL PROJECTS FUND
EXHIBIT F-2k
SCHEDULE OF PROJECT REVENUES, EXPENDITURES, PROJECT BALANCES AND PROJECT STATUSNORTH BERGEN HIGH SCHOOL REHABILITATION
FROM INCEPTION THROUGH THE FISCAL YEAR ENDED JUNE 30, 2014
Revenues and Other Financing Sources State Sources - SDA Grant Local Sources
Total Revenues
Expenditures and Other Financing Uses Architectural/Engineering Services Construction Services
Total Expenditures and Other Financing Uses
Prior Periods
$
Excess (Deficiency) of Revenues Over (Under) Expenditures ;;;$~~~~--
Additional Project Information: Project Number Grant Date Original Authorized Cost Additional Authorized Cost Revised Authorized Cost
Percentage Increase over Original Authorized Cost
Percentage Completion Original Target Completion Date Revised Target Completion Date
3610-050-14-1001
January 6, 2014 159,540
159,540
0% 0%
June 30,2015 June 30, 2015
82
Current Year
$ 96,853 $
96,853
$ 96,853 $
Totals
96,853 $
96,853
Revised Authorized
Cost
96,853 62,687
159,540
19,145 140,395
159,540
96,853 ;;;_$ ~~~~
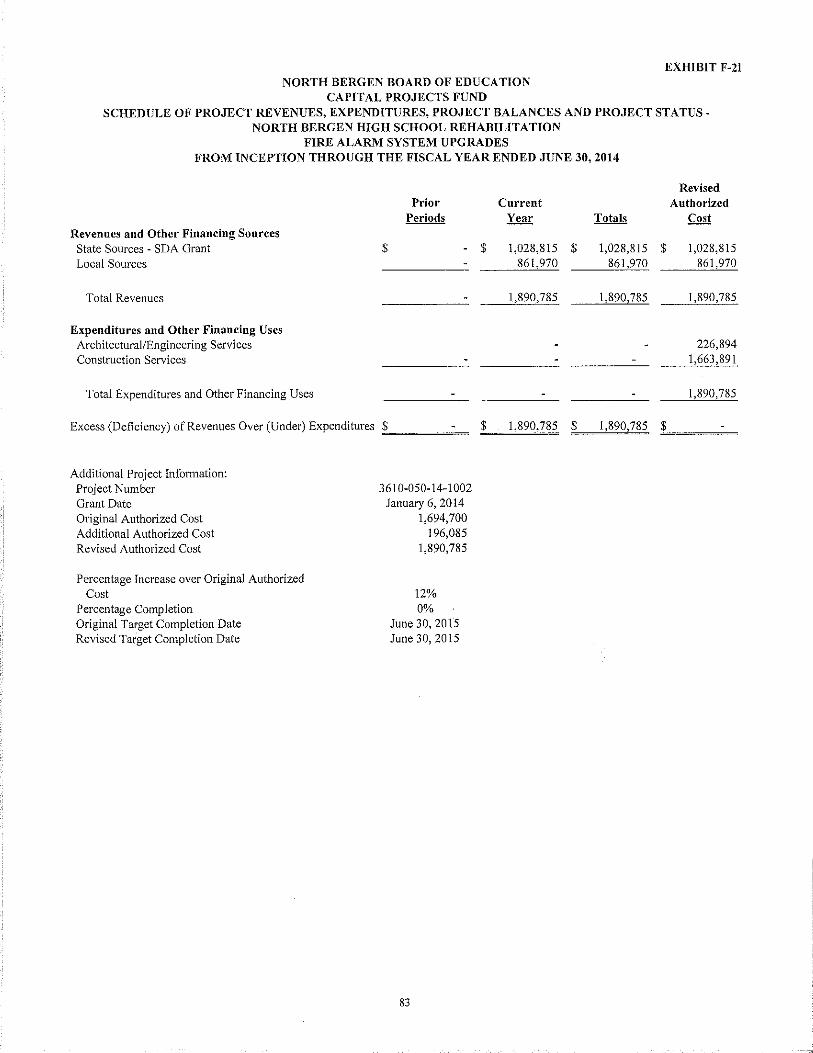
NORTH BERGEN BOARD OF EDUCATION CAPITAL PROJECTS FUND
EXHIBIT F-21
SCHEDULE OF PROJECT REVENUES, EXPENDITURES, PROJECT BALANCES AND PROJECT STATUSNORTH BERGEN HIGH SCHOOL REHABILITATION
FIRE ALARM SYSTEM UPGRADES FROM INCEPTION THROUGH THE FISCAL YEAR ENDED JUNE 30, 2014
Revenues and Other Financing Sources State Sources R SDA Grant Local Sources
Total Revenues
Expenditures and Other Financing Uses Architectural/Engineering Services Construction Services
Total Expenditures and Other Financing Uses
Prior Periods
$
Excess (Deficiency) of Revenues Over (Under) Expenditures "$-----~
Additional Project Information: Project Number Grant Date Original Authorized Cost Additional Authorized Cost Revised Authorized Cost
Percentage Increase over Original Authorized Cost
Percentage Completion Original Target Completion Date Revised Target Completion Date
3610-050-14-1002 January 6, 2014
1,694,700 196,085
1,890,785
12% 0%
June 30, 2015 June 30, 2015
83
Current Year Totals
$ 1,028,815 $ 1,028,815 861,970 861,970
1,890,785 1,890 785
$ 1,890,785 $ 1,890,785
Revised Authorized
Cost
$ 1,028,815 861,970
1,890,785
226,894 1,663,891
1,890,785
$
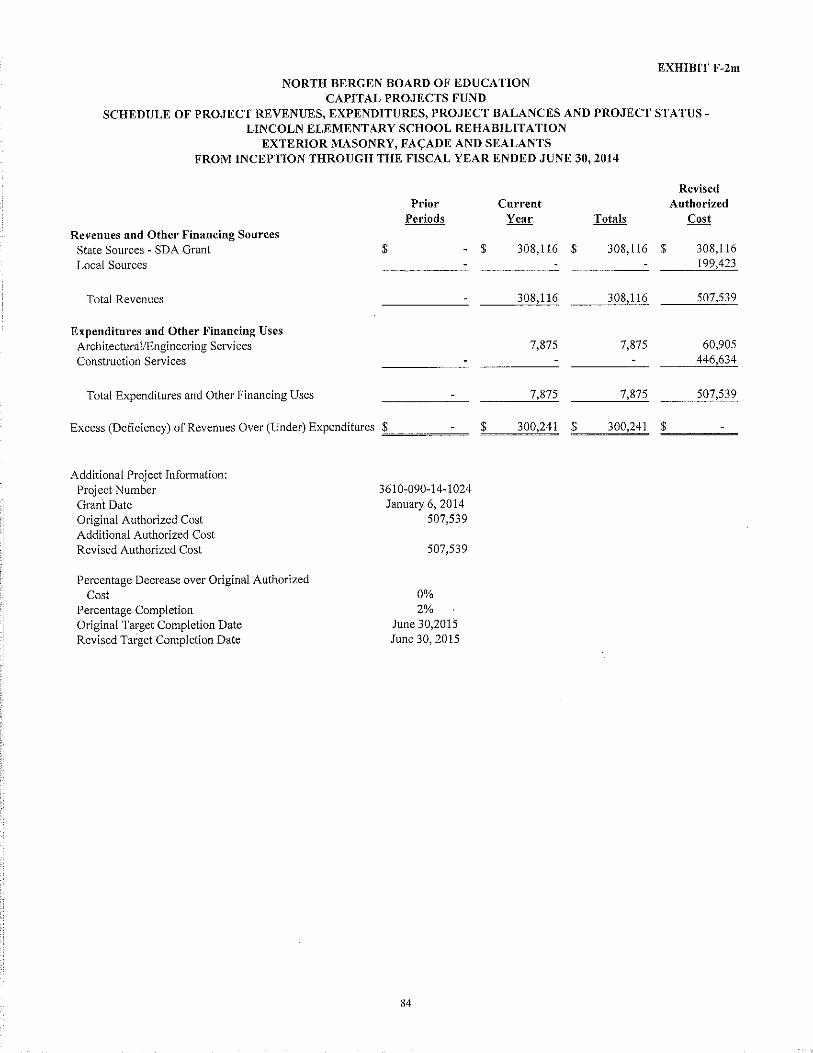
NORTH BERGEN BOARD OF EDUCATION CAPITAL PROJECTS FUND
EXHIBIT F-2m
SCHEDULE OF PROJECT REVENUES, EXPENDITURES, PROJECT BALANCES AND PROJECT STATUSLINCOLN ELEMENTARY SCHOOL REHABILITATION
EXTERIOR MASONRY, FAcADE AND SEALANTS FROM INCEPTION THROUGH THE FISCAL YEAR ENDED JUNE 30, 2014
Revenues and Other Financing Sources State Sources R SDA Grant Local Sources
Total Revenues
Expenditures and Other Financing Uses Architectural/Engineering Services Construction Services
Total Expenditures and Other Financing Uses
Prior Periods
$
Excess (Deficiency) of Revenues Over (Under) Expenditures $~~~~,..;~
Additional Project Information: Project Number Grant Date Original Authorized Cost Additional Authorized Cost Revised Authorized Cost
Percentage Decrease over Original Authorized Cost
Percentage Completion Original Target Completion Date Revised Tafget Completion Date
3610-090-14-1024 January 6, 2014
507,539
507,539
0% 2%
June 30,2015 June 30,2015
84
Current Year
$ 308,116 $
308,116
7,875
7,875
$ 300,241 $
Totals
308,116 $
308,116
7,875
7,875
Revised Authorized
Cost
308,116 199,423
507,539
60,905 446,634
507,539
300,241 ;;;.$ ~~~~

NORTH BERGEN BOARD OF EDUCATION CAPITAL PROJECTS FUND
EXHIBIT F-2n
SCHEDULE OF PROJECT REVENUES, EXPENDITURES, PROJECT BALANCES AND PROJECT STATUSHORACE MANN ELEMENTARY SCHOOL REHABILITATION
ROOF REPLACEMENT AND MASONRY REPAIRS FROM INCEPTION THROUGH THE FISCAL YEAR ENDED JUNE 30, 2014
Revenues and Other Financing Sources State Sources ~ SDA Grant Local Sources
Total Revenues
Expenditures and Other Financing Uses Architectural/Engineering Services Construction Services
Total Expenditures and Other Financing Uses
Prior Periods
$
Excess (Deficiency) of Revenues Over (Under) Expenditures "$~~~~~~
Additional Project Information: Project Number Grant Date Original Authorized Cost Additional Authorized Cost Revised Authorized Cost
Percentage Decrease over Original Authorized Cost
Percentage Completion Original Target Completion Date Revised Target Completion Date
3610-070-14-1020 January 6, 2014
738,650
738,650
0% 0%
June 30, 2015 June 30, 2015
85
Current Year
$ 448,418 $
448,418
2,430
2,430
$ 445,988 $
Totals
448,418 $
448,418
2,430
2,430
Revised Authorized
Cost
448,418 290,232
738,650
88,638 650,012
738,650
445,988 ;;,.$ ~~~-

NORTH BERGEN BOARD OF EDUCATION CAPITAL PROJECTS FUND
EXHIBIT F-2o
SCHEDULE OF PROJECT REVENUES, EXPENDITURES, PROJECT BALANCES AND PROJECT STATUSMcKINLEY ELEMENTARY SCHOOL REHABILITATION
SECURITY CAMERA INSTALLATION FROM INCEPTION THROUGH THE FISCAL YEAR ENDED JUNE 30, 2014
Revenues and Other Financing Sources State Sources - SDA Grant Local Sources
Total Revenues
Expenditures and Other Financing Uses Architectural/Engineering Services Construction Services
Total Expenditures and Other Financing Uses
Prior Periods
$
Excess (Deficiency) of Revenues Over (Under) Expenditures :;:,$~~~~~~
Additional Project Infonnation: Project~urnber
Grant Date Original Authorized Cost Additional Authorized Cost Revised Authorized Cost
Percentage Increase over Original Authorized
Cost Percentage Completion Original Target Completion Date Revised Target Completion Date
3610-100-14-1015 January 6, 2014
128,652 19,455
148,107
15% 0%
June 30, 2015 June 30, 2015
86
$
$
Current Year
78,102 $ 70,005
148,107
148,107 $
Totals
78,102 $ 70,005
148,107
Revised Authorized
Cost
78,102 70,005
148,107
17,773 130,334
148,107
148,107 :;;$~~~~
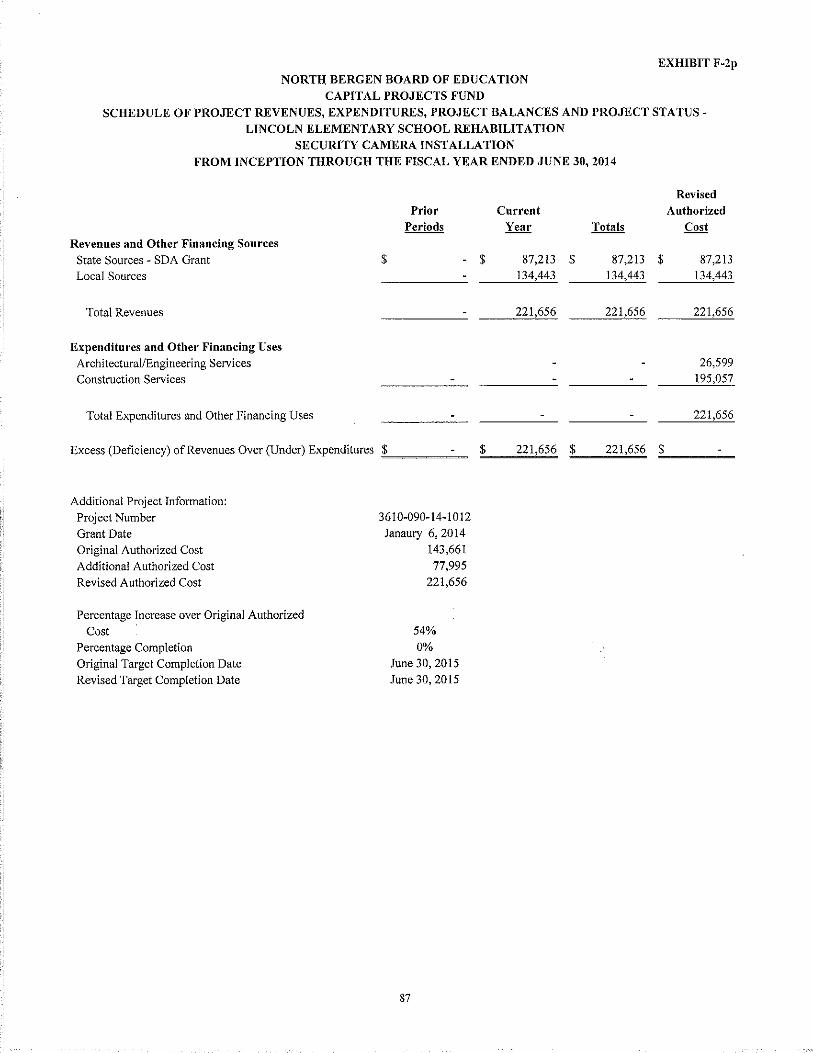
!I
NORTH BERGEN BOARD OF EDUCATION CAPITAL PROJECTS FUND
EXHIBIT F-2p
SCHEDULE OF PROJECT REVENUES, EXPENDITURES, PROJECT BALANCES AND PROJECT STATUSLINCOLN ELEMENTARY SCHOOL REHABILITATION
SECURITY CAMERA INSTALLATION FROM INCEPTION THROUGH THE FISCAL YEAR ENDED JUNE 30, 2014
Revenues and Other Financing Sources State Sources - SDA Grant Local Sources
Total Revenues
Expenditures and Other Financing Uses Architectural/Engineering Services Construction Services
Total Expenditures and Other Financing Uses
Prior Periods
$
Excess (Deficiency) of Revenues Over (Under) Expenditures ~$~~~~~~
Additional Project Information: Project Number Grant Date Original Authorized Cost Additional Authorized Cost Revised Authorized Cost
Percentage Increase over Original Authorized
Cost Percentage Completion Original Target Completion Date Revised Target Completion Date
3610-090-14-1012 Janaury 6, 2014
143,661
77,995 221,656
54%
0% June 30, 2015 June 30, 2015
87
$
$
Current Year
87,213 $ 134,443
221,656
221,656 $
Totals
87,213 $ 134,443
221,656
Revised Authorized
Cost
87,213 134,443
221,656
26,599 195,057
221,656
221,656 :::.$~~~~

NORTH BERGEN BOARD OF EDUCATION CAPITAL PROJECTS FUND
EXHIBIT F-2q
SCHEDULE OF PROJECT REVENUES, EXPENDITURES, PROJECT BALANCES AND PROJECT STATUSJOHN F. KENNEDY ELEMENTARY SCHOOL REHABILITATION
SECURITY CAMERA INSTALLATION FROM INCEPTION THROUGH THE FISCAL YEAR ENDED JUNE 30, 2014
Revenues and Other Financing Sources State Sources - SDA Grant Local Sources
Total Revenues
Expenditures and Other Financing Uses Architectural/Engineering Services Construction Services
Total Expenditures and Other Financing Uses
Prior Periods
$
Excess (Deficiency) of Revenues Over (Under) Expenditures ;;:$~~~~~~
Additional Project Infonnation:
Project Number
Grant Date
Original Authorized Cost
Additional Authorized Cost Revised Authorized Cost
Percentage Increase over Original Authorized
Cost Percentage Completion
Original Target Completion Date
Revised Target Completion Date
3610-080-14-1011 January 6, 2014
97,199 56,123
153,322
58% 0%
June 30, 2015 June 30, 2015
88
Current Year
$ 59,007 $ 94,315
153,322
$ 153,322 $
Totals
59,007 $ 94,315
153,322
Revised
Authorized Cost
59,007 94,315
153,322
18,399 134,923
153,322
153,322 ;;:.$ --~~

NORTH BERGEN BOARD OF EDUCATION CAPITAL PROJECTS FUND
EXHIBIT F-2r
SCHEDULE OF PROJECT REVENUES, EXPENDITURES, PROJECT BALANCES AND PROJECT STATUSHORACE MANN ELEMENTARY SCHOOL REHABILITATION
SECURITY CAMERA INSTALLATION FROM INCEPTION THROUGH THE FISCAL YEAR ENDED JUNE 30, 2014
Revenues and Other Financing Sources State Sources - SDA Grant Local Sources
Total Revenues
Expenditures and Other Financing Uses Architectural/Engineering Services
Construction Services
Total Expenditures and Other Financing Uses
Prior Periods
$
Excess (Deficiency) of Revenues Over (Under) Expenditures ~$~~~~~-
Additional Project Infonnation:
Project Number
Grant Date
Original Authorized Cost
Additional Authorized Cost
Revised Authorized Cost
Percentage Increase over Original Authorized
Cost
Percentage Completion
Original Target Completion Date
Revised Target Completion Date
3610-070-14-1099
January 6, 2014
108,082
63,822
171,904
59%
0% June 30, 2015
June 30, 2015
89
Current Year
$ 65,614 $ 106,290
171,904
$ 171,904 $
Totals
65,614 $ 106 290
171,904
Revised Authorized
Cost
65,614
106,290
171,904
20,628 151,276
171,904
171,904 ;;:_$~~~~

NORTH BERGEN BOARD OF EDUCATION CAPITAL PROJECTS FUND
EXHIBIT F-2s
SCHEDULE OF PROJECT REVENUES, EXPENDITURES, PROJECT BALANCES AND PROJECT STATUSFRANKLIN ELEMENTARY SCHOOL REHABILITATION
SECURITY CAMERA INSTALLATION FROM INCEPTION THROUGH THE FISCAL YEAR ENDED JUNE 30, 2014
Revenues and Other Financing Sources State Sources - SDA Grant Local Sources
Total Revenues
Expenditures and Other Financing Uses Architectural/Engineering Services Construction Services
Total Expenditures and Other Financing Uses
Prior Periods
$
Excess (Deficiency) of Revenues Over (Under) Expenditures "'$~~~~~~
Additional Project Information: Project~unnber
Grant Date Original Authorized Cost Additional Authorized Cost Revised Authorized Cost
Percentage Increase over Original Authorized
Cost Percentage Connpletion Original Target Completion Date Revised Target Connpletion Date
3610-060-14-1008 January 6, 2014
104,883 46,720
151,603
45% 0%
June 30, 2015 June 30, 2015
90
$
$
Current Year
63,672 $ 87,931
151,603
151,603 $
Totals
63,672 $ 87,931
151,603
Revised Authorized
Cost
63,672 87,931
151,603
18,192 133,411
151,603
151,603 ::.$~~~~

NORTH BERGEN BOARD OF EDUCATION CAPITAL PROJECTS FUND
EXHIBIT F-2t
SCHEDULE OF PROJECT REVENUES, EXPENDITURES, PROJECT BALANCES AND PROJECT STATUSROBERT FULTON ELEMENTARY SCHOOL REHABILITATION
SECURITY CAMERA INSTALLATION FROM INCEPTION THROUGH THE FISCAL YEAR ENDED JUNE 30, 2014
Revenues and Other Financing Sources State Sources - SDA Grant Local Sources
Total Revenues
Expenditures and Other Financing Uses Architectural/Engineering Services Construction Services
Total Expenditures and Other Financing Uses
Prior Periods
$
Excess (Deficiency) of Revenues Over (Under) Expenditures $:;;.,.~~~,.,;~
Additional Project Infonnation: Project Number Grant Date Original Authorized Cost Reduced Authorized Cost Revised Authorized Cost
Percentage Decrease over Original Authorized
Cost Percentage Completion Original Target Completion Date Revised Target Completion Date
3610-110-14-1016
January 6, 2014 99,558
105,927 205,485
106% 0%
June 30,2015 June 30, 2015
91
$
$
Current Year
60,439 $ 145,046
205,485
205,485 $
Totals
60,439 $ 145,046
205,485
Revised Authorized
Cost
60,439 145,046
205,485
24,658 180,827
205,485
205,485 ~$ ~~~~
PROPRIETARY FUNDS
NORTH BERGEN BOARD OF EDUCATION PROPRIETARY FUND
STATEMENT OF NET POSITION AS OF JUNE 30, 2014
THIS STATEMENT IS NOT APPLICABLE
FINANCIAL STATEMENTS ARE PRESENTED ON EXHIBIT B-4
STATEMENT OF REVENUES, EXPENSES AND CHANGES IN NET POSITION
FOR THE FISCAL YEAR ENDED JUNE 30,2014
THIS STATEMENT IS NOT APPLICABLE
FINANCIAL STATEMENTS ARE PRESENTED ON EXHIBIT B-5
STATEMENT OF CASH FLOWS FOR THE FISCAL YEAR ENDED JUNE 30, 2014
THIS STATEMENT IS NOT APPLICABLE FINANCIAL STATEMENTS ARE PRESENTED ON EXHIBIT B-6
92
EXHIBIT G-1
EXHIBITG-2
EXHIBITG-3

FIDUCIARY FUNDS

NORTH BERGEN BOARD OF EDUCATION FIDUCIARY FUNDS
COMBINING STATEMENT OF AGENCY ASSETS AND LIABILITIES AS OF JUNE 30, 2014
Student Activity Payroll
ASSETS
Cash and Cash Equivalents $ 196, I 08 $ 2,756,359 Due from Other Funds 90,283
Total Assets $ 286,391 $ 2,756,359
LIABILITIES
Payroll and Payroll Deductions and Withholdings $ 28,502
Accrued Salaries and Wages 2,534,704 Due to Other Funds 193,153 Due to Student Groups $ 286,391
Total Liabilities $ 286,391 $ 2,756,359
93
EXHIBITH-1
Total
$ 2,952,467 90,283
$ 3,042,750
$ 28,502 2,534,704
193,153 286,391
$ 3,042,750

NORTH BERGEN BOARD OF EDUCATION FIDUCIARY FUNDS
COMBINING STATEMENT OF CHANGES IN FIDUCIARY NET POSITION
FOR THE FISCAL YEAR ENDED JUNE 30, 2014
NOT APPLICABLE
STUDENT ACTIVITY FUND SCHEDULE OF RECEIPTS AND DISBURSEMENTS
FOR THE FISCAL YEAR ENDED JUNE 30,2014
Balance, July 1, Cash Cash 2013 Receipts Disbursements
ELEMENTARY SCHOOLS $ 92,644 $ 192,010 $ 182,100
HIGHSCHOOL Athletic 5,628 44,044 42,366 General 178,661 277,542 279,672
Total $ 276,933 $ 513,596 $ 504,138
PAYROLL AGENCY FUND SCHEDULE OF RECEIPTS AND DISBURSEMENTS
FOR THE FISCAL YEAR ENDED JUNE 30, 2014
Balance, July 1, Cash Cash 2013 Receipts Disbursements
ASSETS Cash $ 3,682,103 $ 89,005,709 $ 89,931,453
Total Assets $ 3,682,103 $ 89,005,709 $ 89,931,453
LIABILITIES Payroll and Payroll Deductions
and Withholdings $ 564,641 $ 86,384,142 $ 86,920,281 Accrued Salaries and Wages 3,021,294 2,524,582 3,011,172 Due to Other Funds 96,168 96,985
Total Liabilities $ 3,682,103 $ 89,005,709 $ 89,931,453
94
EXHIBIT H-2
EXHIBITH-3
Balance, June 30,
2014
$ 102,554
7,306 176,531
$ 286,391
EXHIBITH-4
Balance, June30,
2014
$ 2,756,359
$ 2,756,359
$ 28,502 2,534,704
193,153
$ 2,756,359
LONG-TERM DEBT

Issue
Pension Obligation Refunding Bonds
Refunding Bonds
Pension Obligation Refunding Bonds
NORTH BERGEN BOARD OF EDUCATION LONG-TERM DEBT
SCHEDULE OF SERIAL BONDS FOR THE FISCAL YEAR ENDED JUNE 30, 2014
Date of Amount of Annual Maturities Interest Balance, Issue Issue Date Amount Rate Julv 1, 2013
5/15/2003 $ 4,250,000 $ 3,120,000
5/2112009 3,125,000 3/1/2015 $ 345,000 $ 3.000 % 3/1/2016 350,000 4.000 3/1/2017 355,000 4.000
3/1/2018 365,000 4.000 1,760,000
10/31/2013 $ 3,225,000 411/2015 220,000 1.159 411/2016 220,000 1.777 411/2017 225,000 2.481 411/2018 230,000 2.931 411/2019 235,000 3.319 4/1/2020 240,000 3.719 4/112021 250,000 4.054 411/2022 265,000 4.254 4/1/2023 275,000 4.504 4/1/2024 285,000 5.054 4/1/2025 300,000 5.054 4/112026 275,000 5.054
EXHIBIT I-1
Balance, Increased Decreased June 30, 2014
$ 3,120,000
345,000 1,415,000
$ 3,225,000 205,000 $ 3,020,000
$ 4,880,000 $ 3,225,000 $ 3,670,000 $ 4,435,000
95
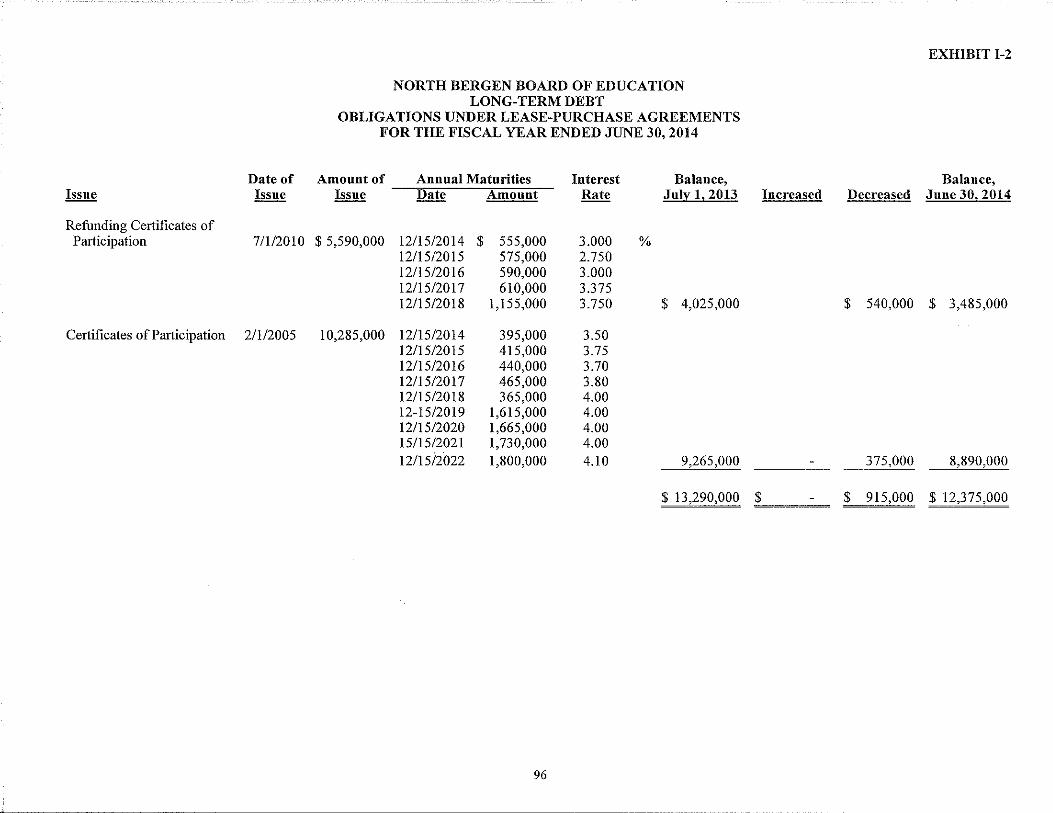
Issue
Refunding Certificates of Participation
NORTH BERGEN BOARD OF EDUCATION LONG-TERM DEBT
OBLIGATIONS UNDER LEASE-PURCHASE AGREEMENTS FOR THE FISCAL YEAR ENDED JUNE 30, 2014
EXHIBIT 1-2
Date of Amount of Annual Maturities Interest Rate
Balance, Balance, Issue Issue Date Amount
7/1/2010 $ 5,590,000 12/15/2014 $ 12/15/2015 12/15/2016 12115/2017 12115/2018
555,000 575,000 590,000 610,000
1,155,000
3.000 2.750 3.000 3.375 3.750
%
July 1, 2013 Increased Decreased June 30, 2014
$ 4,025,000 $ 540,000 $ 3,485,000
Certificates ofParticipation 2/1/2005 10,285,000 12/15/2014 395,000 415,000 440,000 465,000 365,000
3.50 3.75 3.70 3.80 4.00 4.00 4.00 4.00 4.10
12115/2015 12115/2016 12/15/2017 12/15/2018 12-15/2019 12115/2020 15/15/2021 12/15/2022
1,615,000 1,665,000 1,730,000 1,800,000
96
9,265,000
$ 13,290,000 ;;;.$~~~
375,000 8,890,000
$ 915,000 $ 12,375,000

NORTH BERGEN BOARD OF EDUCATION LONG-TERM DEBT
SCHEDULE OF SALES/LEASEBACK OBILIGATIONS PAYABLE FOR THE FISCAL YEAR ENDED JUNE 30, 2014
Description
Acquisition and Improvement of Real Property for School Purposes
Date of Issue
Amount oflssue
1/31/2014 $ 2,535,000
97
Interest Rate Increased
1.54% $ 2,53?,000
Decreased
$ 355,000
EXHIBIT I-3
Balance June 30 2014
$ 2,180,000
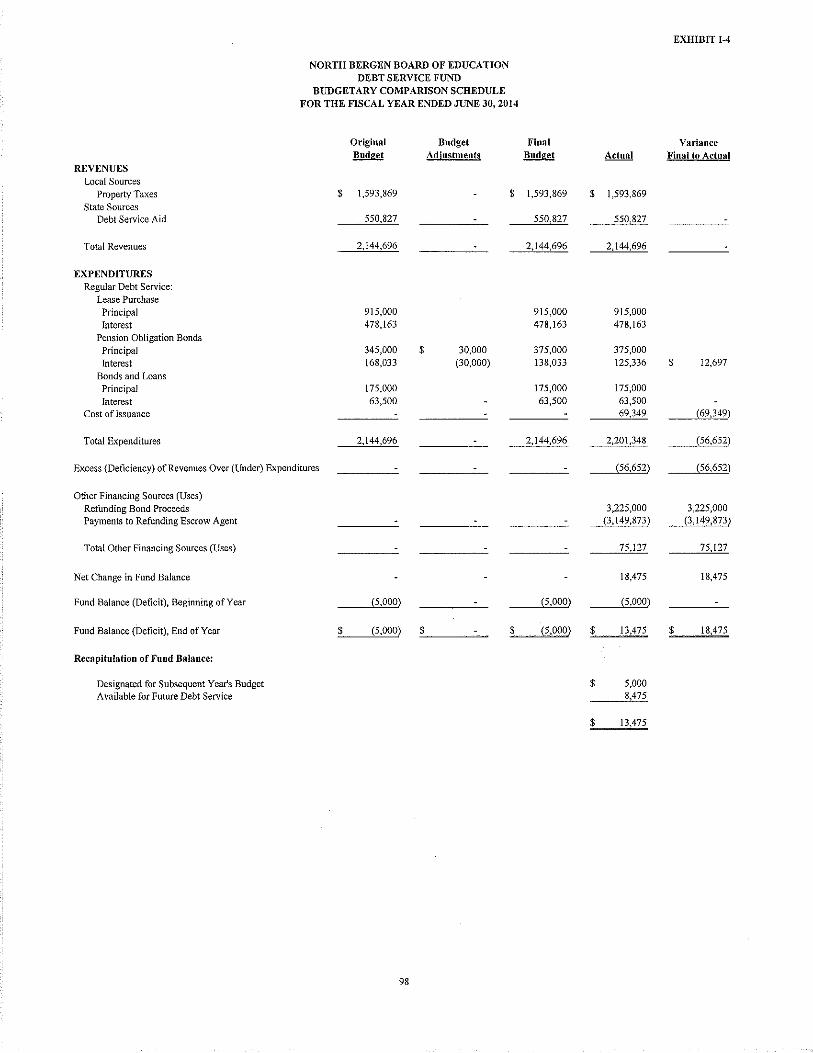
EXHIBIT 1-4
NORTH BERGEN BOARD OF EDUCATION DEBT SERVICE FUND
BUDGETARY COMPARISON SCHEDULE FOR THE FISCAL YEAR ENDED JUNE 30, 2014
Original Budget Final Variance Budget Adjustments Budget Actual Final to Actual
REVENUES Local Sources
Property Taxes $ 1,593,869 $ 1,593,869 $ 1,593,869
State Sources Debt Service Aid 550,827 550,827 550,827
Total Revenues 2,144,696 2,144,696 2,144,696
EXPENDITURES Regular Debt Service:
Lease Purchase Principal 915,000 915,000 915,000
Interest 478,163 478,163 478,163
Pension Obligation Bonds Principal 345,000 $ 30,000 375,000 375,000
Interest 168,033 (30,000) 138,033 125,336 $ 12,697
Bonds and Loans Principal 175,000 175,000 175,000
Interest 63,500 63,500 63,500 Cost of Issuance 69,349 (69,349)
Total Expenditures 2,144,696 2,144,696 2,201,348 (56,652)
Excess {Deficiency) of Revenues Over (Under) Expenditures (56,652) (56,652)
Other Financing Sources (Uses) Refunding Bond Proceeds 3,225,000 3,225,000 Payments to Refunding Escrow Agent (3,149,873) (3,149,873)
Total Other Financing Sources (Uses) 75,127 75,127
Net Change in Fund Balance 18,475 18,475
Fund Balance (Deficit), Beginning of Year (5,000) (5,000) (5,000)
Fund Balance (Deficit), End of Year $ (5,000) $ $ (5,000) $ 13,475 $ 18,475
Recapitulation of Fund Balance:
Designated for Subsequent Year's Budget $ 5,000 Available for Future Debt Service 8,475
$ 13,475
98

STATISTICAL SECTION
This part of the North Bergen Board of Education's comprehensive annual fmancial report presents detailed infonnation as a context for understanding what the infonnation in the financial statements, note disclosures, and required supplementary infonnation says about the govermnent's overall financial health.
Contents
Financial Trends
These schedules contain trend infonnation to help the reader understand how the govermnent's fmancial perfonnance and well-being have changed
over time.
Revenue Capacity
These schedules contain infonnation to help the reader assess the government's most significant local revenue source, the property tax.
Debt Capacity
These schedules present infonnation to help the reader assess the affordability of the govermnent's current levels of outstanding debt and the govermnent's ability to issue additional debt in the future.
Demographic and Economic Information
These schedules offer demographic and economic indicators to help the reader understand the enviromnent within which the govermnent's financial activities take place.
Operating Information
These schedules contain service and infrastructure data to help the reader understand how the infonnation in the govermnent's fmancial report relates to the services the government provides and the activities it perfonns.
Sources: Unless otherwise noted, the infonnation in these schedules is derived from the comprehensive annual fmancial reports for the relevant year.
Exhibits
J-1 to J-5
J-6 to J-9
J-10 to J-13
J-14 and J-15
J-16 to J-20
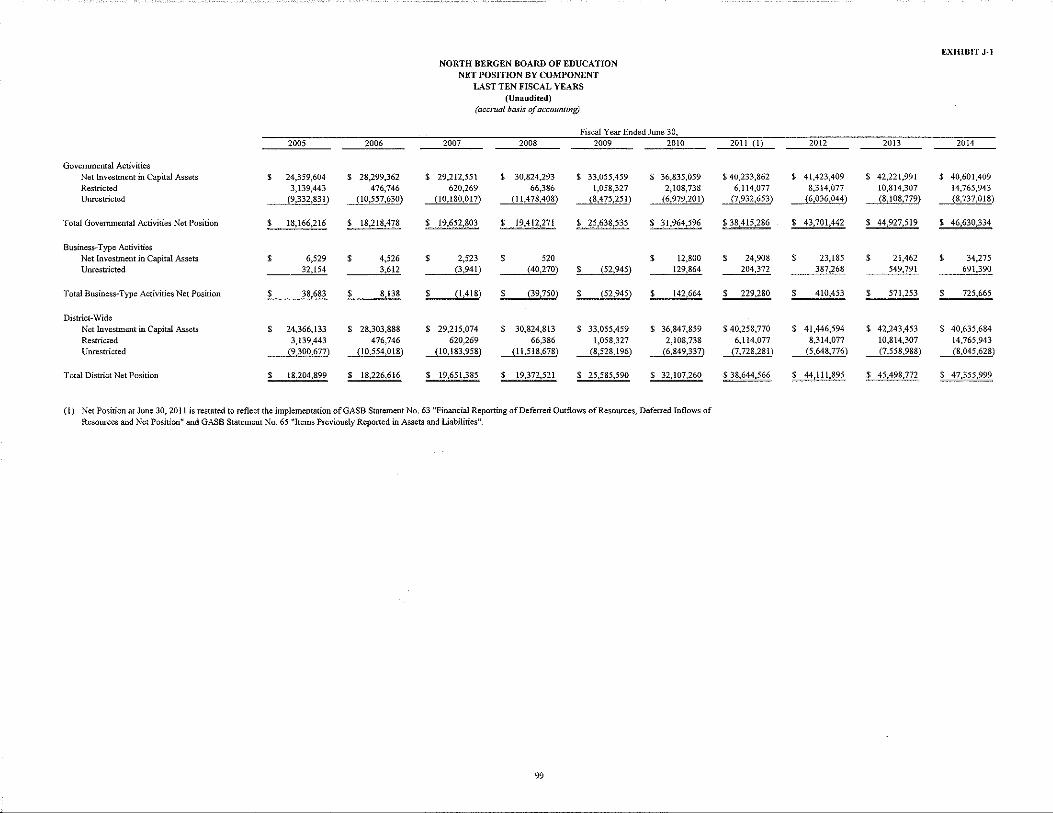
EXHIBlT J-1 NORTH BERGEN BOARD OF EDUCATION
NET POSITION BY COMPONENT LAST TEN FISCAL YEARS
(Unaudited) (accroal basis of accounting)
Fiscal Year Ended June 30, 2005 2006 2007 2008 2009 2010 20ll (I) 2012 2013 2014
Goverrunental Activities Net Investment in Capital Assets $ 24,359,604 $ 28,299,362 $ 29,212,551 $ 30,824,293 $ 33,055,459 $ 36,835,059 $ 40,233,862 $ 41,423,409 $ 42,221,991 $ 40,601,409 Restricted 3,139,443 476,746 620,269 66,386 1,058,327 2,108,738 6,114,077 8,314,077 10,814,307 14,765,943 Unrestricted (9,332,831) (10,557,630) (10,180,017) (I 1,478,408) (8,475,251) (6,979,201) (7,932,653) (6,036,044) (8,108,779) (8,737,018)
Total Governmental Activities Net Position $ 18,166,216 $ 18,218,478 $ 19,652,803 $ 19,412,271 $ 25,638,535 $ 3!,964,596 $38,415,286 $ 43,701,442 $ 44,927,519 $ 46,630,334
Business-Type Activities Net Investment in Capital Assets $ 6,529 $ 4,526 $ 2,523 $ 520 $ 12,800 $ 24,908 $ 23,185 $ 21,462 $ 34,275 Unrestricted 32.J2! 3,612 (3,941) (40,270) $ (52,945) ~864 204,372 387,268 549,791 691,390
Total Business-Type Activities Net Position $ 38,683 $ 8,l38 $ (1,418) $ (39,750) $ (52,945) $ 142,664 $ 229,280 $ 410,453 $ 571,253 $ 725,665
District-Wide Net Investment in Capital Assets $ 24,366,133 $ 28,303,888 $ 29,215,074 $ 30,824,813 $ 33,055,459 $ 36,847,859 $ 40,258,770 $ 41,446,594 $ 42,243,453 $ 40,635,684 Restricted 3,139,443 476,746 620,269 66,386 1,058,327 2,108,738 6,ll4,077 8,314,077 10,814,307 14,765,943 Unrestricted (9,300,677) {10,554,018) {10,183,958) (11,518,678) (8,528, 196) (6,849,337) {7,728,281) (5,648,776) (7,558,988) (8,045,628)
Total District Net Position $ 18,204,899 $ 18,226,616 $ 19,651,385 $ 19,372,521 $ 25,585,590 $ 32,107,260 $ 38,644,566 $ 44,111,895 $ 45,498,772 $ 47,355,999
(I) Net Position at June 30, 2011 is restated to reflect the implementation ofGASB Statement No. 63 "Financial Reporting of Deferred Outflows of Resources, Deferred Inflows of Resources and Net Position" and GASB Statement No. 65 "Items Previously Reported in Assets and Liabilities".
99
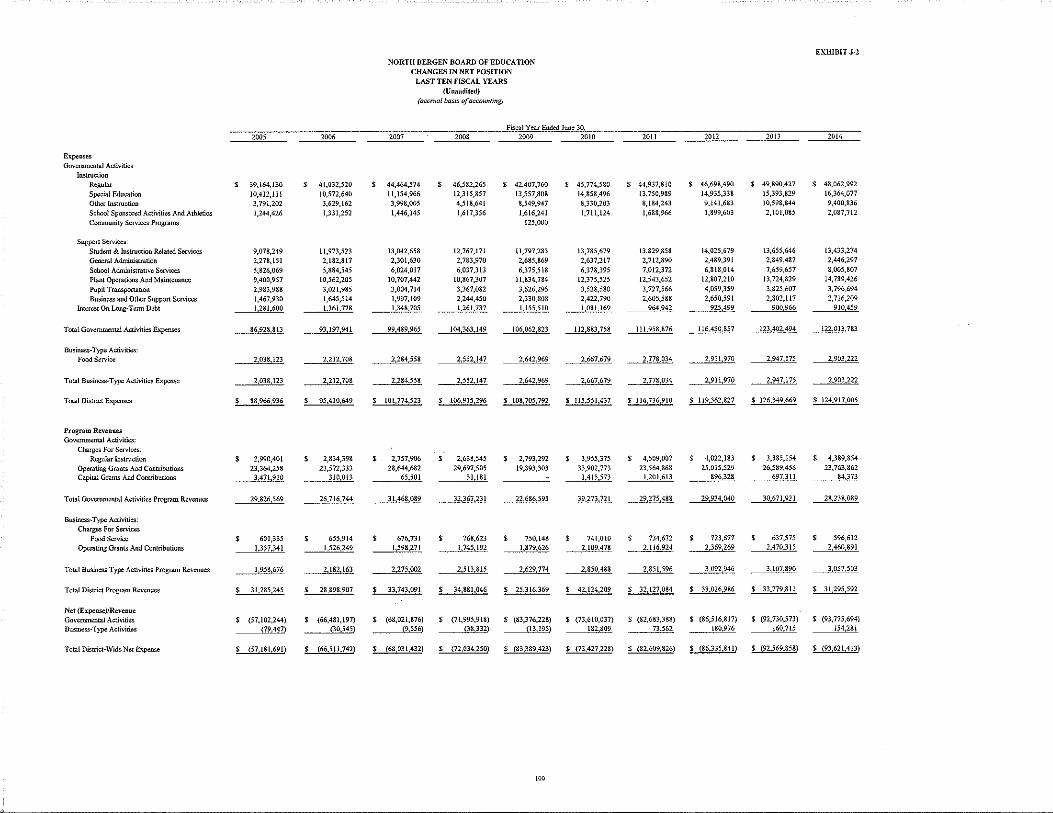
EXHIBIT J·2
NORTH BERGEN BOARD OF EDUCATION CHANGES IN NET POSITION
LAST TEN FISCAL YEARS (Unaudited)
(accn•al basis ofaccmmling)
Fiscal Year Ende<l June 30,
~ 2006 2007 2008 2009 2010 2011 2012 20!3 2014
Expenses Governmemal Activities
Instruction Regular $ 39,164,130 $ 41,032,520 $ 44,464,574 $ 46,582,265 $ 42,407,760 $ 45,774,580 $ 44,937,810 $ 46,698,490 $ 49,890,427 $ 48,062,992
Special Education 10,412,111 10,572,640 11,154,966 12,315,857 13,557,808 14,858,496 13,750,989 14,935,338 15,393,829 16,364,077
Other Instruction 3,791,202 3,629,162 3,998,005 4,518,641 8,549,947 8,330,203 8,184,243 9,141,683 10,598,844 9,400,836
School Sponsored Activities And Athletics 1,244,426 1,331,252 1,446,145 1,617,356 1,616,241 1,711,124 1,688,966 1,899,603 2,101,085 2,087,712
Community Services Pmgrnms 125,000
Support Services: Studdlt & Instruction Related Services 9,078,249 11,973,523 13,042,658 12,767,171 11,797,283 13,785,679 13,829,858 14,025,679 13,655,646 13,433,274
Ge=al Administration 2,278,151 2,182,811 2,301,630 2,783,970 2,685,869 2,637,217 2,712,890 2,489,391 2,849,487 2,446,297
School Administrative Servic.:s 5,826,069 5,884,545 6,024,017 6,037,313 6,315,518 6,378,395 7,012,372 6,818,014 7,659,657 8,005,807
Plant Operntions And Maintenance 9,400,957 10,562,205 10,707,442 10,867,307 I 1,834,784 12,375,525 12,543,652 12,807,210 13,724,829 14,789,426
Pupil Transportation 2,983,988 3,021,985 3,004,714 3,367,082 3,626,295 3,528,580 3,727,566 4,059,359 3,825,607 3,796,694
Business and Other Support Services 1,467,930 1,645,514 1,997,109 2,244,450 2,330,808 2,422,790 2,605,588 2,650,591 2,802,117 2,716,209 Interest On Long-T~nn Debt I 281 600 U61,7?8 1,348,705 1,261,137 1,155,510 I 081,169 964,942 __ 925,499 900.966 910.459
Total Governmental Activities Expenses 86,928,813 93,197,941 99 489 965 104,363 149 106 062,823 I 12 883 758 lll,958,876 116,450,857 123 402 494 122 013,783
Business-Twe Activities: Food S~rvice 2 038 !23 2,212,708 2,284 558 2552,147 2,642,969 2,667,679 2 778,034 2,911,970 2,947,175 ~222
Total Business-Twe Activities Expense 2,038,123 2 212 708 2 284.558 2 552,147 2,642 969 2 667 679 2,778,034 2 9li 970 2947175 1,903 222
Total District Expenses $ 88,966,936 $ 95,410,649 $ 101,774,57) $ 19§,~!~.296 $ 108,70?,792: ~ _115,551,437 s 114,736,910 $ 119,362,827 $ 126,349,669 $ 124,917,005
Prugram Revenues Governmental Activiti.:s:
Charges For Sesvices: Regular Instruction $ 2,990,401 $ 2,834,398 $ 2,757,906 $ 2,638,545 $ 2,793,292 $ 3,955,375 $ 4,509,007 $ 4,022,183 $ 3,385,154 $ 4,389,854
Operating Grnnts And Contributions 23,364,258 23,572,333 28,644,682 29,697,505 19,893,303 33,902,773 23,564,868 25,015,529 26,589,456 13,763,862
Capita! Grnnts And Contributions 3 471910 310,013 65 501 31 181 I 415,573 1,201,613 896,328 697 31i --~"~·373
Total Governmental Activities Pmgrnm R<:venues 29,826 569 26,716,744 31 468 089 32 367 231 22 686 595 39,273 721 29,275,488 29,934 040 30,671 921 ~089
B~iness-Type Activiti.:s: Charges For Services
Food Service $ 601,335 $ 655,914 $ 676,731 $ 768,623 $ 750,148 $ 741,010 $ 734,672 $ 723,677 $ 637,575 $ 596,612
Operating Grants And Comributions I 357341 1,526,249 1598,271 I 745 192 1,879,626 2 109,478 2,il6,924 2,369,269 2,470 315 ~891
Total Business Twe Activities Program Revdlues I 958 676 2,182,163 2,275,002 2513815 2 629,774 2 850 488 2,851596 3,092 946 3 107 890 3,057,503
Total District Program Revenues $ 31,785,245 $ 28,898,907 $ 33,743,091 $ ~4.881,04~ $ 25,316,369 $ 4:!,124,209 $ 32,127,0M $ 33,026,986 $ 33,779,811 $ 31,295,592
Net (Expense)/Reveoue
GovciJliTleiltal Activities $ (57,102,244) $ (66,481,197) $ (68,021,876) $ (71,995,918) $ (83,376,228) $ (73,610,037) $ (82,683,388) $ (86,516,817) $ (92,730,573) $ (93,775,694)
Business-Twe Activities (79 447) (30,545) ('! 556) (38 332) (13,!95) 182 809 73,562 180,976 !60,715 154 28!
Total District-Wide Net Expense $ (57,181,691) $ (66,511,742) $ (68,03l,432) $ (72,034,250) $ (83,389,423) $ {73,427,228) $ (82,609,826) $ (86,335,MI) $ (92,569,858) $ (93,621,413)
•oo
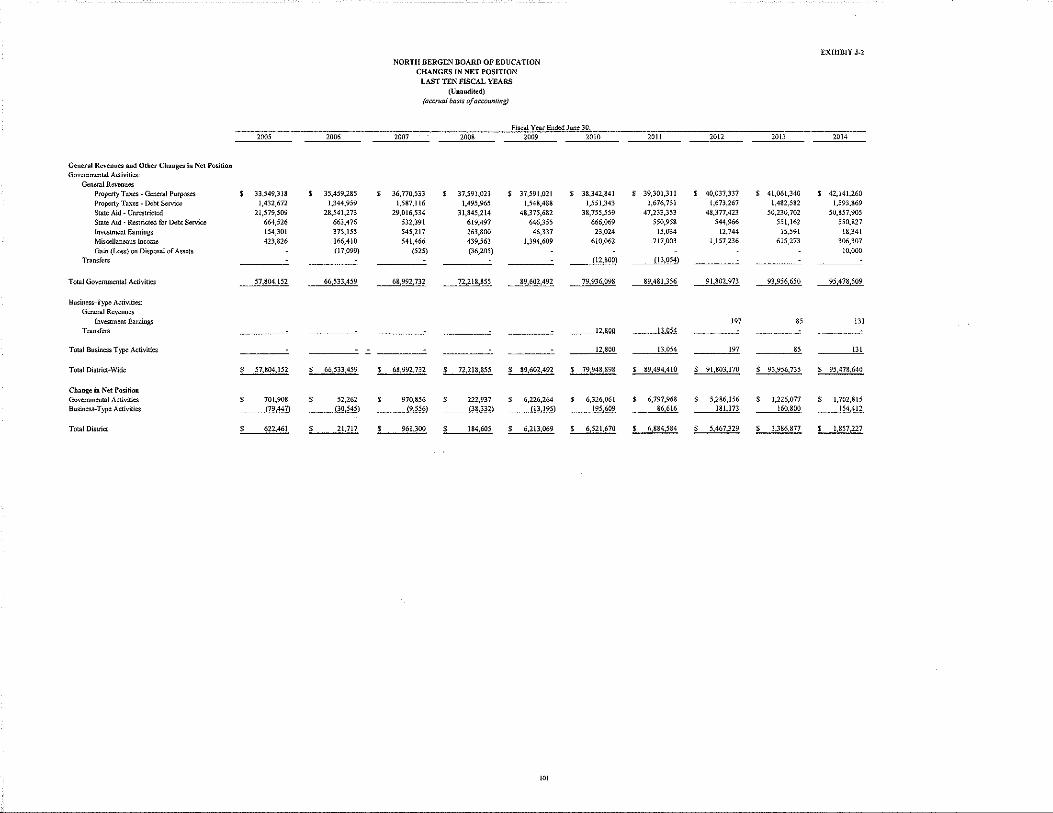
EXHIBIT J-2
NORTH BERGEN BOARD OF EDUCATION CHANGES IN NET POSITION
LAST TEN FISCAL YEARS (Unaudited)
(accrual basis afaccaunling)
Fiscal Year Ended June 30, ------------2005 2006 2007 2008 2009 20l0 201! 2012 20l3 2014
General Revenues and Otber Changes in Net Positio" Govemlll<!ntal Activities·
General Revenues Property Tax~s- General Purposes $ 33,549,3!8 $ 35,459,285 $ 36,770,533 $ 37,591,021 $ 37,591,021 $ 38,342,841 s 39,301,311 $ 40,037,337 $ 41,061,340 $ 42,141,260
Property Taxes- Debt Servi~ 1,432,672 1,344,959 1,587,116 1,495,965 1,548,488 1,551,343 1,676,751 1,673,267 1,482,582 1,593,869
Stat~ Aid- Unrestricted 21,579,509 28,541,273 29,016,534 31,845,214 48,375,682 38,755,559 47,233,353 48,377,423 50,230,702 50,857,905 State Aid - Restricted for Debt Service 664,526 663,476 532,39! 619,497 646,355 666,069 550,958 544,966 551,162 550,827
Investment Earnings 154,301 375,155 545,217 263,800 46,337 23,024 15,034 12,744 15,591 18,341 Mil!cellaneous Income 423,826 166,410 541,466 439,563 1,394,609 610,062 717,003 1,157,236 6!5,273 306,307
Gain (Loss) on Disposal of Ass~ts (17,099) (525) (36,205) 10,000 Transfers (12,800) (13,054)
Total Governmental Activities 57,804,152 66,533,459 68,992,732 72,218,855 89,602,492 79 936 098 89,481356 91802 973 93,956,650 ~509
Business-Type Activities: General Revenu~s
Investment Earnings "' 85 131 Transfers 12 800 l3 054
Total Business Type Activities 12,800 13,054 197 85 131
Total District-Wide $ 57,804,152 $ 66,533,459 $ 68 992,732 $ 72,218,855 $ 89,602,492 ' 79,94a_898 $ 89,494,410 $ 9!,803,170 $ 93,956,735 $ 95,478,640
Change in Net Position Govemm¢lltal Activitios $ 701,908 $ 52,262 $ 970,856 $ 222,937 $ 6,226,264 ' 6,326,061 ' 6,797,968 $ 5,2&6,156 $ 1,226,on s 1,702,815 Busin=-Type Activities (79,447) (30,545) (9,556) (38,332) (13,195) !95,609 86,616 181,173 !60,800 ~412
Total District $ 622,46! $ 21,717 • 96!,300 $ 184,605 $ 6,213,069 $ 6,521.670 ' 6,884,584 $ 5,467,329 $ 1_386,877 $ 1,857,227
101

EXHIBIT J-3 NORTH BERGEN BOARD OF EDUCATION
FUND BALANCES- GOVERNMENTAL FUNDS LAST TEN FISCAL YEARS
(Unaudited) (modified accn~al basis of accounting)
Fiscal Year Ended June 30, 2005 2006 "2007 2008 2009 2010 20ll 2012 2013 2014
General Fund Reserved $ 128,211 $ 427,161 $ 1,598,446 $ 275,554 $ 6,127,537 $ 5,766,175 Unreserved 1,026,227 2,930,849 411,402 {199,833) (2,354,090) {2,716,512) Restricted $ 7,194,281 $ 7,605,189 $ 10,231,727 $ 16,046,061 Committed 104,291 422,972 88,967 26,686 Assi~'lled 1,219,248 4,259,700 4,652,890 3,503,405 Unassigned --- (2,813,482) (2,984,615) (3,317,010) (4,726,127)
Total General Fund $ 1,154,438 $ 3,358,010 $ 2,009,848 $ 75,721 $ 3,773,447 $ 3,049,663 $ 5 704 338 $ 9,303,246 $ 11,656,574 $ 14,850,025
All Other Govenunental Funds Reserved $ 3,617,301 $ 782,966 $ 911,162 $ 31,037 $ 31,037 $ 2,246,942 Unreserved 15,588 {288,783) 187,138 (272,039) 1,160,124 1,659,195 Restricted $ 4,388,642 $ 3,489,567 $ 2,335,710 $ 3,694,101 Unassigned (5,000)
Total All Other Governmental Funds $ 3,632,889 $ 494,183 $ 1,098,300 $ (241,002) $ l,l91,16l $ 3,906,137 $ 4,388,642 $ 3,489,567 $ 2,330,710 $ 3,694,101
Beginning with 2010/2011 Fiscal Year, the District implemented GASB Statement No. 54, "Fund Balance Reporting and Governmental Fund Type Definitions". The Statement provides more clearly defined fund balance categories to make the nature and extent of the constraints placed on a governmenfs fund balance more transparent. This Statement established fund balance classifications that comprise a hierarchy based primarily on the extent to which a government is bound to observe constraints imposed upon the use of the resources reported in govenunental funds. Reclassification of prior year fund balance amounts to comply with Statement No. 54 is not required.
102
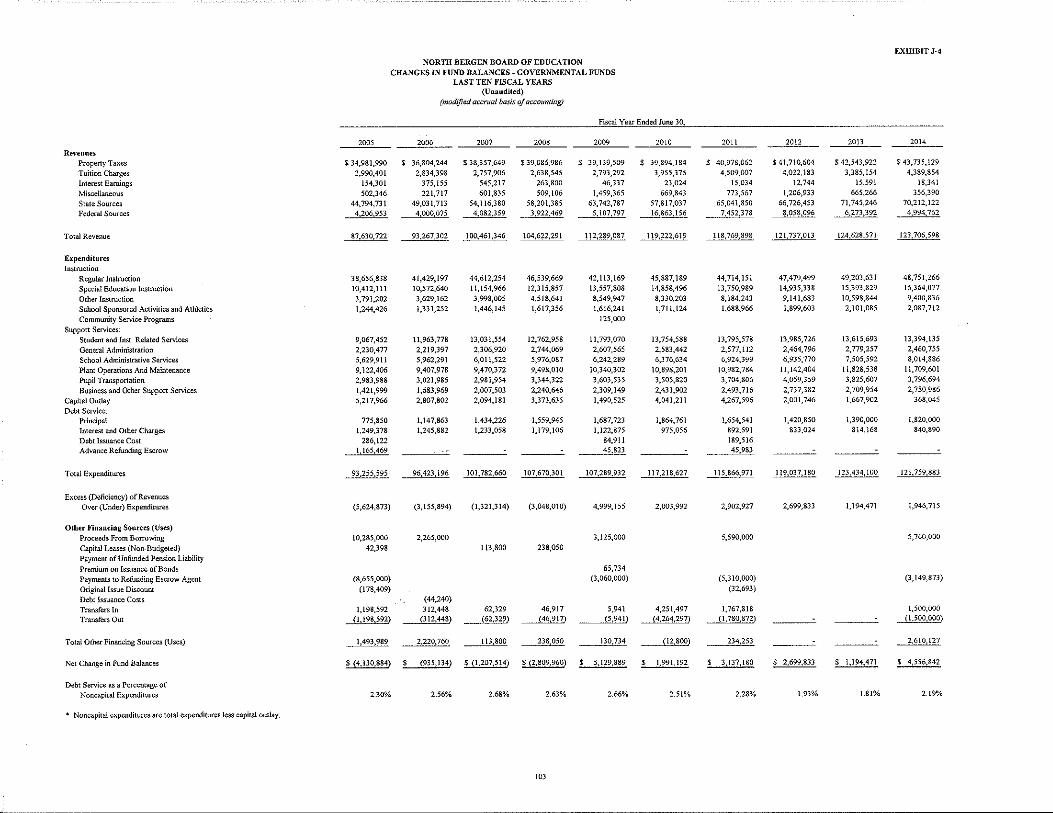
EXHIBIT J-4
NORTH BERGEN BOARD OF EDUCATION CHANGES IN FUND BALANCES- GOVERNMENTAL FUNDS
LAST TEN FISCAL YEARS (Unaudited)
(modified accrual basis of accounting)
Fiscal Year Ended June 30,
2005 2006 2007 2008 2009 2010 2011 2012 2013 2014
ReYenues Property Taxes $34,981,990 $ 36,804,244 $ 38,357,649 $ 39,086,986 $ 39,139,509 $ 39,894,184 $ 40,978,062 $41,710,604 $ 42,543,922 $43,735,129
Tuition Charges 2,990,401 2,834,398 2,757,906 2,638,545 2,793,292 3,955,375 4,509,007 4,022,183 3,385,154 4,389,854
Interest Earnings 154,301 375,155 545,217 263,800 46,337 23,024 15,034 12,744 15,591 18,341
Miscellaneous 502,346 221,717 601,835 509,106 1,459,365 669,843 773,567 1,206,933 665,266 356,390
State Sources 44,794,731 49,031,713 54,ll6,380 58,201,385 63,742,787 57,817,037 65,041,850 66,726,453 71,745,246 70,212,122
Federal Sources 4,206,953 4,000 075 4 082,359 3,922,469 5,107,797 16,863,156 7,452,378 8 058 096 6 273,392 4,994,762
Total Revenue 87 630 722 93,267,302 100,461,346 104,622,291 112 289 087 119,222,619 ll8,769 898 121,737,013 124 628 571 123,706,598
Expenditures Instn.tction
Regular Instruction 38,656,838 41,429,197 44,612,254 46,539,669 42,113,169 45,887,189 44,714,151 47,479,499 49,203,631 48,751,266
Special Education Instruction 10,412,ll1 10,572,640 11,154,966 12,315,857 13,557,808 14,858,496 13,750,989 14,935,338 15,393,829 16,364,077
Other Instruction 3,791,202 3,629,162 3,998,005 4,518,641 8,549,947 8,330,203 8,184,243 9,141,683 10,598,844 9,400,836
School Sponsored Activities and Athletics 1,244,426 1,331,252 1,446,145 1,617,356 1,616,241 1,711,124 1,688,966 1,899,603 2,101,085 2,087,712
Community Service Programs 125,000
Support Services: Studem and Inst. Related Services 9,067,452 11,963,778 13,031,554 12,762,958 11,793,070 13,754,588 13,795,578 13,985,726 13,615,693 13,394,\35
General Administration 2,230,477 2,219,397 2,306,920 2,744,069 2,607,565 2,583,442 2,577,112 2,464,796 2,779,257 2,460,755
School Administrative Services 5,629,911 5,962,291 6,011,522 5,976,087 6,242,289 6,376,634 6,924,399 6,935,770 7,505,592 8,014,886
Plant Operations And Maintenance 9,122,406 9,407,978 9,470,372 9,498,010 10,340,302 10,898,201 \0,982,784 11,142,404 11,828,538 I 1,709,601
Pupil Transportation 2,983,988 3,021,985 2,981,954 3,344,322 3,603,535 3,505,820 3,704,806 4,059,359 3,825,607 3,796,694
Business and Other Support Services 1,421,999 1,683,969 2,007,503 2,240,646 2,309,149 2,431,902 2,493,716 2,737,382 2,709,954 2,750,986
Capital Outlay 5,217,966 2,807,802 2,094,181 3,373,635 1,490,525 4,041,211 4,267,596 2,001,746 1,667,902 368,045
Debt Service: Principal 775,850 1,147,863 1,434,226 1,559,945 1,687,723 1,864,761 1,654,541 1,420,850 1,390,000 1,820,000
Interest and Other Charges 1,249,378 1,245,882 1,233,058 1,179,106 1,122,875 975,056 892,591 833,024 814,168 840,890
Debt Issuance Cost 286,122 84,911 189,516 Advance Refunding Escrow ~469 45,823 45,983
Total Expenditures 93,255,595 96,423,196 101,782,660 107,670,301 107,289,932 117,218,627 I 15,866,971 119,037,180 123,434,100 121,759,883
Excess (Deficiency) of Revenues Over (Under) Expenditures (5,624,873) (3,155,894) (1,321,314) (3,048,010) 4,999,155 2,003,992 2,902,927 2,699,833 1,194,471 1,946,715
Other Financing Sources (Uses) Proceeds From Borrowing 10,285,000 2,265,000 3,125,000 5,590,000 5,760,000
Capital Leases (Non-Budgeted) 42,398 J 13,800 238,050
Paymem of Unfunded Pension Liability Premium on Issuance ofBonds 65,734
Payments to Refunding Escrow Agent (8,655,000) (3,060,000) (5,310,000) (3,149,873)
Original Issue Discount (178,409) (32,693)
Debt Issuance Costs (44,240)
Transfers In 1,198,592 312,448 62,329 46,917 5,941 4,251,497 1,767,818 1,500,000
Transfers Out (1,198,592} (312,448) (62,329) (46,917) (5 941) (4,264,297) (1,780,872) (1,500,000}
Total Other Financing Sources (Uses) 1493 989 2,220,760 113,800 238 050 130 734 {12,800) 234,253 ~127
Net Change in Fund Balances $ (4,130,884) $ (935,134) $ (1,207,514) $ (2,809,960) $ 5,129,889 $ 1,991,192 $ 3,137,!80 $ 2,699,833 $ 1,194,471 $ 4,556,842
Debt Service as a Percentage of Noncapital Expenditures 2_30% 2.56% 2.68% 2.63% 2.66% 2.51% 2.28% l.93% 1.81% 2.19%
* Noncapita! expenditures are total expenditures less capital ou!lay.
103

EXHIBIT J-5
NORTH BERGEN BOARD OF EDUCATION
GENERAL FUND OTHER LOCAL REVENUE BY SOURCE
LAST TEN FISCAL YEARS
(Unaudited)
Fiscal
Year Ended Interest on June 30. Tuition Investments Refunds E-Rate Solar Energy Gate Receipts Miscellaneous Total
2005 $ 2,990,40! $ !43,058 $ 20,!!6 $ !7!,443 $ !9,!48 $ 2!3,!!9 $ 3,557,285
2006 2,834,398 352,7!8 88,774 !5,252 62,384 3,353,526
2007 2,757,906 53!,767 74,!03 322,630 !8,407 !26,326 3,83!,!39
2008 2,638,545 245,982 4,678 !65,697 9,663 259,525 3,324,090
2009 2,793,292 40,396 20,35! 205,965 !2,928 !75,372 3,248,304
20!0 3,955,375 22,998 !04,983 !02,000 $ !79,475 6,302 !45,0!9 4,5!6,!52
20!! 4,509,007 15,023 22,706 224,648 220,467 !!,!79 237,450 5,240,480
20!2 4,022,!83 !2,744 98,55! 239,348 360,500 2,684 456, !53 5,192,163
20!3 3,385,!54 !5,59! !2!,308 25!,647 6!,6!7 4,440 !76,26! 4,0!6,0!8
20!4 4,389,854 !8,34! 43,878 !!6,532 !!,357 !34,540 4,7!4,502
Source: District records
104
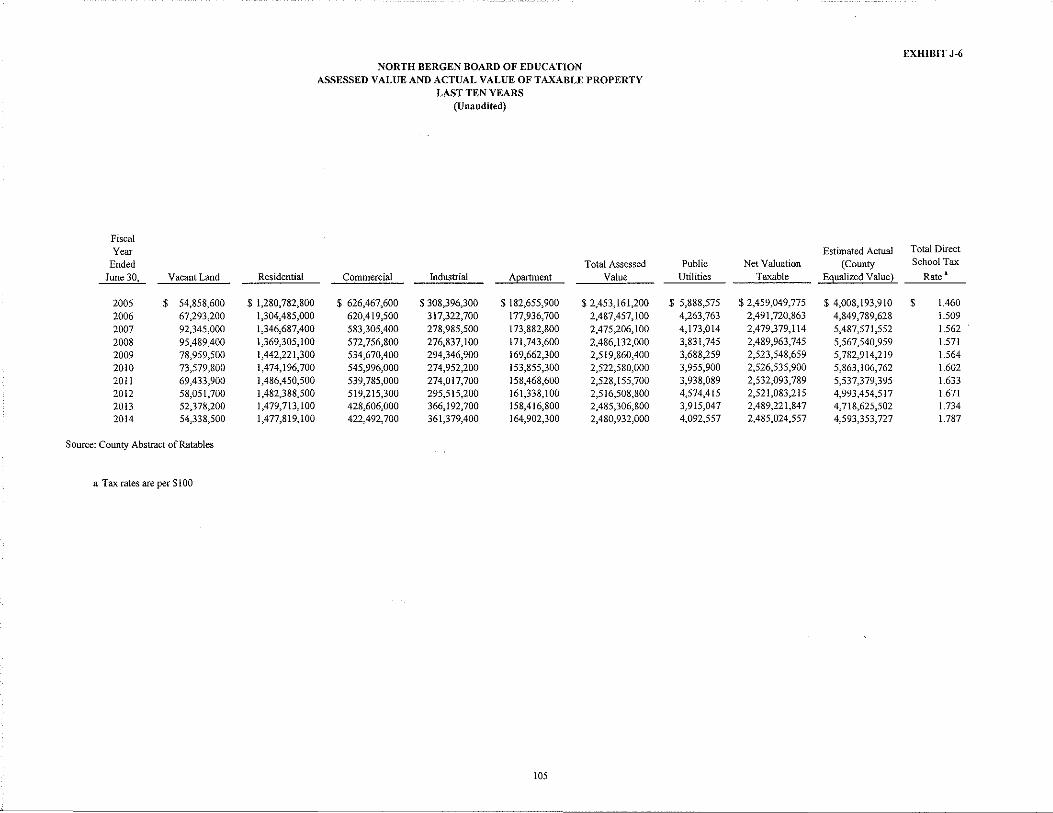
Fiscal Year
Ended June 301.,_ Vacant Land Residential
2005 $ 54,858,600 $ 1,280,782,800 2006 67,293,200 1,304,485,000 2007 92,345,000 1,346,687,400 2008 95,489,400 1,369,305,100 2009 78,959,500 1,442,221,300 2010 73,579,800 1,474,196,700 2011 69,433,900 1,486,450,500 2012 58,051,700 I ,482,388,500 2013 52,378,200 1,479,713,100 2014 54,338,500 1,477,819,100
Source: County Abstract of Ratables
a Tax rates are per $100
NORTH BERGEN BOARD OF EDUCATION ASSESSED VALUE AND ACTUAL VALUE OF TAXABLE PROPERTY
LAST TEN YEARS (Unaudited)
Total Assessed Commercial Industrial AQartment Value
$ 626,467,600 $ 308,396,300 $ 182,655,900 $ 2,453,161,200 620,419,500 317,322,700 177,936,700 2,487,457,100 583,305,400 278,985,500 173,882,800 2,475,206,100 572,756,800 276,837,100 171,743,600 2,486,132,000 534,670,400 294,346,900 !69,662,300 2,519,860,400 545,996,000 274,952,200 153,855,300 2,522,580,000 539,785,000 274,017,700 158,468,600 2,528,155,700 519,215,300 295,515,200 16!,338,!00 2,516,508,800 428,606,000 366,192,700 158,416,800 2,485,306,800 422,492,700 361,379,400 164,902,300 2,480,932,000
105
EXHIBIT J-6
Estimated Actual Total Direct
Public Net Valuation (County School Tax
Utilities Taxable Egualized Value) Rate a
$ 5,888,575 $ 2,459,049,775 $ 4,008,!93,9!0 $ 1.460 4,263,763 2,491,720,863 4,849,789,628 1.509 4,173,014 2,479,379,114 5,487,571,552 1.562 3,831,745 2,489,963,745 5,567,540,959 1.571 3,688,259 2,523,548,659 5,782,914,219 1.564 3,955,900 2,526,535,900 5,863,106,762 1.602 3,938,089 2,532,093,789 5,537,379,395 1.633 4,574,415 2,521,083,215 4,993,454,517 1.671 3,915,047 2,489,221,847 4,718,625,502 1.734 4,092,557 2,485,024,557 4,593,353,727 1.787
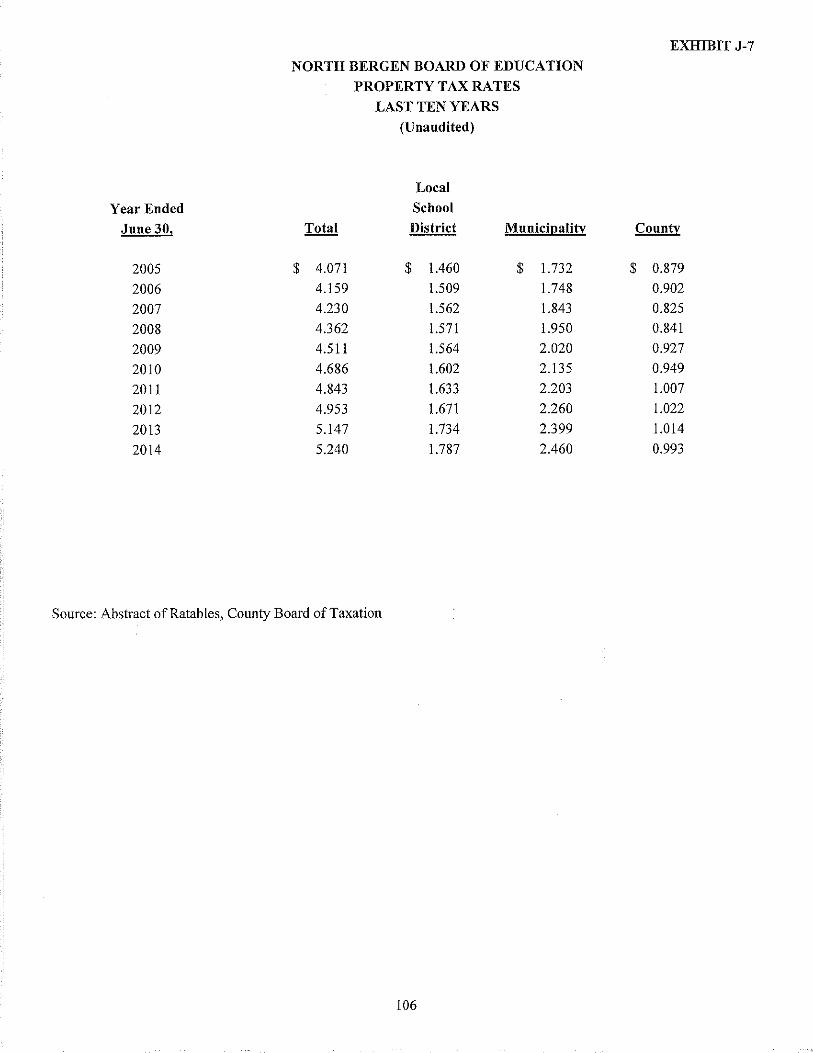
Year Ended
June 30,
2005
2006
2007
2008
2009
2010
2011
2012
2013
2014
NORTH BERGEN BOARD OF EDUCATION
PROPERTY TAX RATES
LAST TEN YEARS
(Unaudited)
Local
School
Total District Municipality
$ 4.071 $ 1.460 $ 1.732
4.159 1.509 1.748
4.230 1.562 1.843
4.362 1.571 1.950
4.511 1.564 2.020
4.686 1.602 2.135
4.843 1.633 2.203
4.953 1.671 2.260
5.147 1.734 2.399
5.240 1.787 2.460
Source: Abstract ofRatables, County Board of Taxation
106
EXHIBIT J-7
County
$ 0.879
0.902
0.825
0.841
0.927
0.949
1.007
1.022
1.014
0.993

Taxpayer
Hartz Mountain Development M-Industries LLC FCtrreeco Col. Pk. LLC 7912 River Road Apts., LLC Woodcliff Gardens 5851 West Side Associates, LLC Westview Tower Realty Co. Stone Henge Apartments LLC Target 210191st StLLC Hartz Mountain Associates LCI Holding, Inc. Mack Associates APA Transport Corporation N.B. Plaza- Lowe's Prop Mgt
Source: Municipal Tax Assessor
NORTH BERGEN BOARD OF EDUCATION PRINCIPAL PROPERTY TAXPAYERS,
CURRENT YEAR AND NINE YEARS AGO
(Unaudited)
2014
$
Taxable Assessed
Value
71,458,300 34,857,600 24,962,200 19,710,600 24,007,800 22,230,400 18,000,000 15,281,000 14,763,000 14,400,000
$ 259,670,900
107
%of Total District Net
Assessed Value
2.88% 1.40% 1.00% 0.79% 0.97% 0.89% 0.72% 0.61% 0.59% 0.58%
10.45%
EXHIBIT J-8
2005
$
Taxable Assessed
Value
58,000,000 24,960,000 23,956,000
18,000,000
18,212,000
123,163,300 60,652,600 30,048,500 30,861,900 19,959,000
$ 407,813,300
%of Total District Net
Assessed Value
2.36% 1.02% 0.97%
0.73%
0.74%
5.01% 2.47% 1.22% 1.26% 0.81%
16.59%

Fiscal Year
Ended June 30,
2005 2006 2007 2008 2009 2010 2011 2012 2013 2014
NORTH BERGEN BOARD OF EDUCATION PROPERTY TAX LEVIES AND COLLECTIONS
LAST TEN FISCAL YEARS (Unaudited)
Collected within the Fiscal Year of the Levy Collections in
Taxes Levied for Percentage Subsequent the Fiscal Year Amount of Levy Years
$ 34,981,990 $ 34,981,990 100.00% N/A 36,804,244 36,804,244 100.00% N/A 38,357,649 38,357,649 100.00% N/A 39,086,986 39,086,986 100.00% N/A 39,139,509 39,139,509 100.00% N/A 39,894,184 39,894,184 100.00% N/A 40,978,062 40,978,062 100.00% N/A 41,710,604 41,710,604 100.00% N/A 42,543,922 42,543,922 100.00% N/A 43,735,129 43,735,129 100.00% N/A
108
EXHIBIT J-9
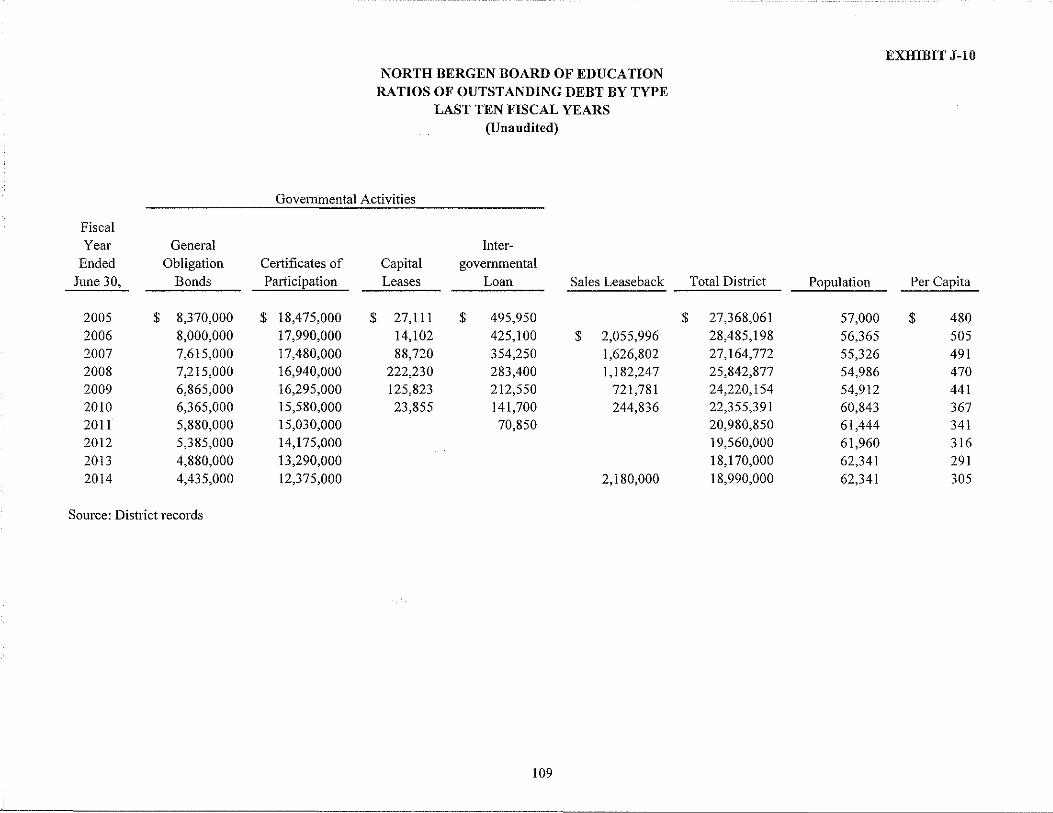
Fiscal Year General
Ended Obligation June 30, Bonds
2005 $ 8,370,000 2006 8,000,000 2007 7,615,000 2008 7,215,000 2009 6,865,000 2010 6,365,000 2011 5,880,000 2012 5,385,000 2013 4,880,000 2014 4,435,000
Source: District records
NORTH BERGEN BOARD OF EDUCATION RATIOS OF OUTSTANDING DEBT BY TYPE
LAST TEN FISCAL YEARS (Unaudited)
Governmental Activities
Inter-Certificates of Capital governmental Participation Leases Loan Sales Leaseback
$ 18,475,000 $ 27,111 $ 495,950 17,990,000 14,102 425,100 $ 2,055,996 17,480,000 88,720 354,250 1,626,802 16,940,000 222,230 283,400 1,182,247 16,295,000 125,823 212,550 721,781 15,580,000 23,855 141,700 244,836 15,030,000 70,850 14,175,000 13,290,000 12,375,000 2,180,000
109
EXHIBIT J-10
Total District Population ~erCapita
$ 27,368,061 57,000 $ 480 28,485,198 56,365 505 27,164,772 55,326 491 25,842,877 54,986 470 24,220,154 54,912 441 22,355,391 60,843 367 20,980,850 61,444 341 19,560,000 61,960 316 18,170,000 62,341 291 18,990,000 62,341 305
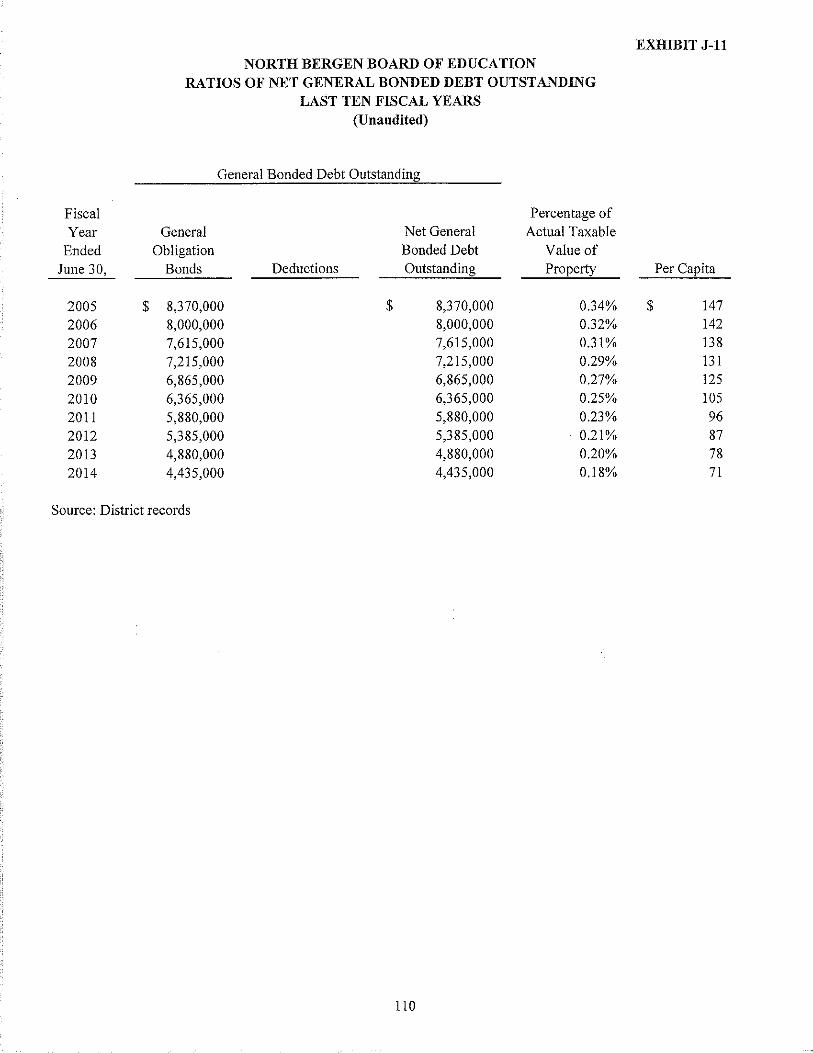
Fiscal Year
Ended June 30,
2005 $ 2006 2007 2008 2009 2010 2011 2012 2013 2014
NORTH BERGEN BOARD OF EDUCATION RATIOS OF NET GENERAL BONDED DEBT OUTSTANDING
LAST TEN FISCAL YEARS (Unaudited)
General Bonded Debt Outstanding
Percentage of General Net General Actual Taxable
Obligation Bonded Debt Value of Bonds Deductions Outstanding Property
8,370,000 $ 8,370,000 0.34% 8,000,000 8,000,000 0.32% 7,615,000 7,615,000 0.31%
7,215,000 7,215,000 0.29%
6,865,000 6,865,000 0.27%
6,365,000 6,365,000 0.25%
5,880,000 5,880,000 0.23%
5,385,000 5,385,000 0.21%
4,880,000 4,880,000 0.20%
4,435,000 4,435,000 0.18%
Source: District records
110
EXHIBIT J-11
Per Capita
$ 147 142 138 131 125 105 96 87 78 71

EXHIBIT J-12 NORTH BERGEN BOARD OF EDUCATION
COMPUTATION OF DIRECT AND OVERLAPPING DEBT AS OF DECEMBER 31, 2013
(Unaudited)
Direct Debt: North Bergen Board of Education (as of June 30, 2014) Township of North Bergen (I)
Total Direct Debt
Overlapping Debt Apportioned to the Municipality: Hudson County:
County of Hudson (A) North Bergen Municipal Utilities Authority
Total Overlapping Debt
Total Direct and Overlapping Debt
(A) The debt for this entity was apportioned by dividing the Municipality's 2013 equalized value by the total2013 equalized value for Hudson County.
Sources: (I) Township of North Bergen Annual Debt Statement
lll
$ 16,810,000 59342013
76,152,013
43,993,621 61,925,129
105,918,750
$ 182,070,763
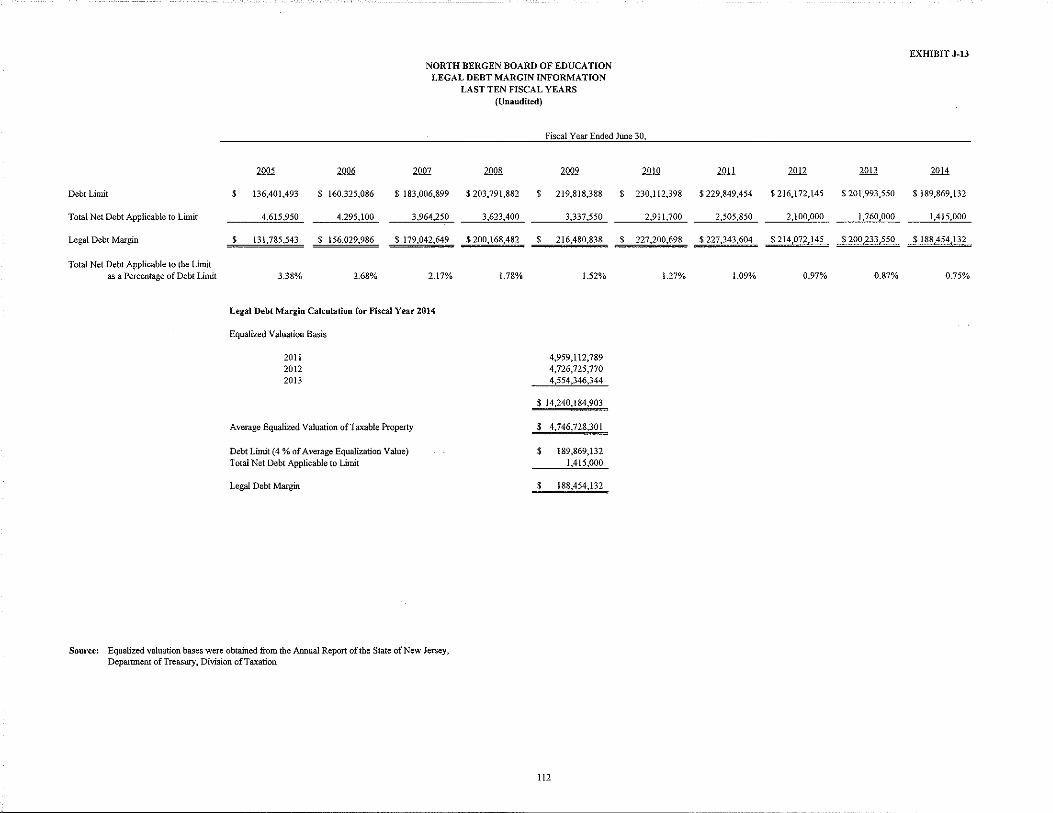
NORTH BERGEN BOARD OF EDUCATION LEGAL DEBT MARGIN INFORMATION
LAST TEN FISCAL YEARS (Unaudited)
Fiscal Year Ended June 30,
Debt Limit
Total Net Debt Applicable to Limit
Legal Debt Margin
Total Net Debt Applicable to the Limit as a Percentage of Debt Limit
2005 2006 2007
$ 136,401,493 $ 160,325,086 $ 183,006,899
4,615,950 4,295,100 3,964,250
$ 131,785,543 $ 156,029,986 $ 179,042,649
3.38% 2.68% 2.17%
Legal Debt Margin Calculation for Fiscal Year 2014
Equalized Valuation Basis
20ll 2012 2013
Average Equalized Valuation of Taxable Property
Debt Limit (4% of Average Equalization Value) Total Net Debt Applicable to Limit
Legal Debt Margin
Source: Equalized valuation bases were obtained from the Annual Report of the State of New Jersey, Department of Treasury, Division of Taxation
2008
$203,791,882
3,623,400
$200,168,482
1.78%
$
$
2009
219,818,388
3,337,550
216,480,838
1.52%
4,959,112,789 4,726,725,770 4,554,346,344
$ 14,240,184,903
$ 4,746,728,301
$ 189,869,132 1,415,000
$ 188,454,132
112
2010
$ 230,112,398
2,9ll,700
$ 227,200,698
1.27%
EXHIBIT J~13
.fQll 2012 2013 2014
$ 229,849,454 $216,172,145 $201,993,550 $ 189,869,132
2,505,850 2,100,000 1,760,000 1,415,000
$227,343,604 $ 214,072,145 $200,233,550 $ 188,454,132
1.09% 0.97% 0.87% 0.75%
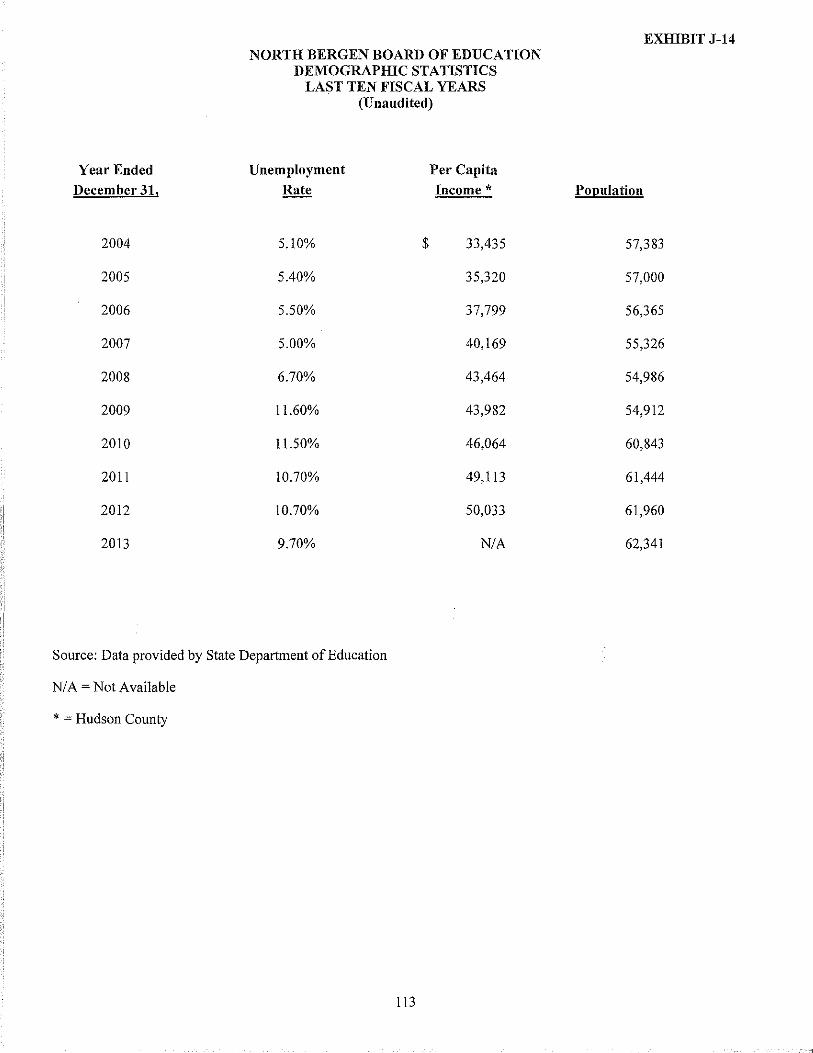
II H !
Year Ended December 31,
2004
2005
2006
2007
2008
2009
2010
2011
2012
2013
NORTH BERGEN BOARD OF EDUCATION DEMOGRAPHIC STATISTICS
LAST TEN FISCAL YEARS (Unaudited)
Unemployment Per Capita Rate Income*
5.10% $ 33,435
5.40% 35,320
5.50% 37,799
5.00% 40,169
6.70% 43,464
11.60% 43,982
11.50% 46,064
10.70% 49,113
10.70% 50,033
9.70% N/A
Source: Data provided by State Department of Education
N/A =Not Available
* = Hudson County
113
EXHIBIT J-14
Population
57,383
57,000
56,365
55,326
54,986
54,912
60,843
61,444
61,960
62,341
NORTH BERGEN BOARD OF EDUCATION PRINCIPAL EMPLOYERS
CURRENT YEAR AND NINE YEARS AGO (Unaudited)
INFORMATION NOT AVAILABLE
114
EXHIBIT J-15
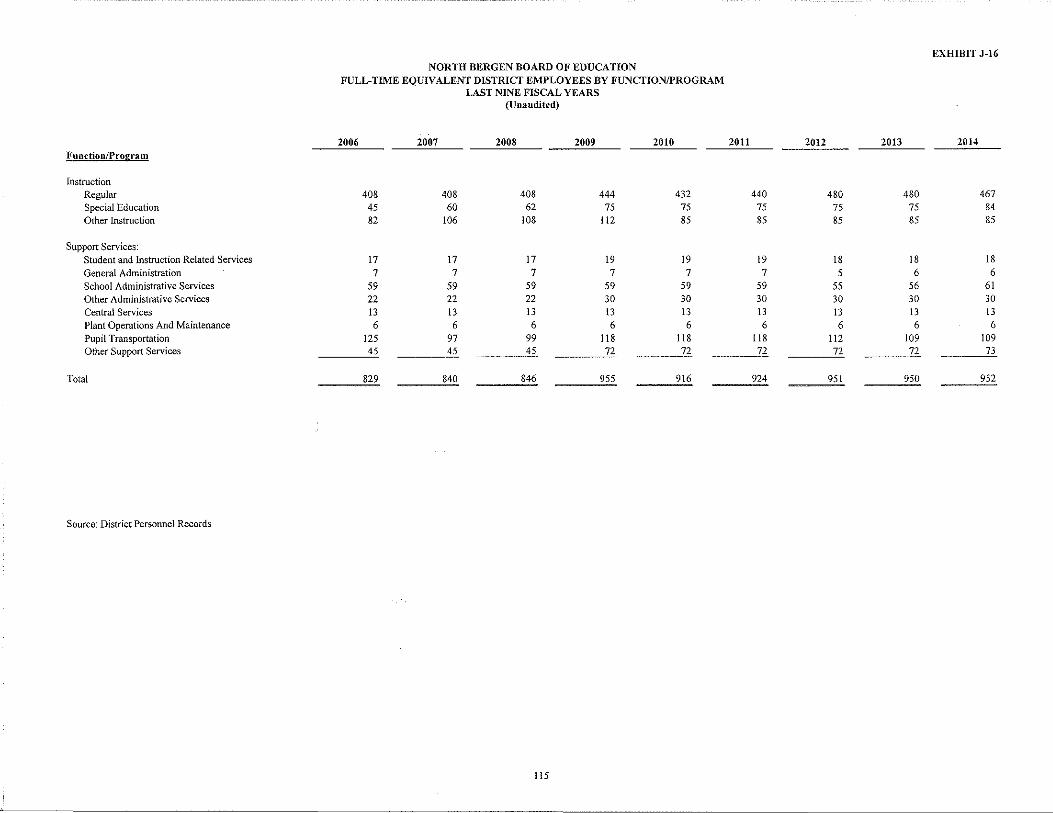
EXHIBIT J-16 NORTH BERGEN BOARD OF EDUCATION
FULL-TIME EQUIVALENT DISTRICT EMPLOYEES BY FUNCTION/PROGRAM LAST NINE FISCAL YEARS
(Unaudited)
2006 2007 2008 2009 2010 2011 2012 2013 2014 Function/Program
Instruction Regular 408 408 408 444 432 440 480 480 467 Special Education 45 60 62 75 75 75 75 75 84 Other Instruction 82 106 108 112 85 85 85 85 85
Support Services: Student and Instruction Related Services 17 17 17 19 19 19 18 18 18 General Administration 7 7 7 7 7 7 5 6 6 School Administrative Services 59 59 59 59 59 59 55 56 61 Other Administrative Services 22 22 22 30 30 30 30 30 30
Central Services 13 13 13 13 13 13 13 13 13 Plant Operations And Maintenance 6 6 6 6 6 6 6 6 6 Pupil Transportation 125 97 99 118 118 118 112 109 109 Other Support Services 45 45 45 72 72 72 72 72 73
Total 829 840 846 955 916 924 951 950 952
Source: District Personnel Records
115
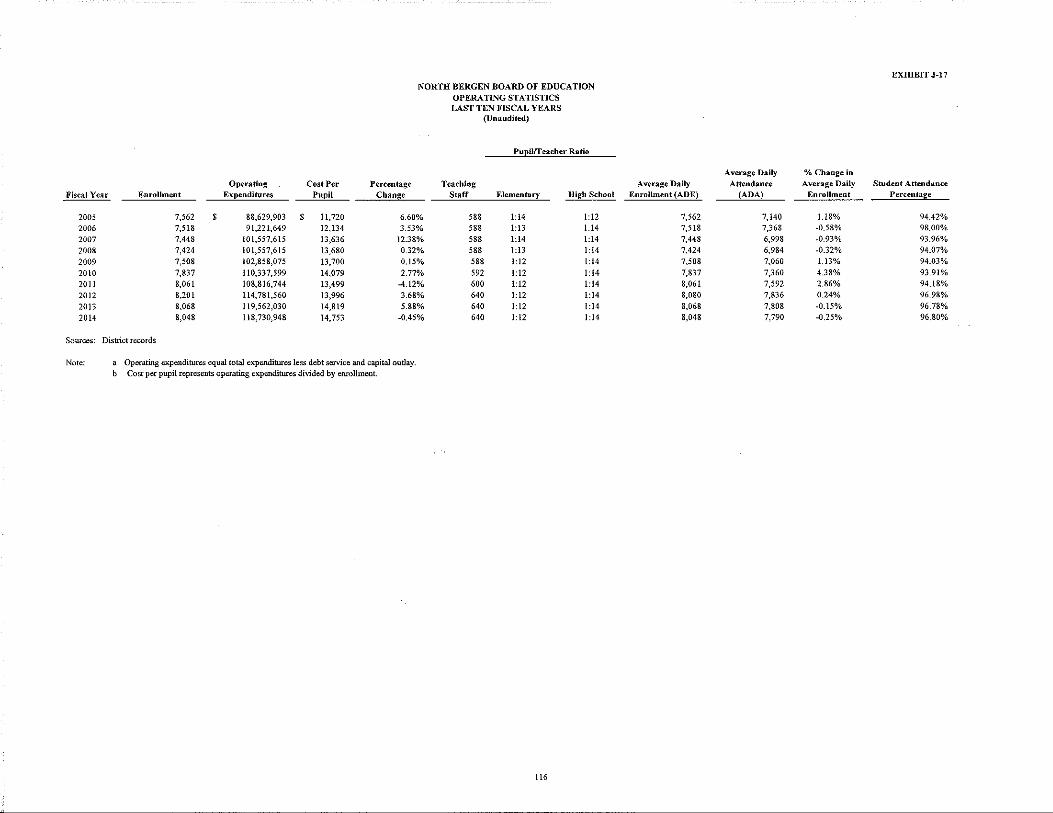
Fiscal Year Enrollment
2005 2006 2007 2008 2009 2010 2011 2012 2013 2014
Sources: District records
7,562 7,518 7,448 7,424 7,508 7,837 8,061 8,201 8,068 8,048
s
Operating Cost Per Expenditures Pupil
88,629,903 s 11,720 91,221,649 12,134
101,557,615 13,636 101,557,615 13,680 102,858,075 13,700 110,337,599 14,079 108,816,744 13,499 114,781,560 13,996 119,562,030 14,819 ll8,730,948 14,753
NORTH BERGEN BOARD OF EDUCATION OPERATING STATISTICS
Percentage Change
6.60% 3.53%
12.38% 0.32% 0.15% 2.77%
-4.12% 3.68% 5.88%
-0.45%
LAST TEN FISCAL YEARS (Unaudited)
Pupilffeacher Ratio
Teaching Staff Elementary High School
588 1:14 1:12 588 1:13 1.14 588 1:14 1:14 588 1:13 1:14 588 1:12 1:14 592 1:12 1:14 600 1:12 1:14 640 1:12 1:14 640 1:12 1:14 640 1:12 1:14
Note: a Operating expenditures equal total expenditures less debt service and capital ouday. b Cost per pupil represents operating expenditures divided by enrollment.
116
EXHIBIT J-17
Average Daily %Change in Average Daily Attendance Average Daily Student Attendance
Enrollment (ADE) (ADA) Enrollment Percentage
7,562 7,140 l.l8% 94.42% 7,518 7,368 -0.58% 98.00% 7,448 6,998 -0.93% 93.96% 7,424 6,984 -0.32% 94.07% 7,508 7,060 U3% 94.03% 7,837 7,360 4.38% 93.91% 8,061 7,592 2.86% 94.18% 8,080 7,836 0.24% 96.98% 8,068 7,808 -0.15% 96.78% 8,048 7,790 -0.25% 96.80%

EXHIBIT J-18
NORTH BERGEN BOARD OF EDUCATION SCHOOL BUILDING INFORMATION
LAST NINEFISCAL YEARS (Unaudited)
2006 2007 2008 2009 2010 2011 2012 2013 2014
District Building Elementary Robert Fulton/No. 2 ( 1926)
Square Feet 97,409 97,409 97,409 97,409 97,409 97,409 97,409 97,409 97,409 Capacity (students) 784 784 784 784 784 784 784 784 784 Enrollment 995 955 955 995 995 995 995 995 995
Fulton Annex Square Feet 18,800 18,800 18,800 18,800 18,800 18,800 18,800 18,800 18,800 Capacity (students) !55 !55 !55 !55 !55 !55 !55 !55 !55 Enrollment !44 !75 !75 !44 !44 !44 !44 !44 !44
Franklin School/No. 3 (1919) Square Feet 57,434 57,434 57,434 57,434 57,434 57,434 57,434 57,434 57,434 Capacity (students} 475 475 475 475 475 475 475 475 475 Enrollment 575 659 659 575 575 575 575 575 575
Franklin Annex (1999)
Square Feet 6,225 6,225 6,225 6,225 6,225 6,225 6,225 6,225 6,225 Capacity (students) 80 80 80 80 80 80 80 80 80 Enrollment 85 N/A N/A 85 85 85 85 85 85
Lincoln School/No. 5 (1915) Square Feet 58,246 58,246 58,246 58,246 58,246 58,246 58,246 58,246 58,246 Capacity (students) 550 550 550 550 550 550 550 550 550 Enrollment 659 682 682 659 659 659 659 659 659
Lincoln SchooVNo. 5 Annex (2004) Square Feet 62,300 62,300 62,300 62,300 62,300 62,300 62,300 62,300 62,300
Capacity (students) 352 352 352 352 352 352 352 352 352 Enrollment 436 40! 40! 436 436 436 436 436 436
J.F. Kennedy School/No. 7 (including Annex) Square Feet 94,125 94,125 94,125 94,125 94,125 94,125 94,125 94,125 94,125 Capacity (students) 662 662 662 662 662 662 662 662 662 Enrollment 538 540 540 538 538 538 538 538 538
Horace Mann School!No. 9 (1928)
Square Feet 98,068 98,068 98,068 98,068 98,068 98,068 98,068 98,068 98,068
Capacity (students) 836 836 836 836 836 836 836 836 836 Enrollment 1,023 1,026 1,026 1,023 1,023 1,023 1,023 1,023 1,023
McK.innely School/No. 10 (1919) Square Feet 46,050 46,050 46,050 46,050 46,050 46,050 46,050 46,050 46,050
Capacity (students) 426 426 426 426 426 426 426 426 426
Enrollment 4!9 4!8 4!8 4!9 4!9 419 419 419 4!9 High School North Bergen High. School (1961)
Square Feet 197,973 197,973 197,973 197,973 197,973 197,973 197,973 197,973 197,973
Capacity (students) 1,3'77 1,377 1,377 1,377 1,377 1,377 1,377 1,377 1,377
Enmllment 2,416 2,421 2,421 2,416 2,416 2,416 2,416 2,416 2,416
Other Central Administration (1961)
Square Feet 9,267 9,267 9,267 9,267 9,267 9,267 9,267 9,267 9,267
Number of Schools at June 30, 2014 Elementacy = 7 Senior High School= I Other""' 1
Source: District Records
ll7

School Facilities 2005
North Bergen High School $ 557,009
Franklin School 161,508
Horace Mann 233,072
John F. Kennedy 377,503
Lincoln School 272,871
McKinley 123,283
Robert Fulton 262,007
Total School Facilities $ 1,987,253
Source: School District Records
NORTH BERGEN BOARD OF EDUCATION GENERAL FUND
SCHEDULE OF REQUIRED MAINTENANCE FOR SCHOOL FACILITIES LAST TEN FISCAL YEARS
{Unaudited)
2006 2007 2008 2009 2010
$ 700,837 $ 544,339 $ 638,136 $ 595,942 $ 464,805
173,631 207,128 216,426 182,854 354,624
362,657 374,259 281,046 290,332 283,323
251,523 259,681 237,094 307,894 298,033
310,059 320,863 300,952 321,977 313,534
135,939 223,037 149,403 199,474 355,870
283,741 343,730 273,421 354,955 353,645
$ 2,218,387 $ 2,273,037 $ 2,096,478 $ 2,253,428 $ 2,423,834
118
EXHIBIT J-19
2011 2012 2013 20I4
$ 663,015 $ 676,438 $ 658,851 $ 637,900
202,033 195,036 198,994 183,520
270,101 249,303 306,554 271,850
319,207 296,193 295,791 282,963
370,947 328,705 313,341 278,965
184,365 197,378 193,450 195,682
367,238 316,534 304,485 278,950
$ 2,376,906 $ 2,259,587 $ 2,271,466 L2.129,830
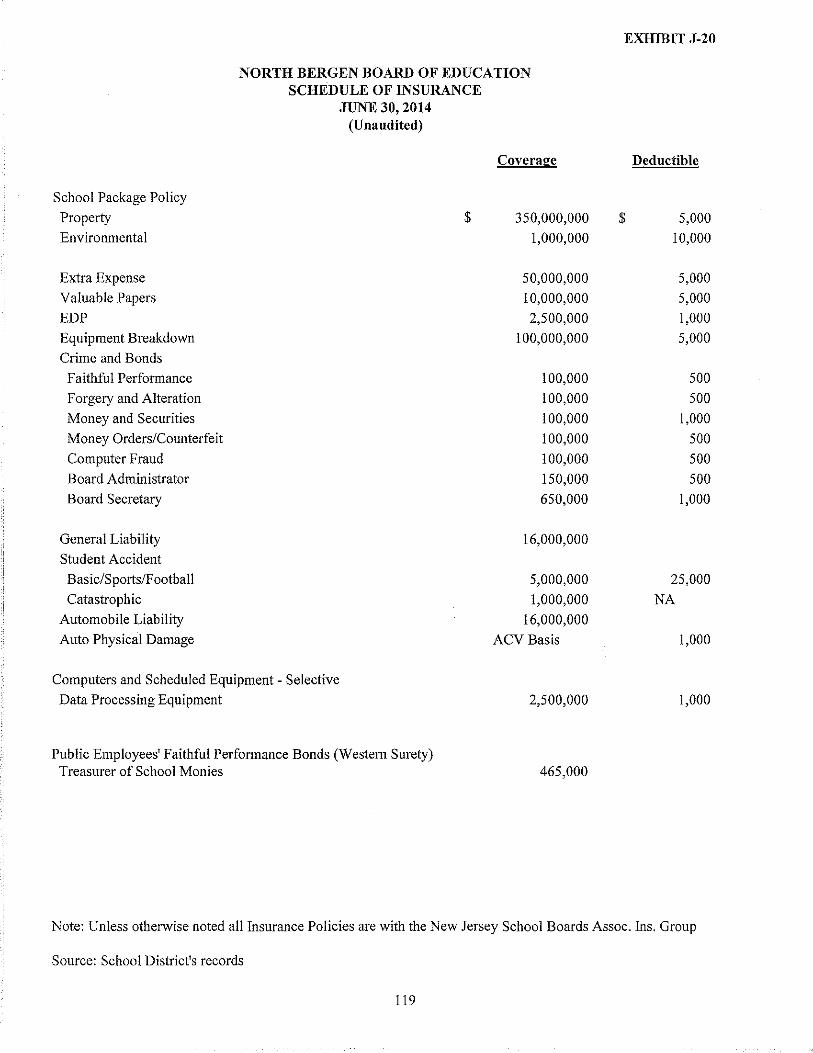
NORTH BERGEN BOARD OF EDUCATION SCHEDULE OF INSURANCE
School Package Policy
Property
Environmental
Extra Expense
Valuable Papers
EDP
Equipment Breakdown
Crime and Bonds
Faithful Performance
Forgery and Alteration
Money and Securities
Money Orders/Counterfeit
Computer Fraud
Board Administrator
Board Secretary
General Liability
Student Accident
Basic/Sports/Football
Catastrophic
Automobile Liability
Auto Physical Damage
Computers and Scheduled Equipment - Selective
Data Processing Equipment
JUNE 30, 2014 (Unaudited)
Public Employees' Faithful Performance Bonds (Western Surety) Treasurer of School Monies
$
Coverage
350,000,000
1,000,000
50,000,000
10,000,000
2,500,000
100,000,000
100,000
100,000
100,000
100,000
100,000
150,000
650,000
16,000,000
5,000,000
1,000,000
16,000,000
ACVBasis
2,500,000
465,000
EXHIBIT J-20
$
Deductible
5,000
10,000
5,000
5,000
1,000
5,000
500
500
1,000
500
500
500
1,000
25,000
NA
1,000
1,000
Note: Unless otherwise noted all Insurance Policies are with the New Jersey School Boards Assoc. Ins. Group
Source: School District's records
119

SINGLE AUDIT
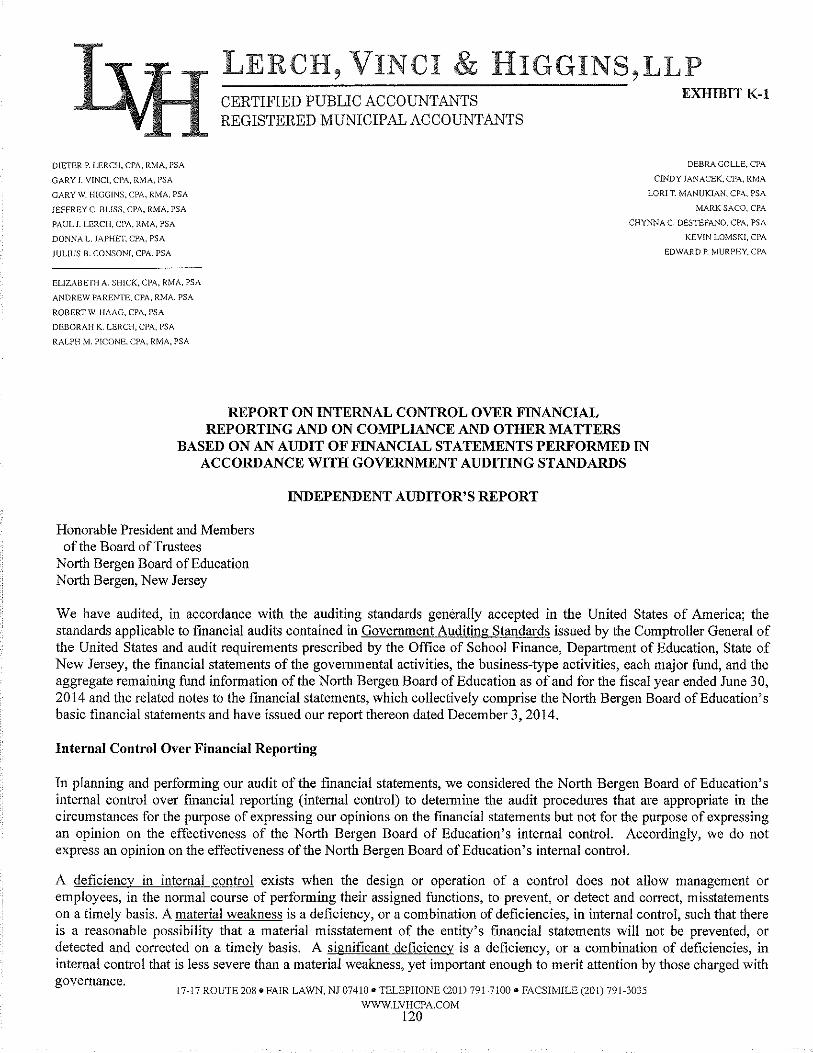
LERCH, VINCI & HIGGINS,LLP
DIETER P. LERCH, CPA, RMA, PSA
GARY J. VINCI, CPA, RMA, PSA
GARY W. HIGGINS, CPA, RMA, PSA
JEFFREY C. BLISS, CPA, RMA, PSA
PAUL J. LERCH, CPA, RMA, PSA
DONNA L JAPHET, CPA, PSA
JULIUS B. CONSONI, CPA, PSA
ELIZABETH A. SHICK, CPA, RMA, PSA
ANDREW PARENTE, CPA, RMA, PSA
ROBERT W. HAAG, CPA, PSA
DEBORAH K. LERCH, CPA, PSA
RALPH M. PICONE, CPA, RMA, PSA
CERTIFIED PUBLIC ACCOUNTANTS REGISTERED MUNICIPAL ACCOUNTANTS
EXHIBIT K-1
DEBRA GOLLE, CPA
CINDY JANACEK, CPA, RMA
LORI T. MANUKIAN, CPA, PSA
MARK SACO, CPA
CHYNNA C. DESTEFANO, CPA, PSA
KEVIN LOMSKI, CPA
EDWARD P. MURPHY, CPA
REPORT ON INTERNAL CONTROL OVER FINANCIAL REPORTING AND ON COMPLIANCE AND OTHER MATTERS
BASED ON AN AUDIT OF FINANCIAL STATEMENTS PERFORMED IN ACCORDANCE WITH GOVERNMENT AUDITING STANDARDS
Honorable President and Members of the Board of Trustees
North Bergen Board of Education North Bergen, New Jersey
INDEPENDENT AUDITOR'S REPORT
We have audited, in accordance with the auditing standards generally accepted in the United States of America; the standards applicable to financial audits contained in Government Auditing Standards issued by the Comptroller General of the United States and audit requirements prescribed by the Office of School Finance, Department of Education, State of New Jersey, the financial statements of the governmental activities, the business-type activities, each major fund, and the aggregate remaining fund information of the North Bergen Board of Education as of and for the fiscal year ended June 30, 2014 and the related notes to the financial statements, which collectively comprise the North Bergen Board of Education's basic financial statements and have issued our report thereon dated December 3, 2014.
Internal Control Over Financial Reporting
In planning and performing our audit of the financial statements, we considered the North Bergen Board of Education's internal control over financial reporting (internal control) to determine the audit procedures that are appropriate in the circumstances for the purpose of expressing our opinions on the financial statements but not for the purpose of expressing an opinion on the effectiveness of the North Bergen Board of Education's internal control. Accordingly, we do not express an opinion on the effectiveness of the North Bergen Board of Education's internal control.
A deficiency in internal control exists when the design or operation of a control does not allow management or employees, in the normal course of performing their assigned functions, to prevent, or detect and correct, misstatements on a timely basis. A material weakness is a deficiency, or a combination of deficiencies, in internal control, such that there is a reasonable possibility that a material misstatement of the entity's financial statements will not be prevented, or detected and corrected on a timely basis. A significant deficiency is a deficiency, or a combination of deficiencies, in internal control that is less severe than a material weakness, yet important enough to merit attention by those charged with governance.
17·17 ROUTE 208 • FAIR LAWN, Nl 074!0 • TELEPHONE C20ll791-7l00 • FACSIMILE (201) 791-3035 WWW.LVHCPA.COM
120

Our consideration of internal control was for the limited purpose described in the first paragraph of this section and was not designed to identifY all deficiencies in internal control that might be material weaknesses or significant deficiencies. Given these limitations, during our audit we did not identifY any deficiencies in internal control that we consider to be material weaknesses. However, material weaknesses may exist that have not been identified.
Compliance and Other Matters
As part of obtaining reasonable assurance about whether the North Bergen Board of Education's financial statements are free from material misstatement, we performed tests of its compliance with certain provisions of laws, regulations, contracts, and grant agreements, noncompliance with which could have a direct and material effect on the determination of financial statement amounts. However, providing an opinion on compliance with those provisions was not an objective of our audit, and accordingly, we do not express such an opinion. The results of our tests disclosed no instances of noncompliance or other matters that are required to be reported under Government Auditing Standards and audit requirements as prescribed by the Office of School Finance, Department of Education, State of New Jersey.
We noted certain matters that are not required to be reported under Government Auditing Standards that we reported to management of the North Bergen Board of Education in a separate report entitled, "Auditor's Management Report on Administrative Findings- Financial, Compliance and Performance" dated December 3, 2014.
Purpose of this Report
The purpose of this report is solely to describe the scope of our testing of internal control and compliance and the results of that testing, and not to provide an opinion on the effectiveness of the North Bergen Board of Education's internal control or on compliance. This report is an integral part of an audit performed in accordance with Government Auditing Standards in considering the North Bergen Board of Education's internal control and compliance. Accordingly, this communication is not suitable for any other purpose.
Fair Lawn, New Jersey December 3, 2014
121
J;11, !/;.. < ~ fh~~A ,{£/ r!ERCH, VINCI & fil~s, LLP Certified Public Accountants Public School Accountants
£~;;ptl Public School Accountant PSA Number CS00829
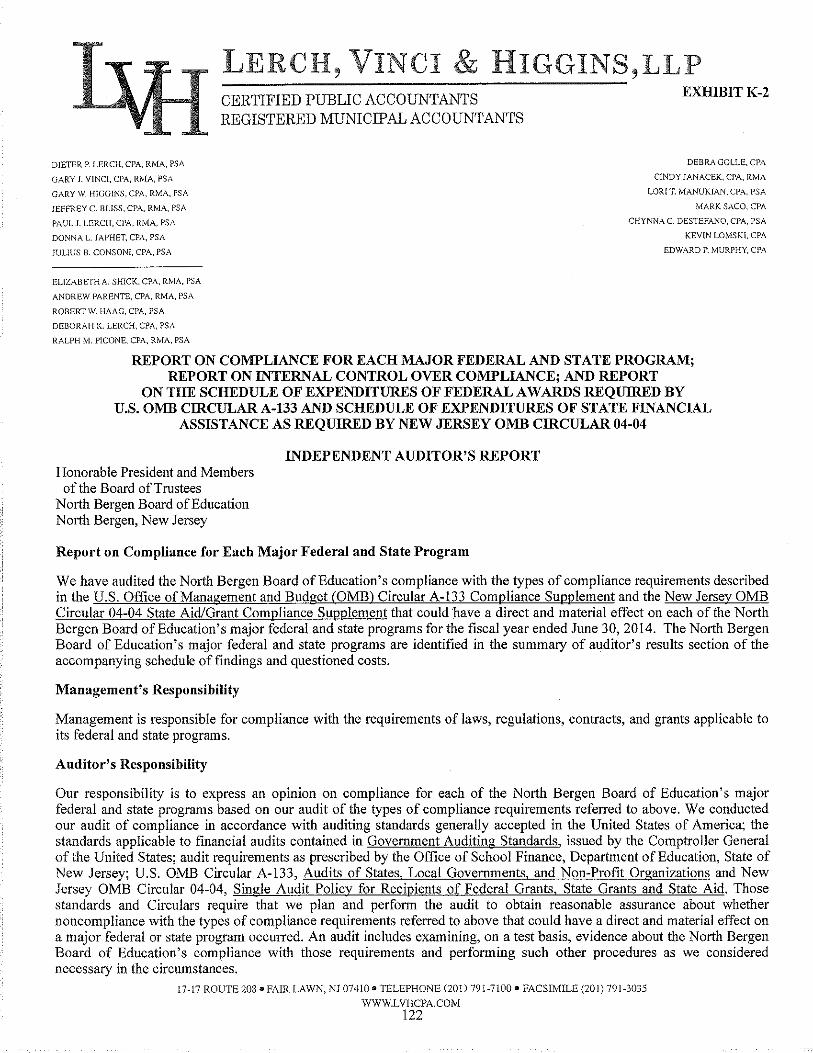
LERCH, VINCI & HIGGINS,LLP
DIETER P. LERCH, CPA, RMA, PSA
GARY J. VINCI, CPA, RMA, PSA
GARY W. HIGGINS, CPA, RMA, PSA
JEFFREY C. BLISS, CPA, RMA, PSA
PAUL J. LERCH, CPA, RMA, PSA
DONNA L.JAPHET, CPA, PSA
JULIUS B. CONSONI, CPA, PSA
ELIZABETH A. SHICK. CPA, RMA, PSA
ANDREW PARENTE, CPA, RMA, PSA
ROBERT W. HAAG, CPA, PSA
DEBOR1\H K. LERCH, CPA, PSA
RALPH M. PICONE, CPA, RMA, PSA
CERTIFIED PUBLIC ACCOUNTANTS REGISTERED MUNICIPAL ACCOUNTANTS
EXHIBITK-2
DEBRA GOLLE, CPA
CINDY JANACEK, CPA, RMA
LORIT. MANUKIAN,CPA, PSA
MARK SACO, CPA
CHYNNA C. DESTEFANO, CPA, PSA
KEVIN LOMSKI, CPA
EDWARD P. MURPHY, CPA
REPORT ON COMPLIANCE FOR EACH MAJOR FEDERAL AND STATE PROGRAM; REPORT ON INTERNAL CONTROL OVER COMPLIANCE; AND REPORT
ON THE SCHEDULE OF EXPENDITURES OF FEDERAL AWARDS REQUIRED BY U.S. O!VID CIRCULAR A-133 AND SCHEDULE OF EXPENDITURES OF STATE FINANCIAL
ASSISTANCE AS REQUIRED BY NEW JERSEY O!VID CIRCULAR 04-04
Honorable President and Members of tbe Board of Trustees
Nortb Bergen Board of Education Nortb Bergen, New Jersey
INDEPENDENT AUDITOR'S REPORT
Report on Compliance for Each Major Federal and State Program
We have audited the North Bergen Board of Education's compliance with the types of compliance requirements described in the U.S. Office of Management and Budget COMB) Circular A-133 Compliance Supplement and the New Jersey OMB Circular 04-04 State Aid/Grant Compliance Supplement that could have a direct and material effect on each of the North Bergen Board of Education's major federal and state programs for the fiscal year ended June 30, 2014. The North Bergen Board of Education's major federal and state programs are identified in tbe summary of auditor's results section of the accompanying schedule of findings and questioned costs.
Management's Responsibility
Management is responsible for compliance with the requirements of laws, regulations, contracts, and grants applicable to its federal and state programs.
Auditor's Responsibility
Our responsibility is to express an opinion on compliance for each of the North Bergen Board of Education's major federal and state programs based on our audit of the types of compliance requirements referred to above. We conducted our audit of compliance in accordance with auditing standards generally accepted in tbe United States of America; the standards applicable to financial audits contained in Government Auditing Standards, issued by tbe Comptroller General of the United States; audit requirements as prescribed by the Office of School Finance, Department of Education, State of New Jersey; U.S. OMB Circular A-133, Audits of States, Local Governments, and Non-Profit Organizations and New Jersey OMB Circular 04-04, Single Audit Policy for Recipients of Federal Grants, State Grants and State Aid. Those standards and Circulars require tbat we plan and perform tbe audit to obtain reasonable assurance about whether noncompliance with tbe types of compliance requirements referred to above that could have a direct and material effect on a major federal or state program occurred. An audit includes examining, on a test basis, evidence about tbe North Bergen Board of Education's compliance with those requirements and performing such other procedures as we considered necessary in the circumstances.
17-17 ROUTE 208 • FAIR LAWN, Nl 07410 • TELEPHONE C20lJ 791-7100 • FACSIMILE (201) 791-3035
WWW.LVHCPA.COM 122

We believe that our audit provides a reasonable basis for our opinion on compliance for each major federal and state program. However, our audit does not provide a legal determination of the North Bergen Board of Education's compliance.
Opinion on Each Major Federal and State Program
In our opinion, the North Bergen Board of Education complied, in all material respects, with the types of compliance requirements referred to above that could have a direct and material effect on each of its major federal and state programs for the fiscal year ended June 30, 2014.
Other Matters
The results of our auditing procedures disclosed an instance of noncompliance, which is required to be reported in accordance with U.S. OMB Circular A-133 and New Jersey OMB Circular 04-04 which is described in the accompanying schedule of findings and questioned costs as item 2014-001. Our opinion on each major federal and state program is not modified with respect to these matters.
The North Bergen Board of Education's response to the noncompliance finding identified in our audit is described in the accompanying schedule of findings and questioned costs. The North Bergen Board of Education's response was not subjected to the auditing procedures applied in the audit of compliance and, accordingly, we express no opinion on the response.
Report on Internal Control Over Compliance
Management of the North Bergen Board of Education is responsible for establishing and maintaining effective internal control over compliance with the types of compliance requirements referred to above. In planning and performing our audit of compliance, we considered the North Bergen Board of Education's internal control over compliance with the types of requirements that could have a direct and material effect on each major federal and state program to determine the auditing procedures that are appropriate in the circumstances for the purpose of expressing an opinion on compliance for each major federal and state program and to test and report on internal control over compliance in accordance with U.S. OMB Circular A-133 and New Jersey OMB Circular 04-04, but not for the purpose of expressing an opinion on the effectiveness of internal control over compliance. Accordingly, we do not express an opinion on the effectiveness of the North Bergen Board of Education's internal control over compliance.
A deficiency in internal control over compliance exists when the design or operation of a control over compliance does not allow management or employees, in the normal course of performing their assigned functions, to prevent, or detect and correct, noncompliance with a type of compliance requirement of a federal or state program on a timely basis. A material weakness in internal control over compliance is a deficiency, or combination of deficiencies, in internal control over compliance, such that there is a reasonable possibility that material noncompliance with a type of compliance requirement of a federal or state program will not be prevented, or detected and corrected, on a timely basis. A significant deficiency in internal control over compliance is a deficiency, or a combination of deficiencies, in internal control over compliance with a type of compliance requirement of a federal or state program that is less severe than a material weakness in internal control over compliance, yet important enough to merit attention by those charged with governance.
Our consideration of internal control over compliance was for the limited purpose described in the first paragraph of this section and was not designed to identifY all deficiencies in internal control over compliance that might be material weaknesses or significant deficiencies. We did not identifY any deficiencies in internal control over compliance that we consider to be material weaknesses. However, material weaknesses may exist that have not been identified.
The purpose of this report on internal control over compliance is solely to describe the scope of our testing of internal control over compliance and the results of that testing based on the requirements of U.S. OMB Circular A-133 and New Jersey OMB Circular 04-04. Accordingly, this report is not suitable for any other purpose.
123
Report on Schedule of Expenditures of Federal Awards Required by U.S. OMB Circular A-133 and Schedule of Expenditures of State Financial Assistance Required by New Jersey OMB Circular 04-04
We have audited the financial statements of the governmental activities, the business-type activities, each major fund, and the aggregate remaining fund information of the North Bergen Board of Education, as of and for the fiscal year ended June 30, 2014 and the related notes to the financial statements, which collectively comprise the Board of Education's basic financial statements. We issued our report thereon dated December 3, 2014, which contained unmodified opinions on those financial statements. Our audit was conducted for the purpose of forming opinions on the financial statements that collectively comprise the basic financial statements. The accompanying schedule of expenditures of federal awards as required by U.S. OMB Circular A-133 and schedule of expenditures of state financial assistance as required by New Jersey OMB Circular 04-04 are presented for purposes of additional analysis and are not a required part of the basic financial statements. Such information is the responsibility of management and was derived from and relates directly to the underlying accounting and other records used to prepare the basic financial statements. The information has been subjected to the auditing procedures applied in the audit of the financial statements and certain additional procedures, including comparing and reconciling such information directly to the underlying accounting and other records used to prepare the basic financial statements or to the basic financial statements themselves, and other additional procedures in accordance with auditing standards generally accepted in the United States of America. In our opinion, the schedule of expenditures of federal awards and schedule of expenditures of state financial assistance are fairly stated in all material respects in relation to the basic financial statements as a whole. {? '
a~Jir& :Y;;;/,~
Fair Lawn, New Jersey December 3, 2014
124
Certified Public Ace ntants
~jjt""""" Public School Accountant PSA Number CS00829
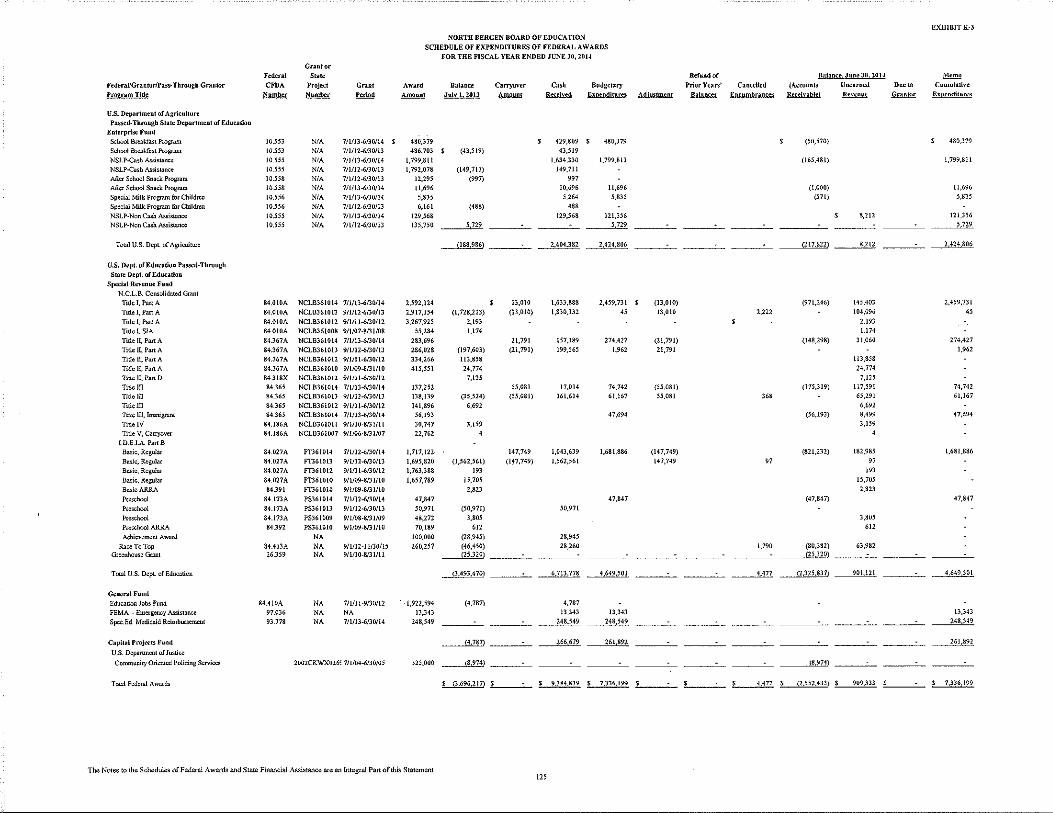
Federai/Grantorll'ass-Through Grantor Prorram Tide
U.S. DeiJ'Irlment nf Agriculture
f'.:u;,;ed-Through St~te DeiJ'Inment of Educ.alioo
Enterprise fuud
School Bre.al:fas~. Progr.un
School Breakfost Program NSLP-Cnsh ksistaoce
NSLP-Cash ksisumc~ Aller School Snack Program Afkr School Snack Program
Special Milk Progmm fw Children
Spednl Milk Program for Children
NSLP-Non Cosh Assistance
NSLP-Non Cash Assisla!IC¢
Total U.S. Dept. of Agricullure
U.S. Dept. nfEduc~lion Passed-Through
State Dept. ofEduution
Special Revenue Fund
N.C.L.B. Consolidated Gr.mt Tidcl,PartA
Tidei,PartA
Tidel.PartA
Tide I. SiA Tide!!, Part A
Titlell,f'anA Tide!!, Pan A
TitleU,I'artA Title!!. PanD
Titlel!I Tide HI
Titlelll Title 11!, Inunigmnt
Title IV
Title V, Carryover l.D.E.l.A Part B
Ba.ic, Regular
Basic, Regular Basic, Regular
Basic, Regular
BasicARRA Preschool
Preschool
Preschool Preschool ARRA Achievement Award
Race To Top Greenhouse Grant
Total U.S. Dept. ofEducatiOJl
Gene01IFuud
Education Jobs Fund
FEMA - Emergency Assismnce
Spec. Ed. Medicaid Reio>hursemeut
Capital PrnjttiS Fund
U.S. Department of JusLice
Community Oriented Pnlicing Services
Tntal Federal Awards
Federal
CFDA
~
10.553
10.553 10.555 IQ.555 10.558 W.558
10.556 10.556
10.555 10.555
Gr~ntor
Stllte
f'roj«l
Number
WA
WA WA NIA WA WA NIA NIA NIA WA
Gr~nl
Perlnd
7/l/13-6/30/14
711/12-6/30113
1/1/13-6/30/14 7/1/12-6130/13 7/1/12-6/30/13 7/1/13-6/30/14
711/13-6130/14 7/1/12-6/30/13
711/13-6130/14 711/12-6/30/13
84.010A NCLB361014 7/1/13-6/30114
84.010A NCLB361013 9/1/12-6/30/13
84.010A NCLB361012 9/l/ll-6f.l0112 84.010A NCLB361008 9/1107-8131/08
84.367A NCLB361014 7/l/l3-6f.l0/14
84.367A NCLB361013 9/1/12-6/30113 84.367A NCLB36WI2 9/1/11-6/30/12 84.367A NCLB361010 9/1/()9-f:/31/10
84.318X NCLB361012 9/1/11-6130/12 84.365 NCLB361014 7/1113-6130/14 84.365 NCLB36101J 9/1112-6130/13
84.365 NCLB361012 9/l/11-6/30/12 84.365 NCLB361014 7/1/13-6/30/14
84.186A NCLB361011 9/1/10-f:/31/11 84.186A NCLB361007 9/l/06-8131/07
84.027A 84.027A
84.027A
84.027A 84.391
84.173A
84.173A
84.173A 84.392
84.413A 26.359
84.4JOA
97.036 93.778
FT.l61014 711/12-6/30/14 FT.l61013 9/I/12-6/3Q/13
FT.l61012 9/!111-6/30/12 FT361010 9/1109-8/31/10
FT.l61010 91!/09-8131/10
P$361014 7/1112-6/30/14
PS361013 9/1112-6/30/13 PS361009 9/1/08-8/31109
PS361010 9/l/09-8/31/10
NA NA NA
NA NA NA
9/1/12-11130/15 9/1/10-f:/31/ll
711/11-9/30/12
NA 7/1/13-6/30/14
2002CKWX026! 711/04-6/30/05
NORTH BERGEN BOARD OF EDUCATION
SCHEDULE OF EXPENDITURES OF FEDERAL AWARDS
FOR THE FISCAL YEAR ENDED JUNE 30, lOU
Aw~rd
Amount
480,379
486,703
1,799,811 1,792,078
12,295 !1,696
5,835 6,161
!29,568 135,750
2,592.124
2,917,154
3,267,925 55,284
283,696
286,028 334,266
415,551
137,252 138,!39
141,896 56,193
30,747 22,762
1,717,122 1,695,820
1,763,388
1,657,789
47,847
50,97!
48,272 70,189
100.000
260.257
1,922,594 13,343
248,549
325.000
Balance
Jutv I 2013
(H,519)
(149,711) (997)
{488)
5.729
Carrynver
A.mru!..!!!
(188.986) --~-
(1,728,2!3)
2,193 1,174
(197,603)
113,858
24,774 1,125
(35,524)
6,692
3,159
• (1,562.561)
'" !5,705
2.823
(50,97!)
3,805
"' (28,945)
{46,450) (25.320)
(3493470)
(4,787)
(4.787)
(8.974)
!3,010 (13,010)
21,791 (21,791)
55,081 (55,081)
147,749 (147,749)
Cash Recch·ed
Budgetary Exnenditures
429,809 $ 480,379 43.519
1,634,330 1,799,811 149.711
'" 10,696 11,696 5,264 5,835 ...
129,568 121,356
2 404.382
1,633,888
1,830,132
157,189
199,565
17,014 161,614
1,043,639
1,562,561
50.971
28,945
28,260
6.713.778
4,787 13,343
248.549
266.679
5,729
2.424 806
2,459,731
" 274,427
1,962
74,742 61,167
47,694
1,681,886
47,847
4.649.501
13,343
248.549
261,892
Adjustment
(13,010)
13,010
(21,791)
21,791
(55,081)
55.081
(147,749)
147,749
(3.696,217) $ 9.384.839 s 7.336.199 ''---'--
The Notes to the Schedules of Federal A wards and State Financial Assistance are an Integral Part of this Statement
"'
Refund of
Prior Years'
Balances Cancelled
Encumbrances
2,222
""
"
1,790
Balance Juue31l 2au (Accounts Unearned
Receivable!
(50,570)
(165,481)
(1,000) (571)
Revenue
8,212
(217.622) 8.2l2
(97l,246)
{148,298)
(175,319)
(56.193)
(821,232)
(47,847)
(80,382)
145.403 104,096
2,193 1,174
31.060
113.858 24,774
7,125 ll7.591 65.29!
6.692 8,499 3,159
• 182.985
" '" 15.705
2.823
3.805
612
63,982
(25 320) ---~
---''C'-'C'L7 _ a.325.837l 901,121
---"""''"'"74) --~
Due to Grantor
~ 4.477 s !2.552.433) 909.333 <'----'--
EXHIB!TK-3
Memo
Cumulative Emcnditlu-es
480.379
1.799,811
11,696 5.835
121.356 5.729
2 424 806
2,459,731
" 274,427
1.962
74,742 61,167
47,694
1,681,886
47,847
4.649.501
13.343 248.549
261,892
$ 7.336.199
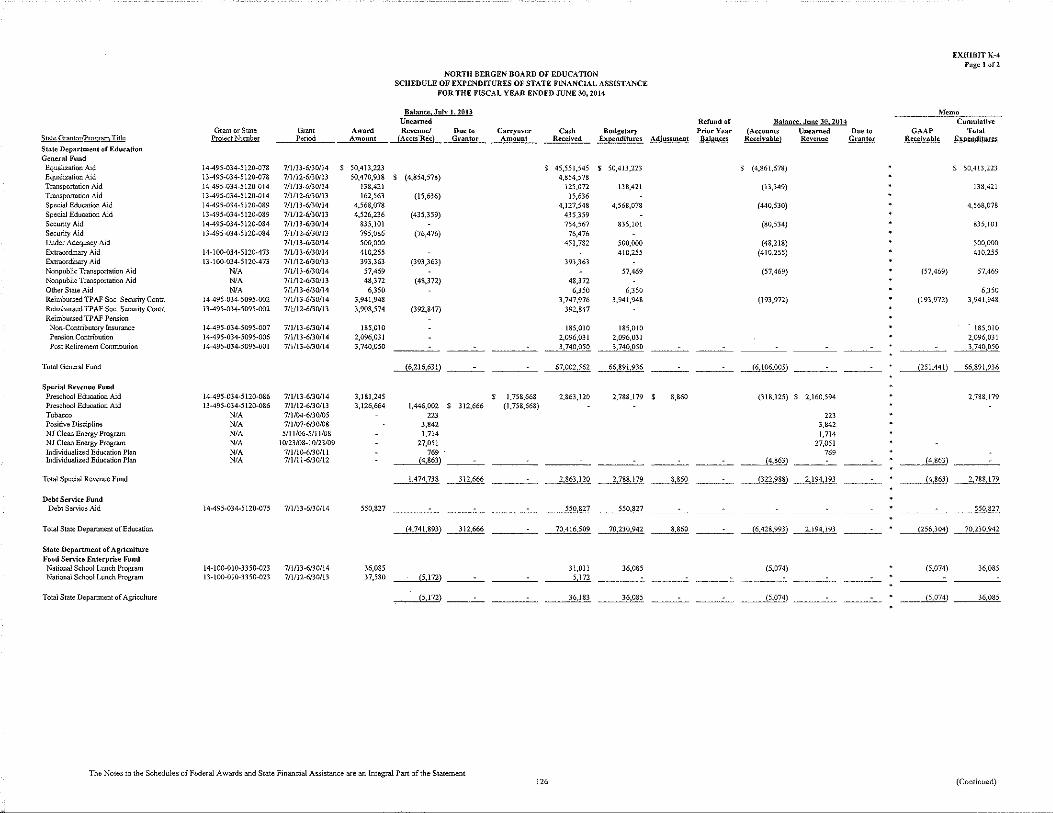
EXHIBITK-4 Page I of2
NORTH BERGI':N BOARD OF EDUCATION SCHEDULE OF EXPENDITURES OF STATE FINANCIAL ASSISTANCE
FOR THE FISCAL YEAR Ji:NOJi:D JUNE 30,2014
Balance, Jut~ l. 20ll Memo Unearned Refund of Balance. June 30, 2014 Cumulative
Grant or State Grant Award Revenue/ Due to Carryover Cm> Budgetary PriorY ear (Accounts Unearned Due to GAAP Total :;!tate Grantor/Program Title frQi~ct NJJmb!H Period Amount (Accts-Rfic} Grantor Amount Received Expenditures Adjunment Balances Receivable) Revenue Grantor Receivable fuenditurcs
State Department of Education General Fund
Equalization Aid 14-495-034-5120-078 7!!/13-6/30114 $ 50,413,223 $ 45,551,545 $ 50,413,223 $ (4,861,678) $ 50,413,223 Equalilation Aid 13-495-034-5120-078 7!1/12-6130/13 50,470,938 ' (4,854,578) 4,854.578 Transportation Aid 14-495-034-5120-0 14 7/1/13-15130/14 138,421 125.072 138,421 (13,349) 138,421 T ransponation Aid 13-495-034-5120-0 14 7/1/12-6130/13 162,563 (15,636) 15,636 Special Education Aid 14-495-034-5120-089 7/l/13-6/30/14 4,568,078 4,127,548 4,568,078 (440,530) 4.568.078 Special Education Aid 13-495-034-5120-089 7/1/12-6/30113 4,526,236 (435,359) 435,359 Security Aid 14-495-034-5120-084 7/l/13-6/30/14 835.101 754,567 835,101 (80,534) 835.101 Security Aid 13-495-034-5120-084 7/1112-6/30113 795,086 (76,476) 76,476 Under Adequacy Aid 7/lf13-6/30/14 500,000 451,782 500,000 (48,218) 500,000 Extraordinary Aid 14-l 00-034-5120-473 7/1113-6/30/14 410,255 410,255 (410,255) 410,255 Extraordinary Aid 13-1 00-034-5120--473 711112-6/30113 393,363 (393,363) 393,363 Nonpublic Transportation Aid NIA 711113·6/30/14 57,469 57,469 (57,469) (57,469) 57.469 Nonpublic Transportation Aid NIA 711112-6/30fl3 48,372 (48,372) 48,372 Other State Aid NIA 711/13-6/30fl4 6,350 6,350 6,350 6,350 Reimbursed TPAF Soc. Se<:urity Contr. 14-495-034-5095-002 7/1113-6/30114 3,941,948 3,747,976 3,941,948 (193,972) . (193.972) 3,941.948 Reimbursed TPAF Soc. Security Contr. 13-495-034-5095-002 7/l/l2-6130/l3 3,908,574 (392.847) 392,847 Rdrnbursed TP AF Pension
Non-Contributory Insurance 14-495-034-5095-007 7/1/13-6/30114 185,010 185,010 185,010 . 185,010 Pension Contribution 14--495-034-5095-006 7/1/13-6130114 2,096,031 2,096,031 2,096,031 2,096,031 Post Retirement Contribution 14-495-034-5095-00 I 7/l/13-6130/14 3,740,050 ---- 3.740,050 3,740.050 -------- ---- ____ .2.:1iQ,050
Total General Fund (6,216,631) ---- 67,002.562 66,891.936 -------- (6.106.005) ---- {251,441) 66,891,936
Special Revenue Fund Preschool Education Aid 14-495-034-5120-086 7/1/13-6/30/14 3,181,245 ' 1.758.668 2.863,120 2,788,179 ' 8,860 (318.125) $ 2,160,594 2.788.179 Preschool Education Aid 13-495-034-5120-086 7/IJI2-6/30/13 3,126,664 1,446,002 ' 312,666 (1.758,668) Tobacco NIA 7/1104-6/30/05 223 223 Positive Discipline NIA 7/1/07-6/30/08 3,842 3.842 NJ Clean Energy Program NIA 5/11/06-5111/08 1,714 1,714 NJ Clean Energy Program NIA l 0/23/08-1 0/23/09 27,05] 27,051 Individualized Education Plan NIA 7/1110-6/30111 769 "' Individualized Education Plan NIA 7/1111-6130/12 (4,863) --- -------- (4.863) ---- (4.863)
Total Special Revenue Fund 1,474,738 3!2,666 2,863,120 2.788.179 ~---- (322,988) 2.194.193 ---- (4,863) 2. 788,179
Debt Service Fund Debt Service Aid 14-495-034-5120-075 711/13-6/30114 550,827 ---- 550.827 550,827 ---- _____________11827
Total State Department of Education (4.741.893) 3!2.666 70,416,509 70.230,942 ~---- (6,428.993) 2.194 193 ---- (256,304) 70.230.942
State Department of Agriculture Food Service Enterpri~e Fund National School Lunch Program 14-1 00..0 1 0-33 50-023 7/l/13-6/30114 36,085 31,011 36,085 (5,074) (5.074) 36,085 National School Lunch Program 13-100--010-3350---023 711112-6/30/!3 37,580 (5,172) ---- 5,172 -------- ----
Total State Department of Agriculture (5.172) 36)83 36.085 (5.074) (5.074) 36,085
The Notes to the Schedules of Federal Awards and State Financial Assistance are an Integral Part of the Statement 126 (Continued)
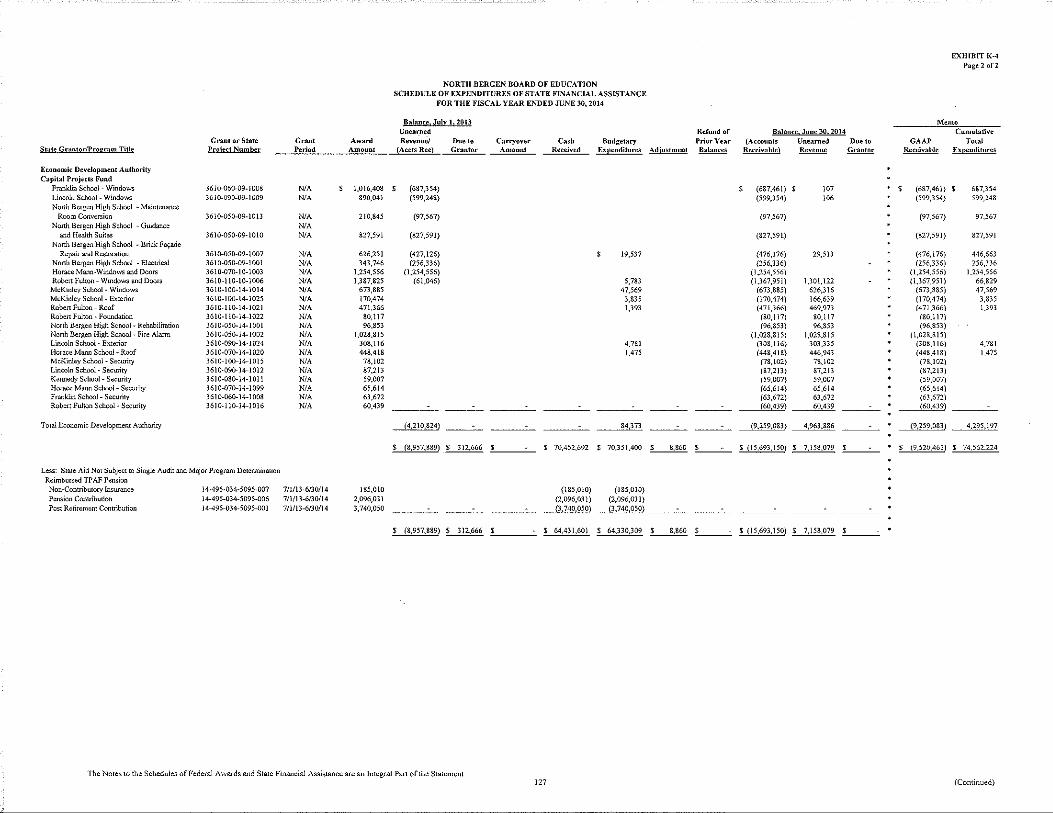
EXHIBITK-4 Page 2 of2
NORTH BERGEN BOARD OF EDUCATION SCHEDULE OF EXPENDITURES OF STATE FINANCIAL ASSISTANCE
FOR THE FISCAL YEAR ENDED JUNE 30, 2014
Balance July 1, 21H3 Memo Unearned Refund of Bala11ce Ju11e 30. 2014 Cumulative
Grant ar State Grant Award Revenue/ Due to Carryover Cash Budgetary PriarYear (Accounts Unearned Due to GAAP Total State Gnntor/Progum Title Project Number Period Amount (Accts Rec) Gun tor Amount Received E.:pcnditures Adjustment Balances Receivable) Revenue G•·a,.tor Receivable Expenditures
Ewnomic DevdGpment Authority CaJlital PrGjects Fund
Franklin School- Windows 361 O-D60-09-l 008 NIA $ 1,016,408 $ (687,354) $ (687,461) $ 107 $ (687,461) $ 687,354 Lincoln School- Windows 361 0-090-09-1 009 NIA 890,041 (599,248} (599,354) 100 (599,354) 599,248 North Bergen High School -Maintenance .
Room Conversion 3610-050-09-lOll NIA 210,845 (97,567) (97,567) (97,567) 97,567 North Bergen High School -Guidance NIA
and Health Suites 3610-050-09-1010 N/A 827,591 (827,591) (827,591) (827,591) 827,591 North Bergen High School -Brick Fa~ade
Repair and Restoration 3610-050-09-1007 NIA 626,251 (427,126) $ 19,537 {476,176) 29,513 (476,176) 446,663 North Bergen High School -Electrical 3610-050-09-1001 NIA 343,746 (256,336) (256,336) (256,336) 256,336 Horace Mann-Windows and Doors 3610-070-10-1003 NIA 1,254,556 (1,254,556) (1,254,556) (1,254,556) 1,254,556 Robert Fulton- Windows and Doors 3610-110-10-1006 NIA 1,387,825 (61,046) 5,783 (1,367,951) 1,301,122 (1,367,951) 66,829
McKinley School- Windows 3610-100-14-1014 N/A 673,885 47,569 (673,885) 626,316 (673,885) 47,569 McKinley School- Exterior 3610-1(}(}..14-1025 N/A 170,474 3,835 (170,474) 166,639 . (170,474) 3,835 Raben Fulton- Roof 3610-1 JD-14-1021 NIA 471,366 1,393 (471,366) 469,973 (471,366) 1)93 Robert Fulton- Foundation 3610-110-14-1022 NIA 80,117 (80,117) 80,117 (&OJ 17) North Bergen High School- Rehabilitation 3610-050-14-1001 NIA 96,853 (96,853) 96,853 (96,853) North Bergen High School- Fire Alarm 36JO-D50-l4-1002 NIA 1,028,815 (1,028,815) 1,028,815 (!,028,815) Lincoln School- Exterior 3610-090-14-1024 NIA 308,ll6 4,781 (308J 16) 303,335 (308J 16) 4,781 Horace Mann School - Roof 3610-070-14-1020 N/A 448,418 1,475 (448,418) 446,943 (448,418) 1,475 McKinley School- Security 3610-100-14-1015 NIA 78,102 (78,102} 78,102 (78,102) Lincoln School- Security 3610-090·14-1012 NIA 87,213 (87,213) 87,2)3 (87,2)3) Kennedy School- Security 3610-080-14-1011 NIA 59,007 (59,007) 59,007 (59,007) Horace Mann School- Security 3610-070-14-1099 NIA 65,614 (65,614) 65,614 (65,614) Franklin School- Security 3 61 0-060-14-1 008 NIA 63,672 (63,672) 63,672 (63,672) Robert Fulton School- Security 36Hl-ll0-14-1016 NIA 60,439 ---- -------- (60,439) 60 439 ---- (60,439)
Total Economic Development Authority (4,210,824) ---- 84 373 -------- (9,259,083) 4 963,886 ---- (9,259,083) ~197
$ (8,957,889) $ 312,666 $ $ 70,452,692 $ 70,351,400 ~-·---
$ (15,693,150) $ 7J58,079 _, ___ $ (9.520,461) $ 74.562,224
Less: State Aid Not Subject to Single Audit and Major Program Determination Reimbursed TPAF Pension
Non-Contributory Insurance 14-495-034-5095-007 7/1113-6/30/14 185,010 (185,010) (185,010) P<lnSion Contribution 14-495-034-5095-006 7/1/13-6/30/14 2,096,031 (2,096,031) (2,096,031) Post Retirement Contribution 14-495-034-5095-00 I 7/1113-6/30114 3,740,050 ---- (3,740,050) (3,740,050)
(8,957,889) $ 312,666 $ $ 64,431,601 s 64,330,309 ~-·--- $ (!5,693,150) $ 7,158,079 _, ___
The Notes to the Schedules of Federal Awards and State Financial Assistance are an Integral Pan of the Statement 127 (Continued)

NORTH BERGEN BOARD OF EDUCATION NOTESTOTHESCHEDULESOFEXPENDITURESOF FEDERAL AWARDS AND STATE FINANCIAL ASSISTANCE FOR THE FISCAL YEAR ENDED JUNE 30, 2014
NOTE 1 GENERAL
EXHIBITK-5
The accompanying schedules present the activity of all federal and state financial assistance programs of the North Bergen Board of Education. The Board of Education is defmed in Note 1(A) to the Board's financial statements. All federal financial assistance received directly from federal agencies, as well as federal awards and state financial assistance passed through other government agencies is included on the schedule of expenditures of federal awards and state financial assistance.
NOTE 2 BASIS OF ACCOUNTING
The accompanying schedules are prepared and presented using the budgetary basis of accounting with the exception of programs recorded in the food service fund, which are presented using the accrual basis of accounting. These bases of accounting are described in Notes !(C) to the Board's financial statements. The information in these schedules is presented in accordance with requirements of U.S. OMB Circular A-133, "Audits of States, Local Governments and Non-Profit Organizations" and New Jersey OMB Circular 04-04, "Single Audit Policy for Recipients of Federal Grants, State Grants, and State Aid". Therefore, some amounts presented in these schedules may differ from the amounts presented in, or used in the preparation of, the financial statements.
NOTE 3 RELATIONSHJP TO FINANCIAL STATEMENTS
The financial statements present the general fund and special revenue fund on a GAAP basis. Budgetary comparison statements or schedules (RSI) are presented for the general fund and special revenue fund to demonstrate finance-related legal compliance in which certain revenue is permitted by law or grant agreement to be recognized in the audit year, whereas for GAAP reporting, revenue is not recognized until the subsequent year or when expenditures have been made.
The general fund is presented in the accompanying schedules on a modified accrual basis with the exception of the revenue recognition of the delayed state aid payments in the current budget year, which is mandated pursuant to N.J.S.A. 18A:22-44.2.. For GAAP purposes, those payments are not recognized until the subsequent year due to the state deferral and recording of certain state aid payments in the subsequent year. The special revenue fund is presented in the accompanying schedules on the grant accounting budgetary basis which recognizes encumbrances as expenditures and also recognizes the related revenues, which may include the delayed state aid payments, whereas the GAAP basis does not. The special revenue fund also recognizes the delayed state aid payments in the current budget year, consistent with N.J.S.A. 18A:22-44.2.
The net adjustment to reconcile from the budgetary basis to the GAAP basis is a decrease of $79,152 for the general fund and an increase of $58,101 for the special revenue fund. See the Notes to Required Supplementary Information for a reconciliation of the budgetary basis to the modified accrual basis of accounting for the general and special revenue funds. Awards and financial assistance revenues are reported in the Board's financial statements on a GAAP basis as presented as follows:
Federal State Total
General Fund $ 261,892 $ 66,812,784 $ 67,074,676 Special Revenue Fund 4,732,870 2,764,138 7,497,008 Capital Projects Fund 84,373 84,373 Debt Service Fund 550,827 550,827 Food Service Fund 2,424,806 36,085 2,460,891
Total Financial Assistance $ 7,419,568 $ 70,248,207 $ 77,667,775
128

NORTH BERGEN BOARD OF EDUCATION NOTES TO THE SCHEDULES OF EXPENDITURES OF FEDERAL AWARDS AND STATE FINANCIAL ASSISTANCE FOR THE FISCAL YEAR ENDED JUNE 30, 2014
NOTE 4 RELATIONSHIP TO FEDERAL AND STATE FINANCIAL REPORTS
EXHIBITK-5
Amounts reported in the accompanying schedules may not necessarily agree with the amounts reported in the related federal and state financial reports due to timing differences between the District's fiscal year and grant program years.
NOTE 5 OTHER INFORMATION
Revenues and expenditures reported under the National School Lunch Program as non-cash assistance represent current year value received and current year distributions, respectively of the Federal Food Distribution Program. TP AF Social Security contributions in the amount of $3,941,948 represents the amount reimbursed by the State for the employer's share of social security contributions for TPAF members for the fiscal year ended June 30, 2014. The amount reported as TPAF Pension System Contributions in the amount of$2,281,041 and TPAF Post-Retirement Medical Benefits Contributions in the amount of $3,7 40,050 represents the amount paid by the State on behalf of the District for the fiscal year ended June 30, 2014.
NOTE 6 ON-BEHALF PROGRAMS NOT SUBJECT TO STATE SINGLE AUDIT
On-behalf State Programs for TP AF Pension and Post-Retirement Medical Benefits Contributions are not subject to a State single audit and, therefore, are excluded from major program determination. The Schedule of State Financial Assistance provides a reconciliation of State financial assistance reported in the District's financial statements and the amount subject to State single audit and major program determination.
129
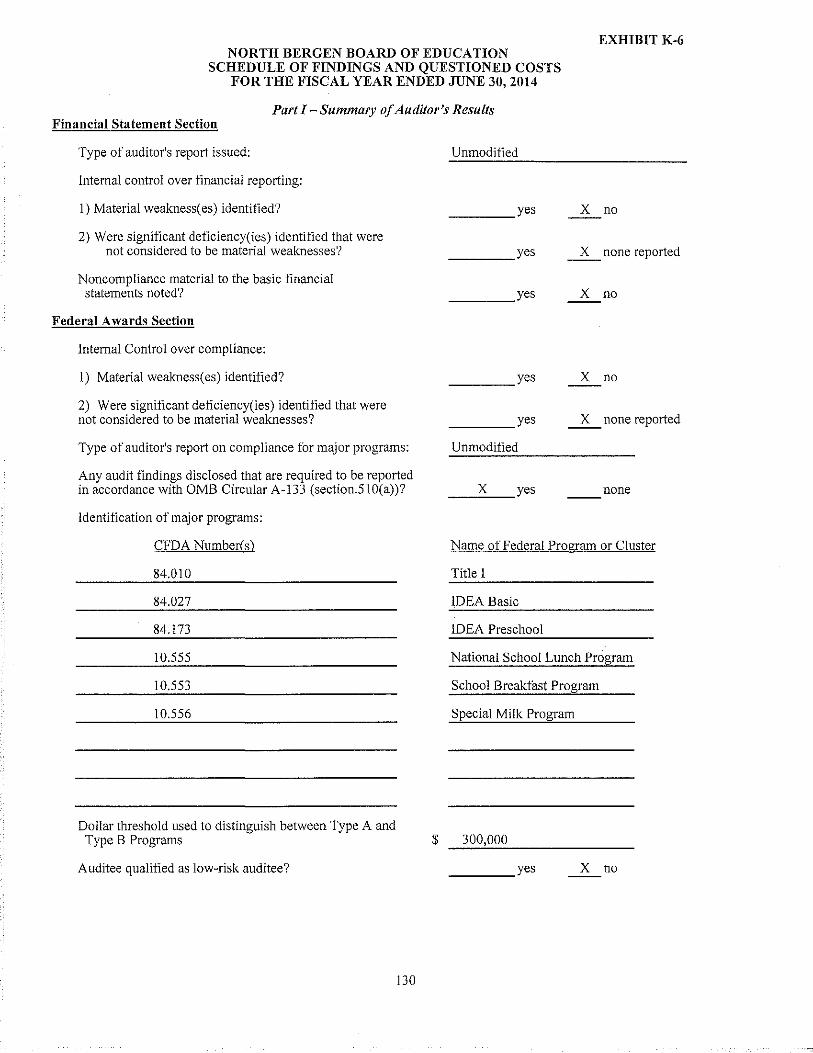
EXHIBIT K-6 NORTH BERGEN BOARD OF EDUCATION
SCHEDULE OF FINDINGS AND QUESTIONED COSTS FOR THE FISCAL YEAR ENDED JUNE 30, 2014
Part I- Summary of Auditor's Results Financial Statement Section
Type of auditor's report issued:
Internal control over tinancial reporting:
I) Material weakness(es) identitied?
2) Were signiticant deticiency(ies) identitied that were not considered to be material weaknesses?
Noncompliance material to the basic tinancial statements noted?
Federal Awards Section
Internal Control over compliance:
I) Material weakness(es) identitied?
2) Were signiticant deticiency(ies) identitied that were not considered to be material weaknesses?
Type of auditor's report on compliance tor major programs:
Any audit tindings disclosed !bat are required to be reported in accordance with OMB Circular A-133 (section.510(a))?
ldentitication of major programs:
CFDA Number(s)
84.010
84.027
84.173
I 0.555
I 0.553
10.556
Dollar threshold used to distinguish between Type A and Type B Programs
Auditee qualitied as low-risk auditee?
130
$
Unmoditied
____ yes
____ yes
____ yes
____ yes
____ yes
Unmoditied
_ __:X..:__ yes
X no
~none reported
X no
X no
~none reported
none
Name of Federal Program or Cluster
Title I
IDEA Basic
IDEA Preschool
National School Lunch Program
School Breaktast Program
Special Milk Program
300,000
____ yes X no

EXHIBIT K-6
NORTH BERGEN BOARD OF EDUCATION SCHEDULE OF FINDINGS AND QUESTIONED COSTS (CONT'D)
FOR THE FISCAL YEAR ENDED JUNE 30, 2014
Part I- Summary of Auditor's Results
State Awards Section
Internal Control over compliance:
I) Material weakness(es) identified?
2) Were significant deficiency(ies) identified that were not considered to be material weaknesses?
Type of auditor's report on compliance for major programs:
Any audit findings disclosed that are required to be reported in accordance with N.J. OMB Circular 04-04, as amended?
Identification of major programs:
State Grant/Project Number (s)
495-034-5120-078
495-034-5120-083
495-034-5120-089
495-034-5120-084
495-034-5120-086
495-034-5095-002
Dollar threshold used to distinguish between Type A and Type B Programs
Auditee qualified as low-risk auditee?
131
__ yes X no ---
__ yes _ _::..:X:___ none reported
U nrnodified
__ yes _ _::..:X:___ none
N arne of State Program
Equalization Aid
Under Adequacy Aid
Special Education Aid
Security Aid
Preschool Education Aid
TP AF Social Security
$ 1,929,909
___ yes _ __.:.:X:___ no
NORTH BERGEN BOARD OF EDUCATION SCHEDULE OF FINDINGS AND QUESTIONED COSTS (CONT'D)
FOR THE FISCAL YEAR ENDED JUNE 30, 2014
Part 2 -Schedule of Financial Statement Findings
EXHIBITK-6 Page 3
This section identifies the significant deficiencies, material weaknesses, fraud, illegal acts, violations of provisions of contracts and grant agreements and abuse related to the financial statements in accordance with Government Auditing Standards.
THERE ARE NONE.
132

NORTH BERGEN BOARD OF EDUCATION SCHEDULE OF FINDINGS AND QUESTIONED COSTS
FOR THE FISCAL YEAR ENDED JUNE 30, 2014
Part 3- Schedule of Federal and State Award Findings and Questioned Costs
EXHIDITK-6
This section identifies the significant deficiencies, material weaknesses, and instances of noncompliance, including questioned costs, related to the audit of major federal and state programs, as required by OMB Circular A-133and New Jersey OMB's Circular 04-04.
CURRENT YEAR FEDERAL AWARDS
Finding 2014-001:
The NCLB FY13 Title I final report was not in agreement with the financial accounting records of the District. The expenditures reported in the final grant report exceeded the expenditures reported in the District's budgetary accounting records by $101,874.
Federal Program Information:
NCLB- Title I 84.010
Criteria or Specific Requirement:
OMB Circular A-133 Compliance Supplement- Reporting Requirements
Condition:
Expenditures reported on the District's financial records were not in agreement with amounts reported on the final NCLB grant expenditure reports.
Ouestioned Costs:
None.
Context:
Cause:
Effect:
The District's 2012-13 Title I final expenditure report reflected total expenditures of $3,104,872. The District's financial records for the grant period reflected expenditures of $3,002,998.
Unknown.
The District's financial reports are not in agreement with amounts reported to grantor agencies.
Recommendation:
The District reconcile the final NCLB grant reports to the budgetary accounting system prior to submission of the report.
View of Responsible Officials and Planned Corrective Action:
Management has reviewed this finding and has indicated it will review and revise its procedures to ensure corrective action is taken.
133

NORTH BERGEN BOARD OF EDUCATION SCHEDULE OF FINDINGS AND QUESTIONED COSTS
FOR THE FISCAL YEAR ENDED JUNE 30, 2014
Part 3- Schedule of Federal and State Award Findings and Questioned Costs
EXHIBITK-6
This section identifies the significant deficiencies, material wealmesses, and instances of noncompliance, including questioned costs, related to the audit of major federal and state programs, as required by OMB Circular A-133and New Jersey OMB's Circular 04-04.
CURRENT YEAR STATE AWARDS
There are none.
134

NORTH BERGEN BOARD OF EDUCATION SUMMARY SCHEDULE OF PRIOR YEAR AUDIT FINDINGS
AND QUESTIONED COSTS FOR THE FISCAL YEAR ENDED JUNE 30, 2014
This section identifies the status of prior-year findings related to the basic financial statements
EXIDBITK-7
and federal and state awards that are required to be reported in accordance with Chapter 6.12 of Government Auditing Standards, U.S. OMB Circular A-133 (section .315(a)(b)) and New Jersey OMB's Circular 04-04.
STATUS OF PRIOR YEAR FINDINGS
THERE WERE NONE.
135