North American Nitrogen Outlook - Fertilizer Industry … 2016 - North... · · 2017-01-16North...
27
North American Nitrogen Outlook TFI Outlook November 2016 Doug Hoadley Hoadley Consulting
Transcript of North American Nitrogen Outlook - Fertilizer Industry … 2016 - North... · · 2017-01-16North...

North American
Nitrogen Outlook
TFI Outlook
November 2016
Doug Hoadley
Hoadley Consulting
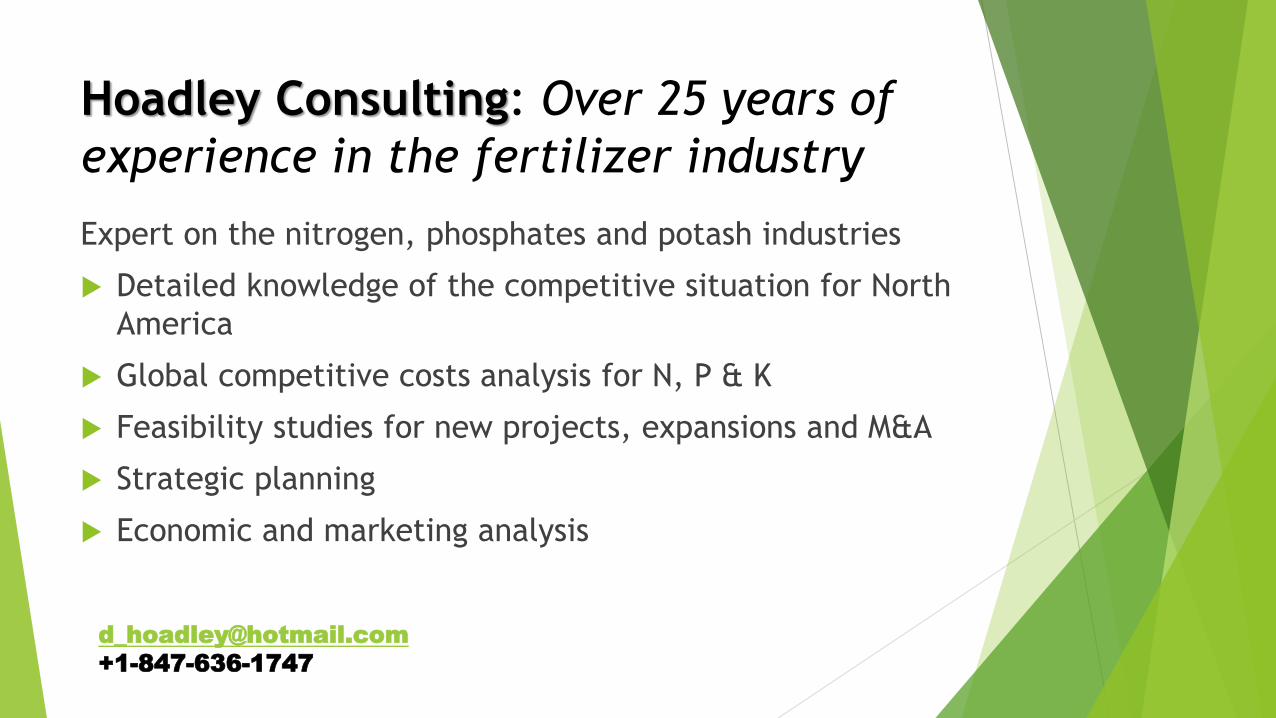
Hoadley Consulting: Over 25 years of
experience in the fertilizer industry
Expert on the nitrogen, phosphates and potash industries
Detailed knowledge of the competitive situation for North
America
Global competitive costs analysis for N, P & K
Feasibility studies for new projects, expansions and M&A
Strategic planning
Economic and marketing analysis
+1-847-636-1747

Agenda
Demand Outlook
Changes to Capacity
Ammonia Outlook
Urea Outlook
UAN Outlook
Summary
Hoadley Consulting

Key Nitrogen Drivers
Low grain prices = slow demand growth
New nitrogen capacity puts pressures prices
Collapse in energy values plus currency devaluations results in lower costs for marginal producers
Cash costs for most producers have fallen
Cheap freight shrinks the globe
China, China, China
Hoadley Consulting
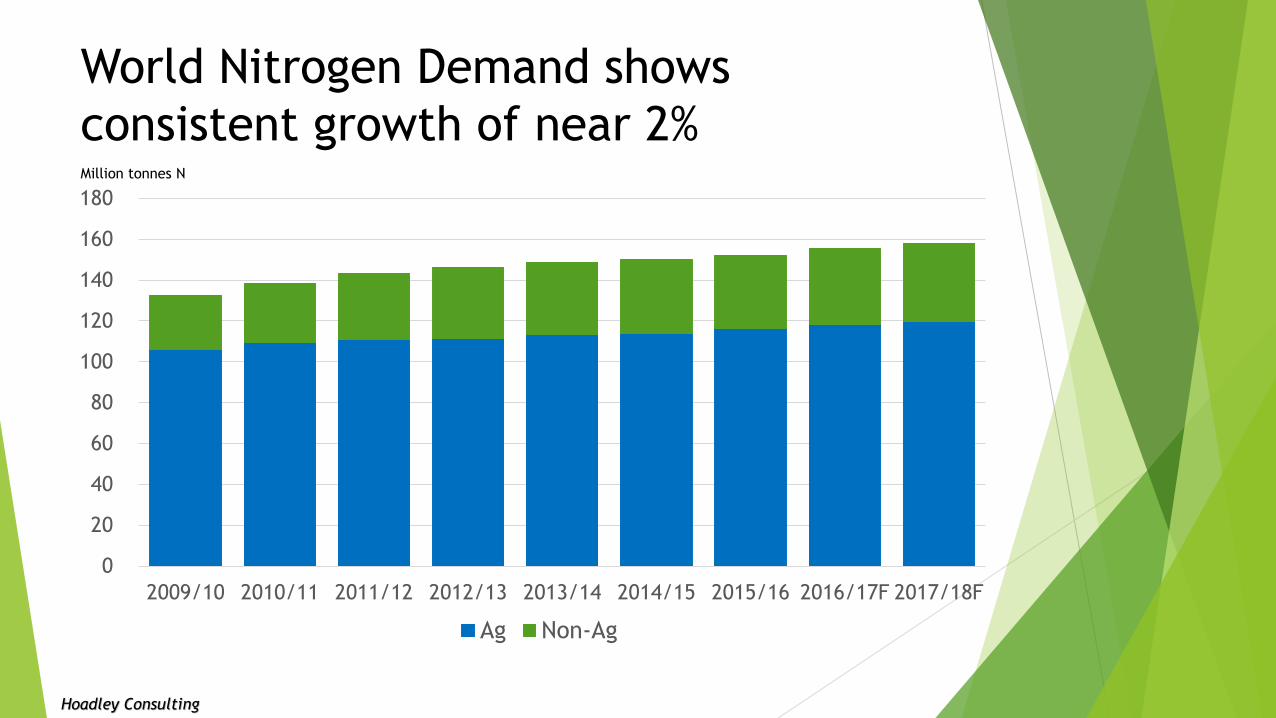
World Nitrogen Demand shows
consistent growth of near 2%
0
20
40
60
80
100
120
140
160
180
2009/10 2010/11 2011/12 2012/13 2013/14 2014/15 2015/16 2016/17F 2017/18F
Ag Non-Ag
Million tonnes N
Hoadley Consulting
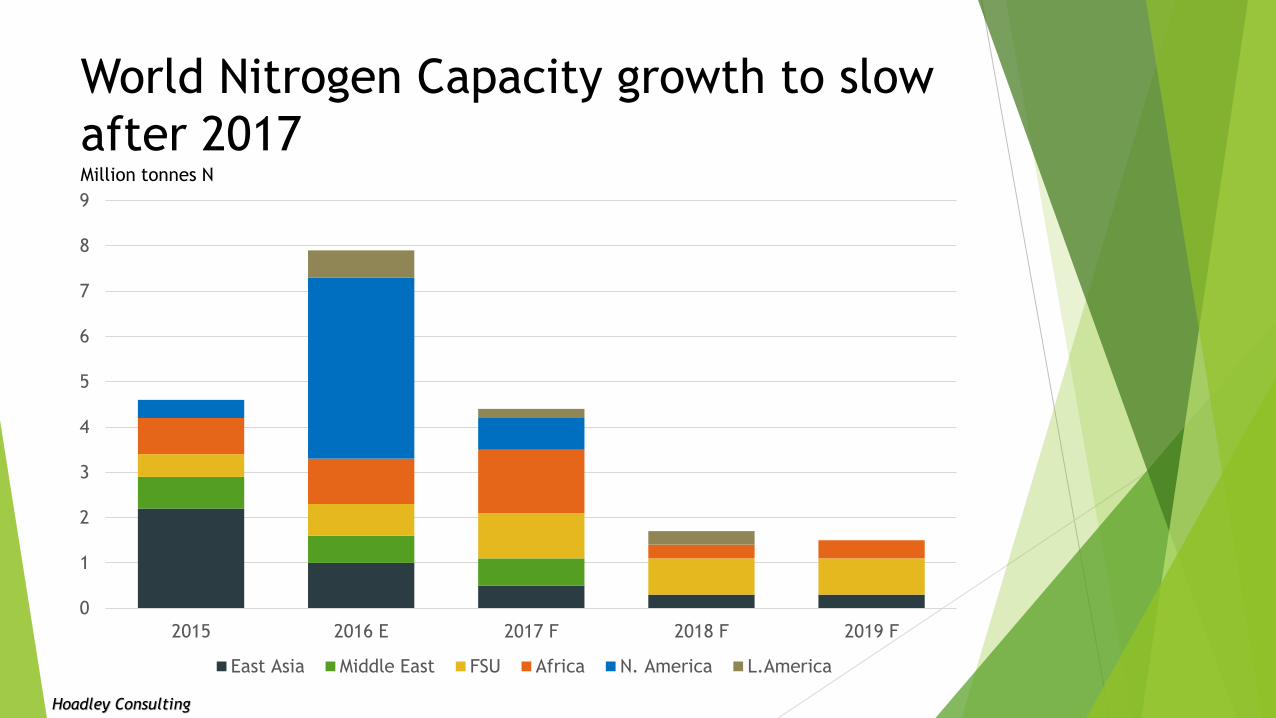
World Nitrogen Capacity growth to slow
after 2017
0
1
2
3
4
5
6
7
8
9
2015 2016 E 2017 F 2018 F 2019 F
East Asia Middle East FSU Africa N. America L.America
Hoadley Consulting
Million tonnes N
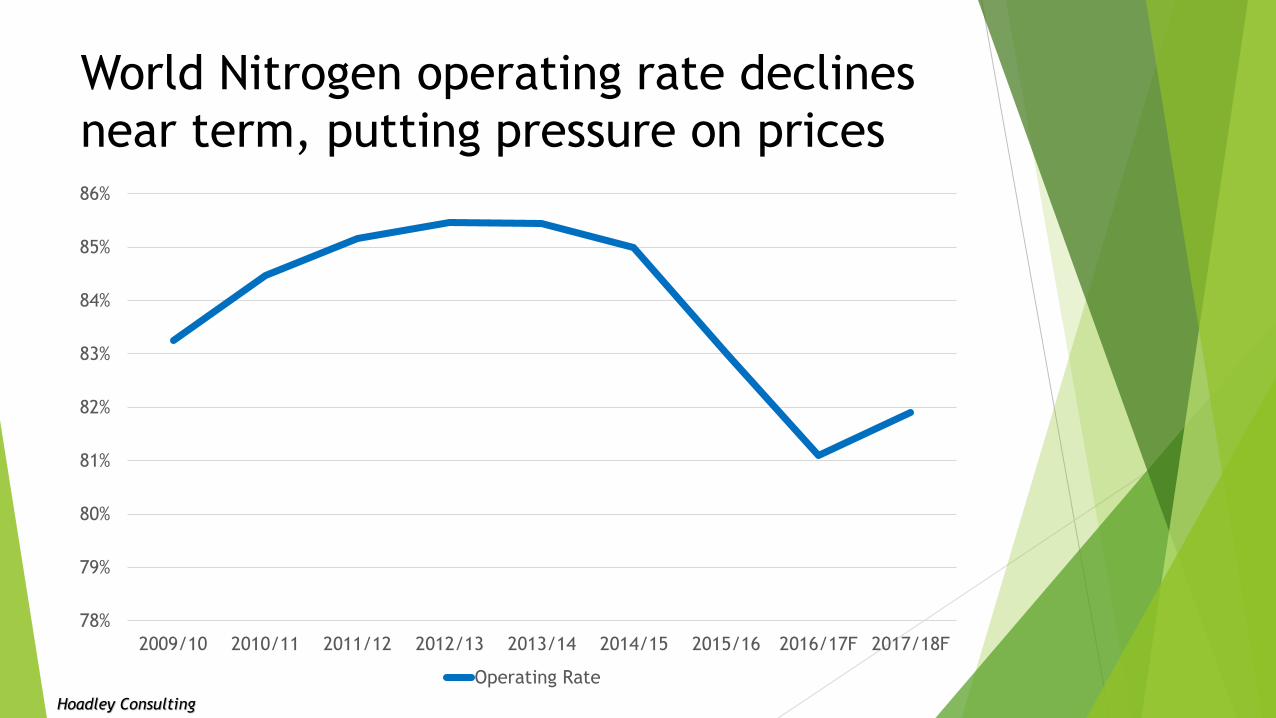
World Nitrogen operating rate declines
near term, putting pressure on prices
78%
79%
80%
81%
82%
83%
84%
85%
86%
2009/10 2010/11 2011/12 2012/13 2013/14 2014/15 2015/16 2016/17F 2017/18F
Operating Rate
Hoadley Consulting
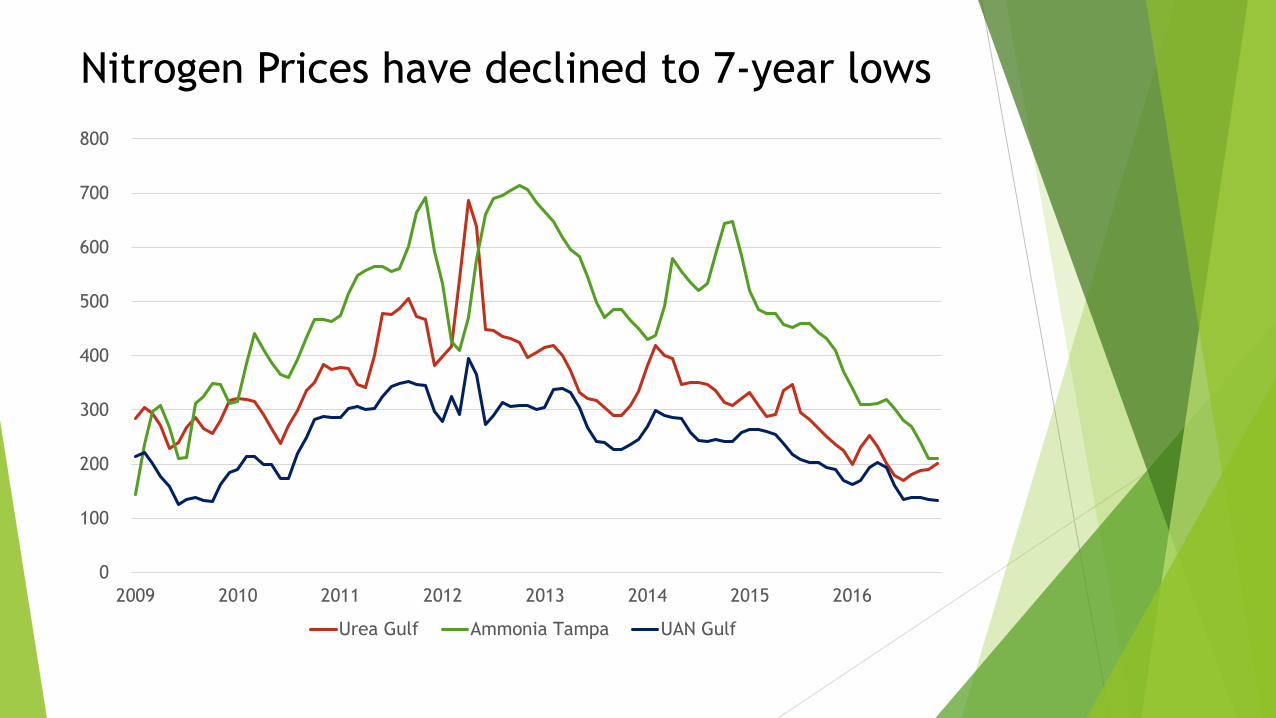
Nitrogen Prices have declined to 7-year lows
0
100
200
300
400
500
600
700
800
2009 2010 2011 2012 2013 2014 2015 2016
Urea Gulf Ammonia Tampa UAN Gulf

USA nitrogen fertilizer demand forecast
to decline 1% to 2% next year
0
2
4
6
8
10
12
14
2013/14 2014/15 2015/16E 2016/17F
Ammonia Urea UAN Other
Million tons N
Hoadley Consulting

North American Nitrogen Capacity
growth peaks in 2016/17
0.0
0.5
1.0
1.5
2.0
2.5
3.0
3.5
4.0
4.5
Ammonia Urea UAN
2015/16 2016/17F 2017/18F
Hoadley Consulting
Million tons

Ammonia Situation and Outlook
Hoadley Consulting
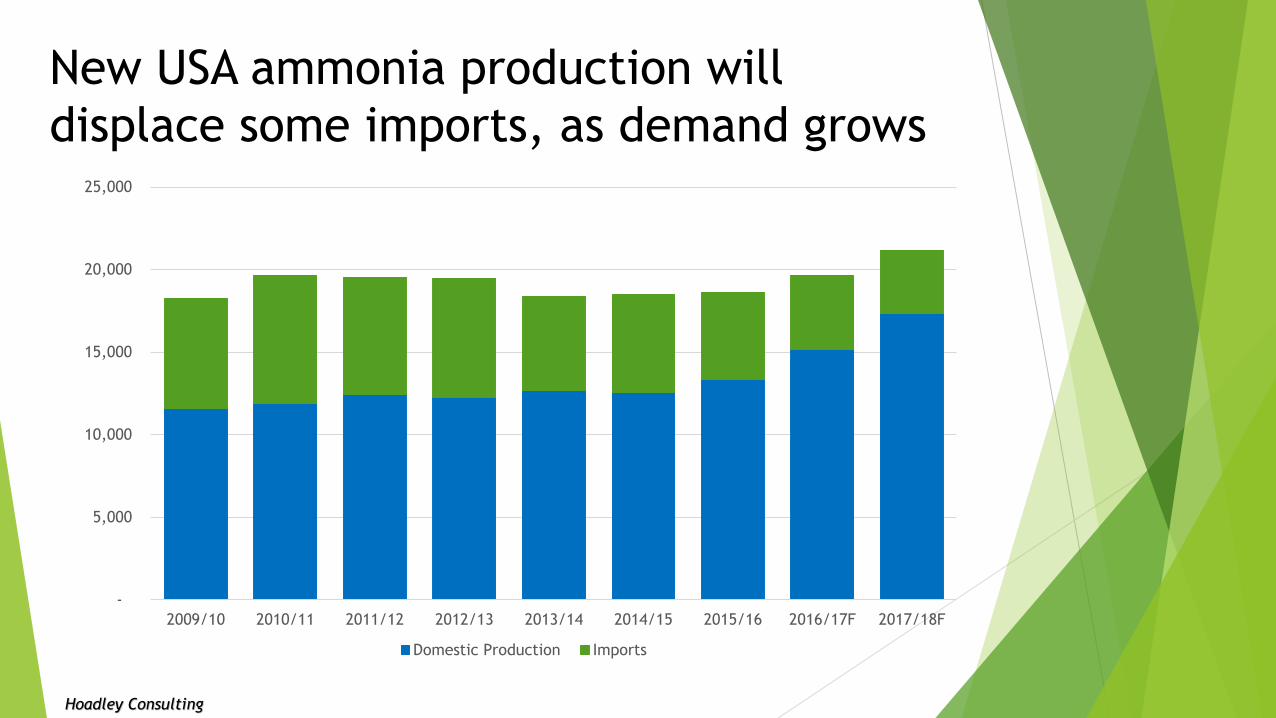
New USA ammonia production will
displace some imports, as demand grows
-
5,000
10,000
15,000
20,000
25,000
2009/10 2010/11 2011/12 2012/13 2013/14 2014/15 2015/16 2016/17F 2017/18F
Domestic Production Imports
Hoadley Consulting
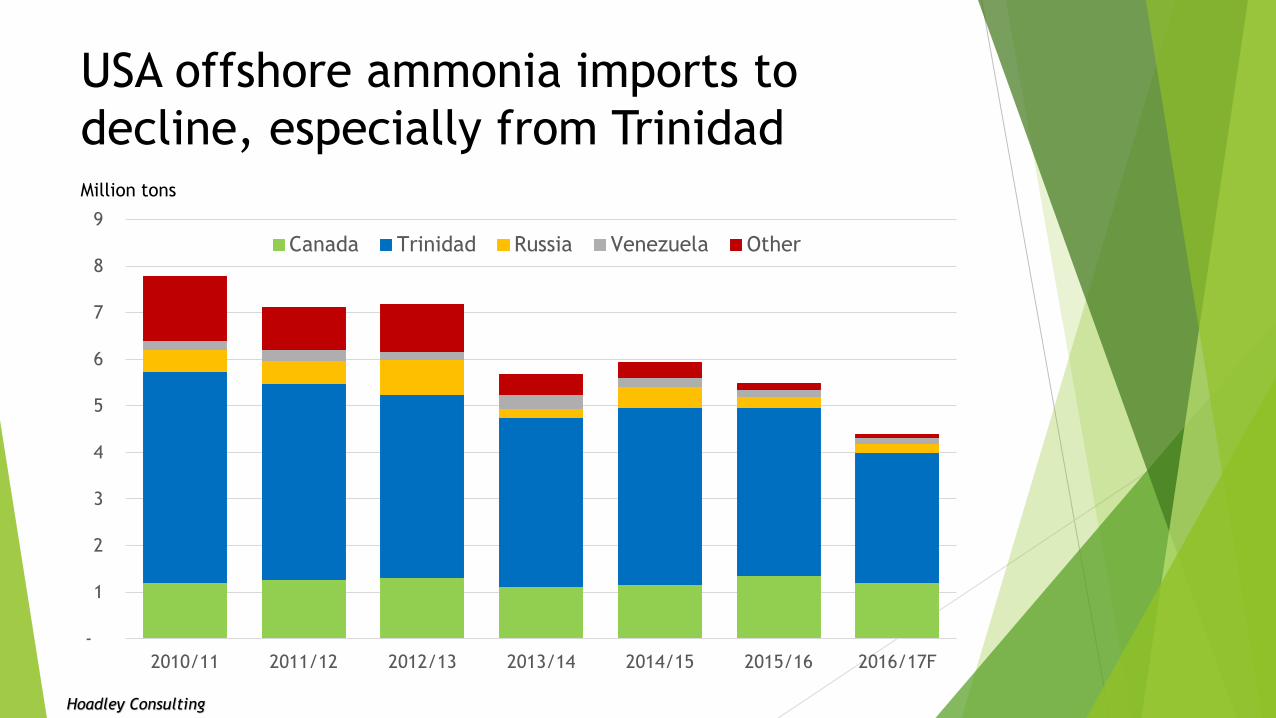
USA offshore ammonia imports to
decline, especially from Trinidad
-
1
2
3
4
5
6
7
8
9
2010/11 2011/12 2012/13 2013/14 2014/15 2015/16 2016/17F
Canada Trinidad Russia Venezuela Other
Million tons
Hoadley Consulting

2015/16 Ammonia Cost Curve based on
USA supply
Hoadley Consulting
USA Production
Trinidad
imports

How high will offshore USA Ammonia
exports grow?
-
50
100
150
200
250
300
2012/13 2013/14 2014/15 2015/16 2016/17F
Latin America Canada W. Europe Morocco Other
Hoadley Consulting

Urea Situation and Outlook
Hoadley Consulting

New USA urea production will displace about
half of current imports by 2017/18
2010/11 2011/12 2012/13 2013/14 2014/15 2015/16 2016/17F 2017/18F
Domestic Production Imports
Hoadley Consulting
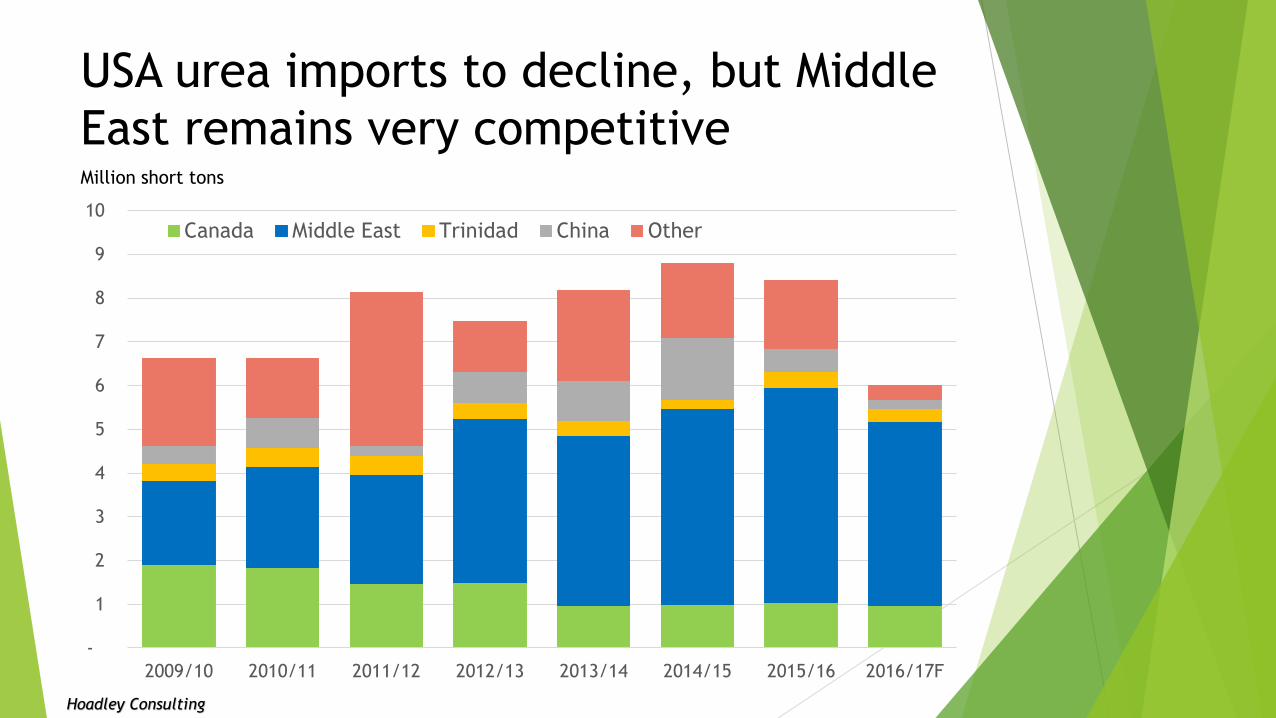
USA urea imports to decline, but Middle
East remains very competitive
-
1
2
3
4
5
6
7
8
9
10
2009/10 2010/11 2011/12 2012/13 2013/14 2014/15 2015/16 2016/17F
Canada Middle East Trinidad China Other
Million short tons
Hoadley Consulting

2015/16 Urea Cost Curve based on
USA supply
Hoadley Consulting
USA
productionMiddle East
imports

Will Offshore USA Urea exports increase?
-
50
100
150
200
250
300
350
400
450
2012/13 2013/14 2014/15 2015/16
Latin America Canada W. Europe Other
Hoadley Consulting

UAN Situation and Outlook
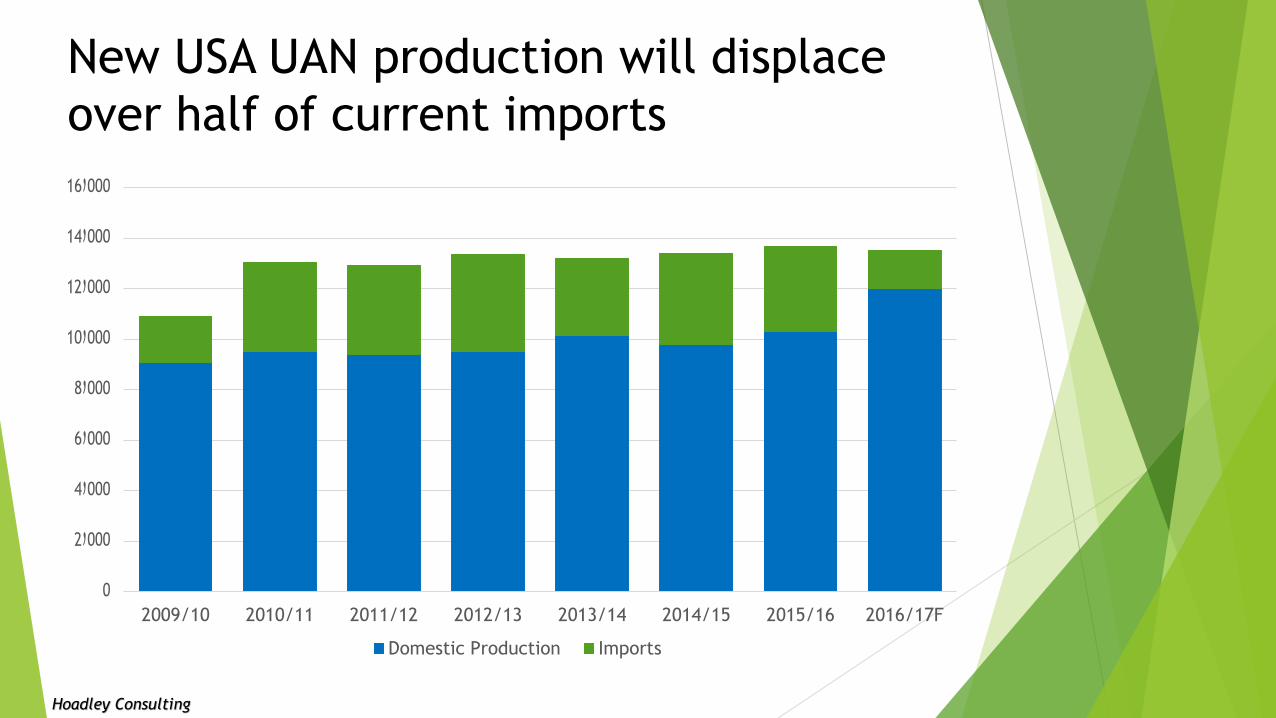
New USA UAN production will displace
over half of current imports
2009/10 2010/11 2011/12 2012/13 2013/14 2014/15 2015/16 2016/17F
Domestic Production Imports
Hoadley Consulting
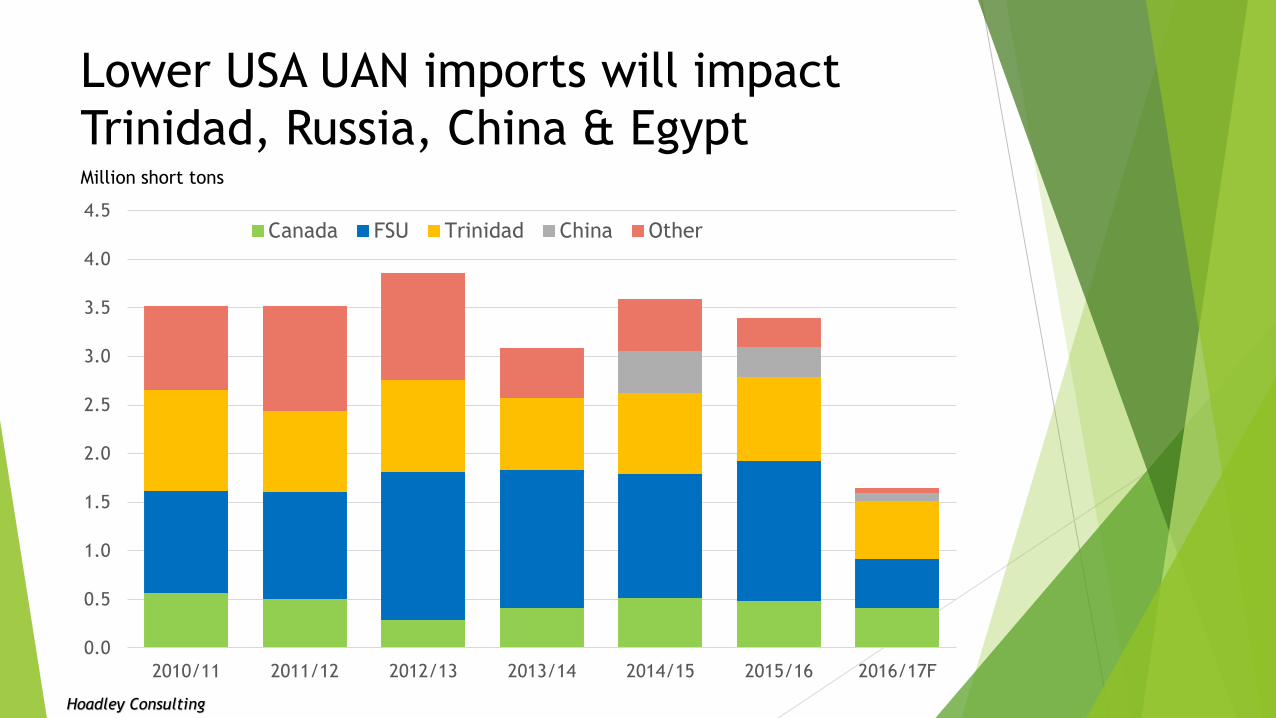
Lower USA UAN imports will impact
Trinidad, Russia, China & Egypt
0.0
0.5
1.0
1.5
2.0
2.5
3.0
3.5
4.0
4.5
2010/11 2011/12 2012/13 2013/14 2014/15 2015/16 2016/17F
Canada FSU Trinidad China Other
Million short tons
Hoadley Consulting

2015/16 UAN Cost Curve based on supply
to North America
Hoadley Consulting
North American production
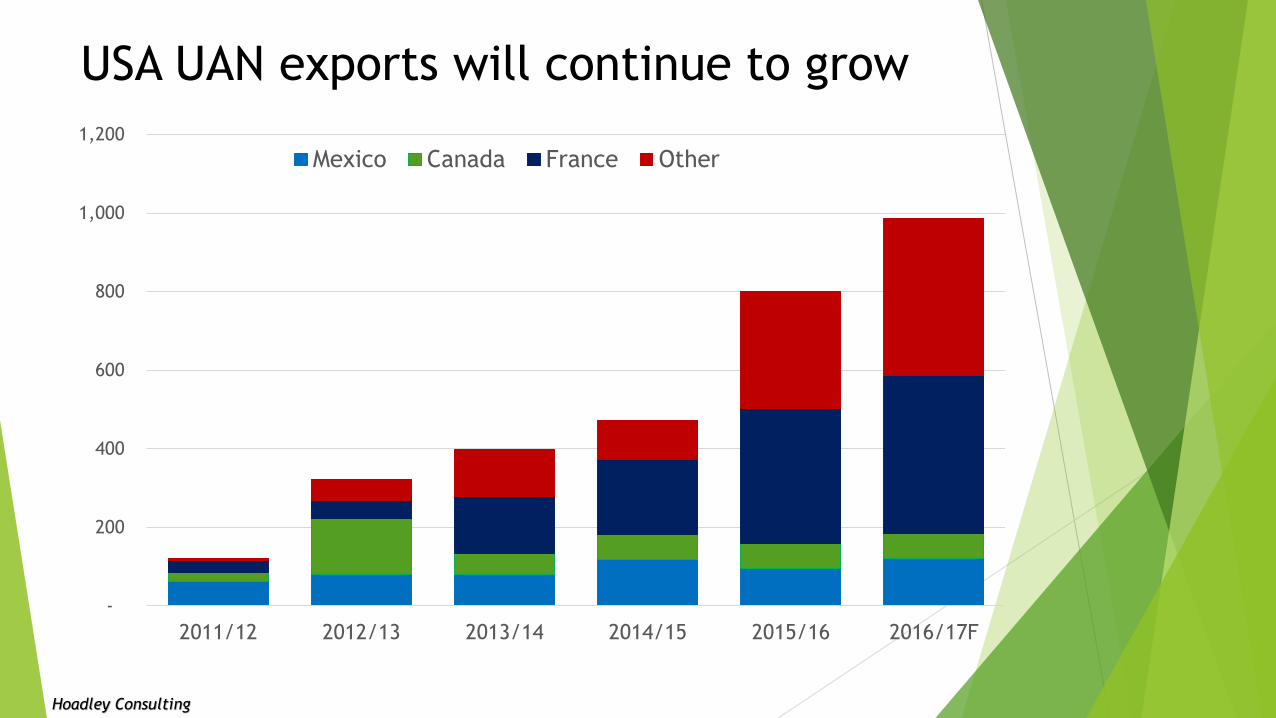
USA UAN exports will continue to grow
-
200
400
600
800
1,000
1,200
2011/12 2012/13 2013/14 2014/15 2015/16 2016/17F
Mexico Canada France Other
Hoadley Consulting

Summary
New nitrogen capacity peaks in 2016; the global balance starts to return in
2018 and 2019
Fertilizer demand growth will be slow unless grain prices rally; industrial
growth should remain strong
New capacity, lower energy values and currency devaluations has put pressure
on nitrogen fertilizer prices
The cash cost of the marginal supplier to the USA will decline as high-cost
suppliers are no longer competitive
New North American production will result in lower ammonia, urea and UAN
offshore imports, but….imports will continue
USA offshore exports will expand for UAN & ammonia and probably urea
Hoadley Consulting

Appendix Sources are mainly TFI, IFA, & Company Reports
Forecasts are by Hoadley Consulting
Years are USA fertilizer years (July-June)
Data are short tons, mostly in ‘000 except where noted otherwise
Costs are US$/ton, delivered to US Gulf for Offshore suppliers
We do not guarantee the accuracy of any assumptions, data or forecasts
More questions? Call Doug at +1-847-636-1747
Go Cubs!
Hoadley Consulting