
Norovirus in bivalve mollusk, the UK experience (Dr. David ... · • Norovirus and hepatitis A...
40
Norovirus in bivalve molluscs the UK experience David Lees European Union Reference Laboratory for Monitoring Bacteriological and Viral Contamination of Bivalve Molluscs
-
Upload
phungthien -
Category
Documents
-
view
215 -
download
0
Transcript of Norovirus in bivalve mollusk, the UK experience (Dr. David ... · • Norovirus and hepatitis A...
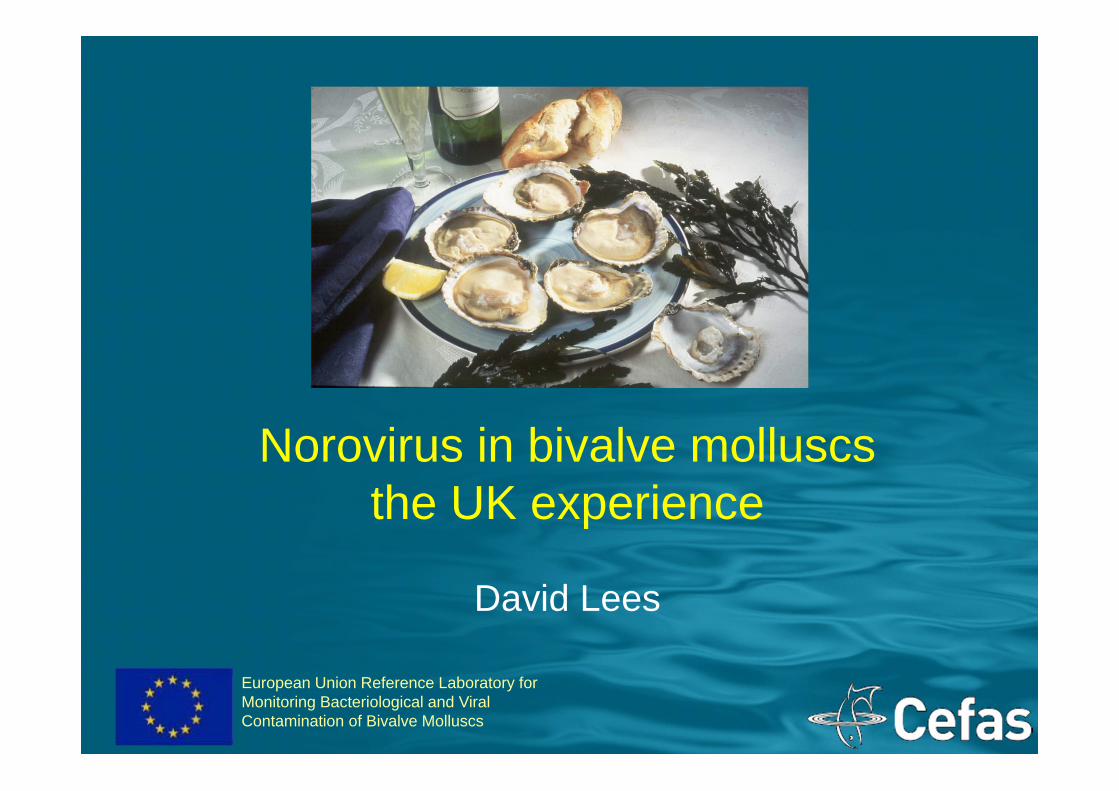
Norovirus in bivalve molluscs the UK experience
David Lees
European Union Reference Laboratory for Monitoring Bacteriological and Viral Contamination of Bivalve Molluscs

Cefas• The Centre for Environment, Fisheries,
and Aquaculture Science• Executive Agency of DEFRA• Two specialist laboratories, 500 highly
qualified staff, unique facilities, international perspective
• Cefas – making a difference for 100 years
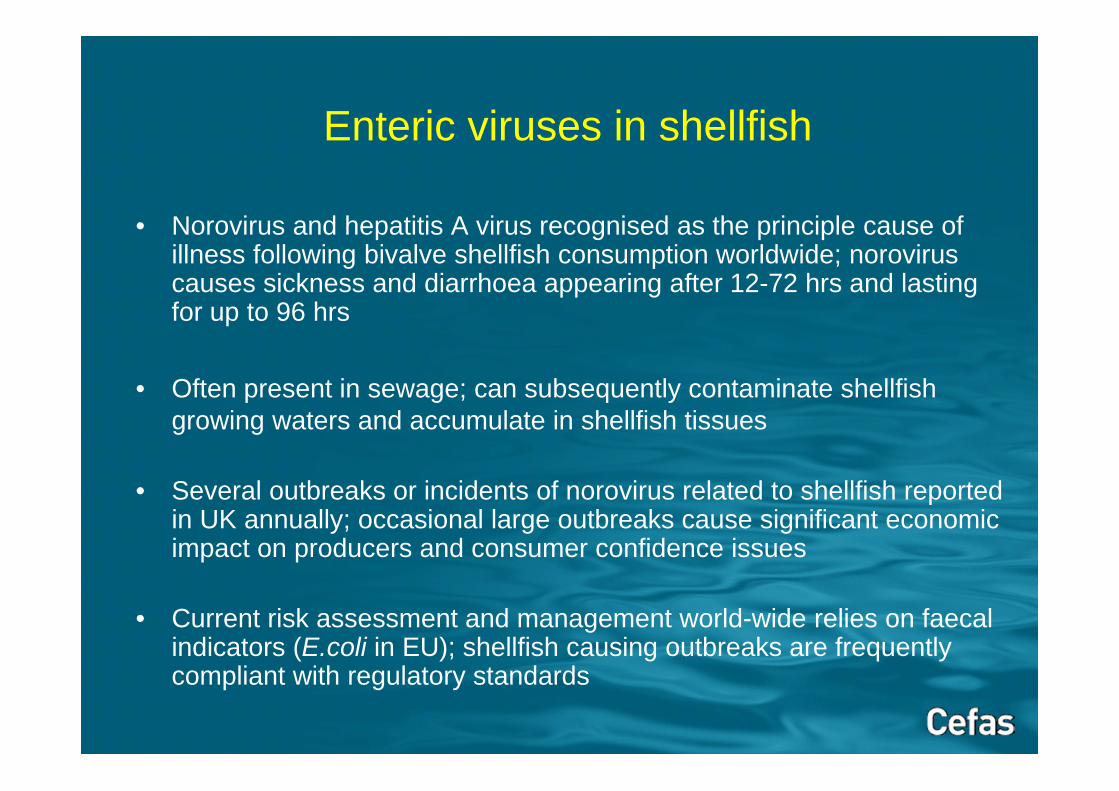
• Norovirus and hepatitis A virus recognised as the principle cause of illness following bivalve shellfish consumption worldwide; noroviruscauses sickness and diarrhoea appearing after 12-72 hrs and lasting for up to 96 hrs
• Often present in sewage; can subsequently contaminate shellfish growing waters and accumulate in shellfish tissues
• Several outbreaks or incidents of norovirus related to shellfish reported in UK annually; occasional large outbreaks cause significant economic impact on producers and consumer confidence issues
• Current risk assessment and management world-wide relies on faecal indicators (E.coli in EU); shellfish causing outbreaks are frequently compliant with regulatory standards
Enteric viruses in shellfish
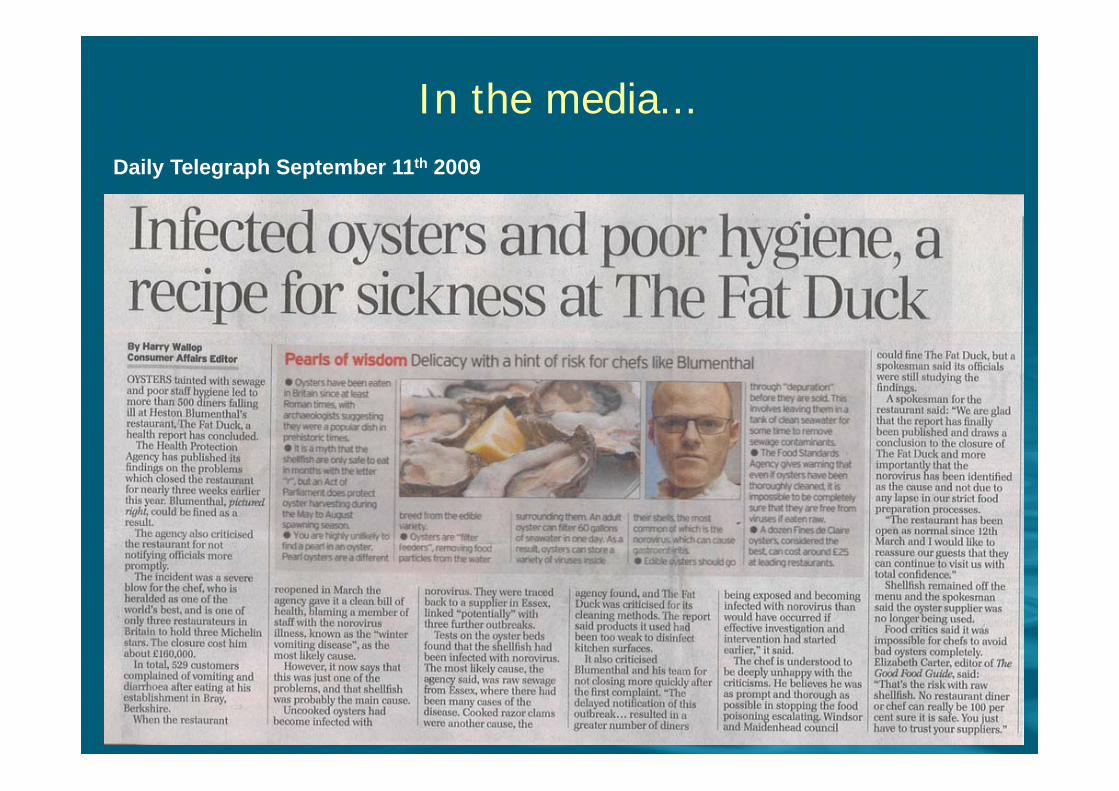
Daily Telegraph September 11th 2009
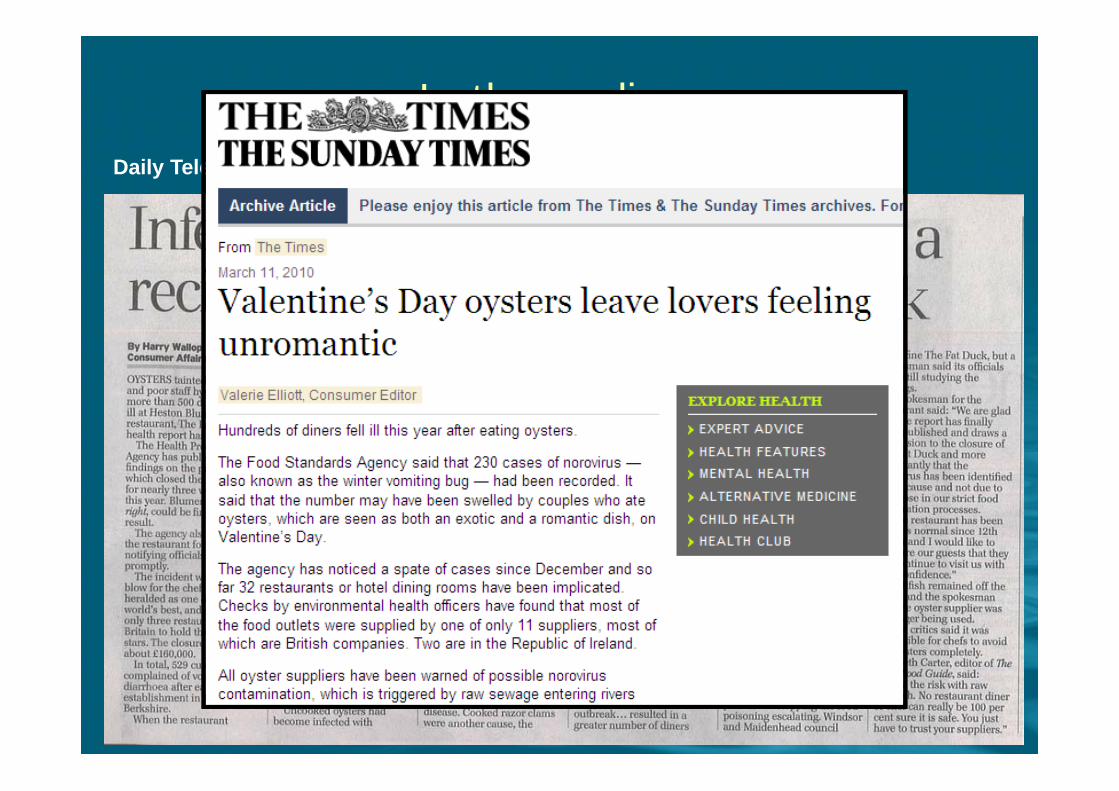
In the media...
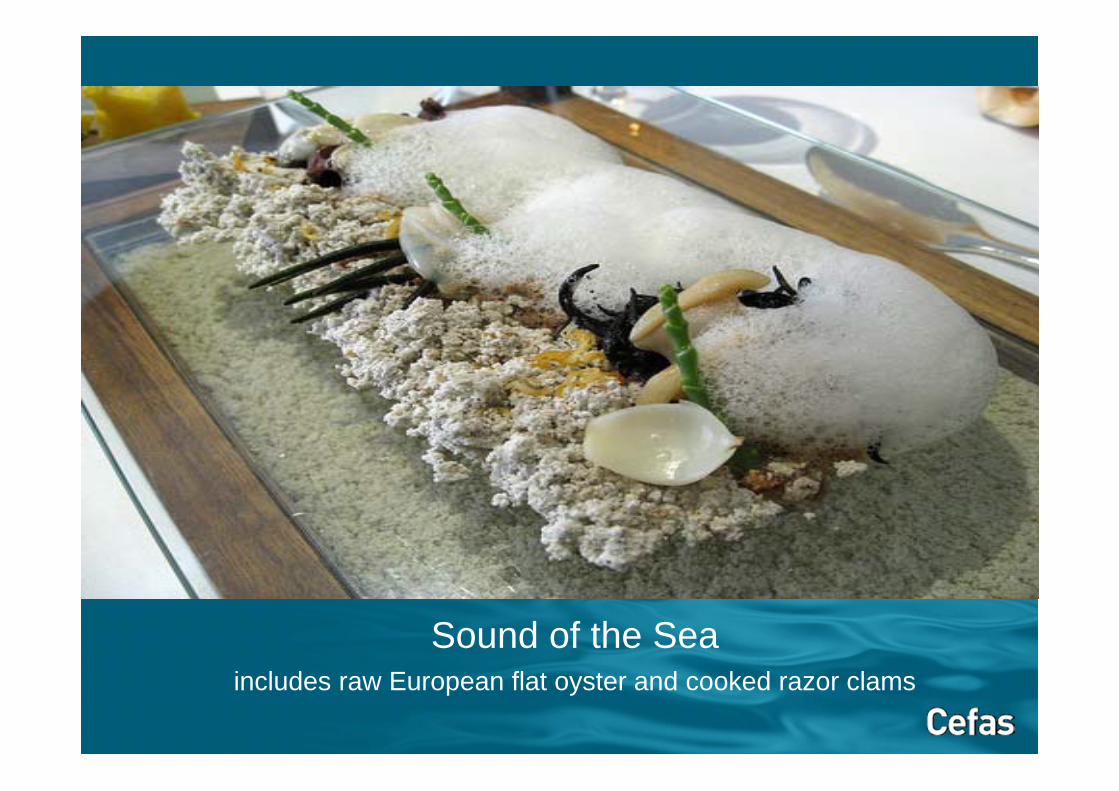
Sound of the Seaincludes raw European flat oyster and cooked razor clams
Daily Telegraph September 11th 2009
In the media...
0
5
10
15
20
25
87 88 89 90 91 92 93 94 95 96 97 98 99 00 01 02 03 04 05 06 07 08 09 10 11 12 13 14
Num
ber o
f rep
orte
d ou
tbre
aks
Year
Other
Hepatitis A
Viral gastroenteritis
Unknown
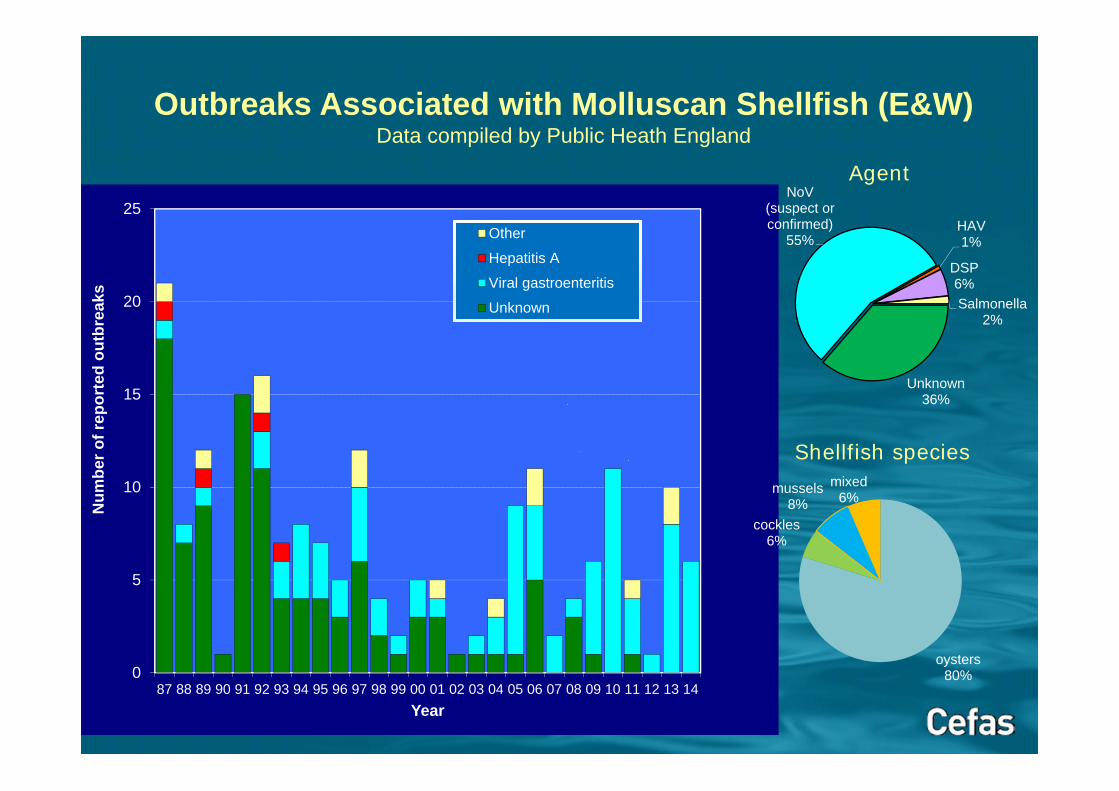
Outbreaks Associated with Molluscan Shellfish (E&W)Data compiled by Public Heath England
Shellfish species
oysters80%
cockles6%
mussels8%
mixed6%
Agent
Unknown36%
NoV(suspect or confirmed)
55%HAV1%
DSP6%Salmonella
2%
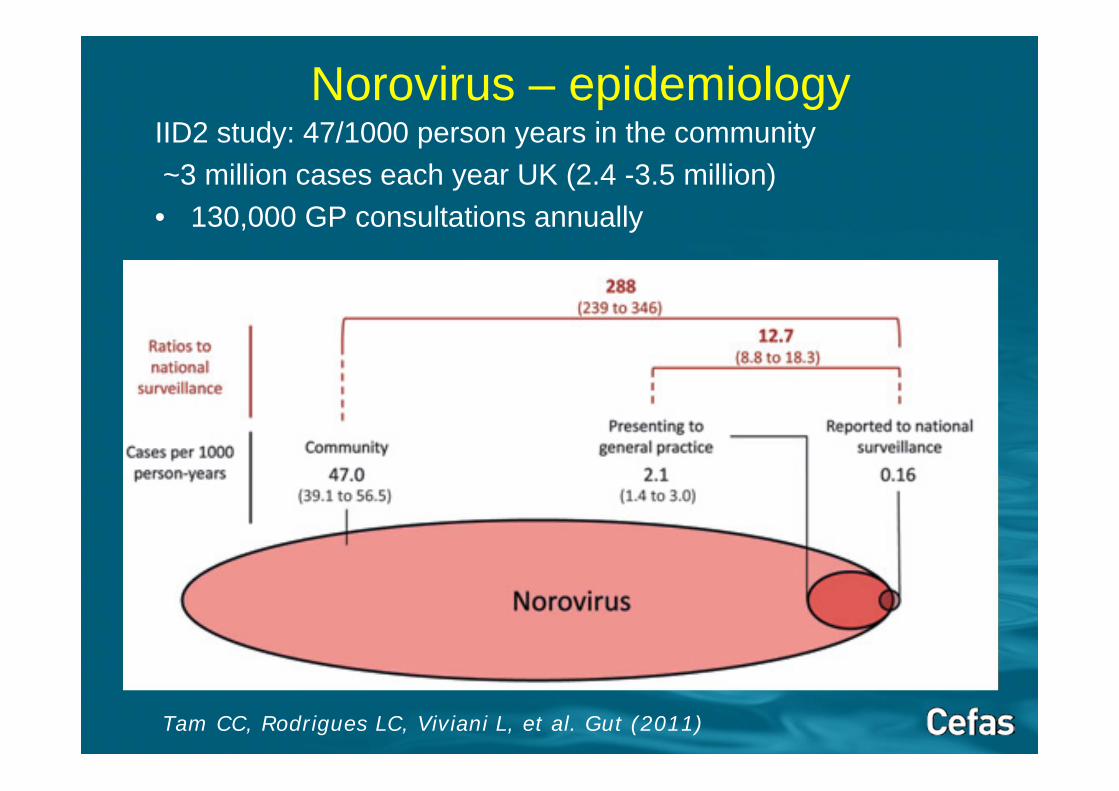
Tam CC, Rodrigues LC, Viviani L, et al. Gut (2011)
Norovirus – epidemiologyIID2 study: 47/1000 person years in the community~3 million cases each year UK (2.4 -3.5 million)• 130,000 GP consultations annually
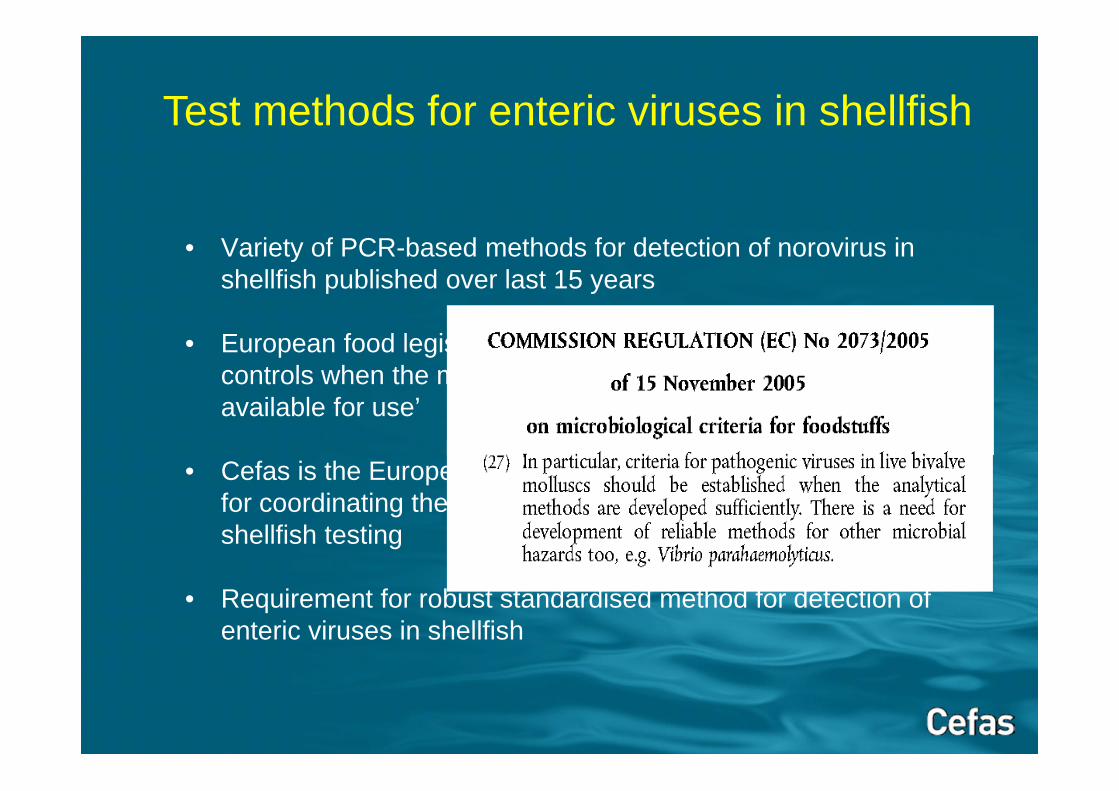
• Variety of PCR-based methods for detection of norovirus in shellfish published over last 15 years
• European food legislation anticipates the adoption of virus controls when the methods are ‘sufficiently developed and available for use’
• Cefas is the European Reference laboratory with responsibility for coordinating the application of analytical methods for shellfish testing
• Requirement for robust standardised method for detection of enteric viruses in shellfish
Test methods for enteric viruses in shellfish
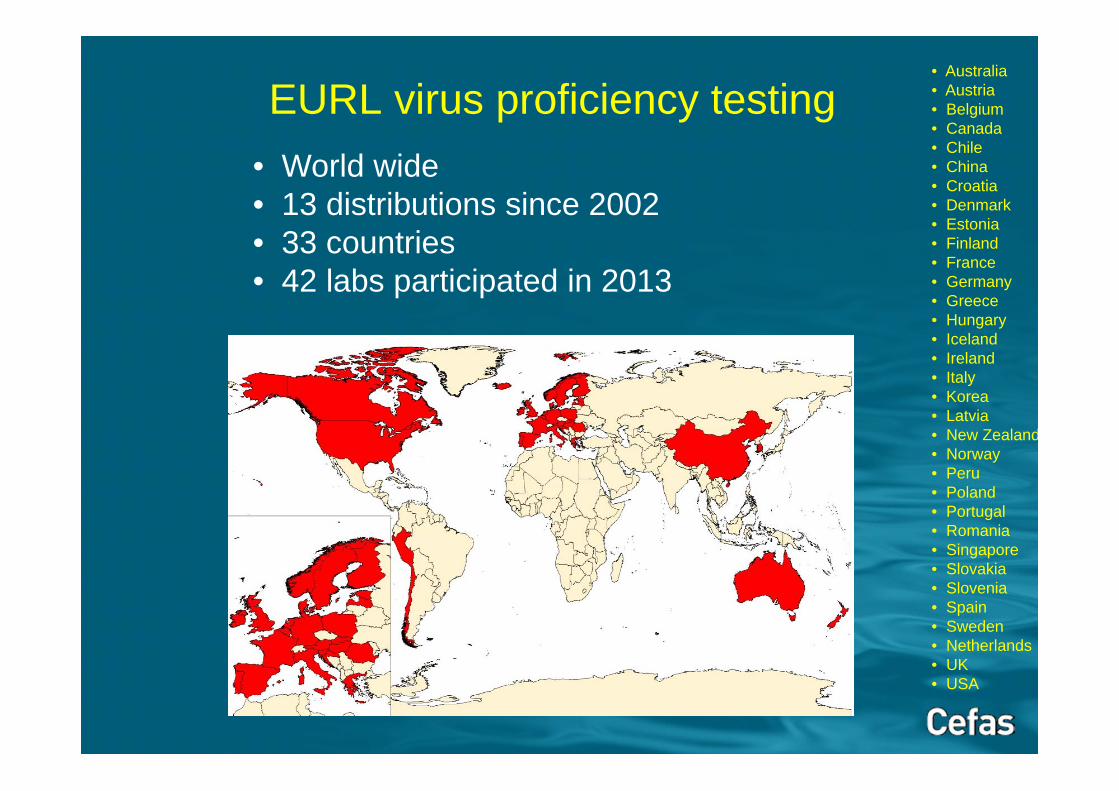
EURL virus proficiency testing• World wide• 13 distributions since 2002• 33 countries• 42 labs participated in 2013
• Australia• Austria• Belgium• Canada• Chile• China• Croatia • Denmark• Estonia• Finland• France• Germany• Greece• Hungary• Iceland• Ireland• Italy• Korea• Latvia• New Zealand• Norway• Peru• Poland• Portugal• Romania• Singapore• Slovakia• Slovenia• Spain• Sweden• Netherlands• UK• USA
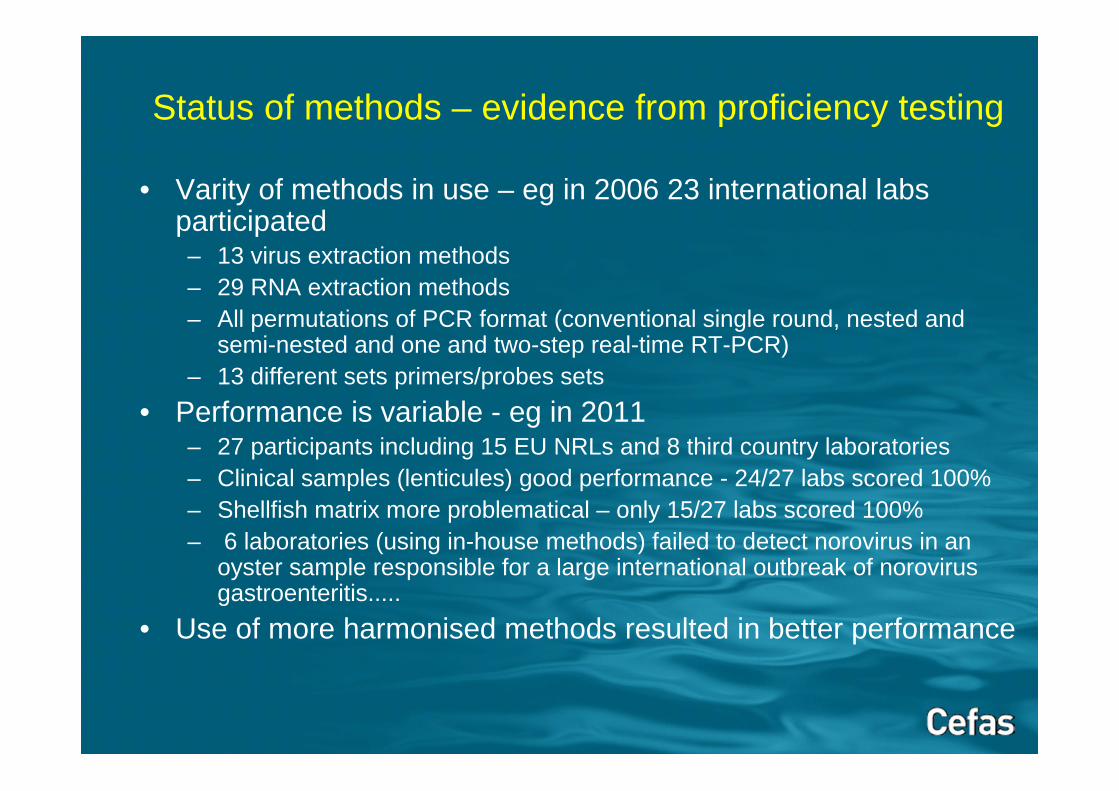
Status of methods – evidence from proficiency testing
• Varity of methods in use – eg in 2006 23 international labs participated– 13 virus extraction methods– 29 RNA extraction methods– All permutations of PCR format (conventional single round, nested and
semi-nested and one and two-step real-time RT-PCR)– 13 different sets primers/probes sets
• Performance is variable - eg in 2011– 27 participants including 15 EU NRLs and 8 third country laboratories – Clinical samples (lenticules) good performance - 24/27 labs scored 100%– Shellfish matrix more problematical – only 15/27 labs scored 100%– 6 laboratories (using in-house methods) failed to detect norovirus in an
oyster sample responsible for a large international outbreak of norovirus gastroenteritis.....
• Use of more harmonised methods resulted in better performance
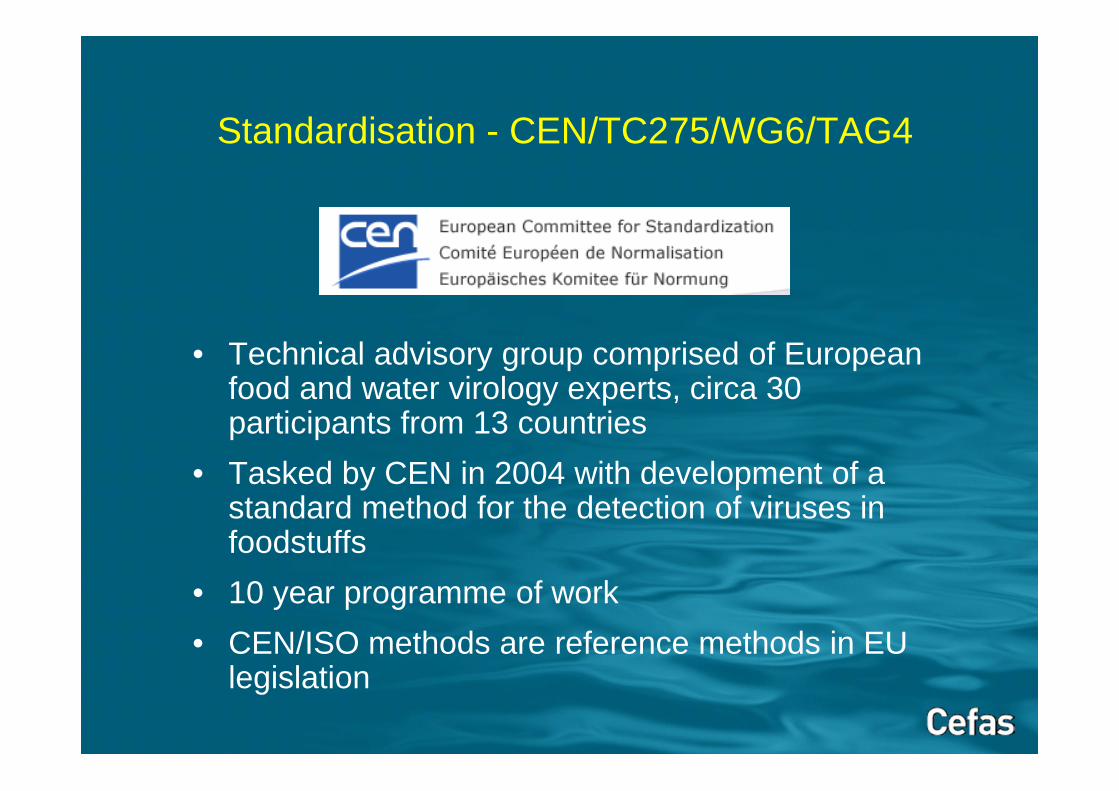
Standardisation - CEN/TC275/WG6/TAG4
• Technical advisory group comprised of European food and water virology experts, circa 30 participants from 13 countries
• Tasked by CEN in 2004 with development of a standard method for the detection of viruses in foodstuffs
• 10 year programme of work• CEN/ISO methods are reference methods in EU
legislation
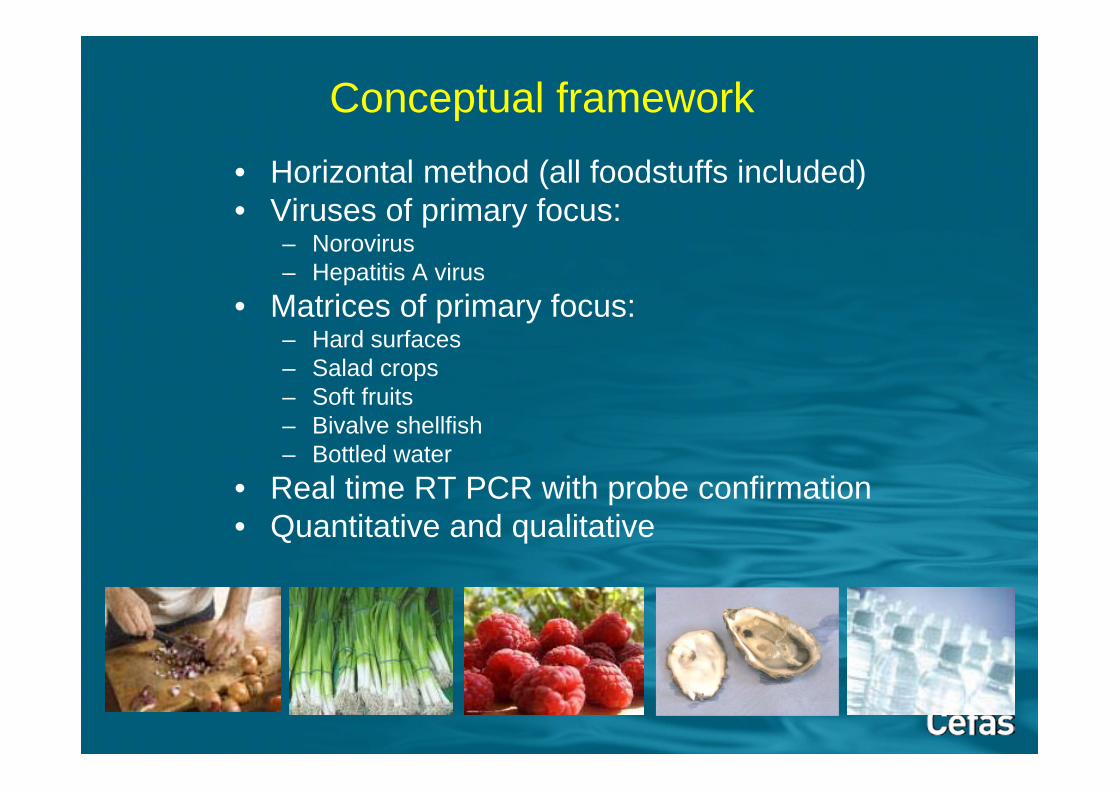
Conceptual framework• Horizontal method (all foodstuffs included)• Viruses of primary focus:
– Norovirus– Hepatitis A virus
• Matrices of primary focus:– Hard surfaces– Salad crops– Soft fruits– Bivalve shellfish– Bottled water
• Real time RT PCR with probe confirmation• Quantitative and qualitative
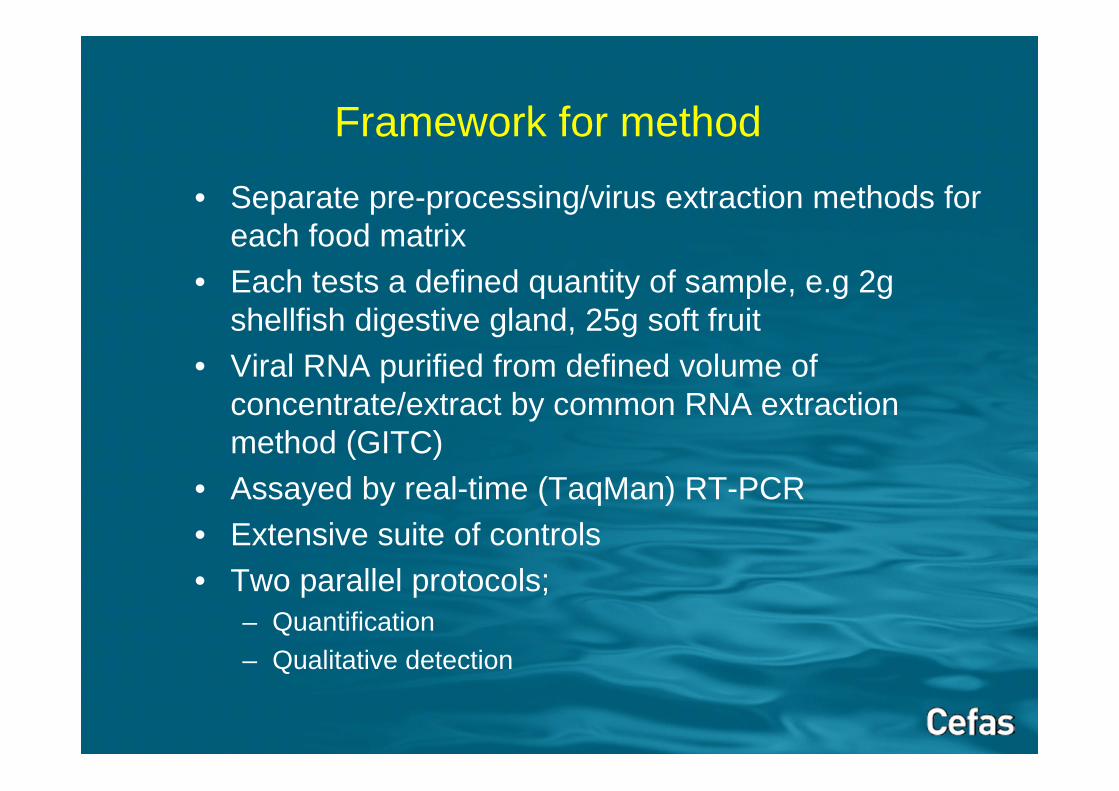
Framework for method
• Separate pre-processing/virus extraction methods for each food matrix
• Each tests a defined quantity of sample, e.g 2g shellfish digestive gland, 25g soft fruit
• Viral RNA purified from defined volume of concentrate/extract by common RNA extraction method (GITC)
• Assayed by real-time (TaqMan) RT-PCR• Extensive suite of controls• Two parallel protocols;
– Quantification– Qualitative detection
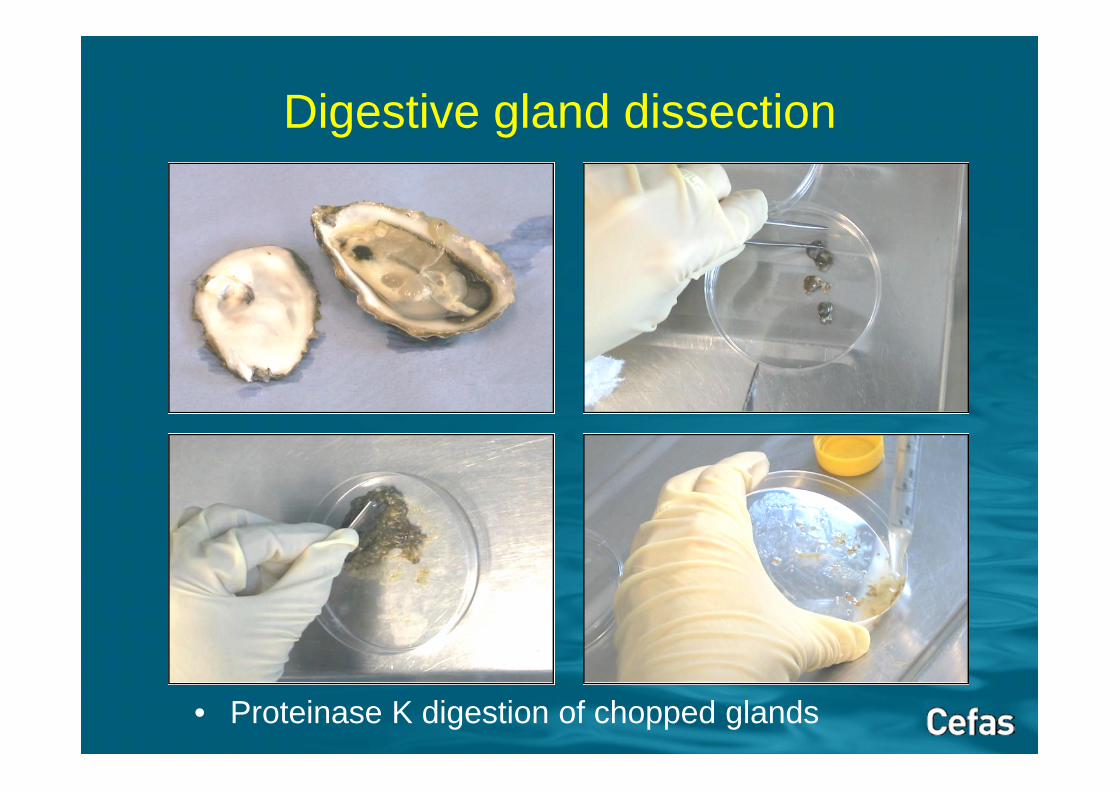
Digestive gland dissection
• Proteinase K digestion of chopped glands
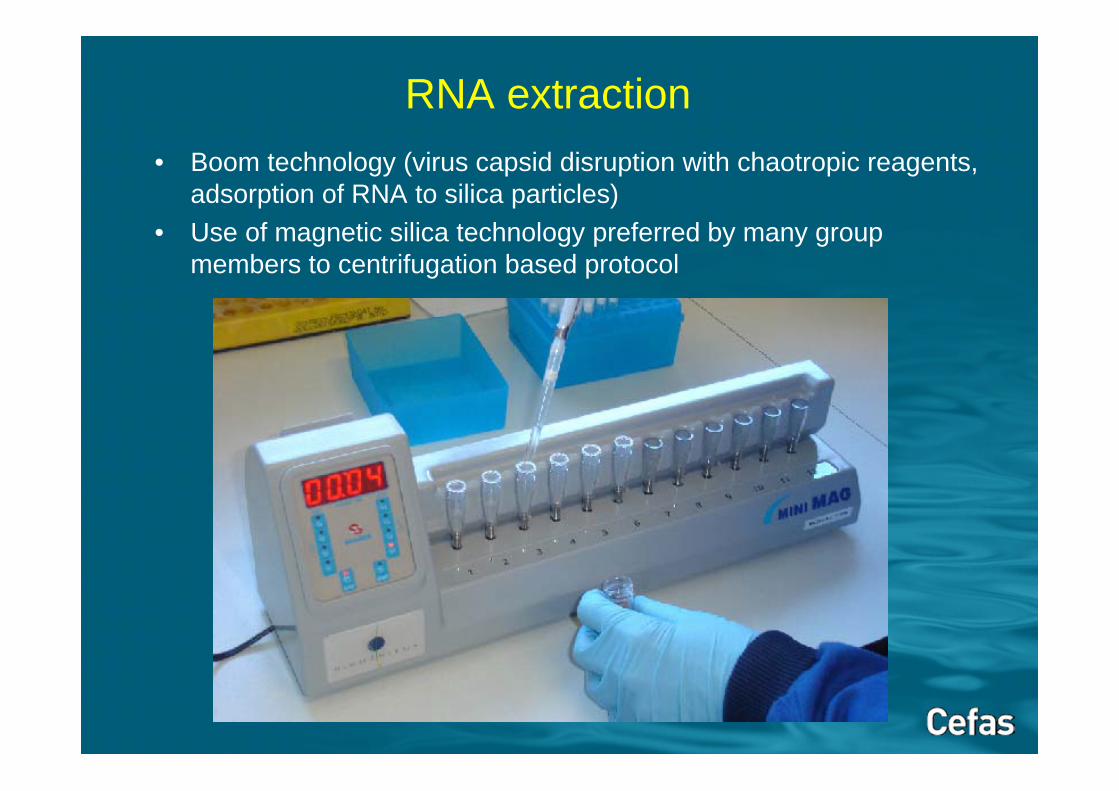
RNA extraction• Boom technology (virus capsid disruption with chaotropic reagents,
adsorption of RNA to silica particles)• Use of magnetic silica technology preferred by many group
members to centrifugation based protocol
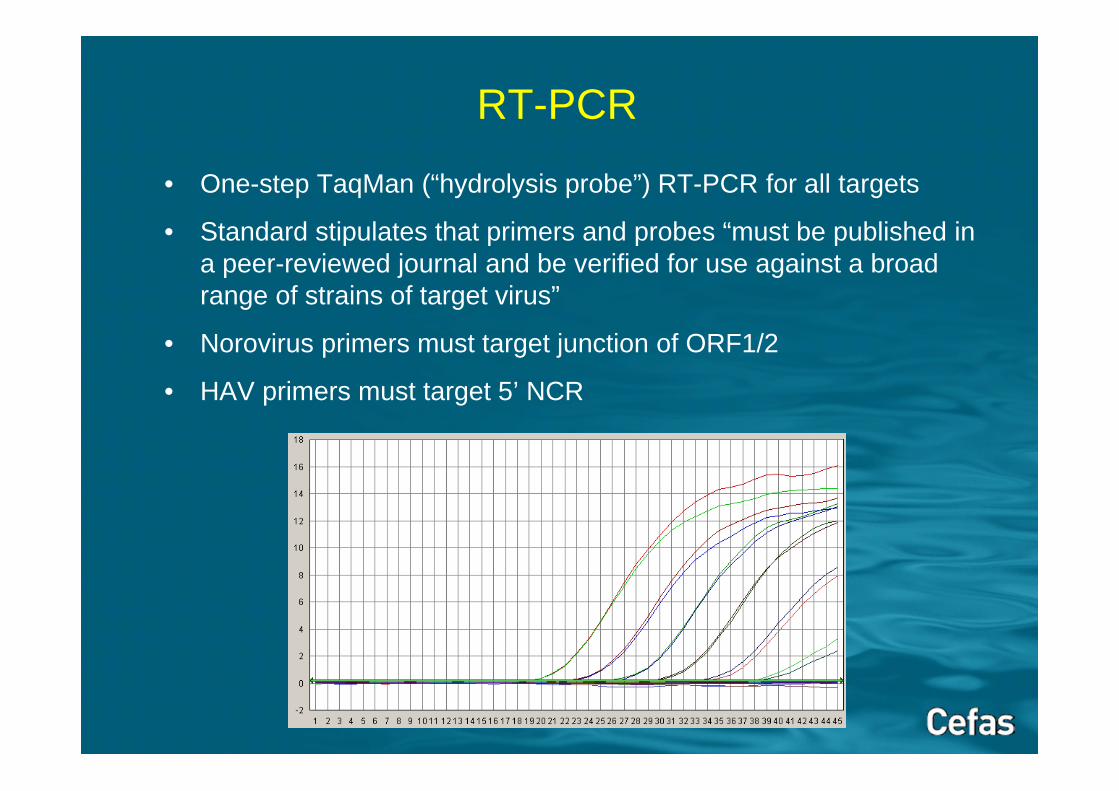
RT-PCR
• One-step TaqMan (“hydrolysis probe”) RT-PCR for all targets
• Standard stipulates that primers and probes “must be published in a peer-reviewed journal and be verified for use against a broad range of strains of target virus”
• Norovirus primers must target junction of ORF1/2
• HAV primers must target 5’ NCR
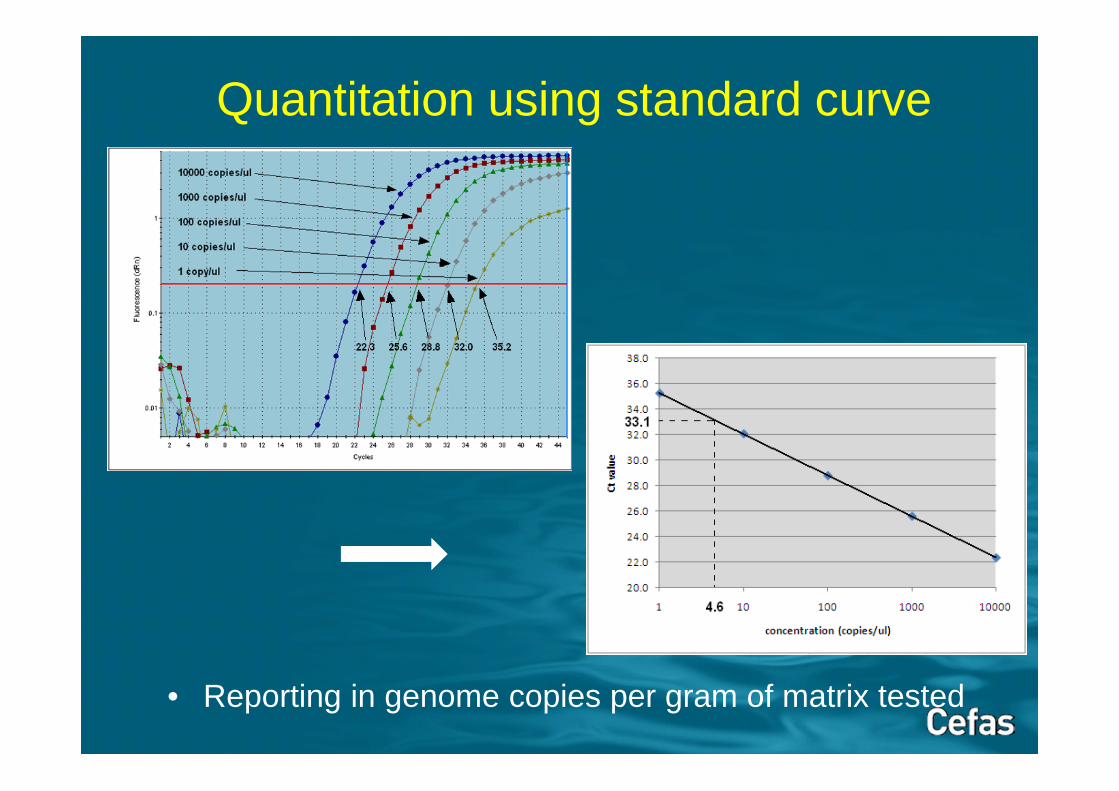
Quantitation using standard curve
• Reporting in genome copies per gram of matrix tested
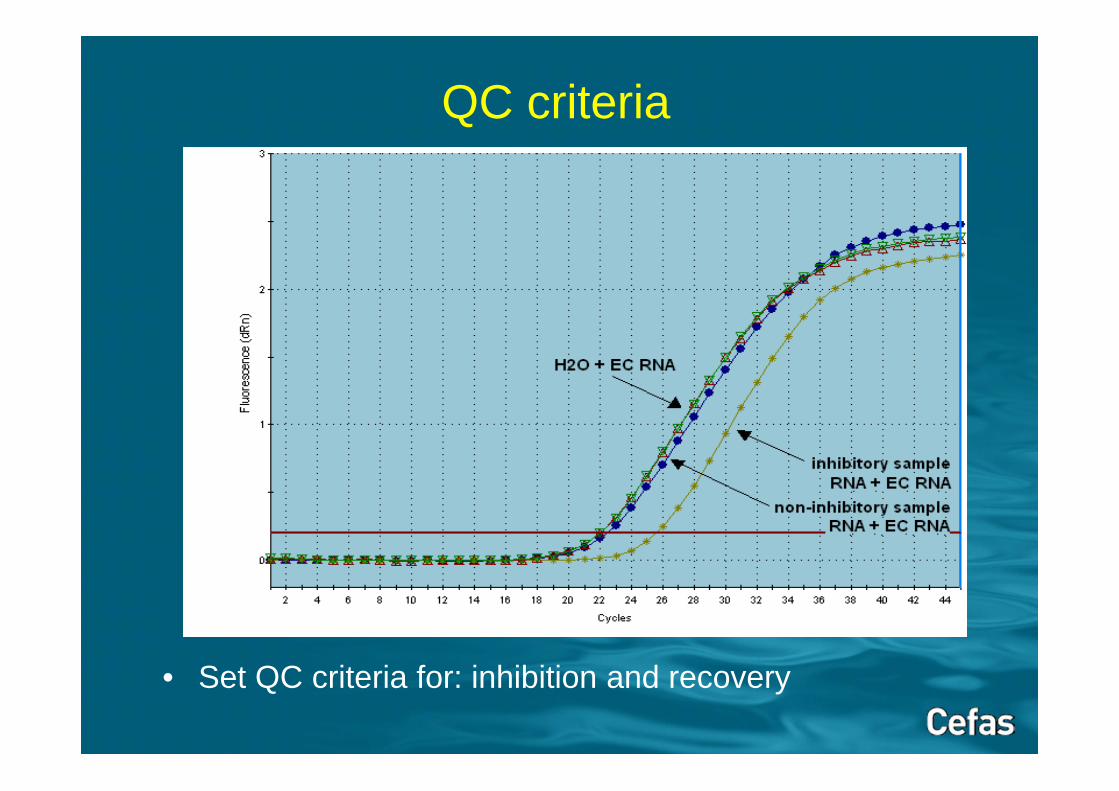
QC criteria
• Set QC criteria for: inhibition and recovery

Application of TS 15216
• Method in routine use across Europe and elsewhere for a variety of food matrices
• Used to investigate major outbreak of food poisoning (11,000 cases) in Germany linked to consumption of strawberries
• Used to investigate shellfish-related norovirus outbreaks in several countries
Validation of ISO/TS 15216• Maximum lifespan of technical specification 6 years;
requires validation to convert to “full” standard• European project to validate TS 15216-1 (quantification)
in 7 food matrices– Oysters– Mussels– Raspberries– Lettuce– Spring Onions– Bottled Water– Food Surfaces (Bell Pepper)
• In two stages– Method characterisation in single labs (to determine LOD, LOQ,
linearity)– Interlaboratory trials (10 labs per matrix; repeatability, reproducibility)
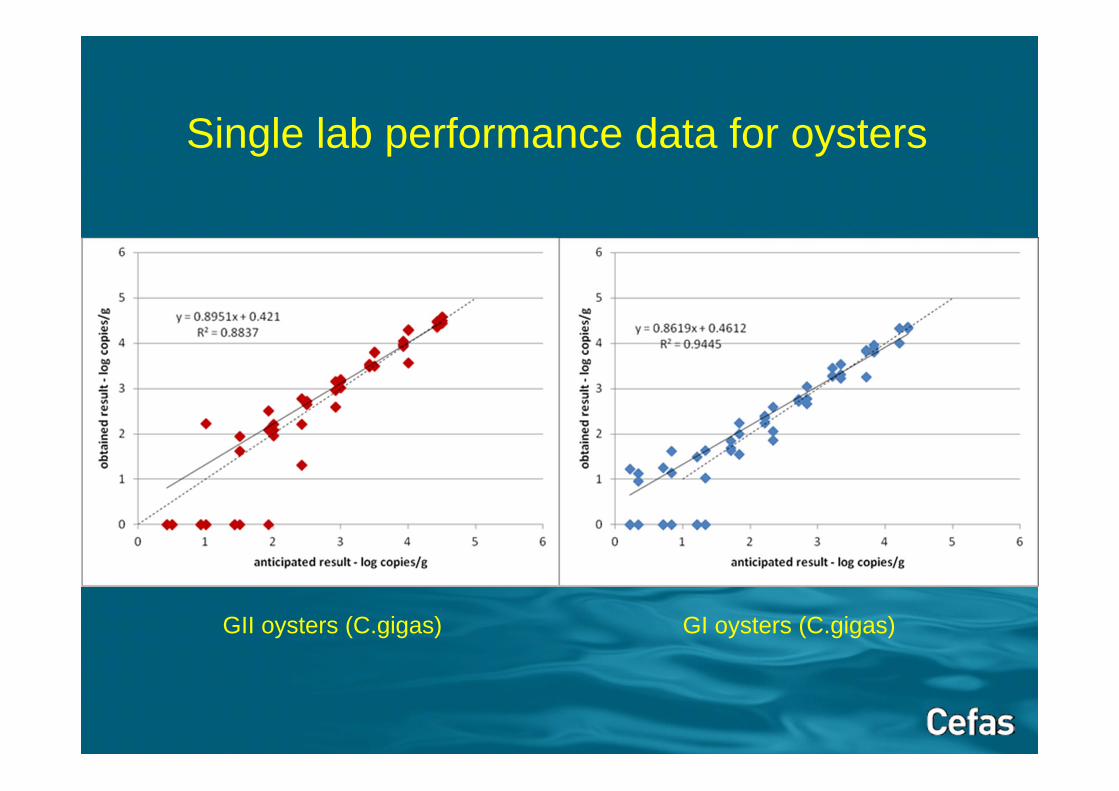
GII oysters (C.gigas) GI oysters (C.gigas)
Single lab performance data for oysters
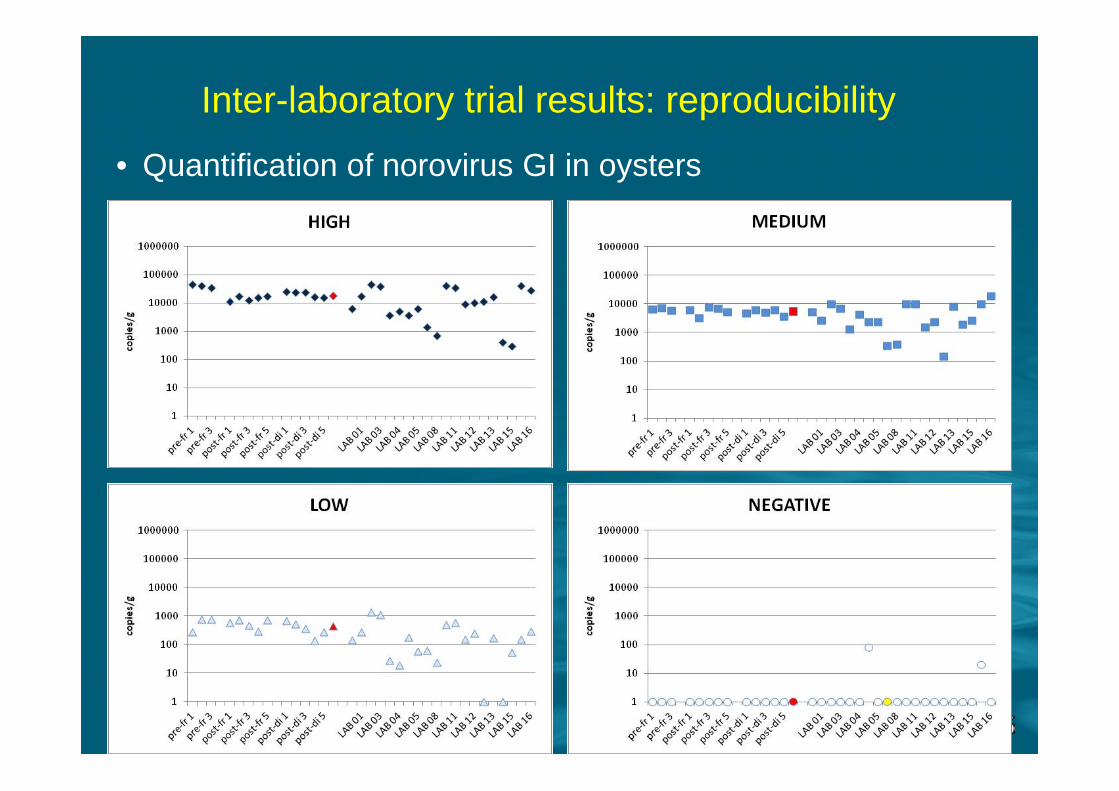
Inter-laboratory trial results: reproducibility
• Quantification of norovirus GI in oysters
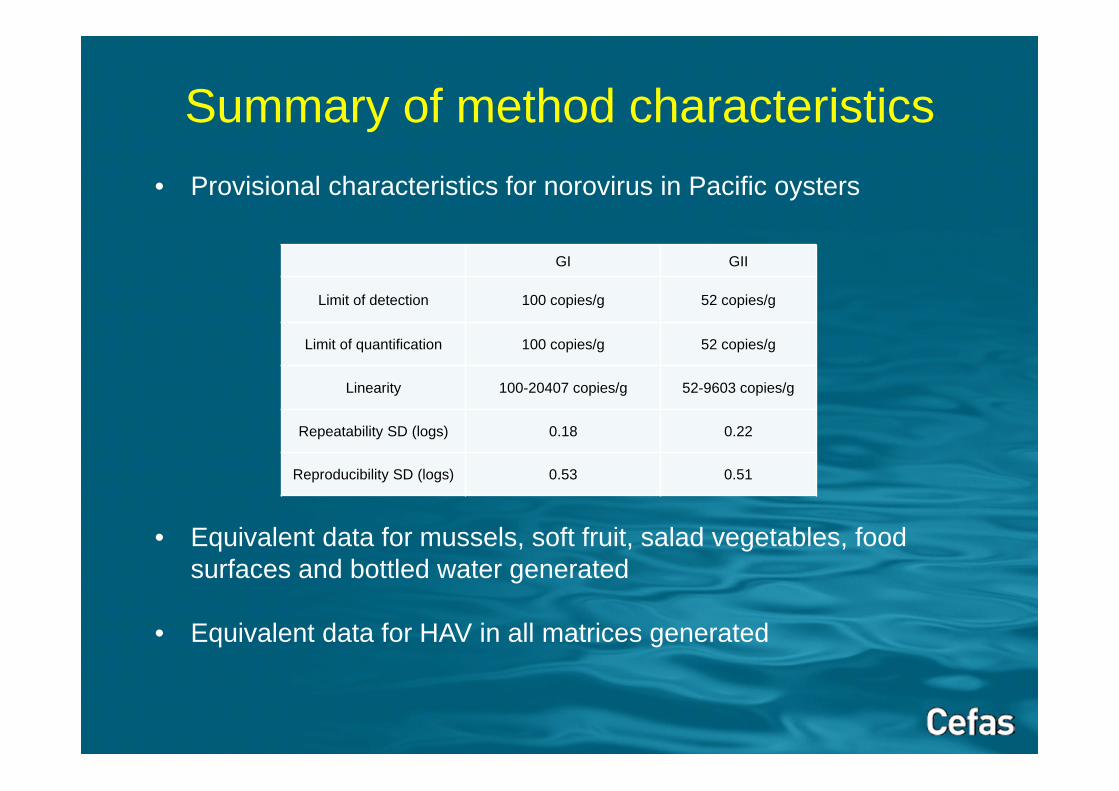
Summary of method characteristics
GI GII
Limit of detection 100 copies/g 52 copies/g
Limit of quantification 100 copies/g 52 copies/g
Linearity 100-20407 copies/g 52-9603 copies/g
Repeatability SD (logs) 0.18 0.22
Reproducibility SD (logs) 0.53 0.51
• Provisional characteristics for norovirus in Pacific oysters
• Equivalent data for mussels, soft fruit, salad vegetables, food surfaces and bottled water generated
• Equivalent data for HAV in all matrices generated
Publication of validated ISO 15216-1
• New draft of ISO 15216-1 prepared following validation
• Includes:-
– modifications to the method following experience of validation
– precision data
• CEN ISO technical enquiry to be launched August 2015 (to run for 3 months)
• Subject to vote, publication due November 2016
Application of virus methods in the UK
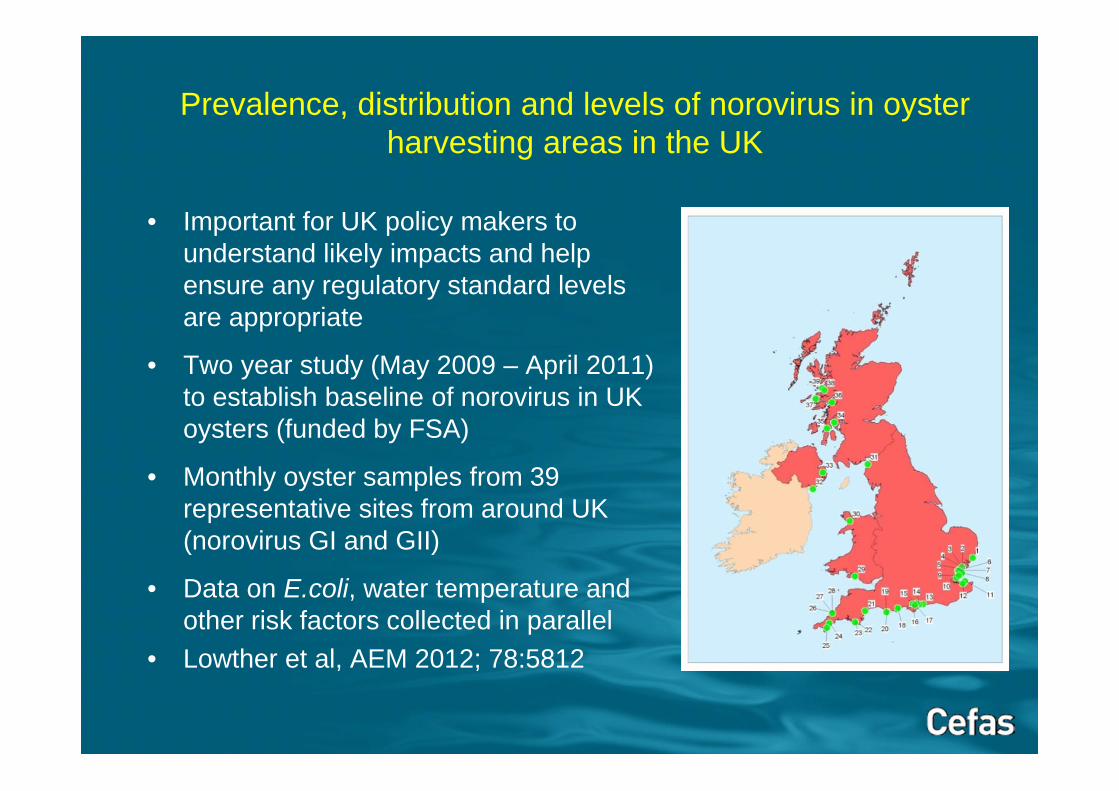
• Important for UK policy makers to understand likely impacts and help ensure any regulatory standard levels are appropriate
• Two year study (May 2009 – April 2011) to establish baseline of norovirus in UK oysters (funded by FSA)
• Monthly oyster samples from 39 representative sites from around UK (norovirus GI and GII)
• Data on E.coli, water temperature and other risk factors collected in parallel
• Lowther et al, AEM 2012; 78:5812
Prevalence, distribution and levels of norovirus in oyster harvesting areas in the UK
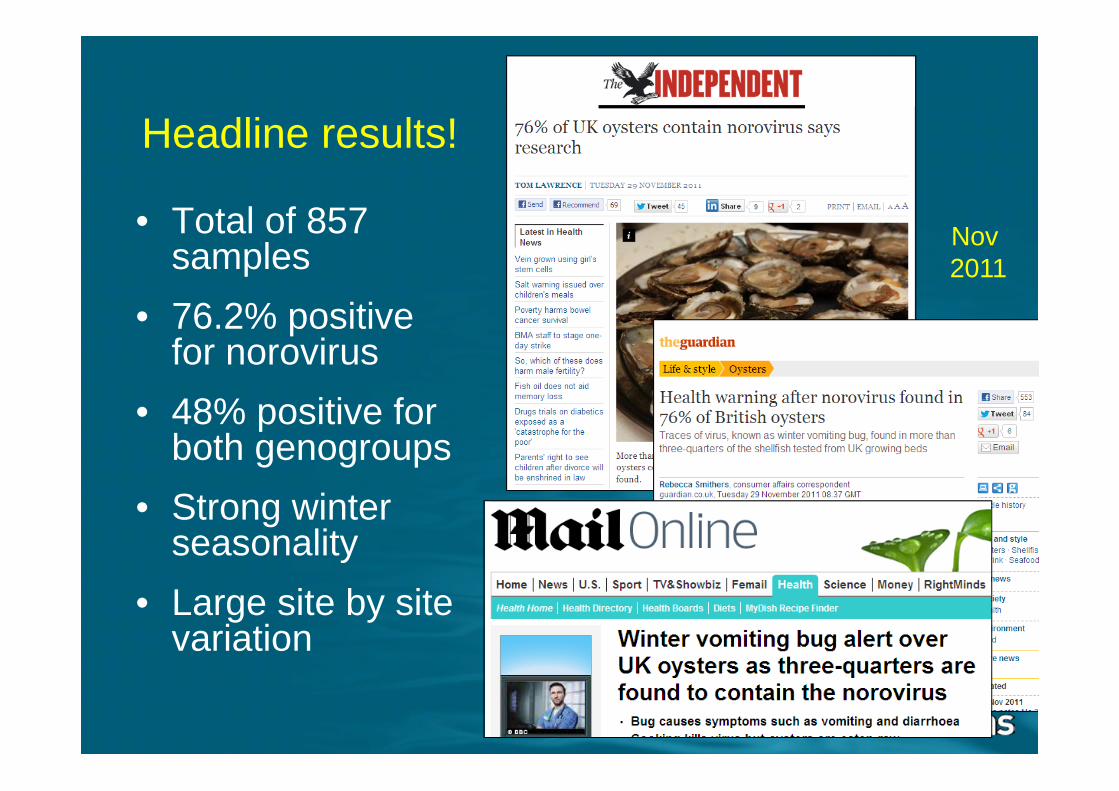
• Total of 857 samples
• 76.2% positive for norovirus
• 48% positive for both genogroups
• Strong winter seasonality
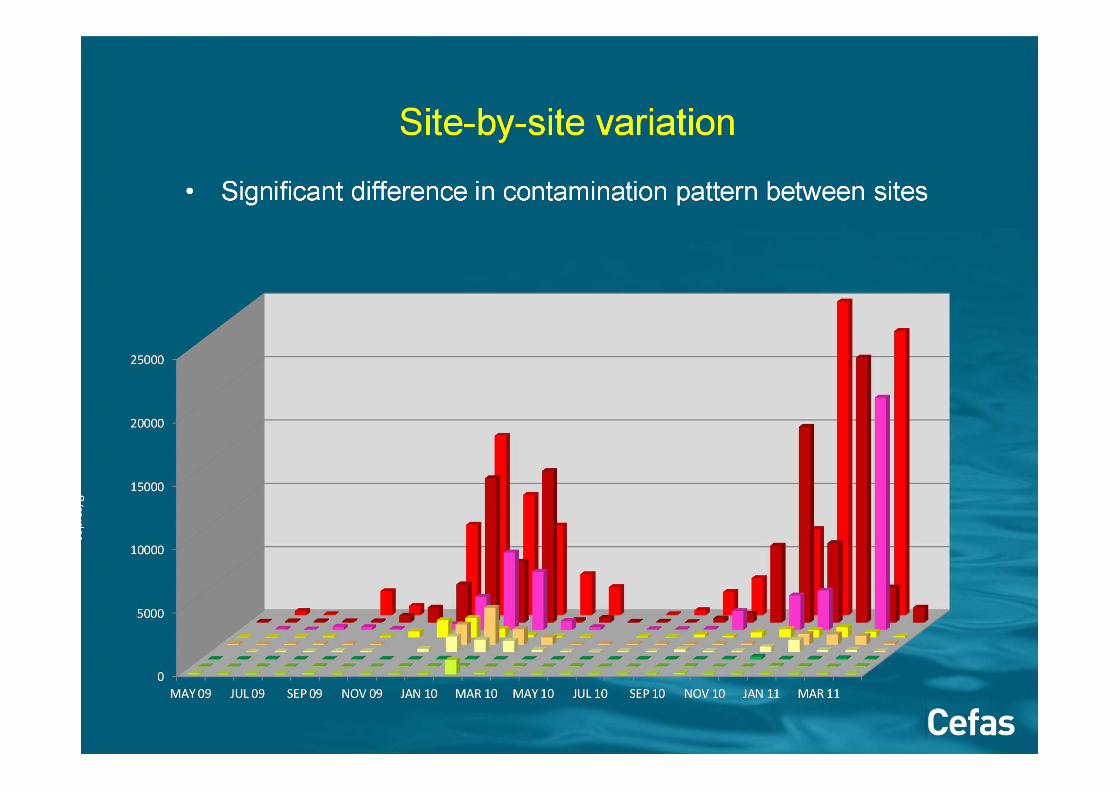
• Large site by site variation
Headline results!
Nov2011
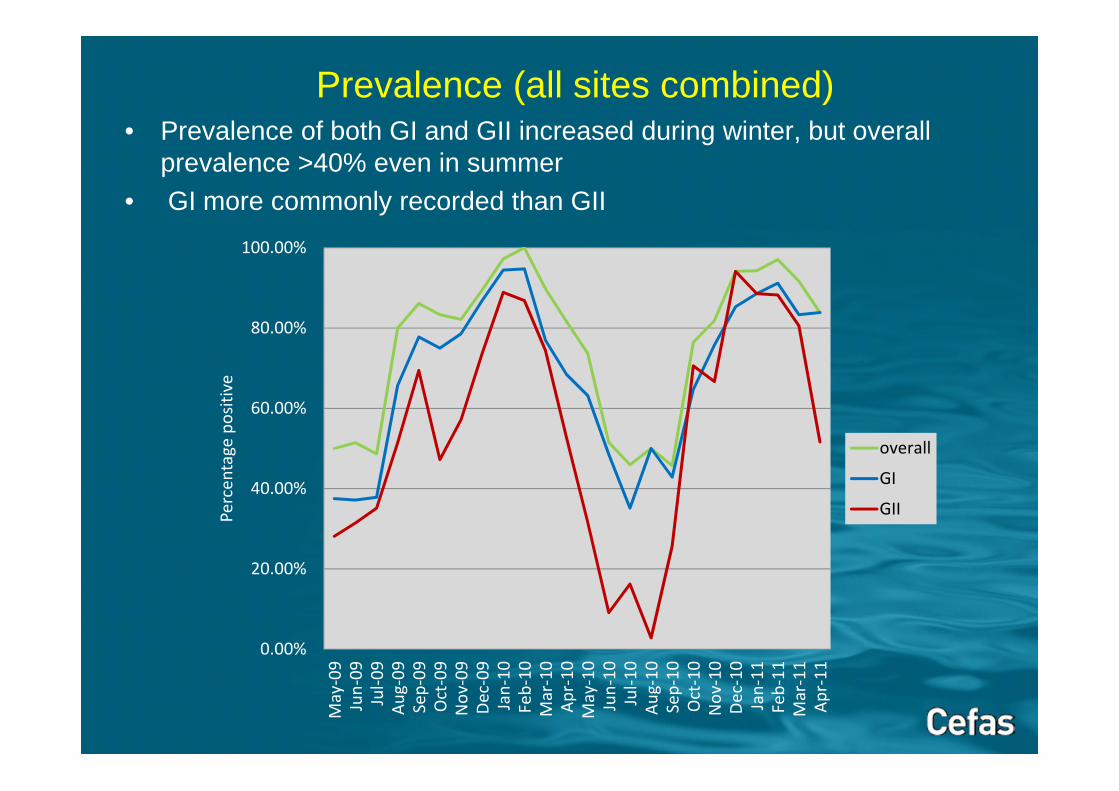
• Prevalence of both GI and GII increased during winter, but overall prevalence >40% even in summer
• GI more commonly recorded than GII
Prevalence (all sites combined)
0.00%
20.00%
40.00%
60.00%
80.00%
100.00%
May‐09
Jun‐09
Jul‐0
9Au
g‐09
Sep‐09
Oct‐09
Nov
‐09
Dec‐09
Jan‐10
Feb‐10
Mar‐10
Apr‐10
May‐10
Jun‐10
Jul‐1
0Au
g‐10
Sep‐10
Oct‐10
Nov
‐10
Dec‐10
Jan‐11
Feb‐11
Mar‐11
Apr‐11
Percentage positive
overall
GI
GII
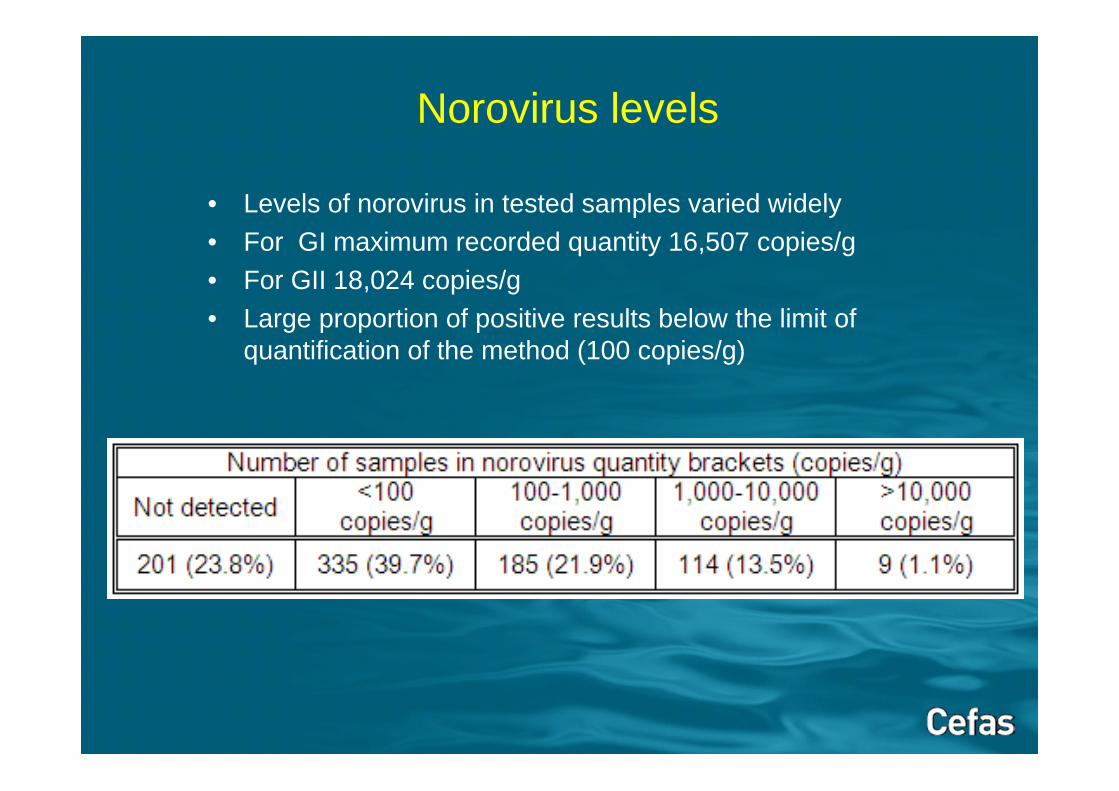
• Levels of norovirus in tested samples varied widely • For GI maximum recorded quantity 16,507 copies/g • For GII 18,024 copies/g• Large proportion of positive results below the limit of
quantification of the method (100 copies/g)
Norovirus levels
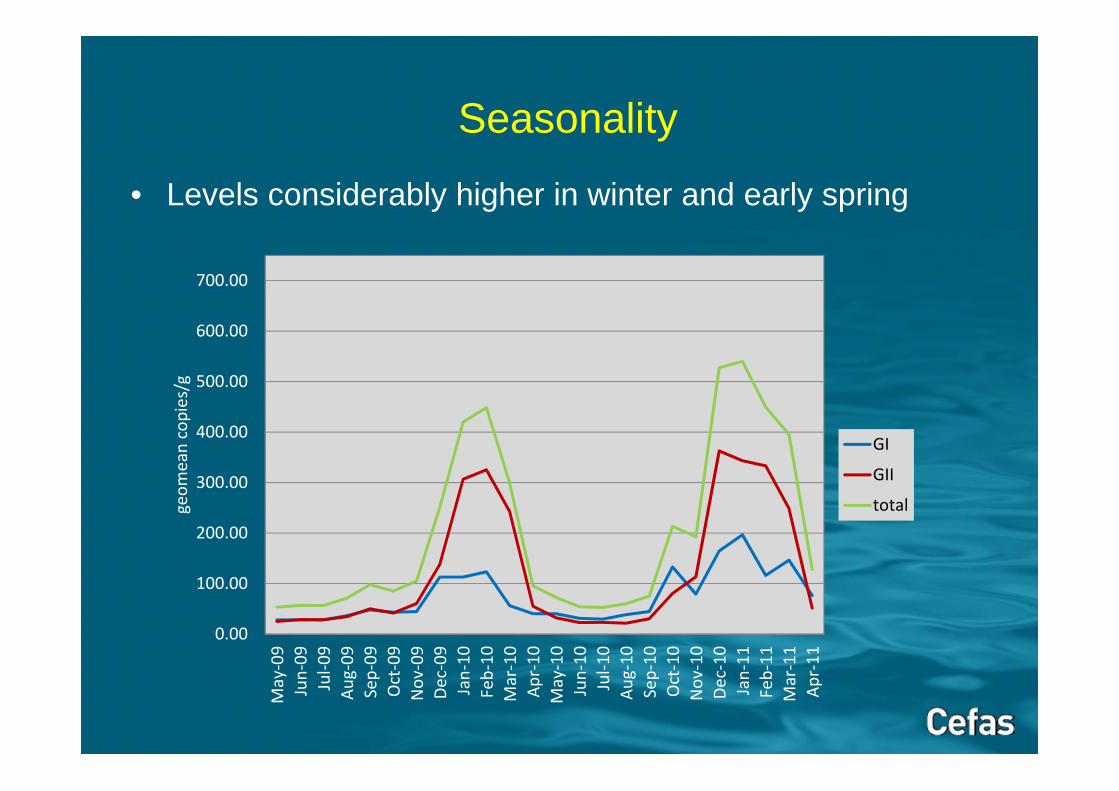
• Levels considerably higher in winter and early spring
Seasonality
0.00
100.00
200.00
300.00
400.00
500.00
600.00
700.00May‐09
Jun‐09
Jul‐0
9Au
g‐09
Sep‐09
Oct‐09
Nov
‐09
Dec‐09
Jan‐10
Feb‐10
Mar‐10
Apr‐10
May‐10
Jun‐10
Jul‐1
0Au
g‐10
Sep‐10
Oct‐10
Nov
‐10
Dec‐10
Jan‐11
Feb‐11
Mar‐11
Apr‐11
geom
ean copies/g
GI
GII
total
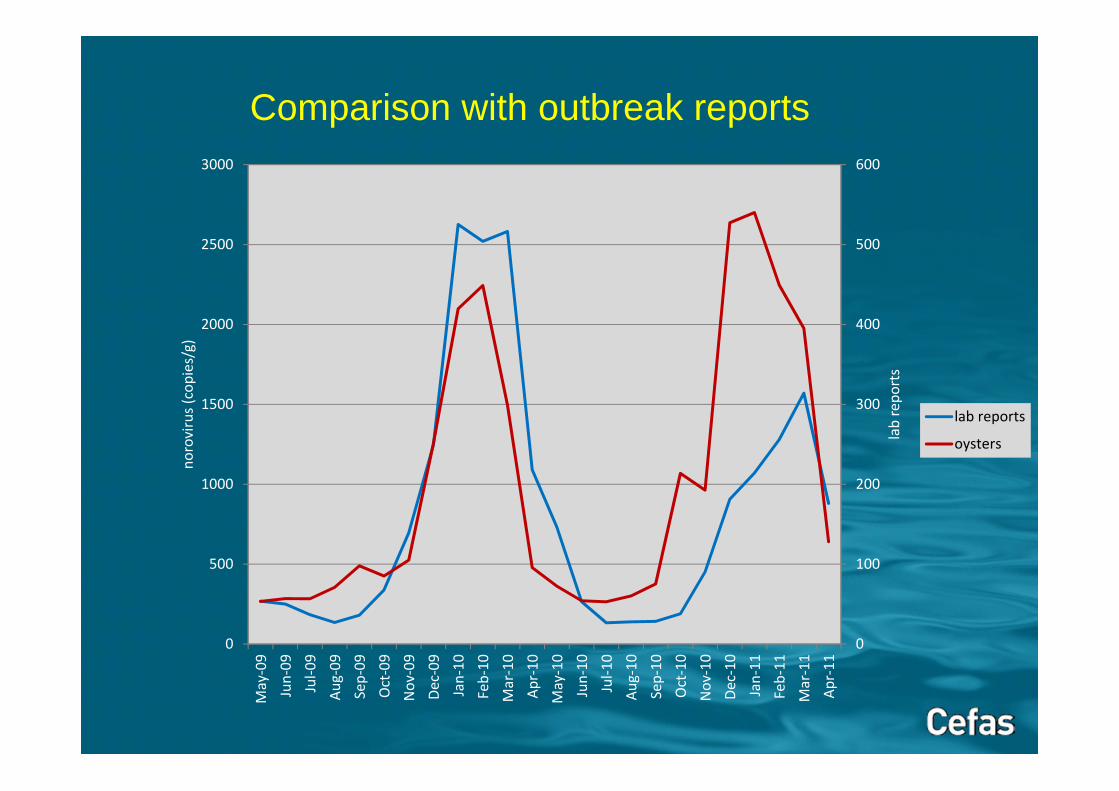
Comparison with outbreak reports
0
100
200
300
400
500
600
0
500
1000
1500
2000
2500
3000
May‐09
Jun‐09
Jul‐0
9Au
g‐09
Sep‐09
Oct‐09
Nov
‐09
Dec‐09
Jan‐10
Feb‐10
Mar‐10
Apr‐10
May‐10
Jun‐10
Jul‐1
0Au
g‐10
Sep‐10
Oct‐10
Nov
‐10
Dec‐10
Jan‐11
Feb‐11
Mar‐11
Apr‐11
lab repo
rts
norovirus (copies/g)
lab reports
oysters
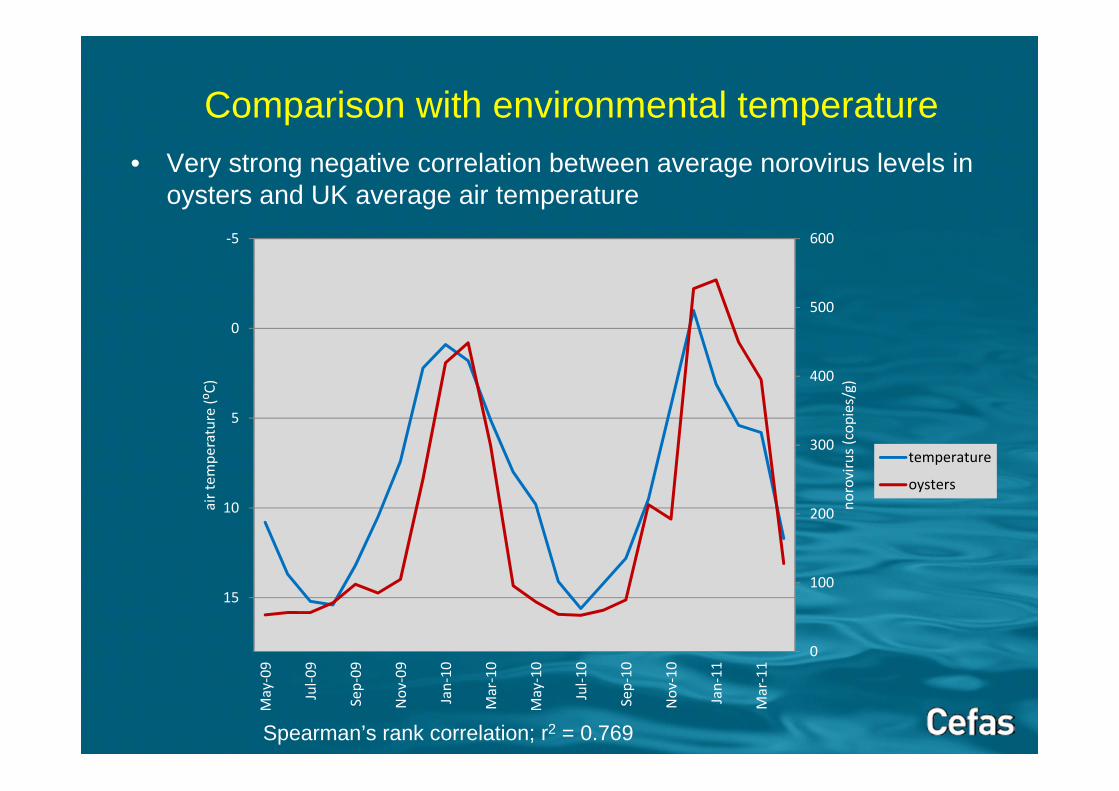
• Very strong negative correlation between average norovirus levels in oysters and UK average air temperature
Spearman’s rank correlation; r2 = 0.769
Comparison with environmental temperature
0
100
200
300
400
500
600‐5
0
5
10
15
May‐09
Jul‐0
9
Sep‐09
Nov
‐09
Jan‐10
Mar‐10
May‐10
Jul‐1
0
Sep‐10
Nov
‐10
Jan‐11
Mar‐11
norovirus (copies/g)
air tem
perature (⁰C)
temperature
oysters
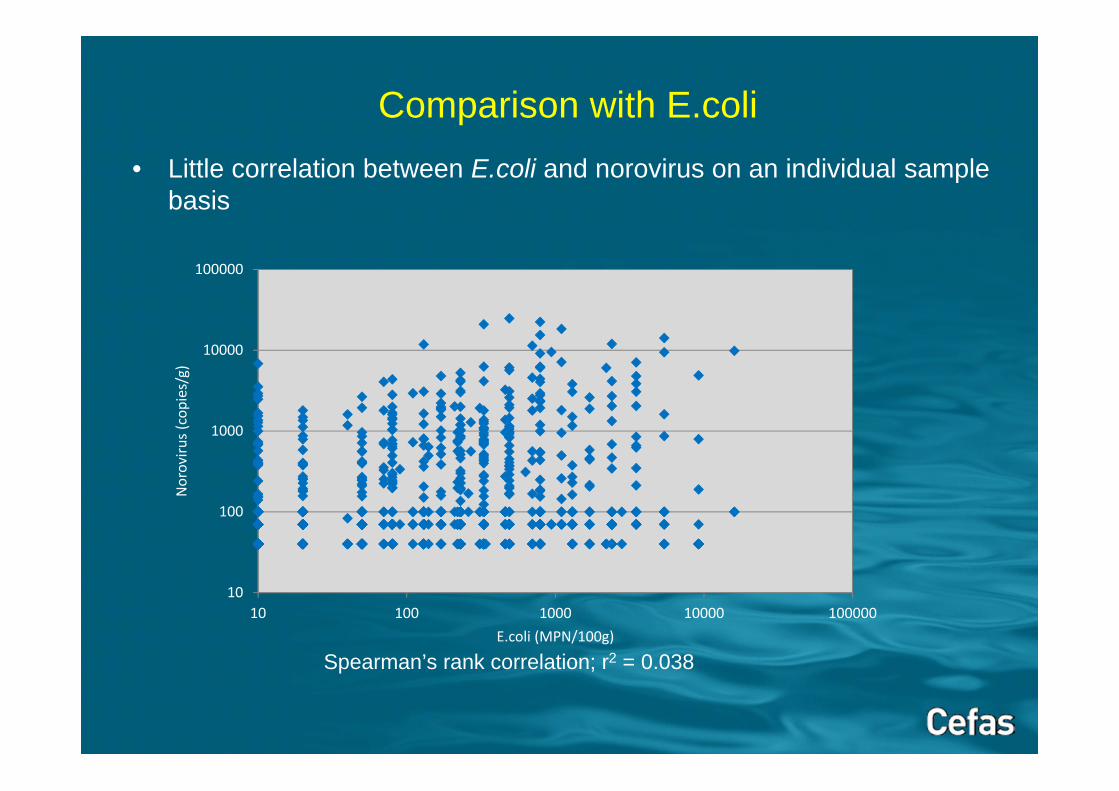
• Little correlation between E.coli and norovirus on an individual sample basis
Spearman’s rank correlation; r2 = 0.038
Comparison with E.coli
10
100
1000
10000
100000
10 100 1000 10000 100000
Noroviru
s (copies/g)
E.coli (MPN/100g)
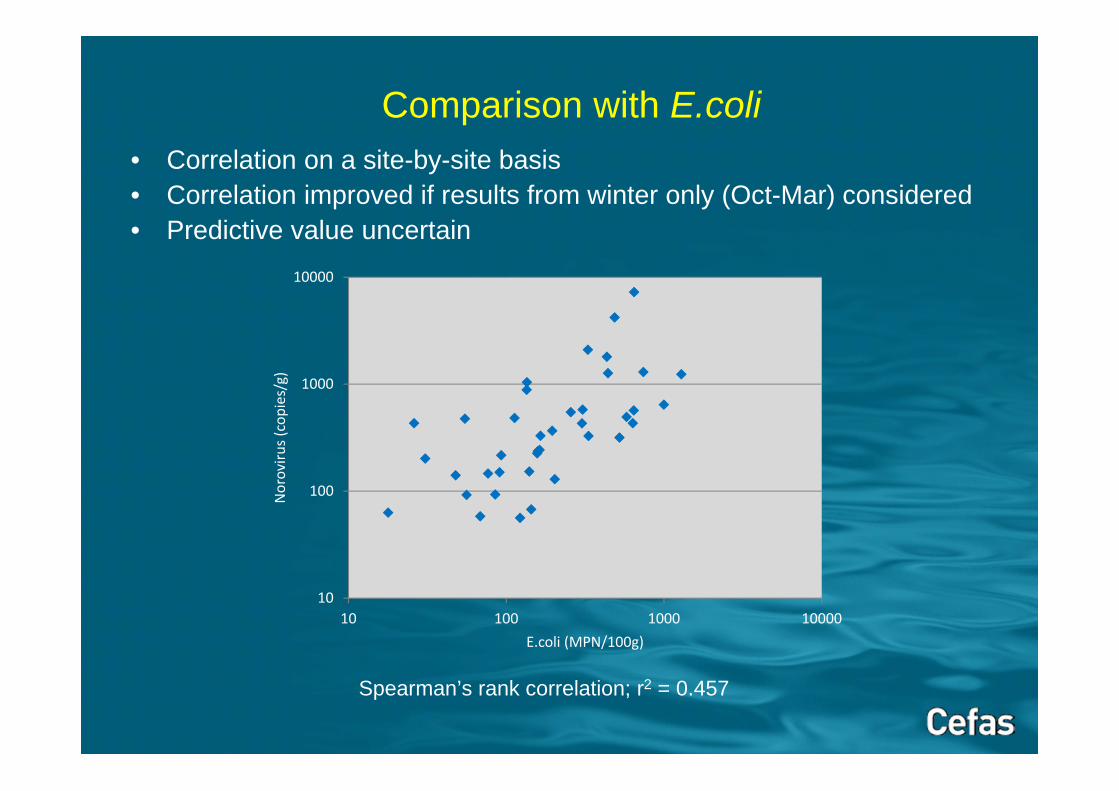
• Correlation on a site-by-site basis• Correlation improved if results from winter only (Oct-Mar) considered• Predictive value uncertain
Spearman’s rank correlation; r2 = 0.457
Comparison with E.coli
10
100
1000
10000
10 100 1000 10000
Noroviru
s (copies/g)
E.coli (MPN/100g)
• Standardised methods for detection of viruses in foods now available
• Unexpectedly high levels of norovirus RNA in UK oyster production areas (76% positive)
• All sites were classified and available for commercial harvest
• Contamination range observed <100 to 10,000 RNA copies per gram
• Strong winter seasonality• Absence standard would have a very high impact• Risk management according to virus titre?• Better environmental pollution control?
Summary