Norms and screening utility of the Dutch version of the ... · data suggest that depression in...
36
Norms and screening utility of the Dutch version of the Children’s Depression Inventory (CDI) in clinical and non-clinical youth
Transcript of Norms and screening utility of the Dutch version of the ... · data suggest that depression in...

Norms and screening utility of the Dutch version of the Children’s Depression Inventory
(CDI) in clinical and non-clinical youth

The CDI in clinical and non-clinical youth
2
Abstract
This study aimed to (1) assess relationships between the Children’s Depression Inventory
(CDI) and DSM-oriented depression and anxiety scales of the Youth Self Report (YSR); (2)
develop reliable norms for the CDI; and (3) determine CDI cutoff scores for selecting
youngsters at risk for depression and anxiety. A total of 3073 non-clinical and 511 clinically
referred children and adolescents from The Netherlands and Belgium were included. Results
showed that CDI scores were significantly related to both DSM-oriented symptoms of
depression and anxiety. CDI scores correlated highly with depression symptoms and
moderately with anxiety symptoms. Norms for the CDI were determined by means of multiple
regression analysis and depended on sex, age, and country. CDI cutoff scores for selecting
individuals at risk for depression and anxiety as measured by the DSM-oriented depression
and anxiety scales of the YSR were determined by means of multiple regression analysis and
ROC analysis. A CDI score of 16 was found to have the most optimal balance between
sensitivity and specificity for depression, whereas a score of 21 provided the best sensitivity
and specificity for anxiety in a subsample of children. It can be concluded that the CDI is an
effective instrument for screening depression, and to a lesser extent anxiety, in school settings
or primary and secondary care centres, before applying further assessment of high risk
individuals.
Keywords: CDI; Children’s Depression Inventory; Cutoff; Norming

The CDI in clinical and non-clinical youth
3
Depressive symptoms are commonly experienced among youth. The epidemiological
data suggest that depression in youth is a serious health care problem, which underscores the
importance of using reliable and well-validated screening instruments (e.g., Birmaher et al.,
1996; Birmaher, Arbelaez, & Brent 2002; Lewinsohn, Rohde, & Seeley, 1998). The
measurement of depressive symptoms in youth was advanced by the development of the
Children’s Depression Inventory (CDI: Kovacs, 1980/1981). The CDI was developed as a
downward extension of the adult-oriented Beck Depression Inventory (BDI: Beck, Ward,
Mendelson, Mock & Erbaugh, 1961). The CDI is a 27-item self-report inventory assessing
depressed mood in children and adolescents. Respondents are asked to choose one of three
descriptions that best fits how they have been feeling over the past two weeks (e.g., “I do most
things wrong”, “I do many things wrong”, “I do everything wrong”). Responses are scored on
a scale from 0 to 2, with total CDI scores ranging between 0 and 54. Although the CDI is
designed to provide information about the presence and severity of depressive symptoms, it
cannot by itself yield a psychiatric diagnosis. Self-report measures in the early assessment
process have however also the advantage over clinical interviews that they facilitate disclosing
personal material. The current study aimed to (1) assess the specificity of the relation between
CDI scores and symptoms of depression and anxiety; (2) develop norms for the Dutch version
of the CDI, and (3) identify cutoff scores on the CDI that put youngsters at risk for depression
and anxiety.
Associations between CDI scores and symptoms of depression and anxiety
A great deal of studies has aimed to assess psychometric properties of the CDI
including reliability and validity (e.g., Craighead, Smucker, Craighead, & Ilardi, 1998;
Fundudis et al., 1991; Kovacs, 1992). This research has shown that the CDI has good internal
consistency and moderate test-retest reliability, and correlates positively with levels of
depression (Kazdin, 1990). However, there is also some evidence that the CDI does not
Opmerking [c1]: Dit moet zijn: most things good
Opmerking [c2]: Na de vorige zin, klinkt dit niet vloeiend ik zou however of also schrappen, zelfs clinical interviews kan eruit
The CDI in clinical and non-clinical youth
4
adequately discriminate between depressive diagnoses and other diagnostic categories
(Kazdin, 1988). More specifically, the CDI typically demonstrates a significant relationship
with anxiety symptoms (Finch et al., 1989; Hodges & Craighead, 1990), suggesting that the
CDI might be a measure of general distress (Saylor, Finch, Spirito, & Bennett, 1984). High
correlations between anxiety and depression can also be taken as evidence for one underlying
common factor ‘negative affectivity’, which suggests that anxiety and depressive states cannot
be reliably differentiated and represent a single construct (e.g., Brady & Kendall, 1992; Wolfe
et al., 1987). We will test these competing views by comparing the scores on the CDI with
those of another well-established screening instrument in youth, the Youth Self Report (YSR:
Verhulst, Van der Ende, & Koot, 1996; Verhulst, Van der Ende, & Koot, 1997). The YSR is a
general measure of psychopathology of which the DSM-oriented depression and anxiety
symptom scales can be used to test differential relationships between the CDI scores and
symptoms of depression and anxiety. We hypothesized a stronger association between the CDI
and the depression scale than with the anxiety scale.
Norms for the CDI
There have been some studies that have addressed test norms for the CDI. That is,
normative data of 1266 children have been described in the CDI manual (Kovacs, 1992).
Finch, Saylor, Conway, and Edwards (1985) reported normative data of 1463 public school
children in Grades 2-8, and found significant but small gender differences with girls having
somewhat lower CDI scores than boys. Twenge and Nolen-Hoeksema (2002) performed a
meta-analysis on mean CDI scores of 310 samples of children aged between 8 and 16. Results
indicated that girls’ depression scores stayed steady form ages 8 to 11 and then increased
between ages 12 and 16. Boys’ CDI scores were stable from ages 8 to 16 except for a high
CDI score at age 12. Girls’ scores were slightly lower than boys’ during childhood, but girls
scored higher beginning at age 13. Since the means and standard deviations in the Twenge and

The CDI in clinical and non-clinical youth
5
Nolen-Hoeksema (2002) study do not constitute CDI norms, there is a need for test norms as
they can be used for diagnostic purposes, clinical decision making, or the evaluation of
treatment effects. Multiple regression analysis is the preferred technique for norming
questionnaire data. This approach allows to examine which predictors (e.g., sex, age) are
important for calculating norm scores. Importantly, it is possible to test for interactions
between predictors. In the case these interactions are significant, norms on the basis of
subgroups should be created. In fact, this boils down to the traditional approach to norms
scores by splitting a group into subgroups based on the background variable. The strength of a
multiple regression approach is that one can examine whether it is necessary to provide norm
data separately for various background variables. For example, Van Breukelen and Vlaeyen
(2005) found that pain coping and cognitions were not predicted by gender, but by level of
education instead, suggesting that norm data do not have to be given for males and females
separately. Similarly, Van der Elst, Van Boxtel, Van Breukelen, and Jolles (2006) found that
performance on the Concept Shifting Test was affected by age, gender, and level of education,
but not by any of their interactions. Consequently, the most stable and simple norming was
obtained by applying a regression model with age, gender and education as predictors of test
score, and applying that model to the complete sample.
In the current study, we calculated norm scores of the CDI in non-clinical and
clinically referred children and adolescents. Data were collected in Belgium and The
Netherlands and some participants were involved in a study in which the CDI was completed
through the internet rather than by paper and pencil. Consequently, gender, age, country, and
completion form served as predictor variables in the current study. Interaction effects of these
predictors were also examined to determine whether norming should take place in the total
group of in subgroups. In particular, an interaction between age and sex might be expected,
given the age and gender differences found within adolescent depression (Lewinsohn, Clarke,
Opmerking [c3]: Schrap OF-- >Or?
Opmerking [c4]: Beter consequent gender?

The CDI in clinical and non-clinical youth
6
Seeley, & Rohde, 1994). Norming of the CDI was done on the total scale scores for two
reasons. First, there is a great amount of variability in obtained factor solutions of the CDI as
well as in the composition of the factors themselves. The proposed factor models range from
one factor (e.g., Kovacs, 1983) to eight factors (e.g., Saylor et al., 1984), depending on the use
of clinical versus non-clinical samples (e.g., Hodges, Siegel, Mullins, & Griffin, 1983;
Kovacs, 1985) and on developmental differences between children and adolescents (e.g.,
Craighead et al., 1998; Weiss et al., 1991). Second, the CDI has originally been developed and
used as a general screening instrument for depressive symptomatology for which norm data
are particularly important.
CDI Cutoff scores
The third aim of the current study was to identify CDI scores at which youngsters
might be ‘at risk’ for depression or anxiety. Previous research has relied on the use of
receiver-operator curves (ROC curves). A ROC curve involves a plot of the sensitivity (Y-
axis), which is the probability of the CDI to classify an individual as depressed if that
individual is indeed depressed, against (1 – specificity) on the X-axis, where the specificity is
the probability of the CDI classifying an individual as not depressed if that individual is
actually not depressed. Each point of the ROC curve corresponds to a different cutoff for the
CDI. A diagonal ROC curve (or rather line) means that sensitivity = 1-specificity for every
possible cutoff and so test does not discriminate between depressed and non-depressed. The
area under the ROC curve (AUC) is then equal to 0.50, the minimum possible AUC. A
perfectly discriminating instrument has perfect sensitivity and specificity at some cutoff, and
the area under the ROC curve (AUC) is then 1.0, the maximum possible AUC. For further
details on ROC see e.g. Hanley & McNeil, 1982; Woodward, 2005). Thus, the larger the area
under the ROC curve the better (Woodward, 2005).
Opmerking [c5]: Schrappen of this test…
Opmerking [c6]: Deze twee zinnen wisselen? Lijkt mij beter…

The CDI in clinical and non-clinical youth
7
Research that relied on ROC curves has yielded cutoff scores of 13 (Kovacs, 1992) or
16 (Timbremont, Braet, and Dreessen, 2004) for clinical samples comprising clinically
referred children, and 19 for non-clinical samples (Kovacs, 1992; Stark, Humphrey, Laurent,
Livingston, & Christopher, 1993). ROC converts raw data into a sensitivity and specificity
value per CDI cutoff and leads to a cutoff which balances between sensitivity and specificity,
irrespective of the prevalence. ROC thereby gives a high sensitivity and specificity, but this
may still lead to many false positives if the prevalence is small. Another approach to obtaining
cutoff scores is the use of logistic regression analysis, which allows for adjusting for the
effects of gender and age, and for taking the prevalence of depression (or anxiety) into
account, which strongly affects the model intercept and thereby the estimated probability of
depression (or anxiety) given age, gender, and CDI, which in turn determines the prediction
(i.e., prediction is “yes” if probability is at least 50%). Logistic regression analysis also allows
for examining the interaction between gender and CDI scores and between age and CDI scores
which, if found, would indicate that ROC curves should ideally be created for gender or age
groups separately. In the current study, both ROC and logistic regression analysis were used to
investigate the sensitivity and specificity of the CDI as a first screening instrument for
depression or anxiety, using the YSR with its established cutoffs as gold standard.
Method
Participants and procedure
A total of 3073 non-clinical and 511 clinically referred Dutch speaking children and
adolescents completed the CDI as part of (ongoing) research conducted between the years
2000 and 2008 in Belgium (Ghent University) and The Netherlands (Maastricht University).
Comparison of the data obtained in 2000-2002 (N=673 non-referred youngsters) with data
obtained in later studies, revealed no differences with respect to the demographic composition
of both samples or with respect to total CDI depression scores.
Opmerking [c7]: Dit deel schrappen, zal betrer leeesbaar zijn.
Opmerking [c8]: Obtain?
Opmerking [c9]: Golden?

The CDI in clinical and non-clinical youth
8
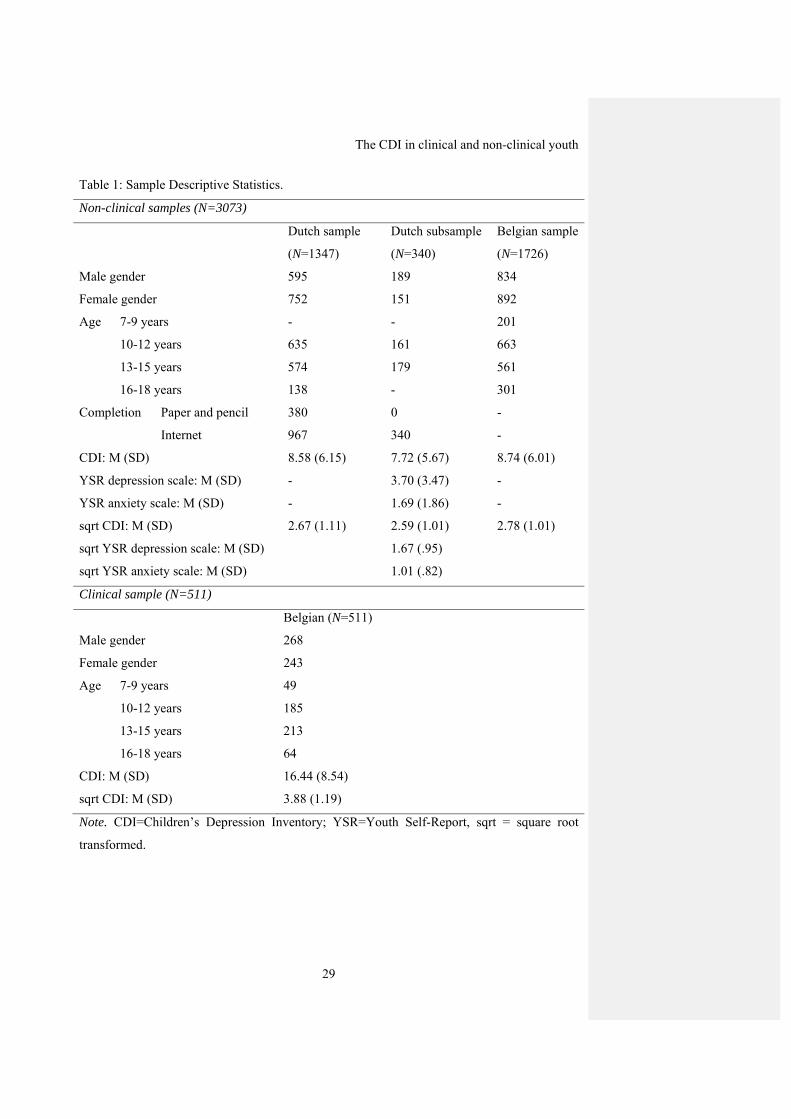
Table 1 presents an overview of the composition of the current samples and
subsamples to be used. The non-clinical sample comprised 1726 youngsters from Belgium and
1347 from the Netherlands. Individuals completed the CDI during regular class. A class
teacher and a research assistant were available to assist the (especially younger) children and
to ensure confidential responding. Note that at the age of seven years, children might
experience difficulty using the Likert type scale to report the severity of the symptoms they
were experiencing. Research assistants or school teachers were necessary to help them with
reading the CDI items aloud. These children were helped outside the class room to ensure
confidential responding. Individuals from the Netherlands (age above 10) were also able to fill
in the CDI via the internet as this was an aspect of one of the larger studies from which the
current sample was drawn. A total of 967 out of 1347 completed the measures through the
internet. Those who completed the measures via the internet were sent a login code to their
homes with which they could complete the measures. Mean age of the non-clinical sample
was 12.7 (SD=2.4) and 53.5% were girls. A Dutch subsample of 340 non-referred adolescents,
who were included in the non-clinical sample, completed both the CDI and the Youth Self-
Report (YSR; Achenbach & Edelbrock, 1987; Achenbach & Rescorla, 2001). Mean age of the
subsample was 12.6 years (SD=.60, range 11-15 years, see for additional information Table 1).
The clinical sample comprised 511 youngsters who were all in treatment at primary
and secondary care settings in Belgium for common childhood psychopathology. The
inclusion criterion was a primary diagnosis as determined with the child edition of the
Structured Clinical Interview for DSM-IV-Child Edition (KIDSCID: Hien et al., 1998). The
KIDSCID is carried out as part of the routine intake procedure within the settings and offers
probe questions, which are designed to help the clinician determine whether DSM-IV criteria
are present or not (see Table 1 for descriptive information of the clinical sample). More
specifically, primary diagnoses were distributed as follows: 39% received a disruptive
Opmerking [c10]: Involved (in the study)
Opmerking [c11]: Voeg hir toe: (see Table 1 for descriptive information of the clinical sample).
Opmerking [c12]: Verplaatsen, nu krijg je de foute verwachting dat de diagnsoses in de table staan
The CDI in clinical and non-clinical youth
9
behaviour disorder diagnosis (i.e., Attention Disorder Hyperactivity Disorder, Oppositional
Deviant Disorder, or Conduct Disorder), 22% met the criteria for a mood disorder and 18% for
an anxiety disorder. A total of 2% had an adjustment disorder and 19% had any other
diagnosis according to the KIDSCID.
Data of the non-clinical (N=3073) and clinical (N=511) samples were used for norming of
the CDI (aim 2), whereas the subsample (N=340) was used for assessing validity relations of the
CDI scores (aim 1) and assessing cutoff scores (aim 3). Informed consent was obtained from the
parents or the legal guardians and the children gave their assent to participate. The study was
approved by the local research ethics committees of both Ghent University and the Academic
Hospital of Maastricht/Maastricht University.
Instruments
Children’s Depression Inventory
The Dutch version of the Children’s Depression Inventory (CDI) is a self-report
instrument that assesses symptoms of depression in children and adolescents aged between 7
and 17 years. The CDI comprises 27 items and respondents are asked to choose one of three
descriptions that best fits how they have been feeling over the past two weeks (e.g., “I do most
things wrong”, “I do many things wrong”, “I do everything wrong”). Responses are scored on
a scale from 0 to 2, with total CDI scores ranging between 0 and 54. The original English
version of the CDI was translated in Dutch and subsequently back-translated into English by a
native speaker. This version was sent to the original author and was approved. Reliability of
the CDI in terms of internal consistency was good (α=.85) in the non-clinical sample and the
clinical sample (α=.86). The one month test-retest reliability was assessed in a non-clinical
subsample (N=643) and was .81 (see Timbremont & Braet, 2002).
Youth Self Report
Opmerking [c13]: Like eating disorders?
Opmerking [c14]: Idem: Dit moet zijn: most things good

The CDI in clinical and non-clinical youth
10
The Youth Self Report (YSR) assesses several emotional and behavioural problem
areas as reported by the child. The Dutch version of the YSR is a reliable and valid instrument
for the assessment of psychological symptoms in youth (Verhulst et al., 1996; Verhulst et al.,
1997). The DSM-oriented depression scale is generally accepted as valid indicator of clinical
diagnosis (see Achenbach & Edelbrock, 1987). In the current study the clinical cutoff score of
the DSM-oriented depression and anxiety problems scales were used, categorizing individuals
in the clinical range (i.e., T score > 69, which corresponds to percentile 98) or not (i.e., T score
< 69). The internal consistency of the YSR in this study is .93 for the total scale and .76 for the
DSM-oriented depression scale and .69 for the DSM-oriented anxiety problems scale, based
on the Dutch non-clinical subsample (n = 340) in which the YSR was administered.
The Structured Clinical Interview for DSM-IV-Child Edition
The Structured Clinical Interview for DSM-IV-Child Edition (KIDSCID; Hien et al.,
1998) was used in a structured interview in the clinical Belgian sample (n = 511). To assure
interrater reliability of diagnoses, we conducted a pilot study on the KID-SCID in 36
youngsters, who were randomly selected for this purpose. Interviews were taped and, besides
by the interviewer, scored by two independent raters (108 ratings). Cohen’s κ ranged from .79
and 1, suggesting excellent agreement. The κ statistic, to determine the chance-corrected
agreement between the first and second interviews, varied between .63 (oppositional-deviant
disorder) and .84 (ADHD and conduct disorder) for the disruptive behaviour disorders
module. In the anxiety disorders module, the κ statistic varied between .44 (posttraumatic
stress disorder) and 1.0 (social phobia). Pilot data also indicated excellent interrater reliability
in the disruptive behaviour module (.84 for ODD and CD and 1.0 for ADHD) (Matzner,
1994). Psychometric studies of the KIDSCID show fair to excellent test-retest reliability for
the disruptive behaviour disorders and various anxiety disorders (Matzner, Silva, Silvan,
Chowdhury, & Nastasi, 1997).

The CDI in clinical and non-clinical youth
11
Statistical analyses
The Statistical Package for the Social Sciences (SPSS, version 15.0) was used to carry
out the correlational analyses to examine associations between the CDI and DSM-oriented
depression and anxiety symptoms on the YSR. Regression analyses were carried out to
determine a parsimonious model for obtaining CDI norms (see Van Breukelen & Vlaeyen,
2005, for a detailed description). This was done separately for the non-clinical and clinical
samples. Total CDI score was the dependent variable in the regression analyses, and age, sex,
and in the non-clinical sample also country, and form of completion (pencil-and-paper versus
internet), and all twoway interactions were the predictor variables. Dummy coding was used
for the categorical predictors sex, country, and completion form. This means that a regression
weight is included in the model to represent the mean scale difference between the reference
category and each other category, adjusted for all other predictors in the model. Linear and
quadratic terms were included for the quantitative predictor age, which was centered to
prevent collinearity between linear and quadratic age terms. The regression model was
reduced in a stepwise fashion by eliminating the least significant predictor (p>.05). For the
final model, residuals were plotted and analyzed to check the assumptions of normality and
homogeneity of residual variance across the entire range of predicted scale scores and the
absence of outliers. With the final model, a raw scale score of an individual child can be
converted into a standardized z-score by computing the predicted score Y (by means of filling
in the regression analysis), computing the residual error (subtracting predicted Y from
observed Y), and finally, dividing the residual error by the SD(e), which is the square root of
the MS(residual). If the residuals are normally distributed with the same variance, then z is
normally distributed and the standard normal distribution can be used to interpret z-values
(e.g., Van Breukelen & Vlaeyen, 2005).

The CDI in clinical and non-clinical youth
12
Finally, to determine CDI scores that would predict whether youngsters are at risk for
depression or anxiety, two series of logistic regression analyses were used with YSR
depression and anxiety symptoms as dependent and dichotomous variables, and CDI score,
gender, age, and the interactions between these variables as independent variables. The
logistic regression model was reduced in a stepwise fashion by eliminating the least significant
predictor (p>.05). The CDI score was calculated at which youngsters were at risk for
depression on the established cutoff scores on the YSR DSM-oriented depression and anxiety
scales. More specifically, using the final logistic regression model, we computed which CDI
score corresponded to a probability of 50% for being depressed or anxious (using the YSR at
the established YSR cutoff as criterion), and we used that CDI score to determine sensitivity
and specificity of the CDI, again with the YSR cutoffs as gold standard. As this approach
takes into account prevalence and thereby leads to more correct diagnoses at the price of a
lower sensitivity, Receiver Operating Characteristic (ROC) curve analysis was also performed
as this method ignores prevalence, leading to more false positives but higher sensitivity.
Individuals were categorized as being at risk according to the screening instrument (YSR
depression and anxiety scores dichotomized), with a pair of sensitivity and specificity values
at each possible cutoff for the CDI score. An area under the ROC curve is calculated by
plotting sensitivity on the Y-axis and “1-specificity” on the X-axis.
Results
Before addressing the main results, some statistical remarks need to be made. First, overall,
less than 1% of the CDI data (at the level of individual items) were missing in the present
study. Careful analyses showed no significant baseline differences between the subjects who
provided complete data and those who did not. Moreover, comparison of means and
covariances of all variables using Little’s (1988) MCAR test suggested that data were missing
completely at random. Therefore, missing values were estimated using maximum likelihood

The CDI in clinical and non-clinical youth
13
estimation (Schafer, 1997) and the expectation maximization algorithm available in SPSS.
Second, total CDI scores and scores on the DSM oriented depression and anxiety scales of the
YSR were not normally distributed in both samples with skewness and kurtosis outside the
range of -1 to +1. A square root-transformation of these total scores was successful in
‘normalizing’ the total scores. These square root-transformed CDI scores were back-
transformed into normal CDI scores after the regression analyses in order to obtain norm data
and cutoff scores.
Relations between CDI and symptoms of anxiety and depression
The correlation between CDI and the DSM-oriented scale representing depression
symptoms was high (r=.71; p<.001), whereas the correlation between the CDI and the DSM-
oriented scale representing anxiety symptoms was moderate (r=.49; p<.001). Correcting both
correlations for attenuation, using the internal consistencies of all scales as estimated from the
present data, increased both correlations to .88 and .64 respectively. Transformation of both
variables by means of square root, resulted in somewhat lower correlation coefficients (i.e.,
.66 for DSM-oriented depression scale and CDI, and .42 for DSM-oriented anxiety scale and
CDI. A similar pattern of findings emerged for the non-parametric Spearman rank correlation,
with a correlation of .60 between DSM-oriented depression scale and CDI, and .34 for the
DSM-oriented anxiety scale and CDI. Thus, although there is overlap between the CDI and
symptoms of anxiety, the association with depressive symptoms was more clearly
demonstrated.
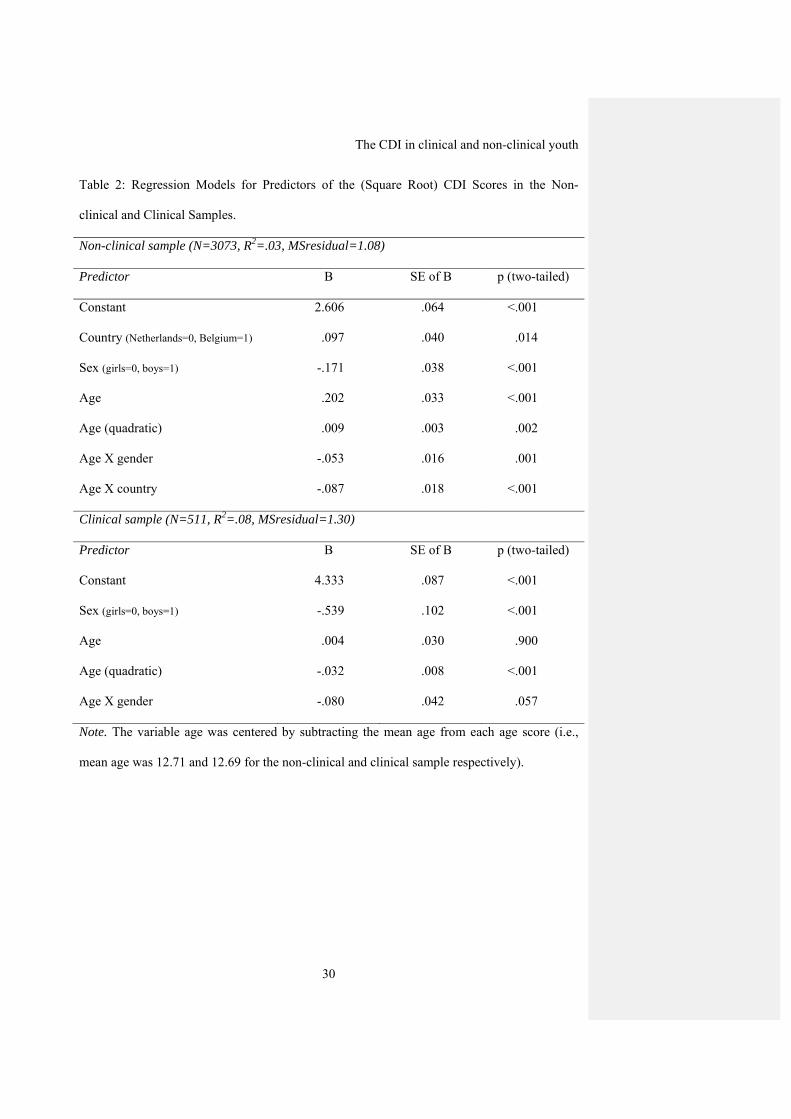
Predictors of the CDI score
Mean of the square root transformed CDI scores was 2.73 (SD=1.04; range 0 to 6.48)
in the non-clinical sample and 3.88 (SD=1.19, range 0 to 6.32) in the clinical sample. The final
model containing significant predictors of the CDI score in the non-clinical sample consisted
of sex, age (included as a linear and quadratic terms), country, and the interactions between
The CDI in clinical and non-clinical youth
14
gender and age and between age and country. The final model in non-clinical youth is
presented in Table 2. The final model in the clinical sample predicting CDI scores comprised
gender, age (included as linear and quadratic terms), and the interaction between gender and
age as significant predictors. The results pertaining to the final regression model in the clinical
sample are presented in the lower part of Table 2.
Model checks
To apply the models for norming purposes, the model assumptions need careful
checking as prediction of individual scores depends even more on such assumptions than the
regression analysis does. More specifically, the use of (standardized) residuals requires a
normal distribution with homogeneous variances of the residual. Normality was checked by
means of skewness and kurtosis and the Kolmogorov-Smirnov test. Skewness and kurtosis
were within the acceptable range of -1 to +1, but the Kolmogorov-Smirnov test revealed
violation of normality in the non-clinical sample (z=1.85, p=.002) and the clinical sample
(z=2.17, p<.001). However, note that the Kolmogorov-Smirnov test gives significance even
with minor violation of normality in large samples like the present one. In fact, the residual
distribution looked quite normal in both samples. As a further check, actual percentiles (5, 10,
25, 50, 75, 90, 95) of the standardized residuals were compared to the corresponding
percentiles of the standard normal distribution, which revealed no deviation larger than .10 on
the z-scale for the standardized residuals. The homogeneity of variances was tested by
grouping patients into quartiles of the predicted scale score and applying Levene’s test to the
residuals. The homogeneity assumption was not violated (p>.05) and the residual standard
deviation within each quartile did not deviate more than 10% form the overall residual
standard deviation of the scale. Thus, the overall residual standard deviation may be used to
compute z-scores.
Computing z-scores for individual children and adolescents
The CDI in clinical and non-clinical youth
15
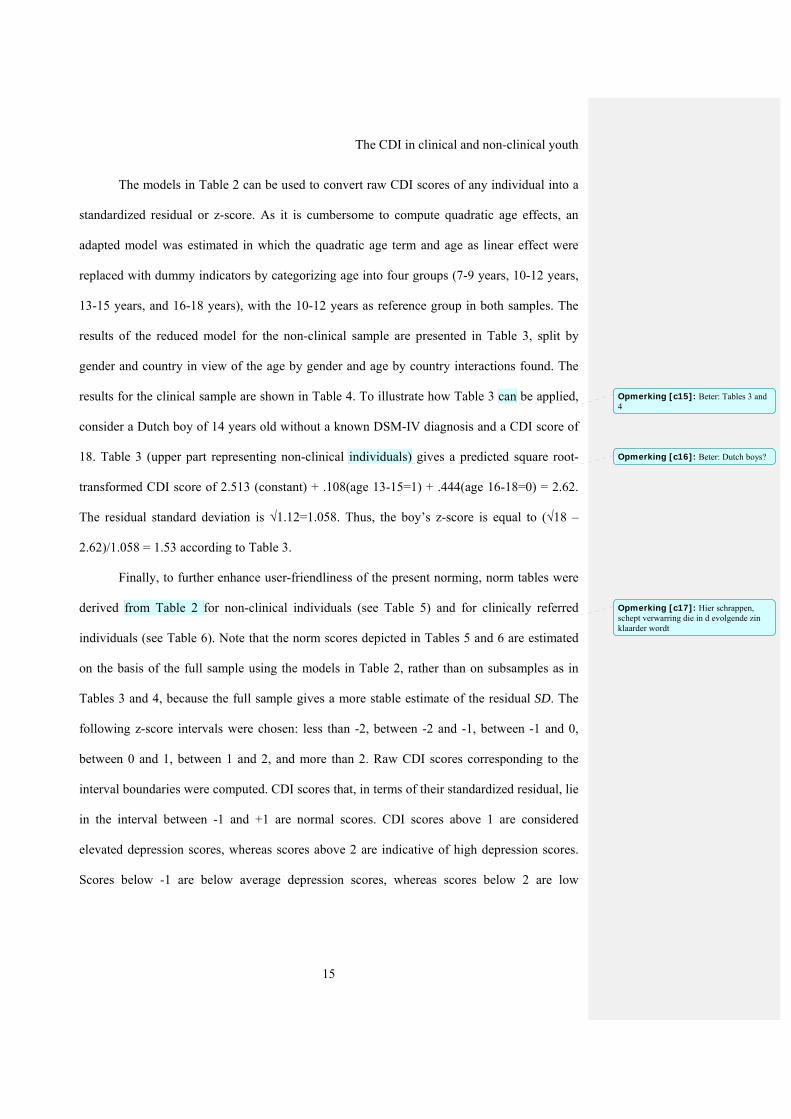
The models in Table 2 can be used to convert raw CDI scores of any individual into a
standardized residual or z-score. As it is cumbersome to compute quadratic age effects, an
adapted model was estimated in which the quadratic age term and age as linear effect were
replaced with dummy indicators by categorizing age into four groups (7-9 years, 10-12 years,
13-15 years, and 16-18 years), with the 10-12 years as reference group in both samples. The
results of the reduced model for the non-clinical sample are presented in Table 3, split by
gender and country in view of the age by gender and age by country interactions found. The
results for the clinical sample are shown in Table 4. To illustrate how Table 3 can be applied,
consider a Dutch boy of 14 years old without a known DSM-IV diagnosis and a CDI score of
18. Table 3 (upper part representing non-clinical individuals) gives a predicted square root-
transformed CDI score of 2.513 (constant) + .108(age 13-15=1) + .444(age 16-18=0) = 2.62.
The residual standard deviation is √1.12=1.058. Thus, the boy’s z-score is equal to (√18 –
2.62)/1.058 = 1.53 according to Table 3.
Finally, to further enhance user-friendliness of the present norming, norm tables were
derived from Table 2 for non-clinical individuals (see Table 5) and for clinically referred
individuals (see Table 6). Note that the norm scores depicted in Tables 5 and 6 are estimated
on the basis of the full sample using the models in Table 2, rather than on subsamples as in
Tables 3 and 4, because the full sample gives a more stable estimate of the residual SD. The
following z-score intervals were chosen: less than -2, between -2 and -1, between -1 and 0,
between 0 and 1, between 1 and 2, and more than 2. Raw CDI scores corresponding to the
interval boundaries were computed. CDI scores that, in terms of their standardized residual, lie
in the interval between -1 and +1 are normal scores. CDI scores above 1 are considered
elevated depression scores, whereas scores above 2 are indicative of high depression scores.
Scores below -1 are below average depression scores, whereas scores below 2 are low
Opmerking [c15]: Beter: Tables 3 and 4
Opmerking [c16]: Beter: Dutch boys?
Opmerking [c17]: Hier schrappen, schept verwarring die in d evolgende zin klaarder wordt
The CDI in clinical and non-clinical youth
16
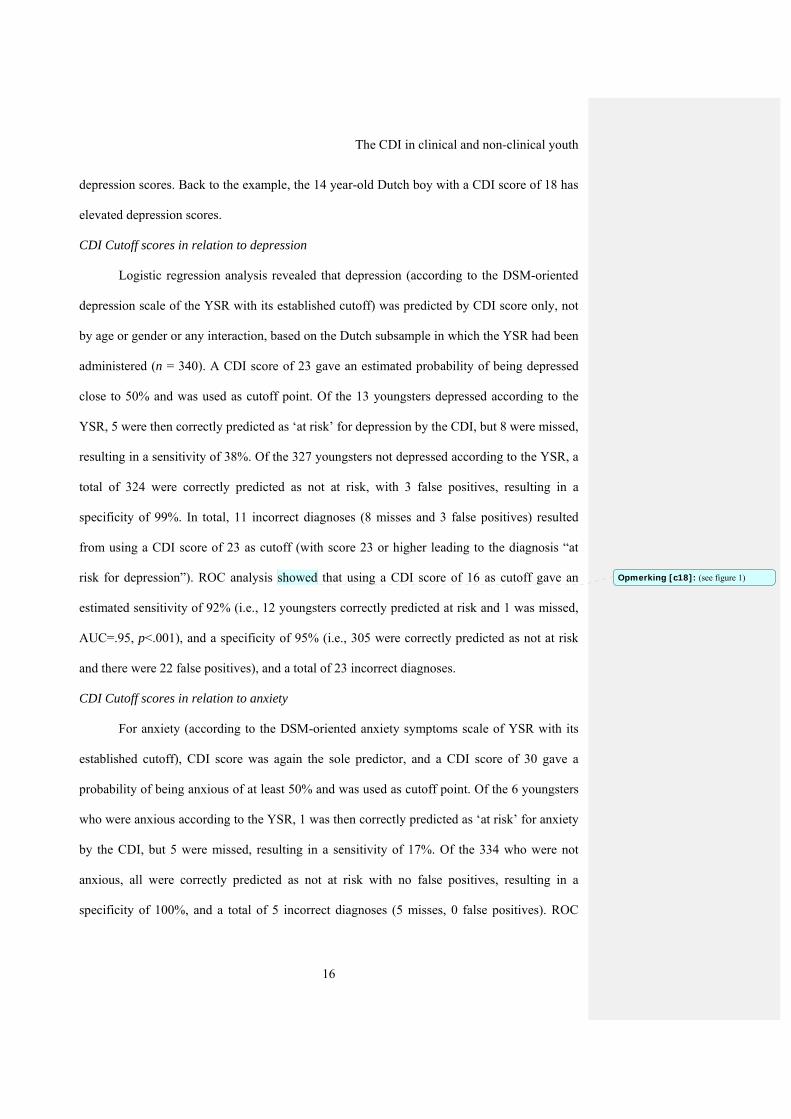
depression scores. Back to the example, the 14 year-old Dutch boy with a CDI score of 18 has
elevated depression scores.
CDI Cutoff scores in relation to depression
Logistic regression analysis revealed that depression (according to the DSM-oriented
depression scale of the YSR with its established cutoff) was predicted by CDI score only, not
by age or gender or any interaction, based on the Dutch subsample in which the YSR had been
administered (n = 340). A CDI score of 23 gave an estimated probability of being depressed
close to 50% and was used as cutoff point. Of the 13 youngsters depressed according to the
YSR, 5 were then correctly predicted as ‘at risk’ for depression by the CDI, but 8 were missed,
resulting in a sensitivity of 38%. Of the 327 youngsters not depressed according to the YSR, a
total of 324 were correctly predicted as not at risk, with 3 false positives, resulting in a
specificity of 99%. In total, 11 incorrect diagnoses (8 misses and 3 false positives) resulted
from using a CDI score of 23 as cutoff (with score 23 or higher leading to the diagnosis “at
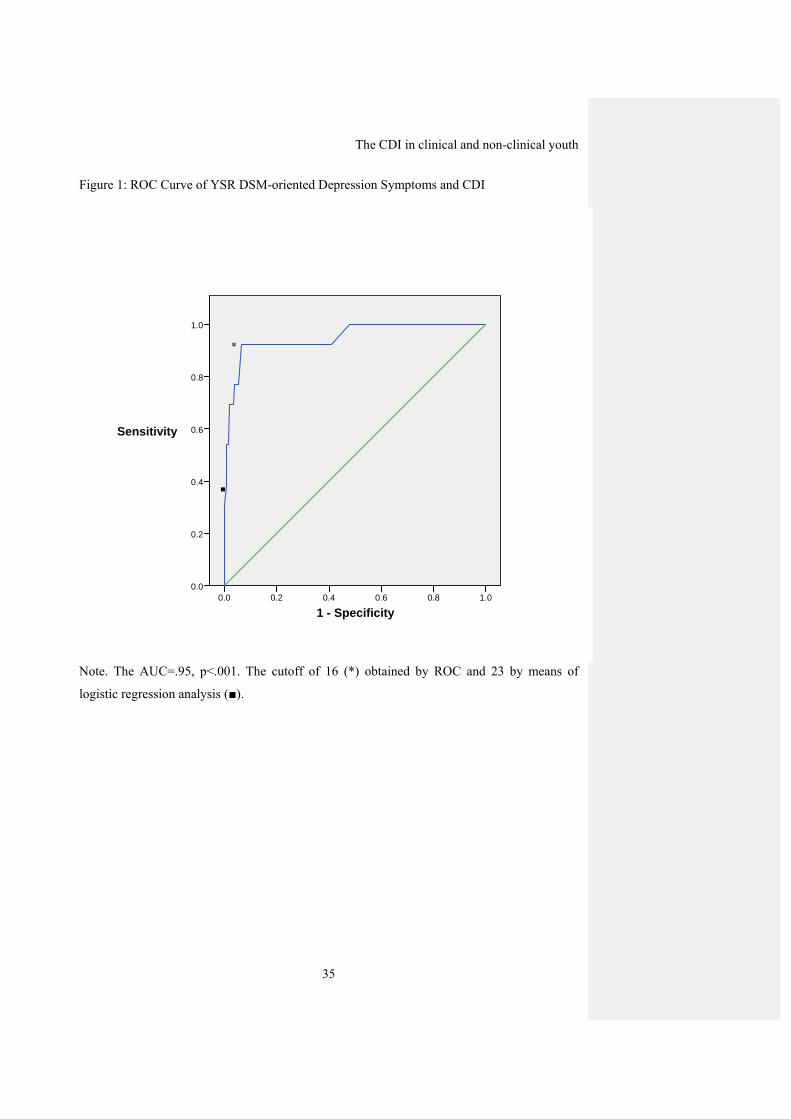
risk for depression”). ROC analysis showed that using a CDI score of 16 as cutoff gave an
estimated sensitivity of 92% (i.e., 12 youngsters correctly predicted at risk and 1 was missed,
AUC=.95, p<.001), and a specificity of 95% (i.e., 305 were correctly predicted as not at risk
and there were 22 false positives), and a total of 23 incorrect diagnoses.
CDI Cutoff scores in relation to anxiety
For anxiety (according to the DSM-oriented anxiety symptoms scale of YSR with its
established cutoff), CDI score was again the sole predictor, and a CDI score of 30 gave a
probability of being anxious of at least 50% and was used as cutoff point. Of the 6 youngsters
who were anxious according to the YSR, 1 was then correctly predicted as ‘at risk’ for anxiety
by the CDI, but 5 were missed, resulting in a sensitivity of 17%. Of the 334 who were not
anxious, all were correctly predicted as not at risk with no false positives, resulting in a
specificity of 100%, and a total of 5 incorrect diagnoses (5 misses, 0 false positives). ROC
Opmerking [c18]: (see figure 1)
The CDI in clinical and non-clinical youth
17
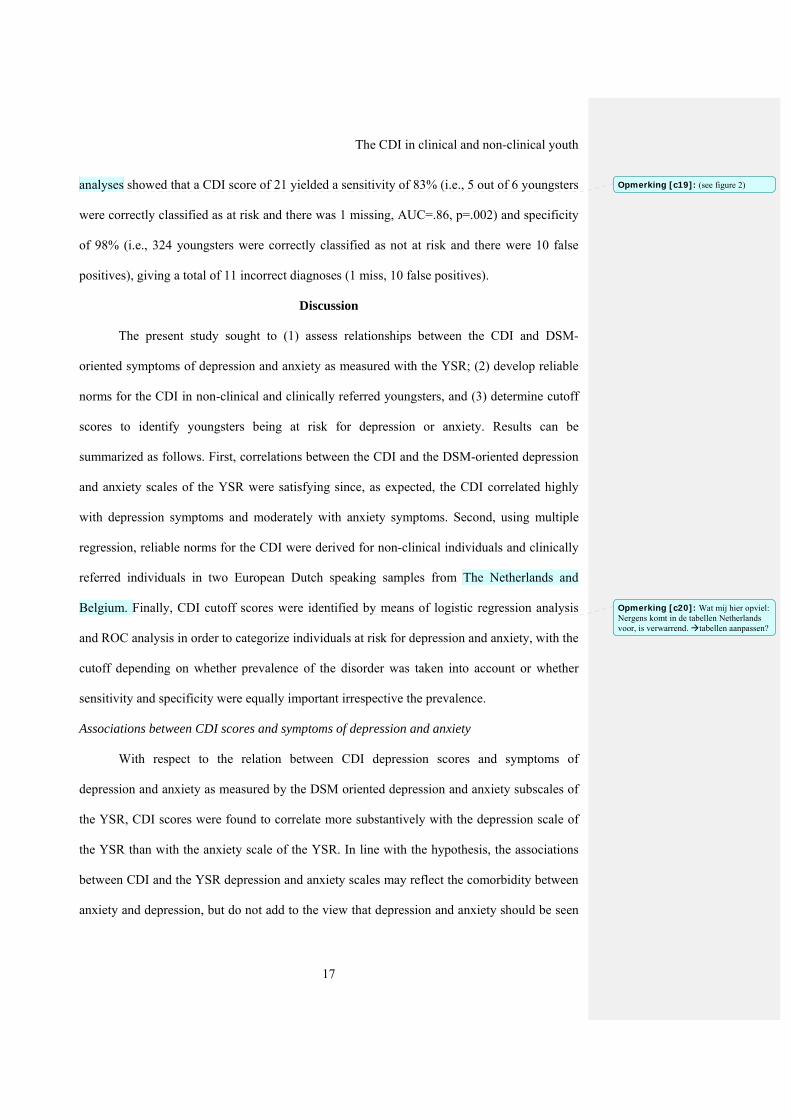
analyses showed that a CDI score of 21 yielded a sensitivity of 83% (i.e., 5 out of 6 youngsters
were correctly classified as at risk and there was 1 missing, AUC=.86, p=.002) and specificity
of 98% (i.e., 324 youngsters were correctly classified as not at risk and there were 10 false
positives), giving a total of 11 incorrect diagnoses (1 miss, 10 false positives).
Discussion
The present study sought to (1) assess relationships between the CDI and DSM-
oriented symptoms of depression and anxiety as measured with the YSR; (2) develop reliable
norms for the CDI in non-clinical and clinically referred youngsters, and (3) determine cutoff
scores to identify youngsters being at risk for depression or anxiety. Results can be
summarized as follows. First, correlations between the CDI and the DSM-oriented depression
and anxiety scales of the YSR were satisfying since, as expected, the CDI correlated highly
with depression symptoms and moderately with anxiety symptoms. Second, using multiple
regression, reliable norms for the CDI were derived for non-clinical individuals and clinically
referred individuals in two European Dutch speaking samples from The Netherlands and
Belgium. Finally, CDI cutoff scores were identified by means of logistic regression analysis
and ROC analysis in order to categorize individuals at risk for depression and anxiety, with the
cutoff depending on whether prevalence of the disorder was taken into account or whether
sensitivity and specificity were equally important irrespective the prevalence.
Associations between CDI scores and symptoms of depression and anxiety
With respect to the relation between CDI depression scores and symptoms of
depression and anxiety as measured by the DSM oriented depression and anxiety subscales of
the YSR, CDI scores were found to correlate more substantively with the depression scale of
the YSR than with the anxiety scale of the YSR. In line with the hypothesis, the associations
between CDI and the YSR depression and anxiety scales may reflect the comorbidity between
anxiety and depression, but do not add to the view that depression and anxiety should be seen
Opmerking [c19]: (see figure 2)
Opmerking [c20]: Wat mij hier opviel: Nergens komt in de tabellen Netherlands voor, is verwarrend. tabellen aanpassen?
The CDI in clinical and non-clinical youth
18
as a single common general distress or negative affect dimension (e.g., Clark & Watson, 1991;
Ollendick & Yule, 1990). The findings that the CDI was more clearly associated with
depression symptoms supports the discriminant validity of the scale and favors the CDI as an
instrument of depressive symptomatology, rather than general distress or negative affect.
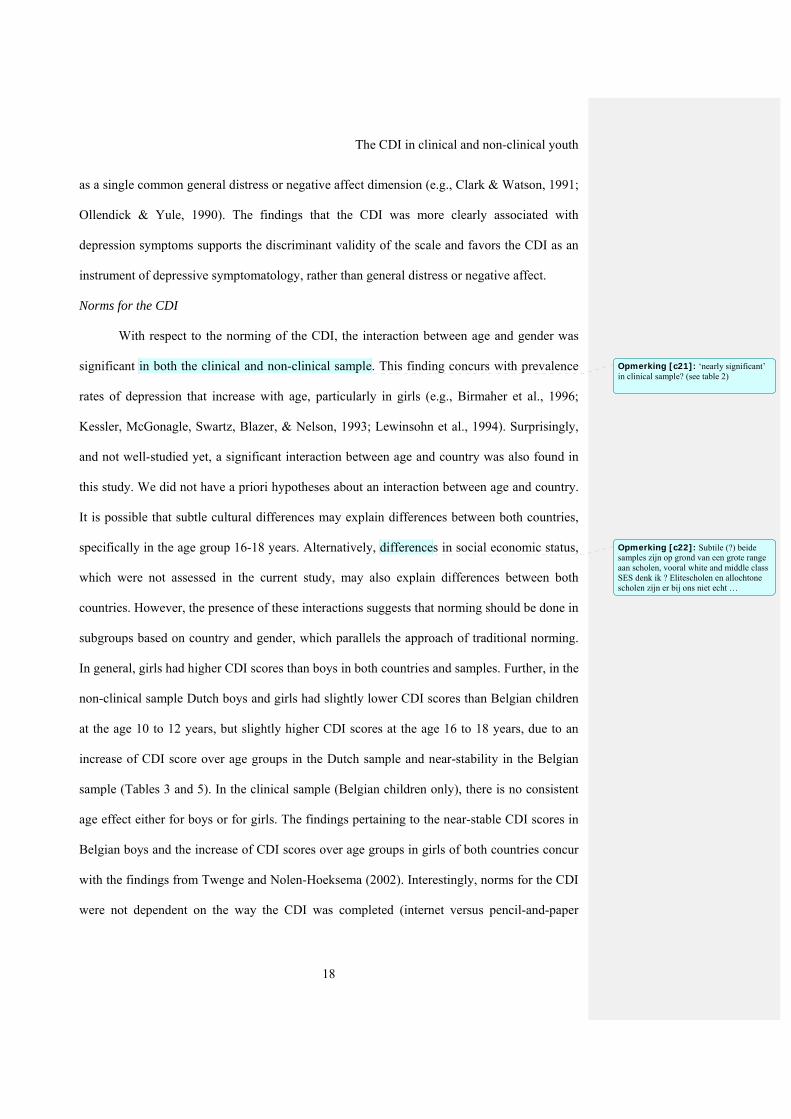
Norms for the CDI
With respect to the norming of the CDI, the interaction between age and gender was
significant in both the clinical and non-clinical sample. This finding concurs with prevalence
rates of depression that increase with age, particularly in girls (e.g., Birmaher et al., 1996;
Kessler, McGonagle, Swartz, Blazer, & Nelson, 1993; Lewinsohn et al., 1994). Surprisingly,
and not well-studied yet, a significant interaction between age and country was also found in
this study. We did not have a priori hypotheses about an interaction between age and country.
It is possible that subtle cultural differences may explain differences between both countries,
specifically in the age group 16-18 years. Alternatively, differences in social economic status,
which were not assessed in the current study, may also explain differences between both
countries. However, the presence of these interactions suggests that norming should be done in
subgroups based on country and gender, which parallels the approach of traditional norming.
In general, girls had higher CDI scores than boys in both countries and samples. Further, in the
non-clinical sample Dutch boys and girls had slightly lower CDI scores than Belgian children
at the age 10 to 12 years, but slightly higher CDI scores at the age 16 to 18 years, due to an
increase of CDI score over age groups in the Dutch sample and near-stability in the Belgian
sample (Tables 3 and 5). In the clinical sample (Belgian children only), there is no consistent
age effect either for boys or for girls. The findings pertaining to the near-stable CDI scores in
Belgian boys and the increase of CDI scores over age groups in girls of both countries concur
with the findings from Twenge and Nolen-Hoeksema (2002). Interestingly, norms for the CDI
were not dependent on the way the CDI was completed (internet versus pencil-and-paper
Opmerking [c21]: ‘nearly significant’ in clinical sample? (see table 2)
Opmerking [c22]: Subtile (?) beide samples zijn op grond van een grote range aan scholen, vooral white and middle class SES denk ik ? Elitescholen en allochtone scholen zijn er bij ons niet echt …
The CDI in clinical and non-clinical youth
19
versions). Past research has shown mixed results with respect to differences between
completing via internet and paper-and pencil (see Van de Looij-Jansen & De Wilde, 2008). In
our study, no differences were found between both types of data collection and suggest that
the same norms can be applied which is promising given the growing interest in electronic
administration of questionnaires.
CDI Cutoff scores
Optimal CDI cutoff scores at which a youngster can be categorized as at risk for
depression or anxiety (as measured with DSM-oriented depression and anxiety scales of the
YSR) were also established. A logistic regression approach was used as well as ROC curves to
determine cutoff points. Generally, logistic regression yielded cutoff points with excellent
specificity, but with the disadvantage of missing individuals at risk due to the low prevalence
which translates into low predicted probability of depression. The logistic regression may also
have low power in detecting an interaction between gender and CDI scores due to the very
small number of youngsters at risk for depression in our sample according to the YSR
depression cutoff score. With respect to the ROC analysis, the finding of a cutoff score of 16
obtained for YSR depression is lower than the score of 19 found by Kovacs (1992) in her non-
clinical sample. Applying a cutoff score of 19 to our data yields a sensitivity of 69% and a
specificity of 96%. Thus, a cutoff score of 19 greatly reduces the sensitivity of the CDI.
Although the current study suggests a cutoff score of 16 gives a good to very good sensitivity
and good specificity, it must be kept in mind that the small number of individuals at risk for
depression identified with the YSR yields unstable estimates of sensitivity as well as the
choice for the best cutoff score.
In interpreting the different cutoff scores, we believe that it is essential not to miss
cases at risk when screening for depression, suggesting that the cutoff points obtained by
means of ROC curves should be used. One should be aware that these cutoff scores imply a
The CDI in clinical and non-clinical youth
20
number of false positives if prevalence is low. For instance, using a CDI score of 16 to detect
depression gave a false alarm for 6% of the total sample, and for 65% of all 34 children
diagnosed as “at risk” by the CDI (i.e. with CDI score of 16 or above). A score of 16 on the
CDI lies in the z-interval of 1 and 2 for all non-clinical subsamples, except girls aged 16-18
years where it lies in the interval 0-1. For the DSM-oriented anxiety symptoms scale of the
YSR, an optimal cutoff score of 21 was found for both boys and girls, with a false alarm of
3% of the total sample, and of 67% of all 15 children with CDI score of 21 or above. A CDI
score of 21 lies in the z-interval of 1 and 2 or around 2, depending on gender and age. In short,
the price for a high sensitivity in the presence of a low prevalence is that the majority (in our
sample two-third) of all children diagnosed as “at risk” according to the CDI are not at risk
according to the YSR. Fortunately, this will become clear upon further screening of all
children who are at risk according to the CDI.
It is also illustrative to compare the CDI scores of those youngsters from the non-
clinical sample who are at risk according to the YSR, with the norms from the non-clinical and
clinical samples. A total of 13 youngsters scored above the clinical cutoff of the YSR
depression scale. Although these 13 kids varied in CDI score, their mean CDI score was 22.3,
which translates into a z–score between of 0 and 1 or around 1, depending on gender,
according to the norms from our clinical sample (Table 6) and into a z-score of about 2 in the
non-clinical sample (Table 5). So their mean CDI score is within the normal range of the
clinical sample and well above the normal range of the non-clinical sample. A similar result
holds for the YSR anxiety scale, on which 6 individuals scored above the clinical cutoff. Their
mean CDI score was 23.5 which is again normal for the clinical, and abnormal for the non-
clinical sample.
A final note pertaining to cutoff scores is that the ROC analyses were based on a
subsample of youngsters aged 10 to 15 years from the total Dutch non-clinical sample because
Opmerking [c23]: Labeled?
Opmerking [c24]: Elevated or high? Was het niet raadzaam voor z-scores van 1 en 2 altijd op dezelfde wijze te labelen?
Opmerking [c25]: Elevated or high?

The CDI in clinical and non-clinical youth
21
the YSR had been administered through the internet to the subsample only (Table 1).
However, the norming results showed no effect of form of completion (i.e., internet versus
pencil-and-paper. Further, we checked comparability between the subsample (n=340) and the
remainder of the Dutch non-clinical sample by an ancillary regression analysis, with square
root CDI scores as dependent variable, and gender, age (as linear and quadratic terms), the
interactions between the age terms and gender, and sample as dummy variable (1 = member of
the subsample, 0 = non-member). This analysis showed no significant effect of sample,
indicating that selection bias was less likely in the subsample relative to the complete Dutch
non-clinical sample. However, it remains to be determined to what extent the obtained cutoff
scores can be generalized to other samples. It should also be noted that the absence of a
significant age effect in the logistic regression of YSR on CDI in the current study might be
due to a restriction of range effect of age and therefore cutoffs should be used within this age
range as it may be relatively normal score for older girls (see Table 5).
Clinical and practical implications
With respect to the norm data, the interpretation of CDI-raw scores depends on age,
gender, and country. Z-scores computed from the residuals of the present regression of (square
root) scores of CDI on sex, age and country, can provide a more objective picture of the
meaningfulness of depressive symptoms of youngsters from different subgroups. Moreover,
when adopted in clinical practice, z-scores can be helpful to identify the severity of the
problems of the youngsters and also to evaluate treatment success. Individuals with low or
very low scores on the CDI might experience no sign of depressive symptoms. However, it
may be the case that those with extreme low scores on the CDI may in some way deny these
symptoms. For clinical use, we advise to interpret low scores on the CDI in the light of scores
of other questionnaires or information obtained from structured interviews.
Opmerking [c26]: A normal score?

The CDI in clinical and non-clinical youth
22
For the results pertaining to CDI cutoff scores, we believe that the cutoff scores
obtained by means of ROC analysis might be used by clinicians to gain more information
about the presence and severity of depressive symptoms. From the viewpoint of prevention, it
is obvious that individuals with elevated CDI scores should be invited for further assessment.
A second assessment period could involve the use of a clinical interview that carefully checks
the diagnostic criteria (e.g., a “multiple gate” assessment strategy (see Reynolds, 1986;
Kendall, Holon, Beck, Hammen, & Ingram, 1987)). A disadvantage of cutoff score obtained
by means of ROC is the relatively high rate of false positives. If there is no time for second
assessments of these individuals in the form of a clinical interview, one may consider having
the CDI administered twice and having a second assessment only for those who have elevated
CDI scores on both occasions as this is less time-consuming than a clinical interview and may
lead to lower rates of false positives.
The cutoff scores obtained for depression and anxiety can be interpreted in the light of
z-scores (see Table 5). That is, a CDI cutoff score for depression of 16 corresponds to a z-
score of 1, whereas a CDI cutoff core of 21 for anxiety corresponds to a z-score of around 2.
Thus, using a z-score of 2 (or larger) on the CDI is alright for detection anxiety, but a z-score
of 1 rather than 2 should be considered for detecting depression.
Strengths and limitations of the current study
The results of the current study advance the CDI as screening instrument for
depression and provide reliable and valid norms for clinical and non-clinical youth. We
noticed no major problems in any subgroup to fill in the questionnaire and missing items were
scarce. It is a strength of the CDI that it takes only 10 minutes to fill in and its reliability is
good. Another strength of the study is that a large sample of both clinical and non-clinical
youngsters was involved, deriving from two different countries, witch enhances the
generalization. A number of limitations of the present study need to be addressed. First, norm
The CDI in clinical and non-clinical youth
23
data and cutoff scores obtained in the current study were found for the Dutch version of the
CDI and therefore it remains to be determined whether these findings can be generalized to
other versions of the CDI. Second, a limitation of our CDI cutoffs is that they were obtained
on a a subsample of children (i.e., within age range of 10 – 15 years) and that it remains to be
determined whether the obtained cutoff scores generalise to a broader age range. Third, social
economic status was not assessed in the current study. Although previous research has
indicated that social economic status was not related to mean CDI scores (e.g., Twenge &
Nolen-Hoeksema, 2002) it cannot be ruled out that this variable is related to CDI norming or
assessing cutoff scores. Future research should include this variable to see whether it is an
important variable to take into account. Despite these limitations, the current study provides
support for the usefulness of the CDI as a screening tool for selecting potential cases for
further assessment.
Opmerking [c27]: eruit

The CDI in clinical and non-clinical youth
24
References
Achenbach, T. M., & Edelbrock, C. (1987). Manual for the Youth Self Report and Profile.
Burlington, VT: Department of Psychiatry, University of Vermont.
Achenbach, T. M., & Rescorla, C. (2001). Manual for the ASEBA school-age forms and
profiles. Burlington, VT: University of Vermont, Research Center for Children, Youth,
and Families.
Beck, A. T., Ward, C. H., Mendelson, M., Mock, J., Erbaugh, J. (1961). An inventory for
measuring depression. Archives of General Psychiatry, 4, 561-571.
Birmaher, B., Ryan, N. D., Williamson, D. E., Brent, D. A., Kaufman, J., Dahl, R. E., et al.
(1996). Childhood and adolescent depression: a review of the past 10 years. Part I. Journal
of American Academy of Child and Adolescent Psychiatry, 35(11), 1427-1439.
Birmaher, B., Arbelaez, C., & Brent, D. (2002). Course and outcome of child and adolescent
major depressive disorder. Child and Adolescent Psychiatric Clinics North America, 11,
619-637.
Brady, E. U., & Kendall, P. C. (1992). Comorbidity of anxiety and depression in children and
adolescents. Psychological Bulletin, 111, 244-255.
Clark, L. A., & Watson, D. (1991). Tripartite model of anxiety and depression: Psychometric
evidence and taxonomic implications. Journal of Abnormal Psychology, 97, 346-353.
Craighead, E. W., Smucker, M. R., Craighead, L. W., Ilardi, S. S. (1998). Factor analysis of
the Children’s Depression Inventory. Psychological Assessment, 10, 156-166.
Finch, A. J., Saylor, C. F., Conway, F., & Edwards, G. L. (1985). Children’s Depression
Inventory: Sex and grade norms for normal children. Journal of Consulting and Clinical
Psychology, 53, 424-425.
Finch, A. J., Jr., Lipovsky, J. A., & Casat, C. D. (1989). Anxiety and depression in children
and adolescents: Negative affectivity or separate constructs? In P. C. Kendall & D. Watson
The CDI in clinical and non-clinical youth
25
(Eds.), Anxiety and depression: Distinctive and overlapping features (pp. 1771-1202).
New York: Academic Press.
Fundudis, T., Berney, T. P., Kolvin, I., Famuyiwa, O. O., Barrett, L., Bhate, S., et al. (1991).
Reliability and validity of two self-rating scales in the assessment of childhood depression.
British Journal of Psychiatry, 159, 36-40.
Hanley, J. A., & McNeil, B. J. The meaning and use of the area under a receiver operating
characteristic (ROC) curve. Radiology, 143, 29-36.
Hien, D., Matzner, F. J., First, M. B., Spitzer, R. L., Gibbon, M., & Williams, J. B. W. (1998).
Structured Clinical Interview for DSM-IV-Child Edition. New York: Columbia University.
Hodges, K. K., & Craighead, W. E. (1990). Relationships of the Children’s Depression
Inventory factors to diagnosed depression. Psychological Assessment: A Journal of
Consulting and Clinical Psychology, 2, 489-492.
Hodges, K. K., Siegel, L. J., Mullins, L., & Griffin, N. (1983). Factor analysis of the
Children’s Depression Inventory. Psychological Reports, 53, 759-763.
Kazdin, A. E. (1988). Childhood depression. In E. J. Mash & L. G. Terdal (Eds.), Behavioral
assessment of childhood disorders (2nd ed., pp. 157-195). New York: Guilford Press.
Kazdin, A. E. (1990). Assessment of childhood depression. In A. M. La Greca (Ed.), Through
the eyes of the child: Obtaining self-reports from children and adolescents (pp.189-233).
Boston, MA: Allyn and Bacon.
Kendall, P. C., Hollon, S. D., Beck, A. T., Hammen, C. L., & Ingram, R. E. (1987). Issues and
recommendations regarding use of the Beck Depression Inventory. Cognitive Therapy and
Research, 11, 289-299.
Kessler, R. C., McGonagle, K. A., Swartz, M., Blazer, D. G., & Nelson, C. B. (1993). Sex and
depression in the National Comorbidity Survey. I: Lifetime prevalence, chronicity and
recurrence. Journal of Affective Disorders, 29(2-3), 85-96.
The CDI in clinical and non-clinical youth
26
Kovacs, M. (1980/1981). Rating scales to assess depression in school-aged children. Acta
Paedopsychiatrica, 46, 305-315.
Kovacs, M. (1983). The Children’s Depression Inventory: A self-rated depression scale for
school-aged youngsters. Unpublished manuscript, University of Pittsburgh.
Kovacs, M. (1985). The Children’s Depression Inventory (CDI). Psychopharmacology
Bulletin, 21, 995-998.
Kovacs, M. (1992). Children’s Depression Inventory. New York: Multi-Health Systems.
Lewinsohn, P. M., Clarke, G. N., Seeley, J. R., & Rohde, P. (1994). Major depression in
community adolescents: age at onset, episode duration, and time to recurrence. Journal of
the American Academy of Child & Adolescent Psychiatry, 33, 809-818.
Lewinsohn, P. M., Rohde, P., & Seeley, J. (1998). Major depressive disorder in older
adolescents: prevalence, risk factors, and clinical implications. Clinical Psychology
Review, 18(7), 765-794.
Little, R. J. A. (1988). A test of missing completely at random for multivariate data with
missing values. Journal of the American Statistical Association, 83, 1198-1102.
Matthey, S., & Petrovsky, P. (2002). The Children’s Depression Inventory. New York: Multi-
Health Systems.
Matzner, F., (1994.) "Videotapes as Training Tools for the Development of the KID-SCID",
Scientific Proceedings, American Academy of Child and Adolescent Psychiatry 42nd
Annual Meeting.
Matzner, F., Silva, R., Silvan, M., Chowdhury, M., & Nastasi, L. (1997, May). Preliminary
test-retest reliability of the KID-SCID. Paper presented at the 150th annual meeting of the
American Psychiatric Association. Washington, DC.

The CDI in clinical and non-clinical youth
27
Ollendick, T. H., & Yule, W. (1990). Depression in British and American children and its
relationship to anxiety and fear. Journal of Consulting and Clinical Psychology, 58, 126-
129.
Reynolds, W. M. (1986). A model for screening and identification of depressed children and
adolescents in school settings. Professional School Psychology, 1, 117-129.
Saylor, C. F., Finch, A. J., Jr., Spirito, A., & Bennett, B. (1984). The Children’s Depression
Inventory: A systematic evaluation of psychometric properties. Journal of Consulting and
Clinical Psychology, 52, 955-967.
Schafer, J. L. (1997). Analysis of incomplete multivariate data. Chapman & Hall, London.
Stark, K. D., Humphrey, L. L., Laurent, J., Livingston, R., & Christopher, J. (1993).
Cognitive, behavioural, and family factors in the differentiation of depressive and anxiety
disorders during childhood. Journal of Consulting and Clinical Psychology, 61, 878-886.
Timbremont, B., & Braet, C. (2002). Children’s Depression Inventory: Nederlandstalige versie
[Children’s Depression Inventory: Dutch version]. Lisse: Swets & Zeitlinger.
Timbremont, B., Braet, C., Dreessen, L. (2004). Assessing depression in youth: Relation
between the Children’s Depression Inventory and a structured interview. Journal of
Clinical Child and Adolescent Psychology, 33, 149-157.
Twenge, J. M., & Nolen-Hoeksema, S. (2002). Age, gender, race, socioeconomic status, and
birth cohort differences on the Children’s Depression Inventory: A meta-analysis. Journal
of Abnormal Psychology, 111, 578-588.
Van Breukelen, G. J. P., & Vlaeyen, J. W. S. (2005). Norming clinical questionnaires with
multiple regression: The pain cognitions list. Psychological Assessment, 17, 336-344.
Van der Elst, W., Van Boxtel, M. P. J., Van Breukelen, G. J. P., & Jolles, J. (2006). The
concept shifting test: Adult normative data. Psychological Assessment, 18, 424-432.
The CDI in clinical and non-clinical youth
28
Van de Looij-Jansen, P. M., & de Wilde E. J. (2008). Comparison of web-based versus paper-
and-pencil self-administered questionnaires: effects on health indicators in Dutch
adolescents. Health Services Research, 43, 1708-1721.
Verhulst, F. C., Ende, van der, J., & Koot, H. M. (1996). Manual for the Child Behavior
Checklist (CBCL/4-18). Afdeling Kinder- en Jeugdpsychiatrie, Sophia
Kinderziekenhuis/Academisch Ziekenhuis Rotterdam/Erasmus Universiteit Rotterdam.
Verhulst, F. C., Ende, van der J., & Koot, H. M. (1997). Manual for the Youth Self Report
(YSR). Afdeling Kinder- en Jeugdpsychiatrie, Sophia Kinderziekenhuis/Academisch
Ziekenhuis Rotterdam/Erasmus Universiteit Rotterdam.
Weiss, B., Weisz, J. R., Politano, M., Carey, M., Nelson, W. M., & Finch, A. J. (1991).
Developmental differences in the factor structure of the Children’s Depression Inventory.
Psychological Assessment, 3, 38-45.
Wolfe, V. V., Finch, A. J., Saylor, C. F., Blount, R. L., Pallmeyer, T. P., & Carek, D. J.
(1987). Negative affectivity in children: a multitraitmultimethod investigation. Journal of
Consulting and Clinical Psychology, 55, 245-250.
Woodward, M. (2005). Epidemiology. Study design and data analysis. New York: Chapman
& Hall.
The CDI in clinical and non-clinical youth
29
Table 1: Sample Descriptive Statistics.
Non-clinical samples (N=3073)
Dutch sample
(N=1347)
Dutch subsample
(N=340)
Belgian sample
(N=1726)
Male gender 595 189 834
Female gender 752 151 892
Age 7-9 years - - 201
10-12 years 635 161 663
13-15 years 574 179 561
16-18 years 138 - 301
Completion Paper and pencil 380 0 -
Internet 967 340 -
CDI: M (SD) 8.58 (6.15) 7.72 (5.67) 8.74 (6.01)
YSR depression scale: M (SD) - 3.70 (3.47) -
YSR anxiety scale: M (SD) - 1.69 (1.86) -
sqrt CDI: M (SD) 2.67 (1.11) 2.59 (1.01) 2.78 (1.01)
sqrt YSR depression scale: M (SD) 1.67 (.95)
sqrt YSR anxiety scale: M (SD) 1.01 (.82)
Clinical sample (N=511)
Belgian (N=511)
Male gender 268
Female gender 243
Age 7-9 years 49
10-12 years 185
13-15 years 213
16-18 years 64
CDI: M (SD) 16.44 (8.54)
sqrt CDI: M (SD) 3.88 (1.19)
Note. CDI=Children’s Depression Inventory; YSR=Youth Self-Report, sqrt = square root
transformed.
The CDI in clinical and non-clinical youth
30
Table 2: Regression Models for Predictors of the (Square Root) CDI Scores in the Non-
clinical and Clinical Samples.
Non-clinical sample (N=3073, R2=.03, MSresidual=1.08)
Predictor B SE of B p (two-tailed)
Constant 2.606 .064 <.001
Country (Netherlands=0, Belgium=1) .097 .040 .014
Sex (girls=0, boys=1) -.171 .038 <.001
Age .202 .033 <.001
Age (quadratic) .009 .003 .002
Age X gender -.053 .016 .001
Age X country -.087 .018 <.001
Clinical sample (N=511, R2=.08, MSresidual=1.30)
Predictor B SE of B p (two-tailed)
Constant 4.333 .087 <.001
Sex (girls=0, boys=1) -.539 .102 <.001
Age .004 .030 .900
Age (quadratic) -.032 .008 <.001
Age X gender -.080 .042 .057
Note. The variable age was centered by subtracting the mean age from each age score (i.e.,
mean age was 12.71 and 12.69 for the non-clinical and clinical sample respectively).

The CDI in clinical and non-clinical youth
31
Table 3: Regression Model for the (Square Root) CDI Scores in the Non-clinical Sample
Breakdown by Gender and Country.
Non-clinical Dutch sample, boys (N=595, R2=.01, MSresidual=1.12)
Predictor B SE of B p (two-tailed)
Constant 2.513 .062 <.001
Age 13-15 .108 .091 .235
Age 16-18 .444 .160 .006
Non-clinical Dutch sample, girls (N=752, R2=.04, MSresidual=1.26 )
Predictor B SE of B p (two-tailed)
Constant 2.534 .061 <.001
Age 13-15 .275 .087 .002
Age 16-18 .704 .135 <.001
Non-clinical Belgian sample, boys (N=834, R2=.01, MSresidual=.97 )
Predictor B SE of B p (two-tailed)
Constant 2.613 .055 <.001
Age 7-9 .369 .118 .002
Age 13-15 .067 .081 .411
Age 16-18 -.018 .096 .855
Non-clinical Belgian sample, girls (N=892, R2=.01, MSresidual=1.03 )
Predictor B SE of B p (two-tailed)
Constant 2.806 .055 <.001
Age 7-9 .079 .111 .474
Age 13-15 .060 .081 .457
Age 16-18 .276 .100 .006
Note. Age group 10-12 years was the reference group.
The CDI in clinical and non-clinical youth
32
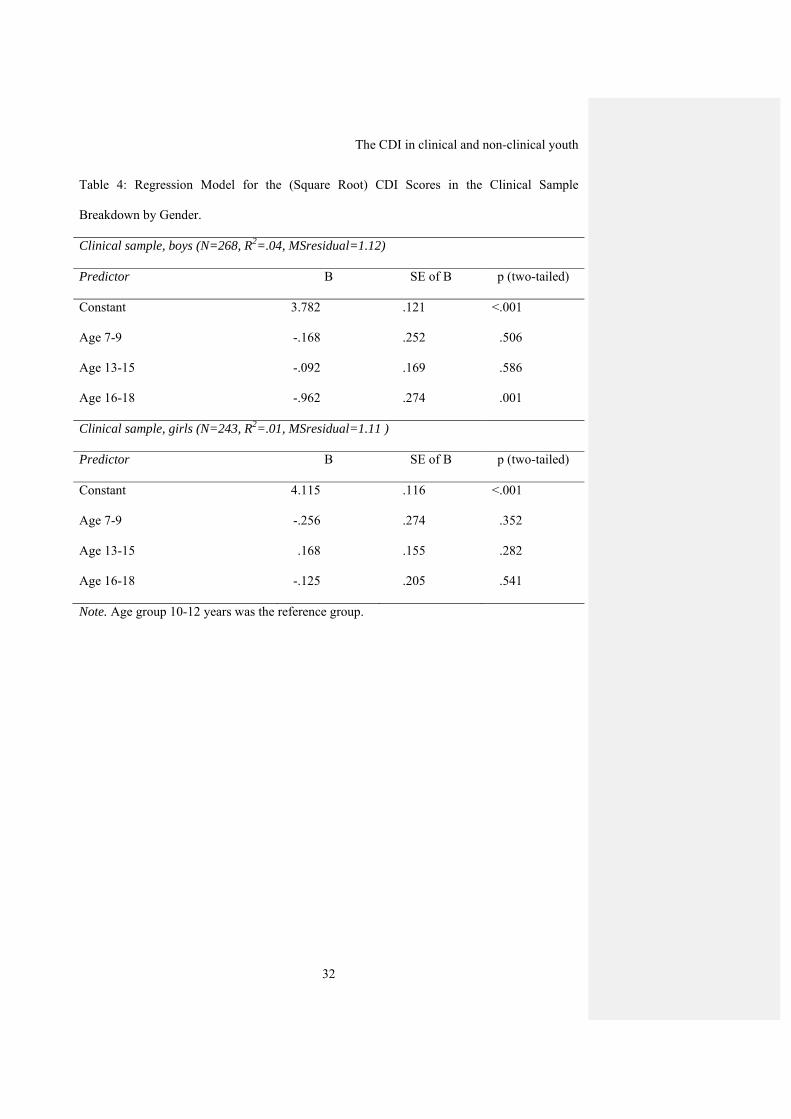
Table 4: Regression Model for the (Square Root) CDI Scores in the Clinical Sample
Breakdown by Gender.
Clinical sample, boys (N=268, R2=.04, MSresidual=1.12)
Predictor B SE of B p (two-tailed)
Constant 3.782 .121 <.001
Age 7-9 -.168 .252 .506
Age 13-15 -.092 .169 .586
Age 16-18 -.962 .274 .001
Clinical sample, girls (N=243, R2=.01, MSresidual=1.11 )
Predictor B SE of B p (two-tailed)
Constant 4.115 .116 <.001
Age 7-9 -.256 .274 .352
Age 13-15 .168 .155 .282
Age 16-18 -.125 .205 .541
Note. Age group 10-12 years was the reference group.
The CDI in clinical and non-clinical youth
33
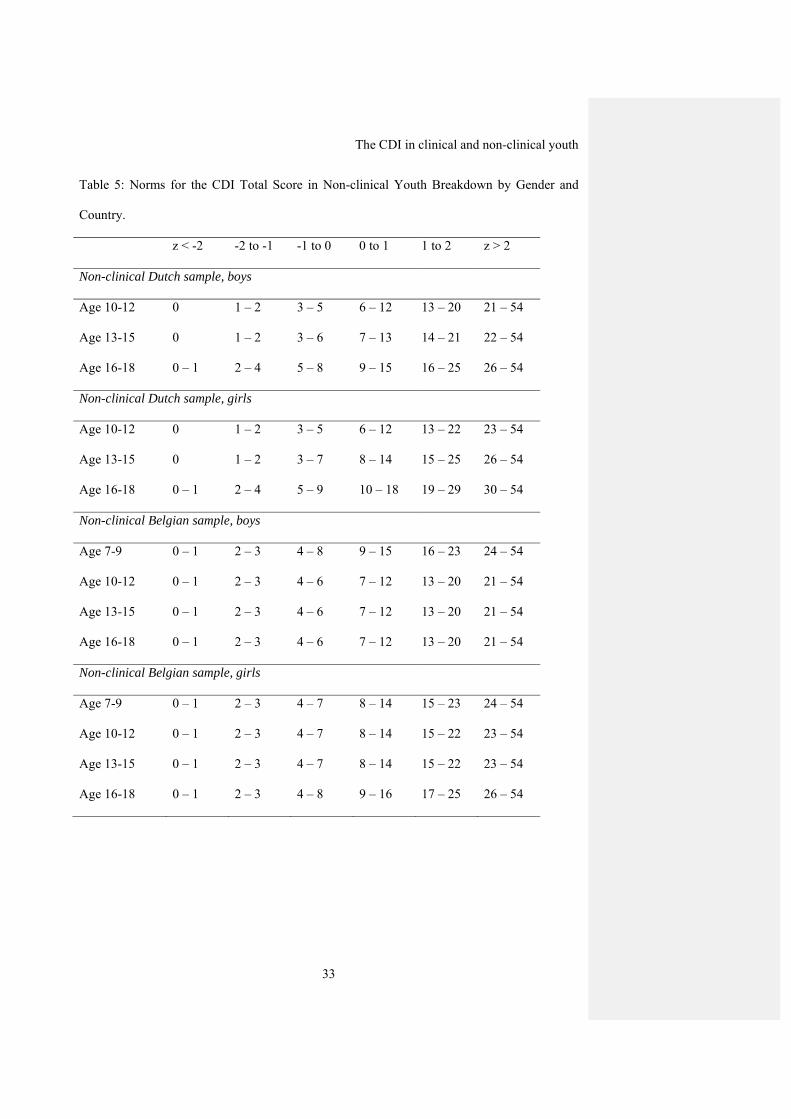
Table 5: Norms for the CDI Total Score in Non-clinical Youth Breakdown by Gender and
Country.
z < -2 -2 to -1 -1 to 0 0 to 1 1 to 2 z > 2
Non-clinical Dutch sample, boys
Age 10-12 0 1 – 2 3 – 5 6 – 12 13 – 20 21 – 54
Age 13-15 0 1 – 2 3 – 6 7 – 13 14 – 21 22 – 54
Age 16-18 0 – 1 2 – 4 5 – 8 9 – 15 16 – 25 26 – 54
Non-clinical Dutch sample, girls
Age 10-12 0 1 – 2 3 – 5 6 – 12 13 – 22 23 – 54
Age 13-15 0 1 – 2 3 – 7 8 – 14 15 – 25 26 – 54
Age 16-18 0 – 1 2 – 4 5 – 9 10 – 18 19 – 29 30 – 54
Non-clinical Belgian sample, boys
Age 7-9 0 – 1 2 – 3 4 – 8 9 – 15 16 – 23 24 – 54
Age 10-12 0 – 1 2 – 3 4 – 6 7 – 12 13 – 20 21 – 54
Age 13-15 0 – 1 2 – 3 4 – 6 7 – 12 13 – 20 21 – 54
Age 16-18 0 – 1 2 – 3 4 – 6 7 – 12 13 – 20 21 – 54
Non-clinical Belgian sample, girls
Age 7-9 0 – 1 2 – 3 4 – 7 8 – 14 15 – 23 24 – 54
Age 10-12 0 – 1 2 – 3 4 – 7 8 – 14 15 – 22 23 – 54
Age 13-15 0 – 1 2 – 3 4 – 7 8 – 14 15 – 22 23 – 54
Age 16-18 0 – 1 2 – 3 4 – 8 9 – 16 17 – 25 26 – 54

The CDI in clinical and non-clinical youth
34
Table 6: Norms for the CDI Total Score in Clinically Referred Youth Breakdown by Gender.
z < -2 -2 to -1 -1 to 0 0 to 1 1 to 2 z > 2
Boys
Age 7-9 0 – 1 2 – 6 7 – 12 13 – 22 23 – 36 37 – 54
Age 10-12 0 – 2 3 – 7 8 – 13 14 – 24 25 – 38 39 – 54
Age 13-15 0 – 2 3 – 6 7 – 13 14 – 23 24 – 37 38 – 54
Age 16-18 0 1 – 2 3 – 7 8 – 15 16 – 27 28 – 54
Girls
Age 7-9 0 – 2 3 – 6 7 – 14 15 – 25 26 – 39 40 – 54
Age 10-12 0 – 3 4 – 8 9 – 16 17 – 27 28 – 42 43 – 54
Age 13-15 0 – 3 4 – 9 10 – 17 18 – 29 30 – 44 45 – 54
Age 16-18 0 – 2 3 – 8 9 – 15 16 – 26 27 – 41 42 – 54
The CDI in clinical and non-clinical youth
35
Figure 1: ROC Curve of YSR DSM-oriented Depression Symptoms and CDI
Note. The AUC=.95, p<.001. The cutoff of 16 (*) obtained by ROC and 23 by means of
logistic regression analysis (■).
* ■
1 - Specificity1.00.80.60.40.2 0.0
Sensitivity
1.0
0.8
0.6
0.4
0.2
0.0

The CDI in clinical and non-clinical youth
36
Figure 2: ROC Curve of YSR DSM-oriented Anxiety Symptoms and CDI.
Note. The AUC=.95, p<.001. The cutoff of 21 (*) obtained by ROC and 30 by means of
logistic regression analysis (■).
* ■
1 - Specificity1.00.80.60.40.2 0.0
Sensitivity
1.0
0.8
0.6
0.4
0.2
0.0