Normal Left Ventricular Myocardial Thickness for Middle...
10
500 S everal common cardiac diseases, such as hypertensive heart disease, dilated cardiomyopathy, hypertrophic cardiomyopathy (HCM), and myocardial infarction, alter left ventricular myocardial thickness (LVMT). Cardiac magnetic resonance (CMR) imaging is often considered a standard for the assessment of left ventricular (LV) anatomy and function because of high accuracy and reproducibility. Cine steady- state free precession (SSFP) is the technique currently used to measure functional parameters, myocardial mass, and wall thickness in CMR. Because of a higher blood-myocardial contrast, measurements of cardiac volume and mass differ from values acquired with the fast gradient echo sequence. 1–4 Clinical Perspective on p 508 Knowledge of normal LVMT is important to diagnose hypertrophy as well as abnormal wall thinning. Normal val- ues for LVMT published in the current literature were derived from echocardiography, 5 restricted to small sample sizes, 6–8 not measured on SSFP images, 7–10 acquired only on short axis images, 11 or in a single region. 12 The purpose of this study was (1) to establish standard reference values for LVMT measured on long axis and short axis cine SSFP images in subjects free of cardiac disease, (2) to assess differences between measurements obtained on © 2012 American Heart Association, Inc. Circ Cardiovasc Imaging is available at http://circimaging.ahajournals.org DOI: 10.1161/CIRCIMAGING.112.973560 Received February 7, 2012; accepted June 8, 2012. From the Radiology and Imaging Sciences Department and National Institute of Biomedical Imaging and Bioengineering, National Institutes of Health, Bethesda, MD (N.K., E.B.T., D.A.B.); Translational Science Institute (J.J.C.), Department of Internal Medicine, Section of Cardiology (W.G.H.), Wake Forest University School of Medicine, Winston-Salem, NC; Department of Radiology and Radiological Sciences (J.E.) and Division of Cardiology (J.A.C.L.), Johns Hopkins University School of Medicine, Baltimore, MD; Department of Radiology, UCLA School of Medicine, Los Angeles, CA (A.S.G.); Collaborative Health Studies Coordinating Center, University of Washington, Seattle, WA (C.J.); Cardiology Office, University of Minnesota Medical School, Minneapolis, MN (S.C.M); Cornell and Columbia Universities, New York, NY (M.R.P.); Department of Radiology, Leiden University Medical Center, Leiden, The Netherlands (R.J.v.d.G.). Correspondence to David A. Bluemke, MD, PhD, Radiology and Imaging Sciences, National Institutes of Health, 10 Center Drive, Rm 10/1C355; Bethesda, MD 20892. E-mail [email protected] Background—Increased left ventricular myocardial thickness (LVMT) is a feature of several cardiac diseases. The purpose of this study was to establish standard reference values of normal LVMT with cardiac magnetic resonance and to assess variation with image acquisition plane, demographics, and left ventricular function. Methods and Results—End-diastolic LVMT was measured on cardiac magnetic resonance steady-state free precession cine long and short axis images in 300 consecutive participants free of cardiac disease (169 women; 65.6±8.5 years) of the Multi- Ethnic Study of Atherosclerosis cohort. Mean LVMT on short axis images at the mid-cavity level was 5.3±0.9 mm and 6.3±1.1 mm for women and men, respectively. The average of the maximum LVMT at the mid-cavity for women/men was 7/9 mm (long axis) and 7/8 mm (short axis). Mean LVMT was positively associated with weight (0.02 mm/kg; P=0.01) and body surface area (1.1 mm/m 2 ; P<0.001). No relationship was found between mean LVMT and age or height. Greater mean LVMT was associated with lower left ventricular end-diastolic volume (0.01 mm/mL; P<0.01), a lower left ventricular end- systolic volume (−0.01 mm/mL; P=0.01), and lower left ventricular stroke volume (−0.01 mm/mL; P<0.05). LVMT measured on long axis images at the basal and mid-cavity level were slightly greater (by 6% and 10%, respectively) than measurements obtained on short axis images; apical LVMT values on long axis images were 20% less than those on short axis images. Conclusions—Normal values for wall thickness are provided for middle-aged and older subjects. Normal LVMT is lower for women than men. Observed values vary depending on the imaging plane for measurement. (Circ Cardiovasc Imaging. 2012;5:500-508.) Key Words: magnetic resonance imaging ◼ myocardial thickness ◼ normal values Normal Left Ventricular Myocardial Thickness for Middle-Aged and Older Subjects With Steady-State Free Precession Cardiac Magnetic Resonance The Multi-Ethnic Study of Atherosclerosis Nadine Kawel, MD; Evrim B. Turkbey, MD; J. Jeffrey Carr, MD, MSc; John Eng, MD; Antoinette S. Gomes, MD; W. Gregory Hundley, MD, MHS; Craig Johnson, MS; Sofia C. Masri, MD; Martin R. Prince, MD, PhD; Rob J. van der Geest, PhD; João A.C. Lima, MD; David A. Bluemke, MD, PhD by guest on July 14, 2018 http://circimaging.ahajournals.org/ Downloaded from
Transcript of Normal Left Ventricular Myocardial Thickness for Middle...

500
Several common cardiac diseases, such as hypertensive heart disease, dilated cardiomyopathy, hypertrophic
cardiomyopathy (HCM), and myocardial infarction, alter left ventricular myocardial thickness (LVMT). Cardiac magnetic resonance (CMR) imaging is often considered a standard for the assessment of left ventricular (LV) anatomy and function because of high accuracy and reproducibility. Cine steady-state free precession (SSFP) is the technique currently used to measure functional parameters, myocardial mass, and wall thickness in CMR. Because of a higher blood-myocardial contrast, measurements of cardiac volume and mass differ from values acquired with the fast gradient echo sequence.1–4
Clinical Perspective on p 508
Knowledge of normal LVMT is important to diagnose hypertrophy as well as abnormal wall thinning. Normal val-ues for LVMT published in the current literature were derived from echocardiography,5 restricted to small sample sizes,6–8 not measured on SSFP images,7–10 acquired only on short axis images,11 or in a single region.12
The purpose of this study was (1) to establish standard reference values for LVMT measured on long axis and short axis cine SSFP images in subjects free of cardiac disease, (2) to assess differences between measurements obtained on
© 2012 American Heart Association, Inc.
Circ Cardiovasc Imaging is available at http://circimaging.ahajournals.org DOI: 10.1161/CIRCIMAGING.112.973560
Received February 7, 2012; accepted June 8, 2012.From the Radiology and Imaging Sciences Department and National Institute of Biomedical Imaging and Bioengineering, National Institutes of Health,
Bethesda, MD (N.K., E.B.T., D.A.B.); Translational Science Institute (J.J.C.), Department of Internal Medicine, Section of Cardiology (W.G.H.), Wake Forest University School of Medicine, Winston-Salem, NC; Department of Radiology and Radiological Sciences (J.E.) and Division of Cardiology (J.A.C.L.), Johns Hopkins University School of Medicine, Baltimore, MD; Department of Radiology, UCLA School of Medicine, Los Angeles, CA (A.S.G.); Collaborative Health Studies Coordinating Center, University of Washington, Seattle, WA (C.J.); Cardiology Office, University of Minnesota Medical School, Minneapolis, MN (S.C.M); Cornell and Columbia Universities, New York, NY (M.R.P.); Department of Radiology, Leiden University Medical Center, Leiden, The Netherlands (R.J.v.d.G.).
Correspondence to David A. Bluemke, MD, PhD, Radiology and Imaging Sciences, National Institutes of Health, 10 Center Drive, Rm 10/1C355; Bethesda, MD 20892. E-mail [email protected]
Background—Increased left ventricular myocardial thickness (LVMT) is a feature of several cardiac diseases. The purpose of this study was to establish standard reference values of normal LVMT with cardiac magnetic resonance and to assess variation with image acquisition plane, demographics, and left ventricular function.
Methods and Results—End-diastolic LVMT was measured on cardiac magnetic resonance steady-state free precession cine long and short axis images in 300 consecutive participants free of cardiac disease (169 women; 65.6±8.5 years) of the Multi-Ethnic Study of Atherosclerosis cohort. Mean LVMT on short axis images at the mid-cavity level was 5.3±0.9 mm and 6.3±1.1 mm for women and men, respectively. The average of the maximum LVMT at the mid-cavity for women/men was 7/9 mm (long axis) and 7/8 mm (short axis). Mean LVMT was positively associated with weight (0.02 mm/kg; P=0.01) and body surface area (1.1 mm/m2; P<0.001). No relationship was found between mean LVMT and age or height. Greater mean LVMT was associated with lower left ventricular end-diastolic volume (0.01 mm/mL; P<0.01), a lower left ventricular end-systolic volume (−0.01 mm/mL; P=0.01), and lower left ventricular stroke volume (−0.01 mm/mL; P<0.05). LVMT measured on long axis images at the basal and mid-cavity level were slightly greater (by 6% and 10%, respectively) than measurements obtained on short axis images; apical LVMT values on long axis images were 20% less than those on short axis images.
Conclusions—Normal values for wall thickness are provided for middle-aged and older subjects. Normal LVMT is lower for women than men. Observed values vary depending on the imaging plane for measurement. (Circ Cardiovasc Imaging. 2012;5:500-508.)
Key Words: magnetic resonance imaging ◼ myocardial thickness ◼ normal values
Normal Left Ventricular Myocardial Thickness for Middle-Aged and Older Subjects With Steady-State Free
Precession Cardiac Magnetic ResonanceThe Multi-Ethnic Study of Atherosclerosis
Nadine Kawel, MD; Evrim B. Turkbey, MD; J. Jeffrey Carr, MD, MSc; John Eng, MD; Antoinette S. Gomes, MD; W. Gregory Hundley, MD, MHS; Craig Johnson, MS;
Sofia C. Masri, MD; Martin R. Prince, MD, PhD; Rob J. van der Geest, PhD; João A.C. Lima, MD; David A. Bluemke, MD, PhD
by guest on July 14, 2018http://circim
aging.ahajournals.org/D
ownloaded from

Kawel et al Normal Left Ventricular Myocardial Thickness 501
long axis and short axis images, and (3) to determine whether LVMT varies with demographics and LV function.
MethodsStudy SampleThe Multi-Ethnic Study of Atherosclerosis is a population-based longitudinal study. At enrollment between 2000 and 2002, study par-ticipants were free of clinically recognized cardiovascular disease.13 A 10-year follow-up examination began in April 2010. Of the initial 2082 participants who were entered consecutively in the database, we selected all 300 participants who had no history of myocardial infarction, no evidence of an ischemic or nonischemic scar on late gadolinium-enhanced CMR, left ventricular ejection fraction >50%, systolic blood pressure <140 mm Hg and no antihypertensive medica-tion, no history of current smoking, and no diabetes mellitus. All 300 participants were free of myocardial infarction according to late gad-olinium-enhanced CMR and their medical history. The study was ap-proved by the institutional review boards of each of the 6 participating US field sites, and all participants provided written informed consent.
Cardiac Magnetic ResonanceCMR examinations were performed at the 6 Multi-Ethnic Study of Atherosclerosis field centers (Baltimore, Winston-Salem, New York, Minneapolis, Los Angeles, and Chicago) on 1.5-T magnetic resonance scanners (Signa Excite, General Electric Medical Systems, Waukesha, WI and Avanto/Espree, Siemens, Erlangen, Germany). Retrospectively ECG-gated long and short axis cine images were ac-quired using a SSFP sequence with the parameters displayed in Table 1. The presence of myocardial scar was evaluated in participants who consented to contrast administration and without contraindication beginning 15 minutes after bolus administration of 0.15 mmol/kg gadopentetate dimeglumine (Bayer, NJ) using an inversion recovery prepared gradient echo sequence.
Image EvaluationLVMT was measured using the semiautomatic software tool of QMass V.7.2 (Medis Medical Imaging Systems, Netherlands). LVMT was measured on horizontal and vertical long axis images at the basal, mid-cavity, and apical level in the anterior, inferior, lateral, and septal region. LVMT was averaged over 33 to 34 measurements per region that were automatically acquired by the software using the 2-dimen-sional centerline method after manually contouring the endocardial and epicardial contours6 (Figure 1).
LVMT was also measured on all short axis images where the myo-cardium was present as a complete circle. After manually contour-ing endocardial and epicardial borders and marking the inferior right ventricular insertion, software automatically divided myocardium of each slice into 6 sections and obtained 16 to 17 measurements of LVMT per section according to the centerline method (Figure 2). Furthermore, measurements were averaged per segment as defined by the American Heart Association according to the 17 segment model (apex excepted).14 All measurements were performed at end-diastole, which was identified as the frame with the largest LV volume.
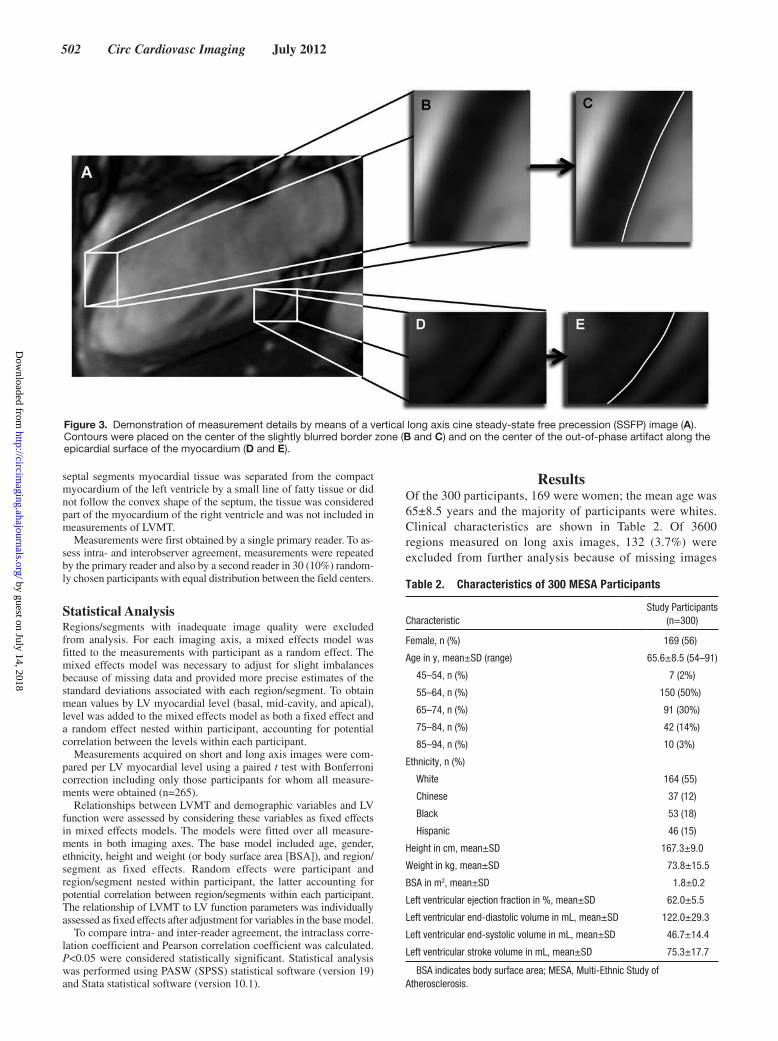
Contours were placed on the center of the black line along the epicardial surface related to an artifact that is caused by out-of-phase imaging and that appears frequently on SSFP images. Motion and limited spatial resolution often slightly blurred myocardial borders, which was obvious particularly after enlargement of the image. Contours were placed on the center of the blurred border region (Figure 3). Papillary muscles and trabculation were excluded from LVMT measurements. For cases where the epicardial contour of the
Table 1. Sequence Parameters of Cine bSSFP
Sequence Parameter1.5 T Avanto/Espree
Siemens
1.5 T Signa ExciteGeneral
Electric
TR ≤3.8 ms Minimize
TE Minimized Minimum full
Flip angle, ° 70 45
Field of view, mm 360 × 360 360 × 360
Matrix size, mm 256 × 205 256 × 192
Slice thickness, mm 8 8
Interslice gap, mm 2 2
Bandwidth, Hz/pixel 1221 977
Parallel imaging GRAPPA: 2 ASSET
Segments, no. 18 16
Temporal resolution, ms 49 48
TR indicates time to repetition; TE, echo time; GRAPPA, generalized autocalibrating partially parallel acquisition; ASSET, array spatial sensitivity encoding technique.
Figure 1. Measurements obtained on long axis steady-state free precession (SSFP) images of the septal (A), lateral (B), anterior (C) and inferior (D) left ventricular wall. After manually contouring the epicardial (green line in A–D) and endocardial (red line in A–D) border, myocardial thickness was automatically acquired in 100 measurements per left ventricular wall using the 2-dimensional centerline method (yellow lines in A–D).
Figure 2. Measurement obtained on a short axis steady-state free precession (SSFP) image. After manually contouring the epicardial (green line) and endocardial (red line) border, left ventricular myocardial thickness was automatically acquired in 100 measurements per slice using the 2-dimensional centerline method (yellow lines).
by guest on July 14, 2018http://circim
aging.ahajournals.org/D
ownloaded from
502 Circ Cardiovasc Imaging July 2012
septal segments myocardial tissue was separated from the compact myocardium of the left ventricle by a small line of fatty tissue or did not follow the convex shape of the septum, the tissue was considered part of the myocardium of the right ventricle and was not included in measurements of LVMT.
Measurements were first obtained by a single primary reader. To as-sess intra- and interobserver agreement, measurements were repeated by the primary reader and also by a second reader in 30 (10%) random-ly chosen participants with equal distribution between the field centers.
Statistical AnalysisRegions/segments with inadequate image quality were excluded from analysis. For each imaging axis, a mixed effects model was fitted to the measurements with participant as a random effect. The mixed effects model was necessary to adjust for slight imbalances because of missing data and provided more precise estimates of the standard deviations associated with each region/segment. To obtain mean values by LV myocardial level (basal, mid-cavity, and apical), level was added to the mixed effects model as both a fixed effect and a random effect nested within participant, accounting for potential correlation between the levels within each participant.
Measurements acquired on short and long axis images were com-pared per LV myocardial level using a paired t test with Bonferroni correction including only those participants for whom all measure-ments were obtained (n=265).
Relationships between LVMT and demographic variables and LV function were assessed by considering these variables as fixed effects in mixed effects models. The models were fitted over all measure-ments in both imaging axes. The base model included age, gender, ethnicity, height and weight (or body surface area [BSA]), and region/ segment as fixed effects. Random effects were participant and region/segment nested within participant, the latter accounting for potential correlation between region/segments within each participant. The relationship of LVMT to LV function parameters was individually assessed as fixed effects after adjustment for variables in the base model.
To compare intra- and inter-reader agreement, the intraclass corre-lation coefficient and Pearson correlation coefficient was calculated. P<0.05 were considered statistically significant. Statistical analysis was performed using PASW (SPSS) statistical software (version 19) and Stata statistical software (version 10.1).
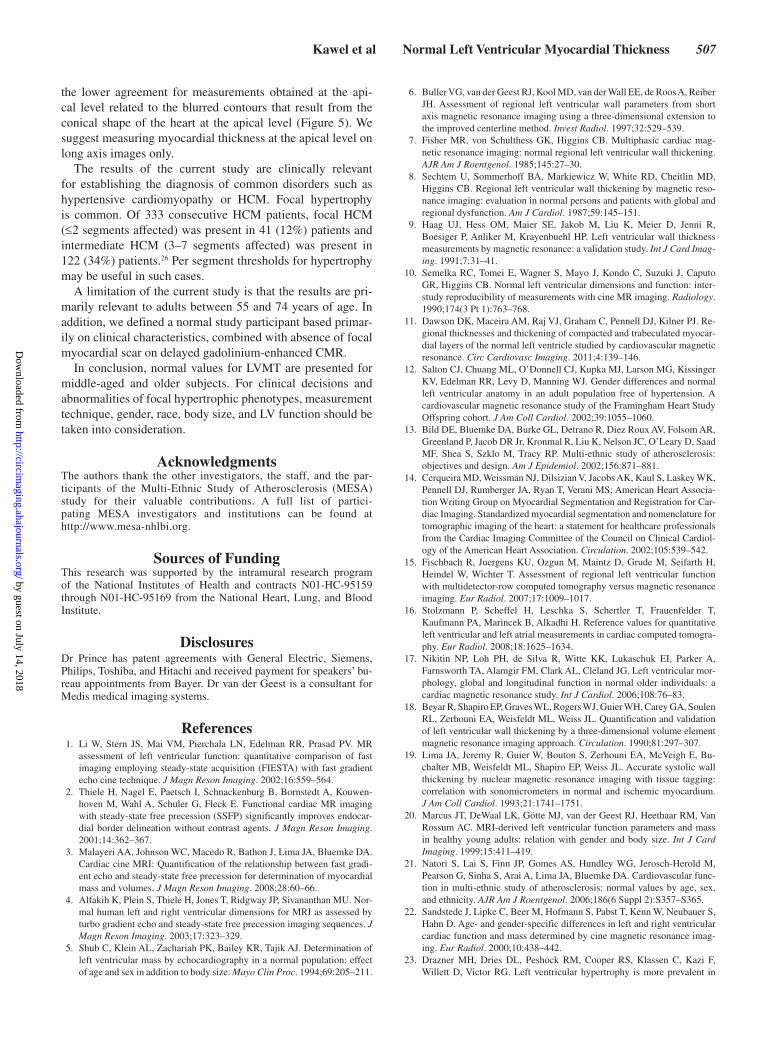
ResultsOf the 300 participants, 169 were women; the mean age was 65±8.5 years and the majority of participants were whites. Clinical characteristics are shown in Table 2. Of 3600 regions measured on long axis images, 132 (3.7%) were excluded from further analysis because of missing images
Figure 3. Demonstration of measurement details by means of a vertical long axis cine steady-state free precession (SSFP) image (A). Contours were placed on the center of the slightly blurred border zone (B and C) and on the center of the out-of-phase artifact along the epicardial surface of the myocardium (D and E).
Table 2. Characteristics of 300 MESA Participants
CharacteristicStudy Participants
(n=300)
Female, n (%) 169 (56)
Age in y, mean±SD (range) 65.6±8.5 (54–91)
45–54, n (%) 7 (2%)
55–64, n (%) 150 (50%)
65–74, n (%) 91 (30%)
75–84, n (%) 42 (14%)
85–94, n (%) 10 (3%)
Ethnicity, n (%)
White 164 (55)
Chinese 37 (12)
Black 53 (18)
Hispanic 46 (15)
Height in cm, mean±SD 167.3±9.0
Weight in kg, mean±SD 73.8±15.5
BSA in m2, mean±SD 1.8±0.2
Left ventricular ejection fraction in %, mean±SD 62.0±5.5
Left ventricular end-diastolic volume in mL, mean±SD 122.0±29.3
Left ventricular end-systolic volume in mL, mean±SD 46.7±14.4
Left ventricular stroke volume in mL, mean±SD 75.3±17.7
BSA indicates body surface area; MESA, Multi-Ethnic Study of Atherosclerosis.
by guest on July 14, 2018http://circim
aging.ahajournals.org/D
ownloaded from

Kawel et al Normal Left Ventricular Myocardial Thickness 503
or inadequate image quality. Of 4800 segments measured on short axis images, 128 (2.7%) were excluded from further analysis.
Normal ValuesHistograms showed a normal distribution of measurements for each region/segment. Mean values per region/segment and per level obtained on short and long axis images are displayed in Tables 3 and 4.
The average of the maximum/minimum LVMT at the mid-cavity as defined on long axis images was 7/5 mm (women) and 9/6 mm (men), respectively. For any segment observed on long axis images, the maximum/minimum LVMT was on average 9/4 mm (women) and 11/4 mm (men), respectively (Table 3).
The average of the maximum/minimum LVMT at the mid-cavity as defined on short axis images was 7/4 mm (women) and 8/5 mm (men), respectively. For any segment observed on short axis images, the maximum/minimum LVMT was on average 9/4 mm (women) and 11/4 mm (men), respectively (Table 4).
Complete sets of both long and short axis measurements were available for comparison in 265 (88%) subjects (Figure 4). Comparison of short and long axis images revealed a signifi-cant difference for all 3 levels (basal, mid-cavity, and apical) (P<0.0001; Bonferroni corrected significance criterion of 0.02). Measurements obtained on long axis images of the basal and mid-cavity level were significantly greater com-pared with those obtained on short axis (by +6% and +10%, respectively). However, apical measurements on long axis
images were ≈20% lower than those measurements obtained on short axis images.
Association of LVMT With Demographic and LV ParametersIn the multivariate baseline mixed model, mean LVMT was greater in men than women (1.0 mm; P<0.001). Compared with whites, black ethnicity was associated with a higher mean LVMT (0.3 mm; P<0.01), whereas Hispanic ethnicity was associated with a lower mean LVMT (−0.2 mm; P=0.04). Furthermore, there was a small positive relationship between mean LVMT and weight (0.02 mm/kg; P=0.01). No rela-tionship was found between mean LVMT and age or height. Except for Hispanic ethnicity, which was not statistically sig-nificantly associated with LVMT, these results did not show a relevant change after substitution of height and weight by BSA. BSA itself was directly correlated with mean LVMT (1.1 mm/m2; P<0.001) (Table 5).
In adjusted models (age, gender, ethnicity, height, and weight), greater mean LVMT was associated with a lower left ventricular end-diastolic volume (−0.01 mm/mL; P<0.01), a lower left ventricular end-systolic volume (−0.01 mm/mL; P=0.01), and a lower left ventricular stroke volume (−0.01 mm/mL; P<0.05). There was no relationship of LVMT with ejection fraction. These results did not show a relevant change after substitution of height and weight by BSA (Table 5).
Intra- and Interobserver AgreementAnalysis of the intrarater agreement revealed a Pearson correlation coefficient of 0.87 (long axis) and 0.81 (short axis), respectively. Intraclass correlation coefficient was 0.87 (long
Table 3. LVMT, LVMTmin, and LVMTmax According to Measurements Acquired on Long Axis Images for Men and Women*
Level Region
Women Men
LVMT±SD, mm
LVMTmin±SD, mm
LVMTmax±SD, mm
LVMT±SD, mm
LVMTmin±SD, mm
LVMTmax±SD, mm
Basal Anterior 7.0±1.1 5.5±1.0 8.2±1.3 8.2±1.3 6.8±1.2 9.2±1.5
Inferior 6.7±1.1 5.7±1.0 7.7±1.3 8.2±1.3 7.0±1.2 9.3±1.5
Septal 7.3±1.1 6.0±1.0 8.8±1.3 9.1±1.3 7.3±1.2 10.6±1.5
Lateral 6.0±1.1 5.2±1.0 6.7±1.3 7.6±1.3 6.5±1.2 8.5±1.5
Mean† 6.8±0.9 5.6±0.8 7.9±1.0 8.3±1.0 6.9±0.9 9.4±1.2
Mid-cavity Anterior 4.9±1.1 4.2±1.0 5.7±1.3 6.0±1.3 5.1±1.2 7.2±1.5
Inferior 6.5±1.1 5.5±1.0 7.3±1.3 7.7±1.3 6.5±1.2 8.8±1.5
Septal 6.8±1.1 5.7±1.0 8.2±1.3 8.3±1.3 6.7±1.2 10.1±1.5
Lateral 5.3±1.1 4.7±1.0 6.0±1.3 6.6±1.3 5.8±1.2 7.7±1.5
Mean† 5.9±0.9 5.0±0.8 6.8±1.0 7.2±1.0 6.0±0.9 8.5±1.2
Apical Anterior 4.2±1.1 3.5±1.0 4.9±1.3 5.1±1.3 4.2±1.2 5.8±1.5
Inferior 5.0±1.1 3.9±1.0 6.0±1.3 5.8±1.3 4.6±1.2 6.9±1.5
Septal 5.0±1.1 3.9±1.0 6.0±1.3 5.8±1.3 4.4±1.2 7.1±1.5
Lateral 4.6±1.1 3.7±1.0 5.3±1.3 5.5±1.3 4.3±1.2 6.6±1.5
Mean† 4.7±0.9 3.8±0.8 5.6±1.0 5.6±1.0 4.3±0.9 6.6±1.2
LVMT indicates left ventricular myocardial thickness (average); LVMTmin, minimum LVMT; LVMTmax, maximum LVMT.*Measurements and SD adjusted for unmeasurable regions by mixed effects modeling.†Level-specific means include only levels in which all regions were measurable.
by guest on July 14, 2018http://circim
aging.ahajournals.org/D
ownloaded from

504 Circ Cardiovasc Imaging July 2012
axis) and 0.74 (short axis), respectively. Interrater agreement according to Pearson was 0.85 (long axis) and 0.71 (short axis), respectively. Intraclass correlation coefficient was 0.85 (long axis) and 0.68 (short axis), respectively. Mean difference among readers was 0.01 mm for measurements obtained on long axis images and 0.3 mm for measurements obtained on short axis images.
DiscussionMeasuring myocardial thickness is critical for diagnosis and characterization of many cardiovascular diseases. Increasingly, magnetic resonance imaging is considered the gold standard for myocardial thickness and mass measurements.
Normal Values of LVMTTable 6 shows various reference studies reporting LVMT in healthy subjects. Direct comparison of values of LVMT obtained in the current study with measurements reported in the literature is hampered by different imaging modalities or CMR sequences.5,7–11 Data of the current study from 300 subjects free of cardiac disease participating in the Multi-Ethnic Study of Atherosclerosis protocol demonstrate that the normal myocardial thickness values for SSFP are smaller than values established with the older spoiled gradient echo magnetic resonance imaging technique. LV mass obtained on SSFP images has been reported to be ≈20% smaller compared with gradient echo images.1,4 It has also been demonstrated that LVMT measurements obtained on magnetic resonance SSFP images are substantially smaller compared with mea-surements obtained on CT images.15 LVMT values of the cur-rent study are also smaller compared with a previous study where measurements were acquired on short axis cine SSFP images.11 Differences can be explained by variation in mea-surement methodology. In our study, we made multiple mea-surements in each segment. In the study by Dawson et al,11
Table 4. LVMT, LVMTmin, and LVMTmax According to Measurements Acquired on Short Axis Images for Men and Women*
Level Segment
Women Men
LVMT±SD, mm LVMTmin±SD, mm LVMTmax±SD, mm LVMT±SD, mm LVMTmin±SD, mm LVMTmax±SD, mm
Basal 1 6.3±1.1 4.8±1.0 8.0±1.6 7.7±1.3 5.8±1.1 9.6±1.9
2 7.1±1.1 5.4±1.0 8.6±1.6 8.7±1.3 6.4±1.1 10.6±1.9
3 7.1±1.1 5.7±1.0 8.5±1.6 8.7±1.3 6.9±1.1 10.4±1.9
4 6.2±1.1 4.6±1.0 7.9±1.6 7.7±1.3 5.7±1.1 9.8±1.9
5 5.6±1.1 4.3±1.0 6.9±1.6 6.9±1.3 5.2±1.1 8.4±1.9
6 5.9±1.1 4.6±1.0 7.2±1.6 7.1±1.3 5.4±1.1 8.6±1.9
Mean† 6.4±0.9 4.9±0.8 7.8±1.4 7.8±1.1 5.9±0.8 9.6±1.6
Mid-cavity 7 5.2±1.1 3.9±1.0 6.7±1.6 6.1±1.3 4.7±1.1 7.8±1.9
8 5.6±1.1 4.2±1.0 7.0±1.6 6.7±1.3 5.1±1.1 8.6±1.9
9 6.3±1.1 4.9±1.0 7.7±1.6 7.6±1.3 5.6±1.1 9.5±1.9
10 5.3±1.1 4.0±1.0 7.0±1.6 6.2±1.3 4.6±1.1 8.5±1.9
11 4.6±1.1 3.5±1.0 5.9±1.6 5.5±1.3 4.1±1.1 7.2±1.9
12 5.1±1.1 3.9±1.0 6.6±1.6 5.9±1.3 4.4±1.1 7.6±1.9
Mean† 5.3±0.9 4.1±0.8 6.8±1.4 6.3±1.1 4.8±0.8 8.2±1.6
Apical 13 6.9±1.1 4.7±1.0 9.1±1.6 7.0±1.3 4.7±1.1 9.3±1.9
14 5.9±1.1 4.4±1.0 7.9±1.6 6.6±1.3 4.9±1.1 8.7±1.9
15 5.1±1.1 3.6±1.0 7.0±1.6 5.7±1.3 3.9±1.1 7.9±1.9
16 5.8±1.1 3.7±1.0 8.4±1.6 6.1±1.3 4.0±1.1 8.7±1.9
Mean† 5.9±0.9 4.1±0.9 8.1±1.4 6.4±1.1 4.4±0.8 8.6±1.7
LVMT indicates left ventricular myocardial thickness (average); LVMTmin, minimum LVMT; LVMTmax, maximum LVMT; segments: 1, basal anterior; 2, basal an-teroseptal; 3, basal inferoseptal; 4, basal inferior; 5, basal inferolateral; 6, basal anterolateral; 7, mid anterior; 8, mid aneroseptal; 9, mid inferoseptal; 10, mid inferior; 11, mid inferolateral; 12, mid anterolateral; 13, apical anterior; 14, apical septal; 15, apical inferior; 16, apical lateral.
*Measurements and standard deviations adjusted for unmeasurable regions by mixed effects modeling.†Level-specific means include only levels in which all regions were measurable.
Figure 4. Mean values of left ventricular myocardial thickness (LVMT) per level measured on long axis images and short axis images for 265 participants with a complete set of measurements. Comparison of the measurements obtained per level on short- and long axis images showed a significant difference (P<0.0001). P<0.02 statistically significant after Bonferroni correction.
by guest on July 14, 2018http://circim
aging.ahajournals.org/D
ownloaded from

Kawel et al Normal Left Ventricular Myocardial Thickness 505
measurements were obtained on 3 slices only with a single mea-surement per segment. For the majority of segments as mea-sured on short axis images, values obtained by Dawson et al lie between the average LVMT and the maximum LVMT measured in the current study. Furthermore, variation in measurement technique (Figure 3) will result in some variation in the result-ing values of LVMT. It appears critical to report measurement technique along with the resulting measurement parameters.
Short Axis Versus Long Axis MeasurementsThe short axis has geometric advantages for measuring LVMT at basal and mid-cavity level. In the current study, measurements obtained at the basal and mid-cavity level resulted in a slightly lower LVMT when acquired on short axis images compared with long axis images (6% and 10%, respectively). Greater values of LVMT on long axis versus short axis images may result when long axis images deviate
Table 5. Association of LVMT With Demographic and LV Parameters
Model Variable Mean Difference SE P
Base model Gender, male 1.0 mm 0.11 <0.001
Age, y 0.0002 mm 0.05 0.97
Ethnicity
Chinese −0.1 mm 0.13 0.28
African American 0.3 mm 0.11 <0.01
Hispanic −0.2 mm 0.12 0.037
Height −0.1 mm/cm 0.01 0.14
Weight 0.02 mm/kg 0.004 0.01
Body surface area 1.1 mm/m2 0.25 <0.001
Base model+LVEF LVEF 0.004 mm/% 0.01 0.61
Base model+LVEDV LVEDV −0.01 mm/mL 0.002 <0.01
Base model+LVESV LVESV −0.01 mm/mL 0.004 0.01
Base model+LVSV LVSV −0.01 mm/mL 0.003 <0.05
LV indicates left ventricular; LVEF, left ventricular ejection fraction; LVEDV, left ventricular end-diastolic volume; LVESV, left ventricular end-systolic volume; LVSV, left ventricular stroke volume.
Table 6. Prior Studies Describing Left Ventricular Wall Thickness in Healthy Subjects
Reference N Age, yImaging
Technique Measurement Left Ventricular Myocardial Thickness Mean±SD, mm
Men Women
Sechtem et al8 9 25–34 CMR: 0.35 T Transverse plane 9 ± 1 (posteroseptal); 9 ± 1 (anteroseptal); 10 ± 2 (anterior);9 ± 2 (anterolateral);
10 ± 1 (posterolateral);10 ± 1 (posterior); 6 ± 2 (apical)
Semelka et al10 11 25–55 CMR: 1.5 T, GRE Anterior, inferior, septal and inferior short axis mid-cavity
9.5 ± 1.1
Shub et al5 111 ≥50 Echocardiography Posterior wall 10.2 ± 1.1 9.2 ± 0.9
Buller et al6 20 21–78 CMR: 0.5 T/1.5 T, GRE
Short axis 10.0 ± 0.24 (basal); 10.5 ± 0.35 (mid-cavity); 12.8 ± 0.41 (apical)
Salton et al12 318 Mean: 56.7 (men), 57.7 (women)
CMR: 1.5 T, GRE Posterior wall, short axis basal to the tips of the papillary muscles
9.9 8.7
Stolzmann et al16 120 40–70 CT Septal and posterior short axis at chorda level
9 ± 2 (posterior)9 ± 2 (septal)
8 ± 2 (posterior)8 ± 1 (septal)
Nikitin et al17 95 22–91 CMR: 1.5 T, GRE Whole myocardium short axis
8.0 ± 1.0 (<65 y)8.6 ± 1.2 (≥65 y)
7.0 ± 0.8 (<65 y) 6.8 ± 0.7 (≥65 y)
Dawson et al11 120 20–80 CMR: 1.5 T, SSFP Per segment, short axis 8.8 (basal)7.7 (mid-cavity)6.6 (apical)
7.2 (basal) 6.4 (mid-cavity) 6.1 (apical)
Current study 300 54–91 CMR: 1.5 T, SSFP Per region/segment, short and long axis
7.8 ± 1.1 (SAX, basal) 8.3 ± 1.0 (LA, basal) 6.3 ± 1.1 (SAX, mid-cavity) 7.2 ± 1.0 (LA, mid-cavity) 6.4 ± 1.1 (SAX, apical) 5.6 ± 1.0 (LA, apical)
6.4 ± 0.9 (SAX, basal) 6.8 ± 0.9 (LA, basal) 5.3 ± 0.9 (SAX, mid-cavity) 5.9 ± 0.9 (LA, mid-cavity) 5.9 ± 0.9 (SAX, apical) 4.7 ± 0.9 (LA, basal)
CMR indicates cardiac magnetic resonance; GRE, gradient echo; LA, long axis; SAX, short axis; SSFP, steady-state free precession; n, number of subjects included.
by guest on July 14, 2018http://circim
aging.ahajournals.org/D
ownloaded from

506 Circ Cardiovasc Imaging July 2012
from a true midline acquisition. We cross-referenced long axis images on the short axis images, and slight deviations from midline acquisitions were common. This is probably because of respiratory variation between different CMR acquisitions.
Short axis measurements acquired at the apical level are known to overestimate myocardial thickness related to the conical shape of the heart at this level.6,18,19 Because of partial volume averaging, short axis images show less distinct myo-cardial borders compared with long axis images at the same level (Figure 5, Tables 3 and 4). In the current study, short axis measurements of LVMT were on average 20% thicker com-pared with long axis images at the same level (Figures 4 and 5).
Association of LVMT With Demographic and LV ParametersMen have a higher LV myocardial mass compared with women even after adjustment for height and weight or BSA.4,20–22 In addition, myocardial thickness has been shown to be higher in men compared with women.11,12 In this study, mean LVMT was ≈1 mm greater for men than women (1.0 mm; P<0.001, adjusted for body size).
In large population-based trials such as Multi-Ethnic Study of Atherosclerosis, the Dallas Heart Study, and Coronary Artery Risk Development in Young Adults (CARDIA), myocardial mass has been shown to be higher in blacks compared with whites.21,23,24 Detailed evaluation of normal myocardial
thickness has not been previously studied. In the current study, black ethnicity was associated with a higher LVMT but the difference was small (0.3 mm; P<0.01).
We observed only slight variations of LVMT with body size. Height was not related to LVMT, but there was a 0.2 mm greater LVMT per 10 kg increase in weight. Furthermore, an increase in BSA by 0.1 m2 was associated with an increase in myocardial thickness of ≈0.1 mm. In contrast, BSA shows a strong relationship to LV mass.
In 336 normotensive adults, Hees et al25 showed an increase in LVMT in women whereas in men LVMT was unrelated to age. Dawson et al11 studied the relationship between compact and noncompact myocardium. They described an increase in myocardial thickness with age starting after the fourth decade in 120 healthy volunteers; gender differences are not mentioned. In the current study, there was no relationship of mean LVMT with age for both men and women between 55 and 74 years. LVMT showed small changes in relationship to variations in LV volumes (eg, a decrease in left ventricular end-diastolic vol-ume, LVESV, and left ventricular stroke volume, respectively, of 10 mL was associated with a 0.1-mm higher LVMT).
Intra- and Interobserver AgreementThe lower agreement for measurements obtained on short axis images compared with long axis images results mainly from
Figure 5. Cine steady-state free precession (SSFP) image at end-diastole acquired as 4 chamber view (A and C) and short axis view (B and D). The white line in A indicates the acquisition plane of the short axis image B and the white line in C corresponds to the acqui-sition plane of the short axis image D. On long axis images (A and C) endo- and epicardial border of the myocardium are clearly delin-eated at all levels while on short axis images of the apical level (B and D) myocardial borders are poorly defined and myocardial thickness appears greater compared with long axis.
by guest on July 14, 2018http://circim
aging.ahajournals.org/D
ownloaded from
Kawel et al Normal Left Ventricular Myocardial Thickness 507
the lower agreement for measurements obtained at the api-cal level related to the blurred contours that result from the conical shape of the heart at the apical level (Figure 5). We suggest measuring myocardial thickness at the apical level on long axis images only.
The results of the current study are clinically relevant for establishing the diagnosis of common disorders such as hypertensive cardiomyopathy or HCM. Focal hypertrophy is common. Of 333 consecutive HCM patients, focal HCM (≤2 segments affected) was present in 41 (12%) patients and intermediate HCM (3–7 segments affected) was present in 122 (34%) patients.26 Per segment thresholds for hypertrophy may be useful in such cases.
A limitation of the current study is that the results are pri-marily relevant to adults between 55 and 74 years of age. In addition, we defined a normal study participant based primar-ily on clinical characteristics, combined with absence of focal myocardial scar on delayed gadolinium-enhanced CMR.
In conclusion, normal values for LVMT are presented for middle-aged and older subjects. For clinical decisions and abnormalities of focal hypertrophic phenotypes, measurement technique, gender, race, body size, and LV function should be taken into consideration.
AcknowledgmentsThe authors thank the other investigators, the staff, and the par-ticipants of the Multi-Ethnic Study of Atherosclerosis (MESA) study for their valuable contributions. A full list of partici-pating MESA investigators and institutions can be found at http://www.mesa-nhlbi.org.
Sources of FundingThis research was supported by the intramural research program of the National Institutes of Health and contracts N01-HC-95159 through N01-HC-95169 from the National Heart, Lung, and Blood Institute.
DisclosuresDr Prince has patent agreements with General Electric, Siemens, Philips, Toshiba, and Hitachi and received payment for speakers’ bu-reau appointments from Bayer. Dr van der Geest is a consultant for Medis medical imaging systems.
References 1. Li W, Stern JS, Mai VM, Pierchala LN, Edelman RR, Prasad PV. MR
assessment of left ventricular function: quantitative comparison of fast imaging employing steady-state acquisition (FIESTA) with fast gradient echo cine technique. J Magn Reson Imaging. 2002;16:559–564.
2. Thiele H, Nagel E, Paetsch I, Schnackenburg B, Bornstedt A, Kouwen-hoven M, Wahl A, Schuler G, Fleck E. Functional cardiac MR imaging with steady-state free precession (SSFP) significantly improves endocar-dial border delineation without contrast agents. J Magn Reson Imaging. 2001;14:362–367.
3. Malayeri AA, Johnson WC, Macedo R, Bathon J, Lima JA, Bluemke DA. Cardiac cine MRI: Quantification of the relationship between fast gradi-ent echo and steady-state free precession for determination of myocardial mass and volumes. J Magn Reson Imaging. 2008;28:60–66.
4. Alfakih K, Plein S, Thiele H, Jones T, Ridgway JP, Sivananthan MU. Nor-mal human left and right ventricular dimensions for MRI as assessed by turbo gradient echo and steady-state free precession imaging sequences. J Magn Reson Imaging. 2003;17:323–329.
5. Shub C, Klein AL, Zachariah PK, Bailey KR, Tajik AJ. Determination of left ventricular mass by echocardiography in a normal population: effect of age and sex in addition to body size. Mayo Clin Proc. 1994;69:205–211.
6. Buller VG, van der Geest RJ, Kool MD, van der Wall EE, de Roos A, Reiber JH. Assessment of regional left ventricular wall parameters from short axis magnetic resonance imaging using a three-dimensional extension to the improved centerline method. Invest Radiol. 1997;32:529–539.
7. Fisher MR, von Schulthess GK, Higgins CB. Multiphasic cardiac mag-netic resonance imaging: normal regional left ventricular wall thickening. AJR Am J Roentgenol. 1985;145:27–30.
8. Sechtem U, Sommerhoff BA, Markiewicz W, White RD, Cheitlin MD, Higgins CB. Regional left ventricular wall thickening by magnetic reso-nance imaging: evaluation in normal persons and patients with global and regional dysfunction. Am J Cardiol. 1987;59:145–151.
9. Haag UJ, Hess OM, Maier SE, Jakob M, Liu K, Meier D, Jenni R, Boesiger P, Anliker M, Krayenbuehl HP. Left ventricular wall thickness measurements by magnetic resonance: a validation study. Int J Card Imag-ing. 1991;7:31–41.
10. Semelka RC, Tomei E, Wagner S, Mayo J, Kondo C, Suzuki J, Caputo GR, Higgins CB. Normal left ventricular dimensions and function: inter-study reproducibility of measurements with cine MR imaging. Radiology. 1990;174(3 Pt 1):763–768.
11. Dawson DK, Maceira AM, Raj VJ, Graham C, Pennell DJ, Kilner PJ. Re-gional thicknesses and thickening of compacted and trabeculated myocar-dial layers of the normal left ventricle studied by cardiovascular magnetic resonance. Circ Cardiovasc Imaging. 2011;4:139–146.
12. Salton CJ, Chuang ML, O’Donnell CJ, Kupka MJ, Larson MG, Kissinger KV, Edelman RR, Levy D, Manning WJ. Gender differences and normal left ventricular anatomy in an adult population free of hypertension. A cardiovascular magnetic resonance study of the Framingham Heart Study Offspring cohort. J Am Coll Cardiol. 2002;39:1055–1060.
13. Bild DE, Bluemke DA, Burke GL, Detrano R, Diez Roux AV, Folsom AR, Greenland P, Jacob DR Jr, Kronmal R, Liu K, Nelson JC, O’Leary D, Saad MF, Shea S, Szklo M, Tracy RP. Multi-ethnic study of atherosclerosis: objectives and design. Am J Epidemiol. 2002;156:871–881.
14. Cerqueira MD, Weissman NJ, Dilsizian V, Jacobs AK, Kaul S, Laskey WK, Pennell DJ, Rumberger JA, Ryan T, Verani MS; American Heart Associa-tion Writing Group on Myocardial Segmentation and Registration for Car-diac Imaging. Standardized myocardial segmentation and nomenclature for tomographic imaging of the heart: a statement for healthcare professionals from the Cardiac Imaging Committee of the Council on Clinical Cardiol-ogy of the American Heart Association. Circulation. 2002;105:539–542.
15. Fischbach R, Juergens KU, Ozgun M, Maintz D, Grude M, Seifarth H, Heindel W, Wichter T. Assessment of regional left ventricular function with multidetector-row computed tomography versus magnetic resonance imaging. Eur Radiol. 2007;17:1009–1017.
16. Stolzmann P, Scheffel H, Leschka S, Schertler T, Frauenfelder T, Kaufmann PA, Marincek B, Alkadhi H. Reference values for quantitative left ventricular and left atrial measurements in cardiac computed tomogra-phy. Eur Radiol. 2008;18:1625–1634.
17. Nikitin NP, Loh PH, de Silva R, Witte KK, Lukaschuk EI, Parker A, Farnsworth TA, Alamgir FM, Clark AL, Cleland JG. Left ventricular mor-phology, global and longitudinal function in normal older individuals: a cardiac magnetic resonance study. Int J Cardiol. 2006;108:76–83.
18. Beyar R, Shapiro EP, Graves WL, Rogers WJ, Guier WH, Carey GA, Soulen RL, Zerhouni EA, Weisfeldt ML, Weiss JL. Quantification and validation of left ventricular wall thickening by a three-dimensional volume element magnetic resonance imaging approach. Circulation. 1990;81:297–307.
19. Lima JA, Jeremy R, Guier W, Bouton S, Zerhouni EA, McVeigh E, Bu-chalter MB, Weisfeldt ML, Shapiro EP, Weiss JL. Accurate systolic wall thickening by nuclear magnetic resonance imaging with tissue tagging: correlation with sonomicrometers in normal and ischemic myocardium. J Am Coll Cardiol. 1993;21:1741–1751.
20. Marcus JT, DeWaal LK, Götte MJ, van der Geest RJ, Heethaar RM, Van Rossum AC. MRI-derived left ventricular function parameters and mass in healthy young adults: relation with gender and body size. Int J Card Imaging. 1999;15:411–419.
21. Natori S, Lai S, Finn JP, Gomes AS, Hundley WG, Jerosch-Herold M, Pearson G, Sinha S, Arai A, Lima JA, Bluemke DA. Cardiovascular func-tion in multi-ethnic study of atherosclerosis: normal values by age, sex, and ethnicity. AJR Am J Roentgenol. 2006;186(6 Suppl 2):S357–S365.
22. Sandstede J, Lipke C, Beer M, Hofmann S, Pabst T, Kenn W, Neubauer S, Hahn D. Age- and gender-specific differences in left and right ventricular cardiac function and mass determined by cine magnetic resonance imag-ing. Eur Radiol. 2000;10:438–442.
23. Drazner MH, Dries DL, Peshock RM, Cooper RS, Klassen C, Kazi F, Willett D, Victor RG. Left ventricular hypertrophy is more prevalent in
by guest on July 14, 2018http://circim
aging.ahajournals.org/D
ownloaded from
508 Circ Cardiovasc Imaging July 2012
blacks than whites in the general population: the Dallas Heart Study. Hy-pertension. 2005;46:124–129.
24. Gardin JM, Wagenknecht LE, Anton-Culver H, Flack J, Gidding S, Ku-rosaki T, Wong ND, Manolio TA. Relationship of cardiovascular risk fac-tors to echocardiographic left ventricular mass in healthy young black and white adult men and women. The CARDIA study. Coronary Artery Risk Development in Young Adults. Circulation. 1995;92:380–387.
25. Hees PS, Fleg JL, Lakatta EG, Shapiro EP. Left ventricular remodeling with age in normal men versus women: novel insights using three-dimen-sional magnetic resonance imaging. Am J Cardiol. 2002;90:1231–1236.
26. Maron MS, Maron BJ, Harrigan C, Buros J, Gibson CM, Olivotto I, Biller L, Lesser JR, Udelson JE, Manning WJ, Appelbaum E. Hypertro-phic cardiomyopathy phenotype revisited after 50 years with cardiovascu-lar magnetic resonance. J Am Coll Cardiol. 2009;54:220–228.
CLINICAL PERSPECTIVELeft ventricular myocardial thickness is altered in certain cardiomyopathies. In some conditions, such as hypertrophic cardiomyopathy, left ventricular myocardial thickness is the major imaging factor used in establishing the presence or absence of disease. In this study, we determined that normal myocardial thickness varies with myocardial region/segment. In addition, the image acquisition plane may affect measurement of myocardial wall thickness. This study provides normal left ventricular myocardial thickness by region/segment as measured in both the short and long axis acquisition planes. Our results indicate that gender-specific cutoffs that vary by myocardial region/segment may be defined to help establish the pres-ence or absence of disease. In addition, body size, ethnicity, and left ventricular function affect left ventricular myocardial thickness measurements.
by guest on July 14, 2018http://circim
aging.ahajournals.org/D
ownloaded from
Lima and David A. BluemkeHundley, Craig Johnson, Sofia C. Masri, Martin R. Prince, Rob J. van der Geest, João A.C.
Nadine Kawel, Evrim B. Turkbey, J. Jeffrey Carr, John Eng, Antoinette S. Gomes, W. GregoryAtherosclerosis
Steady-State Free Precession Cardiac Magnetic Resonance: The Multi-Ethnic Study of Normal Left Ventricular Myocardial Thickness for Middle-Aged and Older Subjects With
Print ISSN: 1941-9651. Online ISSN: 1942-0080 Copyright © 2012 American Heart Association, Inc. All rights reserved.
Dallas, TX 75231is published by the American Heart Association, 7272 Greenville Avenue,Circulation: Cardiovascular Imaging
doi: 10.1161/CIRCIMAGING.112.9735602012;5:500-508; originally published online June 15, 2012;Circ Cardiovasc Imaging.
http://circimaging.ahajournals.org/content/5/4/500World Wide Web at:
The online version of this article, along with updated information and services, is located on the
http://circimaging.ahajournals.org//subscriptions/
is online at: Circulation: Cardiovascular Imaging Information about subscribing to Subscriptions:
http://www.lww.com/reprints Information about reprints can be found online at: Reprints:
document. Permissions and Rights Question and Answer information about this process is available in the
requested is located, click Request Permissions in the middle column of the Web page under Services. FurtherCenter, not the Editorial Office. Once the online version of the published article for which permission is being
can be obtained via RightsLink, a service of the Copyright ClearanceCirculation: Cardiovascular Imagingin Requests for permissions to reproduce figures, tables, or portions of articles originally publishedPermissions:
by guest on July 14, 2018http://circim
aging.ahajournals.org/D
ownloaded from