NORD POOL Market Integration: Nordic Countries APEx 2003 Conference, Catagena de Indias –...
20
NORD POOL Market Integration: Nordic Countries APEx 2003 Conference, Catagena de Indias – Colombia, October 14 & 15 -2003 Torger Lien, President & CEO Nord Pool ASA
-
Upload
arleen-carroll -
Category
Documents
-
view
215 -
download
1
Transcript of NORD POOL Market Integration: Nordic Countries APEx 2003 Conference, Catagena de Indias –...

NORD POOL
Market Integration: Nordic Countries
APEx 2003 Conference, Catagena de Indias – Colombia, October 14 & 15 -2003
Torger Lien, President & CEO Nord Pool ASA

Copyright Nord Pool ASA 2002
Regional challenges
4 Countries 4 Governments with changing policy 4 Legislations 4 Regulators and FSA’s 5 TSO’s 5 Grid’s with reasonably good connections
AND ONE MARKET

Copyright Nord Pool ASA 2002
1996Norway, Sweden
Nord Pool
1993Norway
StatnettMarked
Development of the Exchange Area for Elspot Development of the Exchange Area for Elspot
1 October 2000Norway, Sweden
Finland and Denmark
Nord Pool
1 July 1999Norway, Sweden
Finland, West Denmark
Nord Pool
Nord Pool
15 June 1998Norway, Sweden,
Finland
Now all the Nordic countries are part of Elspot and hourly border trade towards the continent works more efficient than before!
1. Brief info about the Nord Pool Group
Copyright Nord Pool ASA 2002
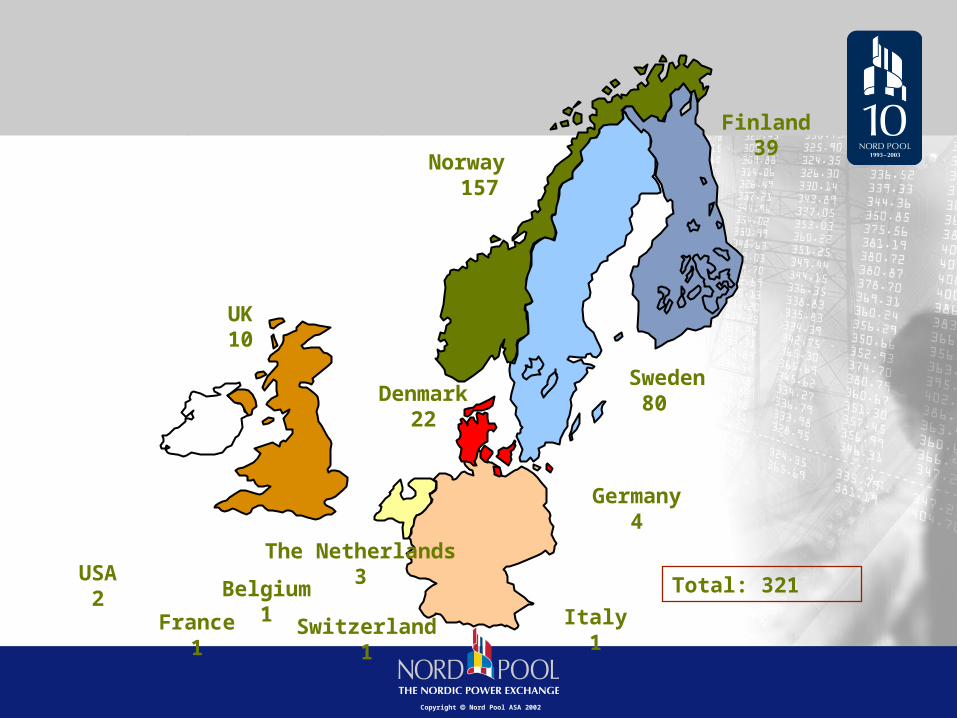
Nord Pool’s Participants February 2003 (Legal Entities)
Total: 321
Norway 157
Finland39
Sweden80
UK10
Germany4
The Netherlands3
Denmark22
USA2
Switzerland1
France1
Italy1
Belgium1
Copyright Nord Pool ASA 2002
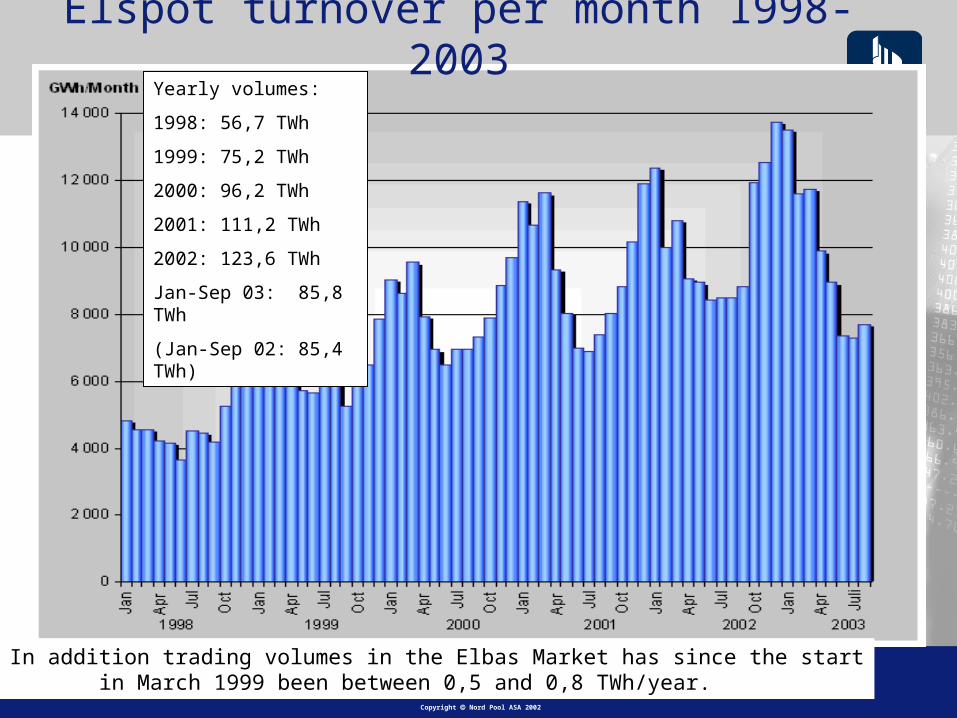
Yearly volumes:
1998: 56,7 TWh
1999: 75,2 TWh
2000: 96,2 TWh
2001: 111,2 TWh
2002: 123,6 TWh
Jan-Sep 03: 85,8 TWh
(Jan-Sep 02: 85,4 TWh)
Elspot turnover per month 1998-2003
Note: In addition trading volumes in the Elbas Market has since the start in March 1999 been between 0,5 and 0,8 TWh/year.

Elspot System price 1993 - Sep 2003 in NOK/MWh per month (1 EUR currently approx. equal to 8,10 NOK)
0
50
100
150
200
250
300
350
400
450
500
550
jan-
93m
ar-9
3m
aj-9
3ju
l-93
sep-
93no
v-93
jan-
94m
ar-9
4m
aj-9
4ju
l-94
sep-
94no
v-94
jan-
95m
ar-9
5m
aj-9
5ju
l-95
sep-
95no
v-95
jan-
96m
ar-9
6m
aj-9
6ju
l-96
sep-
96no
v-96
jan-
97m
ar-9
7m
aj-9
7ju
l-97
sep-
97no
v-97
jan-
98m
ar-9
8m
aj-9
8ju
l-98
sep-
98no
v-98
jan-
99m
ar-9
9m
aj-9
9ju
l-99
sep-
99no
v-99
jan-
00m
ar-0
0m
aj-0
0ju
l-00
sep-
00no
v-00
jan-
01m
ar-0
1m
aj-0
1ju
l-01
sep-
01no
v-01
jan-
02m
ar-0
2m
aj-0
2ju
l-02
sep-
02no
v-02
jan-
03m
ar-0
3m
aj-0
3ju
l-03
sep-
03
Average System Price 93: 80,27 94: 182,67 95: 117,67 96: 253,6397: 135,00 98: 116,3599: 112,11 00: 103,3301: 186,49 02: 201,03Jan-Sep 03: 293,98

Copyright Nord Pool ASA 2002
System Operators’ (TSOs) vs. the Nord Pool Group’s roles in the Nordic Power Market
Regulating service•Balancing between productionand consumption real-time•Balance settlement of BRCsafterwards on measured and reported values
The Spot MarketPhysical deliveryPlanned balanceHourly contractsElspot (and Elbas)Run by Nord Pool Spot AS
Clearing services run by Nord Pool Clearing ASA
The Financial MarketPrice hedging (for physical Spot)Risk ManagementFinancial contractsElspot prices underlying productsDaily--yearly contracts, OptionsRun by Nord Pool ASA
Within the hourWithin the hour The next dayThe next day Next day up to four years aheadNext day up to four years ahead
The Nordic Power Exchange - Nord PoolSystem Operator (TSO) Trading and Clearing – physical and financial
Copyright Nord Pool ASA 2002
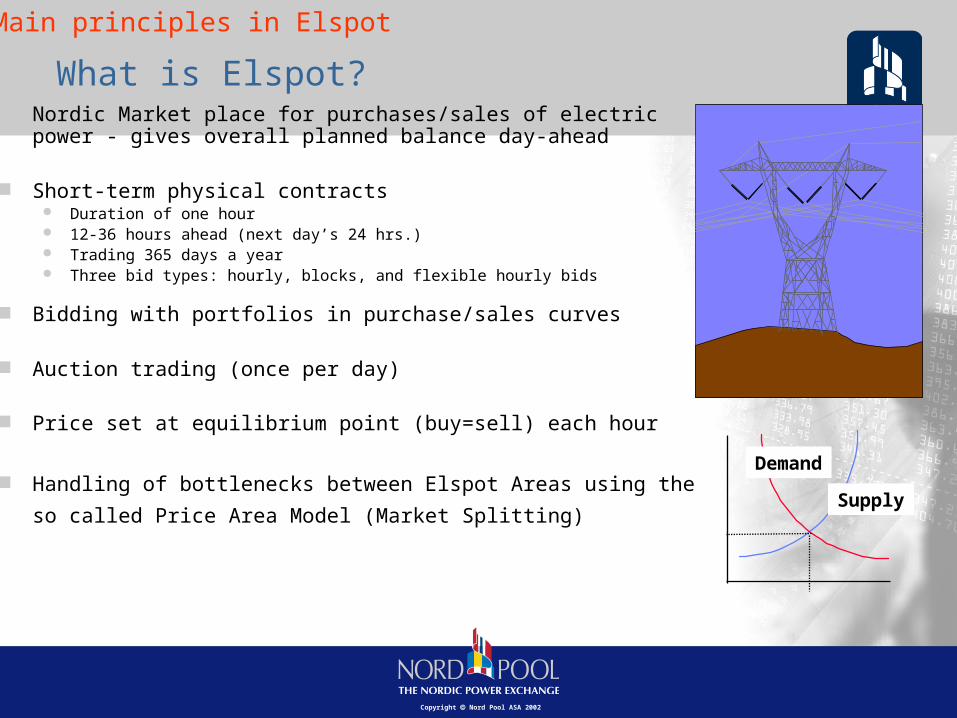
What is Elspot? Nordic Market place for purchases/sales of electric power -
gives overall planned balance day-ahead
Short-term physical contracts Duration of one hour 12-36 hours ahead (next day’s 24 hrs.) Trading 365 days a year Three bid types: hourly, blocks, and flexible hourly bids
Bidding with portfolios in purchase/sales curves
Auction trading (once per day)
Price set at equilibrium point (buy=sell) each hour
Handling of bottlenecks between Elspot Areas using the so
called Price Area Model (Market Splitting)
Demand
Supply
2. Main principles in Elspot
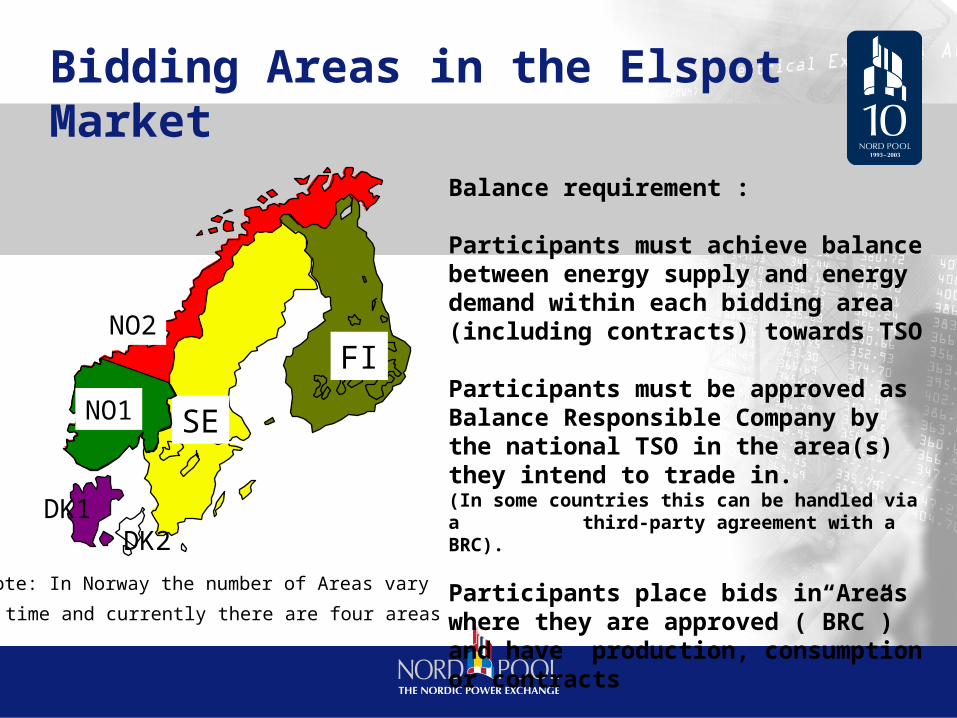
Balance requirement :
Participants must achieve balance between energy supply and energy demand within each bidding area (including contracts) towards TSO
Participants must be approved as Balance Responsible Company by the national TSO in the area(s) they intend to trade in. (In some countries this can be handled via a third-party agreement with a BRC).
Participants place bids in Areas where they are approved (”BRC”) and have production, consumption or contracts
Bidding Areas in the Elspot Market
SE
FIE
DK1DK2
NO1
NO2
Note: In Norway the number of Areas vary
over time and currently there are four areas
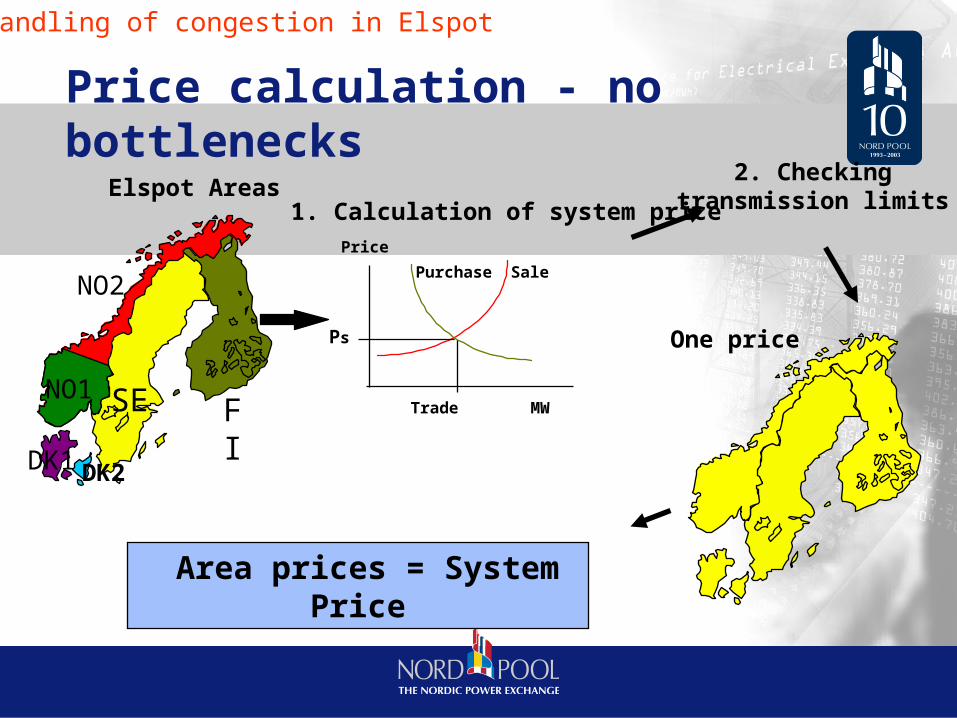
Price calculation - no bottlenecks
Elspot Areas
Area prices = System Price
2. Checkingtransmission limits
MW
Purchase Sale
Ps
Trade
1. Calculation of system pricePrice
One price
SE FIE
DK1
NO1
NO2
DK2
3. Handling of congestion in Elspot

Copyright Nord Pool ASA 2002
3. Calculation of different Elspot area prices(iterative process)
Flow at System Price above capacity, thus different prices
Physical power flow
1. System price calculation
Purchase Sell
Ps
2. Checking transmission limitsElspot Areas
SE FIE
DK1
NO1
NO2
DK2
Price calculation - with bottlenecks
Copyright Nord Pool ASA 2002
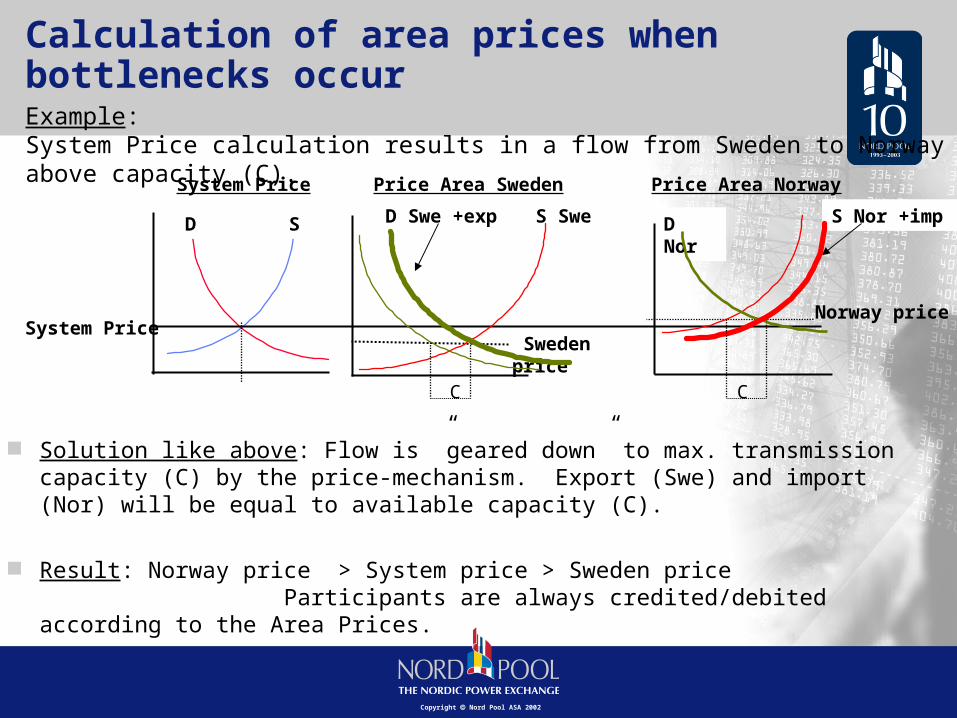
Calculation of area prices when bottlenecks occur
D S
Sweden price
D Swe +exp S Swe D Nor
S Nor +imp
Solution like above: Flow is ”geared down” to max. transmission capacity (C) by the price-mechanism. Export (Swe) and import (Nor) will be equal to available capacity (C).
Result: Norway price > System price > Sweden price
Participants are always credited/debited according to the Area Prices.
System Price
Example: System Price calculation results in a flow from Sweden to Norway above capacity (C).
Norway price
System Price Price Area Sweden Price Area Norway
C C

Copyright Nord Pool ASA 2002
0
50
100
150
200
250
300
350
400
450
500
550
600
650
700
750Oslo
Stockholm
System
NOK/MWh
Elspot prices for Oslo, Stockholm and System 1996 - 2003
Copyright Nord Pool ASA 2002
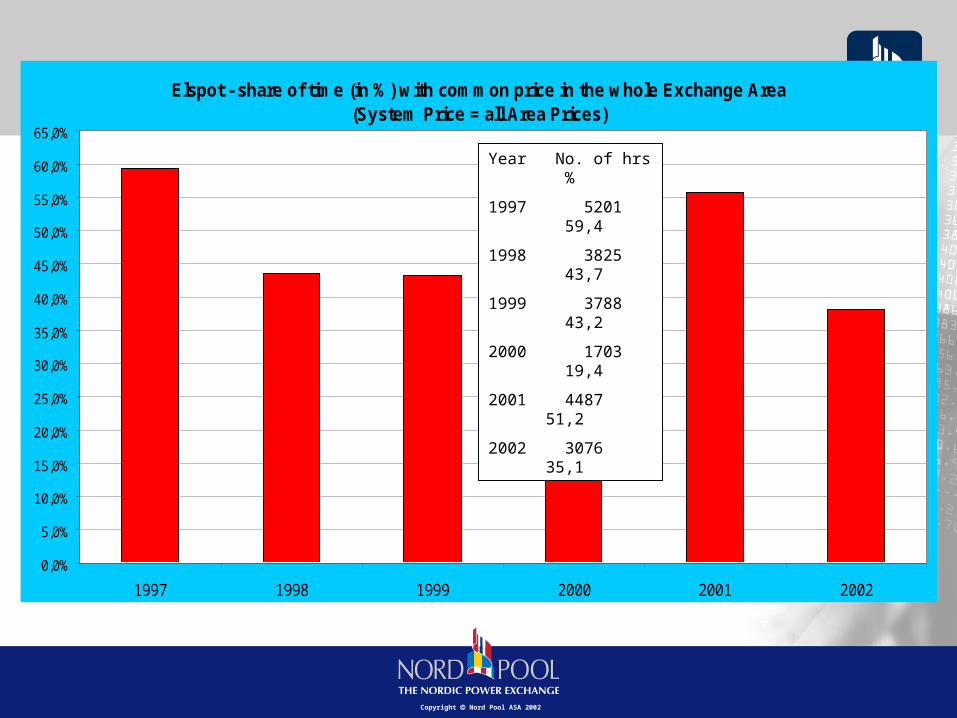
Elspot - share of time (in %) with common price in the whole Exchange Area(System Price = all Area Prices)
0,0%
5,0%
10,0%
15,0%
20,0%
25,0%
30,0%
35,0%
40,0%
45,0%
50,0%
55,0%
60,0%
65,0%
1997 1998 1999 2000 2001 2002
Year No. of hrs %
1997 5201 59,4
1998 3825 43,7
1999 3788 43,2
2000 1703 19,4
2001 4487 51,2
2002 3076 35,1

Copyright Nord Pool ASA 2002
Elspot’s Price Area Model - ”Market Splitting”
Allocates transmission capacity based on the energy bids, thus Elspot is a simultaneous energy and capacity auction
Results in energy flows according to price signals (flow from low high price)
Opens up national and international trading for all types of companies
Bilateral contracts between parties in different countries can easily be agreed upon and then reflected in Elspot bids (buy/sell) per bidding area
Reduces market power because the model connects areas/countries and importantly it is done in a non-discriminatory fashion
4. Possibilities and limits for usage in other countries and regions

Copyright Nord Pool ASA 2002
Isolated markets
Bilateral agreements
Long-term auctions
Daily auctions
Nord Pool Model (Market splitting)
Integrated market
Various ways of handling cross-border Power trading and congestion
Copyright Nord Pool ASA 2002
Nord Pool
OMEL
UKPX,APX
APX
EEX
Gielda Energii
Powernext
Borzen
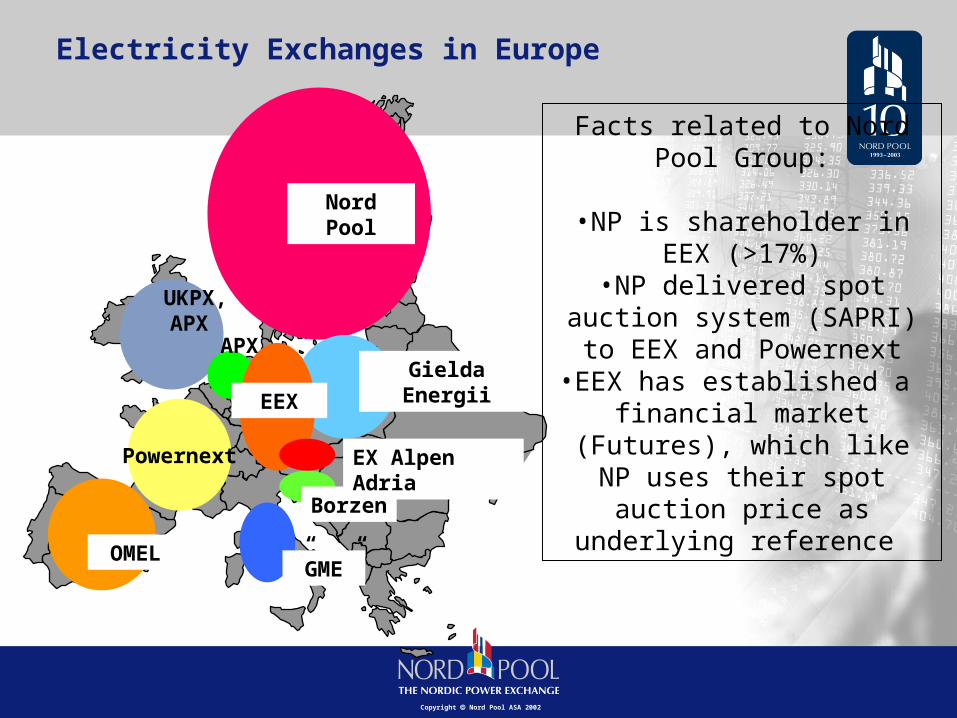
Electricity Exchanges in Europe
EX Alpen Adria
”GME”
Facts related to Nord Pool Group:
•NP is shareholder in EEX (>17%)•NP delivered spot auction system (SAPRI) to EEX and Powernext•EEX has established a financial market (Futures), which like NP uses their spot auction price as
underlying reference
Copyright Nord Pool ASA 2002
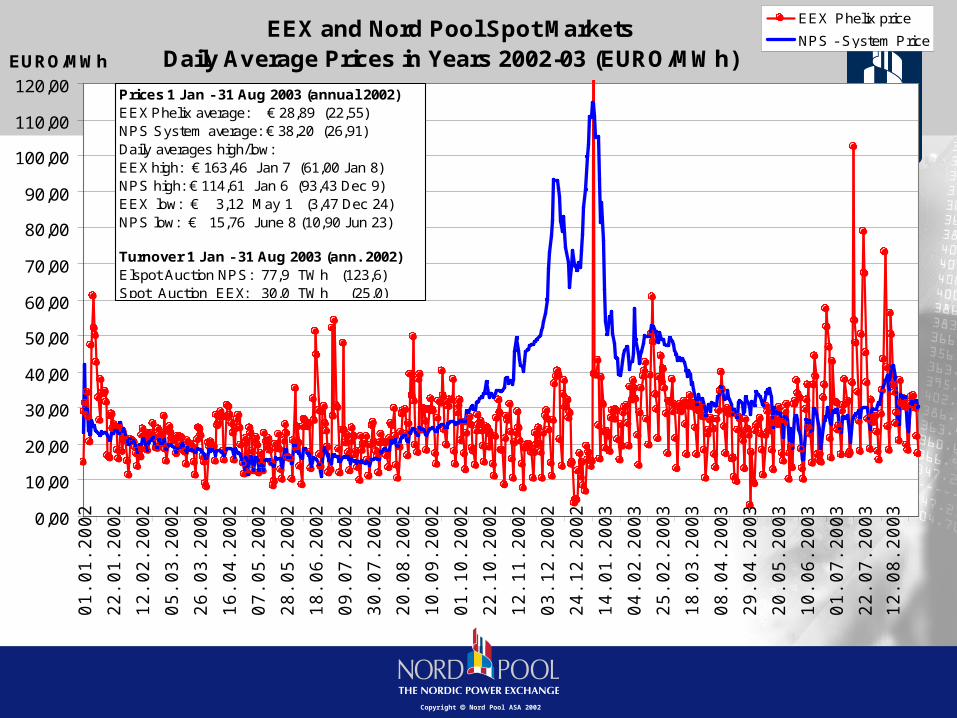
EEX and Nord Pool Spot Markets Daily Average Prices in Years 2002-03 (EURO/MWh)
0,00
10,00
20,00
30,00
40,00
50,00
60,00
70,00
80,00
90,00
100,00
110,00
120,000
1.0
1.2
00
2
22
.01
.20
02
12
.02
.20
02
05
.03
.20
02
26
.03
.20
02
16
.04
.20
02
07
.05
.20
02
28
.05
.20
02
18
.06
.20
02
09
.07
.20
02
30
.07
.20
02
20
.08
.20
02
10
.09
.20
02
01
.10
.20
02
22
.10
.20
02
12
.11
.20
02
03
.12
.20
02
24
.12
.20
02
14
.01
.20
03
04
.02
.20
03
25
.02
.20
03
18
.03
.20
03
08
.04
.20
03
29
.04
.20
03
20
.05
.20
03
10
.06
.20
03
01
.07
.20
03
22
.07
.20
03
12
.08
.20
03
EURO/MWh
EEX Phelix price
NPS - System Price
Prices 1 Jan - 31 Aug 2003 (annual 2002)EEX Phelix average: € 28,89 (22,55) NPS System average: € 38,20 (26,91) Daily averages high/low: EEX high: € 163,46 Jan 7 (61,00 Jan 8)NPS high: € 114,61 Jan 6 (93,43 Dec 9)EEX low: € 3,12 May 1 (3,47 Dec 24)NPS low: € 15,76 June 8 (10,90 Jun 23)
Turnover 1 Jan - 31 Aug 2003 (ann. 2002)Elspot Auction NPS: 77,9 TWh (123,6)Spot Auction EEX: 30,0 TWh (25,0)

Copyright Nord Pool ASA 2002
European integration ?
Market areas to be connected Real competition on supply and demand Harmonised legislation and regulatory framework Equal knowledge to price sensitive information Harmonisation between regulators and / or common
regulator Sincere political willingness to implement a common
market

www.nordpool.com
For further information, please visit:


![Indias Future[571]](https://static.fdocuments.us/doc/165x107/577d35651a28ab3a6b905299/indias-future571.jpg)