NOR ILIA ANISA BINTI ARIS - Institutional...
171
DEMULSIFICATION OF WATER-IN- OIL (W/O) EMULSION BY MICROWAVE HEATING TECHNOLOGY NOR ILIA ANISA BINTI ARIS MASTER OF ENGINEERING IN CHEMICAL UNIVERSITI MALAYSIA PAHANG
-
Upload
trannguyet -
Category
Documents
-
view
218 -
download
0
Transcript of NOR ILIA ANISA BINTI ARIS - Institutional...

DEMULSIFICATION OF WATER-IN- OIL (W/O)
EMULSION BY MICROWAVE HEATING TECHNOLOGY
NOR ILIA ANISA BINTI ARIS
MASTER OF ENGINEERING IN CHEMICAL
UNIVERSITI MALAYSIA PAHANG

UNIVERSITI MALAYSIA PAHANG
CENTER FOR GRADUATE STUDIES
We certify that the thesis entitled “Demulsification of Water-in-Oil (W/O) Emulsion
via Microwave Heating Technology” is written by Nor Ilia Anisa Binti Aris. We
have examined the final copy of this thesis and in our opinion; it is fully adequate in
terms of scope and quality for the award of the degree of Master of Engineering in
Chemical. We herewith recommend that it be accepted in fulfillment of the
requirements for the degree of Master of Engineering specializing in Chemical.
Name of External Examiner Signature
Institution:
Name of Internal Examiner Signature
Institution:
DEMULSIFICATION OF WATER-IN-OIL (W/O) EMULSION BY MICROWAVE
HEATING TECHNOLOGY
NOR ILIA ANISA BINTI ARIS
A thesis submitted in fulfillment of the requirements
for the award of the degree of
Master Engineering of Chemical
Faculty of Chemical and Natural Resource Engineering
UNIVERSITI MALAYSIA PAHANG
FEBRUARY 2011

STATEMENT OF AWARD FOR DEGREE
1. Master of Engineering (by research)
Thesis submitted in fulfilment of the requirements for the award of the degree of Master of
Engineering in Chemicals

SUPERVISOR’S DECLARATION
I hereby declare that I have checked this thesis and in my opinion, this thesis is adequate in
terms of scope and quality for the award of the degree of Master of Engineering in
Chemical
Signature:
Name of Supervisor: ASSOCIATE PROF. DR. ABDURAHMAN HAMID NOUR
Position: LECTURER IN FACULTY OF CHEMICAL EMGINEERING AND
NATURAL RESOURCES
Date:

STUDENT’S DECLARATION
I hereby declare that the work in this thesis is my own except for quotations and summaries
which have been duly acknowledged. The thesis has not been accepted for any degree and
is not concurrently submitted for award of other degree.
Signature
Name: NOR ILIA ANISA BINTI ARIS
ID Number: MKC09001
Date:

To my beloved parents, brothers, sisters, fiance, lecturers and friends

ABSTRACT
Traditional ways of breaking emulsion using heat and chemicals are
disadvantageous from both economic and environmental perspectives. In this thesis, the
potentials of microwave technology in demulsification of water-in-oil emulsion is
investigated. The work began with some characterisation studies to provide understandings
of fundamental issues such as formation, formulation and breaking of emulsions by both
chemical and microwave approaches. The aim was to obtain optimised operating condition
as well as fundamental understanding of water-in-oil stability, upon which further
developments on demulsification processes could be developed. The stability studies were
carried out by analysing operating conditions such as stirring time, types of surfactant used,
temperature, phase inversion, water-oil-ratio (10-90%) and stirring intensity. In this study,
also for microwave and chemical demulsification performance tests, three crude oils,
namely crude oil A, B and C were utilised. These crude oils were obtained from Petronas
Penapisan Melaka, Malaysia. Among of these oils, crude oil C was found to be the heaviest
and best for stability and followed by crude oil A and B, respectively. Results also showed
that microwave heating of emulsions is advantageous as it was faster and more uniform. A
microwave-assisted chemical system was then developed in crude oil A and C, and then
successfully applied on demulsification of water-in-oil emulsions. Its performance was
compared with conventional demulsification methods such as hotplate, chemical
demulsifiers and gravity separation. For microwave irradiation, it was found that the
microwave power was proportional to the volume rate of heat generation, rate of
temperature increases, wavelength and penetration depth, while the volume fraction is
proportional to dielectric properties and inversely proportional to the penetration depth and
wavelength. In optimisation part, crude oil A and C obtained 23 factorial designs with
microwave power, microwave processing time and demulsifier concentration. The
percentage of water separated from the model crude oil A was 45.10% at 710 watt in 2.40
minutes with 0.15 wt% demulsifier, while for crude oil C was 38.03% at 767 watt in 2.50
minutes with 0.14 wt% demulsifier, respectively. Crude oil B acquired 22 factorial design
with microwave power and time processing; the percentage of water separated was 64.07%
at 692 watt in 2.56 minutes. The results obtained in this study have exposed the capability
of microwave technology in demulsification of water-in-oil emulsion. Further works are
nevertheless required to provide deeper understanding the mechanisms involved to
facilitate the development of an optimum system applicable to the industry.

ABSTRAK
Kaedah tradisional dalam memisahkan emulsi menggunakan haba dan bahan kimia
adalah merugikan dari segi ekonomi and alam sekitar. Dalam tesis ini, potensi teknologi
gelombang mikro dalam demulsifikasi oleh air-dalam-minyak emulsi dikaji. Pekerjaan
bermula dengan beberapa kajian mengenai ciri-ciri untuk memberikan pemahaman tentang
isu-isu asas seperti pembentukan, perumusan dan memecahkan emulsi oleh kedua-dua
pendekatan kimia dan gelombang mikro. Tujuannya adalah untuk mendapatkan keadaan
operasi dioptimumkan serta pemahaman dasar air-dalam kestabilan-minyak, atas mana
perkembangan lebih lanjut atas proses demulsification dapat dikembangkan. Pengajian
kestabilan dilakukan dengan menganalisis keadaan operasi seperti waktu pengadukan, jenis
surfaktan yang digunakan, suhu, fasa inversi , nisbah air-minyak (10-90%) dan adukan
intensitas. Dalam kajian ini, juga untuk ujian gelombang mikro dan demulsifikasi kimia,
tiga minyak mentah, dinamakan sebagai minyak mentah A,B dan C telah digunakan.
Minyak mentah ini diperolehi dari Petronas Penapisan Melaka, Malaysia. Di antara minyak
mentah ini, minyak mentah C adalah yang terberat and baik untuk kestabilan dan masing-
masing diikuti oleh minyak mentah A and B. Keputusan juga telah menunjukkan bahawa
pemanasan emulsi oleh gelombang mikro ini menguntungkan kerana lebih cepat dan
seragam. Sebuah sistem gelombang mikro-kimia kemudian dikembangkan di minyak
mentah A dan C, dan kemudiannya berjaya dalam aplikasi ke atas demulsifikasi oleh
emulsi air-dalam-minyak. Prestasinya telah dibandingkan dengan kaedah demulsifikasi
konvensional seperti piring pemanas, demulsifi kimia dan pemisahan graviti. Untuk iridiasi
gelombang mikro, didapati bahawa kuasa gelombang mikro adalah berkadar terus dengan
kadar isipadu oleh generasi haba, kadar peningkatan suhu, panjang gelombang dan
kadalaman penetrasi, manakala fraksi isipadu adalah berkadar terus dengan sifat dielektrik
dan berkadar songsang dengan kedalaman penetrasi dan panjang gelombang. Dalam
bahagian pengoptimuman, minyak mentah A dan C memperolehi 23 rancangan faktorial
dengan kuasa gelombang mikro, masa pemprosesan gelombang mikro dan konsentrasi
demulsifer. Peratusan pemisahan air daripada model minyak mentah A ialah 43.11% pada
710 watt dalam 2.40 minit dengan 0.15 wt% konsentrasi demulsifer, manakala untuk
minyak mentah C ialah 38.03 % pada 767 watt dalam 2.50 minit bersama 0.14 wt%
demulsifer. Minyak mentah B memperolehi 22 rancangan faktorial dengan kuasa
gelombang mikro dan masa memprosesan; peratusan pemisahan air ialah 64.10 % pada 692
watt dalam 2.56 minit. Keputusan yang diperolehi dari kajian ini telah mengembangkan
keupayaan teknologi gelombang mikro dalam demulsifikasi emulsi air-dalam-minyak.
Lebih banyak kerja tetap diperlukan untuk memberikan pemahaman yang lebih dalam
mekanisme yang terlibat untuk memudahkan pembangunan sistem yang optimum yang
sesuai untuk industri.

ACKNOWLEDGEMENT
I would like to express my gratitude to all those who gave me the possibility to
complete this thesis. I am deeply indebted to my supervisor‟s, Associate Professor Dr.
Abdurahman Hamid Nour whose help, inspiring suggestions and encouragement helped me
in all the time of my research.
It is difficult to overstate my gratitude to Petronas Penapisan Melaka for supplying
the crude oil. Also to my former colleagues supported me in my research work. I wish to
extend my warmest thanks to all of them. I am especially grateful to lecturers in Faculty of
Chemical Engineering and Natural Resources by assisting in explaining any difficulty I
faced. My thanks goes also to all people in my group for their direct and indirect assistance
and helpful discussion during my work.
Finally, I owe my loving thanks to my family. Without their love, encouragement
and understanding it would have been impossible for me to finish this work. My deepest
gratitude goes also to my friends for their indefatigable love and support throughout my
life. To all of them I dedicate this thesis.

TABLE OF CONTENTS
Page
TITLE PAGE i
STATEMENT OF AWARD ii
SUPERVISOR’S DECLARATION iii
STUDENT’S DECLARATION iv
DEDICATION v
ACKNOWLEDGEMENTS vi
ABSTRACT vii
ABSTRAK viii
TABLE OF CONTENTS ix
LIST OF TABLES xv
LIST OF FIGURES xvii
LIST OF ABBREVIATIONS xxi
LIST OF NOMECLATURES xxiii
CHAPTER 1 INTRODUCTION 1
1.1 Background of Study 1
1.2 Problem Statement 2
1.3 Definition of Terms 3
1.3.1 Emulsion 3
1.3.2 Demulsification 4
1.3.3 Microwave Irradiation 4
1.4 Operational Definition 5
1.4.1 Microwave 5
1.5 Objectives of Study 5
1.6 Scopes of Study 5
1.7 Significant of Study 6
1.8 Thesis Outline 6
1.9 Summary 7
CHAPTER 2 EMULSION STABILITY 8

2.1 Introduction 8
2.2 Crude Oil Emulsion Composition 8
2.3 Emulsion 10
2.4 Emulsion Formation 10
2.4.1 Physico-chemical Factors Affecting the 11
Formation of Emulsions
2.5 Types of Emulsion 12
2.5.1 Water-in-Oil Emulsion (W/O) 12
2.5.2 Oil-in-Water Emulsion (O/W) 13
2.5.3 Differences Between W/O and O/W Emulsions 13
2.6 Tests for Emulsion Types 13
2.6.1 Dilution Method 13
2.6.2 Electrical Conductivity 14
2.6.3 Staining the Continuous Phase 14
2.7 Emulsion Stability 14
2.7.1 Electrostatic Forces 15
2.7.2 Steric Repulsion 15
2.7.3 Marangoni-Gibbs Effect 16
2.7.4 Thin Film Stabilization 16
2.8 Emulsion and Foam 17
2.9 Emulsion Destabilisation 18
2.9.1 Sedimentation 18
2.9.2 Aggregation 19
2.9.3 Coalescence 19
2.9.4 Ostwald Ripening 20
2.10 Methods of Emulsion Breaking 20
2.10.1 Application of Chemical 20
2.10.2 Application of Thermal Heating 22
2.10.3 Effects of Electric Current 22
2.11 Surfactants 23

2.12 Summary 25
CHAPTER 3 MECHANISMS OF MICROWAVE THEORY 26
3.1 Introduction 26
3.2 Microwave Energy and Materials Interaction 26
3.3 Microwave Properties 29
3.3.1 Dipole Rotation Mechanism 29
3.3.2 Ionic Conduction 30
3.3.3 Dielectric Properties 31
3.3.4 Energy Conversion 32
3.4 Working Equations for Microwave Demulsification 33
Study
3.5 Summary 35
CHAPTER 4 MATERIALS AND METHODS 36
4.1 Introduction 36
4.2 Flow of Study 36
4.3 Material Selection 38
4.3.1 Sample Preparation 38
4.4 Analytical Procedure 39
4.4.1 Physical Characteristics 39
4.4.2 Chemical Characteristics 42
4.5 Demulsification Procedures 46
4.5.1 Microwave Oven 46
4.5.2 Conventional Methods 47
4.6 Data Analysis 48
4.7 Optimisation 48

4.7.1 The method of Factorial Experiment 49
4.7.2 Optimisation Using Response Surface 51
Methodology (RSM)
4.7.3 Evaluating the Model 52
4.8 Summary 52
CHAPTER 5 CRUDE OIL STABILITY 54
5.1 Introduction 54
5.2 Characteristics of Crude oil 54
5.2.1 Physical Properties of Crude oil 54
5.2.2 Chemical Properties of Crude oil 56
5.3 Stability Characteristics of Crude oil Emulsion 59
5.3.1 Effect of Surfactant Concentration Ratio on Stability 59
of Emulsion
5.3.2 Effect of Stirring Intensity (rpm) on Emulsion 61
Stability
5.3.3 Effect Temperature on Emulsion Stability 65
5.4 Other Factors Controlling Emulsion Stability 68
5.4.1 Rheological Properties of W/O Emulsions of 68
Different Dispersed Volume Fractions
5.5 Summary 75
CHAPTER 6 MICROWAVE DEMULSIFICATION STUDY ON 76
WATER-IN-OIL (W/O) EMULSION
6.1 Introduction 76
6.2 Experimental Results for Microwave Irradiation 76
6.3 Effect of Water-Oil Ratio on Temperature Distribution 79
6.4 Effect of Microwave Power on W/O Emulsion 80
6.5 Separation of Water from Emulsions 83

6.5.1 Comparison Microwave Irradiation and Conventional 83
Methods
6.6 Comparison between Microwave Irradiation and 89
Conventional Heating
6.7 Effect of Volume Fraction on Dielectric Constant, 96
Dielectric Loss, Wavelength and Microwave Penetration
Depth
6.8 Optimisation 99
6.8.1 Optimisation for Crude oil A 99
6.8.2 Optimisation for Crude oil B 104
6.8.3 Optimisation for Crude oil C 109
6.9 Validation of Model Prediction 115
6.10 Summary 117
CHAPTER 7 CONCLUSIONS AND RECOMMENDATIONS 118
7.1 Conclusions 118
7.1.1 Characterisation of Crude Oil and Stability of W/O 118
Emulsion
7.1.2 Demulsification 119
7.2 Recommendations 121
REFERENCES 122
APPENDICES
A FTIR Analysis of Crude Oil 130
B Analysis of Differential Scanning Calorimetry 132
C Effect of Droplets Size on Stirring Intensity 134
D Effect of Temperature on Emulsion Stability 135
E W/O Emulsion Heated by Microwave Irradiation in Varied 138
Microwave Power

F W/O Emulsion Heated by Microwave Irradiation in Varied 142
Volume Fraction
G List of Publications 145

LIST OF TABLES
TABLE NO. TITLE PAGE
2.1 A Summary of Surfactant HLB Ranges and Applications 25
4.1 Assignment of Absorption Bands of IR-Spectra of the Crude 45
Oil Fractions
4.2 Assignment for Hydrogen Bonding in Asphaltenes 46
4.3 Levels of the Experimental Variables in 22 Factorial Design 50
4.4 Levels of the Experimental Variables in 23 Factorial Design 51
5.1 Physical Properties of Crude Oil 56
5.2 Chemical Properties of Crude Oil 57
6.1 23 Factorial Design with Response 100
6.2 Analysis of Variance (ANOVA) 101
6.3 Regression Coefficient Values for Response Surface 102
6.4 Observed Response and Predicted Values 103
6.5 22 Factorial Design with Response 105
6.6 Analysis of Variance (ANOVA) 106
6.7 Regression Coefficient Values for Response Surface 107
6.8 Observed Response and Predicted Values 107
6.9 23 Factorial Design with Response 109
6.10 Analysis of Variance (ANOVA) 111
6.11 Regression Coefficient Values for Response Surface 112
6.12 Observed Response and Predicted Values 113
6.13 Model Prediction Variables 116
LIST OF FIGURES
FIGURE NO. TITLE PAGE
1.1 Common Types of Crude Oil Emulsions (W/O and O/W) 4
and Less Common (W/O/W)
2.1 Schematic of Saturate, Aromatic, Resin and Asphaltene (SARA) 9
Fractionation of Crude Oils
2.2 Processes of the Crude Oil Emulsion Formation 11
2.3 The Orientation of Emulsifier on the Surface of the Dispersed 12
Phase
2.4 Electrostatic Forces 15
2.5 Steric Repulsion 16
2.6 Illustration of a Generalised (a) Foam; (b)Emulsion 17
2.7 Possible Consequence from Collisions between Two Droplets 18
2.8 Process of Chemical Demulsification 21
2.9 Typically Surfactant Structure 24
3.1 Frequency Ranges of Microwaves used in Microwave Oven 27
3.2 A Propagating Electromagnetic Wave 27
3.3 Sample Heating by (a) Conventional Thermal Heating 28
(b) Microwave Heating
3.4 Alignment of Dipolar Molecules with an Oscillating Electric Field 29
3.5 Charge Particles in the Solution Follow the Applied Electric Field 30
4.1 Flow of Study 37
4.2 Schematic Diagram for Preparing W/O Emulsion System 39
4.3 Procedures for Recovering Asphaltenes and Resins 43
4.4 Separation Wax Crystal from Crude Oil 44

4.5 Schematic Diagram for Elba Microwave Model: EMO 808 SS 47
4.6 Central Composite Designs for Optimisation of 22 Factorial 50
Design
4.7 Central Composite Designs for Optimisation of 23 Factorial 51
Design
5.1 FTIR Spectra for Asphaltenes of Crude oil A, B and C 58
5.2 FTIR Spectra for Resins of Crude oil A, B and C 59
5.3 Effects of Types of Surfactant on W/O Emulsion Stability 61
(Experimental Condition: Stirring Intensity=1500 rpm;
Processing Time=5 minutes)
5.4 Viscosity Effect at varied Stirring Intensity (a) 50-50 % W/O 62
(b) 20-80 % W/O Emulsion
5.5 Effects of Stirring Intensity on Emulsification 63
5.6 Mean of Droplet Diameter (µm) within 500 to 2000 rpm of 64
Stirring Intensity
5.7 Effect of Temperature on Emulsion Stability at (a) 50-50 % W/O 66
and (b) 20-80 % W/O Emulsion
5.8 Effect of Mean Droplet Diameter (m) in Increasing Temperature 68
5.9 An Influence of Phase Volume Fraction on the Emulsion Type 70
and Viscosity
5.10 Interfacial Tension Effect of Emulsion by varied Density 71
5.11 Effect of Shear Stress on Shear Rate with Varied Phase Ratio 73
(a) 50-50 % W/O Emulsion (b) 20-80 % W/O Emulsion
5.12 Effect of Shear Stress on Shear Rate in Crude oil A by Increased 74
the Composition
5.13 Shear Rate Dependence on Viscosity of Emulsion with Varied 75
Phase Ratio (a) 50-50 % W/O Emulsion (b) 20-80 % W/O Emulsion
5.14 Effect of Apparent Viscosity on Shear Rate in Crude oil A at 76
55-45 % and 60-40 % W/O emulsion

6.1 Temperature (a) and Heating Rate (b) as Function Microwave 79
Radiation Time by Comparing Water with Crude Oils
6.2 Effect of Temperature Distribution at Varied Phase Ratio 80
6.3 Microwave Power Effect on Water Separation Efficiency 81
6.4 Heating Rate in Microwave Power with Variation Time 82
6.5 Wavelength (cm) and Wavelength (cm) Affected Within 360 to 83
900 W in Microwave Power
6.6 Comparison of Conventional and Microwave Methods in 86
Demulsified W/O Emulsion for 20-80 % W/O Emulsion
(a) Crude oil A (b) Crude oil B (c) Crude oil C
6.7 Comparison of Conventional and Microwave Methods in 87
Demulsified W/O Emulsion for 20-80 % W/O Emulsion
(a) Crude oil A (b) Crude oil B (c) Crude oil C
6.8 Demulsification Efficiency in Microwave Irradiation during 89
60 minutes for Crude oil A and C containing 0.1% of Demulsifier
6.9 Photography of Emulsion after Irradiation in 3 minutes for 90
Crude oil A and C with 0.1 % Demulsifier at (a) 50-50 % W/O
emulsion (b) 20-80 % W/O Emulsion within 5 minutes Observing
the Phase Separation
6.10 Effect of Viscosity by Comparison Microwave (MW) and 92
Conventional Heating (CH) (a) 50-50 % W/O Emulsion
(b) 20-80 % W/O Emulsion
6.11 Microscope Image of an Emulsion in Crude oil A, B and C before 93
Demulsified in Microwave
6.12 Microscope Image of an Emulsion in Crude oil A, B and C after 93
Demulsified in Microwave
6.13 Droplets Diameter (m) before Demulsified in Microwave 95
Irradiation (a) Crude oil A (b) Crude oil B (c) Crude oil C
6.14 Droplets Diameter (m) after Demulsified in Microwave 95
Irradiation (a) Crude oil A (b) Crude oil B (c) Crude oil C
6.15 Effect of Dielectric Constant within Radiation Time 97

6.16 Plots of Tangent Loss (tan δ) with Temperature (o C) in Varied 98
Volume Fraction
6.17 Effect of Penetration Depth, Dp and Wavelength, λm on Varied 99
Volume Fraction
6.18 Response Surface of Predicted Water Separated in Microwave 105
Irradiation by Interaction (a) Power-Time (b) Power-Concentration
and (c) Time-Concentration
6.19 Response Surface of Predicted Water Separated by Interaction 109
Power (X1) and Time (X2) in Microwave Irradiation
6.20 Response Surface of Predicted Water Separated by Interaction 115
Microwave Power (X1), Time Processing (X2) and Concentration
of Demulsifier (X3) in Microwave Irradiation
6.21 W/O Emulsion Demulsified Using Optimum Variables 117

LIST OF ABBREVIATIONS
A asphaltenes
API American Petroleum Institute
oC
OCelcius
oC/min
oC per minute
CH conventional heating
cm centimetre
CMC critical micelle concentration
cP centipoises
DSC Differential Scanning Calorimetry
FTIR Fourier Transform Infra Red
g gram
GHz giga hertz
HLB hydrophile-lipophile balance
HPLC High-Performance Liquid Chromatogram
min minute
mL mili litre
mg mili gram
MW microwave
O/W oil-in-water
O/W/O oil-in-water-in-oil
R resin
R/A resin to asphaltene ratio
rpm rotate per minute
SARA Saturated, Asphaltenes, Resin, Aromatic
SDDS sodium dedocyl sulfate
Span 83 sorbitan sesquiolate
Tween 80 polysorbate 80
WAT wax appearance temperature

W/O water-in-oil
W/O/W water-in-oil-in-water

LIST OF NOMENCLATURES
E electric field intensity
f frequency
H magnetic field
S surface
co velocity
Dp penetration depth
c speed of light
V volume of water separated
Cp heat capacity
h convective heat transfer coefficient
qmv volume rate of heat generation
P microwave power dissipated per unit volume
W watt
Greek Symbols
µO viscosity of oil
ρ liquid density, g/cm3
µ micron
Φ volume fraction
ε‟‟ dielectric loss
ε‟ dielectric properties
ε* complex permittivity
λ wavelength, cm
% percent
ζ electric conductivity

CHAPTER 1
INTRODUCTION
1.1 BACKGROUND OF STUDY
It is well recognized that the energy consumption per capita and crude oil play and
important role in providing energy supply of the world because crude oil is the most readily
exploitable source of energy available to humankind, and also source of raw materials for
feed stocks in many of the chemical industries (Holmberg; 2001). However, there are about
80% of exploited crude oils exist in an emulsion state, all over the world (Xia et al., 2004).
Particularly, the emulsion presents in crude oil reduced the quality of crude oil and also
may be encountered problems during the refinery process thus can lead to enormous
financial losses if not treated correctly. Hence, emulsions have to be broken to reach
specific values of product quality (<0.5% W/O), both for oil and produced water to avoid
large economic penalties (Hannisdal, 2005).
The undesired emulsion is necessary to be demulsified to have good quality of the
crude oil. Although great effort has been made to demulsified these emulsions, it remains a
challenge to effectively break up undesired emulsions by understand the mechanism of
formation and stabilisation of the emulsion. The stabilisation and formation of emulsion are
crucial parts to study before demulsified the stable emulsion, results in higher separation of
water presented in the crude oil.

1.2 PROBLEM STATEMENT
The major problem, when dealing with the crude oil is the formation of persistent
water in the crude oil emulsion thus performed the stable emulsion. The present stable
emulsion in crude oils encountered many problems especially when deals with the quality
of crude oils. Emulsions occurred when there is water as immiscible liquids present in the
crude oil. Water is normally present in crude oil reservoirs or is injected as steam to
stimulate oil production. Water and oil can mix while rising through the well and when
passing through valves and pumps to form in most cases relatively stable dispersions of
water droplets in crude oil. Emulsions of crude oil and water can be encountered at many
stages during drilling, producing, transporting and processing of crude oils and in many
locations such as in hydrocarbon reservoirs, well bores, surface facilities, transportation
system and refineries. Also, emulsions usually exhibit viscosities significantly higher than
crude oil, thus increasing the energy input required for transport in pipeline (Alejandro et
al., 2005). The formation of stable and persistent emulsions are typically undesirable and
can result in high pumping costs, reduced throughput and special handling equipment in the
production and refining of crude oil petroleum as a challenge which has defied broads and
generic resolution for several decades.
A most recent technology which has received lots of attention from researchers is
the application of microwave field in the demulsification process (Wolf, 1986; Rajaković
and Skala, 2006). Microwave offer a fast heating treatment with uniform temperature
distribution to the subjected sample. Because of the qualities of microwave discussed
earlier in the other industry such as food industry and oil sands separation from previous
researchers (Mutyala et al., 2010; Yanniotis and Sundén, 2006), study has been conducted
regarding the use of electromagnetic energy to heat emulsion especially for stable
emulsion. This present study is aimed to investigate the effect of microwave radiation in the
breaking of the emulsion and separation of water from crude oil and compare it with
conventional heating methods, to find an effective way of good separation, less energy
consumption, and even cost effective. Thus, to fill this gaps in petroleum industry, three
types of crude oil from light to heavy crude oil were selected to accomplish the problems in

9
industry especially when covenant with stable emulsion for heavy crude oil . The emulsion
was prepared by following the problems encountered in industry through screening the
stability of emulsion before demulsified each emulsion.
1.3 DEFINITION OF TERMS
The terms of emulsion, types of emulsion, demulsification and microwave radiation
are defined in generally and are listed below:-
1.3.1 Emulsion
Dispersions of a liquid phase in another will exhibit certain stability. The term
significantly stable means relative to the intended use and may range from a few minutes to
a few years. At least two immiscible liquid phases should be present to make an emulsion
(Sjöblom, 2006; Rosen, 2004). The dispersed phase is sometimes referred to as the internal
(disperse) phase and the continuous phase as the external phase (Schramm, 2005). In most
emulsions, one of liquids is aqueous while the other is hydrocarbon and referred to as oil.
Emulsions are formed when one liquid is dispersed in a continuous liquid phase of a
different composition. However, as studied by Rosen (2004), two immiscible pure liquids
cannot form an emulsion. For a suspension of a liquid in another to be stable enough to be
classified as an emulsion, a third component must be present to stabilise the system and
called as emulsifying agent.
As reviewed from Holmberg (2001) as shown in Figure 1.1, the common types of
emulsions are oil-in-water (O/W) and water-in-oil (W/O) emulsions, although water-in-oil-
in-water (W/O/W) and oil-in-water-in-oil (O/W/O) multiple emulsions are sometimes
encountered. However, in the petroleum industry, the common emulsion present is water-
in-oil (W/O) types.

10
Figure 1.1: Commom Types of Crude Oil Emulsions (W/O and O/W) and Less
Common (W/O/W)
Source: Holmberg (2001)
1.3.2 Demulsification
The breaking of emulsion is necessary in many applications such as environmental
technology, painting, petroleum industry and waste-water treatments. The breaking of
emulsion which is the process of oil and water separation from emulsion also can be
identified as demulsification (Yang et al., 2009). As studied by Wu et al. (2003),
demulsification can be achieved by three methods which are chemical, mechanical and
electrical.
1.3.3 Microwave Irradiation
Microwave irradiation is one of the demulsification methods. Abdurahman et al.
(2007), Tanmay and Ayappa (1997) as saying that microwave radiation is an
electromagnetic radiation with frequency range within 300 MHz to 300 GHz or
equivalently with wavelengths ranging from 1 m down to 1 mm Microwave is non-ionizing
radiation that causes molecular motion by migration of ions and dipole rotation. However,
it will not change the molecular structure.
W/O O/W W/O/W

11
1.4 OPERATIONAL DEFINITION
Microwave radiation terms need to be operated as follow this study.
1.4.1 Microwave
In this study, microwave was used as an alternative method to demulsified water-in-
crude oil emulsion. Elba domestic microwave oven model: EMO 808 SS would be used in
heating crude oil emulsion samples. The microwave was modified to put sample container.
Two thermocouples were inserted in the emulsion samples at different locations. This study
was investigated the capability of microwave compared with conventional methods at
prescribed variables.
1.5 OBJECTIVES OF STUDY
The objectives of this present study are:-
i. To investigate the stability of emulsion using different crude oil samples.
ii. To investigate the performance of microwave application in demulsification
of water-in-crude oil emulsions.
iii. To compare the performance of microwave application with conventional
demulsification methods.
1.6 SCOPES OF STUDY
To accomplish the objectives of this study, the scopes of this work focuses on:
1. Characterisation of crude oil in terms of physical and chemical properties.
2. To investigate the factors affected stability and formation of W/O emulsion.
3. To examine the demulsification of emulsions by conventional methods (hotplate,
chemical demulsifiers, and gravity separation).
4. To examine the demulsification of emulsions by microwave heating using batch
process system.

12
5. To study the effect of varying the microwave power generation in
demulsification of W/O emulsions.
6. Optimisation of process parameters in demulsification.
1.7 SIGNIFICANT OF STUDY
Demand of the crude oil especially in refinery industry causes the higher production
of crude oil. However to date, crude oil exploitation has advanced to the point that the era
of large fields with a high quantity and quality is over. Since the possibility of finding
highly productive formations is small the corresponding strategy is focused on an improved
exploitation of the existing large fields and to tie in, in an efficient way, small fields. The
most important thing when focusing on existing large fields is to increase the recovery rate.
To fill these gaps, this study is proposed an alternative method to demulsified the formation
of emulsion by using different types of crude oil starting from lighter to heavier which each
crude oil inventive from petroleum industry to accomplish the industry standard and
requirement. Subsequently, the prepared emulsion was demulsified by comparing
conventional and microwave irradiation. By the end of this study, the most effective
method in demulsification could be identified and the process parameters also could be
optimised using response surface methodology.
1.8 THESIS OUTLINE
This thesis was organized by seven chapters which begun with chapter 1. Chapter 1
presents in general information regarding the background, definition of terms. This chapter
also listed the objectives and scopes of study covered in this study.
Chapter 2 discussed in details about water-in-crude oil emulsion and factors affect
the stability of emulsion. In first section, the formation of emulsion different of W/O and
O/W also foam were explained. As major problems investigated in this study, emulsions
were explained the mechanisms of stability and instability. The introduction of application
method such as heating, chemical and electrical in demulsification is engrossed in general.

13
The purpose of chapter 3 is to discuss, in general terms how microwave is generated. It also
introduces the fundamental nature of microwaves include mechanisms of dielectric constant
and loss and loss tangent. This chapter discuss about interact of microwave with materials,
and how these interactions generate process heat.
Materials and experiment procedures used to achieve objectives in this study are
presented in Chapter 4. These include the crude oil characteristics which involve the
physical and chemical properties of crude oil. Then follow by the emulsion stability test at
different phase ratio of emulsion. And finally demulsified the emulsion by comparing
conventional and microwave methods. Demulsification by microwave heating technology
was selected for further scope which optimisation part.
The main findings for emulsion stability are discussed in Chapter 5. The discussion
covered the crude oil characteristics in physical and chemical properties. This chapter also
discussed the factors affect on emulsion stability. Meanwhile for the demulsification part,
results and discussion are conferred in Chapter 6. The optimisation part in microwave
technology also covered in this chapter. Lastly, the conclusion and recommendations in this
study are discussed and listed in Chapter 7.
1.9 SUMMARY
Emulsion problems in crude oil production and processing have gained serious
consideration either from fundamental and practical aspects by oil companies as well as
researchers for the last few decades. One of the focuses is on developing an effective
method of breaking up W/O emulsions formed within reservoirs. This study will address
some of the fundamental and practical aspects of these areas of interest.

14
CHAPTER 2
EMULSION STABILITY
2.1 INTRODUCTION
Crude oil emulsions have a wide variation in both physical and chemical properties,
and also stability of emulsion. Emulsion presences in industry normally performed the
stable emulsion due to the existence of natural surfactant in crude oil. The rheological
properties such as emulsion composition and viscosity have been a great interest in
understanding the concept of emulsion stability. Therefore, it is necessary to study the
composition and properties of crude oil before further with the factors effect stability and
rheological properties in emulsion. In this chapter, the characterisation of crude oil, the
formation of emulsion and the factors affect stability of emulsion will be reviewed. Then,
the demulsification methods will be touched in generally by explained the application of
using chemical demulsifier, conventional thermal heating and electric current in treating the
emulsion.
2.2 CRUDE OIL EMULSION COMPOSITION
Crude oil varies greatly in appearance depending on its composition. As postulated
from Auflem (2002), crude oil is the complex mixture of hydrocarbons, with small amount
of sulphur, oxygen and nitrogen, as well as various metallic constituents, particularly
vanadium, nickel, iron and copper. Crude oils consist of light hydrocarbon such as gasoline,
asphaltenes, resins, waxes and napthenic acid. Crude oils, especially heavy crude oils

contain large quantities of asphaltenes (high molecular weight polar components) act as
natural emulsifier or also called surface active agent. Besides, the other crude oil
components such as resins, fatty acids, waxes and napthenic acid also act as surface active
agent but cannot action alone in producing stable emulsion. The other particles in crude oils
such as silica, clay and iron oxides naturally hydrophilic but they can become oil-wet
(hydrophobic) due to long term exposure to the crude oil in the absence of water (Langevin
et al., 2004).
The method of dividing crude oil into four major fractions: saturates (including
waxes), aromatics, resins and asphaltenes is called SARA fractionation, based on their
polarity and solubility in the solvent. Based on Hannisdal (2005), briefly, saturates are
defined as the saturated hydrocarbons ranging from straight-chained paraffins to
cycloparaffins (naphthenes) while the aromatic fraction includes those hydrocarbons
containing one or more aromatic nuclei which may be substituted with naphthenes or
paraffins. Asphaltenes are defined as the solubility class of crude oil that precipitates in the
presence of aliphatic solvents while the resin fraction is defined as the fraction soluble in
light alkanes, but insoluble in liquid propane. Both are the most aromatic and most polar
compounds of petroleum with the greatest amount of sulphur, nitrogen, and oxygen. The
method of dividing crude oil into these four fractions is illustrated in Figure 2.1.
Figure 2.1: Schematic of Saturate, Aromatic, Resin and Asphaltene (SARA)
Fractionation of Crude Oils
Source: Auflem (2002)
Crude Oil
Dilute with n-alkane
Maltenes
Adsorb with silica
gel
Saturates Aromatics Resins Asphaltene
s
n-alkane Toluene Toluene/
methanol
Precipitated

28
Crude oils from different regions have different properties. The physical properties that
mainly affect the behaviour and persistence of crude oil are specific gravity, viscosity and
pour point (Hannisdal, 2005).
2.3 EMULSION
Emulsions are colloidal dispersions in which a liquid is dispersed in a continuous
liquid phase of different composition. The dispersed phase is sometimes referred as the
internal (disperse) phase and the other one phase as the external phase (Schramm, 2005).
Emulsions may contain not just oil, water and emulsifier (usually surfactant), but also solid
particles and gas. Emulsions are created throughout the full range of processes in the
petroleum producing industry including drilling and completion, fracturing and simulation,
reservoir recovery, surface treating and transportation. During heating, as part of an oil
recovery process such as hot-water flotation or in situ steam flooding, emulsions having a
wide range of viscosities can be formed, particularly if they are water-in-oil (W/O) type.
2.4 EMULSION FORMATION
There are two stage processes formation of emulsions which are formation of new
droplets and stabilisation of the droplets (Figure 2.2). For the formation of emulsion, at
least two immiscible liquids are required (Ariany, 2004). The first process, formation of
new droplets involves disrupting the stable bulk liquid to form dispersed phase by apply
mechanical energy. The second process is the tendency of the droplets to coalesce and
reform the stable bulk liquid must be overcome (Jennifer, 1999).
Emulsions form more readily as the interfacial tension between the oil and water
phases is reduced, and theoretically, when the value of interfacial tension is zero, the
emulsion will form spontaneously. According to the emulsion theory, the formation of
emulsion is easier when the interfacial energy is low but this is not a crucial factor for
emulsion stability (Wanli et al., 2000). In the formation of an emulsion, the surface area or
interfacial area between the dispersed and continuous phases increase to a very great extent,

29
and the properties of the interface are important in determining the ease of emulsion
formation and its stability. This increase in surface area increases the free energy and
thermodynamic instability of the system. Emulsifiers have the property of adsorbing at the
interface, thus reducing the interfacial free energy, and this influences the ease with which
the emulsion forms.
Figure 2.2: Processes of the Crude Oil Emulsion Formation
Source: Ariany (2004)
2.4.1 Physico-chemical Factors Affecting the Formation of Emulsions
Emulsion is part of liquid-liquid dispersion that can be affected by the formation of
emulsion. The more important once are: (a) Concentration, (b) stability, (c) particle size, (d)
viscosity, of the emulsion. Sometime other properties, like dielectric strength, electrical
conductivity, or the colour may be specified, but these are relatively special features.
2.5 TYPES OF EMULSION

30
In commonly, there are two basic types of emulsion depend on the kind of liquid
that perform as continuous phase. Still, the very general formulation by Bancroft (1912) is
states that the „continuous phase of an emulsion will be in which the surfactant (emulsifier)
is most soluble’. The common types of emulsions in the petroleum industry are oil-in-water
(O/W) and water-in-oil (W/O).
Figure 2.3: The Orientation of Emulsifier on the Surface of the Dispersed Phase.
2.5.1 Water-in-Oil Emulsion (W/O)
In industry, typically W/O emulsion is existed. Water dispersed in crude oil,
therefore water act as dispersion phase and continuous phase is crude oil. As claimed by
Fingas (2001), W/O emulsion can be classified in four types which stable emulsion,
mesostable emulsion, unstable emulsion and entrained water. Stable emulsion is brown
materials with about 80% of average water content. While mesostable emulsion is brown or
black viscous liquid with average water content of 62% on the day of formation and 38%
one week later; entrained water is black liquids with average water content 42% in on the
first day of formation and about 15% after one week.
2.5.2 Oil-in-Water Emulsion (O/W)

31
In general, O/W is presented if the surfactant (emulsifying agents) is more soluble
in water than oil. Emulsions are common colloidal systems in many industrial products
such as food, cosmetics, and pharmaceutical or agrochemical preparations. O/W emulsion
is often used to deliver functional molecules and nutritional benefits, or to create a certain
texture to the consumer. Oil-in-water emulsions are made of oil droplets which are
dispersed in an aqueous continuous phase and stabilised by surface active molecules.
2.5.3 Differences Between W/O and O/W Emulsions
Not all emulsions exhibit the classical „milky‟ opaqueness with which they are
usually associated. A tremendous in range of appearance of emulsion is depending on the
droplets sizes and difference of refractive index between the phases. Physically, the texture
of an emulsion frequently reflects to the continuous phase. W/O emulsion feel more „oily or
greasy‟ compared to O/W which this types of emulsion are considered more „watery or
creamy‟ (Schramm, 2005).
2.6 TESTS FOR EMULSION TYPES
Several tests can be used to identify the emulsion types. In general, three tests are
usually used as listed below:-
2.6.1 Dilution Method
This method is based on the fact that an emulsion can be diluted freely with a liquid
as same as continuous phase. Typically, a small amount of the emulsion is added to a
relatively large volume of water and the mixture is stirred. If the emulsion disperses in
water, it is considered to be on O/W type emulsion. However, the emulsion remains
undispersed is opposite type; W/O emulsion.
2.6.2 Electrical Conductivity

32
Measurement of electrical conductivity with conductivity bridges using platinum
electrodes fused into glass tubing was proposed many years ago as away differentiating
between O/W and W/O emulsions. The concept of this method based on the ability of the
emulsion to conduct electrical current. Thus, when a voltage is applied across a liquid, a
significant amount of electric current will flow only when the path of the current is through
water as continuous phase. W/O performed insignificant current flow when applied under
electric current since oil is a non-conductor of electricity.
2.6.3 Staining the Continuous Phase
Another method to determine the type of emulsion is to use Sudan III or Scharlach
R, red dyes soluble in the oil but not in the water (Bancroft, 1912). A small portion of the
finely powdered dye is dusted over the surface of the emulsion. If oil is the external phase
the colour gradually spreads throughout the emulsion. But if water is the external phase the
colour does not spread but is confined to the oil with which it comes in contact on the
surface. An example of such a dye is scarlet red, which is an oil soluble dye. When added
to an O/W type emulsion, followed by observation under the microscope, bright red
coloured oil drops in an aqueous phase can be seen clearly.
2.7 EMULSION STABILITY
Emulsion stabilized with particles is called „pickering emulsions‟. It is generally
considered that since the size of stable emulsion drops is generally 10 μm or less, the
particles contributing to emulsion stabilization should not be more than 1 μm in size
(Langevin et al., 2004). Usually emulsions made by mixing together two pure liquids are
not very stable. The stability of emulsion is determined by the interaction between the
particles during the collisions. As studied from previous researchers (Sullivan and
Kilpatrick, 2002; Ariany, 2004; Abdurahman et al., 2007) there are at least four
mechanisms by which emulsions are stabilized; electrostatic repulsion, steric repulsion, the
Marangoni- Gibbs effect, which retards film drainage and thin film stabilization.

33
2.7.1 Electrostatic Forces
The approach of emulsion droplets to another one may be resisted by electrostatic
forces. Sullivan and Kilpatrick (2002) as saying that electrostatic forces in emulsions arise
from a surface charge on the droplet and then electric double layer may form around
disperses phase droplet (Figure 2.4). Electrostatic forces do not play a significant role in the
stabilization of water-in-oil emulsion because of the low dielectric constant of continuous
phase.
Figure 2.4: Electrostatic Forces
Source: Ariany (2000)
2.7.2 Steric Repulsion
Steric repulsion is one of the mechanisms in emulsion stability. Steric repulsion is
the resistance of adsorbed species on droplet interfaces to interactions with adsorbed
species on other droplets as shown in Figure 2.5 (Sullivan and Kilpatrick, 2002). This
mechanism occurs when it is energetically favourable for the adsorbed material to interact
with the solvent in the continuous phase rather than other adsorbed material. Steric
repulsion is commonly found in systems stabilized by nonionic where salvation energies
can be high as result of hydrogen-bonding interactions.

34
Figure 2.5: Steric Repulsion
Source: Ariany (2004)
2.7.3 Marangoni-Gibbs Effect
The effect on the surface tension by surfactant adsorption from the bulk solution
(Gibbs effect) and by diffusion along the interface (Marangoni effect) is often referred to as
combined Marangoni-Gibbs effect. The critical thickness for rupture of a thin film depends
on the adsorption kinetics and interfacial activity of added demulsifiers. As the film thins,
the continuous phase drains out from between the droplets and an interfacial tensions
gradient is formed as the surfactants at the droplet interface are dragged out with the liquid.
Because of the depletion of surfactant at the centre of the thin film interface, a diffusion
flux is generated in the opposite direction of the drainage which cause the slowing fluid
drainage (Sullivan and Kilpatrick, 2002)
2.7.4 Thin Film Stabilization
The formation of a mechanically rigid, viscoelastic and stagnant film around the
droplets provides a physical barrier for droplet-droplet coalescence. Crude oil varies greatly
in appearance depending on its composition. As postulated from Auflem (2002), crude oil,
especially heavy crude oils contain large quantities of asphaltenes (high molecular weight
polar components) act as natural emulsifier or also called surface active agent. Besides, the
other crude oil components such as resins, fatty acids, waxes and napthenic acid also act as

35
surface active agent but cannot action alone in producing stable emulsion (Langevin et al.,
2004).
2.8 EMULSION AND FOAM
As mention above, emulsion is colloidal dispersion in which a liquid is dispersed in
a continuous liquid phases. Foam is also deal with the colloidal dispersion. However, foam
involve with gas is dispersed in a continuous liquid phase. Liquids foams and emulsions in
general, unstable thermodynamic (Wilde, 2000). The creation of foams and emulsion
essentially requires the formation of fine bubbles and droplets. Foam can be created by
liquid which, the surface area of liquid is expand to form a thin film around gas bubbles.
The liquid must be able to posse the correct rheological and surface properties to retard
thinning of the lamellae which lead to bubble coalescence and also diffuse the trapped gas
from small to large bubbles or to the surrounding atmosphere. Figure 2.5 illustrated the
general foam and emulsion image. Bubbles in persistent foams are polyhedral and not
spherical. In fact foam bubbles usually have diameters greater than 10 µm and may be
larger than 1000 µm (Schramm, 2005).
(a) (b)
Figure 2.6: Illustration of a Generalised (a) Foam (b) Emulsion
Source: Schramm (2005)

36
2.9 EMULSION DESTABILISATION
The break-up of droplets depends strongly on the type and intensity of the flow
which is determined by the rotational speed and geometry of the impeller, geometry of the
vessel and material properties of the continuous phase such as viscosity and mass density
(Hannisdal; 2005). The phenomenon of emulsion separation can be broadly categorized
into four mechanisms for demulsification which are sedimentation/ creaming, aggregation
coalescence and Ostwald ripening. Sedimentation or creaming occurs when there is density
different between dispersed and continuous phase. Aggregation is when two or more
droplet species are aggregated and clump together but separated by a thin film of
continuous phase. While coalescence occurs when thin film between the droplets break and
they fuse together to form single larger unit. From Figure 2.7, at low interfacial coverage of
the stabilizing units, collision of the emulsion droplets (a-b) usually terminated their
coalescence (b-c). The flocculation or aggregation (d) takes place before proceed with
coalescence process.
Figure 2.7: Possible Consequence from Collisions between Two Droplets.
Source: Hannisdal (2005)
2.9.1 Sedimentation
This is the phenomenon by which emulsions separate into two emulsions, one richer
other is poorer in the dispersed phase. The more concentrated emulsion is commonly
referred to as cream. The separation of cream from unhomogenised milk is very common

37
example of cream phenomenon. The mechanism of creaming appears to be due to the slow
sedimentation of the emulsified droplets (Paul and Daniel; 1985). The velocity of
sedimentation of a drop, vm of a radius, r and density, w in a liquid of viscosity, µo and
density of continuous phase, o is given by Stoke‟s equation if oil is continuous phase.
o
ow
m
gDV
18
)(2 (2.1)
Larger dispersed particle radii and difference density, (w -o) give the faster sedimentation.
This effect may be minimised by gentle mixing (Jennifer; 1999).
2.9.2 Aggregation
Flocculation is the process in which emulsion drops aggregate, without rupture of
the stabilizing layer at the interface. Flocculation of emulsions may occur under conditions
when the van der Waals attractive energy exceeds the repulsive energy and can be weak or
strong, depending on the strength of inter-drop forces (Hannisdal, 2006). The rate of
flocculation can be estimated from the product of a frequency factor (how often drops
encounter each other) and the probability factor (how long they stay in contact).
2.9.3 Coalescence
As two emulsified drops approach each other, liquid flows out of the film and
thinning occur. According to Wanli et al. (2000), the drainage velocity of thinning film is
dependent upon the forces acting at the interface of the film then, the droplets fuse together
to form a single larger unit.

38
2.9.4 Ostwald Ripening
Ostwald ripening is a long-term effect in destabilisation process of emulsion. This
step occurs when dispersed phase is soluble enough within the continuous phase and
consists of a gradual coarsening of emulsion (Hannisdal, 2005). Ostwald ripening caused
by the diffusion of monomers from smaller to larger droplets due to greater solubility of a
single monomer molecules in the larger monomer droplets.
2.10 METHODS OF EMULSION BREAKING
The breaking of emulsion is necessary in emulsion treatment. Methods currently
available for demulsification can be classified as chemical, electrical and mechanical
(Abdurahman et al., 2007). In generally, methods to induce phase separation for water-in-
oil emulsions can be applied using chemical or heating the emulsion. Chemical
demulsifiation is common method used and since the 1930s, demulsifier has been used in
treating emulsion (Wu et al., 2003). Conventional thermal heating involved the breaking of
emulsion due to reduction of viscosity of continuous phase. However, currently microwave
has been studied an alternative method to treat the emulsion. The concept of microwave
demulsification is first introduced by Klaika (1978) and Wolf (1986).
2.10.1 Application of Chemical
Chemical demulsifier is a conventional method widely used in industry. However,
the problems of using this method are environment problematic which involve with waste
water stream and the cost of using chemical in large quantities volume could be enormous
and may outweigh the benefits realized (Countinho et al., 2008; Rajaković and Skala ,
2006; Arnoud, 2004). This method involves the use of chemical additives to accelerate the
emulsion breaking process. As studied by Kang et al. (2006), the breaking through this
method is based on the rupture of interfacial film and surfactant adsorption mechanisms.
The dispersed phase (water droplets) approached each other and flattens to form a thin film
of continuous phase between them. Demulsifier molecules and natural surfactants

39
(asphaltenes) then compete each other to adsorb onto voids created because of the
difference of interfacial tension inside and outside film (Figure 2.8). The outward drainage
flow of the film can create gradients in the interfacial tension which then oppose and slow
down to drainage (Djuve et al., 2001). In this way, the adsorption of demulsifier is
continuous exponentially until the films become very thin and it ruptures due to close
proximity of adjacent dispersed phase surfaces and local absence of surfactant molecules.
Most commercial demulsifiers that are used to break up water-in-oil emulsions are
oil soluble. The interfacial activity of these oil soluble demulsifier molecules is controlled
by the rate of the bulk diffusion process from bulk phase to the interface and adsorption
barrier at the water/oil interface. As reviewed by Djuve et al. (2001), the efficiency of the
demulsifier is related to the hydrophile-lipophile balance (HLB) behaviour.
Figure 2.8: Process of Chemical Demulsification
Source: Djuve et al. (2001)
2.10.2 Application of Thermal Heating

40
Thermal heating method is the addition of heat to enhance the emulsion breaking.
Heating an emulsion usually causes a slight reduction in the interfacial tension between oil
and water phases. Heat is applied in breaking the emulsion because it is characterised by
rates in temperature (Coutinho et al., 2008). The thermal heating is affected on the
emulsion due to reduction of viscosity of emulsion. This is agreed from previous
researchers (Strom-Kristiansen et al., 1995; Hannisdal, 2005; Yang et al., 2009) the
viscosity of emulsion is reduced as increasing temperature due to the elimination of
protective rigid film surround the droplets.
Temperature and viscosity have significant factors in heating. Indeed, microwave
irradiation also occupied with heating but in different way. In microwave irradiation,
electromagnetic is transfer to energy and energy will be conversed. But, for thermal heating
the heat transfer is transfer using thermal gradient from conduction to convection
(Yanniotis and Sundén, 2006). Microwave irradiation is widely used in food industry
because demonstrates significant advantages over conventional methods in reducing
process time and improving food quality. The idea of using this microwave heating in food
industry leads of using this method in demulsification. As studied by Xia et al. (2004),
conventional heating could be used in demulsification due to the reduction of viscosity;
however this process takes long time in separation.
2.10.3 Effects of Electric Current
Electric is applied to demulsified across an emulsion that causes the charged
droplets to move toward the oppositely charged. Electric field produced disturbs the surface
tension of each droplet, possibly by causing polar molecules to reorient themselves. This
reorientation weaken the film surround the droplets because the polar molecules are no
longer concentrated at the droplets surface. A mutual attraction of adjacent emulsion
particles receives induced and oriented charges from the applied electric field. This mutual
attraction places oppositely charged particles in close proximity to each other. Therefore,
the droplets are electrically attracted to each other and lead coalescence process.

41
In microwave irradiation, electric current is applied due to the combination of
electric and magnetic wave from penetration of electromagnetic through the materials.
Information of using this method in demulsification has been developed in last 30 years.
This method was firstly introduced by Klaika and Wolf since 1970s in their patent
application to remove hydrocarbon fuel from geological substrates such as coal, shale, tar
sand and existing oil wells (Klaika, 1978). Abdurahman and Rosli (2006) studied the
efficiency of microwave irradiation by comparing gravity sedimentation, conventional
heating and microwave irradiation by using light crude oil. They concluded that microwave
irradiation can be tool to demulsified emulsion. In a related study, Ngai and Wu (2005)
investigated the efficiency of microwave mixed with solvent in stabilising the
microemulsion polymerisation. These combination solvent and microwave could be able to
produce narrowly distributed small emulsifier-free polystyrene latex particles due to
volumetric heating in microwave. Rajaković and Skala (2006) also proved the efficiency of
microwave irradiation in demulsification method by combination freeze-thaw and
microwave and metal-working oil has been used as emulsion sample.
The development of microwave irradiation as an alternative method for heating
heavy crude oil in reservoirs may be economically viable alternatives to steam in certain
situation. From Mutyala et al. (2010), the application of microwave in petroleum industry
could be used as pre-heating tools where the temperature effect on viscosity is significant.
2.11 SURFACTANTS
Surfactants are widely used and find a very large number of applications because of
their remarkable ability to influence the properties of surfaces and interfaces. A surfactant,
also called surface-active agent is a substance that has the property of adsorbing onto the
surfaces of interfaces of the system at low concentration and alter to a marked degree the
surface or interfacial free energies of those surfaces (Rosen, 2004). Previous researchers
(Rosen, 2004; Schramm, 2000), agreed that surfactants have a characteristic molecular
structure consisting of a structural group that has very little attraction for solvent, known as

42
hydrophilic group, together with a group that has strong attraction for solvent, and known
as hydrophobic group. This is known as an amphiphilic structure.
The adsorption of surfactant from a bulk phase to a surface or interface occurs at
any concentration. As studied by Homberg (2001), the surface concentration increased
gradually as soluble surfactant in water increased until reaches a maximum level at specific
bulk concentration. Beyond this concentration, individual surfactant monomers begin to
aggregate with their hydrophilic heads pointing outwards towards the solution and the
hydrophobic tails pointing inwards away from the water in order to minimise the free
energy of the system. The effects of association between adjacent hydrophobic or
hydrophilic section of surfactant molecules are enhanced in aggregate structures such as
micelles (Biresaw and Mittal, 2008). Hence, the concentration at this aggregation occurs is
called the critical micelle concentration (CMC) as shown in Figure 2.9.
Figure 2.9: Typically Surfactant Structure
Source: Carlota et al. (2005)
By adding surfactant such as surface-active emulsifiers or demulsifiers that affect
the molecular confirmation and arrangement at the interface, would alter the interfacial
tension and changed the stability of the formed emulsions (Wang et al., 2004). The
selection of surfactant in preparation of either W/O or O/W emulsions is often made by
hydrophilic-lipophilic balance (HLB). This method was first introduced by Griffin (1954)
to scale the relative percentage of hydrophilic to lipophlic (hydrophobic) groups in the

43
surfactant molecules. For an O/W emulsion, droplets the hydrophobic chain exists in the oil
phase, while the hydrophilic head resides in aqueous phase and vice versa for W/O
emulsion. Table 2.1 provided the range of HLB in selection of surfactants for particular
applications:-
Table 2.1: A Summary of Surfactant HLB Ranges and Applications
HLB range Application
3-6 W/O emulsifier
7-9 Wetting agent
8-18 O/W emulsifier
13-15 Detergent
15-18 Solubiliser
Source: Hait and Moulik (2001)
2.12 SUMMARY
In the petroleum industry, the present of emulsion is undesirable because of
problems encountered by forming this emulsion. Essentially breaking of emulsion is to
improve the quality of emulsion. However, the stability of emulsion is crucial part to
investigate first. This stability of emulsion depends on the properties of crude oil and
factors affected on emulsion characteristics such as viscosity, temperature and
concentration of dispersed phase.

44
CHAPTER 3
MECHANISMS OF MICROWAVE THEORY
3.4 INTRODUCTION
It has been known for long time that microwaves can be use for heat materials. In
fact, the development of microwave oven for the heating food has been more than a 50-year
history (Wu, 2003). Recently, microwave is investigated as an alternative method to break
the emulsion. Microwave irradiation is being studied as tool for demulsification. In the
electromagnetic spectrum, the microwave radiation is located between infrared radiation
and radio waves. Microwaves have wavelengths of 1 mm -1m, corresponding to the
frequencies between 0.3 and 300 GHz (Lidstrőm et al., 2001). From Lidstrőm et al. (2001),
in general in order to avoid interference, the frequency at which industrial and domestic
corresponding to 2.45 GHz, but other frequency allocations do exists (Figure 3.1). The
heating of liquids using microwaves can be explained by the interaction of matter with the
electric field of the incident radiation, causing the movement of ions as well as that of
induced or permanent molecule dipoles. The movement of such species can cause heat
generation.
3.5 MICROWAVE ENERGY AND MATERIALS INTERACTION
Microwave is very short waves of electromagnetic by penetrate the electromagnetic
energy through materials. Since microwave energy transfer involve electric and magnetic
field, the interaction materials is selected based on electric and magnetic component.

Figure 3.1: Frequency Ranges of Microwaves used in Microwave Oven
Source: Modified from National Materials Advisory Board (1994)
A propagating electromagnetic wave has two components which are an electric
field, E (unit V/m) and magnetic field, H (unit A/m). There are vectors and always
perpendicular with each other as illustrated in Figure 3.2. In free space the propagating
wave has a velocity (co) of about 3.0 x 10⁸ m/s and this is the maximum speed for energy to
travel. Frequency (f) and wavelength (λ) are linked as in Equation 3.1;
fc (3.1)
Figure 3.2: A Propagating Electromagnetic Wave
Source: Ryynänen (2002)

38
The most important thing in microwave heating is volumetric heating, which in a
manner different with conventional heating. Volumetric heating means that materials can
absorb microwave energy directly and convert into heat. This lead the advantages of
microwave like rapid, selectively, control and uniform heating. While in conventional
heating, heat must diffuse from the surface to material. As reported by Nadkarni (1984), for
conventional thermal heating, typical time required to complete heat wet absorption by
conductive heating is about 1-2 hours. While for microwave heating in open-vessel, the
time required is less about 96% which 5-15 min. In conventional thermal heating, vessel
used usually poor conductors of heat, thus it takes time to heat vessel and transfer it into the
solution. Because vaporisation occurs at the surface of liquid, a thermal gradient is
established by convection currents and only a small portion of solution is at the temperature
of the heat applied. Therefore, when conductively heating occurs, only a small portion of
the solution is above the boiling point temperature of the solution (Figure 3.3).
(a) (b)
Figure 3.3: Sample Heating by (a) Conventional Thermal Heating (b) Microwave
Heating
Source: Kingston (1988)

39
3.3 MICROWAVE PROPERTIES
The main application of microwave processing of materials is heating. As studied
by Lidstrőm et al. (2001), if two samples containing water and oil respectively are heated
under microwave irradiation, the final temperature is higher in the water sample. In order to
understand why this phenomenon occurs, it is necessary to understand the mechanisms of
microwave dielectric heating. As with all electromagnetic radiation, microwave radiation
can be divided into an electric field and magnetic field component. The former component
is responsible to the dielectric heating is affected via two mechanisms which are dipole
rotation and ionic conduction as illustrated in Figure 3.4 and 3.5 (Coutinho et al., 2008).
Gas cannot be heated under microwave irradiation since the distance between two rotating
molecules is long enough for molecules to be able to follow the electric field therefore,
there are no phases different will be generated.
3.3.1 Dipole Rotation Mechanism
Electric dipoles are formed by the interaction of electric charge with the matrix.
A dipole is sensitive to the external electric fields and will attempt to align itself with the
electric field by rotation itself (Lidstrőm et al., 2001). Water molecule is an example of a
posse dipole molecule.
Figure 3.4: Alignment of Dipolar Molecules with an Oscillating Electric Field
Source: Lidstrőm et al. (2001)

40
Based on Coutinho et al. (2008), in liquids state, the electric dipoles cannot rotate
instantaneously and the ability of molecules to align under influence of electric field will
vary with different frequencies and viscosities of liquid. For low radiation frequencies, the
time where the electric field changes direction is higher than the dipole response time.
Molecules gain some energies but overall heating effect with full alignment is small.
However, at very high frequency electric field, dipoles do not have sufficient time to follow
the oscillating field and molecules do not rotate and move. When there is no motion, so
there is no energy takes place and there also no heating occurs.
3.3.2 Ionic Conduction
A solution containing ions migrate through the solution under the influence of an
electric field, resulting in expenditure of energy due to an increased collision rate, therefore
converting the kinetic energy to heat (Lidstrőm et al., 2001). The resulting electrical
currents heat the sample as a consequence of the electrical resistance
Figure 3.5: Charge Particles in the Solution Follow the Applied Electric Field
Source: Lidstrőm et al. (2001)
This ion migration is a flow of current that results in I2R migration depend on size, charge
and conductivity of the dissolved ions and are subject to the effects of ion interaction with
the solvent molecules. The parameters affecting ionic conduction are ion concentration, ion
mobility and temperature of solution.

41
3.3.3 Dielectric Properties
From the mechanisms above, polar solvents and/or ions are needed for the
microwave heating. Dielectric response for various materials plays important role to carry
out efficient material processing and a significant amount of earlier research was devoted to
understand the physics on microwave assisted transport and heating characteristics
(Lidstrőm et al., 2001; Basak and Meenakshi, 2006). The dielectric polarization depends on
the ability of the dipoles reorientation in an applied electric field. In order to compare the
abilities of different solvents to generate heat from microwave irradiation, their capabilities
to absorb microwave energy and to convert the absorbed energy into heat must be
accounted (Lidstrőm et al., 2001). These factors may be considered using the loss angle, δ
which is usually expressed in the form of its tangent
''
tan (3.2)
The real permittivity or dielectric constant,‟ is characterising the penetration of
microwaves into material and loss factor, ‟‟ indicating the material ability to store energy.
The complex permittivity,* is a measure the ability of a dielectric to adsorb and store
electrical potential energy with real permittivity,‟ and loss factor, ‟‟.
''*'* i (3.3)
The re-orientation of dipoles and displacement of charge are equivalent to an
electric current as mention in Maxwell‟s displacement current. As postulated by Indra,
(2007), the displacement current will be 90o out of phase with the electric field when a
dielectric precisely follows the electric field whereas the flow of current is perpendicular to
the electric field. A dielectric that does not follow the oscillating electric field will have a
phase difference between the orientation and electric field. Hence, this will produces a
component, I sin δ which cause energy is absorbed from the electric field and converted
into heat; called as dielectric loss.

42
3.3.4 Energy Conversion
In microwaves, energy is converted into heat which, a process that involves
interaction between microwave fields and the conductivity or dielectric properties of the
material. As claimed by National Materials Advisory Board (1994), there are three
processes interaction between microwave and materials; i) space charges due to electronic
conduction ii) ionic polarization associated with far-infrared vibrations and iii) rotation of
dielectric dipoles.
The dielectric properties of material in combination with the applied of
electromagnetic field result in the conversion of the electromagnetic energy into heat.
Power that transmitted through the material can be determined by Poynting‟s Vector
(Equation 3.4) which is derived from Maxwell equation (Leszek, 2003). The flow of energy
through the surface, S enclosing the volume, V to the cross product of the electric-field, E
and magnetic field, H strength which can be explained by the flux of a vector:-
HES (3.4)
Using the divergence theorem, the Maxwell equation by assuming material properties of
the volume, the following equation can be acquired for the real portion of the Poynting
Power Theorem:-
dVHEt
JdVEdSHE VVnS
22
2
1
2
1. (3.5)
The rate loss of energy stored in electric and magnetic field within a region of space is state
in left side. The right side represent the work done per second by the impressed forces,
JdVE. , the sum of the rate of dissipation of electrical energy, 2
2
1E as heat and the rate of
flow of electromagnetic energy outward, 2
2
1H through the surface of region.

43
3.4 WORKING EQUATIONS FOR MICROWAVE DEMULSIFICATION
STUDY
Microwave heating is an alternative method to demulsified the emulsion due to the
fact that microwave offers a clean, cheap and convenient heating process that in most of the
times results into better yield and shorter times. Since microwave heats material
volumetrically, the volume rate of microwave heat generation from energy balance
equation can be determined as:-
dt
dTCTT
V
ATT
V
hAQ pamammw
44 )15.273()15.273()( (3.6)
The right side comprises three terms, convection, conduction and radiation heat
transfer through the sample. From Equation 3.7, the rate of heat transfer for conduction and
convection are assume zero due to the rate of heat transfer from emulsified water droplets
to continuous phase is very rapid; therefore, in practically temperature of water and oil
almost same. Therefore, the heat generation of emulsion can be expressed as follows:-
dt
dTCQ Pmw (3.7)
where Qmw ( cal/s.cm3) is the total dissipated microwave power in the material, heating rate,
dT/dt (oC/sec), density, (g/cm
3) and heat capacity, Cp (cal/g.
oC) respectively. Density and
heat capacity of emulsion calculated from mixing rules as:
)1( owm (3.8)
)1((,, opwppm CCC (3.9)
The rate of heat generation is depends on dielectric properties of the emulsion. For water,
dielectric constant and loss are two important parameters. These parameters are represented
by the following equations (Di et al., 2000):
Tw 3358.02.85' (3.10)
03.166.320'' Tw (3.11)

44
However, as proposed by Von Hippel (1954) dielectric properties of various petroleum oils,
in this regard dielectric constant and loss tangent of crude oil for this study calculated from
the equation below:-
Toil 000727.024.2' (3.12)
41028.4527.0tan xTo (3.13)
From Lidstrőm et al. (2001), the dielectric constant can only change with temperature since
the frequency for most types of microwave apparatus is set at 2.45 GHz, the wavelength, m
and penetration depth, Dp within a sample for a radiation is related to dielectric constant and
dielectric loss as follows:
2/12
2
1'
''1'
r
rr
mf
c
(3.14)
Penetration depth has been generally related to temperature distribution in microwave
heating. Penetration depth measures the distance from the surface of a dielectric material
and given approximately by:-
2/12
2
1'
''1'
2
r
rr
pf
cD
(3.15)
3.5 SUMMARY
The penetration of electromagnetic into materials was depends on the ability of
materials to absorb the electromagnetic and convert it into heat. The ability of materials to
absorb the electromagnetic was interpreted into dielectric properties equation of emulsion
whereas using mixing rule for water and crude oil. The effectiveness of microwave

45
radiation at different microwave power and ratio of water-crude oil was investigated
through penetration depth and wavelength as discussed in equation above.

46
CHAPTER 4
MATERIALS AND METHODS
4.1 INTRODUCTION
This chapter describes the materials, equipment and methods followed to solve the
problem of this study. To accomplish the objectives of scopes of this research, the study
was carried out in three stages namely, emulsion stabilisation, microwave batch process and
optimisation.
The first and second stages are experimental while third stage is optimisation.
Experimental methods involve the procedure for emulsion sample preparations,
experimental set-up for microwave equipment, sample characterisation using microwave
processes (sample analysis, identification of emulsion type, measurement of emulsion
stability, density, viscosity and dielectric properties of emulsions. Details of the
experimental are discussed below.
4.2 FLOW OF STUDY
The study has been conducted by using three types of crude oil from lighter to
heavier crude oil. The flow of study shows in Figure 4.1. Basically this study was
summarised by six parts. Firstly each crude oil was characterised in term of physical and
chemical properties. The emulsion would be prepared depend on the requirement of volume
fraction and each prepared emulsion was checking either W/O or O/W emulsion by using

dilution and conventional drop tests. Only W/O emulsion has been used in the emulsion
stability part. The most stable emulsion was selected in this screening part before
demulsified in demulsification part by comparing conventional and microwave irradiation.
The most effective methods determined by observing the percentage of water separated.
For the optimisation part, the process parameters in demulsification would be optimised
using response surface methodology.
Figure 4.1: Flow of Study
Crude oil
characteristics
Emulsion preparation
Emulsion checking
Demulsification
Emulsion stability
Optimisation
i. Physical
ii. Chemical
W/O or O/W
emulsion
Stable emulsion
preparation
i. Conventional
method
ii. Microwave
irradiation
Response surface
methodology (RSM)

77
4.3 MATERIAL SELECTION
Basically in this study, there were three types of crude oils were donated from
Petronas Refinery at Melaka were used. The samples were denoted as crude oil A (Saudi),
crude oil B (Kuwait) and C (United Arab Emirates). The samples were selected because of
the types which were consisting heavy and light crude oil.
Several chemicals are selected while characterise and investigated the emulsion
stability. In the preliminary study, four emulsifiers such as sodium dedocyl sulfate (SDDS)
10% in water from Merck, polysorbate 80 (Tween 80) from R&M chemicals, Triton X-100
(98-100% from Merck) and sorbitan sesquiolate (Span 83) from Sigma were selected to
form the most stable emulsions depend on the type of crude oils. The emulsifiers contain of
non-ionic and ionic groups to compare the most stable emulsion performed by emulsifiers.
The reagent grade n-pentane (>99.0% from R&M Chemicals), n-hexane (99% from Merck)
to decolourise crude oil, toluene (>99.5% from Systerm), methanol (≥99.9% from Merck),
dichloromethane (≥99.6% from Merck) were used in separation of fraction components in
crude oil. 99% hexylamine from Sigma-Aldrich, octylamine (≥98% from Merck) and
pentylamine (98% from Merck) act as demulsifier.
4.3.1 Sample Preparation
Basically emulsion is prepared by added water to crude oil in prescribed ratio.
About 50 mL of emulsion sample was prepared in this study. Figure 4.2 illustrates the
schematic diagram in preparing the emulsion. Firstly, 0.1% emulsifier of crude oil added to
crude oil (mixing solution) and it stirred using three blades propeller for 1 minute with
±500 rpm. Water is added gradually to the mixing solution and was agitated vigorously
using a standard three blade propeller at speed 500 to 1500 rpm and temperature 28-30oC
for 5 minutes. Then, the type of emulsion (W/O or O/W) was inferred by a conventional
drop test (Evdokimov et al., 2008). The concentrations of water (internal phase) in the
samples were varied by volume. Emulsions were observed over a period of time to provide

78
a qualitative measure of the stability. Details of these studies were reported in next chapter
(results and discussion).
Figure 4.2: Schematic Diagram for Preparing W/O Emulsion System
4.4 ANALYTICAL PROCEDURE
4.4.1 Physical Characteristics
Density of Crude Oil
The density of crude oil is measured using pycnometer 20 mL (ASTM D70, NFT
66007). Pycnometer is a glass flask with a close fitting ground glass stopper with a
capillary hole through it. This fine hole releases a spare liquid. The samples is introduced to
equilibrate to room temperature (27 o
C ± 0.2 oC) in pycnometer and weighted. The
pycnometer also filled with distillate water and weighted at same temperature. While for
oAPI density, both density of crude oil and water are measured at 15.6
oC as shown in
Equation. 4.1. The petroleum gravity (oAPI) is measured using the following equation:-

79
5.131)6.15(
5.141
CatdAPIdensity
o
o (4.1)
water
sampleo Catd
)6.15( (4.2)
Pour Point
Pour point bath model K46100 from Koehler Instrument Company which conforms
to ASTM D9 used to measure pour point for each crude oil. Pour point bath required a
pressure vessel and a water bath in addition. The pour point bath consisted of 4 litres water
cooling bath with cover, which is equipped with an opening for one air jacket, a stopper and
a borehole for thermometer. Crude oil was cooled at specified rate and examined the flow
characteristics. The lowest temperature at which crude oil will flow is observed and stated
as pour point.
Viscosity, Shear Rate and Shear Stress
Viscosity, shear rate, and shear stress of the water-in-crude oil emulsions in this
study were determined by Brookfield Rotational Digital Viscometer Model LV/DV-III with
UL adaptor. The Brookfield Viscometer apparatus was equipped with a water bath
thermostat, a spindle set, and software of Brookfield Rheocalc Version 1.2. A smaller
diameter spindle (type‟s spindle 31) was used to measure the emulsions‟ viscosities with a
cell containing approximately 10 mL of sample. This type of measurement is usually
referred as Couette method, and it measures the fluid parameters of shear stress and
viscosity at given shear rates. The principle of operation of this unit is to drive a spindle
which is immersed in the sample. The measuring range is determined by the rotational
speed of the spindle, the container the spindle is rotating in and the full scale torque of the
spring. The rheometer was thoroughly cleaned between measurements of different
emulsion samples.

80
Water Content
The crude oil was injected using syringe 10mL in Karl Fisher Analyzer model 787
KF Titrano brand Metrohm to analyse water content in crude oil. Karl Fisher is calibrated
to achieve standard drift value is below 20 or once condition of light remains on without
blinking, the 787 KF Titrano was ready for sample injected. The syringe with sample was
tare to zero and sample was injected through septum. The result of water content was
measured in unit of percent (%).
Interfacial Tension and Surface Tension
Surface and interfacial tension measurement standard test method (ASTM) is used
and the equipment is Surface Tension Analyzer model DST 60 A. This measurement was
equipped with ring and glass sample. Crude oil was inserted into the glass sample and the
ring was adjusted and the analyzer was calibrated at the surface of crude oil. Water was
inserted into the crude oil and the reading of interfacial tension perform was recorded. The
ring used in this method must kept under perfectly clean and dust free conditions. It was
cleaned by 70% ethanol and burnt with a blue flame from a Bunsen burner after every
application.
Droplet Size
The droplet size distribution of emulsion was observed and determined using Carl
Zeiss research microscope equipped with the digital camera and AxioVission AC image
analysis software. The measurement of emulsion was performed without further dilution of
emulsion. Approximately 3 images were randomly taken for each distribution and 100-400
droplets were counted to obtain droplets size distribution.

81
Wax Appearance Temperature (WAT)
The wax appearance temperature of crude oil was performed using Differential
Scanning Calorimetry (DSC) apparatus. Before experiment, all the crude oils are thermally
pre-treated; namely, the samples were heated to 80oC for 2 hours in water bath with closed
containers and shaken thoroughly to ensure complete dissolution of wax. Then the closed
containers are left to cool to room temperature. A 4-8 mg thermally pre-treated crude oil
specimen was then transferred into an aluminium crucible, which was then sealed and
weighed. The apparatus was continuously flushed with nitrogen at 20 mL/min, and an
empty crucible was held in the reference cell (Díaz-Ponce et al., 2010). Experiments were
carried out by heating the crucible to 80oC and keeping temperature for 1 minute then
cooled at a cooling rate of 5oC/min from 80 to -30
oC.
4.4.2 Chemical Characteristics
Crude Oil Separation
The procedures in separating asphaltenes and resins were modified from
Ariany(2004) and followed procedure from ASTM D2007-80. Crude oil was weighted
about 100 g and hexane slowly added into the crude oil with ratio 1:10. The solution was
stirred using magnetic stirrer and left in 6 hours to sediment precipitated. Two layers were
observed. The solution was filtered using membrane filter paper (0.22 µm) at funnel filter.
The precipitated was dried and evaporated at fumed hood. The precipitate contained
asphaltenes and solid, was filtered and dried at room temperature. In order to separate
asphaltene from solid, the dried precipitate was dissolved into toluene and centrifuged for
30 minutes at 3000 rpm. After supernatant liquid was separated from precipitate, the
precipitated solids were rewashed with toluene until clear rewashed toluene flow. The
asphaltene was acquired by evaporated the toluene of supernatant.
The supernatant liquid was poured onto the silica gel. The mixture was shaken using
mechanical shaker for 15 minutes at room temperature to ensure resins (absorbed fraction)

82
absorbed well onto the silica gel. The mixture was allowed stand for 30 minutes for
sedimentation and followed by filtration process to separate oil and silica gel with absorbed
fraction. After that, the mixture was dried by evaporating the solvent then the mixture
dissolved with 7% methanol in dichloromethane to desorbed resins from silica. Lastly, the
resins and clean silica was obtained after filtration and solvent evaporation.
Figure 4.3: Procedures for Recovering Asphaltenes and Resins
Source: Ariany (2004)
Hexane
Mixing
Left for 6 hours
Precipitate Supernatant
(liquid) Washing
Mixing
Drying Sedimentation
and Filtration Precipitated
(Asphaltenes
+Solids)
Mixing
Toluen
e
Centrifuging
Evaporating
Toluen
e Asphaltenes
Silica
Gel
Silica+
Adsorbed Fraction
Dissolved in 7%
methanol in
dichloromethane
Filtration
Adsorbed Fraction
+ Solvent
Evaporating Silica
Gel
Solvent
(Methanol +
dichloromethane) Resins
Crude Oil Hexane
Ratio 1:10
Solid
Oil-wax +solvent
(hexane)
Evaporating
Oil + wax
Without
active
fraction

83
Separation of Oil and Wax Precipitated
From sedimentation and filtration steps in supernatant liquid, the balance of
sedimentation was oil, wax and hexane. Meanwhile after filtration, the filtrate was silica
with absorbed fraction as shown in Figure 4.4 (Nemirosvkaya et al., 2005). Hexane was
evaporated in room temperature to ensure only oil and wax was left in further steps. The
oil-wax sample was weighted and petroleum ether was added as ratio 1:7. The mixing
process was done using glass rod to dissolve the sample. A 110mL of acetone was inserted
into the dissolved sample and stirred using magnetic stirrer in 5 minutes to execute the
homogenous sample. The samples were cooled in 2 hours at -20oC in the freezer. The next
process was filtration which the samples were filtrated (using Whatman no.1 filter paper)
through a Buchner funnel (d=15 cm). The precipitated sample was wax crystal and
supernatant liquid consisted of crude oil with solvent (acetone and petroleum ether). The
precipitated was washed with wash solvent until clean solvent flowed and dried in room
temperature was about 24 hours. The precipitated wax crystal was weighted each hour after
24 hours sample was dried to ensure the solvent was evaporated with ±0.001g from
previous weighted crystal wax. Meanwhile for pure oil, the supernatant liquid was
evaporated to obtain pure oil.
Figure 4.4: Separation Wax Crystal from Crude Oil
Non-volatile Oil Wax
1:7
Mixing
Petroleum ether Oil-wax sample
Acetone 110 mL
Mixing
Freezing at -20oC
Filtration
Supernatant
(Liquid)
Wax crystal
(precipitate)
Evaporating Drying

84
Functional Group Analysis
Fourier Transfer Infrared Spectrometer (FTIR) model Thermo Nicolet was used to
analyse the content of various functional groups in main natural surfactant of crude oil
which are asphaltenes and resins based on vibration of molecules. The sample was prepared
and inserted into pellet beside KBr powder. This KBr powder was utilised as die set before
recorded into FTIR spectrophotometer. The pellet was cleaned with acetone for each
sample analysis. In infrared spectroscopy, IR was passed through the asphaltenes and
resins. Infrared spectroscopy detects the vibration characteristics of chemical functional
groups in a sample. When an infrared light interacts with the matter, chemical bonds will
stretch, contract and bend. As a result, a chemical functional group tends to adsorb infrared
radiation in a specific wavenumber (cm-1
) range regardless of the structure of the rest of the
molecule. Table 4.1 listed the assignment of absorption bands in the 1800-1550 and 1100-
950 cm-1
region of IR-spectra of the crude oil fractions.
Table 4.1: Assignment of Absorption Bands of IR-Spectra of the Crude Oil Fractions
Functional group Absorption band (cm-1
)
Ester 1750-1710
Ketone 1730-1700
Aldehyde 1730-1690
Amide 1670-1620
Aromatic 1600
Nitro 1600-1480
Ether 1150-1050
Sulfoxide 1060-1020
Source: Midttun and Kvalheim (2001)
Table 4.2 listed the types of hydrogen bonding presence in asphalatenes within 3170-3500
cm-1
region of FTIR spectra.

85
Table 4.2: Assignment for Hydrogen Bonding in Asphaltenes
Types of hydrogen bonding Wavenumber (cm-1
)
OH-п 3500
Self-associated OH 3370
OH-ether O 3300
Cyclic OH 3240
OH-N 3170
Source: Chen et al. (1998)
4.5 DEMULSIFICATION PROCEDURES
The stable emulsion would be treated in demulsification part. The demulsification
experiments were performed using both methods; conventional heating and microwave
irradiation at 2450 MHz. using batch process. For conventional heating, chemical and
hotplate were selected as method in comparing with microwave radiation method. The
demulsification efficiency was evaluated by measuring the percentage of water separated
from the emulsion as a function of time. The amount of separated water is the most
appropriate measure of the emulsion stability of water-in crude oil (W/O) emulsions (Jiang
et al., 2007).
4.5.1 Microwave Oven
Elba domestic microwave oven model: EMO 808 SS was used in heating crude oil
emulsion samples (for batch heating process). The details of the Elba domestic microwave
oven was: its power consumption is 230 V~50Hz, 1400 Watts (microwave), 230 V at 1000
Watts (Heater) and its rated power outlet is 900 Watts at operation frequency of 2450 MHz.
The oven cavity dimensions are: 215 mm (H)*350 mm (W)* 330 mm (D), and oven
capacity 23 Litres.

86
For the batch microwave heating process, the top and bottom of the sample
container was covered with aluminium foil and was placed in the centre of the microwave.
Three thermocouples were inserted in the emulsion samples at different locations; top,
middle, and bottom, as shown in Figure 4.5 respectively. The emulsion samples were
heated with microwave radiation at 2450 MHz for a different microwave exposure time.
Temperature profiles of emulsions inside the cylindrical container during the batch
microwave heating were recorded by Pico-TC-08 data logger. In the conventional heating,
a hotplate was used for samples heating.
Figure 4.5: Schematic Diagram for Elba Microwave Model: EMO 808 SS
4.5.2 Conventional Methods
Emulsion was prepared by compared two ratios; 20-80 % W/O and 50-50 % W/O
emulsion. The chemical demulsifier was added into the emulsion at 1500 rpm in 30 seconds
to perform homogenous solution. The effectiveness of demulsifier was evaluated by
observing the percentage of water separation from gravity settling. The most effective
demulsifier in screening part was then compared with others demulsification methods. In
conventional heating method, the prepared emulsion was heated using hotplate in
prescribed condition to compare with microwave heating method. Temperatures at surface

87
and bottom beaker were measured using thermometer. While for gravity settling, emulsion
was prepared and separated by sedimentation.
4.6 DATA ANALYSIS
The experiment was analysed by observation free water forms at the bottom of
measuring cylinder and calculated as percentage water separation as shown in Equation 4.3.
This is the best indicator in measuring stability of emulsion and used from previous
researcher (Jiang et al., 2007). The amount of water separated or response of yield (%) was
calculated as equation below:-
Water separated (%) = volume of water (V), mL x 100 (4.3)
Original volume of water (Vo), mL
Each data collection would be performed in MATLAB (matrix laboratory) in plotting
functions of data collection.
4.7 OPTIMISATION
The results from the demulsification of microwave irradiation were used as the
variable in optimising the formulation in order to produce the best results in breaking the
prepared emulsion by using experimental design. An experimental design determined the
effect of the independent variables on the dependent variable (response) which then the
relation between them illustrated through a regression model. In this section, the software
Design Expert (Trial Version 6.0.8, Stat-Ease Inc., Minneapolis, MN) was employed for
experimental design, data analysis and modelling of experiment. The central composite
design (CCD) of response surface methodology was used to obtain data that fits a full
second order polynomial in five replicates at the centre of the design to allow for estimation
the pure of sum squares (Wang et al., 2008).

88
4.7.1 The Method of Factorial Experiment
There are many types of factorial experiment, but only 2 levels, i.e. the 2k factorial
experiments used in this study. As denoted 2k, 2 refer to level and k is for variable
investigated in the study. The method of factorial experiments has been design to allow the
effects of a number of experimental variables on the yield to be investigated
simultaneously. It gives the „main effects‟ and „interaction effects‟ of the changing its value
from lower to higher level. The main effect of an experimental variable is defined as
average of the effects of changing its value from the lower level to upper level among all
the experiments. It is derived by assuming that the experimental variable is an independent
variable and all the variations in its effect due to experimental errors only. The interactive
effects between two or more experimental variables are calculated on the assumption that
the experimental variables are not independent but in fact interacting between them. In this
study two levels of factorial design were selected which 22 and 2
3 designs. These factorial
design were selected depend on the sample used after screening processes.
The 22 Design
For this type, emulsion prepared in crude oil B was used which two variables
involved between microwave power and time processing. The levels of each variable may
be arbitrarily called as „low‟ and „high‟ (Montgomery, 2001). The treatment combinations
can be displayed graphically as in Figure 4.6. The level of experiment variables in 22
factorial design is shown in Table 4.3 which x1 donates microwave power and x2 is time
processing of microwave, respectively.

89
Figure 4.6: Central Composite Designs for Optimisation of 22 Factorial Design
() Points of Factorial Design, (о) Axial Points and (□) Central Point
Source: Bezerra et al. (2008)
In the experimental design, all variables were coded. Once the desired range of values for
the variables are defined, they were coded to lie at ±1 for the factorial points, 0 for the
center points and ± ˛ for the axial points.
Table 4.3: Levels of the Experimental Variables in 22 Factorial Design
Level of Experiment Variables
Experiment
variables = -1 = 0 = +1 units
Power (x1) 540 720 900 Watt
Time (x2) 2 2.5 3 min
The 23 Design
Supposing there were three variables for both screening emulsions (crude oil A and
C) that are microwave power (x1), time processing (x2) and concentration of demulsifier
(X3). This design is known as 23 factorial design due to the number of variables involved
(Montgomery, 2001). The treatment combinations can be displayed graphically as in Figure
4.7. The level of experiment variables in 23 factorial design is shown in Table 4.4.

90
Figure 4.7: Central Composite Designs for the Optimisation of 23 Factorial Design
() Points of Factorial Design, (о) Axial Points and (□) Central Point
Source: Bezerra et al. (2008)
Table 4.4: Levels of the Experimental Variables in 23 Factorial Design
Level of Experiment Variables
Experiment
variables = -1 = 0 = +1 units
power 540 720 900 Watt
time 2 2.5 3 min
concentration 0.05 0.1 0.15 wt %
4.7.2 Optimisation Using Response Surface Methodology (RSM)
Respond surface methodology is a group of statistical techniques for empirical
model building (Lenth, 2009). Usually the response surface model can be classified in first-
order or second-order polynomial. The first-order function will be used if the response is
well modelled by a linear function of the independent variables.
kko xxxy ....2211 (4.4)
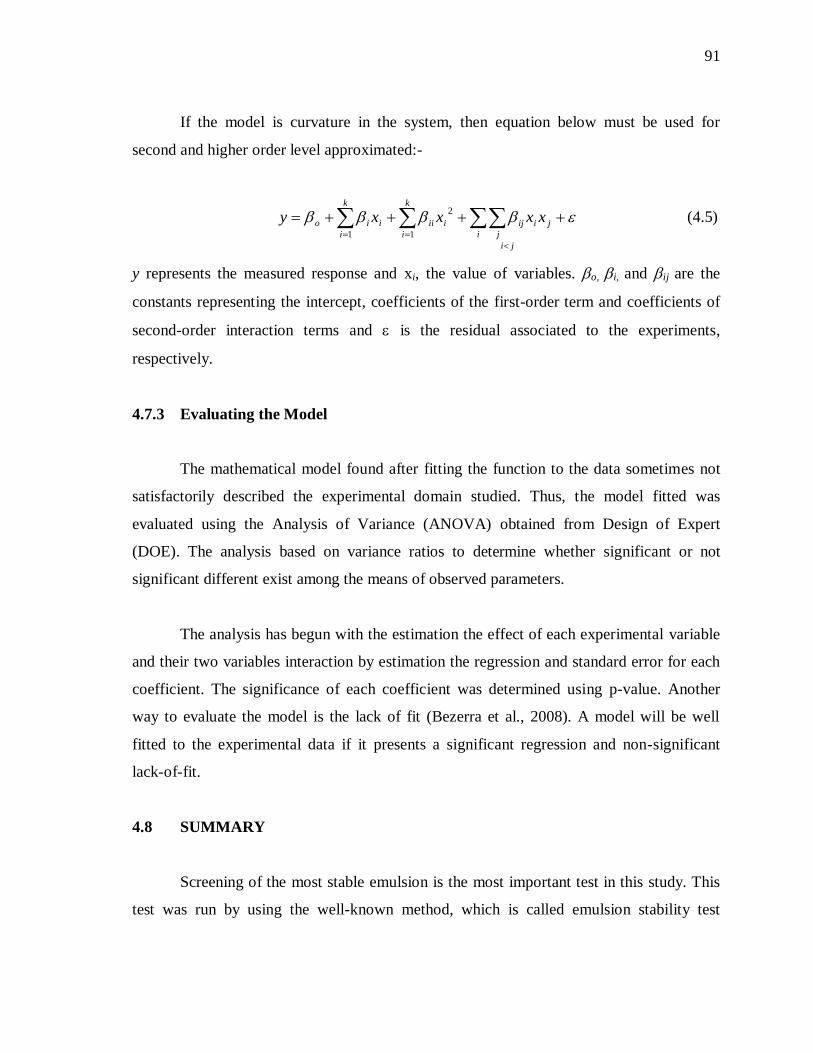
91
If the model is curvature in the system, then equation below must be used for
second and higher order level approximated:-
ji
i
ji
j
iji
k
i
iii
k
i
io xxxxy2
11
(4.5)
y represents the measured response and xi, the value of variables. o, i, and ij are the
constants representing the intercept, coefficients of the first-order term and coefficients of
second-order interaction terms and is the residual associated to the experiments,
respectively.
4.7.3 Evaluating the Model
The mathematical model found after fitting the function to the data sometimes not
satisfactorily described the experimental domain studied. Thus, the model fitted was
evaluated using the Analysis of Variance (ANOVA) obtained from Design of Expert
(DOE). The analysis based on variance ratios to determine whether significant or not
significant different exist among the means of observed parameters.
The analysis has begun with the estimation the effect of each experimental variable
and their two variables interaction by estimation the regression and standard error for each
coefficient. The significance of each coefficient was determined using p-value. Another
way to evaluate the model is the lack of fit (Bezerra et al., 2008). A model will be well
fitted to the experimental data if it presents a significant regression and non-significant
lack-of-fit.
4.8 SUMMARY
Screening of the most stable emulsion is the most important test in this study. This
test was run by using the well-known method, which is called emulsion stability test

92
assisted equipments depend on the types of emulsion rheology have been chosen and the
most stable emulsion was performed through percentage of water separated.
For the optimisation, parameters affected demulsification process in microwave was
selected to locate the optimum point in enhancing the percentage of water separated. Crude
oil A and C was used 23 factorial design while crude oil B occupied with 2
2 factorial design
due to the results in demulsification using microwave irradiation.

93
CHAPTER 5
CRUDE OIL EMULSION STABILITY
5.1 INTRODUCTION
For emulsion dispersion, which is not thermodynamically stable, the degree of
emulsion stability is very important. Thus, knowledge of the emulsion stability was
investigated closely before proceed with demulsification process. The stability of emulsion
was first determined by observing the physical separation of water after emulsion was
prepared and left in room in a certain time. Generally, greater separation phase separation
indicates lower emulsion stability with shorter shelf life.
5.2 CHARACTERISTICS OF CRUDE OIL
The stability of emulsion was investigated closely to the characteristic of crude oil.
Determine physical and chemical properties of crude oil are essential to get better
understanding of crude oil characteristics. The physical properties such as viscosity, shear
stress, density and surface tension, as well as for chemical properties; weight percentage of
asphaltenes, resins, solid particles and wax precipitated.
5.2.1 Physical Properties of Crude Oil
Each crude oil has own complexity nature in characteristics and offers individual
problems. The properties of crude oil is one of the crucial parts need to be studied to solve
and better understanding of emulsion problems encountered in oil field. Comparison studies

94
among the crude oil were listed in Table 5.1.Results had shown that crude oil C was the
heaviest and the lightest was crude oil B. Crude oil C acquired nearly density as crude oil
A. The density of all the types of crude oil exhibit almost same density while crude oil C
obtained the highest followed by crude oil A and B. This trend has good confirmation with
Ariany (2004), which viscosity changes in small magnitude usually proportional to density
change, whether caused by temperature or pressure. The different physical properties of
crude oil are obviously showed from API density which strongly agreed that crude oil C is
the heaviest crude oil.
The crude oil ceased to flow when reached pour point due to excessive amount of
wax crystal forming due to the build up of network wax crystal forming and the crude oil
gels under static condition (Zhu, 2008). From Table 5.1, crude oil A obtained the lowest
pour point (-20.4oC) while crude oil C acquired the highest pour point (-12
oC) whereas the
lower pour point would mean the gelling of oil in the wells will not be expected. This is
supported by Pedersen and Rnningsen (2000) which the network of wax crystal build up
was persuaded the value of pour point. As reported by Taraneh et al. (2008), the waxy
crystal behaves as typical homogenous liquid at temperature above pour point and the
amount of wax start to attain its saturation limit by forming a solid solution in the crude oil
at temperature lower pour point. In contrast, temperature at which the dissolved solids are
no longer completely soluble was measured using differential scanning calorimetry (DSC)
as the onset temperature of the exothermal peak observed upon cooling and called as wax
appearance temperature (WAT). Crude oil C, which presents the highest pour point,
displays higher with sharp peak of exothermal (Appendix A). High WAT cause greater
flow pressure and temperature drop, thus the WAT is good indicator of the pour point
(Alghanduri et al., 2010). The properties of crude oil also investigated closely for surface
tension analysis. From Table 5.1, crude oil C obtained the highest surface tension due to
high viscosity of crude oil thus increase force attraction between molecules.
Table 5.1: Physical Properties of Crude Oil

95
crude oil A crude oil B crude oil C
viscosity (cP) at 25oC 183.6 24.6 207.8
density (g/cm3) 0.8459 0.8345 0.8494
oAPI density 29.226 33.819 26.481
pour point (oC) -20.4 -19 -12
Wax Appearance Temperature
(WAT),oC
-1.18 3.11 4.44
Water content (%) 7 0.65 2
Surface tension (m/Nm) 13.276 13.046 13.659
5.2.2 Chemical Properties of Crude Oil
The composition of crude oil as explained in Chapter 4 shown in Table 5.2. Results
explained that crude oil C obtained the highest asphaltenes content followed by crude oil A
and B. From Auflem (2002) and Langevin et al. (2004), the asphalteness content can be a
good indicator in emulsion stability since asphaltenes play an important part in emulsion
stability. As postulated from El Gamal et al. (2005), at the interface, asphaltenes self
assemble to produce rigid film thus make a barrier in coalescence. The presence of resin
also persuade in the emulsion stability. However, high content of resin reduced the
emulsion stability due to the interaction of resins with asphaltenic aggregates render the
aggregates less interfacially active. Therefore, the ratio of resin to asphaltenes (R/A) can be
an important factor to identify the emulsion stability. As increasing R/A ratio, the
asphaltenes molecularly dissolved (Ali and Alqam, 2000; Mclean and Kilpatrick, 1997).
Results indicate crude oil B less stable crude oil compared to others crude oil. In contrast,
as studied the content of wax precipitated in the crude oil, crude oil C performed the higher
content of wax followed by crude oil B and A. This was proven by studied of physical
properties of crude oil which the higher wax crystal exhibited higher wax appearance
temperature. Solid particles have both hydrophilic and hydrophobic regions, so it would be
located at the oil-water interface. Therefore, the presence of solid particles at the interface

96
will enhance the stability of asphaltenes-resin film (El Gamal et al., 2005; Sullivan and
Kilpatrick, 2002).
Table 5.2: Chemical Properties of Crude Oil
Types of
crude oil
asphaltenes
(A)
resin
(R)
Oil Wax
solid
particles R/A non-
volatile volatile
crude oil A 11.00 21.60 33.49 16.97 2.74 14.20 2.70
crude oil B 5.94 32.33 45.51 0.32 5.11 9.77 11.0
crude oil C 14.7 23.80 29.01 5.28 11.81 15.27 2.03
Infrared analysis informs the functional groups exist in asphaltenes for crude oil A,
B and C as shown in Figure 5.1. Crude oil A, B and C indicate the presence of hydrocarbon
bonded such as OH due to the presence of hydrogen bonding between OH groups and
various hydrogen bonding acceptors such as ether oxygen and pyridinic nitrogen. Both
asphaltenes and resin had shown same trend with the spectra of crude oil (Appendix A). As
listed in Table 4.2 (in previous chapter) there were five types of hydrogen bonding existed
in asphaltenes (Chen, 1998). Figure 5.1 shows the strongest absorption ~ 3300 cm-1
that
OH-ether oxygen was the main hydrogen bonds in all types of crude oil studied. These
types of crude oil also contained large amounts of water, characterised by the large broad
band at 3400 cm-1
. Hence, as postulated by Woods et al. (2004), the peak also is attributed
to O-H or N-H stretching and associated hydrogen bonding. All crude oil also obtained
peaks in the 2830 and 2850 cm-1
which corresponding to CH2 and CH3 group. The range of
these peaks due to the CH bends for aliphatic group presented in asphaltenes. At~1600cm-1
,
the crude oil contain of aromatic groups. However this functional group indicates stronger
peak in crude oil B compared to other crude oils. The stronger peak of aromatic performs
lower asphaltenes (Hannisdal et al., 2005; Ariany, 2004).

97
Figure 5.1: FTIR Spectra for Asphaltenes of Crude Oil A, B and C
Resin is a component in crude oil that has dark colour in liquid or semisolid. The
functional groups of resin are also indicated in crude oil A, B and C. Figure 5.2 displays the
spectra of resin analyse using FTIR. The overall trend of spectra has similarity with
asphaltenes because resin also has polar group. A comparison of the subtracted spectra of
the each crude oil shows that crude oil A and B displayed the same trend. However, crude
oil C presents the aldehydes group at 2775.85 cm-1
which this interest area different with
both crude oil A and B. Aldehydes is part of aromatic group whereas the heavy crude oil
presents high aromatic content. This is supported by Hannisdal (2005) who studied the
relation of aromatic groups in crude oil. Meanwhile, aromatic compound also rest in range
1600-1450 cm-1
the peaks on figure show that each crude oil resin have similar aromatics
compound.
Wavenumber (cm-1
)
Tra
nsm
itta
nce
(%
)

98
Figure 5.2: FTIR Spectra for Resin of Crude Oil A, Crude Oil B and Crude Oil C
5.3 STABILITY CHARACTERISTICS OF CRUDE OIL EMULSION
The stability of emulsion is main element of water-in-oil (W/O) emulsion. The
characteristics of emulsion are investigated closely to better understand the effect of
parameters such as surfactant, stirring intensity, droplets size and volume fraction on
emulsion stability.
5.3.1 Effect of Surfactant Types on Stability of Emulsion
Emulsion was prepared at different surfactants to discover the most stable emulsion
as problems encountered in industry. The most important task in preparation of emulsions
is the selection of suitable surfactant which will satisfactorily emulsify the chosen
ingredients at a given temperature. It has long been recognized that with a homologous
series of surfactants, there is a relation between the contributions of the polar hydrophilic
Wavenumber (cm-1
)
Tra
nsm
itta
nce
(%
)

99
head and the nonpolar lipophilic tail which related to the polarity of surfactant (Chen and
Tao, 2005).
Figure 5.3 shows various types of surfactants were compared to investigate the most
stable emulsion performed in crude oil B. Span 83 (HLB=3.7) which is non-ionic group oil
soluble executed the most stable emulsion compared to other types of surfactant. As studied
by Opawale and Burgess (1998), who are investigated the rheological properties of sorbitan
fatty acid ester (Span) at water-oil interface, the sorbitan fatty acid ester (Span) is typically
used in preparing W/O emulsion. As observed until 180 minutes, there was no separation
occurring by using Span 83. Span 83 adsorbed onto surfaces with hydrophobic group
oriented toward the surfaces and making it more hydrophilic. This surfactant dissolved in
the crude oil as continuous phase, essentially non-polar in nature as compared to water, the
dispersed phase (water) in crude oil becomes covered with a single layer of surfactant
molecules and increased dissimilarity between droplets. By increasing dissimilarity
between two droplets, avoided droplets from coalesce and made system become stable.
As compared to the other types of surfactant, Tween 80 is non-ionic group and
water-soluble obtained the highest percentage of water separation (60 % after 60 minutes)
followed by Triton X-100 and SDDS. Triton X-100 (HLB= 13.5) same group as Tween 80
(15.0) with but Triton X-100 most soluble in water and miscible in most polar organic
solvents & aromatic hydrocarbons (Hait and Moulik, 2001). However within 180 minutes,
the percentage of water separated in the crude oil was only 56 % within 180 minutes by
gravitational settling. SDDS from anionic group obtained the higher percentage of water
separated compared with emulsion prepared in Span 83 due to the properties of surfactant
which an anionic group. From Chern and Lin (1996), this types of surfactant can impart
repulsive forces between similarity charged electric double layer to the particles of natural
surfactant i.e. asphaltenes and resin.

100
0 20 40 60 80 100 120 140 160 1800
10
20
30
40
50
60
Time (min)
Wate
r S
ep
ara
ted
(%
)
Span 83
SDDS
Triton X-100
Tween 80
Figure 5.3: Effects of Types of Surfactant on W/O Emulsion Stability (Experimental
Condition: Stirring Intensity = 1500 rpm; Processing Time=5 minutes)
5.3.2 Effect of Stirring Intensity (rpm) on Emulsion Stability
The stability of emulsion is also affected by stirring intensity. During
emulsification, interfacial area between two phases increase, therefore mechanical energy is
required to minimise the interfacial area and proceed with emulsification. The larger excess
of energy required to produce small droplets size using very intense agitation thus makes a
barrier of droplets to coalesce. The break-up of droplets depends strongly on the type and
intensity of the flow which is determined by the rotational speed and geometry of the
agitator (Hannisdal, 2005).
Figure 5.4 examines the effect of viscosity for crude oil A, B and C in 50-50 %
W/O and 20-80 % W/O emulsion as varied stirring intensity. From figures, higher ratio (50-
50 % W/O emulsion) has higher viscosity because the main attribution to the viscosity in
emulsion system is dispersed droplets (Urdahl et al., 1997). When droplets are introduced,
the flow system becomes distorted; hence the energy dissipation is increased. This
increment energy will lead to an increase in the viscosity of emulsion. For 50-50 % W/O
emulsion, crude oil C showed there was significantly increasing of viscosity. In contrast,

101
crude oil A and B show only slightly increasing and at 1500 rpm, emulsion prepared from
crude oil A and B began to form stable emulsion. This trend of results also can be
determined at lower ratio (20-80 % W/O emulsion).
500 1000 1500 20000
500
1000
1500
2000
2500
Stirring Intensity (rpm)
Vis
co
sity
(cP
)
crude oil A
crude oil B
crude oil C
(a)
500 1000 1500 20000
50
100
150
200
250
300
350
400
Stirring Intensity (rpm)
Vis
co
sity
(cP
)
crude oil A
crude oil B
crude oil C
(b)
Figure 5.4: Viscosity Effect at Varied Stirring Intensity (a) 50-50 % W/O (b) 20-80 %
W/O Emulsion
Further study of stirring intensity on water separated only could be observed in
crude oil B due to the properties of crude oil and after screening, crude oil A and C do not
separated through observation until 5 days. The percentage of water separated observed in

102
varied stirring intensity shown in Figure 5.5. Emulsion was processed at 5 minutes for each
mixing speed and using Span 83 as selected surfactant. Results acquired that higher stirring
intensity indicated more stable emulsion by observing the percentage of water separation.
At 500 rpm, after 15 minutes, the water resolved was 65 % as compared to 1500 rpm which
only achieved 5%. At lower stirring intensity, the surfactant does not well mixed with the
crude oil (not homogenous). Thus, the surfactant do not covered the droplets significantly
and rigid film do not formed. However, for the higher stirring intensity, the effectiveness of
surfactant to adsorb onto the droplets was increased. At higher stirring intensity, example
for this study, the maximum speed has been studied was 2000 rpm, the surfactant and crude
oil mixed well and the amphiphilic in the surfactant and play their parts very well and
adsorbed onto the droplets.
10 20 30 40 50 60 70 80 9032
34
36
38
40
42
44
46
48
50
Time (hrs)
Wate
r S
ep
ara
ted
(%
)
500 rpm 1000 rpm1500 rpm2000 rpm
Figure 5.5: Effect of Stirring Intensity on Emulsification
In addition, the agitation speed also persuaded the diameter of droplets and
provided information on the efficiency of emulsification process. Figure 5.6 demonstrates
the mean of droplets diameter, d at varied phase ratio for crude oil B where the size of
droplets (mean) is inversely proportional with stirring intensity. Both phases ratio showed
high discrepancy for droplets mean diameter and viscosity where 50-50 % W/O emulsion
obtained higher diameter and viscosity compared to 20-80 % W/O emulsion. For 50-50 %

103
W/O emulsion, the droplets mean diameter decrease significantly until 1500 rpm and
slightly decreased at 2000 rpm while 20-80 % W/O emulsion, there was slightly decreased
of droplets mean diameter within 1500 rpm and droplets decreased drastically at 2000 rpm.
The intersection of mean droplet diameter for 20-80 % and 50-50 % W/O emulsion can be
explained due to the stability of emulsion. Emulsion at this stirring intensity was believed
began to form a stable emulsion and after this stirring intensity the emulsion took a long
time to separate after left in room temperature. The higher stirring intensity also providing
the two-phase-oil-water system which more energy can generate drastic shear strength as
consequence leading to the water droplets being small.
500 1000 1500 200010
20
30
40
50
60
70
Stirring Intensity (rpm)
Mean
Dro
ple
ts D
iam
ete
r (µ
m)
50 -50 % W/O emulsion
20-80 % W/O emulsion
Figure 5.6: Mean of Droplet Diameter (µm) within 500 to 2000 rpm of Stirring Intensity
5.3.3 Effect of Temperature on Emulsion Stability
Temperature often has an indirect factor that affects the emulsion stability as
results of altering the interfacial tension and viscosity of emulsion. The effect of
temperature was examined at 20-80 % W/O and 50-50 % W/O emulsion. For both ratios,

104
viscosity of W/O emulsion is strongly augmented by decreasing temperature. According to
the ideal Stoke‟s Law for the creaming rate of emulsion, the gravitational instability rate of
emulsion is directly proportional with density different of continuous and dispersed phases
(ρo- ρw)
o
wO
m
gDv
18
)(2 (5.1)
If viscosity, µo (cP) is lower, the density different of continuous and dispersed phases
increased. Thus, lead the higher velocity of droplets, vm. As temperature increased, the
movement of droplets (velocity) also higher therefore enhance the droplets to coalescence.
Figure 5.7 (a) and (b) show decreasing of viscosity as augmented temperature.
However for crude oil B, at 90oC the deformability limit for the droplets is over and the
viscosity abruptly increased. The drastic increasing of viscosity in crude oil B is believed
because of the phase inversion occurs from W/O to O/W emulsion. Temperature is one of
factor changing the surfactant hydrophile-lipophile balance (HLB) in systematically varied
from predominantly oil-soluble to water soluble. At lower temperature, Span 83 is mainly
soluble in oil phase and as temperature increased to 90oC (crude oil B), the surfactant is
preferentially soluble in water phase.
Crude oil B obtained the lower viscosity compared to crude oil A and C. At
inversion point, the interfacial tension decreases favour the breaking process thus, produced
smaller droplets size and associated higher viscosity.

105
Temperature (oC)
20 30 40 50 60 70 80 900
200
400
600
800
1000
1200
1400
1600
1800
Vis
co
sity
(cP
)
crude oil A
crude oil B
crude oil C
(a)
20 30 40 50 60 70 80 900
100
200
300
400
500
600
Vis
co
sity
(cP
)
crude oil A
crude oil B
crude oil C
(b)
Figure 5.7: Effect of Temperature on Emulsion Stability at (a) 50-50 % W/O and
(b) 20-80 % W/O Emulsion
Figure 5.8 illustrates the effects of mean droplets size diameter as increasing
temperature when prepared at 1500 rpm for 20-80 % W/O and 50-50 % W/O emulsion. The
emulsion with higher ratio shows bigger in mean of droplets size compared to lower ratio
Temperature (oC)

106
with increasing temperature as decipted in Figure 5.8. This results was discussed in
previous figure (Figure 5.6) which at 1500 rpm, the mean droplet size has intersaction of
20-80 % and 50-50 % W/O emulsion. This is expected since higher ratio obtained the
emulsion become more viscous thus reduce the interaction among droplets. However for
50-50 % W/O emulsion observed there was drastically decreasing for mean of droplets size
from 27 m to 7.5 m at 90oC. This results explained the study was proven by Rusli
(2007), which the decreasing droplet size at higher temperature because of viscosity have
no longer effects to temperature. As droplets size increased, the specific surface area of
oil/water interface increased thus resulting strong interaction between them.
The emulsion which have relatively large droplet size (>10 µm), the relative
temperature is independent of the droplet size. As temperature increased, the viscosity
decreased thus the viscosity of emulsion is no longer independent factor. This result is
correlated with Zaki (1997) which, at higher droplet size, the hydrodynamic forces (hard-
sphere interaction) are dominant. While for smaller droplet size (<10 µm), the colloidal
surfaces and Brownian motion can be dominant.
20 30 40 50 60 70 80 90 1005
10
15
20
25
30
35
40
45
Em
uls
ion
Dro
ple
ts S
ize
(µm
)
20-80 % W/O emulsion
50-50 % W/O emulsion
Figure 5.8: Effect of Mean Droplet Diameter (µm) in Increasing Temperature
5.4 OTHER FACTORS CONTROLLING EMULSION STABILITY
Temperature (oC)

107
5.4.1 Rheological Properties of W/O Emulsions of Different Dispersed Volume
Fractions
The discussion of rheology has deal with the deformability and flow properties
which related to the viscosity of emulsion. Volume fraction of dispersed (water) phase is
varied from lower (10-90 % W/O) until 60-40 % W/O emulsion to identify the effect of
volume fraction of dispersed phase on emulsion stability.
Effects on Viscosity
As stated in literature part, viscosity can be though as resistance of fluid to flow.
The affecting factors are numerous and viscosity is one of the expected. If the internal
phase in an emulsion has a sufficiently high volume fraction, the emulsion viscosity
increased due to droplet crowding or structural viscosity become non-Newtonian until
achieved to the critical volume fraction. This expected result is proven by investigated the
effects of viscosity when changing the volume fraction of emulsion.
The effects of volume fraction and maximum volume fraction on viscosity are
described using the Krieger-Dougherty equation:-
2
1
m
c
(5.2)
Where η is viscosity of emulsion; ηc represents the viscosity of continuous phase (based on
this study, crude oil is continuous phase); Φ is phase volume of dispersed phase and Φm
denotes the maximum phase volume.
Effect of the viscosity on the volume fraction is shown in Figure 5.9 for all types of
crude oil used in this study. At low volume fraction (~0.15), the viscosity increased linearly
but as the volume fraction increased the viscosity increased steeper. However, when the

108
droplets are closed enough and exceed the limitation, the viscosity decreased drastically
due to changing the phase inversion of emulsion to oil-in-water. From Figure 5.9, the
critical volume fraction point for crude oil A, B and C are 0.5, 0.6 and 0.68, respectively.
This results is supported by Tadros (2009) which, random packing droplets might
start being in contact at a lower volume fraction. Earlier assumptions of phase inversion
were based on packing parameters. When volume fraction exceeds of maximum packing (~
0.64 for random packing and ~0.74 for hexagonal packing of monodisperse), critical point
of volume fraction reached. However, these assumptions are not adequate because there are
still emulsion invert at volume fraction values below than the maximum packing.
0 0.1 0.2 0.3 0.4 0.5 0.6 0.7 0.80
500
1000
1500
2000
2500
3000
3500
4000
Volume Fraction
Vis
cosi
ty (
cP)
crude oil A
crude oil B
crude oil C
Figure 5.9: An Influence of Phase Volume Fraction on the Emulsion Type and Viscosity
Effect of Interfacial Tension
Surface tension is a measure of the force at a boundary between condenses and gas
phase. If these attractive forces are between two immiscible liquids, which boundary

109
between two condensed phases, like oil and water, they are referred to as interfacial
tension. The interfacial tension of crude oil are important because they are also indicative
the ease of formation and emulsion stability. Figure 5.10, the overall trend of graph shows
that the interfacial tensions increased with density and drastically decrease as density is
further increasing. Emulsion prepared in crude oil A and C demonstrated there are linear
increasing of interfacial tension within density 0.923 and 0.92 g/mL and linearly decrease
within 0.94 g/mL. Also, as can be seen from Figure 5.10, in crude oil B, two peaks are
obtained before interfacial tension drastically decreases at 0.9172 g/mL. The increasing
density of emulsion has correlation with volume fraction which emulsion has changing
from a simple viscous solid at low volume fraction to an elastic solid having a substantial
shear modulus at higher volume fraction. Also, this elasticity results from work done
against interfacial tension to create additional droplet surface area when the shear further
deforms the compressed droplets. Thus, the definition from Bancroft (1912) could be
applied whereas the water acted as continuous phase due to the surfactant more soluble in
water.
From Rosen (2004), the changing of W/O to O/W emulsion as increasing volume
fraction due to the interfacial tension between the hydrophilic ends of the surfactant
molecules with water phase and oil phase molecules. For W/O emulsion, the water-
hydrophilic end tension was greater causing the film to be concave toward water. However,
as droplets increased until reached a critical amount, the oil-hydrophobic end tension was
greater causing the film toward the oil, resulting in the enclosure of the oil by the water.

110
0.86 0.87 0.88 0.89 0.9 0.91 0.92 0.93 0.940.5
1
1.5
2
2.5
3
3.5
4
4.5
Density (g/mL)
Inte
rfac
ial
Ten
sio
n (
mN
/m)
crude oil A
crude oil B
crude oil C
Figure 5.10: Interfacial Tension Effect of Emulsion by Varied Density
Effects of Shear Stress and Shear Rate
The shear stress versus shear rate profile is presented in Figure 5.11. The
rheological behaviour of an emulsion may be either Newtonian or non-Newtonian
depending upon its ratio. When shear stress is applied, Newtonian liquid flows as long as
stress is applied even after stress is removed (McClements, 2005). Figure 5.11(a) and (b)
show the shear stress is no longer linear as increasing the dispersed phase ratio which at 20-
80 % W/O emulsion, a straight line graph observed from shear stress versus shear rate.
While as increased the dispersed phase ratio, crude oil B and C obtained non-Newtonian
behaviour. As proposed from Chhabra, (2007) and Lee et al. (1997), as increasing dispersed
phase ratio, the emulsion behaviour more on non-Newtonian due to the alteration of
rheological properties of fluid flow condition. However, at 50-50 % W/O emulsion for
crude oil A, the emulsion follows Newtonian behaviour which as shear stress is applied, the
crude oil is flow continuously. This is due to the wax appearance temperature (WAT) of
crude oil higher (4.44oC) compared to others crude oils. Above the WAT, wax crystal

111
Shea
r S
tres
s (d
/cm
2)
Sh
ear
Str
ess
(d/c
m2)
dissolved although chemically very complex crude oil and performed a simple Newtonian
fluid (Li and Zhang, 2003).
2 4 6 8 10 12 14 16 1810
20
30
40
50
60
70
80
90
100
Shear Rate, dv/dy (1/sec)
crude oil A
crude oil B
crude oil C
(a)
2 4 6 8 10 12 14 16 180
20
40
60
80
100
Shear Rate, dv/dy (1/sec)
crude oil A
crude oil B
crude oil C
(b)
Figure 5.11: Effect of Shear Stress on Shear Rate with Varied Phase Ratio (a) 50-50 %
W/O (b) 20-80 % W/O Emulsion

112
Shea
r S
tres
s (d
/cm
2)
The crude oil A was investigated closely by increasing the phase ratio of water-
crude oil to 55-45 % W/O and 60-40 % W/O emulsion as shown in Figure 5.12. As
increasing the phase ratio, the emulsion behaviour as pseudoplastic which emulsion was
stretched and alignment while being sheared due to increasing the droplet content into the
crude oil. This result verified that higher phase ratio required from crude oil A to behave as
non-Newtonian due to the content of wax-precipitated in crude oil A was lower than crude
oil C and B.
2 4 6 8 10 12 14 16 1810
20
30
40
50
60
70
80
90
Shear Rate, dv/dy (1/sec)
55-45 % W/O emulsion
60-40 % W/O emulsion
Figure 5.12: Effect of Shear Stress on Shear Rate in Crude Oil A by Increased the Ratio
The effect of phase ratio in examining the emulsion behaviour was confirmed by
plotting apparent viscosity versus shear rate as shown in Figure 5.13. At higher phase ratio,
the apparent viscosity of crude oil B and C clearly decreased as increasing shear rate thus
verified the emulsion pursued pseudoplatic behaviour. The gradual break-up of
interparticles structure may be primarily responsible for this behaviour. While, crude oil A
obtained a slightly decreased of apparent viscosity at lower shear rate and begun to be
constant at higher shear rate.

113
However, at lower phase ratio, all the crude oil confirmed act as Newtonian
behaviour whereas the apparent viscosity is independent with shear rate because the
flocculation of droplets does not take place due to the amount of droplets present in the
emulsion was smaller.
2 4 6 8 10 12 14 16 181
2
3
4
5
6
7
8
9
10
Shear Rate (1/sec)
Ap
pare
nt
Vis
co
sity
crude oil A
crude oil B
crude oil C
(a)
2 4 6 8 10 12 14 16 180
1
2
3
4
5
6
Shear Rate, dv/dy (1/sec)
Ap
pare
nt
Vis
co
sity
crude oil A
crude oil B
crude oil C
(b)
Figure 5.13: Shear Rate Dependence on Viscosity of Emulsion with Varied Phase
Ratio (a) 50-50 % W/O Emulsion (b) 20-80 % W/O Emulsion

114
Crude oil A was further investigated in behaviour of emulsion by increased phase
ratio to 55-45 % W/O and 60-40 % W/O emulsion. The results display in Figure 5.14 was
showed that the apparent viscosity decreased as increasing shear rate. Emulsion in both
ratios exhibited non-Newtonian behaviour due to trend of graph obtained. This was
supported the discussion of shear stress against shear rate at same ratios in crude oil A.
2 4 6 8 10 12 14 16 183.5
4
4.5
5
5.5
6
6.5
Shear Rate, dv/dy (1/sec)
Ap
pare
nt
Vis
co
sity
55-45 % W/O emulsion
60-40 % W/O emulsion
Figure 5.14: Effect of Apparent Viscosity on Shear Rate in Crude Oil A at 55-45 %
and 60-40 % W/O emulsion
5.5 SUMMARY
The overall stability of emulsion was influenced by the characteristics of crude oil
itself. The heavy crude oil obtained the higher percentage of asphaltenes and wax-
precipitated thus enhance the non-Newtonian behaviour as increased the volume fraction of
emulsion. Thus, from this study, crude oil C acquired the heaviest crude oil, followed by
crude oil A and B. The rheological of emulsion plays an important role in the phase
inversion of emulsion from water-in-oil (W/O) to oil-in-water (O/W).

115
CHAPTER 6
MICROWAVE DEMULSIFICATION STUDY ON WATER-IN OIL (W/O)
EMULSION
6.1 INTRODUCTION
The types and mechanisms of demulsification process as reviewed in section 2.9 for
the overall demulsification methods (Chapter 2) and details of microwave demulsification
was discussed in Chapter 3. Chapter 5 was mainly concerned with the problems involved in
the production, formation and stabilisation of water-in-oil (W/O) emulsions. This chapter
on the other hand, focuses on reducing the stability of existing emulsions, i.e.,
demulsification or emulsion breaking.
This chapter presents and analyses results of an alternative of cost effective
technology of high frequency energy separation of crude oil emulsions via microwave field
irradiation in comparison with the conventional breaking methods.
6.2 EXPERIMENTAL RESULTS FOR MICROWAVE IRRADIATION
Experiments were carried out using water and crude oils in microwave irradiation. It
can be seen in Figure 6.1, water obtained higher temperature compared to crude oil because
water has dipole moments thus more rapid temperature can be arises. However at 80 sec
(T= 105oC), temperature rise for water began to constant because temperature rise in water
is more uniform than oil since more convective mechanisms existence in water.

77
Water is becoming a vapour but, temperature of crude oil is increasing. Temperature
difference of water and crude oil are explained by polarisation. The temperature in crude oil
B and C show higher increasing compared to crude oil A due to the content of wax
precipitated in the crude oil. Wax is non-polar, thus in crude oil A the efficiency of crude
oil in microwave is reduced thus correlated also with the temperature rise. By comparing
crude oil B and C, it shows that crude oil C which exhibited highest asphaltenes content
acquired the highest temperature rise between the others crude oil. This trend was first
detected by Gunal and Islam (2000) who mentioned that under the influence of microwave
irradiation, the temperature rise increases due to the greater impact at higher concentration
values of asphaltenes.
The heating rate was calculated by divided temperature increasing with microwave
radiation time. Results in Figure 6.1b show that the correlation of heating rate was inversely
proportional with radiation. This is expected since the dielectric loss to the wall is small.
The average of heating rate in water, crude oil A, B and C were 0.867, 0.218, 0.497 and
0.257 oC/sec. At early stage in microwave irradiation, crude oil B obtained the higher
heating rate compared with crude oil C. However, as time increased the heating rate of
crude oil B is reduced than crude oil C. This unstable heating in crude oil B obtained due to
the properties of crude oil B itself was lighter than crude oil C. Al-Ayed (2009) has studied
the contribution of heavy component into heating rate which heating rate higher at lower
viscosity of crude oil and can be clarified as smaller heavy component.

78
Tem
per
ature
(oC
) T
emper
ature
(oC
)
20 40 60 80 100 120 140 160 18030
40
50
60
70
80
90
100
110
Radiation Time (sec)
watercrude oil Acrude oil Bcrude oil C
(a)
20 40 60 80 100 120 140 160 1800
0.2
0.4
0.6
0.8
1
1.2
1.4
1.6
1.8
Radiation Time (sec)
water
crude oil A
crude oil B
crude oil C
(b)
Figure 6.1: Temperature (a) and Heating Rate (b) as Function Microwave Radiation
Time by Comparing Water with Crude Oils

79
6.3 EFFECT OF WATER-OIL RATIO ON TEMPERATURE DISTRIBUTON
The heaviest crude oil, which crude oil C was further investigated in temperature
distribution under microwave irradiation. Figure 6.2 shows that increasing ratio of water-oil
phase caused the temperature distribution increased. 10-90 % W/O emulsion performed the
lowest temperature increased within 220 seconds; the maximum temperature achieved was
85.11oC. In contrast, for higher ratio, at 220 seconds, temperature distribution could be
higher as 120oC for 50-50 % W/O emulsion and 106
oC for 30-70 % W/O emulsion. This
was due to the content of dispersed phase was lesser than 30-70 % W/O and 50-50 % W/O
emulsion. However, the temperature distribution of 50-50 % W/O has same trend with 30-
70 % W/O emulsion due to rapid heating at higher phase ratio. The average temperature
distribution for 10-90 % W/O, 30-70 % W/O and 50-50 % W/O emulsion were 61.67,
80.52 and 83.14oC. Thus, as phase ratio increased more readily microwave irradiation is
absorbed and higher temperature is obtained.
0 50 100 150 200 25040
50
60
70
80
90
100
110
120
130
Radiation Time (sec)
50-50 % W/O emulsion
30-70 % W/O emulsion
10-90 % W/O emulsion
Figure 6.2: Effect of Temperature Distribution at Varied Phase Ratio
Tem
per
atu
re (
oC
)

80
6.4 EFFECT OF MICROWAVE POWER ON W/O EMULSION
The effectiveness of microwave power was first determined by observing the
physical phase separation which the higher percentage of water separated indicates the most
effective microwave power in demulsified emulsion. Figure 6.3 presents the efficiency of
water-oil separation by varying microwave power. Increasing microwave power up to 720
W (96 %) causes a substantial efficiency in phase separation. After that, the phase
separation decreased to 80 % within 60 minutes. As microwave power increased, the
percentage of water separated increases due to high dielectric properties. However, from
Figure 6.3, at 900 W the percentage of water separated decreased because emulsion from
crude oil A and C contained higher natural surfactant thus at higher power, temperature
increases rapidly and thermal heating arises.
5 10 15 20 25 30 35 40 45 50 55 600
20
40
60
80
100
Time (min)
Perc
enta
ge o
f W
ater
Sep
arat
ed (
%)
360 W
540 W
720 W
900 W
Figure 6.3: Microwave Power Effect on Water Separation
The effects of microwave power with radiation time was examined and results
shown in Figure 6.4. Microwave power significantly influences the rate of temperature rise.
When the emulsion was exposed to 900 W, the average heating rate is approximately

81
Hea
ting R
ate
(oC
/sec
)
0.596oC/sec. The average heating rate decreased as microwave power decreased. With an
increment microwave power from 360 W to 900 W, the heating reached 0.225oC/sec and
0.596oC/sec respectively with the same exposure time. For higher microwave power, the
temperature is greater near the top surface and locally high inside the layer. Furthermore,
this is evident that there has correlation between heating rate and microwave power. The
increasing of heating rates with microwave power is caused by increasing the absorption of
microwave energy because the power absorbed increases with the square of the internal
electric intensity. The relation between microwave power dissipated absorbed by a material
with dielectric field electric intensity has been given in Equation 6.1:-
22''2 EEfP o (6.1)
where P is microwave power dissipated per unit volume, E is electrical field intensity and
is electrical conductivity. This relationship shows that the energy dissipation is
proportional to the electrical conductivity.
0 50 100 150 200 2500
0.5
1
1.5
Radiation Time (sec)
900 W
720 W
540 W
360 W
Figure 6.4: Heating Rate in Microwave Power with Variation Time

82
The effect of wavelength, and penetration depth, Dp at varied microwave power
from 360 W to 900 W were investigated within radiation time as shown in Figure 6.5. From
Figure 6.5, at high microwave power, 900 W, both wavelength and penetration depth were
increased and their values were found to be 2.25 cm and 12.00 cm, respectively. Both
wavelength and penetration depth significantly increased at 360 to 540 W and at higher
microwave power, the wavelength and penetration depth showed slightly increasing
because of more intense electromagnetic inside the molecules. At higher microwave power,
waves can transmit through the water layer rapidly thereby less amount of waves loss at the
wall of the sample‟s beaker due to the decreasing of dielectric constant. The decreasing in
dielectric constant is attributed to the higher temperature within the water layer since the
electromagnetic field is more intense.
300 400 500 600 700 800 9002.05
2.1
2.15
2.2
2.25
2.3
Wav
ele
ng
th (
cm
)
300 400 500 600 700 800 9008
9
10
11
12
13
Micowave Power (W)
Pen
etr
ati
on
Dep
th (
cm
)
Figure 6.5: Wavelength (cm) and Penetration Depth (cm) Affected within 360 W to
900 W in Microwave Power

83
6.5 SEPARATION OF WATER FROM EMULSIONS
6.5.1 Comparison between Microwave Irradiation and Conventional Methods
The comparison of conventional and microwave demulsification methods were
reflected in Figure 6.6 and 6.7. The figures illustrated that at crude oil B, the microwave
demulsification offered rapid separation compared to conventional methods, whereas the
emulsion was totally demulsified within 30 hours in microwave irradiation compared to
chemical demulsifier was separated entirely in 100 hours. This was because of microwave
quickly heat emulsion, huge temperature rises and reducing the viscosity of continuous
phase, thus favouring the contact among water droplets and coalesce the droplets. Besides,
microwave is non-destructive method on emulsion, do not required addition of chemical
agents, which do not implies for further waste water treatment (Rajakovic and Skala; 2006).
The percentage of water separation for both conventional and microwave method was
higher at 50-50 % W/O emulsion. As mentioned in stability part, at higher phase ratio, the
droplets tends to interact each other and agglomerate thus perform coalesce. However for
both ratios, emulsions could not be treated by using gravity settling due to the high stability
of emulsion. As expected, the demulsification efficiency for each crude oil decreases from
lighter to heavy crude oil emulsions as a consequence of the higher stability of the emulsion
because of the higher content of asphaltenes and resins in the crude oil, ultimately the
higher viscosity.
The time required for crude oil A and C for demulsification process is relatively
long which within 20 to 40 hours. However, the other researches performed the chemical
demulsification of W/O emulsion in a few minutes to one hour (Zhang et al., 2005; Kim et
al., 1995). Most of the chemical demulsification studies described in papers have been
conducted using lower asphaltenes fraction in which emulsion stability relatively lower
than this study.

84
0 20 40 60 80 100 1200
10
20
30
40
50
60
Time (hrs)
Wate
r S
ep
ara
ted
(%
)
gravity settling
hotplate
chemical demulsifier
microwave
(a)
0 20 40 60 80 100 120-40
-20
0
20
40
60
80
100
Time (hrs)
Wate
r S
ep
ara
ted
(%
)
gravity settling
hotplate
chemical demulsifier
microwave
(b)

85
0 20 40 60 80 100 1200
2
4
6
8
10
12
14
16
18
20
Time (hrs)
Wate
r S
ep
ara
ted
(%
)
gravity settling
hotplate
chemical demulsifier
microwave
(c)
Figure 6.6: Comparison of Conventional and Microwave Methods in Demulsified W/O
Emulsion for 20-80 % W/O Emulsion (a) Crude Oil A (b) Crude Oil B (c)
Crude Oil C
0 20 40 60 80 100 1200
10
20
30
40
50
Time (hrs)
Wat
er
Sep
ara
ted
(%
)
gravity settling
hotplate
chemical demulsifier
microwave
(a)

86
0 20 40 60 80 100 1200
10
20
30
40
50
60
70
80
90
100
Time (hrs)
Wate
r S
ep
ara
ted
(%
)
gravity settling
hotplate
chemical demulsifier
microwave
(b)
0 20 40 60 80 100 1200
10
20
30
40
50
60
70
Time (hrs)
Wate
r S
epara
ted (
%)
gravity settling
hotplate
chemical demulsifier
4th degree
microwave
(c)
Figure 6.7: Comparison of Conventional and Microwave Methods in Demulsified W/O
Emulsion for 50-50 % W/O Emulsion (a) Crude Oil A (b) Crude Oil B (c)
Crude Oil C

87
Yang et al. (2009) and Xia et al. (2004) have reported that microwave irradiation
can accelerate the efficiency of W/O emulsion separation without use the additives.
However, in this study, crude oil A and C could not be broken using microwave irradiation
alone. For these emulsions, it was necessary to add a demulsifier agent before microwave
irradiation. Thus, for crude oil A and C, demulsifier was added into the emulsion and
results presented in Figure 6.8. As shown in figure, the demulsification efficiency increased
by assisted of demulsifier under experimental conditions, having been irradiated for 3
minutes at 720 W. For both crude oil, the percentage of water separated increased within 60
minutes and crude oil A obtained higher efficiency in separation compared to crude oil C
due to the lower viscosity in crude oil properties. This could be proven by observing from
Figure 6.8 which, in 5 minutes crude oil A for 50-50 % W/O emulsion clearly separated
about 48 %. However for 20-80 % W/O emulsion, flocculation was observed in 64 %.
While within 60 minutes, the percentage of water separated increased up to 88 % and 70 %
for 50-50 % W/O and 20-80 % W/O emulsion.
Figure 6.9 also demonstrates the phase separation of crude oil C for 20-80 % W/O
and 50-50 % W/O emulsion. Both ratios showed the flocculation occurred after 5 minutes
of crude oil being irradiated whereas emulsion do not totally separated. In Figure 6.8, crude
oil C at 50-50 % W/O emulsion separated about 65 % within 60 minutes and for 20-80 %
W/O emulsion, the percentage of water separated is 40 %. Crude oil A and C acquired the
percentage of water separated in emulsion increased as phase ratio increases. This was due
to the acceleration of demulsifier through emulsion before irradiated in microwave
irradiation. Still, these results were contrasted with previous researcher (Guzmán-Lucero et
al., 2010), who studied. the effect of demulsifier in microwave effect which 95% of water
could be removed within 30 minutes due to the dissimilarity natural surface active
presented whereas about 15 wt%, two times smaller than this study.

88
10 20 30 40 50 60 70 80 90 100 110 1200
10
20
30
40
50
60
70
80
90
Time (min)
Perc
enta
ge o
f W
ater
Sep
arat
ed (
%)
crude oil A, 50-50 % W/O
crude oil C, 50-50 % W/O
crude oil A, 20-80 % W/O
crude oil C, 20-80 % W/O
Figure 6.8: Demulsification Efficiency in Microwave Irradiation during 60 Minutes for
Crude Oil A and C with addition 0.1% of Demulsifier
(a)

89
(b)
Figure 6.9: Photography of Emulsion after Irradiation in 3 minutes for Crude Oil A
and C with 0.1 % Demulsifier at (a) 50-50 % W/O Emulsion (b) 20-
80 % W/O Emulsion within 5 minutes Observing the Phase Separation
6.6 COMPARISON BETWEEN MICROWAVE IRRADIATION AND
CONVENTIONAL HEATING
The fundamental in different method of transferring energy from the source to the
sample is the main benefit of utilizing the microwave irradiation compared to conventional
heating processing. The energy delivered to microwave-absorbing materials is directly
penetrated into the sample. The delivering energy generates heat by collisions dipole
moment molecules in the emulsion. Thus, the viscosities of microwave and conventional
heating can be examined due to the heat transfer mechanisms from both methods.
The viscosities of conventional and microwave irradiation for 50-50 % W/O and 20-
80 % W/O emulsion were shown in Figure 6.10. Both ratios showed the lowest viscosity
obtained once the emulsion was demulsified in microwave irradiation. Indeed, the
percentage of viscosity for 50-50 % W/O emulsion in both before and after demulsified in
microwave irradiation were higher than conventional method for crude oils A, B and C
were 87.3, 91.4 and 89 % while for conventional, the percentage decreasing viscosity in
crude oil A, B and C were 7.64, 32.34 and 20.4 %. This was because of the mechanisms of
heating emulsion in both methods was different. In conventional heating, heat was applied

90
to the surface of body, stimulating the outside molecules or atoms. The kinetic energy is
gradually transferred to the inside molecules or atoms until the whole body is heated. While
microwave irradiation allows volumetric heating of samples by penetrated the
electromagnetic wave (Mutyala et al., 2010).
The lower ratio (20-80 % W/O emulsion) also displayed the same result which,
viscosity of emulsion was reduced after demulsified in microwave irradiation. However,
the decreasing viscosity was lesser than higher ratio because of the content of droplets in
20-80 % W/O emulsion was lower than 50-50 % W/O emulsion. The effect of viscosity
was related to temperature. At lower phase ratio, the continuous phase content was
dominant thus temperature cannot distribute easily through the whole body of sample in
conventional heating. In microwave irradiation, the lower phase ratio reduce the efficiency
of electromagnetic to heat emulsion which water only was selected and has ability to absorb
electromagnetic field.
0
200
400
600
800
1000
1200
1400
1600
before MW CH
visc
osity
(cP
)
crude oil A
crude oil B
crude oil C
(a)
Vis
cosi
ty (
cP)

91
0
50
100
150
200
250
300
350
before MW CH
visc
osity
(cP)
crude oil A
crude oil B
crude oil C
(b)
Figure 6.10: Effect of Viscosity by Comparison Microwave (MW) and Conventional
Heating (CH) (a) 50-50 % W/O Emulsion (b) 20-80 % W/O Emulsion
The droplets size distribution of the crude oils before and after demulsified the
emulsion were illustrated in Figure 6.11 and 6.12. Figure 6.11 indicates the scatter of
droplets size in crude oil B higher compared to crude oil A and C due to the lower viscosity
of crude oil thus droplets can interact each other easily compared to crude oil A and C.
While when compared the crude oil A and C, crude oil C illustrated non-statistical
distribution due to the sedimentation and weak interaction between the droplets. This figure
supported the crude oil characteristics studied and discussed in Chapter 5. The droplets size
distribution can be concluded generally become much tighter as the droplets size is
increased.
Vis
cosi
ty (
cP)

92
(a) (b) (c)
Figure 6.11: Microscope Image of an Emulsion in Crude Oil A, B and C before
Demulsified in Microwave
After emulsions were demulsified in microwave irradiation, the droplets literally high
and scattered far away from each other and the droplet size distribution quite uniform. The
quite long distance between droplets existed in crude oil B. However, the size distribution in
crude oil A and C do not display high scattered of droplets because of the high viscosity of
the crude oil itself and this was reason for the lower separating of emulsion even demulsified
in microwave.
(a) (b) (c)
Figure 6.12: Microscope Image of an Emulsion in Crude Oil A, B and C after
Demulsified in Microwave
The effectiveness of microwave irradiation was also determined by observing the
droplets diameter of emulsion. According to Figure 6.13, the emulsion droplets were
dependent on the effectiveness of demulsification process in microwave irradiation. As
discussed previously, the emulsion do not separated in microwave irradiation and

93
demulsifier was added to enhance the separation process. This happens to all emulsions
except the emulsion prepared from crude oil B. Figure 6.13 showed the droplets diameter
before demulsified in microwave irradiation whereas emulsion in crude oil A and C
obtained 6.59 and 5.04 m smaller than three times emulsion prepared in crude oil B (18.59
m). The droplets diameter increases after demulsified in microwave irradiation as
postulated from Holtze et al. (2006), the heating increases with droplets size diameter. The
droplets diameter of emulsion increases after demulsified (Figure 6.14) in microwave
heating which for crude oil A, the mean droplets increase up to 12.1 µm. While for crude
oil B, the mean droplets diameter showed there was a slightly increasing about 19.5 µm due
to the droplets are expected coalescence each other and only small droplets can be observed
through microscope using 10x resolutions. Indeed, when studied the distribution of
droplets, emulsion in crude oil B obtained a uniform distribution compared before
demulsified emulsion due to the volumetric heating arises in microwave irradiation. From
figure, the droplets diameter from crude oil C cannot be examined because emulsion still
viscous and accumulate each other thus it was hard to measure droplets diameter. Besides,
Urdahl et al. (1997) postulated that viscosity is higher when the size distribution is narrow
due to the low degree of polydispersity.
0 5 10 15 20 250
5
10
15
20
25
30
35
Droplets Diameter (µm)
Fre
qu
en
cy
(%
)
d=6.59 ±11.71 µm
(a)

94
0 5 10 15 20 25 30 35 40 450
5
10
15
20
25
30
Droplets Diameter (µm)
Fre
qu
en
cy
(%
)
d= 18.59 ± 8.07µm
(b)
0 2 4 6 8 10 12 14 16 18 200
10
20
30
40
50
60
Droplets Diameter (µm)
Fre
qu
en
cy
(%
)
d=5.04 ± 1.99µm
(c)
Figure 6.13: Droplets Diameter (µm) before Demulsified in Microwave Irradiation (a)
Crude Oil A (b) Crude Oil B (c) Crude Oil C

95
0 10 20 30 40 500
5
10
15
20
25
30
35
40
Droplets Diameter (µm)
Fre
qu
en
cy
(%
)
d=12.1 ± 7.11µm
(a)
0 10 20 30 40 50 600
5
10
15
20
25
Droplets Diameter (µm)
Fre
qu
en
cy
(%
)
d=19.5 ± 13.21µm
(b)
Figure 6.14: Droplets Diameter (µm) before Demulsified in Microwave Irradiation (a)
crude oil A (b) crude oil B

96
6.7 EFFECT OF VOLUME FRACTION ON DIELECTRIC CONSTANT,
DIELECTRIC LOSS, WAVELENGTH AND MICROWAVE
PENETRATION DEPTH
Theoretically the effect of volume fraction on dielectric properties is important to
better understanding the interaction between droplets in the emulsion. Figure 6.15 shows
the effect of dielectric constant at 0.0625, 0.171 and 0.32 of volume fraction. By
measurements, it is observed that higher volume fraction (Φ = 0.32) obtained higher
dielectric constant within radiation time. It would seem reasonable to believe that at higher
volume fraction, more droplets exist thus higher interaction with the electric fields therefore
increase in the dielectric constant. However, the dielectric constant for higher volume
fraction (Φ = 0.32) decreases from 35.2 to 25.9 and lower volume fraction (Φ = 0.0625)
shows only slightly decreases from 9.1 to 7.6 because the abrupt changing of dielectric
constant at higher volume fraction compared to lower volume fraction due to the decreasing
of heat generation within radiation time and the compactness of molecules in these
emulsions. This results was supported the explanation from Calla et al. (2007) who studied
the effect of microwave irradiation with radiation time in soil.
20 40 60 80 100 120 140 160 180 200 2205
10
15
20
25
30
35
40
Radiation Time (sec)
Die
lect
ric
Co
nst
ant
0.32
0.171
0.0625
Figure 6.15: Effect of Dielectric Constant within Radiation Time

97
Figure 6.16 shows the effects of tangent loss with temperature in varied volume
fraction. It can be seen that the tangent loss exponential decreased as increasing
temperature when emulsion is heated under microwave irradiation. Volume fraction at 0.32
has a decreases tangent loss from 0.081 at 50.71oC to 0.052 at 106.14
oC can be explained
by the reduction of interaction matter with the electric field of the incident radiation.
Initially, the droplets absorb more electromagnetic wave due to the polar molecules exist in
the droplets. However, as radiation time increase, temperature also increase and lead the
decreasing of dielectric properties due to the decreasing of heat generation.
40 60 80 100 120 1400.04
0.045
0.05
0.055
0.06
0.065
0.07
0.075
0.08
0.085
Tan
gen
t L
oss
0.32
0.171
0.0625
Figure 6.16: Plots of Tangent Loss (tan δ) with Temperature (oC) in Varied Volume
Fraction
Volume fraction has the greater influence in microwave irradiation due to the
influence on dielectric properties. Figure 6.17 gives the effect of wavelength and
penetration depth at various volume factions. As revealed by the figure, the wavelength and
penetration depth decrease in all the range of volume fraction. As discussed in previous, the
increasing volume fraction leads to the increasing of the droplets interaction thus, the
propagate wave more rapidly thereafter penetration depth rapidly decreased. As mention
before, penetration depth is a depth which power has been attenuated to 1/e times
approximately. As electromagnetic introduced to the medium, the transmitted radiation
Temperature (oC)

98
would gets attenuated exponentially while passing through medium and acquired the higher
frequency. The microwaves operate at high frequency has a short wavelength which
corresponds to a smaller penetration depth (Rao et al., 1988; Rattanadecho, 2006).
0.05 0.1 0.15 0.2 0.25 0.3 0.35 0.42
3
4
5W
avel
egth
(cm
)
0.05 0.1 0.15 0.2 0.25 0.3 0.35 0.410
15
20
25
Volume Fraction
Pen
etra
tio
n D
epth
(cm
)
Figure 6.17: Effect of Penetration Depth, Dp and Wavelength, λm on Varied Volume
Fraction
A convenient expression for penetration depth, Dp as a function of permittivity, ε is
shown in Equation 6.2, respectively.
''
'
2eff
PD
(6.2)

99
6.8 OPTIMISATION
6.8.1 Optimisation for Crude Oil A
To study the optimisation of emulsion demulsification, three variables; microwave
power, microwave processing time and demulsifier concentration were investigated in
crude oil A. As discussed previously, emulsions of crude oil A can be separated by
chemical demulsifiers before microwave irradiation introduced. The water separation yield
obtained from experiments that based on the experimental design from Design of Expert
was given in Table 6.1.
Table 6.1: 23 Factorial Design with Response
Run Type
Factor A,
power
(Watt)
Factor
B, time
(min)
Factor C,
concentration
(wt %)
Response,
water separated (%)
1 Fact 540 2.0 0.05 30.8
2 Fact 900 2.0 0.05 28.8
3 Fact 540 3.0 0.05 34.8
4 Fact 900 3.0 0.05 24.6
5 Fact 540 2.0 0.15 34.0
6 Fact 900 2.0 0.15 36.0
7 Fact 540 3.0 0.15 34.2
8 Fact 900 3.0 0.15 30.8
9 Axial 540 2.5 0.10 40.8
10 Axial 900 2.5 0.10 32.0
11 Axial 720 2.0 0.10 36.2
12 Axial 720 3.0 0.10 38.0
13 Axial 720 2.5 0.05 40.8
14 Axial 720 2.5 0.15 44.6
15 Center 720 2.5 0.10 40.2

100
16 Center 720 2.5 0.10 42.8
17 Center 720 2.5 0.10 45.0
18 Center 720 2.5 0.10 44.6
19 Center 720 2.5 0.10 44.2
The analysis of variance (ANOVA) from DOE was analysed to measure the
variability of the observed response values as shown in Table 6.2. The value of R2
is
0.94801 which the second-order model explained about 94.801% of the variability
observed in the gain.
Table 6.2: Analysis of Variance (ANOVA)
Sum of Mean F Prob >
F
Source Squares DF Square Value
Model 617.457 9 68.6063 18.2351 <0.0001 significant
A 50.176 1 50.176 13.3364 0.0053
B 1.156 1 1.156 0.30726 0.5929
C 39.204 1 39.204 10.4202 0.0104
A2 102.257 1 102.257 27.1793 0.0006
B2 80.1946 1 80.1946 21.3152 0.0013
C2 0.09098 1 0.09098 0.02418 0.8799
AB 23.12 1 23.12 6.14514 0.0351
AC 14.58 1 14.58 3.87527 0.0805
BC 2.88 1 2.88 0.76548 0.4044
Residual 33.8609 9 3.76232
Lack of Fit 18.6289 5 3.72578 not significant
Pure Error 15.232 4 3.808
Cor Total 651.318 18
Std. Dev. 1.93967 R-Squared 0.94801
Mean 37.0105 Adj R2 0.89602

101
The application of the response surface methodology (RSM) yielded the following
regression equation. The empirical relationship between response and variables in coded
unit are summarised in Table 6.3 and the equation was given in Equation 6.3.
Table 6.3: Regression Coefficient Values for Response Surface
Coefficients Values
bo 42.9856
b1 -2.24
b2 -0.34
b3 1.98
b12 -6.1175
b22 -5.4175
b32 0.18247
b12 -1.7
b13 1.35
b23 -0.6
Y=42.9856–2.24X1-0.34X2+1.98 X3-6.1175 X12 -5.4175X2
2+0.18247X3
2 (6.3)
-1.7X1 X2+1.35X1 X3-0.6X2X3
Each of observation values yA is compared with predicted value, yo as shown in Table 6.4.
Table 6.4: Observed Response and Predicted Values
Actual value (yA) Predicted value (yO) Errors (yA-yO) Squared errors
30.8 31.2830 -0.4830 0.2333
28.8 27.5030 1.2970 1.6822
34.8 35.2030 -0.4030 0.1624
24.6 24.6230 -0.0230 0.0005

102
34.0 33.7430 0.2570 0.0661
36.0 35.3630 0.6370 0.4058
34.2 35.2630 -1.0630 1.1299
30.8 30.0830 0.7170 0.5141
40.8 39.1080 1.6920 2.8627
32.0 34.6280 -2.6280 6.9066
36.2 37.9080 -1.7080 2.9174
38.0 37.2280 0.7720 0.5959
40.8 41.1880 -0.3880 0.1506
44.6 45.1480 -0.5480 0.3003
40.2 42.9856 -2.7856 7.7594
42.8 42.9856 -0.1856 0.0344
45.0 42.9856 2.0144 4.0579
44.6 42.9856 1.6144 2.6064
44.2 42.9856 1.2144 1.4748
Sum of squared errors = 33.8609
Mean squared errors = 1.7822
The effects of microwave power, time processing and concentration of demulsifier
on the yield of water separation percentage, as well as their interaction are shown in Figure
6.18. An increasing microwave power resulted in higher percentage of water separation
while the percentage (yield) reached a maximum when both microwave power and time
processing up to a certain value, with no significantly further improvement thereafter. Time
processing and concentration of demulsifier in microwave irradiation had similar effect on
the yield. The yield increased to a certain value with elevating time and concentration
(Figure 6.18c). A different effect on the percentage of water separated was shown for
concentration of demulsifier. As shown in Figure 6.18b and c, there were plateau in relation
to concentration of demulsifier, indicating that the percentage of water separated increased
with increasing the concentration. High percentage of water separated could only be
produced at higher demulsifier concentration. Molecules presented in the emulsion could be

103
accelerated by increasing the concentration of demulsifier. Therefore, in this model,
microwave power acquired high effect on the percentage of water separated due to the fact
that the wavelength and penetration depth increases along with microwave power. Thus, the
ability of electromagnetic to penetrate into the emulsion could be evaluated by correlation
of both penetration depth and wavelength with microwave power. The overall results
obtained show that there are limitation of microwave power, time processing in microwave
irradiation and also concentration of demulsifier to achieve optimum point of water
separated. Based on Figure 6.18, the maximum yield of water separation predicted through
this model is 45.10 % at microwave power 710 W in 2.40 min with 0.15 wt% demulsifier.
(a)
(b)

104

(c)
Figure 6.18: Response Surface of Predicted Water Separated in Microwave Irradiation
by Interaction (a) Power-Time (b) Power-Concentration and (c) Time-
Concentration
6.8.2 Optimisation for Crude Oil B
The variables in optimisation of crude oil B involved microwave power and time
processing in microwave. The percentage of water separated in crude oil B obtained from
the experiments based on the experimental design are given in Table 6.5. The model was
considered as a second-order model for the transistor gain data. The combination of
variables can be treated as 22 factorial design using Yates‟ Method (Lazić, 2004) to
calculate response from main and interactive effects from the factorials.
Table 6.5: 22 Factorial Design with Response
Run Type Factor A, power
(Watt)
Factor B, time
(min)
Response, water
separated (%)
1 Fact 540 2.0 54.4
2 Fact 900 2.0 52.6
3 Fact 540 3.0 57.0
4 Fact 900 3.0 49.0
5 Axial 540 2.5 56.6
6 Axial 900 2.5 50.2

121
7 Axial 720 2.0 60.0
8 Axial 720 3.0 62.0
9 Center 720 2.5 65.8
10 Center 720 2.5 64.2
11 Center 720 2.5 63.6
12 Center 720 2.5 64.8
13 Center 720 2.5 63.0
Subsequently, the significance interaction of each factors were showed in an
analysis of variance (ANOVA) from Table 6.6. The factors can be declared as significant
when the Prob > F is less than 0.05, thus A and A2 are significantly model terms. The
"Lack of Fit F-value" of 2.73 implies the Lack of Fit is not significant relative to the pure
error. By analysis of variance, the R2 value of this model was determined to be 0.96451,
which showed that the regression model defined well the true behaviour of the system.
Table 6.6: Analysis of Variance (ANOVA)
Sum of Mean F
Source Squares DF Square Value Prob >
F
Model 388.011 5 77.6023 38.0462 <0.0001 significant
A 43.74 1 43.74 21.4445 0.0024
B 0.16667 1 0.16667 0.08171 0.7833
A2 242.433 1 242.433 118.858 <0.0001
B2 8.64266 1 8.64266 4.23725 0.0785
AB 9.61 1 9.61 4.7115 0.0666

122
Residual 14.2778 7 2.03969
Lack of
Fit 9.58982 3 3.19661 2.72748 0.1784
not
significant
Pure
Error 4.688 4 1.172
Cor Total 402.289 12
Std. Dev. 1.42818 R2 0.96451
Mean 58.7077 Adj. R2 0.93916
The application of the response surface methodology (RSM) yielded the following
regression equation. The empirical relationship between response and variables in coded
unit are summarised in Table 6.7. While the mathematical model representing the yield of
water separation percentage as a function of the independent variables within the region
under this study was expressed from Equation 6.4.
Table 6.7: Regression Coefficient Values for Response Surface
Coefficients Values
bo 63.8483
b1 -2.7
b2 0.16667
b12 -9.369
b22 -1.769
b1 b2 -1.55

123
Y= 63.8483-2.7 X1+0.16667 X2-9.369X12-1.769X2
2-1.55 X1X2 (6.4)
The yield or response expression to be optimised was the water separated in percent
(%). Table 6.8 listed the actual and predicted of responses from model. The differential
values between actual and predicted are ranging between -1.9 and 1.9. The comparison of
the error and squared error indicates that none of the individual error exceeds twice of the
squared root of the errors. Due to this smaller differential, the regression model indicates in
good adequacy.
Table 6.8: Observed Response and Predicted Values
Actual value (yA) Predicted value (yO) Errors (yA-yO) Squared errors
54.4 53.69368 0.706322 0.498891
52.6 51.39368 1.206322 1.455212
57 57.12701 -0.12701 0.016132
49 48.62701 0.372989 0.13912
56.6 57.17931 -0.57931 0.3356
50.2 51.77931 -1.57931 2.494221
60 61.91264 -1.91264 3.658206
62 62.24598 -0.24598 0.060505
65.8 63.84828 1.951724 3.809227
64.2 63.84828 0.351724 0.12371
63.6 63.84828 -0.24828 0.061641
64.8 63.84828 0.951724 0.905779
63 63.84828 -0.84828 0.719572
Sum of squared errors = 14.2778
Mean squared errors = 1.09829

124
The interaction and 3D graphs of optimisation in crude oil B arises between two
variables are identified and explained in Figure 6.19. Both variables obtain quadratic trend
of graphs however, microwave power has significant factor compared to time of microwave
processing. The reason for this result due to the characteristics of crude oil B which crude
oil B acquired a light type of crude oil. Thereby, the thermal heating occurred could be
avoided when demulsified under microwave irradiation. The thermal heating was correlated
to the higher temperature. In crude oil B, the light crude oil might have lower interaction of
molecules compared to heavy crude oil. Thus, as increasing time, only slightly temperature
increased arises in this type of crude oil. The maximum yield of water separation predicted
from the response surface under microwave irradiation illustrates in Figure 6.19b. The
response surface plot in figure shows this model is quadratic. The maximum yield of water
separation predicted through this model is 64.0661 % at microwave power 692 W in 2.56
min.
(a) (b)
Figure 6.19: Response Surface of Predicted Water Separated by Interaction Power (X1)
and Time (X2) in Microwave Irradiation (a) Interaction (b) 3D Graph
6.8.3 Optimisation for Crude Oil C

125
This crude oil also selected same variables (microwave power, time of microwave
processing and concentration of demulsifier) with factorial design 23 factorial design. The
water separation yield obtained from experiments that based on the experimental design is
given in Table 6.9.
Table 6.9: 23 Factorial Design with Response
Run Type
Factor A,
power
(Watt)
Factor B,
time
(min)
Factor C,
concentration (wt %)
Response,
water
separated (%)
1 Fact 540 2.0 0.05 28.6
2 Fact 900 2.0 0.05 30
3 Fact 540 3.0 0.05 26.2
4 Fact 900 3.0 0.05 30.2
5 Fact 540 2.0 0.15 32.4
6 Fact 900 2.0 0.15 30.4
7 Fact 540 3.0 0.15 28.8
8 Fact 900 3.0 0.15 32.4
9 Axial 540 2.5 0.10 32.4
10 Axial 900 2.5 0.10 36.2
11 Axial 720 2.0 0.10 36.0
12 Axial 720 3.0 0.10 32.2
13 Axial 720 2.5 0.05 38.0
14 Axial 720 2.5 0.15 38.0
15 Center 720 2.5 0.10 36.8
16 Center 720 2.5 0.10 36.0
17 Center 720 2.5 0.10 38.0
18 Center 720 2.5 0.10 38.0
19 Center 720 2.5 0.10 36.2

126
The analysis of variance (ANOVA) from DOE was analysed to measure the variability of
the observed response values as shown in Table 6.10. The value of R-squared from
regression coefficient table is 0.94389. That is, the second-order model explained about
94.389 % of the variability observed in the gain. The adjusted R2 for this model is 0.88777
which considered as good fit for the observed response values. The Prob>F values of the
model were 0.0001 which indicated that the model fitness was significant. The values of
Prob> F less than 0.05 indicate model terms are not significant, and in this crude oil, A, A2,
B2 and AB display the significant model terms. The „Lack of Fit F-Value‟ of 2.33 implies
the Lack of Fit is not significant relative pure error. Thus model was acceptable to fit.
Table 6.10: Analysis of Variance (ANOVA)
Sum of Mean F
Source Squares DF Square Value Prob >
F
Model 242.036 9 26.8929 16.8208 0.0001 significant
A 11.664 1 11.664 3.61273 0.0244
B 5.776 1 5.776 5.06633 0.0898
C 8.1 1 8.1 22.6082 0.0509
A2 36.1457 1 36.1457 25.1629 0.0010
B2 40.2302 1 40.2302 0.00676 0.0007
C2 0.01081 1 0.01081 5.2571 0.9363
AB 8.405 1 8.405 1.12898 0.0476
AC 1.805 1 1.805 0.02815 0.3157
BC 0.045 1 0.045 0.8705

127
Residual 14.3891 9 1.59879
Lack of
Fit 10.7091 5 2.14182 2.32807 0.2166
not
significant
Pure
Error 3.68 4 0.92
Cor Total 256.425 18
Std. Dev. 1.26443 R2 0.94389
Mean 33.5158 Adj. R2 0.88777
The application of the response surface methodology (RSM) yielded the following
regression equation. The empirical relationship between response and variables in coded
unit are summarised in Table 6.10 and the equation was given in Equation 6.5.
Table 6.11: Regression Coefficient Values for Response Surface
Coefficients Values
bo 37.4165
b1 1.08
b2 -0.76
b3 0.9
b12 -3.63711
b22 -3.83711
b32 0.06289
b12 1.025
b13 -0.475
b23 0.075

128
Y=37.4165+1.08 X1-0.76X1+0.9X3-3.63711 X12 -3.83711X2
2+0.06289X3
2 (6.5)
+1.025X1 X2-0.475X1 X3+0.075X2X3
where Y is the response of water separated and X1, X2 and X3 are the coded variables for
microwave power, time of processing and concentration of demulsifier, respectively.
Table 6.12 listed the actual and predicted of responses from model. The differential
values between actual and predicted are ranging between -1.41 and 1.66. The agreement
between actual and predicted value of percentage water separation yield confirmed the
significance of model. Thus, due to this smaller differential, the regression model indicates
in good adequacy.
Table 6.12: Observed Response and Predicted Values
Actual value (yA) Predicted value (yO) Errors (yA-yO) Squared errors
28.6 29.41015 -0.81015 0.656351
30.0 30.47015 -0.47015 0.221045
26.2 25.69015 0.509845 0.259942
30.2 30.85015 -0.65015 0.422701
32.4 32.01015 0.389845 0.151979
30.4 31.17015 -0.77015 0.593138
28.8 28.59015 0.209845 0.044035
32.4 31.85015 0.549845 0.30233
32.4 32.69938 -0.29938 0.089629
36.2 34.85938 1.340619 1.797258

129
36.0 34.33938 1.660619 2.757654
32.2 32.81938 -0.61938 0.383633
38.0 36.57938 1.420619 2.018157
38.0 38.37938 -0.37938 0.14393
36.8 37.41649 -0.61649 0.380066
36.0 37.41649 -1.41649 2.006458
38.0 37.41649 0.583505 0.340478
38.0 37.41649 0.583505 0.340478
36.2 37.41649 -1.21649 1.47986
Sum of squared errors = 14.3891
Mean squared errors = 0.75732
As shown in Figure 6.20a, there was an optimal value for microwave power and
time processing in microwave to obtain the highest percentage of water separated. Indeed,
microwave power and time processing arises a maximum point in the experimental region.
However both Figure 6.20b and c display there were plateau in relation to concentration of
demulsifier, which also as same in crude oil A that indicating that the concentration do not
affected in this microwave-assisted chemical system. This is due to the higher asphaltenes
presented in this crude oil. The content of asphaltenes in crude oil can be an indicator in
determining the viscosity of crude oil. Crude oil C had higher viscosity thus as increasing
the demulsifier concentration in the microwave-assisted system conveyed thermal heating
in microwave system. Thus, the concentration of demulsifier was allowed of 0.14wt% at
767 W in 2.50 min.

130
(a)
(b)

131
(c)
Figure 6.20: Response Surface of Predicted Water Separated by Interaction Microwave
Power (X1), Time Processing (X2) and Concentration of Demulsifier (X3) in
Microwave Irradiation
6.9 VALIDATION OF MODEL PREDICTION
Optimum variables gained by Design of Expert (DOE) will be used in order to
validate this predicted model. However, the microwave power obtained through this model
cannot be followed exactly due to the drawback of microwave power used. Table 6.13
indicates the optimum variables for each crude oil.
Table 6.13: Model Prediction Variables
Crude oil Microwave power (Watt) Time (min) Concentration (wt %)
A 710 2.40 0.15
B 692 2.56 -
C 767 2.50 0.14

132
Crude oil A was pursued the variables listed from Table 6.13. In contrast, the
microwave power in crude oil B and C were operated at 690 W and 770 W. The results
obtained in this validation model are shown in Figure 6.21. It seems that each crude oil
excellently break after 5 minutes as followed by response of prediction model. This results
proved that the W/O emulsion for each crude oil is better separation in both real and
prediction model. In this results, within 5 minutes, crude oil A obtained 44.0 % of water
separated, which is 1.1.0% lower than prediction model. While crude oil B shows that 60.0
% of water can be separated and 38.0% for crude oil C. The percentage of water separated
in crude oil B lower 4.0 % than predicted model. This is might be obtained due to the
microwave power operated was lower than predicted model. However, still W/O emulsion
can be separated in microwave irradiation and microwave-assisted chemical for heavy
crude oil.
10 20 30 40 50 6030
40
50
60
70
80
90
Time (min)
Perc
en
tag
e o
f W
ate
r S
ep
ara
ted
(%
)
crude oil A
5th degree
crude oil B
crude oil C
Figure 6.21: W/O Emulsion Demulsified Using Optimum Variables
Time (min)

133
6.9 SUMMARY
By comparing the effectiveness methods of microwave irradiation and conventional
methods in demulsification, microwave irradiation indicates the highest percentage of water
separation for lighter crude oil. However, for heavy crude oil which in this study, crude oils
A and C were treated in chemical demulsifier to accelerate the droplets in emulsion before
enhanced in microwave irradiation.
In optimisation part, crude oil A and C used 23 factorial design in modelling
experiments using design expert. In contrast, 22 factorial design was selected in crude oil B
due to the properties of crude oil and only this type of crude oil can be separated while
using microwave irradiation.

134
CHAPTER 7
CONCLUSIONS AND RECOMMENDATIONS
7.1 CONCLUSION
The behaviour of water-in-oil emulsion was investigated by studying the formation,
stabilisation and demulsification of emulsions by various methods (chemical
demulsifications and microwave irradiation). The principal objective of this study work
was to develop a better fundamental understanding of the mechanisms of emulsion
stabilisation, mechanisms of coalescence demulsification (emulsion breaking), as well as
microwave method for emulsion demulsification.
This chapter presents the main results discussed in chapter 5 and 6. In this study,
three types of crude oils were used namely; crude oil A, B and C. results showed crude oil
C is the heaviest and followed by crude oil A and B, respectively. Based on the results of
this study, it can be concluded that:-
7.1.1 Characterisation of Crude Oil and Stability of W/O Emulsion
According to the characterisation results of crude oil A, B, C and W/O emulsion
prepared from these crude oils, the following conclusion can be made:-
i. The physical properties of three types of crude oil showed that the range of viscosity
was between 24.6 to 207.8 cP; the API density obtained ranged from 26.481 to
29.226; pour point acquired value ranged from -12.0 to -20.4oC; wax

appearance temperature within range -1.18 to 4.44oC and for surface tension
analysis, the range within 13.046 to 13.659 m/Nm. While for chemical properties,
crude oil C obtained the highest asphaltenes content 14.7 wt%, followed by crude
oil A (11.0 wt%) and 5.94 wt% in crude oil B. Therefore, the presents of solid
particles in crude oil C was highest (15.27 wt %) followed by crude oil A (14.20 wt
%) and 9.77wt% for crude oil B. The analysis of the properties shows that there are
correlations between some physical and chemical properties of crude oil. For
instance, crude oil C whereas the heaviest crude oil indicated the higher asphaltenes
content and viscosity. In contrast, higher resin content performed the instability of
crude oil as following crude oil B>crude oil A>crude oil C. Besides, asphaltenes
and resins analysed by FTIR showed that they have functional groups of
hydrocarbon and aromatic.
ii. The analysis of the factor affected the stability of emulsion were demonstrated that
the emulsion prepared in crude oil C acquired the highest viscosity as comparing the
stirring intensity and temperature. Besides, phase inversion of W/O to O/W
emulsion investigated closely which caused at higher temperature and ratio. Crude
oil B showed that the W/O emulsion inversed to O/W at higher temperature (90oC)
and at 60-40 % W/O emulsion for all crude oil types, emulsions were inversed to
O/W. In addition the emulsion also varied with the ratio of water-oil to analyse the
rheology of emulsion. The behaviour of emulsion observed through plotting graph
shear stress versus shear rate and viscosity versus shear rate. Higher ratio (50-50 %
w/o emulsion) indicated emulsion behave as non-Newtonian for crude oil B and C
only. However, for crude oil A, the emulsion showed non-Newtonian behaviour at
higher ratio (55-45 % W/O emulsion) due to the content of wax in crude oil.
7.1.2 Demulsification
Analysis of demulsification was conducted by comparing microwave irradiation
with conventional methods such as chemical demulsification, thermal heating (hotplate)
and settling gravity. In optimisation, the optimum conditions in microwave irradiation of

percentage water separated were arises. The following of analysis in demulsification were
concluded below:-
i. There were no separation observed in emulsion prepared from crude oil A and C
compared to crude oil B after demulsified in microwave irradiation and
conventional methods. Thus, chemical demulsifier was added into emulsions from
crude oil A and C to accelerate the droplets in emulsion before enhanced using
microwave irradiation.
ii. The correlation of volume fraction of emulsion and microwave power with
dielectric properties, wavelength and penetration depth also discussed in
demulsification part. Volume fraction increased with increasing the dielectric
properties and has reversed correlation with wavelength and penetration depth due
to the efficiency of microwave absorption high. While, microwave power has
directly correlation with penetration depth and wavelength because of more
electromagnetic intense inside the water molecules.
iii. In optimisation part, the analysis of demulsification in microwave irradiation using
response surface methodology, two types of factorial designs selected which 22
factorial design for crude oil B and 23 factorial design for crude oil A and C. From
factorial design analysis, it was found that the optimum variables and yield
(percentage of water separation) in crude oil A which are 710 W in 2.40 min with
0.15 wt% of demulsifier and maximum yield of water separation predicted was
45.10 %. While in crude oil B, the maximum yield of water separation predicted
through this model is 64.07 % at microwave power 692 W in 2.56 min. The last
sample analysis was crude oil C whereas based on the model; the maximum yield of
water separation predicted through this model is 38.03 % at microwave power 767
W in 2.50 min with 0.14 wt% demulsifier.

7.2 RECOMMENDATIONS
Based on this study, some additional experiments in characterisation of crude oil are
suggested before demulsification is a`cquired. Therefore, some further studies are still
required as follows:-
i. For heavy crude oil, viscosity reduction is necessary to obtain the optimum viscosity
point by dilution of heavy crude oil with light crude oil.
ii. Instead of using bottle test to asses the emulsion stability, this study suggests water
concentration profile (hold-up) and coalescing interface behaviour as future
investigation or emulsion stability.

REFERENCES
Abdurahman, H. N., Rosli, M.Y. and Anwarudin, H. 2007. Water in crude oil emulsion: Its
stabilization and demulsification. Journal of Applied Science 7(22): 3512-3517
Abdurahman, H. N. and Rosli, M. 2006. A comparative study on emulsion demulsification
by microwave radiation and conventional heating. Journal of Applied Science 6(10):
2307-2311
Al-Ayed, O.S., Al-Harahsheh, A., Khaleel, A.M. and Al-Harahsheh, M. 2009. Oil shale
pyrolysis in fixed-bed retort with different heating rates. Estonian Academy
Publishers. Oil Shale. Vol. 26, No.2, pp.139-147
Alejandro, A.P., George, J.H. and Miller, C.A. 2005. Chemically induced destabilization
of water-in-crude oil emulsions. Ind. Eng. Chem. Res. 44: 1139- 1149
Alghanduri, L.M., Elgarni, M.M., Daridon, J-L. and Coutinho, J.A.P. 2010.
Characterization of Libyan waxy crude oils. Energy Fuels 24: 3101–3107.
Ali, M.F. and Alqam, M.H. 2000. The role of asphaltenes, resins and other solids in the
stabilization of water in oil emulsions and its effects on oil production in Saudi oil
fileds. Fuel 79: 1309-1316
Ariany, Z. 2004. Formation and stability study of some Malaysian crude oil emulsions.
MSc. Thesis. Universiti Teknologi Malaysia, Skudai
Arnaud, J. 2004. Methods and apparatus for oil demulsification and separation of oil and
suspended solids from produced water. US Patent 2004/0031472 A1
Auflem, I.H. 2002. Influence of asphaltene aggregation and pressure on crude oil emulsion
stability. Ph.D Thesis. Norwegian University of Science and Technology.
Trondhein, Noway.
Bancroft, W.D. 1912. Theory of emulsification IV, Journal of Physical Chemistry 16 (9):
739-758
Basak, T. and Meenakshi, A. 2006. A theoretical analysis on microwave heating of food
slabs attached with ceramic plates: role of distributed microwave incidence. Food
Research International 39: 932–944
Bezerra, M.A., Santelli, R.E., Oliveira, E.P., Villar, L.S. and Escaleira, L.A. 2008.
Response surface methodology (RSM) as a tool for optimization in analytical
chemistry. Talanta 76: 965-977

Biresaw, G. and Mittal, K.L.2008 (ed). Surfactants in tribology . CRC Press, Taylor &
Francis Group, London, New York
Calla, O.P.N., Bohra, D. and Mishra. 2007. Effect of microwave radiation on the electrical
parameters of soil. Indian Journal of Radio and Spaces Physic. Vol.36, June 2007,
pp. 229-233
Carlota, O.R-Y., Adalberto, P-Jr. and Tavares, C.L. 2005. Micellar solubilization of drugs.
J Pharm Pharmaceut Sci 8(2):147-163, 2005
Chern, C-S. and Lin, S-Y.1996. Emulsion polymerization of styrene stabilized by mixed
anionic and nonionic surfactants. Polymer Vol. 38 No. 8, pp. 1977-1984
Chhabra, R.P. 2007. Bubbles, drops and particles in non-Newtonian fluids. Boca Raton,
FL: CRC Taylor & Francis, 2007
Chen, C., Gao, J.-S. and Yan, Y.-J. 1998. Original preasphaltenes and asphaltenes in coals.
Fuel Processing Technology 55: 143-151
Chen, G. and Tao, D. 2005. An experimental study of stability of oil-water emulsion. Fuel
Processing Technology 86:499-508
Coutinho, R.C., Fortuny, H.M., de Souza, M.N. and Santos, A.F.2008. Method for the
microwave treatment of water-in-oil emulsions. US Patent 2008/0221226 A1
Di, P., Chang, D.P.Y. and Dwyer, H. A.2000. Heat and mass transfer during microwave
steam treatment of contaminated soils. Journal of Environmental Engineering. Vol.
126 n12 pp. 1108-1115
Díaz-Ponce, J.A., Flores, E.A., Lopez-Ortega, A. Hernández-Cortez, J.G., Estrada, A.,
Castro, L.V. and Vazquez,F.2010.Differential scanning calorimetry characterization
of water-in-oil emulsions from Mexican crude oils. J Therm Anal Calorim. DOI
10.1007/s10973-010-0904-8
Djuve, J., Yang, X., Fjellanger, I.J. Sjöblom, J. and Pelizzetti, E.2001. Chemical
destabilization of crude oil based emulsions and asphaltene stabilized emulsions.
Colloid Polymer Science. 279: 232-239.
El Gamal, M., Mohamed, A-M.O. and Zekri, A.Y. 2005. Effect of asphaltene, carbonate,
and clay mineral contents on water cut determination in water–oil emulsions.
Journal of Petroleum Science and Engineering 46: 209– 224.
Evdokimov, I.N., Efimov, Y.O., Losev, A.P. and Novikov, M.A. 2008. Morphological
transformation of native petroleum emulsions, I. Viscosity Studies. Langmuir 24:
7124-7131

Fingas, M. F.F.B. 2001.What causes the formation of water-in-oil emulsions. International
Oil Spill Conference. Environment Canada, Ottawa, Ontario. pp. 109-11
Griffin, W.C: 1949. Classification of surface-active agents by 'HLB‟. Journal of the Society
of Cosmetic Chemists 1: 311
Gunal, O.G. and Islam, M.R.2000. Alteration of asphaltic crude rheology with
electromagnetic and ultrasonic irradiation. Journal of Petroleum Science and
Engineering 26: 263–272
Guzmán-Lucero, D.,Flores, P., Rojo, T. and Martínez-Palou, R.2010. Ionic Liquids as
Demulsifiers of water-in-crude oil emulsions: study of the microwave effect.
Energy Fuels 24: 3610–3615
Hait, S.K. and Moulik, S.P.2001. Determination of critical micelle concentration (CMC)
of nonionic surfactants by donor–acceptor interaction with iodine and
correlation of CMC with hydrophile–lipophile balance and other parameters of
the surfactants. Journal of Surfactants and Detergents, Vol. 4, No. 3 (July 2001)
Hannisdal, A., Helen, M. Ese, Hemmingsen, P.V. and Sjόblom, J. 2006. Particle-stabilized
emulsions: effect of heavy crude oil components pre-adsorbed onto stabilizing
solids. Colloids and Surfaces A: Physicochem. Eng. Aspects 276:45–58.
Hannisdal, A. 2005. Particle-stabilized emulsions and heavy oils. Ph.D Thesis. Norwegian
University of Science and Technology. Trondhein, Noway.
Hannisdal, A., Helen, M. Ese, Hemmingsen, P.V., Sjöblom, J. 2005. Group-type analysis
of heavy crude oils using vibrational spectroscopy in combination with
multivariate analysis. Ind. Eng. Chem. Res. 44: 1349-1357
Holmberg, K. 2001. Handbook of Applied Surface and Colloid Chemistry. United States:
John Wiley & Sons.
Holtze, C. Sivaramakrishnan, R. Antonietti, M, J. Tsuwi , Kremer, F., Kramer, K.D.
2006. The microwave absorption of emulsions containing aqueous micro- and
nanodroplets: A means to optimize microwave heating. Journal of Colloid and
Interface Science 302: 651–657
Indra, S.R.G.2007.Microwave assisted generation and trapping of acetylketene. MSc.
Thesis. Texas Technology University, Texas
Jennifer, K. 1999. Investigation in to the stability of bitumen emulsions. Thesis and
Seminars. The University of Queensland, Australia.
Jiang,T., Hirasaki, G. and Miller, C.2007. Diluted Bitumen Water-in-Oil Emulsion
Stability and Characterization by Nuclear Magnetic Resonance (NMR)
Measurements. Energy Fuels. 21 (3), pp 1325–1336

Kang, W., Jing, G., Zhang, H., Li M. and Wu, Z. 2006. Influence of demulsifier on
interfacial film between oil and water. Colloids and Surfaces A. Physicochem. Eng.
Aspects 272: 27-31
Kim, Y.H, Wasan, D.T. and Breen, P.J. 1995. A study of dynamic interfacial mechanisms
for demulsification of water-in-oil emulsions. Colloids and Surfaces A:
Physicochemical and Engineering Aspects 95 : 235-247
Kingston, H. M. and Tassie, L.B. 1988. Introduction to microwave sample
preparation theory and practice. American Chemical Society. Washington.
Klaika, W.J. 1978. Method and apparatus for controlling fluency of high viscosity
hydrocarbon fluids. U.S.Patent 4,067,683
Langevin, D., Poteau, S., Hénaut, I. and Argillier, J.F. 2004. Crude oil emulsion properties
and their application to heavy oil transportation. Oil & Gas Science and
Technology. Rev. IFP, Vol. 59, No. 5, pp. 511-521
Lazić, Z.R. 2004. Design of Experiments in Chemical Engineering: A Practical Guide.
WILEY-VCH Verlag GmbH & Co. KGaA, Weinheim
Lenth, R.V. 2009. Response-Surface Methods in R, Using RSM Journal of Statistical
Software October 2009, Volume 32, Issue 7. (online).
http://www.jstatsoft.org/v32/i07/paper (20 July 2010).
Leszek, S.C. 2003. Considerations on the concept of pointing vector contribution to
power theory development. Sixth International Workshop on Power Definitions
and Measurements under Nonsinusoidal Conditions.Milano, Italy.
Lee, H.M. Lee, J.W. and Park, O.O. 1997. Rheology and dynamics of water-in-oil
emulsions under steady and dynamic shear flow. Journal of Colloid and Iinterface
Science 185 297-305
Li, H. and Zhang, J. 2003. A generalized model for predicting non-Newtonian viscosity of
waxy crudes as a function of temperature and precipitated wax. Fuel. 82(11): 1387-
1397.
Lidstrőm, P., Tierney, J., Wathey, B. and Westman, J. 2001. Microwave assisted organic
synthesis: a review. Tetrahedron 57: 9225- 9283
McClements, D.J. 2005. Food emulsions: principles, practices, and techniques.2nd
ed. Boca
Raton: CRC Press, 2005
McLean, J.D. and Kilpatrick, P.K. 1997. Effects of asphaltene solvency on stability
of water-in-crude-oil emulsions. Journal of Colloid and Interface Science. 189: 242-
253

Midttun, O. and Kvalheim, O.M. 2001. Interactions in chromatographic separation of resins
from deasphaltened crude oils studied by means of infrared spectroscopy and
principal component analysis. Fuel, Volume 80, Number 5, April 2001, pp. 717-
730(14)
Montgomery, D.C. 2001. Design and analysis of experiments. 5th
Ed. New York: John
Wiley & Sons
Mutyala, S., Fairbridge, C., Paré, J.J.R., Bélanger, J.M.R., Ng. S. and Hawkins, R. 2010.
Microwave applications to oil sands and petroleum: A review. Fuel Processing
Technology 91: 127-135
Nadkarni, R.A. 1984. Application of microwave oven sample dissolution in analysis.
Analytical Chemistry 56 (12): 2233-2237
National Materials Advisory Board. 1994. Microwave Processing of Materials.
Publication NMAB-473. National Academy Press. Washington, D.C.
Nemirosvkaya, G.B., Emel‟yanova A.S., and Ashmyan, K.D. 2005. Methods of Analysis of
High-Wax Crude Oils. Resins, Asphaltenes, Paraffin Waxes. Chemistry and
Technology of Fuels and Oils. 41:( 3) 236-240
Ngai, T.and Wu, C.2005.Double roles of stabilization and destabilization of initiator
potassium persulfate in surfactant-free emulsion polymerization of styrene under
microwave irradiation. Langmuir,21: 8520-8525
Opawale, F.O. and Burgess, D.J.1998. Influence of interfacial properties of lipophilic
surfactants on water-in-oil emulsion stability. Journal of Colloid and Interface
Science 197: 142–150
Paul, B. and Daniel, S. 1985. Encyclopedia of Emulsion Technology. Volume 2:
Applications. Marcel Dekker, Inc.New York
Pedersen, K.S. and Rnningsen, H.P. 2000. Effect of precipitated wax on viscosity-a
model for predicting non-Newtonian viscosity of crude oils. Energy & Fuels 14: 43-
51
Rajaković, V. and Skala, D. 2006. Separation of water-in-oil emulsions by freeze/thaw
method and microwave radiation. Separation and Purification Technology
49(2006): 192-196
Rao, K.S., Chandra, G. and Rao, P.V.N. 1988. Study on penetration depth and its
dependence on frequency, soil moisture, texture and temperature in the context of
microwave remote sensing. Journal of the Indian Society of Remote Sensing, Vo.
16, No.2, 1988

Rattanadecho, P. 2006. The simulation of microwave heating of wood using a rectangular
wave guide: Influence of frequency and sample size. Chemical Engineering Science
61: 4798 – 4811
Rosen, M. J. 2004. Surfactant and interfacial phenomena. New Jersey: John Wiley & Sons,
Inc., Hoboken.
Rusli, D., Shahinas, B. and Ibrahim, A. 2007. Effect of molecular weight on the droplet size
and rheological properties of liquid natural rubber emulsion. Malaysian Polymer
Journal (MPJ), Vol 2, No. 1, p 29 -38, 2007
Ryynänen, S. 2002. Microwave heating uniformity of multicomponent prepared foods.
Academic Dissertation. University of Helsinki. Finland.
Schramm, L.L. 2005. Emulsions, foams and suspensions; fundamental and applications.
Weinheim : Wiley-VCH Verlag GmbH & Co.
Schramm, L.L. 2000. Surfactant; fundamental and applications in the petroleum industry.
Cambridge University Press
Sjöblom, J. 2006. Emulsions and emulsion stability, second edition. New York: Taylor &
Francis.
Strom-Kristiansen, T., Daling, P.S. and Brandvick, P.J. 1995. Dispersant and underwater
release experiments: Surface oil sampling and analysis. Data report. IKU report,
N25: 39-60.
Sujoy, K. S. and Basak, T. 2009. Enhanced microwave processing of oil-water emulsions
confined within ceramic and ceramic/ metallic or composite plates. Chemical
Engineering and Processing 48: 706–721
Sullivan, A.P. and Kilpatrick, P.K. 2002. The effects of inorganic solid particles on water
and crude oil emulsion stability. Ind. Eng. Chem. Res. 41: 3389-3404
Tadros, T.F. 2009. Emulsion science and technology. WILEY-VCH Verlag GmbH & Co.
KGaA, Weinheim
Tanmay, B. and Ayappa, K.G. 1997. Analysis of microwave thawing of slabs with effective
heat capacity method, AIChE Journal, 43, 1662-1674
Taraneh, J.B., Rahmatollah, G., Hassan, A. and Alireza, D. 2008. Effect of wax inhibitors
on pour point and rheological properties of Iranian waxy crude oil. Fuel Processing
Technology 89: 973-977
Urdahl, O., Fredheim, A.O. and LØken, K-P. 1997. Viscosity measurements of water-in-
crude-oil emulsions under flowing conditions: A theoretical and practical approach.

Colloids and Surfaces A: Physicochemical and Engineering Aspects 123- 124: 623-
634
Von Hippel, A.R. 1954. Dielectric Materials and Applications. MIT Press.
Cambridge, MA.
Wang, L., Yang, B., Du, X., Yi, C. 2008. Optimisation of supercritical fluid extraction of
flavonoids from Pueraria lobata. Food Chemistry 108: 737-741
Wang, W., Zhou, Z., Nandakumar, K., Xu, Z. and Jacob, H.M. 2004. Effect of charged
colloidal particles on adsorption of surfactants at oil–water interface. Journal of
Colloid and Interface Science 274: 625–630
Wanli, K., Yi, L., Baoyan, Q., Guangzhi, L., Zhenyu, Y., and Jichun, H. 2000. Interactions
between alkali: surfactant: polymer and their effects on emulsion stability. Colloids
and Surfaces A: Physicochemical and Engineering Aspects 175: 243–247
Wilde, P.J. 2000. Interfaces: Their role in foam and emulsion behaviour. Current Opinion
in Colloid & Interface Science. 5: 176-181
Wolf, N.O. 1986. Use of microwave radiation in separating emulsions and dispersion of
hydrocarbon and water. U.S.Patent 4,582,629
Woods, J.R., Kung, J., Pleizier, G., Kotlyar, L.S., Sparks, B.D., Adjaye, J., and Chung,
K.H.2004. Characterization of a coker gas oil fraction from athabasca oil sands
bitumen. Fuel 83 (2004) 1907–1914
Wu, J., Xu, Y., Dabros, T. and Hamza, H. 2003. Effect of Demulsifier Properties on
Destabilization of Water-in-Oil Emulsion. Energy Fuels, 17 (6): 1554–1559
Xia, L., Lu, S. and Cao, G. 2004. Stability and demulsification of emulsions tabilized by
asphaltenes or resins. Journal of Colloid and Interface Science 271: 504-506
Yang, X. Tan,W. and Bu, Y. 2009. Demulsification of asphaltenes and resins stabilized
emulsions via the freeze/ thaw method. Energy & Fuel 23(1): pp 481-486
Yanniotis,B and Sundén, S.(Ed.).2007. Heat transfer in food industry: Recent development
and application. Boston: WIT Press
Zaki, N.N. 1997. Surfactant stabilized crude oil-in water emulsions for pipeline
transportation of viscous crude oils. Colloids and Surfaces A: Physicochemical and
Engineering Aspects 125: 19-25
Zhang, Z., Wang, F.G.X., Dong, S. and Chen, Y. 2005. Demulsification by amphiphilic
dendrimer copolymers. Journal of Colloid and Interface Science. 282: 1–4

Zhu, T. 2008. Evaluation of Wax Deposition and Its Control during Production of Alaskan
North Slope Oils. Petroleum Development Laboratory. Institute of Northern
Engineering University of Alaska Fairbanks, Alaska.

APPENDIX A
FTIR ANALYSIS FOR CRUDE OIL
44
1.3
447
6.3
451
2.4
856
7.8
562
3.2
8
76
4.9
6
10
83
.75
16
30
.04
22
54
.22
33
66
.53
34
11
.92
34
62
.22
38
16
.47
38
52
.73
38
87
.59
39
88
.01
-16
-14
-12
-10
-8
-6
-4
-2
0
2
4
6
8
10
12
14
16
18
20
22
%T
500 1000 1500 2000 2500 3000 3500 4000
Wavenumbers (cm-1)
Figure A1: FTIR Analysis of Crude Oil A

47
5.0
451
5.3
6
57
9.8
2
10
33
.47
10
84
.51
11
73
.56
16
51
.5418
26
.79
22
55
.41
32
38
.91
32
91
.99
34
16
.53
34
83
.22
35
79
.74
39
04
.80
-4
-2
0
2
4
6
8
10
12
14
16
18
%T
500 1000 1500 2000 2500 3000 3500 4000
Wavenumbers (cm-1)
Figure A2 FTIR Analysis of Crude Oil B
41
5.4
645
1.4
649
0.6
9
58
1.3
1
10
25
.15
16
37
.76
18
21
.96
22
75
.11
33
01
.78
34
11
.31
34
62
.02
39
05
.35
39
39
.14
-10
-8
-6
-4
-2
0
2
4
6
8
10
12
14
16
18
20
22
24
26
28
30
%T
500 1000 1500 2000 2500 3000 3500 4000
Wavenumbers (cm-1)
Figure A3 FTIR Analysis of Crude Oil C

APPENDIX B
ANALYSIS OF DIFFERENTIAL SCANNING CALORIMETRY (DSC)
Figure B1: DSC Analysis of Crude Oil A
Figure B2: DSC Analysis of Crude Oil B

Figure B3: DSC Analysis of Crude Oil C

APPENDIX C
EFFECT OF DROPLETS SIZE ON STIRRING INTENSITY
(a) 500 rpm (b)1000 rpm
(c) 1500 rpm (d)2000 rpm
Figure C1: Droplet Size Affect at Varied Stirring Intensity

APPENDIX D
EFFECT OF TEMPERATURE ON EMULSION STABILITY
Ambient temperature
Temperature 50
oC
Temperature 70
oC

Temperature 90
oC
Figure D1 50-50 % W/O Emulsion (Left at 10x resolution; Right at 100x resolution)
Ambient temperature
Temperature 50
oC

Temperature 70
oC
Temperature 90
oC
Figure D2 20-80 % W/O Emulsion (Left at 10x resolution; Right at 100x resolution)


APPENDIX E
W/O EMULSION HEATED BY MICROWAVE RADIATION IN VARIED MICROWAVE POWER
Table E1: Experimental Results of 900 W
time
(sec)
Temperature
average (oC)
heating rate
,dT/dt (oC/s)
volume rate of
heat generation,
qmv (cal/s.cm3)
ε'r
(water) ε'r (oil)
dielectric
constant,
ε'r
ε''r
(water) ε''r (oil)
dielectric
loss, ε''r tan δ
20 50.3333 1.1330 2.4834 68.31156 2.203408 35.25748 5.7356 0.0000023 2.8678 0.081338
40 63.8033 0.9033 1.9328 63.78793 2.193615 32.99077 4.4960 0.0000010 2.2480 0.068141
60 71.4533 0.7297 1.5614 61.21883 2.188053 31.70344 4.0025 0.0000007 2.0013 0.063124
80 79.3067 0.6454 1.3811 58.58144 2.182344 30.38189 3.5961 0.0000005 1.7980 0.059182
100 87.9033 0.6023 1.2888 55.69442 2.176094 28.93526 3.2355 0.0000003 1.6177 0.055909
120 93.3267 0.5471 1.1707 53.87311 2.172152 28.02263 3.0426 0.0000003 1.5213 0.054288
140 90.7100 0.4503 0.9635 54.75186 2.174054 28.46296 3.1327 0.0000003 1.5664 0.055032
160 106.8233 0.4947 1.0586 49.34052 2.162339 25.75143 2.6485 0.0000002 1.3243 0.051425
180 96.1133 0.3802 0.8136 52.93726 2.170126 27.55369 2.9520 0.0000002 1.4760 0.053569
200 98.8333 0.3558 0.7614 52.0238 2.168148 27.09597 2.8686 0.0000002 1.4343 0.052935
220 97.0533 0.3154 0.6748 52.62158 2.169442 27.39551 2.9227 0.0000002 1.4613 0.053342
AVERAGE 0.5961 1.2756 29.41373 1.7560 0.059701

Table E2: Experimental Results of 720 W
time
(sec)
Temperature
average (oC)
heating rate
,dT/dt (oC/s)
volume rate of
heat
generation, qmv
(cal/s.cm3)
ε'r
(water) ε'r (oil)
dielectric
constant, ε'r
ε''r
(water) ε''r (oil)
dielectric
loss, ε''r tan δ
20 50.7067 0.9657 2.1166 68.18618 2.203136 35.19466 5.6922 0.0000022 2.8461 0.080868
40 56.0567 0.6166 1.3194 66.38949 2.199247 34.29437 5.1351 0.0000016 2.5676 0.074868
60 70.4933 0.6517 1.3945 61.54122 2.188751 31.86499 4.0585 0.0000007 2.0292 0.063682
80 73.4967 0.5263 1.1262 60.53261 2.186568 31.35959 3.8883 0.0000006 1.9441 0.061995
100 73.3933 0.4200 0.8987 60.56732 2.186643 31.37698 3.8939 0.0000006 1.9470 0.06205
120 78.8800 0.3957 0.8468 58.72473 2.182654 30.45369 3.6161 0.0000005 1.8080 0.05937
140 83.3367 0.3710 0.7939 57.22805 2.179414 29.70373 3.4176 0.0000004 1.7088 0.057529
160 93.3933 0.3875 0.8292 53.85072 2.172103 28.01141 3.0403 0.0000003 1.5202 0.05427
180 97.9133 0.3696 0.7908 52.33277 2.168817 27.25079 2.8963 0.0000002 1.4482 0.053142
200 97.2900 0.3295 0.7050 52.5421 2.16927 27.35568 2.9154 0.0000002 1.4577 0.053286
220 106.1433 0.3398 0.7271 49.56888 2.162834 25.86586 2.6660 0.0000002 1.3330 0.051535
AVERAGE 0.4885 1.0453 30.24834 1.8736 0.061941

Table E3: Experimental Results of 540 W
time
(sec)
Temperature
average (oC)
heating rate
,dT/dt
(oC/s)
volume rate of
heat
generation, qmv
(cal/s.cm3)
ε'r
(water) ε'r (oil)
dielectric
constant, ε'r
ε''r
(water) ε''r (oil)
dielectric
loss, ε''r tan δ
20 47.1667 0.8115 1.7787 69.37502 2.20571 35.790364 6.1313 0.0000028 3.0657 0.085656
40 50.7300 0.4948 1.0589 68.17834 2.203119 35.190732 5.6895 0.0000022 2.8448 0.080838
60 62.6300 0.5282 1.1303 64.18197 2.194468 33.188218 4.5825 0.0000011 2.2913 0.069039
80 68.7933 0.4732 1.0126 62.11213 2.189987 32.151061 4.1615 0.0000008 2.0807 0.064718
100 69.2900 0.3835 0.8207 61.94534 2.189626 32.067483 4.1309 0.0000008 2.0654 0.064409
120 80.7667 0.4152 0.8886 58.09113 2.181283 30.136206 3.5294 0.0000004 1.7647 0.058557
140 77.0700 0.3295 0.7051 59.33258 2.18397 30.758276 3.7033 0.0000005 1.8516 0.0602
160 83.0833 0.3259 0.6974 57.31312 2.179598 29.746361 3.4284 0.0000004 1.7142 0.057626
180 84.5467 0.2978 0.6373 56.82169 2.178535 29.500114 3.3674 0.0000004 1.6837 0.057075
200 82.4833 0.2577 0.5515 57.51462 2.180035 29.847328 3.4540 0.0000004 1.7270 0.05786
220 85.7933 0.2493 0.5336 56.40302 2.177628 29.290327 3.3172 0.0000003 1.6586 0.056626
AVERAGE 0.4152 0.8884 31.606043 2.0680 0.06543

Table E4: Experimental Results of 360 W
time
(sec)
Temperature
average (oC)
heating rate
,dT/dt
(oC/s)
volume rate of
heat
generation, qmv
(cal/s.cm3)
ε'r
(water) ε'r (oil)
dielectric
constant, ε'r
ε''r
(water) ε''r (oil)
dielectric
loss, ε''r tan δ
20 30.0133 0.0507 0.1111 75.13562 2.21818 38.6769 9.7529 0.0000122 4.8765 0.126082
40 35.2167 0.1554 0.3326 73.38819 2.214397 37.80129 8.2764 0.0000074 4.1382 0.109472
60 44.8200 0.2637 0.5642 70.1631 2.207416 36.18526 6.4612 0.0000034 3.2306 0.089279
80 55.4100 0.3301 0.7064 66.60666 2.199717 34.40319 5.1967 0.0000016 2.5983 0.075526
100 47.5000 0.1850 0.3959 69.26308 2.205468 35.73427 6.0871 0.0000028 3.0436 0.085172
120 57.7133 0.2393 0.5120 65.83313 2.198042 34.01559 4.9838 0.0000014 2.4919 0.073258
140 61.8733 0.2348 0.5025 64.43608 2.195018 33.31555 4.6401 0.0000011 2.3200 0.069639
160 76.7533 0.2985 0.6387 59.43893 2.1842 30.81156 3.7190 0.0000005 1.8595 0.06035
180 82.1533 0.2953 0.6319 57.62545 2.180275 29.90286 3.4682 0.0000004 1.7341 0.057991
200 75.4067 0.2320 0.4965 59.89118 2.185179 31.03818 3.7872 0.0000006 1.8936 0.061009
220 64.8433 0.1629 0.3486 63.43866 2.192859 32.81576 4.4220 0.0000009 2.2110 0.067376
AVERAGE 0.2225 0.4761 34.06367 2.7634 0.081124

APPENDIX F
W/O EMULSION HEATED BY MICROWAVE RADIATION IN VARIED VOLUME FRACTION
Table F1: Experimental Results of 50-50 % Water-in-oil (W/O) Emulsion Heated by Microwave Radiation
time
(sec)
Temperature
average (oC)
heating
rate
,dT/dt
(oC/s)
volume rate of
heat
generation, qmv
(cal/s.cm3)
ε'r
(water) ε'r (oil)
dielectric
constant,
ε'r
ε''r
(water) ε''r (oil)
dielectric
loss, ε''r tan δ
20 50.7067 0.9657 2.0543 68.18618 2.203136 35.19466 5.6922 0.0000022 2.8461 0.080868
40 56.0567 0.6166 1.3117 66.38949 2.199247 34.29437 5.1351 0.0000016 2.5676 0.074868
60 70.4933 0.6517 1.3863 61.54122 2.188751 31.86499 4.0585 0.0000007 2.0292 0.063682
80 73.4967 0.5263 1.1196 60.53261 2.186568 31.35959 3.8883 0.0000006 1.9441 0.061995
100 73.3933 0.4200 0.8935 60.56732 2.186643 31.37698 3.8939 0.0000006 1.9470 0.062050
120 78.8800 0.3957 0.8418 58.72473 2.182654 30.45369 3.6161 0.0000005 1.8080 0.059370
140 83.3367 0.3710 0.7893 57.22805 2.179414 29.70373 3.4176 0.0000004 1.7088 0.057529
160 93.3933 0.3875 0.8243 53.85072 2.172103 28.01141 3.0403 0.0000003 1.5202 0.054270
180 97.9133 0.3696 0.7862 52.33277 2.168817 27.25079 2.8963 0.0000002 1.4482 0.053142
200 97.2900 0.3295 0.7009 52.5421 2.169270 27.35568 2.9154 0.0000002 1.4577 0.053286
220 106.1433 0.3398 0.7228 49.56888 2.162834 25.86586 2.6660 0.0000002 1.3330 0.051535
AVERAGE 0.4885 1.0391 30.24834 1.8736 0.061941

Table F2: Experimental Results of 30-70 % Water-in-oil (W/O) Emulsion Heated by Microwave Radiation
time
(sec)
Temperature
average (oC)
heating
rate
,dT/dt
(oC/s)
volume rate of
heat
generation, qmv
(cal/s.cm3)
ε'r
(water) ε'r (oil)
dielectric
constant,
ε'r
ε''r
(water) ε''r (oil)
dielectric
loss, ε''r tan δ
20 51.9333 1.0270 2.1054 67.77423 2.202244 21.87384 5.5542 0.0000021 1.6663 0.076176
40 56.8267 0.6358 1.3035 66.13090 2.198687 21.37835 5.0637 0.0000015 1.5191 0.071058
60 66.7000 0.5884 1.2063 62.81514 2.191509 20.37860 4.2957 0.0000009 1.2887 0.063238
80 70.3667 0.4872 0.9987 61.58376 2.188843 20.00732 4.0660 0.0000007 1.2198 0.060967
100 75.5733 0.4418 0.9057 59.83521 2.185058 19.48010 3.7786 0.0000005 1.1336 0.058192
120 82.9067 0.4293 0.8800 57.37245 2.179727 18.73755 3.4359 0.0000004 1.0308 0.055010
140 86.2433 0.3918 0.8032 56.25190 2.177301 18.39968 3.2994 0.0000003 0.9898 0.053796
160 94.7233 0.3958 0.8114 53.40406 2.171136 17.54101 2.9965 0.0000002 0.8990 0.051249
180 98.3900 0.3722 0.7630 52.17269 2.168470 17.16974 2.8819 0.0000002 0.8646 0.050354
200 110.4067 0.3951 0.8099 48.13713 2.159734 15.95295 2.5603 0.0000001 0.7681 0.048148
220 122.1300 0.4124 0.8455 44.20008 2.151211 14.76587 2.3083 0.0000001 0.6925 0.046898
AVERAGE 0.5070 1.0393 18.69864 1.0975 0.058692

Table F3: Experimental Results of 10-90 % Water-in-oil (W/O) Emulsion Heated by Microwave Radiation
time
(sec)
Temperature
average (oC)
heating
rate
,dT/dt
(oC/s)
volume rate of
heat
generation, qmv
(cal/s.cm3)
ε'r
(water) ε'r (oil)
dielectric
constant,
ε'r
ε''r
(water) ε''r (oil)
dielectric
loss, ε''r tan δ
20 41.1267 0.4867 1.1105 71.40343 2.210101 9.129434 7.0576 0.0000045 0.7058 0.077307
40 43.2733 0.2970 0.6777 70.68252 2.20854 9.055938 6.6984 0.0000038 0.6698 0.073967
60 48.8867 0.2916 0.6653 68.79739 2.204459 8.863753 5.9099 0.0000025 0.5910 0.066675
80 50.3867 0.2374 0.5418 68.29365 2.203369 8.812397 5.7293 0.0000023 0.5729 0.065015
100 55.0500 0.2366 0.5398 66.72756 2.199979 8.652737 5.2316 0.0000017 0.5232 0.060462
120 61.4467 0.2504 0.5715 64.57937 2.195328 8.433732 4.6732 0.0000011 0.4673 0.055411
140 65.7067 0.2451 0.5593 63.14873 2.192231 8.287881 4.3624 0.0000009 0.4362 0.052635
160 73.0967 0.2606 0.5948 60.66695 2.186859 8.034867 3.9101 0.0000006 0.3910 0.048665
180 75.5533 0.2453 0.5598 59.84192 2.185073 7.950758 3.7796 0.0000006 0.3780 0.047538
200 78.7500 0.2368 0.5403 58.76839 2.182749 7.841313 3.6222 0.0000005 0.3622 0.046194
220 85.1067 0.2442 0.5571 56.63363 2.178127 7.623678 3.3447 0.0000004 0.3345 0.043872
AVERAGE 0.2756 0.6289 8.426044 0.4938 0.058605

APPENDIX G
LIST OF PUBLICATIONS
1. A.N. Ilia Anisa, Abdurahman H.Nour and Azhary H.Nour. Catastrophic and
Transitional Phase Inversion of Water-in-Crude Oil (W/O) Emulsion. (Published in
Journal Applied of Science 10 (23): 3076-3083, 2010)
2. A.N. Ilia Anisa and Abdurahman H.Nour (2010). Affect of Viscosity and Droplet
Diameter on Water-in-Oil (W/O) Emulsions: An Experimental Study. Proceedings
in International Conference of Chemical Engineering 2010 Issue 62, February
2010,128: 691-694
3. A.N. Ilia Anisa and Abdurahman H.Nour (2009). Demulsification of Water-in-
Crude Oil Emulsion via Microwave Heating Technology and Conventional
Method. Proceedings in Regional Conference on Environmental and Earth
Resources (RCER 2009). Pahang, Malaysia, December 7-8, 2009.
4. A.N. Ilia Anisa and Abdurahman H.Nour (2009). Emulsion Separation Rate
Enhancement via Microwave Heating Technology (ISBN 978-967-5080-81-4)
National Conference on Postgraduate Research (NCON-PGR 2009). 018, pp. 79.
Pahang, Malaysia, October 1st, 2009.