NOOSA CONVENTION AND PERFORMING ARTS CENTRE… · noosa convention and performing arts centre:...
48
NOOSA CONVENTION AND PERFORMING ARTS CENTRE: PRE-FEASIBILITY REVIEW NOOSA SHIRE COUNCIL JULY 2016
Transcript of NOOSA CONVENTION AND PERFORMING ARTS CENTRE… · noosa convention and performing arts centre:...
NOOSA CONVENTION AND PERFORMING ARTS CENTRE: PRE-FEASIBILITY REVIEW NOOSA SHIRE COUNCIL JULY 2016
PRE-FEASIBILITY OF CONVENTION AND PERFORMING ARTS CENTRES
i
DOCUMENT CONTROL
Job ID: 18527BNE
Job Name: Pre-feasibility of Convention and Performing Arts Centres
Client: Noosa Shire Council
Client Contact: Michael Shave
Project Manager: Gavin O’Donovan
Email: [email protected]
Telephone: (07) 3831 0577
Document Name: Noosa Convention and Performing Arts Centre Pre-feasibility Review - FINAL
Last Saved: 13/7/2016 1:52 PM
Version Date Reviewed Approved
Draft V1.0 08/07/2016 GO GO
Draft V2.0 10/07/2016 GO GO
Final 13/07/2016 GO GO
Disclaimer:
Whilst all care and diligence have been exercised in the preparation of this report, AEC Group Pty Ltd does not warrant the
accuracy of the information contained within and accepts no liability for any loss or damage that may be suffered as a result of
reliance on this information, whether or not there has been any error, omission or negligence on the part of AEC Group Pty Ltd
or their employees. Any forecasts or projections used in the analysis can be affected by a number of unforeseen variables, and
as such no warranty is given that a particular set of results will in fact be achieved.
PRE-FEASIBILITY OF CONVENTION AND PERFORMING ARTS CENTRES
ii
EXECUTIVE SUMMARY
BACKGROUND
Noosa Council (Council) engaged AEC Group Pty Ltd (AEC) to undertake a review of CCIQ Noosa’s pre-feasibility
study into a proposed Convention Centre with a seating capacity of 1,000 and a separate (but integrated)
Performing Arts Centre with a seating capacity of at least 700. The assessment is to also include an initial high-
level financial and economic impact assessment to allow Council to make an informed decision regarding whether
the concept/proposal should be progressed to the full feasibility stage.
The capital cost of the proposal is estimated at up to $30 million (per CCIQ Noosa estimates), with a potential site
for the development being the current site of The J.
MARKET ASSESSMENT
Convention Centre
There are a number of different privately owned and operated conference and accommodation venues in Noosa
catering for the 150-300 seating capacity conferencing market. In the broader Sunshine Coast market, there are a
variety of similar venues with a holistic service offering that compete for the same market, in addition to a number
of other venue only providers such as sporting clubs, RSL and halls.
In the mid to high level Meetings Incentives Conference and Exhibition (MICE) market, Novotel Twin Waters (30
minutes from Noosa) offers 1,000 seating capacity and the Lake Kawana Community Centre (40 minutes from
Noosa) offers 740 seating capacity. There is considerable uncertainty surrounding the future of the Palmer Coolum
Resort and future use of the site, although it also features considerable capacity to meet the needs of the mid to
high level MICE market should it come back online at some point. By 2020, the following major additions are
expected in the regional market:
Westin Coolum Resort and Spa (20 minutes from Noosa) offering 850sqm of ultra-modern conference and
event space.
Sunshine Coast Entertainment, Convention and Exhibition Centre (40 minutes from Noosa) offering a
convention venue for up to 2,500 people.
The proposed sizing of the proposed Noosa Convention Centre is at the lower end of comparable
regional/metropolitan venues, and is best benchmarked against the Gladstone Entertainment Convention Centre
which includes a theatre alongside convention facilities.
The proposed Noosa Convention Centre will face significant competition from established centres outside of the
region, in addition to competition from Twin Waters and the Kawana Community Centre in the local market in the
initial instance and the Sunshine Coast Entertainment, Convention and Exhibition Centre and Westin Coolum
Resort and Spa when they are constructed. The proposed Noosa Convention Centre would also still compete with
pre-existing facilities catering to the 150-300 capacity given that it would offer different combinations of rooms to
be hired within the larger floor print.
Performing Arts Centre
The J and the Noosa Arts Theatre are the primary dedicated theatre facilities catering to the local market, with The
J having a seating capacity of up to 378 persons.
Performing arts centres typically experience lower competition due to shows touring to multiple venues across
multiple regions. However, Noosa would be in a competitive environment with the venues managed by Sunshine
Coast Venues and Events, including Lake Kawana Community Centre (40 minutes from Noosa) and The Events
Centre (50 minutes from Noosa) in addition to the proposed Sunshine Coast Entertainment, Convention and
Exhibition Centre (40 minutes from Noosa).
PRE-FEASIBILITY OF CONVENTION AND PERFORMING ARTS CENTRES
iii
The proposed 700-seat Noosa Performing Arts Theatre would appear to be quite high relative to the local
population when compared with other regions, with the exception of the theatre component of the Gladstone
Entertainment Convention Centre – this is particularly the case given the facilities provided elsewhere on the
Sunshine Coast.
Financial Performance
All surveyed venues incur considerable operating losses, even when depreciation is excluded. Given the market
environment, such as outcome would also be highly likely for the proposed Noosa Convention Centre and
Performing Arts Centre.
The general range for the portion of operating costs before depreciation is recovered is 40% to 67%. When
depreciation is included, the extent of cost recovery falls further to 30% to 50%. The three international precincts
referenced by CCIQ Noosa (Banff, Canada and Carmel and Aspen, USA) also feature cost recovery levels within
this range and are only able to maintain operations through considerable operating grants and donations.
For the Gladstone Entertainment Convention Centre – which includes convention and performance arts
components of a comparable size to that proposed by CCIQ Noosa – the net operating loss is $2.344 million before
depreciation and $3.269 million after depreciation.
FINANCIAL ASSESSMENT
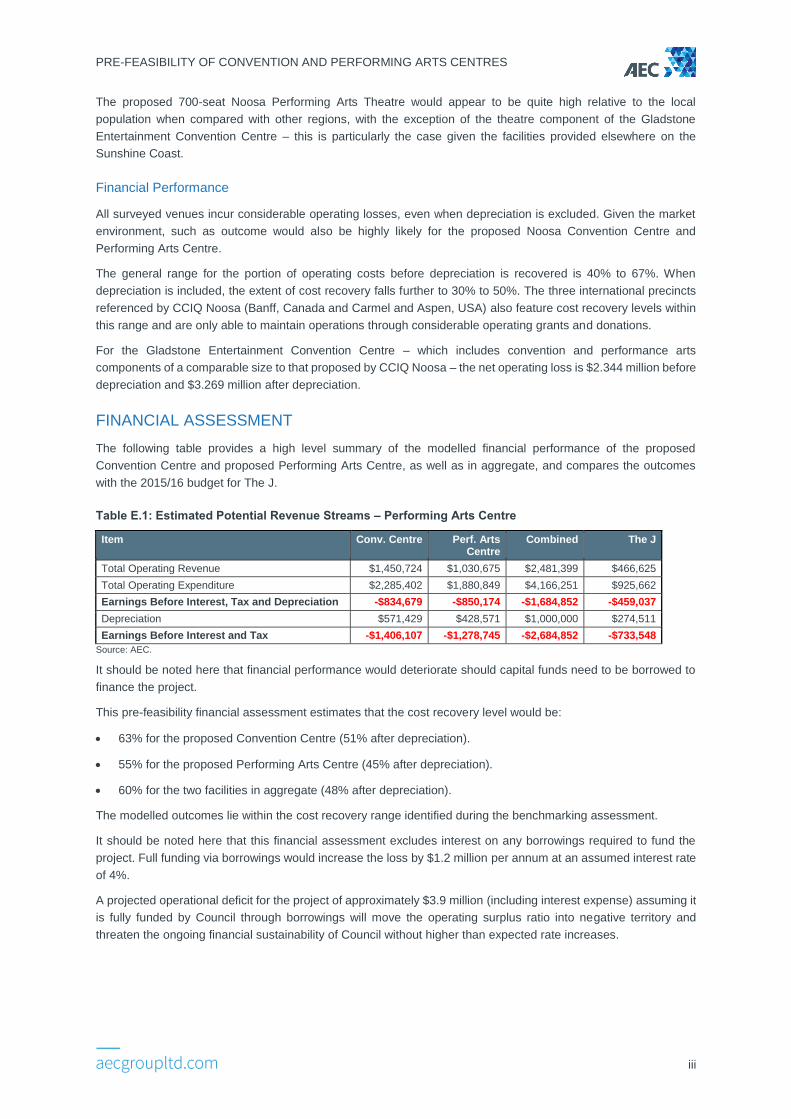
The following table provides a high level summary of the modelled financial performance of the proposed
Convention Centre and proposed Performing Arts Centre, as well as in aggregate, and compares the outcomes
with the 2015/16 budget for The J.
Table E.1: Estimated Potential Revenue Streams – Performing Arts Centre
Item Conv. Centre Perf. Arts Centre
Combined The J
Total Operating Revenue $1,450,724 $1,030,675 $2,481,399 $466,625
Total Operating Expenditure $2,285,402 $1,880,849 $4,166,251 $925,662
Earnings Before Interest, Tax and Depreciation -$834,679 -$850,174 -$1,684,852 -$459,037
Depreciation $571,429 $428,571 $1,000,000 $274,511
Earnings Before Interest and Tax -$1,406,107 -$1,278,745 -$2,684,852 -$733,548
Source: AEC.
It should be noted here that financial performance would deteriorate should capital funds need to be borrowed to
finance the project.
This pre-feasibility financial assessment estimates that the cost recovery level would be:
63% for the proposed Convention Centre (51% after depreciation).
55% for the proposed Performing Arts Centre (45% after depreciation).
60% for the two facilities in aggregate (48% after depreciation).
The modelled outcomes lie within the cost recovery range identified during the benchmarking assessment.
It should be noted here that this financial assessment excludes interest on any borrowings required to fund the
project. Full funding via borrowings would increase the loss by $1.2 million per annum at an assumed interest rate
of 4%.
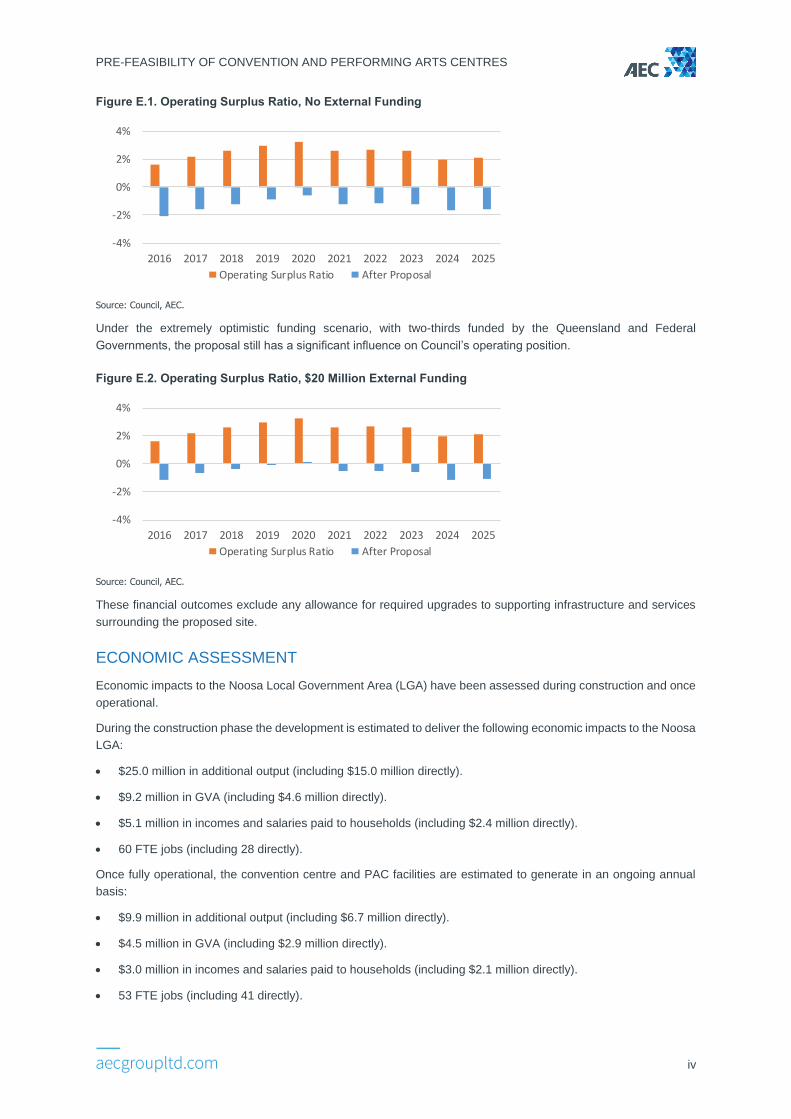
A projected operational deficit for the project of approximately $3.9 million (including interest expense) assuming it
is fully funded by Council through borrowings will move the operating surplus ratio into negative territory and
threaten the ongoing financial sustainability of Council without higher than expected rate increases.
PRE-FEASIBILITY OF CONVENTION AND PERFORMING ARTS CENTRES
iv
Figure E.1. Operating Surplus Ratio, No External Funding
Source: Council, AEC.
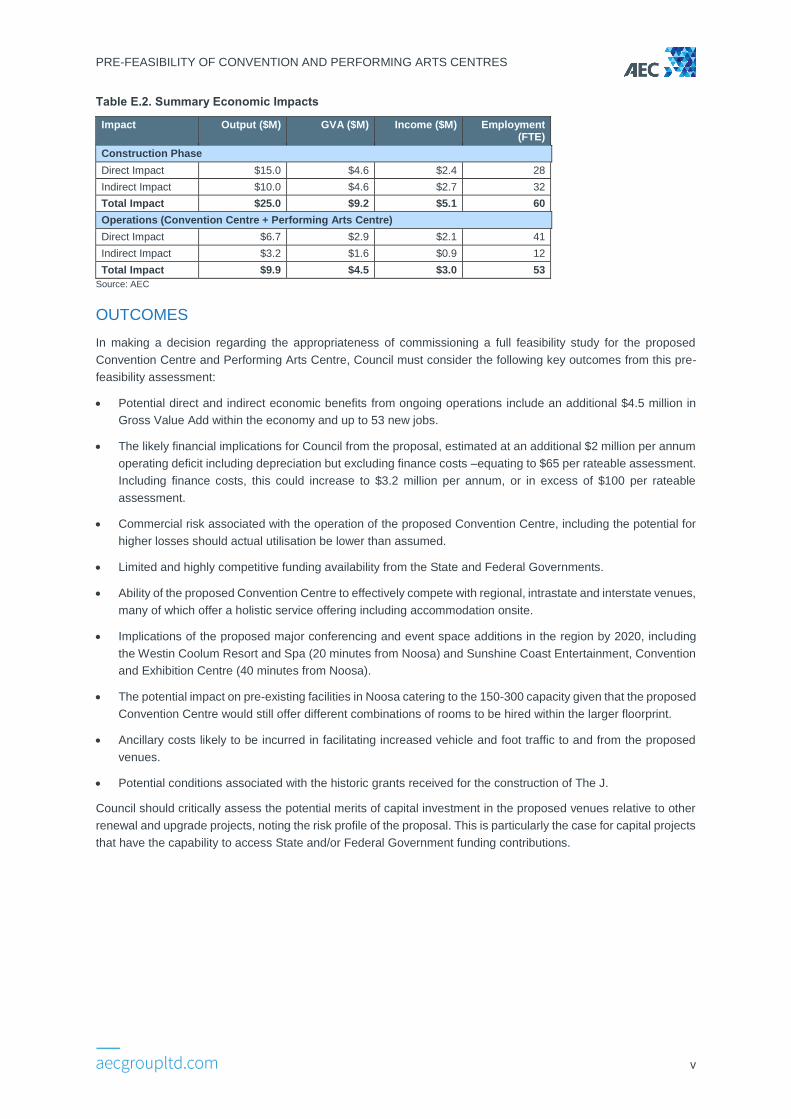
Under the extremely optimistic funding scenario, with two-thirds funded by the Queensland and Federal
Governments, the proposal still has a significant influence on Council’s operating position.
Figure E.2. Operating Surplus Ratio, $20 Million External Funding
Source: Council, AEC.
These financial outcomes exclude any allowance for required upgrades to supporting infrastructure and services
surrounding the proposed site.
ECONOMIC ASSESSMENT
Economic impacts to the Noosa Local Government Area (LGA) have been assessed during construction and once
operational.
During the construction phase the development is estimated to deliver the following economic impacts to the Noosa
LGA:
$25.0 million in additional output (including $15.0 million directly).
$9.2 million in GVA (including $4.6 million directly).
$5.1 million in incomes and salaries paid to households (including $2.4 million directly).
60 FTE jobs (including 28 directly).
Once fully operational, the convention centre and PAC facilities are estimated to generate in an ongoing annual
basis:
$9.9 million in additional output (including $6.7 million directly).
$4.5 million in GVA (including $2.9 million directly).
$3.0 million in incomes and salaries paid to households (including $2.1 million directly).
53 FTE jobs (including 41 directly).
-4%
-2%
0%
2%
4%
2016 2017 2018 2019 2020 2021 2022 2023 2024 2025
Operating Surplus Ratio After Proposal
-4%
-2%
0%
2%
4%
2016 2017 2018 2019 2020 2021 2022 2023 2024 2025
Operating Surplus Ratio After Proposal
PRE-FEASIBILITY OF CONVENTION AND PERFORMING ARTS CENTRES
v
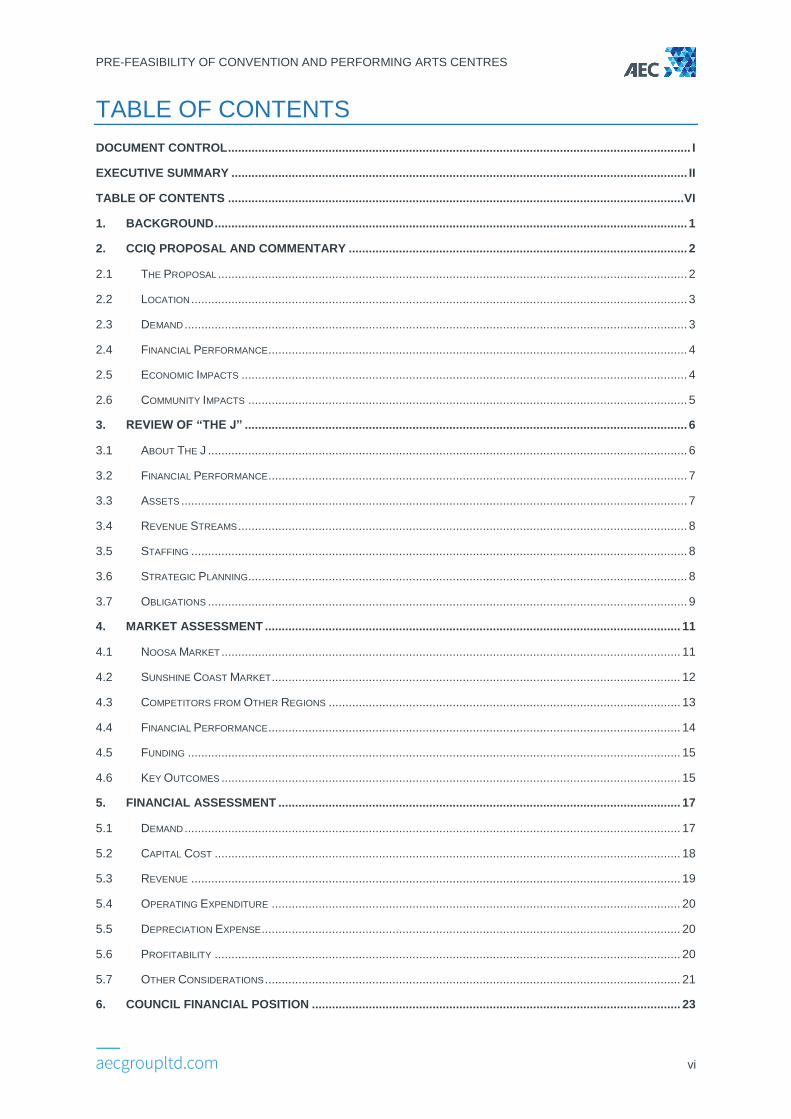
Table E.2. Summary Economic Impacts
Impact Output ($M) GVA ($M) Income ($M) Employment (FTE)
Construction Phase
Direct Impact $15.0 $4.6 $2.4 28
Indirect Impact $10.0 $4.6 $2.7 32
Total Impact $25.0 $9.2 $5.1 60
Operations (Convention Centre + Performing Arts Centre)
Direct Impact $6.7 $2.9 $2.1 41
Indirect Impact $3.2 $1.6 $0.9 12
Total Impact $9.9 $4.5 $3.0 53
Source: AEC
OUTCOMES
In making a decision regarding the appropriateness of commissioning a full feasibility study for the proposed
Convention Centre and Performing Arts Centre, Council must consider the following key outcomes from this pre-
feasibility assessment:
Potential direct and indirect economic benefits from ongoing operations include an additional $4.5 million in
Gross Value Add within the economy and up to 53 new jobs.
The likely financial implications for Council from the proposal, estimated at an additional $2 million per annum
operating deficit including depreciation but excluding finance costs –equating to $65 per rateable assessment.
Including finance costs, this could increase to $3.2 million per annum, or in excess of $100 per rateable
assessment.
Commercial risk associated with the operation of the proposed Convention Centre, including the potential for
higher losses should actual utilisation be lower than assumed.
Limited and highly competitive funding availability from the State and Federal Governments.
Ability of the proposed Convention Centre to effectively compete with regional, intrastate and interstate venues,
many of which offer a holistic service offering including accommodation onsite.
Implications of the proposed major conferencing and event space additions in the region by 2020, including
the Westin Coolum Resort and Spa (20 minutes from Noosa) and Sunshine Coast Entertainment, Convention
and Exhibition Centre (40 minutes from Noosa).
The potential impact on pre-existing facilities in Noosa catering to the 150-300 capacity given that the proposed
Convention Centre would still offer different combinations of rooms to be hired within the larger floorprint.
Ancillary costs likely to be incurred in facilitating increased vehicle and foot traffic to and from the proposed
venues.
Potential conditions associated with the historic grants received for the construction of The J.
Council should critically assess the potential merits of capital investment in the proposed venues relative to other
renewal and upgrade projects, noting the risk profile of the proposal. This is particularly the case for capital projects
that have the capability to access State and/or Federal Government funding contributions.
PRE-FEASIBILITY OF CONVENTION AND PERFORMING ARTS CENTRES
vi
TABLE OF CONTENTS
DOCUMENT CONTROL .......................................................................................................................................... I
EXECUTIVE SUMMARY ........................................................................................................................................ II
TABLE OF CONTENTS ........................................................................................................................................ VI
1. BACKGROUND ............................................................................................................................................. 1
2. CCIQ PROPOSAL AND COMMENTARY ..................................................................................................... 2
2.1 THE PROPOSAL ............................................................................................................................................ 2
2.2 LOCATION .................................................................................................................................................... 3
2.3 DEMAND ...................................................................................................................................................... 3
2.4 FINANCIAL PERFORMANCE ............................................................................................................................. 4
2.5 ECONOMIC IMPACTS ..................................................................................................................................... 4
2.6 COMMUNITY IMPACTS ................................................................................................................................... 5
3. REVIEW OF “THE J” .................................................................................................................................... 6
3.1 ABOUT THE J ............................................................................................................................................... 6
3.2 FINANCIAL PERFORMANCE ............................................................................................................................. 7
3.3 ASSETS ....................................................................................................................................................... 7
3.4 REVENUE STREAMS ...................................................................................................................................... 8
3.5 STAFFING .................................................................................................................................................... 8
3.6 STRATEGIC PLANNING................................................................................................................................... 8
3.7 OBLIGATIONS ............................................................................................................................................... 9
4. MARKET ASSESSMENT ............................................................................................................................ 11
4.1 NOOSA MARKET ......................................................................................................................................... 11
4.2 SUNSHINE COAST MARKET .......................................................................................................................... 12
4.3 COMPETITORS FROM OTHER REGIONS ......................................................................................................... 13
4.4 FINANCIAL PERFORMANCE ........................................................................................................................... 14
4.5 FUNDING ................................................................................................................................................... 15
4.6 KEY OUTCOMES ......................................................................................................................................... 15
5. FINANCIAL ASSESSMENT ........................................................................................................................ 17
5.1 DEMAND .................................................................................................................................................... 17
5.2 CAPITAL COST ........................................................................................................................................... 18
5.3 REVENUE .................................................................................................................................................. 19
5.4 OPERATING EXPENDITURE .......................................................................................................................... 20
5.5 DEPRECIATION EXPENSE ............................................................................................................................. 20
5.6 PROFITABILITY ........................................................................................................................................... 20
5.7 OTHER CONSIDERATIONS ............................................................................................................................ 21
6. COUNCIL FINANCIAL POSITION .............................................................................................................. 23
PRE-FEASIBILITY OF CONVENTION AND PERFORMING ARTS CENTRES
vii
6.1 CURRENT FINANCIAL POSITION .................................................................................................................... 23
6.2 CAPITAL FUNDING ...................................................................................................................................... 23
6.3 IMPLICATIONS FOR COUNCIL FINANCIAL SUSTAINABILITY ................................................................................. 24
6.4 DISCUSSION ON DEPRECIATION ................................................................................................................... 25
6.5 IMPAIRMENT EFFECTS ................................................................................................................................. 25
6.6 IMPLICATIONS FOR FACILITATING INFRASTRUCTURE AND SERVICES ................................................................. 26
6.7 NEW ENTITIES/RESOURCES ........................................................................................................................ 26
7. ECONOMIC ASSESSMENT ........................................................................................................................ 27
7.1 APPROACH ................................................................................................................................................ 27
7.2 MODEL DRIVERS AND ASSUMPTIONS ............................................................................................................ 27
7.3 ECONOMIC IMPACT ASSESSMENT ................................................................................................................. 31
7.4 SUMMARY ECONOMIC IMPACTS .................................................................................................................... 33
8. OUTCOMES ................................................................................................................................................ 34
REFERENCES...................................................................................................................................................... 35
APPENDIX A: NATIONAL STRONGER REGIONS FUND (NSRF) ..................................................................... 37
PRE-FEASIBILITY OF CONVENTION AND PERFORMING ARTS CENTRES
1
1. BACKGROUND
CCIQ Noosa has prepared a “Noosa Convention and Cultural Centre Initiative: Pre-feasibility Study” that considers
the location, construction and operation of dedicated Convention and Performing Arts Centres in central Noosa.
The proposal does not recommend one facility with dual purposing but two distinct and complimentary centres
operating independently but cooperatively. The favoured site outlined by CCIQ Noosa is the site of the current
venue centre “The J”.
The pre-feasibility Study was provided by CCIQ Noosa to Noosa Shire Council (Council) with the intention of
forming the basis for Council to commission a professionally executed full feasibility study into the location,
construction and operation of the proposed new facilities.
Council engaged AEC Group Pty Ltd (AEC) to undertake a review of CCIQ Noosa’s pre-feasibility study and to
include the development of initial high-level financial and economic impacts to allow Council to make informed
decision regarding whether it warrants the progress of the concept/proposal to the full feasibility stage.
AEC has adopted the following review process to inform the pre-feasibility assessment:
Review and summary of the CCIQ Noosa pre-feasibility study.
Review of the current site and facility (“The J”).
Market assessment, including a review of competing facilities and the proposed positioning of the new facilities
(taking into account a range of factors, including location/access, accommodation, attractiveness, etc.), in
addition to a review of the performance of comparable facilities (to the extent possible given available
information).
High-level financial assessment of the proposed facilities, taking into account potential demands, revenues
and costs.
High level assessment of the potential implications for Council financial sustainability, based on assumptions
regarding the initial financing of the facilities (e.g. proportion of potential external funding from government
grants/subsidies).
High-level economic assessment of the proposed facilities, taking into account potential changes in visitation
and expenditure trends.
Conclusions and recommendation regarding the appropriateness of progressing to full feasibility stage.
PRE-FEASIBILITY OF CONVENTION AND PERFORMING ARTS CENTRES
2
2. CCIQ PROPOSAL AND COMMENTARY
2.1 THE PROPOSAL
CCIQ Noosa has requested Council to commission a comprehensive feasibility study into the location, construction
and operation of two iconic world class facilities, being:
A dedicated Convention Centre able to cater for 300-650 delegates, with 600 banquet style seating capacity
and 1,000 theatre style seating capacity. Current Noosa Meetings Incentives Conference and Exhibition
(MICE) capacity is capped at around 250 delegates in theatre-style seating (three venues) and no venue can
cater for a sit-down function in excess of 220 delegates.
A separate (adjacent) Performing Arts Centre with at least 700 seating capacity. Beyond its capacity, additional
limitations of The J as a performing arts centre were identified as including a small stage that does not have a
sprung floor, insufficient height, limited seating and challenging acoustics. Noosa Federation of the Arts Inc.
indicated in its letter of support that local space is needed that has the acoustics required for music
performances (i.e. instrumental and voice recitals, orchestral works, opera, musical theatre), has a stage to
accommodate such performances in addition to ballet, and has a green room and dressing room facilities.
Without these aspects, performances and audiences will travel to other larger venues in Brisbane and other
surrounding regions.
It is envisaged that the two centres would operate independently but cooperatively. CCIQ Noosa indicates that its
proposal aligns with the creation of a business and culture model similar to the leadership centres in Banff, Canada
and Carmel and Aspen, USA. It is proposed that a new entity – Events Noosa – should be formed to manage the
flow of events into the facility, in addition to maintaining customer relationships pre and post event. A Speakers
Bureau could also be created.
Regarding estimated costs, CCIQ Noosa indicate that the construction and fit-out of an entry level convention and
exhibition centre could be in the $15 million to $20 million range, while upgrading The J to a modern performing
arts complex would be of the order of $7 million to $10 million. It is proposed that $30 million should be sufficient
for all components of the development.
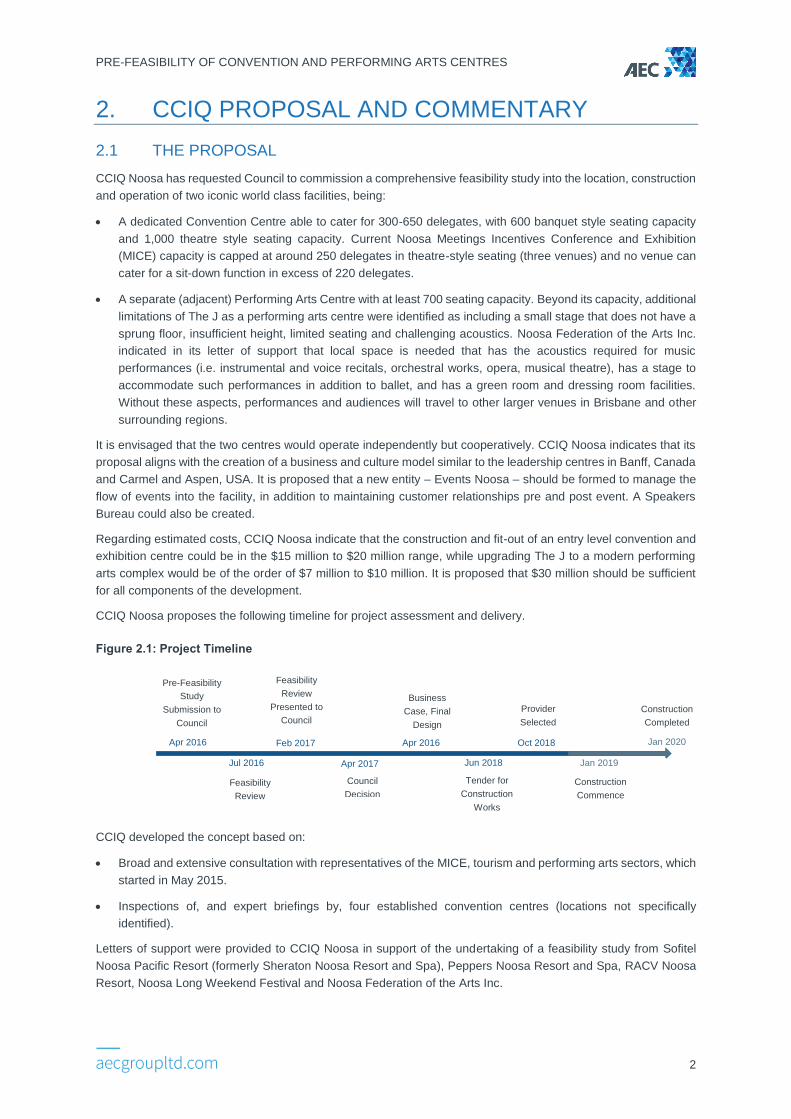
CCIQ Noosa proposes the following timeline for project assessment and delivery.
Figure 2.1: Project Timeline
CCIQ developed the concept based on:
Broad and extensive consultation with representatives of the MICE, tourism and performing arts sectors, which
started in May 2015.
Inspections of, and expert briefings by, four established convention centres (locations not specifically
identified).
Letters of support were provided to CCIQ Noosa in support of the undertaking of a feasibility study from Sofitel
Noosa Pacific Resort (formerly Sheraton Noosa Resort and Spa), Peppers Noosa Resort and Spa, RACV Noosa
Resort, Noosa Long Weekend Festival and Noosa Federation of the Arts Inc.
Pre-Feasibility
Study
Submission to
Council
Apr 2016
Jul 2016
Feb 2017
Apr 2017
Apr 2016
Jun 2018
Oct 2018
Feasibility
Review
Construction
Completed
Jan 2020
Jan 2019
Construction
Commence
Provider
Selected
Feasibility
Review
Presented to
Council
Tender for
Construction
Works
Business
Case, Final
Design
Council
Decision
PRE-FEASIBILITY OF CONVENTION AND PERFORMING ARTS CENTRES
3
2.2 LOCATION
The preferred site for the new centres is identified as the site currently housing The J (subject to a range of identified
issues being resolved), although other location options may be identified during the 2016 Planning Scheme Review.
Key proximity considerations for site selection (preferably within walking distance) were identified as:
Principal accommodation.
Central attractions.
High quality retail.
Parking.
Ancillary services.
Regarding The J, the CCIQ Noosa proposal (p.5) indicates that:
No presumptive assumptions around disposition of the current ‘J’ buildings should be assumed. Expert advice as to
how the current asset might be functionally preserved and integrated into a wider development is essential.
Further, the CCIQ Noosa proposal (p.10) indicates the following:
Retain the ability of The J to operate stand-alone; while at the same time, allowing for its inclusion as a significant
additional space as part of a larger, site-wide conference1.
2.3 DEMAND
Commentary on potential demand is focussed on the Convention Centre, noting that the centre would be targeted
at the mid-level MICE segment catering for the 350-450 delegate range. The following potential national markets
were suggested based on 10% of the total national market2 fitting the profile of the market segment being targeted
by the proposed facility:
1,800 in-house organised event opportunities.
500 professionally staged event opportunities.
500 international global events.
It was suggested that despite the proposed 4,500-seat Sunshine Coast Entertainment, Convention and Exhibition
Centre in Maroochydore, the focus on the mid-level segment should help to reduce competitive bidding between
each facility.
From the above market, the CCIQ proposal (p.6) suggests that the Convention Centre could attract two
conferences per week for 30 weeks of the year, with up to 450 delegates per conference.
However, the proposal acknowledges that targeted market research is required into:
The national offer/marketplace.
Price points and willingness to pay.
Desired features for delegates and partners.
Travel requirements.
It was indicated that two important performance arts spaces to reference as guides for the proposed Performing
Arts Centre are Mandurah Performing Arts Centre in WA and Ashburton Trust Events Centre in Ashburton NZ.
1 It is likely that “venue” or “location” was missing from the end of this sentence.
2 The proposal indicates that IACVB and AACVB figures for global events suggest 18,000 in-house organised events nationally, 500 professionally
staged events nationally, and 15,000 international events of which 30% tour globally.
PRE-FEASIBILITY OF CONVENTION AND PERFORMING ARTS CENTRES
4
Local users of the facilities (most of which already utilise The J) were identified to include:
Noosa Arts Theatre.
Noosa Long Weekend.
Noosa Regional Gallery (offer a new home or an adjunct space for Noosa Regional Gallery as the public space
exhibitor across all areas of both centres).
Noosa Community Radio.
Noosa Jazz Festival.
Noosa Federation for the Arts.
Noosa Biosphere Institute for Sustainability.
Noosa International Film Festival.
Aspects of the Noosa Food and Wine Festival.
A possible professional theatre company could be established.
2.4 FINANCIAL PERFORMANCE
The CCIQ Noosa letter supporting the proposal indicates that expert advice suggests that the two facilities would
operate profitably, but no evidence is provided to justify this statement. Further, it is noted that the Performing Arts
Centre can enhance the profitability of the Convention Centre. It was noted that the Australian Performing Arts
Centres Association (APACA) advised CCIQ Noosa that all performing arts centres in Australia trade at a loss
unless participating in a national performing arts touring circuit of commercially successful shows or gaining
revenue opportunities from event activity (and integrated MICE facility) (CCIQ Noosa, p.7).
Separately, the CCIQ Noosa proposal (p.15) acknowledges that while most venues run at a loss, the primary driver
of such losses is depreciation which is merely an accounting issue given that they are often built and replaced with
government grants. It is further indicated that any such shortfall can be offset by an across-the-board rate rise if
required.
No other comments are made surrounding the financial performance of the new facilities, nor their impact on
Council finances and ongoing financial sustainability. This forms a key part of this pre-feasibility review in a
subsequent chapter.
2.5 ECONOMIC IMPACTS
2.5.1 Convention Centre
CCIQ Noosa indicates that the ability to attract the key mid-market 350-450 delegate MICE business tourism
segment alongside current tourism and events would be a ‘game changer’ in the diversification and branding of the
local economy, with events potentially becoming a third pillar industry for Noosa, adding to the environment and
general tourism as attractors. In addition, the proposed facilities would assist in the creation of a cultural and
business-tourism hub in central Noosa.
It is indicated that higher yield in terms of economic activity can be achieved without higher visitor numbers
(therefore limiting impacts on current market and infrastructure capacities), by shifting a portion (e.g. 20%) of
tourism activity from general tourism into the MICE sector. Further, MICE sector demands would provide stability
to tourism activity in addition to increased profitability and new business and job opportunities. Current capacity off-
peak and mid-week could also be taken advantage of.
Example direct expenditure for the proposed Conference Centre was identified as two conferences per week for
30 weeks of the year, with up to 450 delegates per conference (p.6). Based on an average stay of 2.8 days per
delegate and an average spend of $956 per stay, this equates to $25.81 million per annum and $516.2 million over
PRE-FEASIBILITY OF CONVENTION AND PERFORMING ARTS CENTRES
5
20 years (not discounted to present value). These estimates exclude partner expenditure which was indicated to
add 17%-20% to expenditure on average, in addition to excluding economic multiplier effects.
Reference is made to flow-on effect ratios from EY (2015) – completed on behalf of the Business Events Council
of Australia – with CCIQ Noosa reporting ratios for Queensland of:
1:0.74 for Gross Value Add.
1:1.74 for Gross Value Product.
1:1.36 for Jobs.
However, it should be noted that the above ratios appear to be based on a flawed calculation by CCIQ Noosa in
referencing the wrong values. The actual indirect effects (only) able to be determined by AEC from EY (2015) are
as follows:
0.55 for Gross Value Add.
0.36 for Jobs.
No indirect value of expenditure is mentioned in EY (2015).
2.5.2 Performing Arts Centre
Minimal quantitative information is supplied in relation to the proposed Performing Arts Centre, or expanded version
of The J. It is indicated that the centre should enhance activity through links to national arts touring circuit and
schools across the region and become the home for leading local arts organisations, in addition to servicing the
markets currently captured by The J. The benefits were deemed to also include enhanced cultural tourism business
and job opportunity with more people in the precinct after hours.
2.5.3 Accommodation
Sofitel Noosa Pacific Resort (formerly Sheraton Noosa Resort and Spa), Peppers Noosa Resort and Villas, and
RACV Noosa Resort provided letters of support to CCIQ Noosa in undertaking the comprehensive feasibility study,
given that the proposed facilities will not compete with them by including accommodation. The CCIQ Noosa
proposal (p.13) notes that at least in the short term delegates may out-compete regular travellers of 4 to 5-star
accommodation, until such a time that high quality accommodation supply is increased to match any increased
demands.
2.6 COMMUNITY IMPACTS
It is indicated that the proposed Performing Arts Centre would allow for significantly larger scale events with a mix
of local, regional, national and international artists and performers to be attracted and bid for, adding cultural
diversity and increasing the choice and frequency of cultural and performing arts’ events. Noosa Junction would
also be refreshed as a result of the considerable capital investment in new community infrastructure, creating a
new precinct complementary to Hastings Street and utilising the bus interchange capacity more effectively.
CCIQ Noosa also note that the facilities could also be used as dry (indoor) facilities for existing events, festivals
and weddings, in addition to supporting local community organisations (e.g. schools, dance shools, art schools) at
discounted fees during quieter periods.
PRE-FEASIBILITY OF CONVENTION AND PERFORMING ARTS CENTRES
6
3. REVIEW OF “THE J”
3.1 ABOUT THE J
The J was officially opened in late 2006 and is a Council-owned and operated facility. External funding was sourced
for the project, including a State Government grant of $1.587 million and a Federal Government grant of $1.2
million. The balance of funds to establish the facility was contributed by Council.
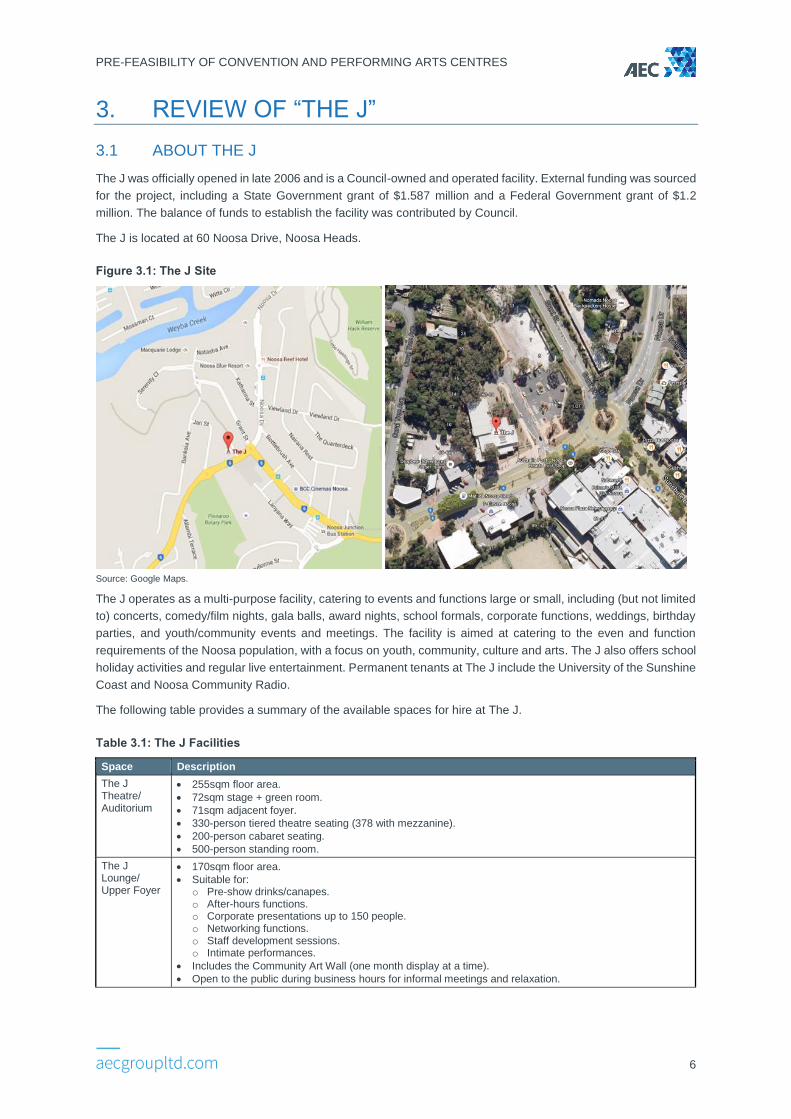
The J is located at 60 Noosa Drive, Noosa Heads.
Figure 3.1: The J Site
Source: Google Maps.
The J operates as a multi-purpose facility, catering to events and functions large or small, including (but not limited
to) concerts, comedy/film nights, gala balls, award nights, school formals, corporate functions, weddings, birthday
parties, and youth/community events and meetings. The facility is aimed at catering to the even and function
requirements of the Noosa population, with a focus on youth, community, culture and arts. The J also offers school
holiday activities and regular live entertainment. Permanent tenants at The J include the University of the Sunshine
Coast and Noosa Community Radio.
The following table provides a summary of the available spaces for hire at The J.
Table 3.1: The J Facilities
Space Description
The J Theatre/ Auditorium
255sqm floor area.
72sqm stage + green room.
71sqm adjacent foyer.
330-person tiered theatre seating (378 with mezzanine).
200-person cabaret seating.
500-person standing room.
The J Lounge/ Upper Foyer
170sqm floor area.
Suitable for: o Pre-show drinks/canapes. o After-hours functions. o Corporate presentations up to 150 people. o Networking functions. o Staff development sessions. o Intimate performances.
Includes the Community Art Wall (one month display at a time).
Open to the public during business hours for informal meetings and relaxation.
PRE-FEASIBILITY OF CONVENTION AND PERFORMING ARTS CENTRES
7
Space Description
Meeting Spaces
The J Boardroom: o 26sqm floor area. o Central meeting desk and seating for 12 people.
The Deck Room: o 33sqm floor area. o Accommodates 16 when seated at central table/s. o Adjacent timber courtyard.
Commercial Kitchen
Available for hire to caterers with a food licence.
Equipped with commercial oven, stove, deep fryer, cold room space, refrigeration, dough mixer, dish washer and ample bench space with fan extraction systems.
Source: www.thej.com.au.
The J offers free on-site parking for up to 220 cars. The Junction shopping precinct also contains 3 free public
parking areas behind the shops, accommodating 700 cars.
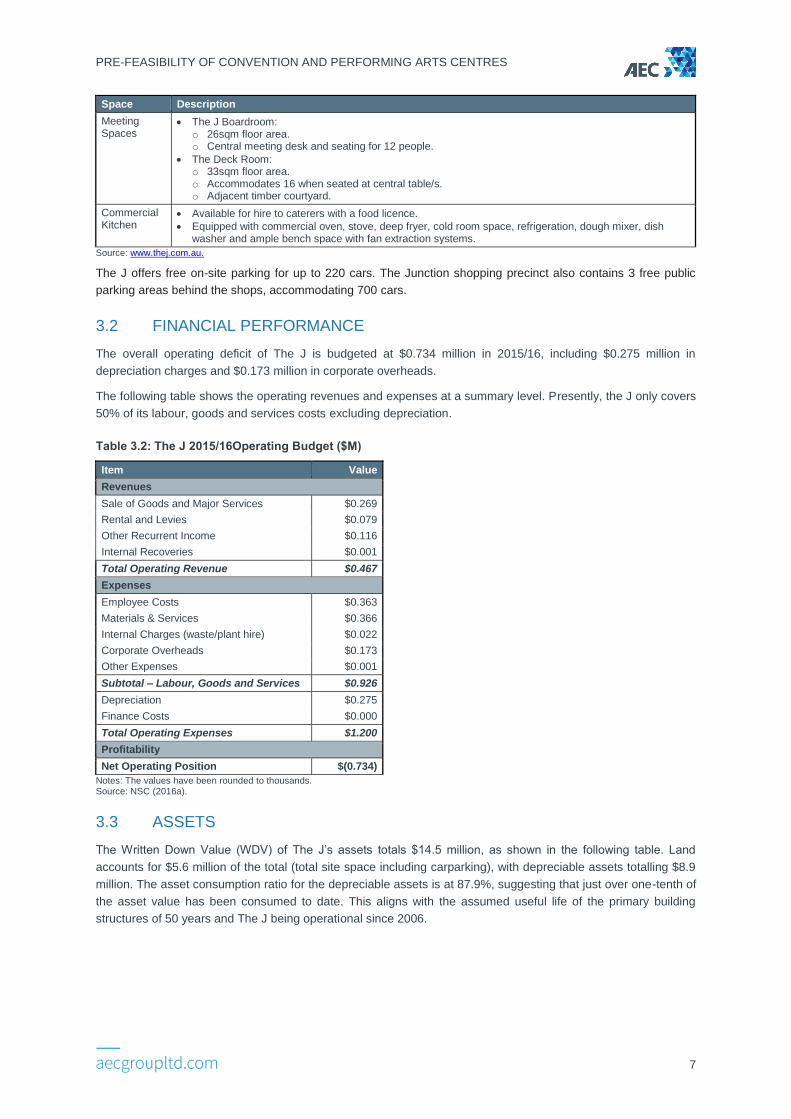
3.2 FINANCIAL PERFORMANCE
The overall operating deficit of The J is budgeted at $0.734 million in 2015/16, including $0.275 million in
depreciation charges and $0.173 million in corporate overheads.
The following table shows the operating revenues and expenses at a summary level. Presently, the J only covers
50% of its labour, goods and services costs excluding depreciation.
Table 3.2: The J 2015/16Operating Budget ($M)
Item Value
Revenues
Sale of Goods and Major Services $0.269
Rental and Levies $0.079
Other Recurrent Income $0.116
Internal Recoveries $0.001
Total Operating Revenue $0.467
Expenses
Employee Costs $0.363
Materials & Services $0.366
Internal Charges (waste/plant hire) $0.022
Corporate Overheads $0.173
Other Expenses $0.001
Subtotal – Labour, Goods and Services $0.926
Depreciation $0.275
Finance Costs $0.000
Total Operating Expenses $1.200
Profitability
Net Operating Position $(0.734)
Notes: The values have been rounded to thousands. Source: NSC (2016a).
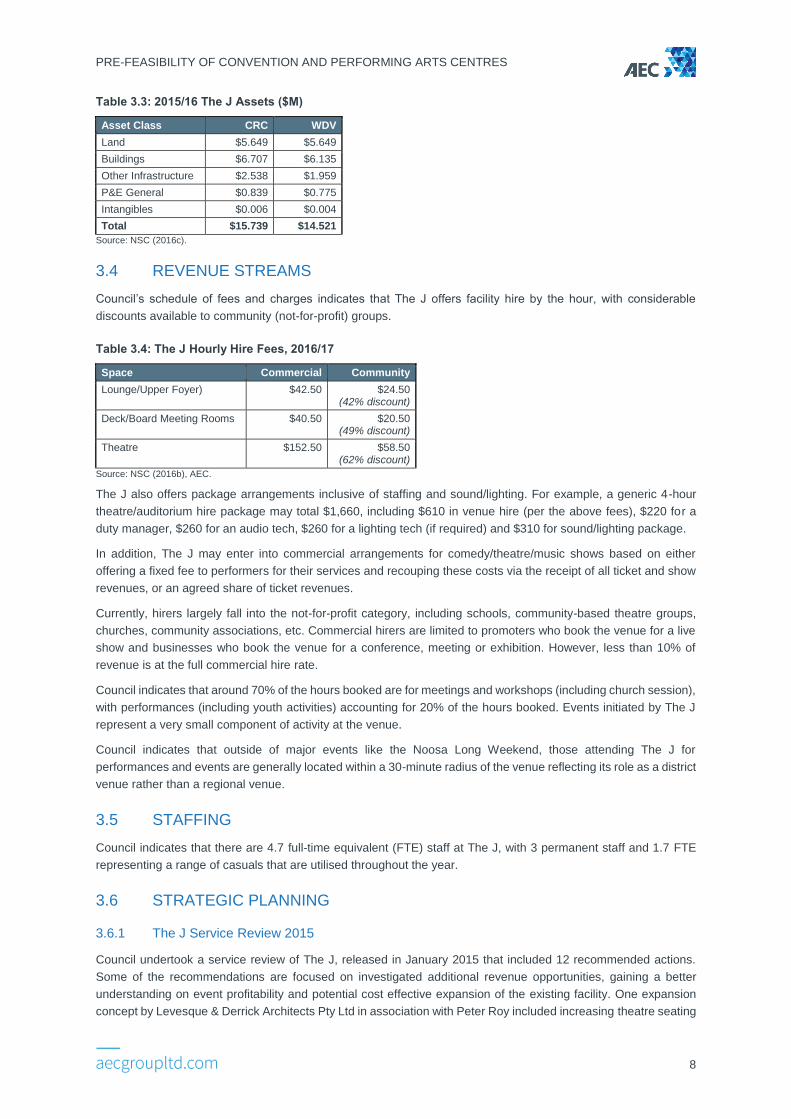
3.3 ASSETS
The Written Down Value (WDV) of The J’s assets totals $14.5 million, as shown in the following table. Land
accounts for $5.6 million of the total (total site space including carparking), with depreciable assets totalling $8.9
million. The asset consumption ratio for the depreciable assets is at 87.9%, suggesting that just over one-tenth of
the asset value has been consumed to date. This aligns with the assumed useful life of the primary building
structures of 50 years and The J being operational since 2006.
PRE-FEASIBILITY OF CONVENTION AND PERFORMING ARTS CENTRES
8
Table 3.3: 2015/16 The J Assets ($M)
Asset Class CRC WDV
Land $5.649 $5.649
Buildings $6.707 $6.135
Other Infrastructure $2.538 $1.959
P&E General $0.839 $0.775
Intangibles $0.006 $0.004
Total $15.739 $14.521
Source: NSC (2016c).
3.4 REVENUE STREAMS
Council’s schedule of fees and charges indicates that The J offers facility hire by the hour, with considerable
discounts available to community (not-for-profit) groups.
Table 3.4: The J Hourly Hire Fees, 2016/17
Space Commercial Community
Lounge/Upper Foyer) $42.50 $24.50 (42% discount)
Deck/Board Meeting Rooms $40.50 $20.50 (49% discount)
Theatre $152.50 $58.50 (62% discount)
Source: NSC (2016b), AEC.
The J also offers package arrangements inclusive of staffing and sound/lighting. For example, a generic 4-hour
theatre/auditorium hire package may total $1,660, including $610 in venue hire (per the above fees), $220 for a
duty manager, $260 for an audio tech, $260 for a lighting tech (if required) and $310 for sound/lighting package.
In addition, The J may enter into commercial arrangements for comedy/theatre/music shows based on either
offering a fixed fee to performers for their services and recouping these costs via the receipt of all ticket and show
revenues, or an agreed share of ticket revenues.
Currently, hirers largely fall into the not-for-profit category, including schools, community-based theatre groups,
churches, community associations, etc. Commercial hirers are limited to promoters who book the venue for a live
show and businesses who book the venue for a conference, meeting or exhibition. However, less than 10% of
revenue is at the full commercial hire rate.
Council indicates that around 70% of the hours booked are for meetings and workshops (including church session),
with performances (including youth activities) accounting for 20% of the hours booked. Events initiated by The J
represent a very small component of activity at the venue.
Council indicates that outside of major events like the Noosa Long Weekend, those attending The J for
performances and events are generally located within a 30-minute radius of the venue reflecting its role as a district
venue rather than a regional venue.
3.5 STAFFING
Council indicates that there are 4.7 full-time equivalent (FTE) staff at The J, with 3 permanent staff and 1.7 FTE
representing a range of casuals that are utilised throughout the year.
3.6 STRATEGIC PLANNING
3.6.1 The J Service Review 2015
Council undertook a service review of The J, released in January 2015 that included 12 recommended actions.
Some of the recommendations are focused on investigated additional revenue opportunities, gaining a better
understanding on event profitability and potential cost effective expansion of the existing facility. One expansion
concept by Levesque & Derrick Architects Pty Ltd in association with Peter Roy included increasing theatre seating
PRE-FEASIBILITY OF CONVENTION AND PERFORMING ARTS CENTRES
9
capacity to 430-450, improving the acoustics system to allow diversity of performances and enhancing the stage
and other areas at an indicative cost of $5-6 million (albeit noting that full costing would need to be undertaken
prior progressing this option).
3.6.2 The J Business Plan 2015-2018
The Business Plan 2015-2018 for The J was completed in November 2015 by 99 Consulting, and builds upon The
J Service Review. The Business Plan’s aim is:
To identify actions and opportunities to increase Council’s return on investment by increasing community benefit and
value, and reducing net cost to Council.
Revenue opportunities include restructure of fees, increase venue utilisation and increase proportion of
commercial-rate hirers. It was noted that there is significant competition from commercial venues for the more
profitable events. Cost reduction opportunities are limited and may result in increasing costs to gain a higher
revenue. However, it was noted that growth of revenue and associated expenses should be reviewed in a profitable
way.
In response to requests for increased capacity at The J and an assessment of the potential development of a
conference facility on the site, the Business Plan indicates that Council will need to consider any potential future
development/expansion in the context of venue provision on the entire Sunshine Coast region.
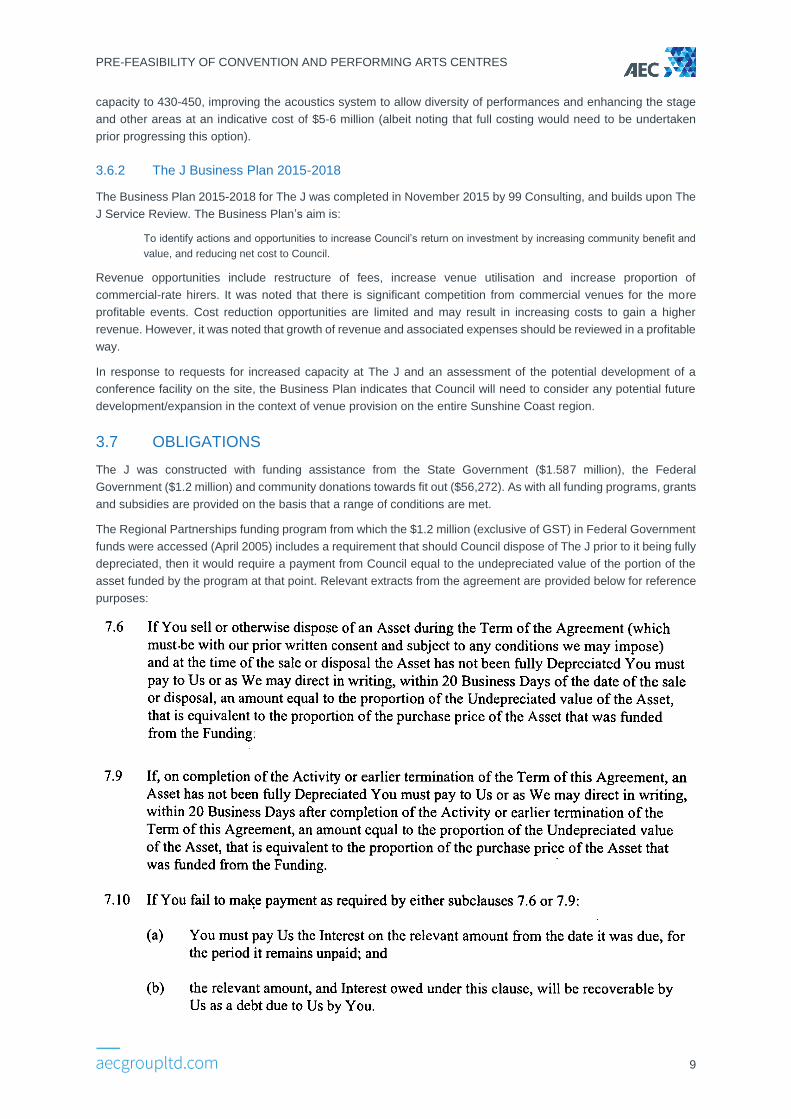
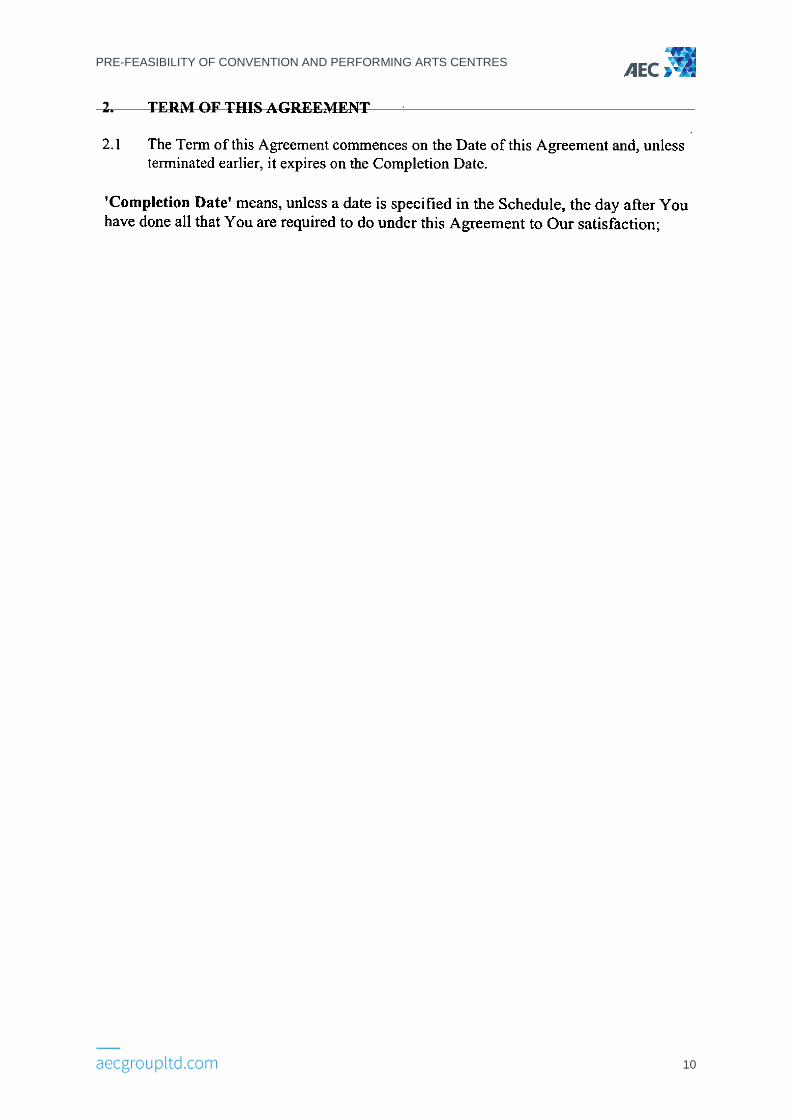
3.7 OBLIGATIONS
The J was constructed with funding assistance from the State Government ($1.587 million), the Federal
Government ($1.2 million) and community donations towards fit out ($56,272). As with all funding programs, grants
and subsidies are provided on the basis that a range of conditions are met.
The Regional Partnerships funding program from which the $1.2 million (exclusive of GST) in Federal Government
funds were accessed (April 2005) includes a requirement that should Council dispose of The J prior to it being fully
depreciated, then it would require a payment from Council equal to the undepreciated value of the portion of the
asset funded by the program at that point. Relevant extracts from the agreement are provided below for reference
purposes:
PRE-FEASIBILITY OF CONVENTION AND PERFORMING ARTS CENTRES
10
PRE-FEASIBILITY OF CONVENTION AND PERFORMING ARTS CENTRES
11
4. MARKET ASSESSMENT
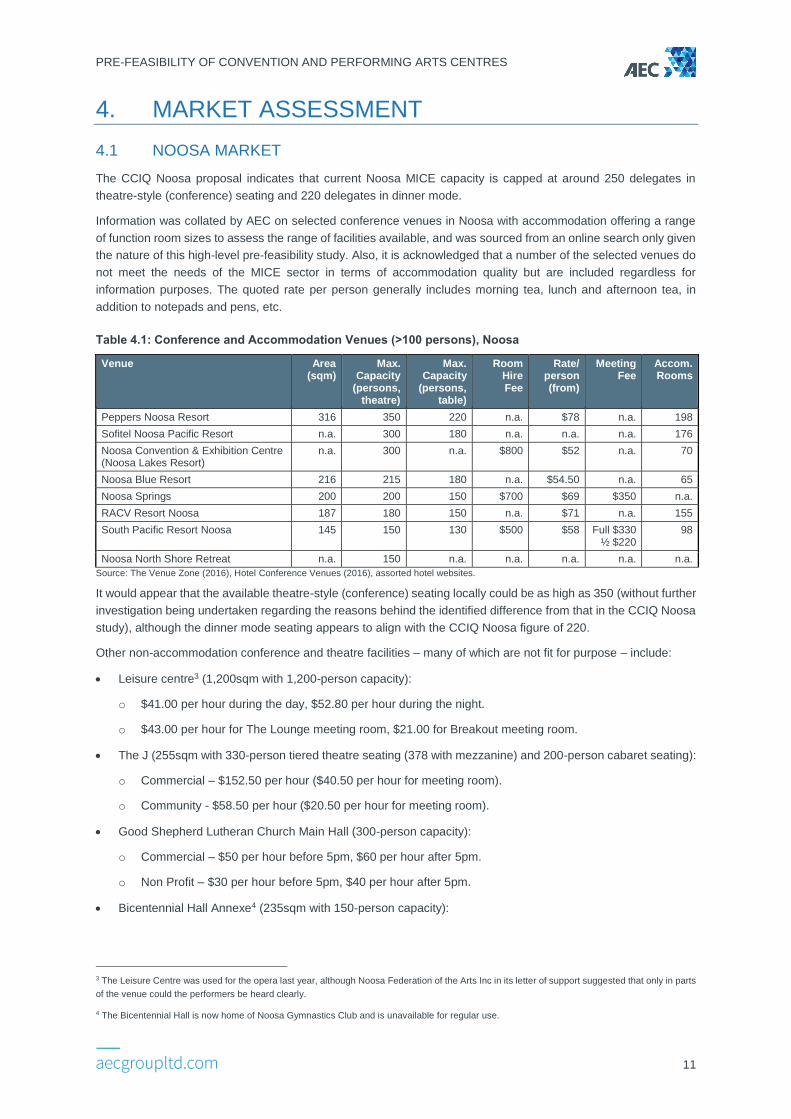
4.1 NOOSA MARKET
The CCIQ Noosa proposal indicates that current Noosa MICE capacity is capped at around 250 delegates in
theatre-style (conference) seating and 220 delegates in dinner mode.
Information was collated by AEC on selected conference venues in Noosa with accommodation offering a range
of function room sizes to assess the range of facilities available, and was sourced from an online search only given
the nature of this high-level pre-feasibility study. Also, it is acknowledged that a number of the selected venues do
not meet the needs of the MICE sector in terms of accommodation quality but are included regardless for
information purposes. The quoted rate per person generally includes morning tea, lunch and afternoon tea, in
addition to notepads and pens, etc.
Table 4.1: Conference and Accommodation Venues (>100 persons), Noosa
Venue Area (sqm)
Max. Capacity
(persons, theatre)
Max. Capacity
(persons, table)
Room Hire Fee
Rate/ person (from)
Meeting Fee
Accom. Rooms
Peppers Noosa Resort 316 350 220 n.a. $78 n.a. 198
Sofitel Noosa Pacific Resort n.a. 300 180 n.a. n.a. n.a. 176
Noosa Convention & Exhibition Centre (Noosa Lakes Resort)
n.a. 300 n.a. $800 $52 n.a. 70
Noosa Blue Resort 216 215 180 n.a. $54.50 n.a. 65
Noosa Springs 200 200 150 $700 $69 $350 n.a.
RACV Resort Noosa 187 180 150 n.a. $71 n.a. 155
South Pacific Resort Noosa 145 150 130 $500 $58 Full $330 ½ $220
98
Noosa North Shore Retreat n.a. 150 n.a. n.a. n.a. n.a. n.a.
Source: The Venue Zone (2016), Hotel Conference Venues (2016), assorted hotel websites.
It would appear that the available theatre-style (conference) seating locally could be as high as 350 (without further
investigation being undertaken regarding the reasons behind the identified difference from that in the CCIQ Noosa
study), although the dinner mode seating appears to align with the CCIQ Noosa figure of 220.
Other non-accommodation conference and theatre facilities – many of which are not fit for purpose – include:
Leisure centre3 (1,200sqm with 1,200-person capacity):
o $41.00 per hour during the day, $52.80 per hour during the night.
o $43.00 per hour for The Lounge meeting room, $21.00 for Breakout meeting room.
The J (255sqm with 330-person tiered theatre seating (378 with mezzanine) and 200-person cabaret seating):
o Commercial – $152.50 per hour ($40.50 per hour for meeting room).
o Community - $58.50 per hour ($20.50 per hour for meeting room).
Good Shepherd Lutheran Church Main Hall (300-person capacity):
o Commercial – $50 per hour before 5pm, $60 per hour after 5pm.
o Non Profit – $30 per hour before 5pm, $40 per hour after 5pm.
Bicentennial Hall Annexe4 (235sqm with 150-person capacity):
3 The Leisure Centre was used for the opera last year, although Noosa Federation of the Arts Inc in its letter of support suggested that only in parts
of the venue could the performers be heard clearly.
4 The Bicentennial Hall is now home of Noosa Gymnastics Club and is unavailable for regular use.
PRE-FEASIBILITY OF CONVENTION AND PERFORMING ARTS CENTRES
12
o Commercial – $55.50 per hour.
o Community – $18.50 per hour.
Noosa Boathouse River Room (130-person capacity).
Noosa Arts Theatre5 (122-person capacity raked theatre style).
Tewantin-Noosa RSL (120-person capacity).
There are a range of Council, school, church and community halls to cater for smaller, local events, which are not
considered to be competing venues.
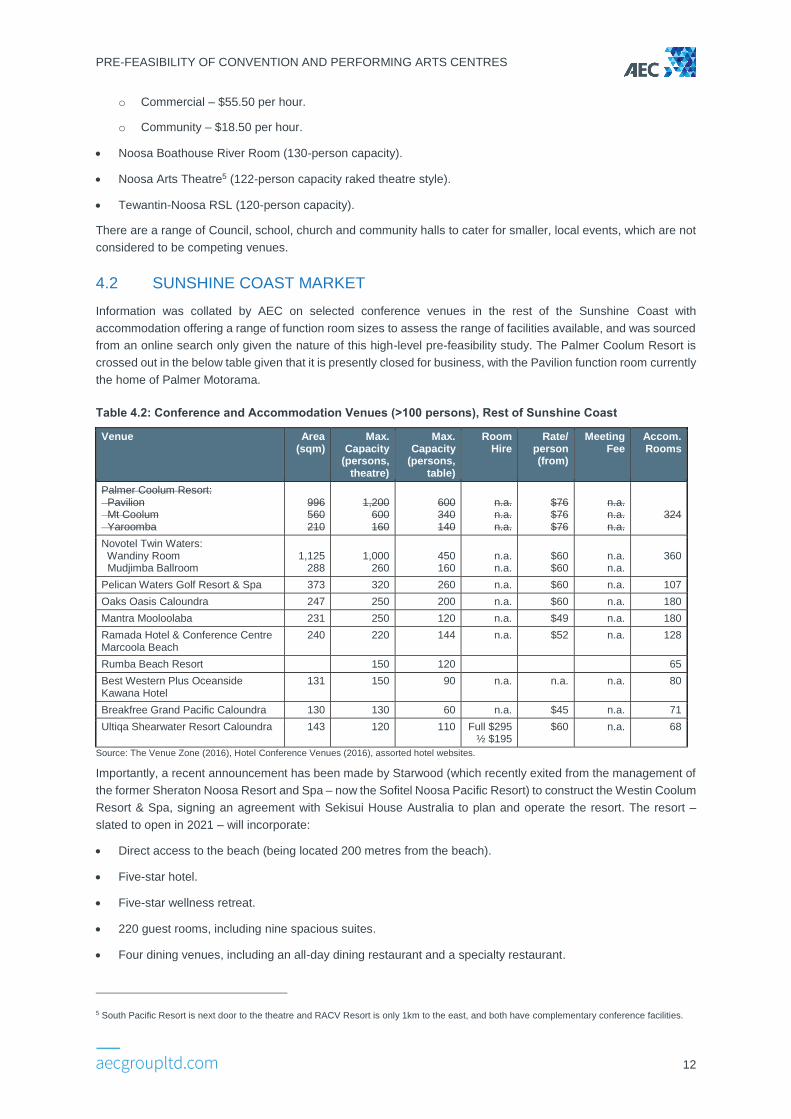
4.2 SUNSHINE COAST MARKET
Information was collated by AEC on selected conference venues in the rest of the Sunshine Coast with
accommodation offering a range of function room sizes to assess the range of facilities available, and was sourced
from an online search only given the nature of this high-level pre-feasibility study. The Palmer Coolum Resort is
crossed out in the below table given that it is presently closed for business, with the Pavilion function room currently
the home of Palmer Motorama.
Table 4.2: Conference and Accommodation Venues (>100 persons), Rest of Sunshine Coast
Venue Area (sqm)
Max. Capacity
(persons, theatre)
Max. Capacity
(persons, table)
Room Hire
Rate/ person (from)
Meeting Fee
Accom. Rooms
Palmer Coolum Resort: Pavilion Mt Coolum Yaroomba
996 560 210
1,200
600 160
600 340 140
n.a. n.a. n.a.
$76 $76 $76
n.a. n.a. n.a.
324
Novotel Twin Waters: Wandiny Room Mudjimba Ballroom
1,125
288
1,000
260
450 160
n.a. n.a.
$60 $60
n.a. n.a.
360
Pelican Waters Golf Resort & Spa 373 320 260 n.a. $60 n.a. 107
Oaks Oasis Caloundra 247 250 200 n.a. $60 n.a. 180
Mantra Mooloolaba 231 250 120 n.a. $49 n.a. 180
Ramada Hotel & Conference Centre Marcoola Beach
240 220 144 n.a. $52 n.a. 128
Rumba Beach Resort 150 120 65
Best Western Plus Oceanside Kawana Hotel
131 150 90 n.a. n.a. n.a. 80
Breakfree Grand Pacific Caloundra 130 130 60 n.a. $45 n.a. 71
Ultiqa Shearwater Resort Caloundra 143 120 110 Full $295 ½ $195
$60 n.a. 68
Source: The Venue Zone (2016), Hotel Conference Venues (2016), assorted hotel websites.
Importantly, a recent announcement has been made by Starwood (which recently exited from the management of
the former Sheraton Noosa Resort and Spa – now the Sofitel Noosa Pacific Resort) to construct the Westin Coolum
Resort & Spa, signing an agreement with Sekisui House Australia to plan and operate the resort. The resort –
slated to open in 2021 – will incorporate:
Direct access to the beach (being located 200 metres from the beach).
Five-star hotel.
Five-star wellness retreat.
220 guest rooms, including nine spacious suites.
Four dining venues, including an all-day dining restaurant and a specialty restaurant.
5 South Pacific Resort is next door to the theatre and RACV Resort is only 1km to the east, and both have complementary conference facilities.
PRE-FEASIBILITY OF CONVENTION AND PERFORMING ARTS CENTRES
13
850sqm of ultra-modern conference and event space, including pre-function areas, a large flexible ballroom,
which can be divided into three, plus a chapel making it the perfect destination for large scale meetings and
events, and weddings.
This will be a considerable addition to high quality accommodation and conferencing/events capacity on the
Sunshine Coast, and is located within reasonable proximity of Noosa. It will have considerable advantages over
the proposed Noosa Convention Centre in that it is located closer to the airport, has beachfront access and views,
and has accommodation and attractions onsite.
The Sunshine Coast Entertainment, Convention and Exhibition Centre is proposed to be developed between 2018
and 2020 and will provide a main auditorium/arena for up to 4,500 people in theatre mode (and flexible
configurations to allow for as little as 1,000 delegates), an exhibition hall for up to 2,500 people in banquet model
and 12-15 meeting rooms with variable capacity of 20-360 people. The exhibition venue will cater to a range of
major industry, trade and public exhibitions.
Other non-accommodation conference and theatre facilities – many of which are not fit for purpose – include:
The Events Centre, Caloundra (1,200-person theatre style, smaller playhouse configuration with 320 seats).
Suncoast Convention Centre (Suncoast Church, Woombye) (1,200-person theatre style).
Lake Kawana Community Centre (Main Hall – 740-person theatre style, 480-person dining + Lake View Room
– 150-person theatre style).
Caloundra Power Boat Club (400-person theatre style, 310-person dining).
Coolum Civic Centre (350-person theatre style).
Beerwah & District Community Hall (350-person theatre style).
Sunshine Coast Function Centre (Caloundra RSL) (350-person capacity).
Kawana Community Hall (320-person theatre style, 200-person dining).
Maroochy Surf Club (200-person theatre style, 200-person dining).
Sunshine Coast Turf Club (Caloundra) (170-person capacity) – $500 hire.
The Lakehouse Sunshine Coast (Mountain Creek) (150-person capacity).
Sunshine Coast Stadium (Kawana Sports Precinct) (120-person capacity).
The Nambour Civic Centre is no longer active and is now a cinema complex.
4.3 COMPETITORS FROM OTHER REGIONS
4.3.1 Convention/Conference Centres
In addition to competition within the local market, the proposed Convention Centre would compete with alternative
regional and metropolitan convention facilities nationwide in order to attract and retain events.
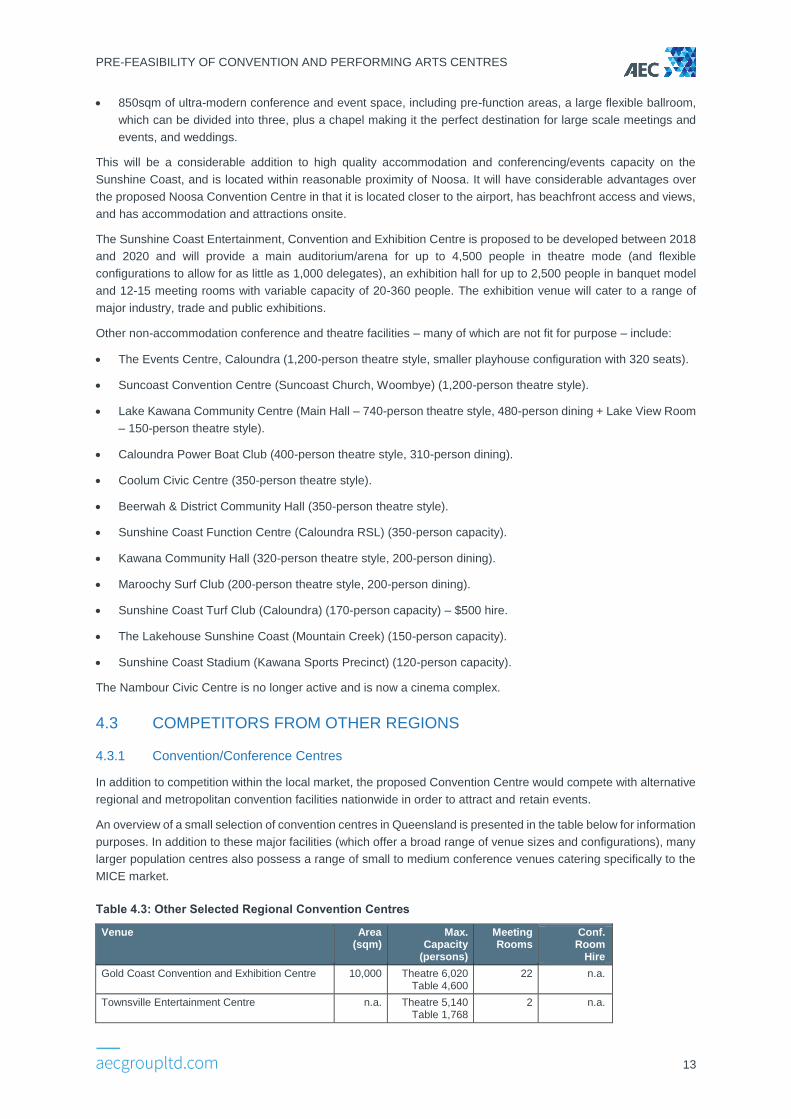
An overview of a small selection of convention centres in Queensland is presented in the table below for information
purposes. In addition to these major facilities (which offer a broad range of venue sizes and configurations), many
larger population centres also possess a range of small to medium conference venues catering specifically to the
MICE market.
Table 4.3: Other Selected Regional Convention Centres
Venue Area (sqm)
Max. Capacity
(persons)
Meeting Rooms
Conf. Room
Hire
Gold Coast Convention and Exhibition Centre 10,000 Theatre 6,020 Table 4,600
22 n.a.
Townsville Entertainment Centre n.a. Theatre 5,140 Table 1,768
2 n.a.
PRE-FEASIBILITY OF CONVENTION AND PERFORMING ARTS CENTRES
14
Venue Area (sqm)
Max. Capacity
(persons)
Meeting Rooms
Conf. Room
Hire
Cairns Convention Centre 4,560 Theatre 5,000 Table 1,080
9 n.a.
Mackay Entertainment and Convention Centre (convention centre component only)
1,460 Theatre 1,540 Table 800
4 $6,030 $5,430 NFP
Seaworld Convention Centre 2,000 Theatre 1,000 Table 400
n.a. n.a.
Gladstone Entertainment Convention Centre (hall component only)
850 Theatre 900 Table 500
3 x conf./ breakout
$3,000 $1,200 NFP
Source: Various convention centre websites.
The proposed Noosa Convention Centre will face significant competition from established centres and will operate
on the smaller end of facilities in other locations.
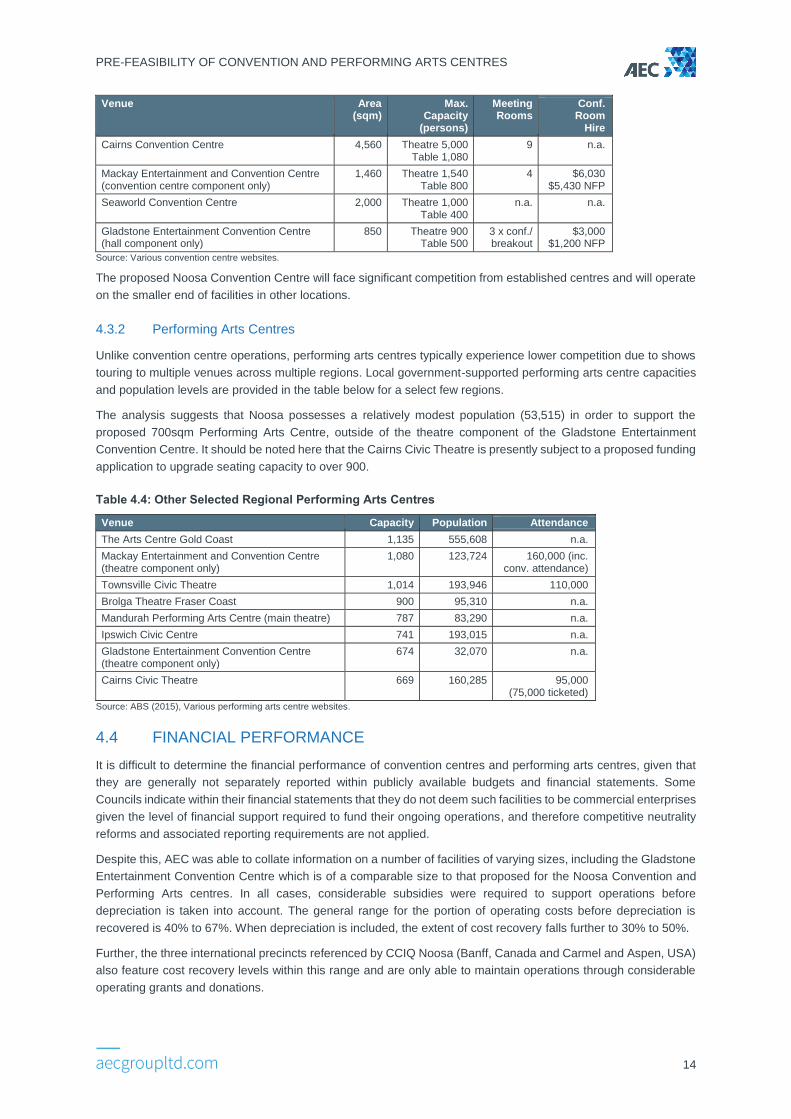
4.3.2 Performing Arts Centres
Unlike convention centre operations, performing arts centres typically experience lower competition due to shows
touring to multiple venues across multiple regions. Local government-supported performing arts centre capacities
and population levels are provided in the table below for a select few regions.
The analysis suggests that Noosa possesses a relatively modest population (53,515) in order to support the
proposed 700sqm Performing Arts Centre, outside of the theatre component of the Gladstone Entertainment
Convention Centre. It should be noted here that the Cairns Civic Theatre is presently subject to a proposed funding
application to upgrade seating capacity to over 900.
Table 4.4: Other Selected Regional Performing Arts Centres
Venue Capacity Population Attendance
The Arts Centre Gold Coast 1,135 555,608 n.a.
Mackay Entertainment and Convention Centre (theatre component only)
1,080 123,724 160,000 (inc. conv. attendance)
Townsville Civic Theatre 1,014 193,946 110,000
Brolga Theatre Fraser Coast 900 95,310 n.a.
Mandurah Performing Arts Centre (main theatre) 787 83,290 n.a.
Ipswich Civic Centre 741 193,015 n.a.
Gladstone Entertainment Convention Centre (theatre component only)
674 32,070 n.a.
Cairns Civic Theatre 669 160,285 95,000 (75,000 ticketed)
Source: ABS (2015), Various performing arts centre websites.
4.4 FINANCIAL PERFORMANCE
It is difficult to determine the financial performance of convention centres and performing arts centres, given that
they are generally not separately reported within publicly available budgets and financial statements. Some
Councils indicate within their financial statements that they do not deem such facilities to be commercial enterprises
given the level of financial support required to fund their ongoing operations, and therefore competitive neutrality
reforms and associated reporting requirements are not applied.
Despite this, AEC was able to collate information on a number of facilities of varying sizes, including the Gladstone
Entertainment Convention Centre which is of a comparable size to that proposed for the Noosa Convention and
Performing Arts centres. In all cases, considerable subsidies were required to support operations before
depreciation is taken into account. The general range for the portion of operating costs before depreciation is
recovered is 40% to 67%. When depreciation is included, the extent of cost recovery falls further to 30% to 50%.
Further, the three international precincts referenced by CCIQ Noosa (Banff, Canada and Carmel and Aspen, USA)
also feature cost recovery levels within this range and are only able to maintain operations through considerable
operating grants and donations.
PRE-FEASIBILITY OF CONVENTION AND PERFORMING ARTS CENTRES
15
For the Gladstone Entertainment Convention Centre – which includes convention and performance arts
components of a comparable size to that proposed by CCIQ Noosa – the net annual operating loss is currently
estimated at $2.344 million before depreciation and $3.269 million after depreciation.
4.5 FUNDING
The following comments are made regarding the external capital funding of selected venues based on information
sourced online and Ranbury Management Group (2011):
Gold Coast Convention and Exhibition Centre (2004):
o Owned and funded by Queensland Government.
o Operated by Tabcorp (Jupiter Limited).
Townsville Entertainment and Exhibition Centre (1993):
o Funded by Queensland Government ($7 million), Townsville City Council ($14 million) and Breakwater
Island Trust (land valued at $6.5 million), with a subsequent $23 million upgrade equally funded by the
Queensland Government ($11.5 million) and Townsville City Council ($11.5 million) in 1997, and recent
refurbishment works at least part funded by the Federal Government ($5 million contribution) and
Queensland Government ($1.8 million).
o Owned by Queensland Government, Townsville City Council and Breakwater Island Trust as a Joint
Venture.
o Operated by Tabcorp (with Convention Bureau funding for marketing provided by Queensland
Government).
Mackay Convention and Exhibition Centre (2009):
o Owned and operated by Mackay Regional Council (with Convention Bureau funding for marketing provided
by Queensland Government).
o Funded by Queensland Government ($29 million) and local land owners.
Gladstone Entertainment Convention Centre (2013):
o Owned and operated by Gladstone Regional Council.
o Funded via a rates equivalent payment from Gladstone Ports Corporation (a Government-owned
corporation).
Sunshine Coast Entertainment, Convention and Exhibition Centre (proposed by 2020):
o Provided/subsidised as part of a holistic area-wide residential and commercial development.
4.6 KEY OUTCOMES
4.6.1 Convention Centre Market
There are a number of different privately owned and operated conference and accommodation venues in
Noosa catering for the 150-300 seating capacity conferencing market.
In the broader Sunshine Coast market, there are a variety of similar venues with a holistic service offering that
compete for the same market, in addition to a number of other venue only providers such as sporting clubs,
RSL and halls.
In the mid to high level MICE market, Novotel Twin Waters (30 minutes from Noosa) offers 1,000 seating
capacity and the Lake Kawana Community Centre (40 minutes from Noosa) offers 740 seating capacity.
There is considerable uncertainty surrounding the future of the Palmer Coolum Resort and future use of the
site, although it also features considerable capacity to meet the needs of the mid to high level MICE market
should its supply come back online at some point.
PRE-FEASIBILITY OF CONVENTION AND PERFORMING ARTS CENTRES
16
By 2020, the following major additions are expected in the regional market:
o Westin Coolum Resort and Spa (20 minutes from Noosa) offering 850sqm of ultra-modern conference and
event space.
o Sunshine Coast Entertainment, Convention and Exhibition Centre (40 minutes from Noosa) offering a
convention venue for up to 2,500 people.
The proposed sizing of the proposed Noosa Convention Centre is at the lower end of comparable
regional/metropolitan venues, and is best benchmarked against the Gladstone Entertainment Convention
Centre which includes a theatre alongside convention facilities.
The proposed Noosa Convention Centre will face significant competition from established centres outside of
the region, in addition to competition from Twin Waters and the Kawana Community Centre in the local market
in the initial instance and the Sunshine Coast Entertainment, Convention and Exhibition Centre and Westin
Coolum Resort and Spa when they are constructed.
The proposed Noosa Convention Centre would also still compete with pre-existing facilities catering to the 150-
300 capacity given that it would offer different combinations of rooms to be hired within the larger floorprint.
4.6.2 Performing Arts Centre Market
The J and the Noosa Arts Theatre are the primary dedicated theatre facilities catering to the local market, with
The J having a seating capacity of up to 378 persons.
Performing arts centres typically experience lower competition across localities due to shows touring to multiple
venues across multiple regions.
However, Noosa would be in a competitive environment with the venues managed by Sunshine Coast Venues
and Events, including Lake Kawana Community Centre (40 minutes from Noosa) and The Events Centre (50
minutes from Noosa) in addition to the proposed Sunshine Coast Entertainment, Convention and Exhibition
Centre (40 minutes from Noosa).
The proposed 700-seat Noosa Performing Arts Theatre would appear to feature quite a high seating capacity
relative to the local population when compared with other regions, with the exception of the theatre component
of the Gladstone Entertainment Convention Centre – this is particularly the case given the facilities provided
elsewhere on the Sunshine Coast.
4.6.3 Financial Performance
All surveyed venues incur considerable operating losses, even when depreciation is excluded.
Such as outcome would also be highly likely for the proposed Noosa Convention Centre and Performing Arts
Centre.
4.6.4 Funding
Some of the larger convention centres have been at least part funded from the Queensland Government or
other external partners, although funding programs are much tighter in the present environment.
PRE-FEASIBILITY OF CONVENTION AND PERFORMING ARTS CENTRES
17
5. FINANCIAL ASSESSMENT
5.1 DEMAND
5.1.1 Convention Centre
It is extremely difficult to establish a baseline position for Convention Centre demand, given that the proposal is to
construct a facility and enter into competition with existing providers in other locations for a completely new market
segment – being the 350-450 MICE sector.
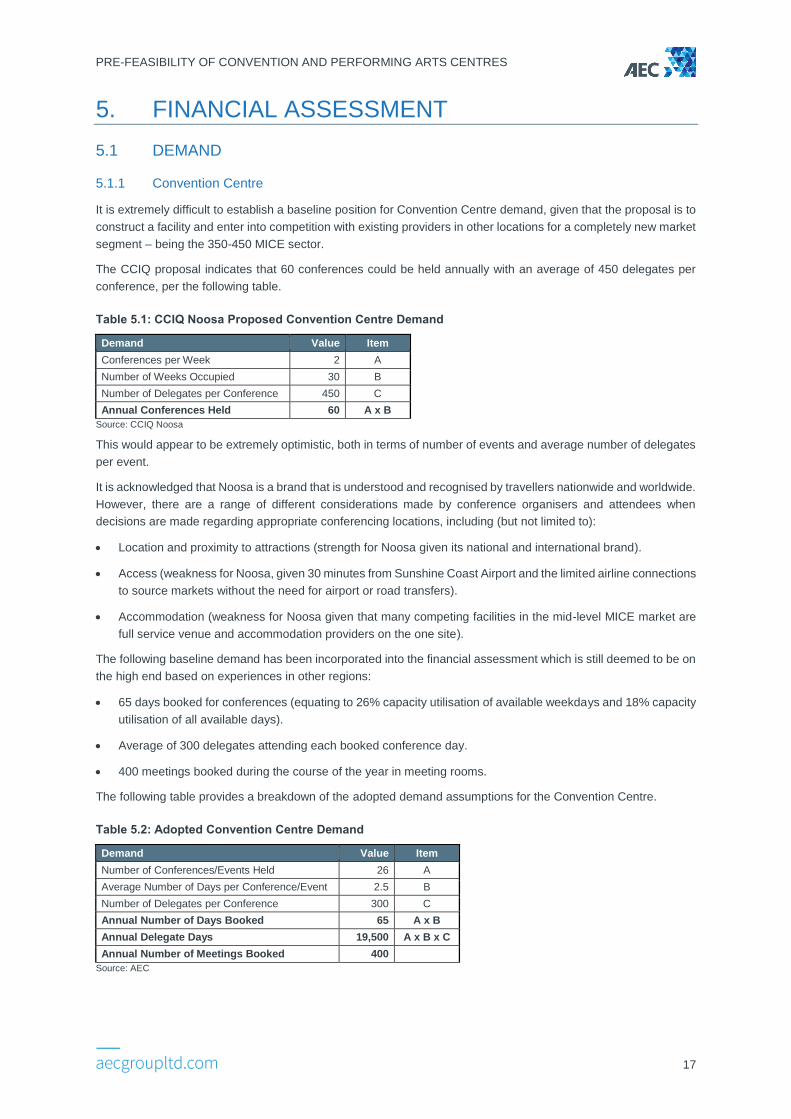
The CCIQ proposal indicates that 60 conferences could be held annually with an average of 450 delegates per
conference, per the following table.
Table 5.1: CCIQ Noosa Proposed Convention Centre Demand
Demand Value Item
Conferences per Week 2 A
Number of Weeks Occupied 30 B
Number of Delegates per Conference 450 C
Annual Conferences Held 60 A x B
Source: CCIQ Noosa
This would appear to be extremely optimistic, both in terms of number of events and average number of delegates
per event.
It is acknowledged that Noosa is a brand that is understood and recognised by travellers nationwide and worldwide.
However, there are a range of different considerations made by conference organisers and attendees when
decisions are made regarding appropriate conferencing locations, including (but not limited to):
Location and proximity to attractions (strength for Noosa given its national and international brand).
Access (weakness for Noosa, given 30 minutes from Sunshine Coast Airport and the limited airline connections
to source markets without the need for airport or road transfers).
Accommodation (weakness for Noosa given that many competing facilities in the mid-level MICE market are
full service venue and accommodation providers on the one site).
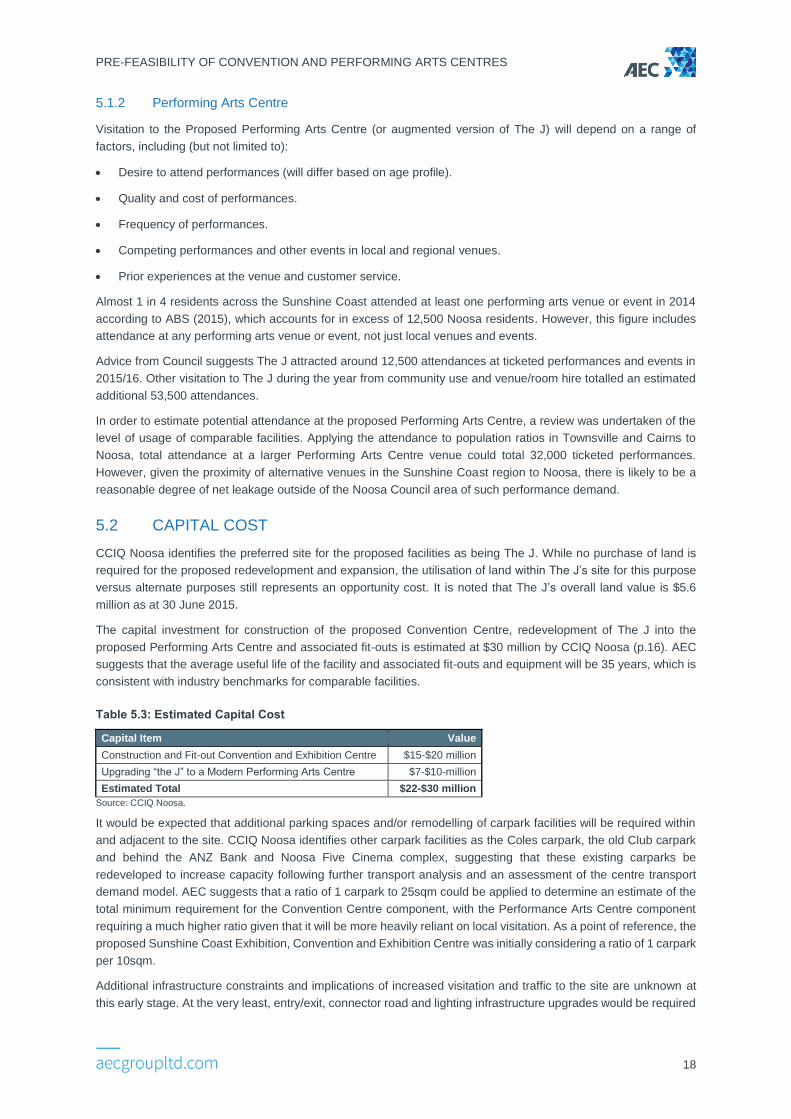
The following baseline demand has been incorporated into the financial assessment which is still deemed to be on
the high end based on experiences in other regions:
65 days booked for conferences (equating to 26% capacity utilisation of available weekdays and 18% capacity
utilisation of all available days).
Average of 300 delegates attending each booked conference day.
400 meetings booked during the course of the year in meeting rooms.
The following table provides a breakdown of the adopted demand assumptions for the Convention Centre.
Table 5.2: Adopted Convention Centre Demand
Demand Value Item
Number of Conferences/Events Held 26 A
Average Number of Days per Conference/Event 2.5 B
Number of Delegates per Conference 300 C
Annual Number of Days Booked 65 A x B
Annual Delegate Days 19,500 A x B x C
Annual Number of Meetings Booked 400
Source: AEC
PRE-FEASIBILITY OF CONVENTION AND PERFORMING ARTS CENTRES
18
5.1.2 Performing Arts Centre
Visitation to the Proposed Performing Arts Centre (or augmented version of The J) will depend on a range of
factors, including (but not limited to):
Desire to attend performances (will differ based on age profile).
Quality and cost of performances.
Frequency of performances.
Competing performances and other events in local and regional venues.
Prior experiences at the venue and customer service.
Almost 1 in 4 residents across the Sunshine Coast attended at least one performing arts venue or event in 2014
according to ABS (2015), which accounts for in excess of 12,500 Noosa residents. However, this figure includes
attendance at any performing arts venue or event, not just local venues and events.
Advice from Council suggests The J attracted around 12,500 attendances at ticketed performances and events in
2015/16. Other visitation to The J during the year from community use and venue/room hire totalled an estimated
additional 53,500 attendances.
In order to estimate potential attendance at the proposed Performing Arts Centre, a review was undertaken of the
level of usage of comparable facilities. Applying the attendance to population ratios in Townsville and Cairns to
Noosa, total attendance at a larger Performing Arts Centre venue could total 32,000 ticketed performances.
However, given the proximity of alternative venues in the Sunshine Coast region to Noosa, there is likely to be a
reasonable degree of net leakage outside of the Noosa Council area of such performance demand.
5.2 CAPITAL COST
CCIQ Noosa identifies the preferred site for the proposed facilities as being The J. While no purchase of land is
required for the proposed redevelopment and expansion, the utilisation of land within The J’s site for this purpose
versus alternate purposes still represents an opportunity cost. It is noted that The J’s overall land value is $5.6
million as at 30 June 2015.
The capital investment for construction of the proposed Convention Centre, redevelopment of The J into the
proposed Performing Arts Centre and associated fit-outs is estimated at $30 million by CCIQ Noosa (p.16). AEC
suggests that the average useful life of the facility and associated fit-outs and equipment will be 35 years, which is
consistent with industry benchmarks for comparable facilities.
Table 5.3: Estimated Capital Cost
Capital Item Value
Construction and Fit-out Convention and Exhibition Centre $15-$20 million
Upgrading “the J” to a Modern Performing Arts Centre $7-$10-million
Estimated Total $22-$30 million
Source: CCIQ Noosa.
It would be expected that additional parking spaces and/or remodelling of carpark facilities will be required within
and adjacent to the site. CCIQ Noosa identifies other carpark facilities as the Coles carpark, the old Club carpark
and behind the ANZ Bank and Noosa Five Cinema complex, suggesting that these existing carparks be
redeveloped to increase capacity following further transport analysis and an assessment of the centre transport
demand model. AEC suggests that a ratio of 1 carpark to 25sqm could be applied to determine an estimate of the
total minimum requirement for the Convention Centre component, with the Performance Arts Centre component
requiring a much higher ratio given that it will be more heavily reliant on local visitation. As a point of reference, the
proposed Sunshine Coast Exhibition, Convention and Exhibition Centre was initially considering a ratio of 1 carpark
per 10sqm.
Additional infrastructure constraints and implications of increased visitation and traffic to the site are unknown at
this early stage. At the very least, entry/exit, connector road and lighting infrastructure upgrades would be required
PRE-FEASIBILITY OF CONVENTION AND PERFORMING ARTS CENTRES
19
to accommodate the safe passage of attendees, staff and performing artists. These costs have not been included
in this assessment but must be considered by Council in assessing the relative merits of further progressing the
CCIQ Noosa proposal.
5.3 REVENUE
5.3.1 Convention Centre
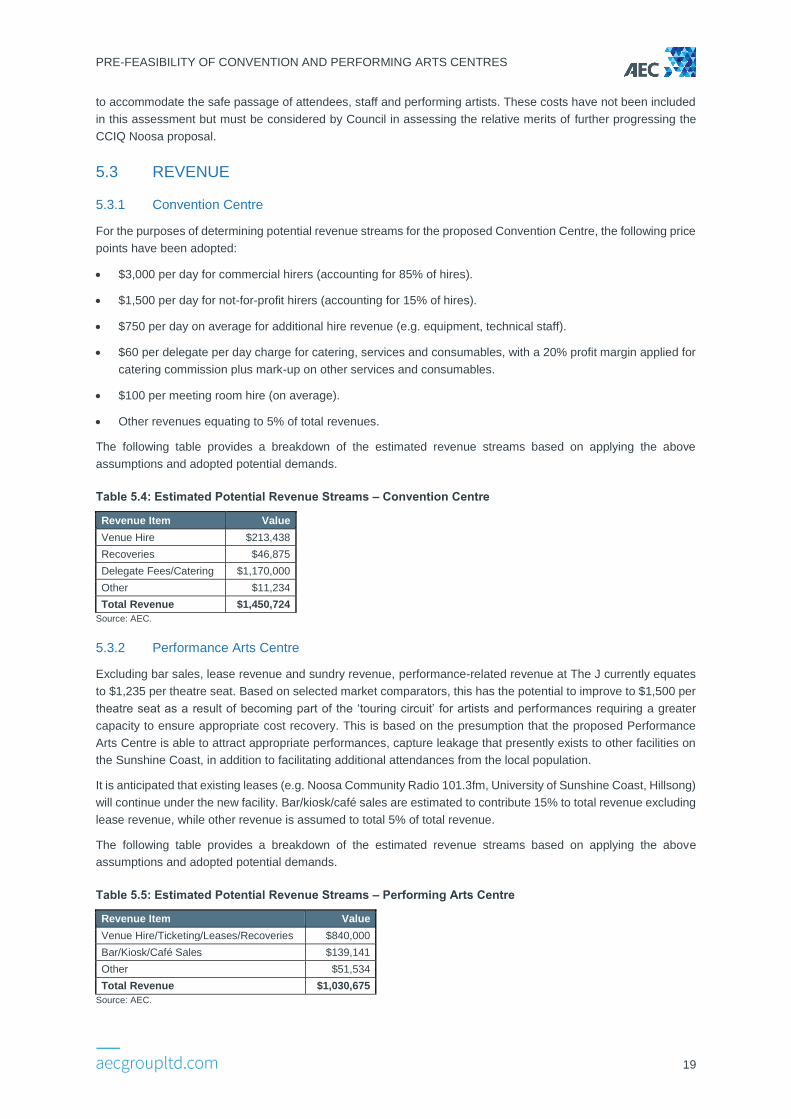
For the purposes of determining potential revenue streams for the proposed Convention Centre, the following price
points have been adopted:
$3,000 per day for commercial hirers (accounting for 85% of hires).
$1,500 per day for not-for-profit hirers (accounting for 15% of hires).
$750 per day on average for additional hire revenue (e.g. equipment, technical staff).
$60 per delegate per day charge for catering, services and consumables, with a 20% profit margin applied for
catering commission plus mark-up on other services and consumables.
$100 per meeting room hire (on average).
Other revenues equating to 5% of total revenues.
The following table provides a breakdown of the estimated revenue streams based on applying the above
assumptions and adopted potential demands.
Table 5.4: Estimated Potential Revenue Streams – Convention Centre
Revenue Item Value
Venue Hire $213,438
Recoveries $46,875
Delegate Fees/Catering $1,170,000
Other $11,234
Total Revenue $1,450,724
Source: AEC.
5.3.2 Performance Arts Centre
Excluding bar sales, lease revenue and sundry revenue, performance-related revenue at The J currently equates
to $1,235 per theatre seat. Based on selected market comparators, this has the potential to improve to $1,500 per
theatre seat as a result of becoming part of the ‘touring circuit’ for artists and performances requiring a greater
capacity to ensure appropriate cost recovery. This is based on the presumption that the proposed Performance
Arts Centre is able to attract appropriate performances, capture leakage that presently exists to other facilities on
the Sunshine Coast, in addition to facilitating additional attendances from the local population.
It is anticipated that existing leases (e.g. Noosa Community Radio 101.3fm, University of Sunshine Coast, Hillsong)
will continue under the new facility. Bar/kiosk/café sales are estimated to contribute 15% to total revenue excluding
lease revenue, while other revenue is assumed to total 5% of total revenue.
The following table provides a breakdown of the estimated revenue streams based on applying the above
assumptions and adopted potential demands.
Table 5.5: Estimated Potential Revenue Streams – Performing Arts Centre
Revenue Item Value
Venue Hire/Ticketing/Leases/Recoveries $840,000
Bar/Kiosk/Café Sales $139,141
Other $51,534
Total Revenue $1,030,675
Source: AEC.
PRE-FEASIBILITY OF CONVENTION AND PERFORMING ARTS CENTRES
20
5.4 OPERATING EXPENDITURE
5.4.1 Convention Centre
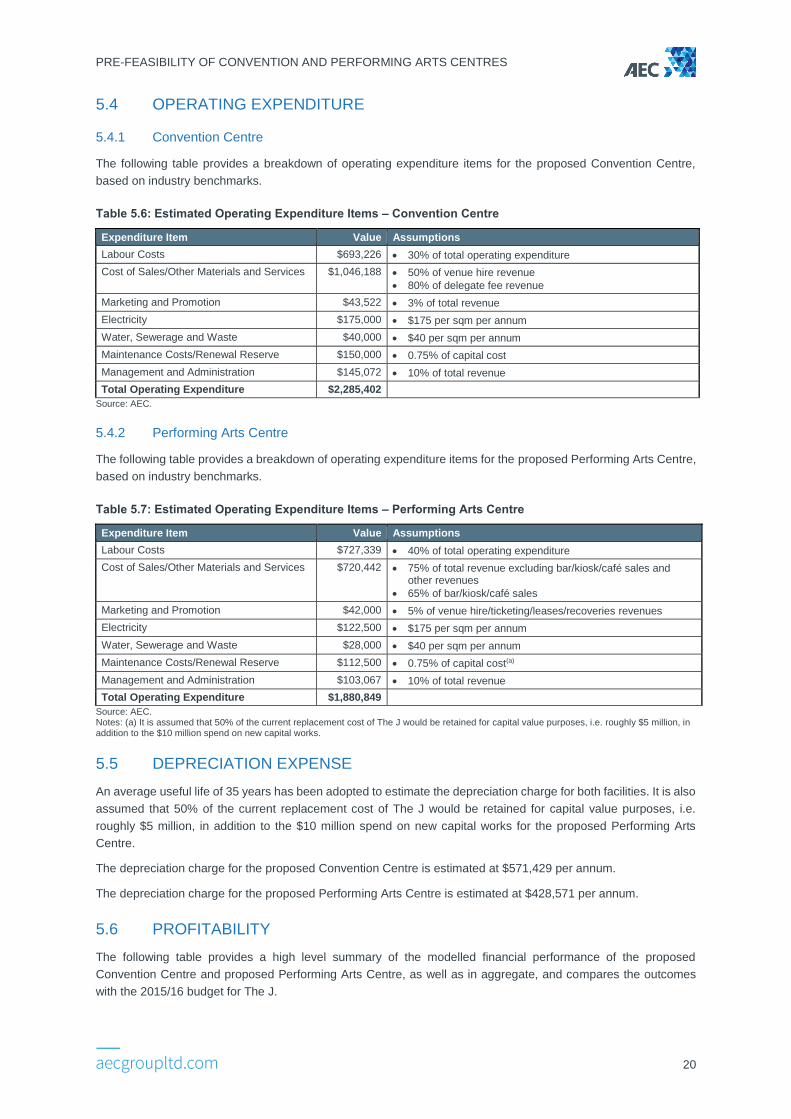
The following table provides a breakdown of operating expenditure items for the proposed Convention Centre,
based on industry benchmarks.
Table 5.6: Estimated Operating Expenditure Items – Convention Centre
Expenditure Item Value Assumptions
Labour Costs $693,226 30% of total operating expenditure
Cost of Sales/Other Materials and Services $1,046,188 50% of venue hire revenue
80% of delegate fee revenue
Marketing and Promotion $43,522 3% of total revenue
Electricity $175,000 $175 per sqm per annum
Water, Sewerage and Waste $40,000 $40 per sqm per annum
Maintenance Costs/Renewal Reserve $150,000 0.75% of capital cost
Management and Administration $145,072 10% of total revenue
Total Operating Expenditure $2,285,402
Source: AEC.
5.4.2 Performing Arts Centre
The following table provides a breakdown of operating expenditure items for the proposed Performing Arts Centre,
based on industry benchmarks.
Table 5.7: Estimated Operating Expenditure Items – Performing Arts Centre
Expenditure Item Value Assumptions
Labour Costs $727,339 40% of total operating expenditure
Cost of Sales/Other Materials and Services $720,442 75% of total revenue excluding bar/kiosk/café sales and other revenues
65% of bar/kiosk/café sales
Marketing and Promotion $42,000 5% of venue hire/ticketing/leases/recoveries revenues
Electricity $122,500 $175 per sqm per annum
Water, Sewerage and Waste $28,000 $40 per sqm per annum
Maintenance Costs/Renewal Reserve $112,500 0.75% of capital cost(a)
Management and Administration $103,067 10% of total revenue
Total Operating Expenditure $1,880,849
Source: AEC. Notes: (a) It is assumed that 50% of the current replacement cost of The J would be retained for capital value purposes, i.e. roughly $5 million, in addition to the $10 million spend on new capital works.
5.5 DEPRECIATION EXPENSE
An average useful life of 35 years has been adopted to estimate the depreciation charge for both facilities. It is also
assumed that 50% of the current replacement cost of The J would be retained for capital value purposes, i.e.
roughly $5 million, in addition to the $10 million spend on new capital works for the proposed Performing Arts
Centre.
The depreciation charge for the proposed Convention Centre is estimated at $571,429 per annum.
The depreciation charge for the proposed Performing Arts Centre is estimated at $428,571 per annum.
5.6 PROFITABILITY
The following table provides a high level summary of the modelled financial performance of the proposed
Convention Centre and proposed Performing Arts Centre, as well as in aggregate, and compares the outcomes
with the 2015/16 budget for The J.
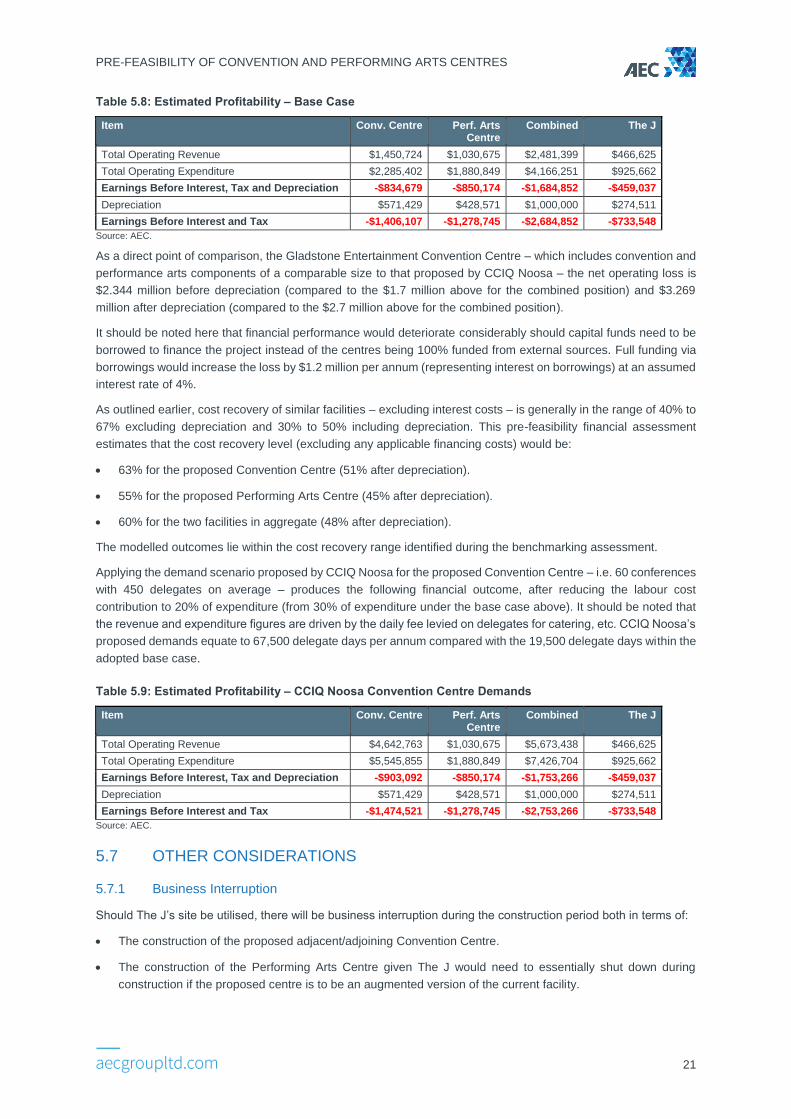
PRE-FEASIBILITY OF CONVENTION AND PERFORMING ARTS CENTRES
21
Table 5.8: Estimated Profitability – Base Case
Item Conv. Centre Perf. Arts Centre
Combined The J
Total Operating Revenue $1,450,724 $1,030,675 $2,481,399 $466,625
Total Operating Expenditure $2,285,402 $1,880,849 $4,166,251 $925,662
Earnings Before Interest, Tax and Depreciation -$834,679 -$850,174 -$1,684,852 -$459,037
Depreciation $571,429 $428,571 $1,000,000 $274,511
Earnings Before Interest and Tax -$1,406,107 -$1,278,745 -$2,684,852 -$733,548
Source: AEC.
As a direct point of comparison, the Gladstone Entertainment Convention Centre – which includes convention and
performance arts components of a comparable size to that proposed by CCIQ Noosa – the net operating loss is
$2.344 million before depreciation (compared to the $1.7 million above for the combined position) and $3.269
million after depreciation (compared to the $2.7 million above for the combined position).
It should be noted here that financial performance would deteriorate considerably should capital funds need to be
borrowed to finance the project instead of the centres being 100% funded from external sources. Full funding via
borrowings would increase the loss by $1.2 million per annum (representing interest on borrowings) at an assumed
interest rate of 4%.
As outlined earlier, cost recovery of similar facilities – excluding interest costs – is generally in the range of 40% to
67% excluding depreciation and 30% to 50% including depreciation. This pre-feasibility financial assessment
estimates that the cost recovery level (excluding any applicable financing costs) would be:
63% for the proposed Convention Centre (51% after depreciation).
55% for the proposed Performing Arts Centre (45% after depreciation).
60% for the two facilities in aggregate (48% after depreciation).
The modelled outcomes lie within the cost recovery range identified during the benchmarking assessment.
Applying the demand scenario proposed by CCIQ Noosa for the proposed Convention Centre – i.e. 60 conferences
with 450 delegates on average – produces the following financial outcome, after reducing the labour cost
contribution to 20% of expenditure (from 30% of expenditure under the base case above). It should be noted that
the revenue and expenditure figures are driven by the daily fee levied on delegates for catering, etc. CCIQ Noosa’s
proposed demands equate to 67,500 delegate days per annum compared with the 19,500 delegate days within the
adopted base case.
Table 5.9: Estimated Profitability – CCIQ Noosa Convention Centre Demands
Item Conv. Centre Perf. Arts Centre
Combined The J
Total Operating Revenue $4,642,763 $1,030,675 $5,673,438 $466,625
Total Operating Expenditure $5,545,855 $1,880,849 $7,426,704 $925,662
Earnings Before Interest, Tax and Depreciation -$903,092 -$850,174 -$1,753,266 -$459,037
Depreciation $571,429 $428,571 $1,000,000 $274,511
Earnings Before Interest and Tax -$1,474,521 -$1,278,745 -$2,753,266 -$733,548
Source: AEC.
5.7 OTHER CONSIDERATIONS
5.7.1 Business Interruption
Should The J’s site be utilised, there will be business interruption during the construction period both in terms of:
The construction of the proposed adjacent/adjoining Convention Centre.
The construction of the Performing Arts Centre given The J would need to essentially shut down during
construction if the proposed centre is to be an augmented version of the current facility.
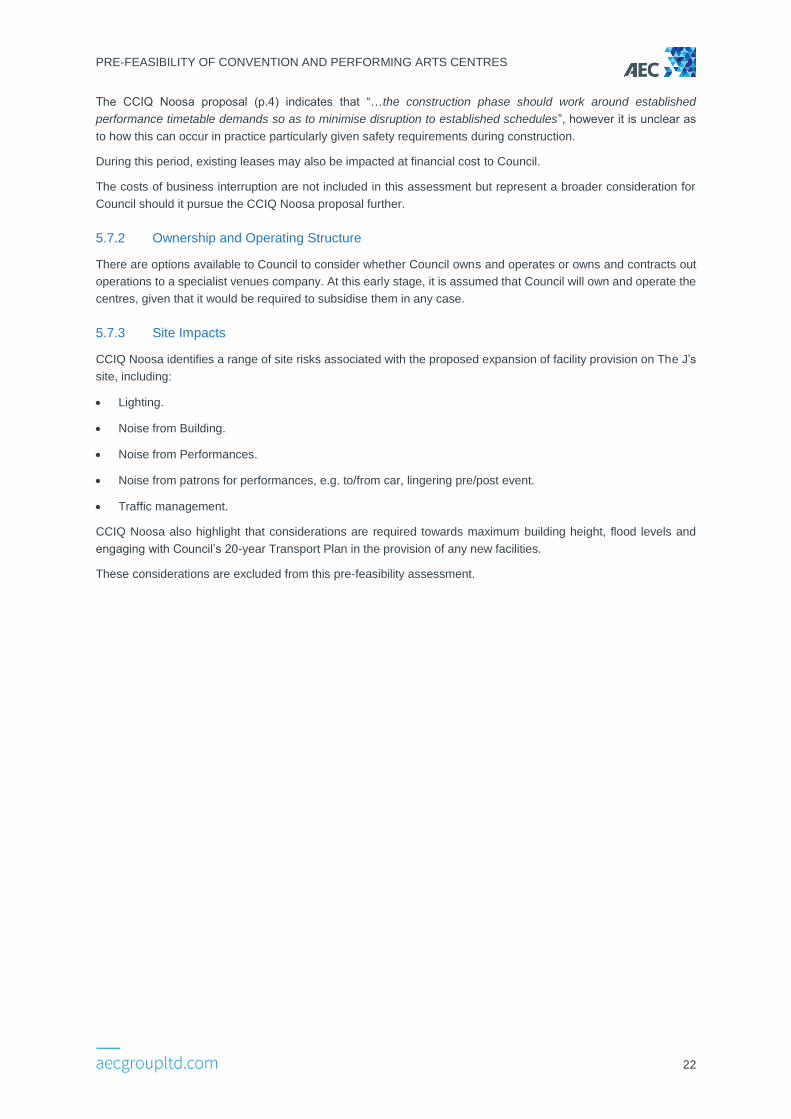
PRE-FEASIBILITY OF CONVENTION AND PERFORMING ARTS CENTRES
22
The CCIQ Noosa proposal (p.4) indicates that “…the construction phase should work around established
performance timetable demands so as to minimise disruption to established schedules”, however it is unclear as
to how this can occur in practice particularly given safety requirements during construction.
During this period, existing leases may also be impacted at financial cost to Council.
The costs of business interruption are not included in this assessment but represent a broader consideration for
Council should it pursue the CCIQ Noosa proposal further.
5.7.2 Ownership and Operating Structure
There are options available to Council to consider whether Council owns and operates or owns and contracts out
operations to a specialist venues company. At this early stage, it is assumed that Council will own and operate the
centres, given that it would be required to subsidise them in any case.
5.7.3 Site Impacts
CCIQ Noosa identifies a range of site risks associated with the proposed expansion of facility provision on The J’s
site, including:
Lighting.
Noise from Building.
Noise from Performances.
Noise from patrons for performances, e.g. to/from car, lingering pre/post event.
Traffic management.
CCIQ Noosa also highlight that considerations are required towards maximum building height, flood levels and
engaging with Council’s 20-year Transport Plan in the provision of any new facilities.
These considerations are excluded from this pre-feasibility assessment.
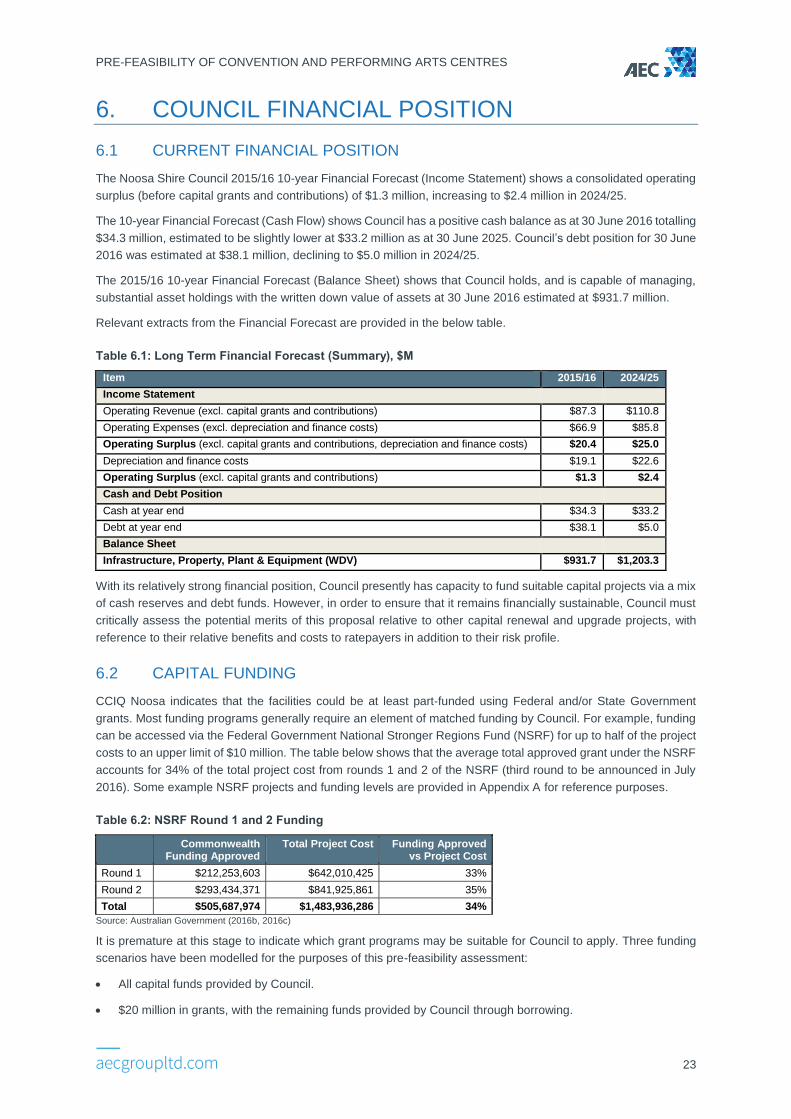
PRE-FEASIBILITY OF CONVENTION AND PERFORMING ARTS CENTRES
23
6. COUNCIL FINANCIAL POSITION
6.1 CURRENT FINANCIAL POSITION
The Noosa Shire Council 2015/16 10-year Financial Forecast (Income Statement) shows a consolidated operating
surplus (before capital grants and contributions) of $1.3 million, increasing to $2.4 million in 2024/25.
The 10-year Financial Forecast (Cash Flow) shows Council has a positive cash balance as at 30 June 2016 totalling
$34.3 million, estimated to be slightly lower at $33.2 million as at 30 June 2025. Council’s debt position for 30 June
2016 was estimated at $38.1 million, declining to $5.0 million in 2024/25.
The 2015/16 10-year Financial Forecast (Balance Sheet) shows that Council holds, and is capable of managing,
substantial asset holdings with the written down value of assets at 30 June 2016 estimated at $931.7 million.
Relevant extracts from the Financial Forecast are provided in the below table.
Table 6.1: Long Term Financial Forecast (Summary), $M
Item 2015/16 2024/25
Income Statement
Operating Revenue (excl. capital grants and contributions) $87.3 $110.8
Operating Expenses (excl. depreciation and finance costs) $66.9 $85.8
Operating Surplus (excl. capital grants and contributions, depreciation and finance costs) $20.4 $25.0
Depreciation and finance costs $19.1 $22.6
Operating Surplus (excl. capital grants and contributions) $1.3 $2.4
Cash and Debt Position
Cash at year end $34.3 $33.2
Debt at year end $38.1 $5.0
Balance Sheet
Infrastructure, Property, Plant & Equipment (WDV) $931.7 $1,203.3
With its relatively strong financial position, Council presently has capacity to fund suitable capital projects via a mix
of cash reserves and debt funds. However, in order to ensure that it remains financially sustainable, Council must
critically assess the potential merits of this proposal relative to other capital renewal and upgrade projects, with
reference to their relative benefits and costs to ratepayers in addition to their risk profile.
6.2 CAPITAL FUNDING
CCIQ Noosa indicates that the facilities could be at least part-funded using Federal and/or State Government
grants. Most funding programs generally require an element of matched funding by Council. For example, funding
can be accessed via the Federal Government National Stronger Regions Fund (NSRF) for up to half of the project
costs to an upper limit of $10 million. The table below shows that the average total approved grant under the NSRF
accounts for 34% of the total project cost from rounds 1 and 2 of the NSRF (third round to be announced in July
2016). Some example NSRF projects and funding levels are provided in Appendix A for reference purposes.
Table 6.2: NSRF Round 1 and 2 Funding
Commonwealth Funding Approved
Total Project Cost Funding Approved vs Project Cost
Round 1 $212,253,603 $642,010,425 33%
Round 2 $293,434,371 $841,925,861 35%
Total $505,687,974 $1,483,936,286 34%
Source: Australian Government (2016b, 2016c)
It is premature at this stage to indicate which grant programs may be suitable for Council to apply. Three funding
scenarios have been modelled for the purposes of this pre-feasibility assessment:
All capital funds provided by Council.
$20 million in grants, with the remaining funds provided by Council through borrowing.
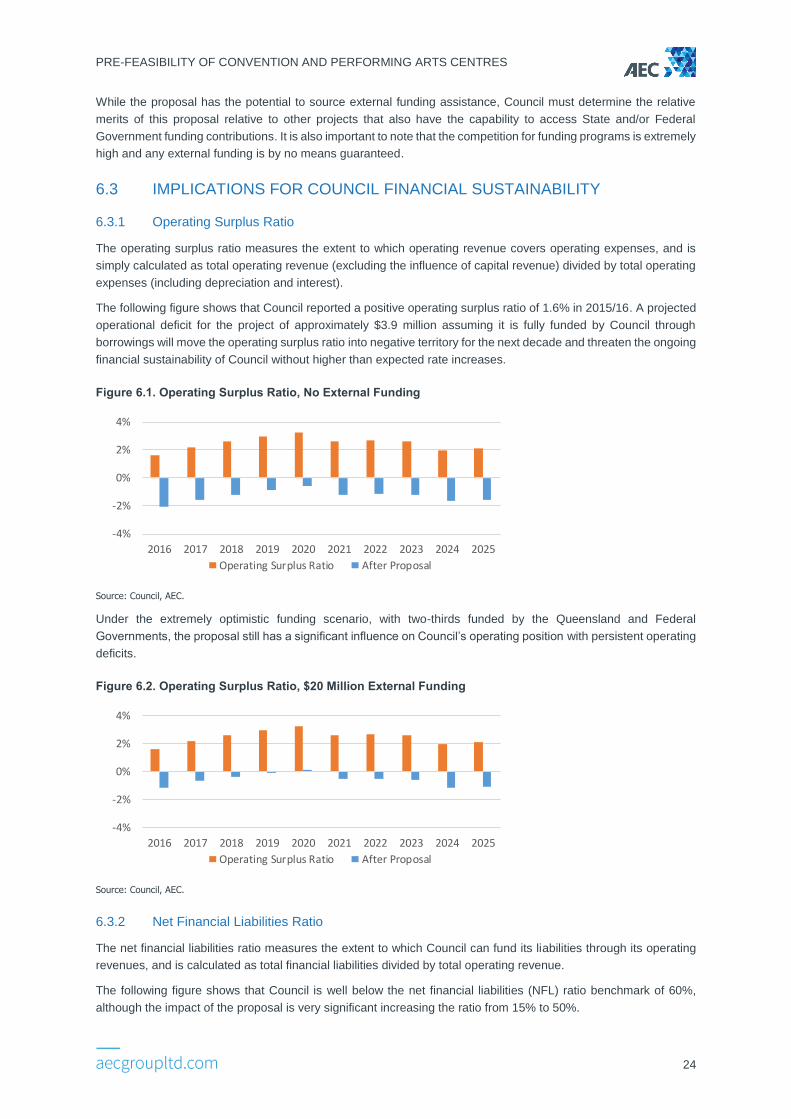
PRE-FEASIBILITY OF CONVENTION AND PERFORMING ARTS CENTRES
24
While the proposal has the potential to source external funding assistance, Council must determine the relative
merits of this proposal relative to other projects that also have the capability to access State and/or Federal
Government funding contributions. It is also important to note that the competition for funding programs is extremely
high and any external funding is by no means guaranteed.
6.3 IMPLICATIONS FOR COUNCIL FINANCIAL SUSTAINABILITY
6.3.1 Operating Surplus Ratio
The operating surplus ratio measures the extent to which operating revenue covers operating expenses, and is
simply calculated as total operating revenue (excluding the influence of capital revenue) divided by total operating
expenses (including depreciation and interest).
The following figure shows that Council reported a positive operating surplus ratio of 1.6% in 2015/16. A projected
operational deficit for the project of approximately $3.9 million assuming it is fully funded by Council through
borrowings will move the operating surplus ratio into negative territory for the next decade and threaten the ongoing
financial sustainability of Council without higher than expected rate increases.
Figure 6.1. Operating Surplus Ratio, No External Funding
Source: Council, AEC.
Under the extremely optimistic funding scenario, with two-thirds funded by the Queensland and Federal
Governments, the proposal still has a significant influence on Council’s operating position with persistent operating
deficits.
Figure 6.2. Operating Surplus Ratio, $20 Million External Funding
Source: Council, AEC.
6.3.2 Net Financial Liabilities Ratio
The net financial liabilities ratio measures the extent to which Council can fund its liabilities through its operating
revenues, and is calculated as total financial liabilities divided by total operating revenue.
The following figure shows that Council is well below the net financial liabilities (NFL) ratio benchmark of 60%,
although the impact of the proposal is very significant increasing the ratio from 15% to 50%.
-4%
-2%
0%
2%
4%
2016 2017 2018 2019 2020 2021 2022 2023 2024 2025
Operating Surplus Ratio After Proposal
-4%
-2%
0%
2%
4%
2016 2017 2018 2019 2020 2021 2022 2023 2024 2025
Operating Surplus Ratio After Proposal
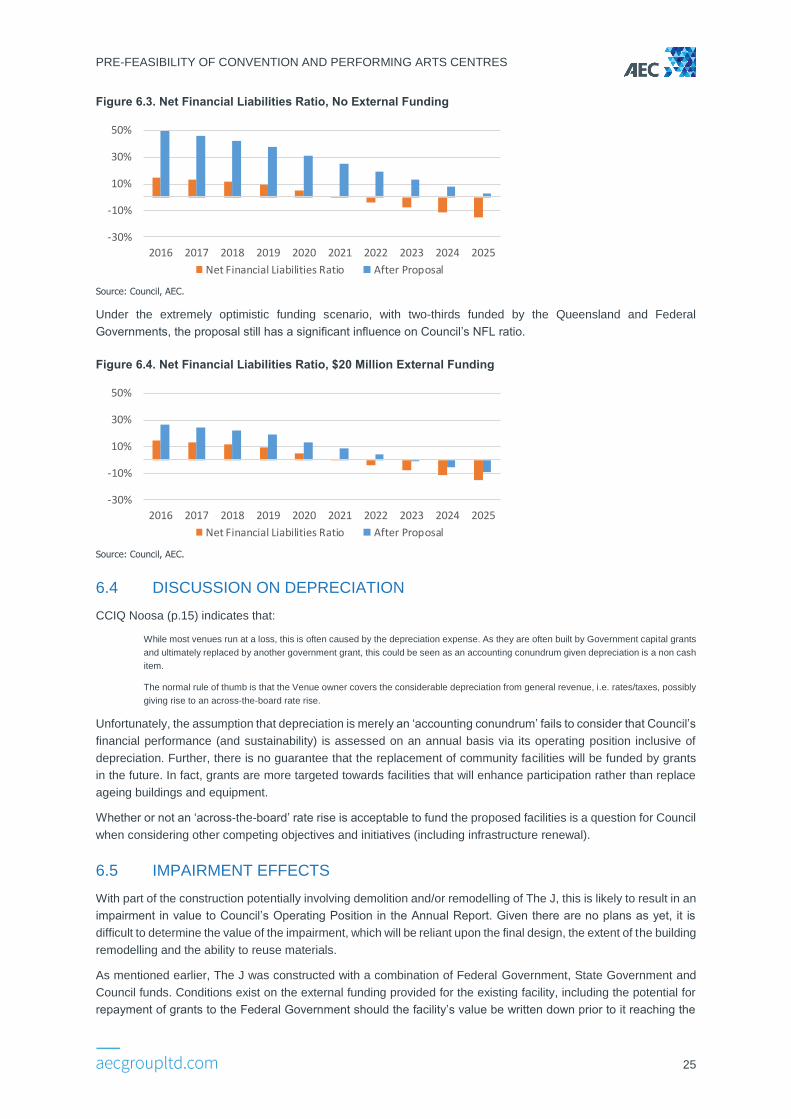
PRE-FEASIBILITY OF CONVENTION AND PERFORMING ARTS CENTRES
25
Figure 6.3. Net Financial Liabilities Ratio, No External Funding
Source: Council, AEC.
Under the extremely optimistic funding scenario, with two-thirds funded by the Queensland and Federal
Governments, the proposal still has a significant influence on Council’s NFL ratio.
Figure 6.4. Net Financial Liabilities Ratio, $20 Million External Funding
Source: Council, AEC.
6.4 DISCUSSION ON DEPRECIATION
CCIQ Noosa (p.15) indicates that:
While most venues run at a loss, this is often caused by the depreciation expense. As they are often built by Government capital grants
and ultimately replaced by another government grant, this could be seen as an accounting conundrum given depreciation is a non cash
item.
The normal rule of thumb is that the Venue owner covers the considerable depreciation from general revenue, i.e. rates/taxes, possibly
giving rise to an across-the-board rate rise.
Unfortunately, the assumption that depreciation is merely an ‘accounting conundrum’ fails to consider that Council’s
financial performance (and sustainability) is assessed on an annual basis via its operating position inclusive of
depreciation. Further, there is no guarantee that the replacement of community facilities will be funded by grants
in the future. In fact, grants are more targeted towards facilities that will enhance participation rather than replace
ageing buildings and equipment.
Whether or not an ‘across-the-board’ rate rise is acceptable to fund the proposed facilities is a question for Council
when considering other competing objectives and initiatives (including infrastructure renewal).
6.5 IMPAIRMENT EFFECTS
With part of the construction potentially involving demolition and/or remodelling of The J, this is likely to result in an
impairment in value to Council’s Operating Position in the Annual Report. Given there are no plans as yet, it is
difficult to determine the value of the impairment, which will be reliant upon the final design, the extent of the building
remodelling and the ability to reuse materials.
As mentioned earlier, The J was constructed with a combination of Federal Government, State Government and
Council funds. Conditions exist on the external funding provided for the existing facility, including the potential for
repayment of grants to the Federal Government should the facility’s value be written down prior to it reaching the
-30%
-10%
10%
30%
50%
2016 2017 2018 2019 2020 2021 2022 2023 2024 2025
Net Financial Liabilities Ratio After Proposal
-30%
-10%
10%
30%
50%
2016 2017 2018 2019 2020 2021 2022 2023 2024 2025
Net Financial Liabilities Ratio After Proposal
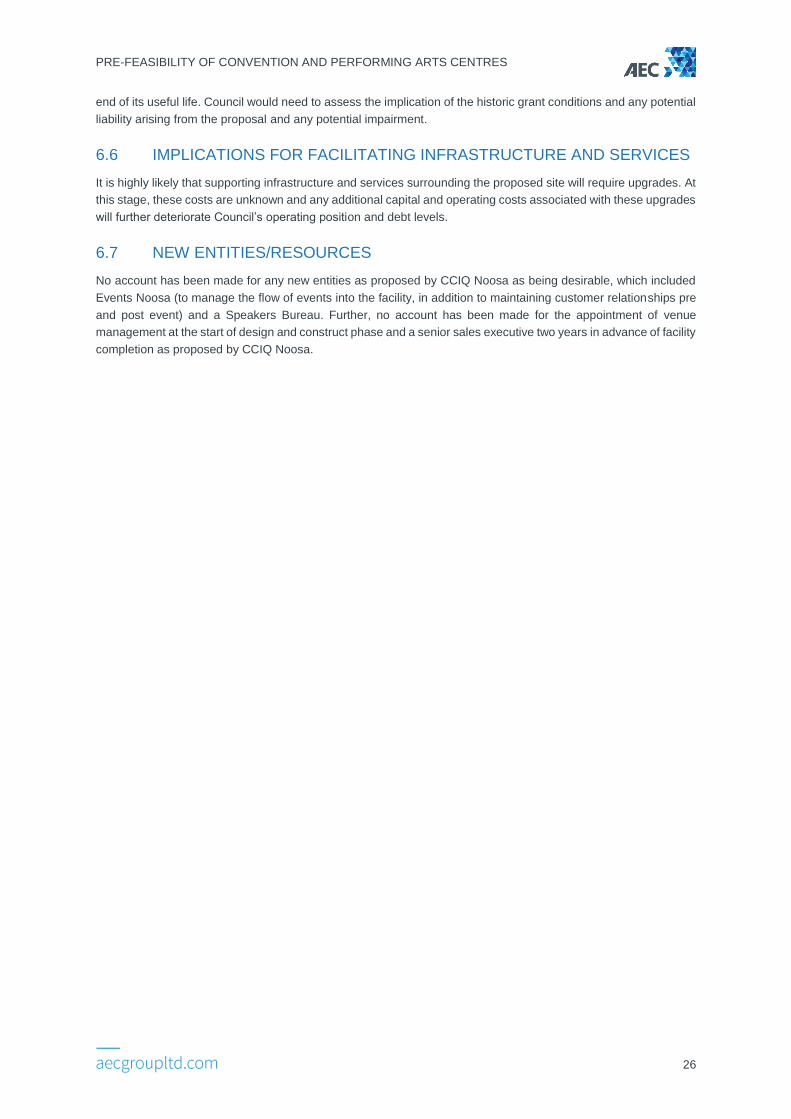
PRE-FEASIBILITY OF CONVENTION AND PERFORMING ARTS CENTRES
26
end of its useful life. Council would need to assess the implication of the historic grant conditions and any potential
liability arising from the proposal and any potential impairment.
6.6 IMPLICATIONS FOR FACILITATING INFRASTRUCTURE AND SERVICES
It is highly likely that supporting infrastructure and services surrounding the proposed site will require upgrades. At
this stage, these costs are unknown and any additional capital and operating costs associated with these upgrades
will further deteriorate Council’s operating position and debt levels.
6.7 NEW ENTITIES/RESOURCES
No account has been made for any new entities as proposed by CCIQ Noosa as being desirable, which included
Events Noosa (to manage the flow of events into the facility, in addition to maintaining customer relationships pre
and post event) and a Speakers Bureau. Further, no account has been made for the appointment of venue
management at the start of design and construct phase and a senior sales executive two years in advance of facility
completion as proposed by CCIQ Noosa.
PRE-FEASIBILITY OF CONVENTION AND PERFORMING ARTS CENTRES
27
7. ECONOMIC ASSESSMENT
7.1 APPROACH
The following sections examine the estimated economic activity supported through the construction and operational
phases of the proposed Convention Centre and Performance Arts Centre. The economic impacts have been
assessed at the Noosa Local Government Area (LGA) level.
An Input-Output model, including the development of a series of specific regional Input- Output transaction tables,
was developed to reflect the economic structure of the Noosa LGA. Input-Output modelling describes economic
activity through the examination of four types of impacts which are defined and described in the table below.
Table 7.1. Economic Indicators
Indicator Description
Output
Refers to the gross value of goods and services transacted, including the costs of goods and services used
in the development and provision of the final product. Output typically overstates the economic impacts as it
counts all goods and services used in one stage of production as an input to later stages of production,
hence counting their contribution more than once.
Gross Value
Added (GVA)
Refers to the value of output after deducting the cost of goods and services inputs in the production
process. GVA defines the true net contribution and is subsequently the preferred measure for assessing
economic impacts.
Income Measures the level of wages and salaries paid to employees of the industry under consideration and to
other industries benefiting from the Project.
Employment
Refers to the part-time and full-time employment positions generated by the economic shock, both directly
and indirectly through flow-on activity, and is expressed in terms of Full-Time Equivalent (FTE) positions.
One FTE job is defined as one person working full time for a period of one year.
Source: AEC
Input-Output multipliers can be derived from open (Type I) Input-Output models or closed (Type II) models. Open
models show the direct effects of spending in a particular industry as well as the indirect or flow-on (industrial
support) effects of additional activities undertaken by industries increasing their activity in response to the direct
spending. Closed models re-circulate the labour income earned as a result of the initial spending through other
industry and commodity groups to estimate consumption induced effects (or impacts from increased household
consumption). The following estimates consider the Type I flow-on impacts only, noting that Type II impacts are
commonly considered to overstate economic activity.
7.2 MODEL DRIVERS AND ASSUMPTIONS
7.2.1 Drivers of Economic Activity
The Convention Centre and Performing Arts Centre developments would be expected to generate net additional
economic activity in the Noosa economy primarily through three avenues:
Economic activity generated through the construction of the facilities.
Direct turnover generated by the operational activities that would not have otherwise occurred within Noosa.
Additional tourism and visitation to the region that would otherwise not be expected to occur, resulting in
increased visitor expenditure on goods and services.
The assumptions used for modelling the impact of each of these avenues are outlined below.
7.2.2 Construction
For modelling purposes, construction costs were broken down into their respective Australian and New Zealand
Standard Industrial Classification (ANZSIC) industries. This breakdown was developed based on assumptions by
PRE-FEASIBILITY OF CONVENTION AND PERFORMING ARTS CENTRES
28
AEC regarding the most appropriate ANZSIC industries for each activity, and the relevant proportion of expenditure
to be allocated to each industry. For this assessment it is assumed:
85% ($25.5 million) of total development expenditure would be in non-residential building construction (i.e. for
construction of the centre structures).
10% ($3.0 million) of total development expenditure would be in professional, scientific and technical services
(i.e. for a range of professional services such as design, engineering, etc.).
5% ($1.5 million) of total development expenditure would be in construction services (i.e. for land clearing,
excavation works and levelling, as well as for external gardens and internal finishes).
Only the construction activity expected to be undertaken within the Noosa LGA has been included in the economic
impact assessment. For the purposes of this assessment it was assumed:
Approximately 50% of the direct expenditure on construction activity would be sourced from local businesses
and labour (including construction and professional services activity).
Approximately 25% of purchases on goods and services (supply chain related activity) made by construction-
related businesses sourced from outside the Noosa LGA would be spent within the local economy (i.e., 25%
of the Type I flow-on activity associated with non-local construction companies is assumed to represent
additional local activity in Noosa LGA).
7.2.3 Operations
7.2.3.1 Convention Centre
Centre Operations
Convention Centre operations have been modelled based on direct operating expenditure of $2.3 million (see
section 5.4.1). There is the potential for some degree of cannibalism of the existing convention centre market in
Noosa given that the convention centre has the opportunity to offer partitioned areas of a similar size to those that
presently exist. Therefore, there is potential for the estimates applied to overstate the economic impacts within
Noosa.
For modelling purposes this turnover has been allocated to the following Australia and New Zealand Standard
Industrial Classification (ANZSIC) categories:
60% ($1.4 million) to food and beverage services.
40% ($0.9 million) to heritage, creative and performing arts6.
Visitor Spend
Based on EY (2015), it has been assumed that the average spend per delegate could be around $880 per delegate
stay, or just under $350 per delegate day, compared to normal spend by non-business event visitors is estimated
at $176 per day (CCIQ Noosa, pp.7-8).
Based on this total spend, exclusions were made to account for expenditure unlikely to be captured within the
Noosa LGA (e.g. airfares) and spend which will be captured directly by the Convention Centre facility (e.g. delegate
registration) which has been accounted for in the centre operations estimates in the previous section. These
exclusions provide an estimated local spend of approximately $220 per delegate day (compared to approximately
$150 per non-business event visitor) as shown in the table below.
For modelling purposes the visitor mix has been based on EY (2015) splits:
6 Which as an ANZSIC sector incorporates entertainment centre operation.
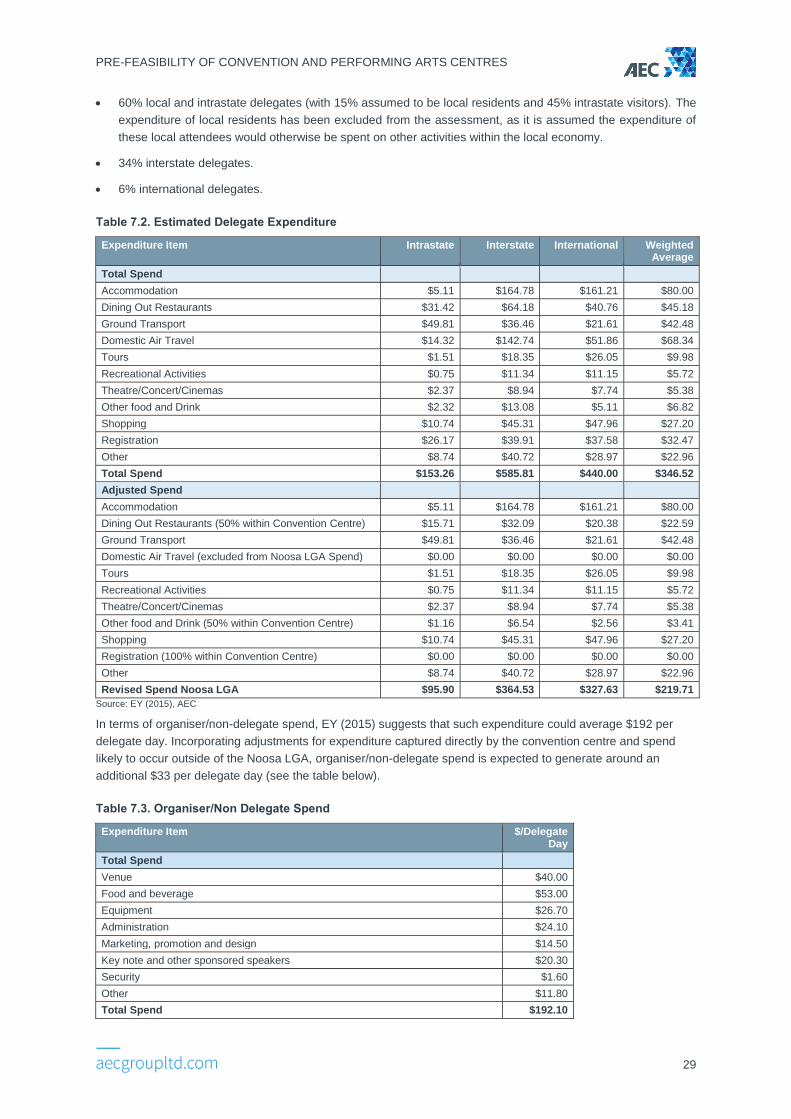
PRE-FEASIBILITY OF CONVENTION AND PERFORMING ARTS CENTRES
29
60% local and intrastate delegates (with 15% assumed to be local residents and 45% intrastate visitors). The
expenditure of local residents has been excluded from the assessment, as it is assumed the expenditure of
these local attendees would otherwise be spent on other activities within the local economy.
34% interstate delegates.
6% international delegates.
Table 7.2. Estimated Delegate Expenditure
Expenditure Item Intrastate Interstate International Weighted Average
Total Spend
Accommodation $5.11 $164.78 $161.21 $80.00
Dining Out Restaurants $31.42 $64.18 $40.76 $45.18
Ground Transport $49.81 $36.46 $21.61 $42.48
Domestic Air Travel $14.32 $142.74 $51.86 $68.34
Tours $1.51 $18.35 $26.05 $9.98
Recreational Activities $0.75 $11.34 $11.15 $5.72
Theatre/Concert/Cinemas $2.37 $8.94 $7.74 $5.38
Other food and Drink $2.32 $13.08 $5.11 $6.82
Shopping $10.74 $45.31 $47.96 $27.20
Registration $26.17 $39.91 $37.58 $32.47
Other $8.74 $40.72 $28.97 $22.96
Total Spend $153.26 $585.81 $440.00 $346.52
Adjusted Spend
Accommodation $5.11 $164.78 $161.21 $80.00
Dining Out Restaurants (50% within Convention Centre) $15.71 $32.09 $20.38 $22.59
Ground Transport $49.81 $36.46 $21.61 $42.48
Domestic Air Travel (excluded from Noosa LGA Spend) $0.00 $0.00 $0.00 $0.00
Tours $1.51 $18.35 $26.05 $9.98
Recreational Activities $0.75 $11.34 $11.15 $5.72
Theatre/Concert/Cinemas $2.37 $8.94 $7.74 $5.38
Other food and Drink (50% within Convention Centre) $1.16 $6.54 $2.56 $3.41
Shopping $10.74 $45.31 $47.96 $27.20
Registration (100% within Convention Centre) $0.00 $0.00 $0.00 $0.00
Other $8.74 $40.72 $28.97 $22.96
Revised Spend Noosa LGA $95.90 $364.53 $327.63 $219.71
Source: EY (2015), AEC
In terms of organiser/non-delegate spend, EY (2015) suggests that such expenditure could average $192 per
delegate day. Incorporating adjustments for expenditure captured directly by the convention centre and spend
likely to occur outside of the Noosa LGA, organiser/non-delegate spend is expected to generate around an
additional $33 per delegate day (see the table below).
Table 7.3. Organiser/Non Delegate Spend
Expenditure Item $/Delegate Day
Total Spend
Venue $40.00
Food and beverage $53.00
Equipment $26.70
Administration $24.10
Marketing, promotion and design $14.50
Key note and other sponsored speakers $20.30
Security $1.60
Other $11.80
Total Spend $192.10
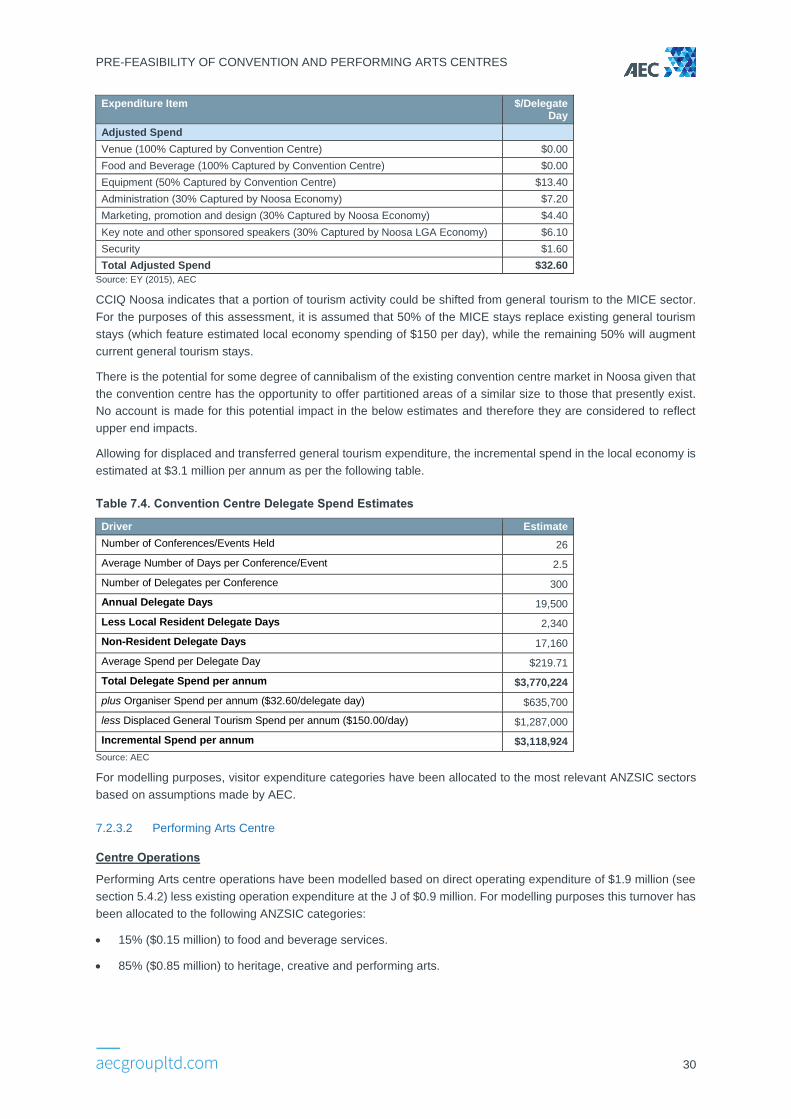
PRE-FEASIBILITY OF CONVENTION AND PERFORMING ARTS CENTRES
30
Expenditure Item $/Delegate Day
Adjusted Spend
Venue (100% Captured by Convention Centre) $0.00
Food and Beverage (100% Captured by Convention Centre) $0.00
Equipment (50% Captured by Convention Centre) $13.40
Administration (30% Captured by Noosa Economy) $7.20
Marketing, promotion and design (30% Captured by Noosa Economy) $4.40
Key note and other sponsored speakers (30% Captured by Noosa LGA Economy) $6.10
Security $1.60
Total Adjusted Spend $32.60
Source: EY (2015), AEC
CCIQ Noosa indicates that a portion of tourism activity could be shifted from general tourism to the MICE sector.
For the purposes of this assessment, it is assumed that 50% of the MICE stays replace existing general tourism
stays (which feature estimated local economy spending of $150 per day), while the remaining 50% will augment
current general tourism stays.
There is the potential for some degree of cannibalism of the existing convention centre market in Noosa given that
the convention centre has the opportunity to offer partitioned areas of a similar size to those that presently exist.
No account is made for this potential impact in the below estimates and therefore they are considered to reflect
upper end impacts.
Allowing for displaced and transferred general tourism expenditure, the incremental spend in the local economy is
estimated at $3.1 million per annum as per the following table.
Table 7.4. Convention Centre Delegate Spend Estimates
Driver Estimate
Number of Conferences/Events Held 26
Average Number of Days per Conference/Event 2.5
Number of Delegates per Conference 300
Annual Delegate Days 19,500
Less Local Resident Delegate Days 2,340
Non-Resident Delegate Days 17,160
Average Spend per Delegate Day $219.71
Total Delegate Spend per annum $3,770,224
plus Organiser Spend per annum ($32.60/delegate day) $635,700
less Displaced General Tourism Spend per annum ($150.00/day) $1,287,000
Incremental Spend per annum $3,118,924
Source: AEC
For modelling purposes, visitor expenditure categories have been allocated to the most relevant ANZSIC sectors
based on assumptions made by AEC.
7.2.3.2 Performing Arts Centre
Centre Operations
Performing Arts centre operations have been modelled based on direct operating expenditure of $1.9 million (see
section 5.4.2) less existing operation expenditure at the J of $0.9 million. For modelling purposes this turnover has
been allocated to the following ANZSIC categories:
15% ($0.15 million) to food and beverage services.
85% ($0.85 million) to heritage, creative and performing arts.
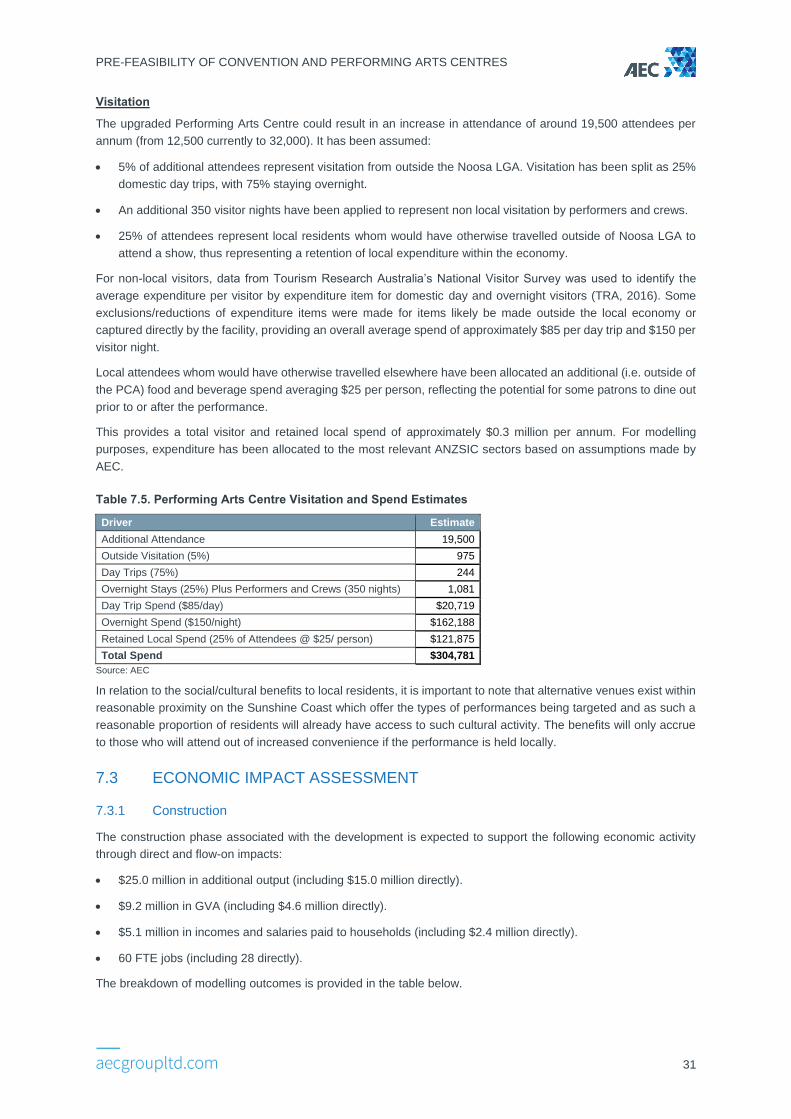
PRE-FEASIBILITY OF CONVENTION AND PERFORMING ARTS CENTRES
31
Visitation
The upgraded Performing Arts Centre could result in an increase in attendance of around 19,500 attendees per
annum (from 12,500 currently to 32,000). It has been assumed:
5% of additional attendees represent visitation from outside the Noosa LGA. Visitation has been split as 25%
domestic day trips, with 75% staying overnight.
An additional 350 visitor nights have been applied to represent non local visitation by performers and crews.
25% of attendees represent local residents whom would have otherwise travelled outside of Noosa LGA to
attend a show, thus representing a retention of local expenditure within the economy.
For non-local visitors, data from Tourism Research Australia’s National Visitor Survey was used to identify the
average expenditure per visitor by expenditure item for domestic day and overnight visitors (TRA, 2016). Some
exclusions/reductions of expenditure items were made for items likely be made outside the local economy or
captured directly by the facility, providing an overall average spend of approximately $85 per day trip and $150 per
visitor night.
Local attendees whom would have otherwise travelled elsewhere have been allocated an additional (i.e. outside of
the PCA) food and beverage spend averaging $25 per person, reflecting the potential for some patrons to dine out
prior to or after the performance.
This provides a total visitor and retained local spend of approximately $0.3 million per annum. For modelling
purposes, expenditure has been allocated to the most relevant ANZSIC sectors based on assumptions made by
AEC.
Table 7.5. Performing Arts Centre Visitation and Spend Estimates
Driver Estimate
Additional Attendance 19,500
Outside Visitation (5%) 975
Day Trips (75%) 244
Overnight Stays (25%) Plus Performers and Crews (350 nights) 1,081
Day Trip Spend ($85/day) $20,719
Overnight Spend ($150/night) $162,188
Retained Local Spend (25% of Attendees @ $25/ person) $121,875
Total Spend $304,781
Source: AEC
In relation to the social/cultural benefits to local residents, it is important to note that alternative venues exist within
reasonable proximity on the Sunshine Coast which offer the types of performances being targeted and as such a
reasonable proportion of residents will already have access to such cultural activity. The benefits will only accrue
to those who will attend out of increased convenience if the performance is held locally.
7.3 ECONOMIC IMPACT ASSESSMENT
7.3.1 Construction
The construction phase associated with the development is expected to support the following economic activity
through direct and flow-on impacts:
$25.0 million in additional output (including $15.0 million directly).
$9.2 million in GVA (including $4.6 million directly).
$5.1 million in incomes and salaries paid to households (including $2.4 million directly).
60 FTE jobs (including 28 directly).
The breakdown of modelling outcomes is provided in the table below.
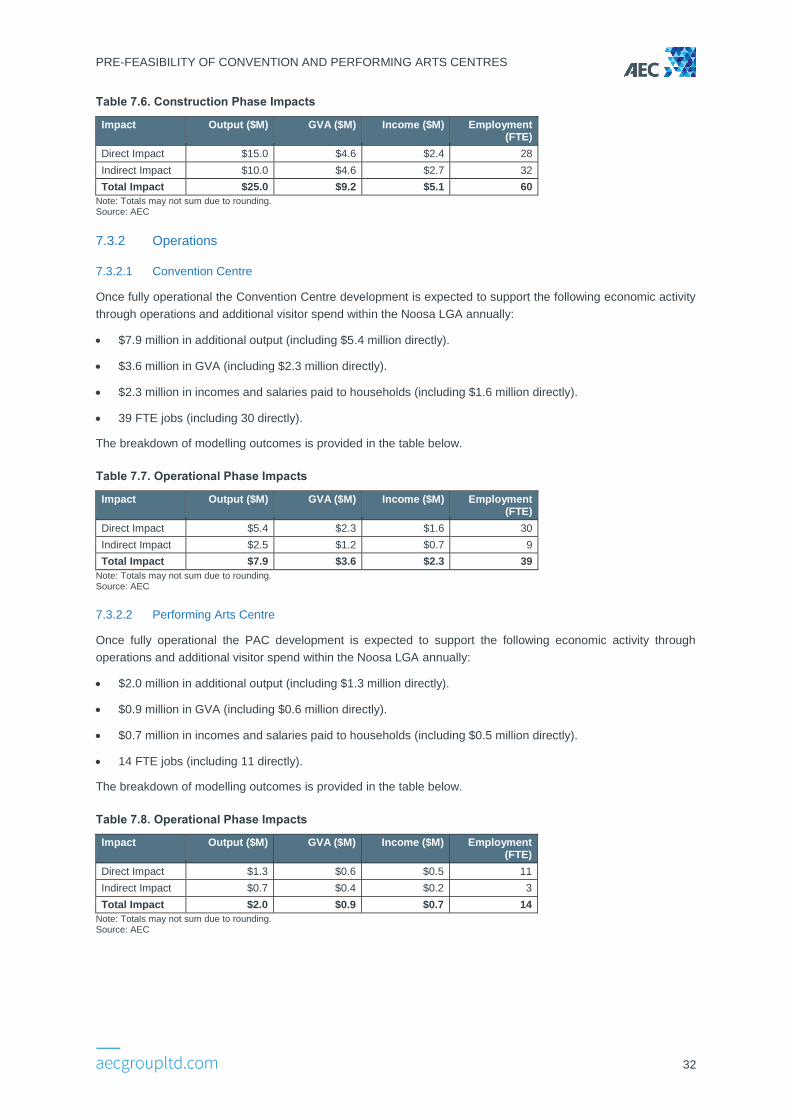
PRE-FEASIBILITY OF CONVENTION AND PERFORMING ARTS CENTRES
32
Table 7.6. Construction Phase Impacts
Impact Output ($M) GVA ($M) Income ($M) Employment (FTE)
Direct Impact $15.0 $4.6 $2.4 28
Indirect Impact $10.0 $4.6 $2.7 32
Total Impact $25.0 $9.2 $5.1 60
Note: Totals may not sum due to rounding. Source: AEC
7.3.2 Operations
7.3.2.1 Convention Centre
Once fully operational the Convention Centre development is expected to support the following economic activity
through operations and additional visitor spend within the Noosa LGA annually:
$7.9 million in additional output (including $5.4 million directly).
$3.6 million in GVA (including $2.3 million directly).
$2.3 million in incomes and salaries paid to households (including $1.6 million directly).
39 FTE jobs (including 30 directly).
The breakdown of modelling outcomes is provided in the table below.
Table 7.7. Operational Phase Impacts
Impact Output ($M) GVA ($M) Income ($M) Employment (FTE)
Direct Impact $5.4 $2.3 $1.6 30
Indirect Impact $2.5 $1.2 $0.7 9
Total Impact $7.9 $3.6 $2.3 39
Note: Totals may not sum due to rounding. Source: AEC
7.3.2.2 Performing Arts Centre
Once fully operational the PAC development is expected to support the following economic activity through
operations and additional visitor spend within the Noosa LGA annually:
$2.0 million in additional output (including $1.3 million directly).
$0.9 million in GVA (including $0.6 million directly).
$0.7 million in incomes and salaries paid to households (including $0.5 million directly).
14 FTE jobs (including 11 directly).
The breakdown of modelling outcomes is provided in the table below.
Table 7.8. Operational Phase Impacts
Impact Output ($M) GVA ($M) Income ($M) Employment (FTE)
Direct Impact $1.3 $0.6 $0.5 11
Indirect Impact $0.7 $0.4 $0.2 3
Total Impact $2.0 $0.9 $0.7 14
Note: Totals may not sum due to rounding. Source: AEC
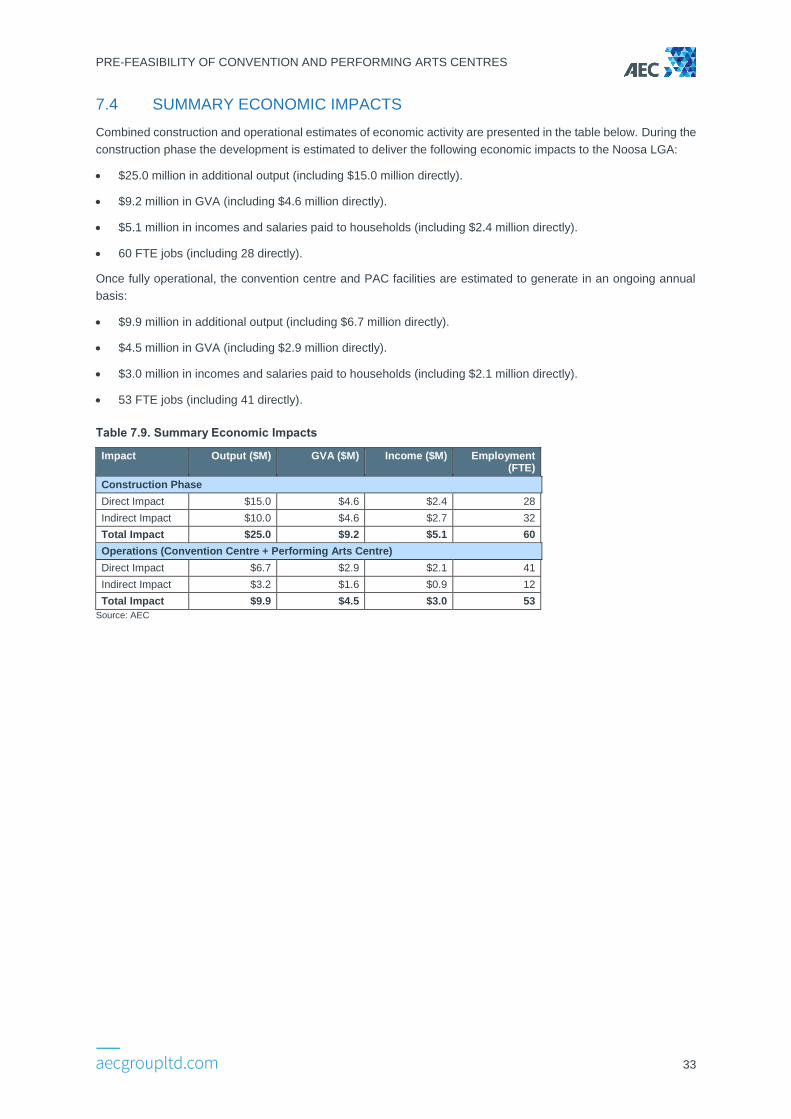
PRE-FEASIBILITY OF CONVENTION AND PERFORMING ARTS CENTRES
33
7.4 SUMMARY ECONOMIC IMPACTS
Combined construction and operational estimates of economic activity are presented in the table below. During the
construction phase the development is estimated to deliver the following economic impacts to the Noosa LGA:
$25.0 million in additional output (including $15.0 million directly).
$9.2 million in GVA (including $4.6 million directly).
$5.1 million in incomes and salaries paid to households (including $2.4 million directly).
60 FTE jobs (including 28 directly).
Once fully operational, the convention centre and PAC facilities are estimated to generate in an ongoing annual
basis:
$9.9 million in additional output (including $6.7 million directly).
$4.5 million in GVA (including $2.9 million directly).
$3.0 million in incomes and salaries paid to households (including $2.1 million directly).
53 FTE jobs (including 41 directly).
Table 7.9. Summary Economic Impacts
Impact Output ($M) GVA ($M) Income ($M) Employment (FTE)
Construction Phase
Direct Impact $15.0 $4.6 $2.4 28
Indirect Impact $10.0 $4.6 $2.7 32
Total Impact $25.0 $9.2 $5.1 60
Operations (Convention Centre + Performing Arts Centre)
Direct Impact $6.7 $2.9 $2.1 41
Indirect Impact $3.2 $1.6 $0.9 12
Total Impact $9.9 $4.5 $3.0 53
Source: AEC
PRE-FEASIBILITY OF CONVENTION AND PERFORMING ARTS CENTRES
34
8. OUTCOMES
In making a decision regarding the appropriateness of commissioning a full feasibility study for the proposed
Convention Centre and Performing Arts Centre, Council must consider the following key outcomes from this pre-
feasibility assessment:
Potential direct and indirect economic benefits from ongoing operations include an additional $4.5 million in
Gross Value Add within the economy and up to 53 new jobs.
The likely financial implications for Council from the proposal, estimated at an additional $2 million per annum
operating deficit including depreciation but excluding finance costs –equating to $65 per rateable assessment.
Including finance costs, this could increase to $3.2 million per annum, or in excess of $100 per rateable
assessment.
Commercial risk associated with the operation of the proposed Convention Centre, including the potential for
higher losses should actual utilisation be lower than assumed.
Limited and highly competitive funding availability from the State and Federal Governments.
Ability of the proposed Convention Centre to effectively compete with regional, intrastate and interstate venues,
many of which offer a holistic service offering including accommodation onsite.
Implications of the proposed major conferencing and event space additions in the region by 2020, including
the Westin Coolum Resort and Spa (20 minutes from Noosa) and Sunshine Coast Entertainment, Convention
and Exhibition Centre (40 minutes from Noosa).
The potential impact on pre-existing facilities in Noosa catering to the 150-300 capacity given that the proposed
Convention Centre would still offer different combinations of rooms to be hired within the larger floor print.
Ancillary costs likely to be incurred in facilitating increased vehicle and foot traffic to and from the proposed
venues.
Potential conditions associated with the historic grants received for the construction of The J.
Council should critically assess the potential merits of capital investment in the proposed venues relative to other
renewal and upgrade projects, with reference to the risk profile of the proposal. This is particularly the case for
other capital projects that have the capability to access State and/or Federal Government funding contributions.
PRE-FEASIBILITY OF CONVENTION AND PERFORMING ARTS CENTRES
35
REFERENCES
Australian Bureau of Statistics (2015). Attendance at Selected Cultural Activities and Events 2013-2014, Cat. No.
4114.0: Customised Report, Commonwealth of Australia,
http://www.australiacouncil.gov.au/research/arts-and-cultural-attendance-and-participation-local-region-
rates/.
Australian Government. Arts and Cultural Attendance and Participation: Local Region Rates,
http://www.australiacouncil.gov.au/research/arts-and-cultural-attendance-and-participation-local-region-
rates/, last accessed 5th July 2016.
Australian Government (2016a). National Stronger Regions Fund (NSRF), About the Programme. Available from
http://investment.infrastructure.gov.au/funding/NSRF/ . Last accessed 17 May 2016.
Australian Government (2016b). National Stronger Regions Fund (NSRF), Round 1 Successful Projects. Available
from http://investment.infrastructure.gov.au/publications/administration/pdf/NSRF_Round_One.pdf. Last
accessed 17 May 2016.
Australian Government (2016c). National Stronger Regions Fund (NSRF), Round 2 Successful Projects. Available
from
http://investment.infrastructure.gov.au/publications/administration/pdf/NSRF_Round_Two_List_of_Appro
ved_Projects_071215.pdf. Last accessed 17 May 2016.
Australian Government (2005). Regional Partnerships Funding Agreement Between Commonweath of Australia
as represented by the Department of Transport and Regional Services and Noosa Council in Relation to
Funding for Noosa Youth Entertainment Centre. Printed on 22 February 2005 and executed on 12 April
2005.
BERL Economics & Angus & Associates (2009). Economic Benefits of a Nelson Performing Arts Centre &
Conference Centre, Report to Beca on behalf of Nelson City Council, August 2009.
Cairns Regional Council (2016a). Cairns Performing Arts Centre. Available from
http://www.cairns.qld.gov.au/council/major-projects/cpac. Last accessed 18 May 2016.
Cairns Regional Council (2016b). Cairns Performing Arts Centre – Detailed Financial Analysis. Available from
http://www.cairns.qld.gov.au/__data/assets/pdf_file/0011/158078/Clause-No-9_Ordinary-Meeting-16-
December-2015v2.pdf. Last accessed 18 May 2016.
CCIQ Noosa (unpublished1). Noosa Convention & Cultural Centre Initiative, Pre-feasibility Study. Provided to AEC
Group Pty Ltd by Noosa Shire Council.
eHotelier (2016). Westin Coolum Resort & Spa announced for Queensland’s Sunshine Coast, published 21st June
2016, https://ehotelier.com/properties/2016/06/21/westin-coolum-resort-spa-announced-queenslands-
sunshine-coast/, last accessed 5th July 2016.
EY (2015). The Value of Business Events to Australia, Commissioned by the Business Events Council of Australia,
February 2015.
Hotel Conference Venues (2016). Conference Hotels on the Sunshine Coast. Available from
http://www.queenslandhotelconferences.com/Venues-SunshineCoast.htm
Noosa Shire Council (2015a). Budget 2015/16 - Financial Statements. Available from
http://www.noosa.qld.gov.au/documents/40217326/40227860/2015-16%20Financial%20Statements.pdf.
Last Accessed 17 May 2016.
Noosa Shire Council (2015b). 2015/16 General Cost - Recovery Fees and Commercial Charges. Available from
http://www.noosa.qld.gov.au/documents/40217326/40227860/General%20Cost%20Recovery%20Fees
%20and%20Commercial%20Charges%202015-16.pdf. Last accessed 17 May 2016.
Noosa Shire Council (2015c). The J Service Review 2014/15. Provide by Noosa Shire Council to AEC Group Pty
Ltd.
PRE-FEASIBILITY OF CONVENTION AND PERFORMING ARTS CENTRES
36
Noosa Shire Council (2016a). The J Financial Performance Report April 2016. Provided by Noosa Shire Council
to AEC Group Pty Ltd.
Noosa Shire Council (2016b). The J Business Case. Developed by 99 Consulting.
Noosa Shire Council (2016c). The J Asset Register. Provide by Noosa Shire Council to AEC Group Pty Ltd.
Noosa Shire Council (2016a). The J Functions & Venue Hire. Available from
http://www.thej.com.au/pages/functions-and-venue/functions-venue-hire.htm. Last Accessed 17 May
2016.
Noosa Shire Council (2016b). The J About Us. Available from http://www.thej.com.au/pages/about/venue-
history.htm. Last Accessed 17 May 2016.
Noosa Springs (2016) http://www.noosasprings.com.au/conferences-functions/venues-capacities/ and
http://www.noosasprings.com.au/conferences-functions/packages/
Ranbury Management Group (2011). Sunshine Coast Entertainment, Convention and Exhibition Centre Feasibility
Report, October 2011, Brisbane.
Sheraton Noosa Resort (2016). http://www.sheratonnoosaresort.com/meetings
The Venue Zone. http://www.thevenuezone.com.au/venues-functions-
centres.php?venuecity=QLD&vvregion=Sunshine_Coast&trkPkz=qs, last accessed 5th July 2016.
University of Technology Sydney (2014). Estimating Inscope Expenditure Attributed to Business Events Held in
New South Wales, Project Report completed on behalf of Business Events Sydney, March 2014, Sydney.
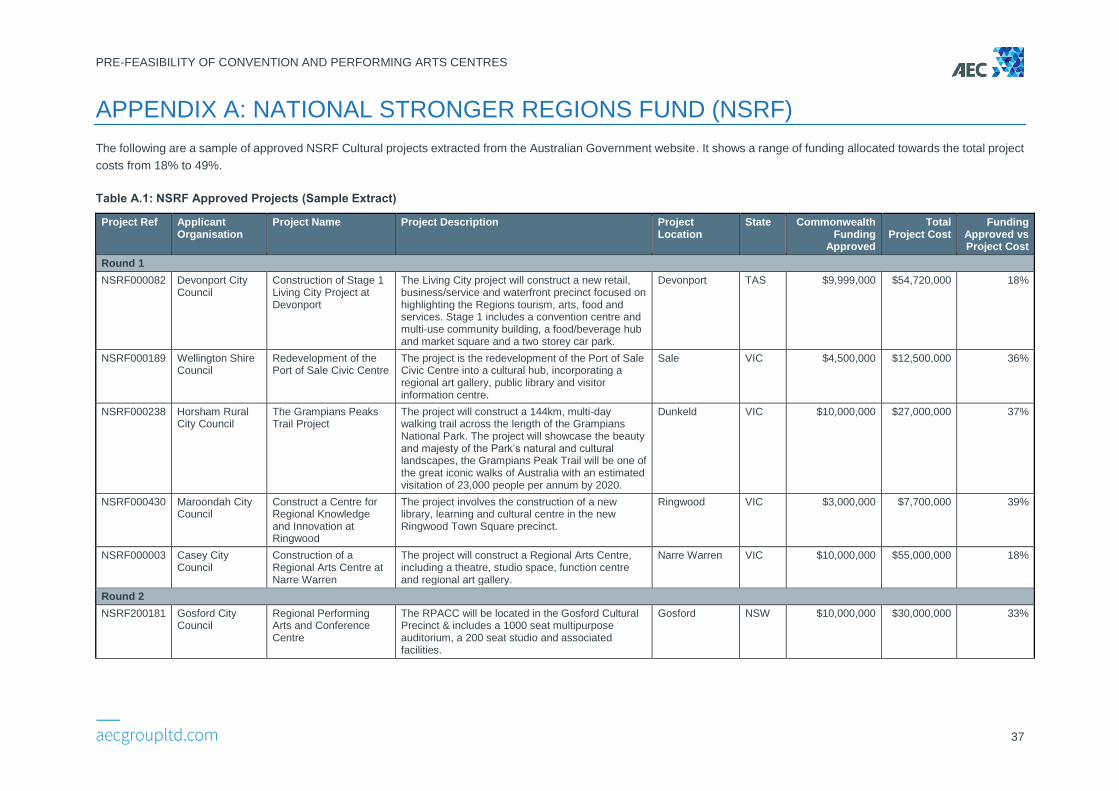
PRE-FEASIBILITY OF CONVENTION AND PERFORMING ARTS CENTRES
37
APPENDIX A: NATIONAL STRONGER REGIONS FUND (NSRF)
The following are a sample of approved NSRF Cultural projects extracted from the Australian Government website. It shows a range of funding allocated towards the total project
costs from 18% to 49%.
Table A.1: NSRF Approved Projects (Sample Extract)
Project Ref Applicant Organisation
Project Name Project Description Project Location
State Commonwealth Funding
Approved
Total Project Cost
Funding Approved vs Project Cost
Round 1
NSRF000082 Devonport City Council
Construction of Stage 1 Living City Project at Devonport
The Living City project will construct a new retail, business/service and waterfront precinct focused on highlighting the Regions tourism, arts, food and services. Stage 1 includes a convention centre and multi-use community building, a food/beverage hub and market square and a two storey car park.
Devonport TAS $9,999,000 $54,720,000 18%
NSRF000189 Wellington Shire Council
Redevelopment of the Port of Sale Civic Centre
The project is the redevelopment of the Port of Sale Civic Centre into a cultural hub, incorporating a regional art gallery, public library and visitor information centre.
Sale VIC $4,500,000 $12,500,000 36%
NSRF000238 Horsham Rural City Council
The Grampians Peaks Trail Project
The project will construct a 144km, multi-day walking trail across the length of the Grampians National Park. The project will showcase the beauty and majesty of the Park’s natural and cultural landscapes, the Grampians Peak Trail will be one of the great iconic walks of Australia with an estimated visitation of 23,000 people per annum by 2020.
Dunkeld VIC $10,000,000 $27,000,000 37%
NSRF000430 Maroondah City Council
Construct a Centre for Regional Knowledge and Innovation at Ringwood
The project involves the construction of a new library, learning and cultural centre in the new Ringwood Town Square precinct.
Ringwood VIC $3,000,000 $7,700,000 39%
NSRF000003 Casey City Council
Construction of a Regional Arts Centre at Narre Warren
The project will construct a Regional Arts Centre, including a theatre, studio space, function centre and regional art gallery.
Narre Warren VIC $10,000,000 $55,000,000 18%
Round 2
NSRF200181 Gosford City Council
Regional Performing Arts and Conference Centre
The RPACC will be located in the Gosford Cultural Precinct & includes a 1000 seat multipurpose auditorium, a 200 seat studio and associated facilities.
Gosford NSW $10,000,000 $30,000,000 33%
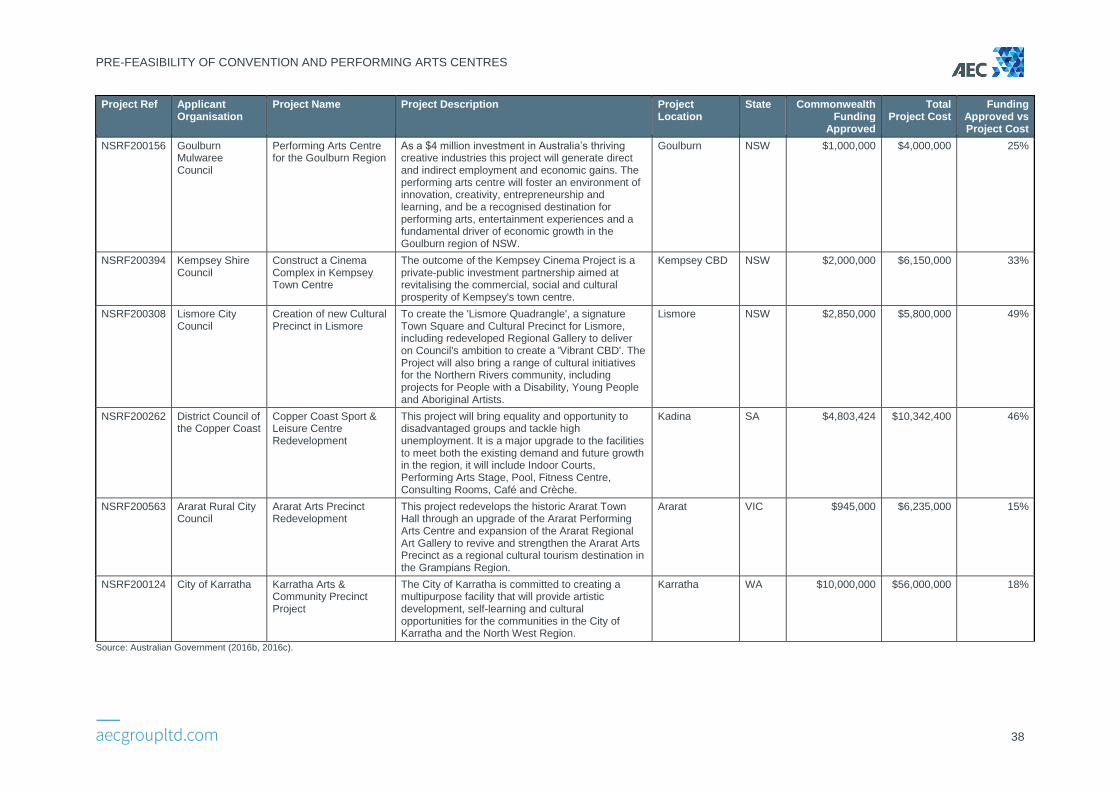
PRE-FEASIBILITY OF CONVENTION AND PERFORMING ARTS CENTRES
38
Project Ref Applicant Organisation
Project Name Project Description Project Location
State Commonwealth Funding
Approved
Total Project Cost
Funding Approved vs Project Cost
NSRF200156 Goulburn Mulwaree Council
Performing Arts Centre for the Goulburn Region
As a $4 million investment in Australia’s thriving creative industries this project will generate direct and indirect employment and economic gains. The performing arts centre will foster an environment of innovation, creativity, entrepreneurship and learning, and be a recognised destination for performing arts, entertainment experiences and a fundamental driver of economic growth in the Goulburn region of NSW.
Goulburn NSW $1,000,000 $4,000,000 25%
NSRF200394 Kempsey Shire Council
Construct a Cinema Complex in Kempsey Town Centre
The outcome of the Kempsey Cinema Project is a private-public investment partnership aimed at revitalising the commercial, social and cultural prosperity of Kempsey's town centre.
Kempsey CBD NSW $2,000,000 $6,150,000 33%
NSRF200308 Lismore City Council
Creation of new Cultural Precinct in Lismore
To create the 'Lismore Quadrangle', a signature Town Square and Cultural Precinct for Lismore, including redeveloped Regional Gallery to deliver on Council's ambition to create a 'Vibrant CBD'. The Project will also bring a range of cultural initiatives for the Northern Rivers community, including projects for People with a Disability, Young People and Aboriginal Artists.
Lismore NSW $2,850,000 $5,800,000 49%
NSRF200262 District Council of the Copper Coast
Copper Coast Sport & Leisure Centre Redevelopment
This project will bring equality and opportunity to disadvantaged groups and tackle high unemployment. It is a major upgrade to the facilities to meet both the existing demand and future growth in the region, it will include Indoor Courts, Performing Arts Stage, Pool, Fitness Centre, Consulting Rooms, Café and Crèche.
Kadina SA $4,803,424 $10,342,400 46%
NSRF200563 Ararat Rural City Council
Ararat Arts Precinct Redevelopment
This project redevelops the historic Ararat Town Hall through an upgrade of the Ararat Performing Arts Centre and expansion of the Ararat Regional Art Gallery to revive and strengthen the Ararat Arts Precinct as a regional cultural tourism destination in the Grampians Region.
Ararat VIC $945,000 $6,235,000 15%
NSRF200124 City of Karratha Karratha Arts & Community Precinct Project
The City of Karratha is committed to creating a multipurpose facility that will provide artistic development, self-learning and cultural opportunities for the communities in the City of Karratha and the North West Region.
Karratha WA $10,000,000 $56,000,000 18%
Source: Australian Government (2016b, 2016c).
PRE-FEASIBILITY OF CONVENTION AND PERFORMING ARTS CENTRES
39
THIS PAGE INTENTIONALLY LEFT BLANK