Nonrenewable Mineral Resources - Weebly
52
© Cengage Learning 2015 LIVING IN THE ENVIRONMENT, 18e G. TYLER MILLER • SCOTT E. SPOOLMAN © Cengage Learning 2015 14 Nonrenewable Mineral Resources
Transcript of Nonrenewable Mineral Resources - Weebly
© Cengage Learning 2015
LIVING IN THE ENVIRONMENT, 18e G. TYLER MILLER • SCOTT E. SPOOLMAN
© Cengage Learning 2015
14 Nonrenewable Mineral Resources
© Cengage Learning 2015
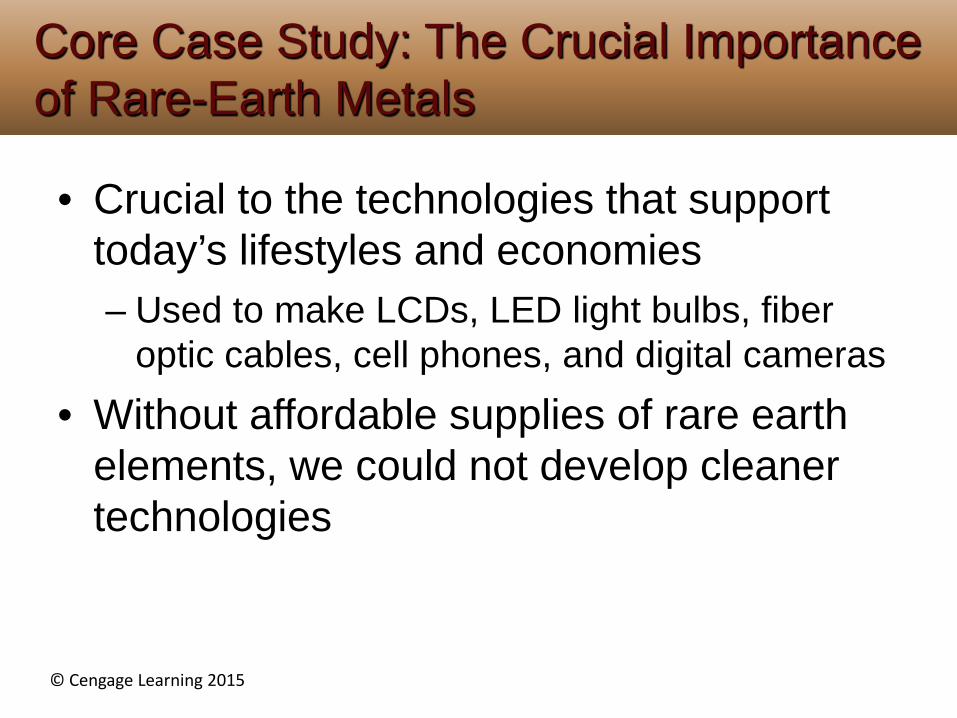
• Crucial to the technologies that support today’s lifestyles and economies – Used to make LCDs, LED light bulbs, fiber
optic cables, cell phones, and digital cameras • Without affordable supplies of rare earth
elements, we could not develop cleaner technologies
Core Case Study: The Crucial Importance of Rare-Earth Metals

Fig. 14-2, p. 350
Catalytic converter • Cerium • Lanthanum Battery • Lanthanum • Cerium
Electric motors and generator • Dysprosium • Neodymium • Praseodymium • Terbium
LCD screen • Europium • Yttrium • Cerium
Presenter
Presentation Notes
Figure 14-2: Manufacturers of all-electric and hybrid-electric cars use a variety of rare earth metals.
© Cengage Learning 2015
• Dynamic processes within the earth and on its surface produce the mineral resources on which we depend
• Mineral resources are nonrenewable – Produced and renewed over millions of years
mostly by the earth’s rock cycle
14-1 What Are the Earth’s Major Geological Processes/Mineral Resources?

© Cengage Learning 2015
• Geology – Study of dynamic processes taking place on
earth’s surface and in earth’s interior • Three major concentric zones of the earth
– Core – Mantle, including the asthenosphere – Crust
• Continental crust • Oceanic crust: 71% of crust
The Earth Is a Dynamic Planet
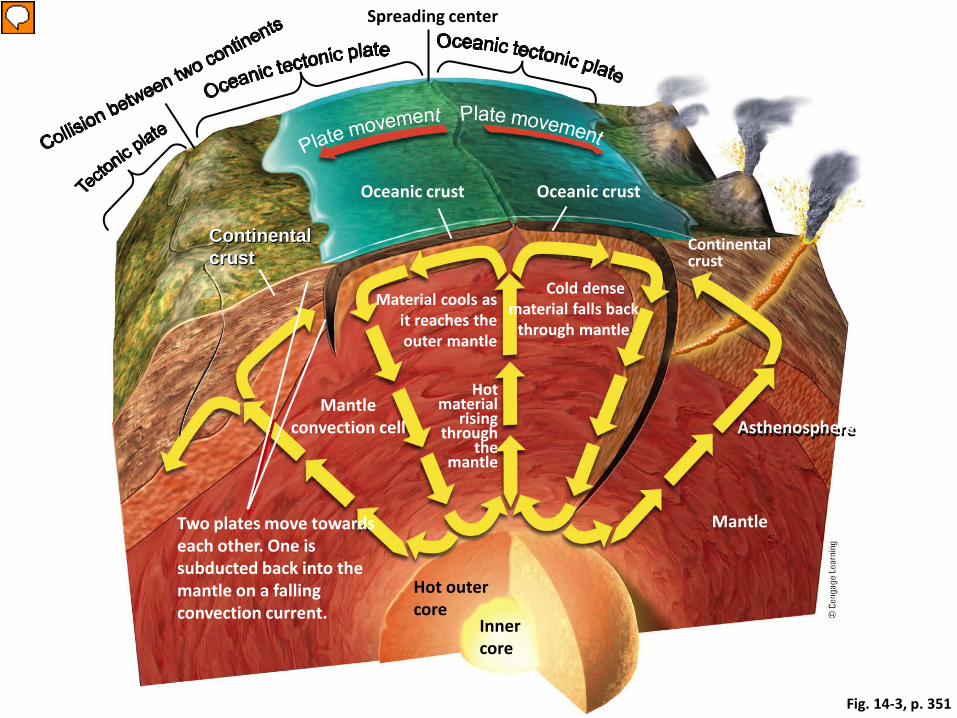
Fig. 14-3, p. 351
Spreading center
Oceanic crust Oceanic crust
Continental crust
Continental crust
Material cools as it reaches the outer mantle
Cold dense material falls back
through mantle
Hot material
rising through
the mantle
Mantle convection cell
Two plates move towards each other. One is subducted back into the mantle on a falling convection current.
Mantle
Hot outer core
Inner core
Asthenosphere Asthenosphere
Presenter
Presentation Notes
Figure 14-3: The earth is composed of a core, mantle, and crust, and within the core and mantle, dynamic forces have major effects on what happens in the crust and on the surface.

© Cengage Learning 2015
• Mineral – Naturally occurring compound that exists as a
crystalline solid • Mineral resource
– Concentration that we can extract and process into raw materials
• Rock – Solid combination of one or more minerals
What Are Minerals and Rocks?

© Cengage Learning 2015
• Sedimentary rock – Made of sediments
• Dead plant and animal remains • Tiny particles of weathered and eroded rocks
• Igneous rock – Intense heat and pressure
• Metamorphic rock – Existing rock subjected to high temperatures,
pressures, fluids, or a combination
What Are Minerals and Rocks? (cont’d.)
© Cengage Learning 2015
• Rock cycle – Rocks are recycled over millions of years – Erosion, melting, and metamorphism – Slowest of earth’s cycle processes
Earth’s Rocks Are Recycled Very Slowly

© Cengage Learning 2015
• Ore – Contains profitable concentration of a mineral – High-grade ore – Low-grade ore
• Metallic mineral resources – Aluminum – Iron for steel – Copper
We Depend on a Variety of Nonrenewable Mineral Resources

© Cengage Learning 2015
• Nonmetallic mineral resources – Sand, gravel, and limestone
• Reserves – Estimated supply of a mineral resource
We Depend on a Variety of Nonrenewable Mineral Resources (cont’d.)

© Cengage Learning 2015
Fig. 14-5, p. 353
Erosion Transportation
Weathering
Deposition
Igneous rock Granite, pumice, basalt
Sedimentary rock Sandstone,
limestone
Heat, pressure
Cooling
Heat, pressure, stress
Magma (molten rock)
Melting
Metamorphic rock Slate, marble, gneiss, quartzite
Presenter
Presentation Notes
Figure 14-5: Natural capital: The rock cycle is the slowest of the earth’s cyclical processes.

© Cengage Learning 2015
• Nonrenewable mineral resources exist in finite amounts – Can become economically depleted when it
costs more than it is worth to find, extract, and process the remaining deposits
• There are several ways to extend supplies of mineral resources – But each of these is limited by economic and
environmental factors
How Long Might Supplies of Nonrenewable Mineral Resources Last?

© Cengage Learning 2015
• Reserves – Identified deposits from which we can extract
the mineral profitably • Depletion time
– Time to use a certain portion of reserves
Supplies of Nonrenewable Mineral Resources Can Be Economically Depleted

© Cengage Learning 2015
• When a resource becomes economically depleted: – Recycle or reuse existing supplies – Waste less – Use less – Find a substitute – Do without
Nonrenewable Mineral Resources Can Be Economically Depleted (cont’d.)

© Cengage Learning 2015
A Mine, use, throw away; no new discoveries; rising prices
Depletion time A
Recycle; increase reserves by improved mining technology, higher prices, and new discoveries B
Depletion time B
Recycle, reuse, reduce consumption; increase reserves by improved mining technology, higher prices, and new discoveries
C
Depletion time C
Prod
uctio
n
Present
Time Stepped Art Fig. 14-6, p. 360
Presenter
Presentation Notes
Figure 14-6: Natural capital depletion: Each of these depletion curves for a mineral resource (such as aluminum, copper, or a rare earth) is based on a different set of assumptions. Dashed vertical lines represent the times at which 80% depletion occurs.

© Cengage Learning 2015
• Rare-earth elements aren’t really rare • China produces 97% of the world’s rare-
earth metals and oxides • The U.S. produces none
Global and U.S. Rare-Earth Supplies
© Cengage Learning 2015
• Subsidies and tax breaks to mining companies keep mineral prices artificially low
• Scarce investment capital hinders the development of new supplies of mineral resources
Market Prices Affect Supplies of Nonrenewable Minerals
© Cengage Learning 2015
• Factors that limit the mining of lower-grade ores – Increased cost of mining and processing
larger volumes of ore – Availability of freshwater – Environmental impact
• Improve mining technology – Using microorganisms – biomining – Slow process
Can We Expand Reserves by Mining Lower-Grade Ores?

© Cengage Learning 2015
• Mineral resources dissolved in the ocean – Low concentrations
• Deposits of minerals in sediments along the shallow continental shelf and near shorelines
Can We Get More Minerals from the Ocean?

© Cengage Learning 2015
• Hydrothermal ore deposits – Hot water vents in the ocean floor
• Metals from the ocean floor – Manganese nodules
• What is the effect of mining on aquatic life?
Can We Get More Minerals from the Ocean? (cont’d.)
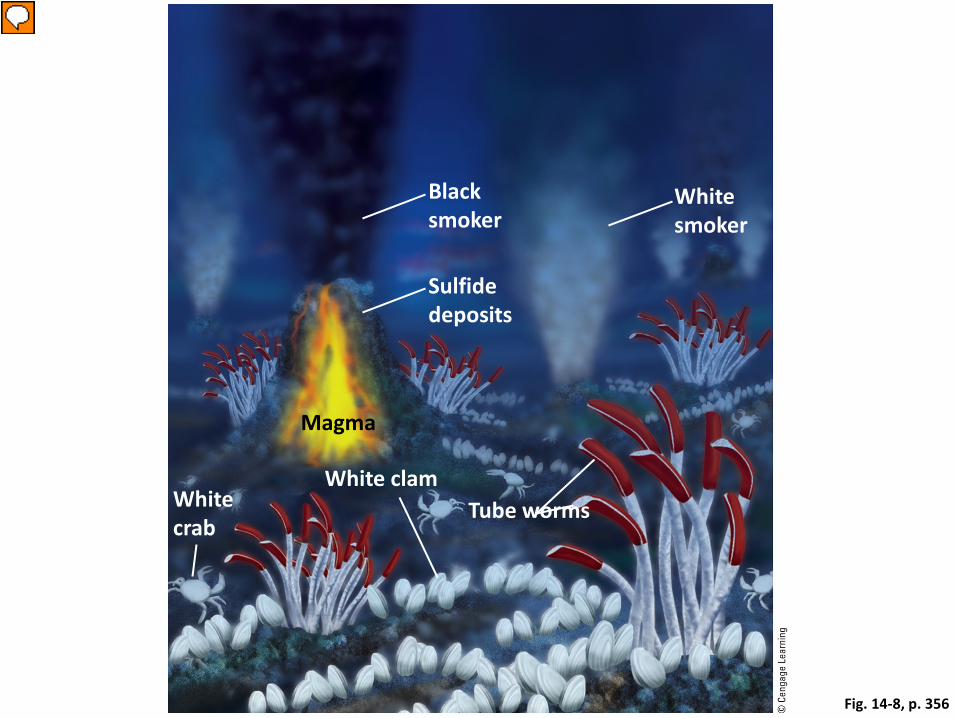
Fig. 14-8, p. 356
Black smoker
White smoker
Sulfide deposits
Magma
White clam White crab
Tube worms
Presenter
Presentation Notes
Figure 14-8: Natural capital. Hydrothermal deposits, or black smokers, are rich in various minerals.

© Cengage Learning 2015
• Extracting minerals from the earth’s crust and converting them into useful products can: – Disturb the land – Erode soils – Produce large amounts of solid waste – Pollute the air, water, and soil
14-3 What Are The Environmental Effects From Using Nonrenewable Minerals?

© Cengage Learning 2015
• Metal product life cycle – Mining, processing, manufacture, and
disposal • Environmental impacts
– Determined by an ore’s grade • Percentage of metal content
Mineral Use Creates Environmental Impacts

© Cengage Learning 2015
Fig. 14-9, p. 357
Mining Metal ore
Separation of ore from waste material
Smelting Melting metal
Conversion to product
Discarding of product
Recycling
Presenter
Presentation Notes
Figure 14-9: Each metal product that we use has a life cycle.

© Cengage Learning 2015
• Surface mining – Removes shallow deposits – Overburden deposited into spoils – waste
material • Open-pit mining • Strip mining • Contour strip mining • Mountaintop removal
Removing Mineral Deposits Has Harmful Environmental Effects

© Cengage Learning 2015
Fig. 14-10, p. 358
Presenter
Presentation Notes
Figure 14-10: Natural capital degradation: This spoils pile in Zielitz, Germany, is made up of waste material from the mining of potassium salts used to make fertilizers.

© Cengage Learning 2015
Fig. 14-11, p. 358
Presenter
Presentation Notes
Figure 14-11: Natural capital degradation: Kennecott’s Bingham Canyon Mine in the U.S. state of Utah has produced more copper than any mine in history. This gigantic open-pit mine is almost 5 kilometers (3 miles) wide and 1,200 meters (4,000 feet) deep, and it is getting deeper.

Fig. 14-13, p. 359
Undisturbed land
Overburden
Pit Bench
Spoil banks
Presenter
Presentation Notes
Figure 14-13: Natural capital degradation: Contour strip mining is used in hilly or mountainous terrain.

© Cengage Learning 2015
• Subsurface mining – Deep deposits
• Potential problems – Subsidence – Acid mine drainage
Removing Mineral Deposits Has Harmful Environmental Effects (cont’d.)

Fig. 14-15, p. 360
Presenter
Presentation Notes
Figure 14-15: Acid mine drainage from an abandoned open-pit coal mine in Portugal.
© Cengage Learning 2015
• At about 90% of the world’s gold mines – Mineral extracted with cyanide salts – Cyanide is extremely toxic
• Mining companies declare bankruptcy – Allows them to avoid environmental
remediation
Case Study: The Real Cost of Gold

© Cengage Learning 2015
• Ore extracted by mining – Ore mineral – Tailings – waste material – Smelting using heat or chemicals causes:
• Air pollution • Water pollution
Removing Metals from Ores Has Harmful Environmental Effects
© Cengage Learning 2015
• We can: – Try to find substitutes for scarce resources – Reduce resource waste – Recycle and reuse minerals
14-4 How Can We Use Mineral Resources More Sustainability?

© Cengage Learning 2015
• Materials revolution – Silicon replacing some metals for common
uses • New technologies:
– Nanotechnology, ceramics, and high-strength plastics
• Substitution doesn’t always work – Platinum – industrial catalyst
We Can Find Substitutes for Some Scarce Mineral Resources

© Cengage Learning 2015
• Recycling and reuse – Lower environmental impact than mining and
processing metals from ores – Adequate supplies of rare-earth elements in
the short-term – Substitutes for rare-earth elements
We Can Use Mineral Resources More Sustainably

© Cengage Learning 2015
Solutions: Sustainable Use of Nonrenewable Minerals
Fig. 14-17, p. 364
Presenter
Presentation Notes
Figure 14-17: We can use nonrenewable mineral resources more sustainably (Concept 14-4). Questions: Which two of these solutions do you think are the most important? Why?

© Cengage Learning 2015
• Dynamic processes move matter within the earth and on its surface and can cause volcanic eruptions, earthquakes, tsunamis, erosion, and landslides
14-5 What Are the Earth’s Major Geologic Hazards?
© Cengage Learning 2015
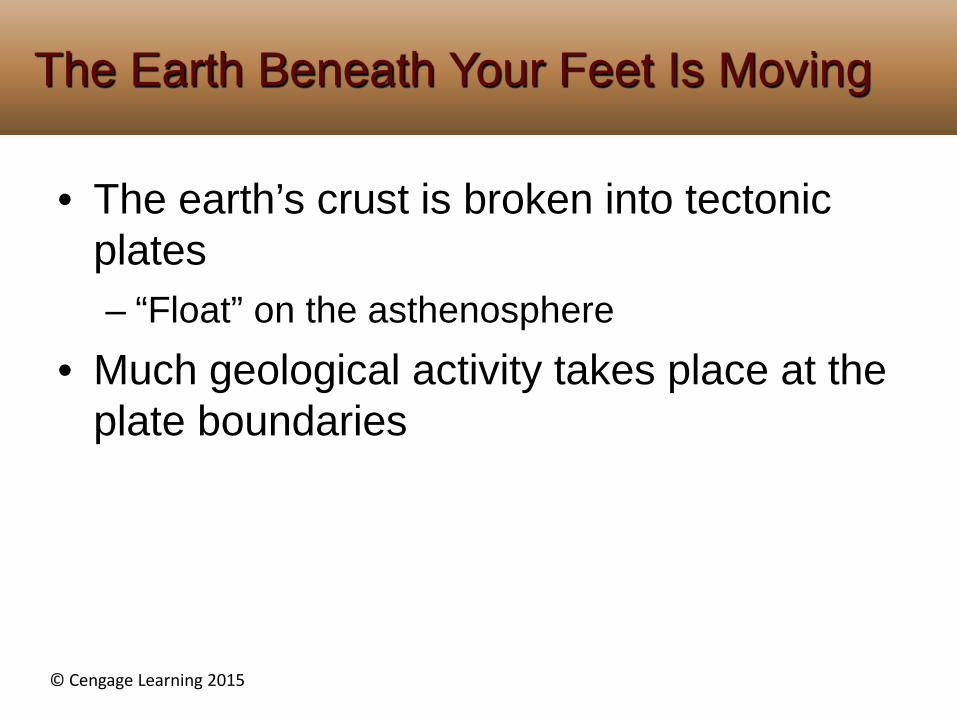
• The earth’s crust is broken into tectonic plates – “Float” on the asthenosphere
• Much geological activity takes place at the plate boundaries
The Earth Beneath Your Feet Is Moving

© Cengage Learning 2015
Fig. 14-18, p. 366
Eurasian plate North American plate Juan De Fuca
plate Caribbean plate
African plate
Pacific plate
Cocos Plate
South American
plate
Arabian plate
Philippine plate
Pacific plate
Nazca plate Indian-Australian
plate
Scotia plate
Antarctic plate
Presenter
Presentation Notes
Figure 14-18: The earth’s crust has been fractured into several major tectonic plates. White arrows indicate examples of where plates are colliding, separating, or grinding along against each other in opposite directions. Question: Which plate are you riding on?

© Cengage Learning 2015
• Volcano – Magma rising through the lithosphere reaches
the earth’s surface through a crack – Eruption – release of lava, hot ash, and gases
into the environment – What are the benefits and hazards of
volcanoes?
Volcanoes Release Molten Rock from the Earth’s Interior
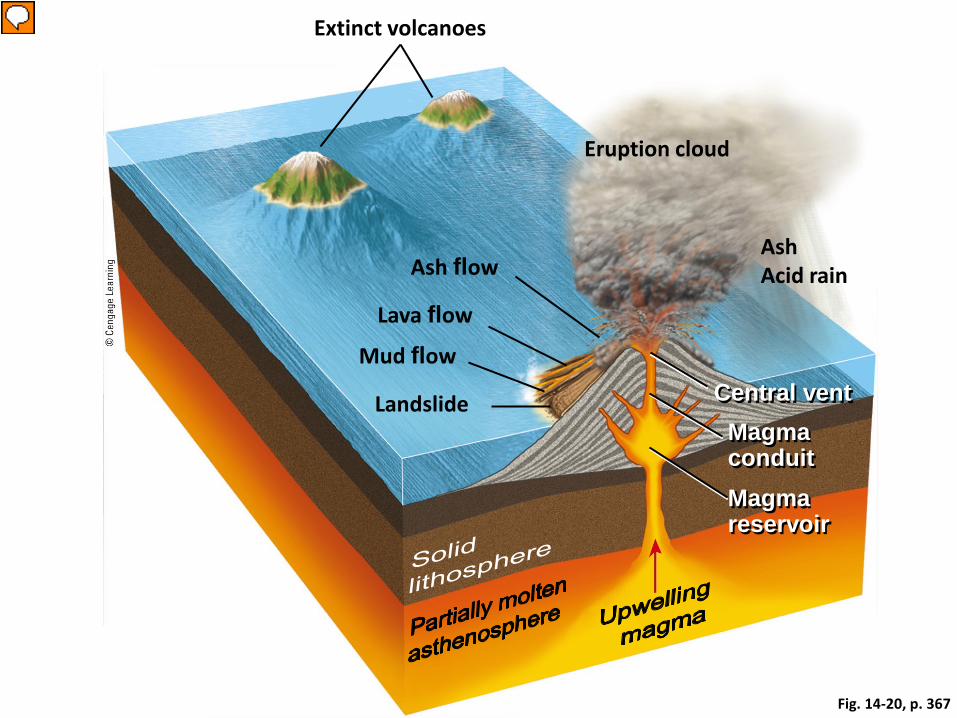
Fig. 14-20, p. 367
Extinct volcanoes
Eruption cloud
Ash Acid rain Ash flow
Lava flow
Mud flow
Landslide Central vent Magma conduit Magma reservoir
Presenter
Presentation Notes
Figure 14-20: Sometimes, the internal pressure in a volcano is high enough to cause lava, ash, and gases to be ejected into the atmosphere (photo inset) or to flow over land, causing considerable damage.
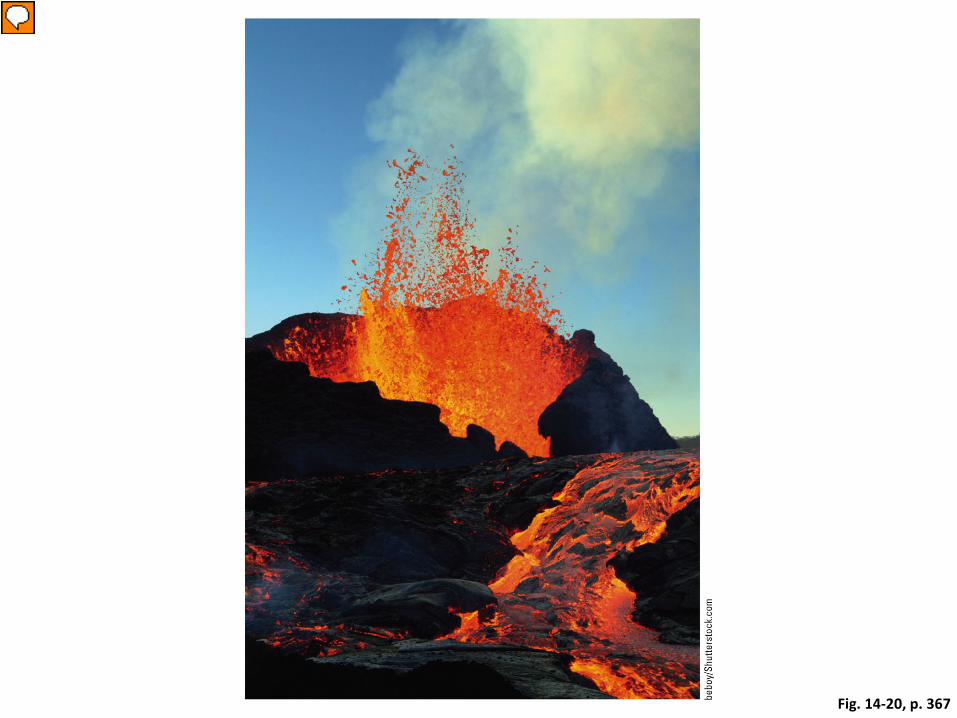
Fig. 14-20, p. 367
Presenter
Presentation Notes
Figure 14-20: Sometimes, the internal pressure in a volcano is high enough to cause lava, ash, and gases to be ejected into the atmosphere (photo inset) or to flow over land, causing considerable damage.

© Cengage Learning 2015
• Earthquake – Breakage and shifting of rocks
• At a fault
– Seismic waves • Vibrations in the crust
– Focus – origin of earthquake – Magnitude – severity of earthquake – Amplitude – size of the seismic waves
Earthquakes Are Geological Rock-and-Roll Events

© Cengage Learning 2015
• Richter scale – Insignificant: <4.0 – Minor: 4.0–4.9 – Damaging: 5.0–5.9 – Destructive: 6.0–6.9 – Major: 7.0–7.9 – Great: >8.0
• Largest recorded: 9.5 in Chile, 1960
Earthquakes Are Geological Rock-and-Roll Events (cont’d.)
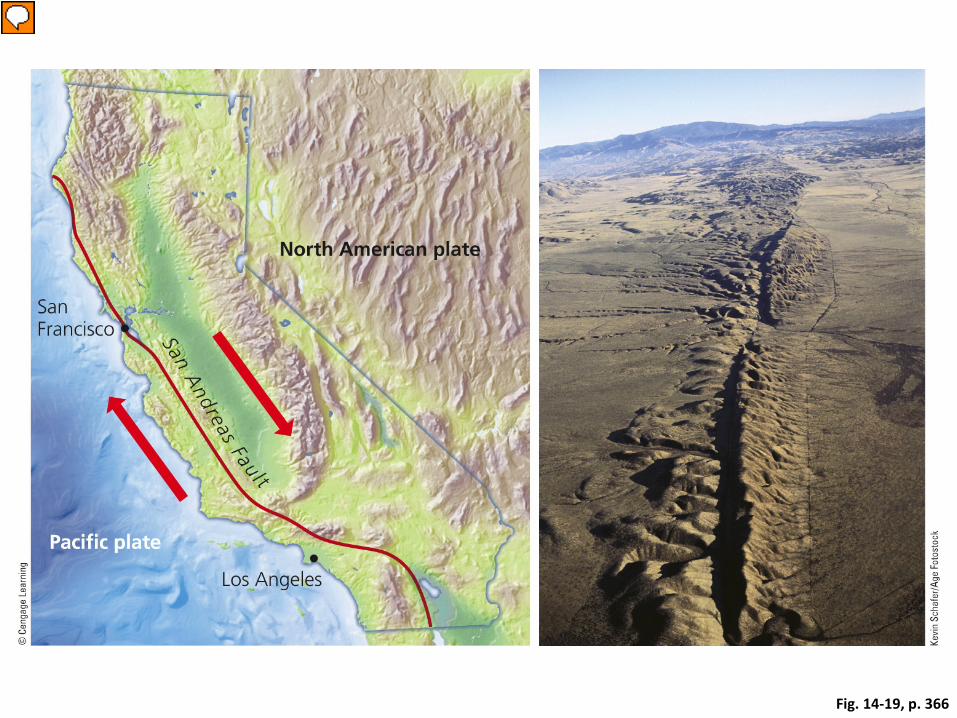
Fig. 14-19, p. 366
Presenter
Presentation Notes
Figure 14-19: The San Andreas Fault, created by the North American Plate and the Pacific Plate sliding very slowly past each other, runs almost the full length of California (see map). It is responsible for earthquakes of various magnitudes, which have caused rifts on the land surface in some areas (photo).

© Cengage Learning 2015
Fig. 14-21, p. 367
Liquefaction of recent sediments causes buildings to sink
Two adjoining plates move laterally along the fault line
Earth movements cause flooding in low-lying areas
Landslides may occur on hilly ground
Shock waves
Focus Epicenter
Presenter
Presentation Notes
Figure 14-21: An earthquake (left) is one of nature’s most powerful events. The photo shows damage from a 2010 earthquake in Port-au-Prince, Haiti.

© Cengage Learning 2015
Fig. 14-21b, p. 367
Presenter
Presentation Notes
Figure 14-21: An earthquake (left) is one of nature’s most powerful events. The photo shows damage from a 2010 earthquake in Port-au-Prince, Haiti.

© Cengage Learning 2015
• Tsunami – Series of huge waves generated when ocean
floor suddenly rises or drops – Travels several hundred miles per hour
• December 2004 – Indian Ocean tsunami – Magnitude 9.15 and 31-meter waves at shore
Earthquakes on the Ocean Floor Can Cause Huge Waves Called Tsunamis

© Cengage Learning 2015
• 2011 – Japan tsunami – Damaged nuclear reactors
• Detection of tsunamis – Buoys in open ocean
Earthquakes on the Ocean Floor Can Cause Huge Waves Called Tsunamis

Fig. 14-22a, p. 368
Earthquake in seafloor swiftly pushes water upwards, and starts a series of waves
Waves move rapidly in deep ocean reaching speeds of up to 890 kilometers per hour.
As the waves near land they slow to about 45 kilometers per hour but are squeezed upwards and increased in height.
Waves head inland causing damage in their path.
Undersea thrust fault
Presenter
Presentation Notes
Figure 14-22: This diagram illustrates how a tsunami forms. The map shows the area affected by a large tsunami in December 2004—one of the largest ever recorded.

Fig. 14-22b, p. 368
Upward wave
Earthquake
Presenter
Presentation Notes
Figure 14-22: This diagram illustrates how a tsunami forms. The map shows the area affected by a large tsunami in December 2004—one of the largest ever recorded.