Nonprofit Employee Benefits Report · SECTION 1: BENEFITS OFFERED PPI Benefit Solutions 2017...
29
2017 Nonprofit Employee Benefits Report Benefit Solutions
Transcript of Nonprofit Employee Benefits Report · SECTION 1: BENEFITS OFFERED PPI Benefit Solutions 2017...

2017 Nonprofit Employee Benefits Report
Bene�t Solutions
CONTENTS
Section 1: Benefits Offered
Section 2: Selection & Management
Section 3: Benefits Administration
Section 4: Plan Funding & Contributions
Section 5: Plan Details
Overview of Survey Participants
About PPI Benefit Solutions
1
Expanding Benefits to Support Employee Physical and Financial Health
Nonprofit employers have always recognized that employee benefits are an important recruitment and retention tool. More than ever before, employees want access to a broad range of benefits to help them manage both their physical and financial health. Often, nonprofit organizations struggle to meet those needs, whether due to uncertain or unpredictable funding, fear of change, or the conflicting demands of a multi-generational workforce regarding benefits. The good news is that nonprofits seem to be embracing several low- to no-cost programs that enhance the benefit offerings that allow employees more choice when selecting benefits that best meet their life stage and lifestyle.
Based on results of the 2017 Nonprofit Employee Benefits Survey, nonprofit employers have begun to embrace voluntary benefits to either replace contributory options or to enhance existing benefit plans. This year, more surveyed nonprofits are offering voluntary coverages such as supplemental medical, dental, vision, accident, critical illness, group legal, and doctors by phone, and most coverages had a double-digit increases over 2016. Employees are also beginning to appreciate these benefits, particularly those enrolled in high deductible health plans. They increasingly value benefits that help cover out-of-pocket costs in the event of an accident, emergency or sudden illness.
The 2017 survey also indicates that nonprofit employers are beginning to embrace wellness programs and participation incentives. Surveyed employers are adding more lifestyle and behavior coaching, programs administered by wellness companies, nutritional counseling, and health fairs. These can be wonderful tools for building employee loyalty and for encouraging employees to make health and lifestyle changes.
Finally, more nonprofit organizations are embracing benefits technology, whether using it to support eligibility manage-ment and COBRA administration or to eliminate paper enrollment forms by allowing employees to enroll in benefits online. Results of this year’s survey show that nearly 75% of nonprofits are using an online system to manage ongoing benefits administration, and one-third give employees access to an enrollment portal to make benefit elections. One-third may seem low, but it represents a 32% increase over last year’s result. Clearly, nonprofit employers are learning that employee self-service enrollment reduces enrollment time, eliminates legibility errors, improves the enrollment experience for employees, and better supports a modern workforce of virtual teams, telecommuters, and the now largest working generation, digital-native Millennials.
PPI Benefit Solutions 2017 Nonprofit Employee Benefits Survey

SECTION 1: BENEFITS OFFERED
PPI Benefit Solutions 2017 Nonprofit Employee Benefits Survey 2
Prevalence of BenefitsThe most prevalent benefits offered by nonprofits continue to be group medical, group dental, and employer-paid life insurance, although the number of nonprofit employers who reported offering them has dipped slightly from 2016: medical dropped from 98.7%; dental fell from 94.9%; paid life decreased from 92.8%. The number offering spending accounts stayed relatively the same.
Offer Group Dental
Offer Employer-Paid Life Insurance
Offer Tax-Advantage Spending Accounts
Among other benefits offered, group long-term disability (LTD) came out on top at 56.1%, but it also saw a significant drop from 2016 when 75% of nonprofits reported offering the benefit. Following LTD were group STD, then voluntary life and group vision. Certain voluntary benefits such as critical illness, accident, supplemental medical, dental, vision, legal, telemedicine, and long-term saw significant increases from 2016.
Offer Group Medical
Group Vision
Group Long-Term Disability (LTD)
Group Short-Term Disability (STD)
Voluntary Life
Spousal Life
Child(ren) Life
Supplemental Medical
Voluntary Dental
Voluntary Vision
Voluntary LTD
Voluntary STD
Accident Insurance (separate from AD&D)
Critical Illness
Long-Term Care
Group Legal
Doctors by phone or online
Identity Theft
Tuition Assitance/Continuing Education
Pet Insurance
41.5%
56.1%
45.7%
41.5%
27.4%
26.2%
17.1%
23.2%
36.0%
21.3%
25.0%
29.3%
16.5%
12.8%
13.4%
10.4%
15.2%
7.9%
26.8%
3.7%
96.4% 87.4%
81.4% 74.9%
from 9.3%
from 75%
from 52%
from 16%
from 18%
from 26.7%
from 14.7%
from 7.1%
from 8.9%
from 13.3%
No change
2016
SECTION 1: BENEFITS OFFERED
PPI Benefit Solutions 2017 Nonprofit Employee Benefits Survey 3
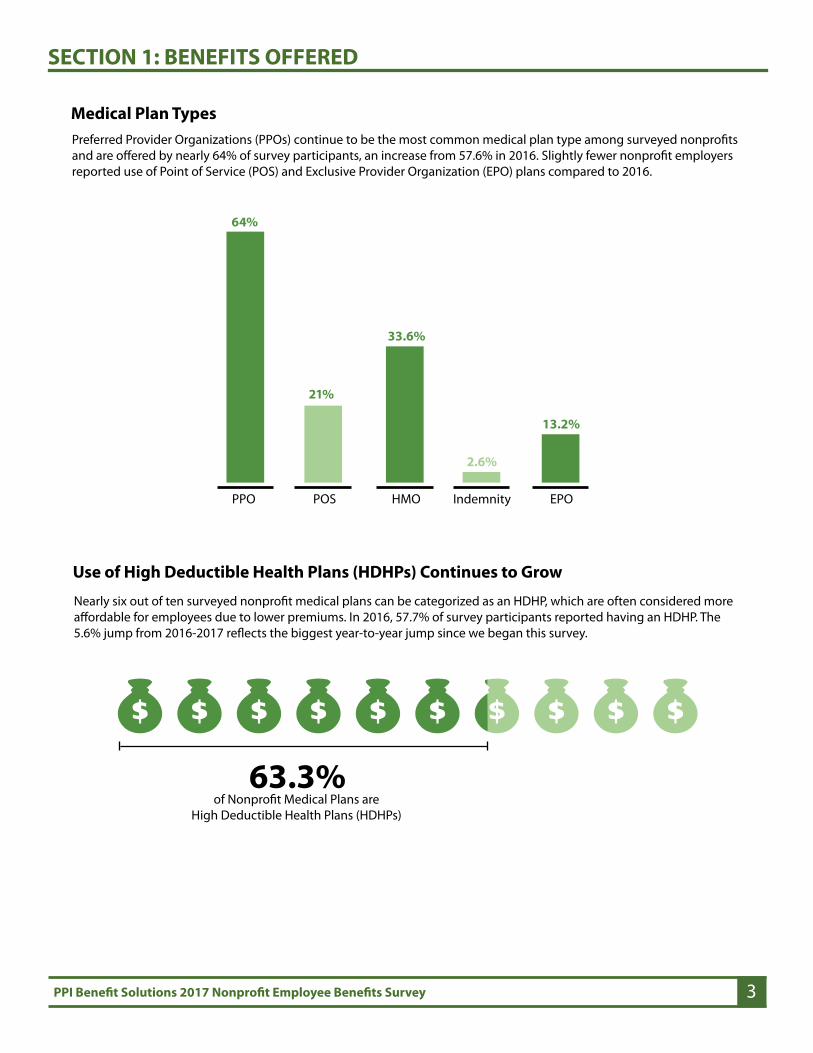
Medical Plan TypesPreferred Provider Organizations (PPOs) continue to be the most common medical plan type among surveyed nonprofits and are offered by nearly 64% of survey participants, an increase from 57.6% in 2016. Slightly fewer nonprofit employers reported use of Point of Service (POS) and Exclusive Provider Organization (EPO) plans compared to 2016.
PPO POS HMO Indemnity EPO
33.6%
2.6%
13.2%
Use of High Deductible Health Plans (HDHPs) Continues to Grow
Nearly six out of ten surveyed nonprofit medical plans can be categorized as an HDHP, which are often considered more affordable for employees due to lower premiums. In 2016, 57.7% of survey participants reported having an HDHP. The 5.6% jump from 2016-2017 reflects the biggest year-to-year jump since we began this survey.
64%
21%
63.3%

SECTION 1: BENEFITS OFFERED
PPI Benefit Solutions 2017 Nonprofit Employee Benefits Survey 4
Employee Enrollment in High Deductible Health Plans (HDHPs)
PPOs are the most common dental plan type offered by surveyed nonprofits (70.8%). Following are Dental Maintenance Organizations (DMOs) and Point of Service (POS) plans.
A dental plan described as a “monthly switch” allows employees to switch between a DMO and either a PPO or indemnity plan. An indemnity plan, or fee-for-service plan, reimburses the covered person for incurred expenses once the deductible is met.
100%90%80%70%60%50%40%30%20%10%<10%
4.9%
8.8%6.9%
12.7%10.8%
5.9%
10.8%
14.7%
11.8%
8.8%
3.9%
Enrollment in HDHPs runs the gamut - 50% of employers surveyed reported less than 50% of employees enrolled in the HDHP, and 44% reported more than 50% enrolled.
Dental Plan Types
PPO POS DMODHMO
Indemnity EPO MonthlySwitch
PDP
70.8%
13.9%
36.5%
5.1% 5.8%8.0% 5.1%
Percent of Employees Enrolled

SECTION 1: BENEFITS OFFERED
PPI Benefit Solutions 2017 Nonprofit Employee Benefits Survey 5
Employer-Paid Life InsuranceThe most common level of employer-paid life insurance offered by nonprofits is “1X salary,” accounting for just over 25% of results. However, this is a decrease from 2011 when 35.9% of employers reported that benefit amount. The second most common answer was “1.5X salary,” followed by “2X salary” which is reversed from 2016.
Statistics less than 5% are not shown: 3X Salary - 4.5%; 4X Salary - 1.5%; 5X Salary - 1.5%; $1 to $9,999 - 3.7%; $10,000 to $19,000 - 3.0; $30,000 to $39,999- 1.5%; $50,000 to $74,999 - 3.0%; $75,000 to $99,999 - 1.5%; $100,000 or more - 2.2%
Prescription Drug Plans
The majority of surveyed nonprofit employers offer a three tier prescription drug plan to their employees, as reported by nearly 40% of survey participants. This is consistent with our 2016 survey results but is significantly lower than the 63% reported in 2015. The second most common answer is “plan pays once deductible is met,” followed by “two tiers.” 8% of surveyed employers do not offer a prescription drug plan.
21.5% 6.7%
39.9%12.9%11.0%
25.4%20.1% 16.4% 7.5% 5.2%
1X salary
1.5X salary $40,000 to $49,000$20,000 to $29,9992X salary
Tax Advantaged AccountsFlexible Spending Accounts (FSAs) are the most common type of tax advantaged account offered by surveyed nonprofits However, 2017 saw a sharp decrease in the number of employers offering an FSA, 65.3% from 80.2% in 2016. The number of employers who offer an HSA rose slightly from 40% in 2016 to 47.9% in 2017.
47.9%
32.2%25.6%
65.3%
6.6%
HSA HRA FSA HRP Transit

Paid Leave
SECTION 1: BENEFITS OFFERED
PPI Benefit Solutions 2017 Nonprofit Employee Benefits Survey 6
The most prevalent paid leave benefits offered by surveyed nonprofits are Holidays, Bereavement time, and Jury duty, followed by Vacation days, bundled time off (PTO), and Sick leave.
Wellness ProgramsThis year, Flu vaccinations topped the list of most popular wellness programs, above Employee Assistance Programs (EAPs) which since the start of this annual survey, was the highest reported program (the EAP is often tied to disability benefits, so the drop is consistent with the reduced number of surveyed employers who offer a paid disability benefit in 2017). Nonprofit employers are making wellness a priority, as seen by the growth in offerings like Lifestyle coaching, Third party wellness, Nutritional counseling, and Health fairs.
Holidays
Sick leave
Personal days
Bereavement
Parental leave/elder care
Military leave
Paternity leave
Maternity leave
57.5%
30.5%
7.2%
80.2%
25.7%
13.8%
31.7%
51.5%
61.1%
8.4%
58.1%
50.9%
64.1%
29.9%
64.7%
30.5%
Lifestyle/Behavioral Coach
Onsite gym
Telemedicine services
EAP
Health fairs
Health Risk Assessments
Third-party wellness company
Biometric screenings
Gym membership discount,subsidy or reimbursement
21.8%
12.2%
39.6%
22.3%
12.2%
54.0%
18.0%
12.2%
14.4%
12.2%
36.7%
from 43.4%
from 7.4%
from 18.9%
from 9%
from 17.2%
from 68%
2016

SECTION 1: BENEFITS OFFERED
PPI Benefit Solutions 2017 Nonprofit Employee Benefits Survey 7
Wellness Participation IncentivesThe ACA amended ERISA and HIPAA nondiscrimination provisions to permit group health plans to adopt wellness program incentives that vary a person’s health plan premiums or cost-sharing based on their health status or participation, as long as the wellness program meets certain requirements. We asked survey participants which incentives were in place at their organization, and nearly three-quarters selected “reduced healthcare premiums.”
Reduced healthcare premiums,
including tobacco-free discounts, under a HIPAA-Compliant wellness program
Cash rewards
74.6%
22.5%
31.0%
15.5%

SECTION 2: SELECTION & MANAGEMENT
PPI Benefit Solutions 2017 Nonprofit Employee Benefits Survey 8
Benefits Program ObjectivesWhen selecting benefit plans, 90.6% of survey participants said that “controlling costs” was very to extremely important to them. “Reducing administrative costs” and “retaining employees” were also deemed very to extremely important by 84.2% and 83% of survey participants, respectively.
Extremely important
Veryimportant
Moderatelyimportant
Slightlyimportant
Not at all important
Controlling costs 60.1% 30.5% 7.8% 0% 0.6%
Retaining employees 41.8% 41.2% 14.5% 1.8% 0.6%
Reducing benefit administration costs 41.2% 43% 13.3% 2.4% 0%
Increasing employee job satisfaction 32.1% 48.5% 17.6% 1.8% 0%
Attracting employees 34.3% 41.6% 20.5% 2.4% 1.2%
Providing benefit options that are
easy for employees to understand36.1% 38.6% 21.1% 4.2% 0%
Addressing employees’ diverse needs 32.1% 42.4% 23% 2.4% 0%
Increasing employee productivity 34.8% 37.8% 21.3% 6.1% 0%
Encouraging healthy lifestyles 34.5% 32.7% 27.3% 4.8% 0.6%

SECTION 2: SELECTION & MANAGEMENT
PPI Benefit Solutions 2017 Nonprofit Employee Benefits Survey 9
The two most challenging factors when providing employee benefits relate to cost. 83.6% of survey participants rated “cost to nonprofits” very to extremely challenging, and 74.4% of survey participants rated “cost to employees” very to extremely challenging. These are consistent with 2016 Survey results.
One notable increase over 2016 results was the “employee resistance to change” result, which went from 36.9% of survey participants rating it very to extremely challenging in 2016 to 48.8% rating it that way in 2017.
Benefits Program Challenges
Extremely challenging
Very challenging
Moderately challenging
Slightly challenging
Not at all challenging
Cost to nonprofit 47.6% 36% 14% 1.8% 0.6%
Cost to employees 37.8% 36.6% 19.5% 3% 3%
Plan design/quality of benefits & networks 21.8% 36.4% 33.9% 5.5% 2.4%
Administrative burden 12.2% 31.1% 37.2% 14% 5.5%
Employee education and communication 12.7% 24.2% 39.4% 20.6% 3%
Competition for talent 12.9% 23.3% 41.7% 15.3% 6.7%
Compliance with state & federal regulations 15.2% 20.6% 30.9% 21.8% 11.5%
Employee resistance to change 16.5% 32.3% 30.5% 14% 6.7%
Healthcare reform implementation 16.5% 26.2% 36.6% 4.8% 4.9%
Selecting plans that meet the needs of our diverse employee population
18.4% 30.7% 36.2% 11% 3.7%

SECTION 2: SELECTION & MANAGEMENT
PPI Benefit Solutions 2017 Nonprofit Employee Benefits Survey 10
Cost-Saving Strategies in Response to Rising CostsThe top three cost-saving strategies that surveyed nonprofit employers have implemented or plan to implement this year are “creating wellness incentives” (60% - up from 20.7% in 2016), “increasing employee contributions” (59.4% - up from 42.2% in 2016), and “offering a high deductible medical plan (HDHP),” (52.4% - statistically unchanged from 2016). Rounding out the least implemented strategies are “moving to a private exchange,” “offer coverage through an Accountable Care Organization (ACO), and “offer a Minimum Value plan,” which are consistent with 2016 results.
Has been implemented
Plan to implement
this year
Plan to implement in next 3 years
Plan to implement at
some point
No plans to implement
Increase employee contributions 42.4% 17% 9.1% 14.5% 16.4%
Reduce or drop certain benefits 22.3% 12.7% 9.6% 13.3% 42.2%
Reduce or eliminate dependent coverage 14.7% 11.7% 4.9% 6.1% 62.6%
Offer a High Deductible Health Plan (HDHP) 43.3% 9.1% 7.9% 10.4% 29.3%
Extend our new hire waiting period 10.3% 9.7% 8.5% 7.9% 63.6%
Restrict eligibility for coverage 11.6% 10.4% 6.1% 7.3% 64.6%
Move to a private exchange marketplace 8% 8.6% 6.8% 13% 63.6%
Change to a defined contribution model (fixed contributions)
19.1% 8.6% 9.9% 17.9% 44.4%
Replace employer-paid benefits with volun-
tary benefits15.3% 13.5% 8.6% 16.6% 46%
Offer a “Minimum Value Plan” only 5.6% 8.6% 11.7% 11.7% 62.3%
Create wellness incentives 42% 18% 9.9% 23.6% 22.4%
Offer coverage through an Accountable Care Organization (ACO)
8% 8% 6.2% 8% 69.8%
SECTION 3: BENEFITS ADMINISTRATION
PPI Benefit Solutions 2017 Nonprofit Employee Benefits Survey 11
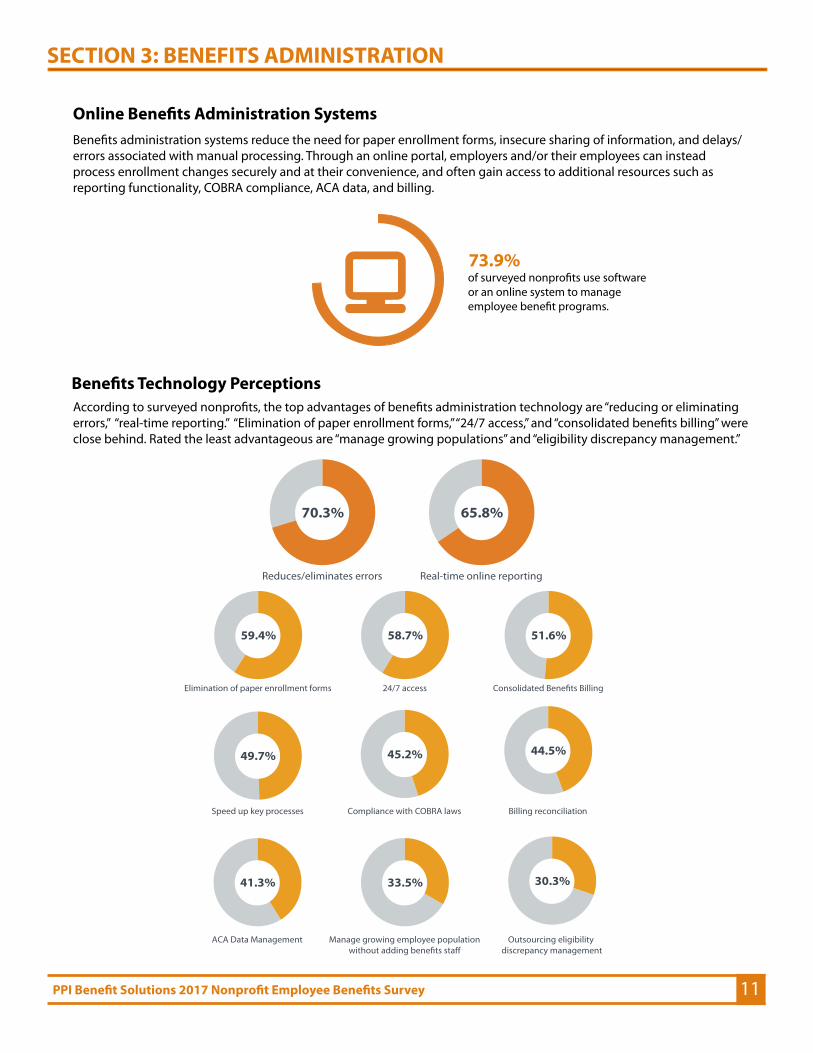
of surveyed nonprofits use software or an online system to manage employee benefit programs.
Online Benefits Administration Systems
Benefits Technology Perceptions
Benefits administration systems reduce the need for paper enrollment forms, insecure sharing of information, and delays/errors associated with manual processing. Through an online portal, employers and/or their employees can instead process enrollment changes securely and at their convenience, and often gain access to additional resources such as reporting functionality, COBRA compliance, ACA data, and billing.
According to surveyed nonprofits, the top advantages of benefits administration technology are “reducing or eliminating errors,” “real-time reporting.” “Elimination of paper enrollment forms,” “24/7 access,” and “consolidated benefits billing” were close behind. Rated the least advantageous are “manage growing populations” and “eligibility discrepancy management.”
73.9%73.9%
Reduces/eliminates errors
70.3%
Speed up key processes
49.7%
Compliance with COBRA laws
45.2%
Outsourcing eligibility
discrepancy management
30.3%
24/7 access
58.7%
Real-time online reporting
65.8%
Billing reconciliation
44.5%
ACA Data Management
41.3%
Elimination of paper enrollment forms
59.4% 51.6%
33.5%

SECTION 3: BENEFITS ADMINISTRATION
PPI Benefit Solutions 2017 Nonprofit Employee Benefits Survey 12
Enrollment MethodsPaper enrollment continues to be the most common enrollment method among surveyed nonprofits, but it’s down significantly from years past (74% in 2016). In 2016, only 19.9% of survey respondents reported use of an Online system to enroll their employees. In 2017, that number jumped to 44.6%.
The number of employers allowing employees to make their own benefit elections using an Online self-service portal also jumped from 25.5% in 2016 to 33.7% in 2017. This is the most significant increase since we began tracking use of employee self service in the 2013 survey.
25.3%
64.5%
44.6% 33.7%
22.3% 5.4% 1.2%
Employees complete apaper enrollment form
Employer uses an onlineenrollment system to
enroll employees
Employees use an onlineenrollment portral during
open-enrollment
Employees use an onlineenrollment portal to make
life-event changes
Automatic Enrollment: new employees automaticallyenrolled with opt-out ability
Telephonic

Employee Self-Service Implementation
SECTION 3: BENEFITS ADMINISTRATION
PPI Benefit Solutions 2017 Nonprofit Employee Benefits Survey 13
Withing the next two years, 54.2% of nonprofit employers surveyed plan to ditch paper enrollment forms and allow employees to elect benefits through an online enrollment portal.
Group meetings are still the most popular method of communicating benefits information to employees, followed by enrollment brochures and materials, one-on-one meetings and through email.
Educating Employees about their Benefits
Within the current year
In the next 2 years
I would like to butdo not know when
32.5%
21.7%
30.1%
15.7%
37.2% 11.5% 7.7%
50%
6.4%16%
78.2%Group meetings
Online decisionsupport tools
Mobile App
Text messages
61%Enrollment brochures/
materials
50.6%One-on-one In person
meetings

ACA Compliance AssistanceMost surveyed nonprofit employers use either their benefits administration provider/TPA or their payroll provider to assist with ACA reporting, while a relatively significant percentage handle it internally.
The biggest concerns surveyed participants expressed with regard to IRS ACA Reporting is Understanding the IRS codes, followed by “understanding who does what,” collecting data from plans not administered” (unions and aggregated employer groups) and “understanding their options.”
Concerns with IRS Sections 6055/6056 Reporting
We handle it In-house
Insurance broker, agent, or consultant
ACA services vendor
HR consultant
Payroll vendor
24.1%
17.7%
13.5%
3.5%9.9%
23.4%
7.8%
SECTION 3: BENEFITS ADMINISTRATION
PPI Benefit Solutions 2017 Nonprofit Employee Benefits Survey 14
Data quality
Expense
Understanding IRS codes
Understanding who does what
Data security
7.8%
7.8%
7.0%
20.2%
6.2%18.6%
15.5%
17.1%

SECTION 4: PLAN FUNDING & CONTRIBUTIONS
PPI Benefit Solutions 2017 Nonprofit Employee Benefits Survey 15
Medical Plan Funding
Medical Contribution StrategyThe majority of surveyed nonprofits (nearly 55.9%) use a percentage of premium contribution strategy for medical plans. 36.6% contribute a fixed dollar amount (defined contribution) for the purchase of medical benefits, which is an increase of nearly 9% over 2016. The remaining 7.5% contribute a fixed amount, or a defined contribution, for medical and dental and/or ancillary.
Additional contribution details show that 30.8% of employers surveyed use a four-tier rate structure (employee only, employee plus spouse, employee plus child(ren), employee plus family, or some variation thereof ), and slightly fewer than 30% use contributions that vary by hours worked.
Percentage of premium
Fixed dollar amount that can be used for the purchase of medical PLUS dental and/or ancillary
Fixed dollar amount for medical only
Level-Funded
Self-InsuredFully-Insured
20.4%
11.5%
68.2%
55.9%36.6%
7.5%
Based on compensation
or position
Based on hours
worked
Varies by plan type
Twocontribution
tiers
Threecontribution
tiers
Four contribution
tiers
Nodependent
contricution
Based on years of service
10.7%
18.9%
28.3%
25.2%
11.3%
16.4%
13.2%
30.8%
3%
Onecontribution
tier

SECTION 4: PLAN FUNDING & CONTRIBUTIONS
PPI Benefit Solutions 2017 Nonprofit Employee Benefits Survey 16
Defined Contribution Strategy Nearly half of nonprofit employers who use a defined contribution strategy most often contribute a fixed dollar amount by dependent tier, followed by an equal, flat amount for all employees, regardless of dependents covered. Only about 20% offer separate contributions for medical coverage versus other benefits.
Equal fixed dollar amount for all employees
Fixed dollar amount by dependent tier
Separate contributions for medical and other benefits
Interestingly, more employers, 75%, use a defined contribution for the dental benefit, as opposed to the medical at 58.3%.
We also asked survey participants who currently use a defined contribution funding strategy to describe how their contributions are structured:
Some coveragesremain 100%
employer-paid
Employees who waivemedical can use
the full contribution for thepurchase of benefits
Employees whowaive medicalforfeit the fullcontribution
Any unusedemployer contributions
are forfeitedby the employee
Employees retainany unused credit
(i.e. cash out, apply to 401(k),
etc.)
Employees whowaive medical receivea reduced employer
contribution that can beused to purchase other
benefits
75% 58.3% 25% 25%MedicalDental Voluntary ProductsAncillary
41.9%
14.5%
38.7%
8.1%
27.4%
8.1%
31.8%
48.5%
19.7%

SECTION 4: PLAN FUNDING & CONTRIBUTIONS
PPI Benefit Solutions 2017 Nonprofit Employee Benefits Survey 17
MONTHLY Employee Payroll Deduction for the Medical Plan with the Most Enrolled Participants
Most survey participants selected $50 to $100 for the employee-only monthly payroll deduction, virtually unchanged from 2015 and 2016 (33.9% to 32%).
NoneLess than $50
$50 to $100
$101 to
$150
$151 to
$200
$201 to
$250
$251 to
$300
$301 to
$400
$401 to
$500
$501 to
$600
$600 to
$750
More than $750
Employee Only 13.6% 15.9% 31.8% 22.7% 8% 5.7% 1.1% 0% 0% 0% 0% 1.1%
Employee plus spouse
13.3% 7.2% 13.3% 12% 16.9% 8.4% 6% 13.3% 4.8% 4.8% 0% 0%
Employee plus children
10.7%% 3.6% 16.7% 14.3% 7.1% 14.3% 13.1% 11.9% 3.6% 4.8% 0% 0%
Family 11.3%% 7.5% 7.5% 12.5% 10% 8.8% 12.5% 0% 8.8% 11.3% 0% 10%

SECTION 4: PLAN FUNDING & CONTRIBUTIONS
PPI Benefit Solutions 2017 Nonprofit Employee Benefits Survey 18
ANNUAL Percentage of Premium Employer Contribution for the Medical Plan with the Most Enrolled Participants
Employee Only
Employee Plus Spouse
Employee Plus Family
Employee Plus Child(ren)
Lessthan 25%
25% to40%
41% to55%
56% to70%
71% to85%
86% to99%
100%
Lessthan 25%
25% to40%
41% to55%
56% to70%
71% to85%
86% to99%
100%
Lessthan 25%
25% to40%
41% to55%
56% to70%
71% to85%
86% to99%
100%
Lessthan 25%
25% to40%
41% to55%
56% to70%
71% to85%
86% to99%
100%
18.3%
19.5%
12.8%
13.8%
20%15%
20%17.5%
7.5% 6.3%
24.4%
15.4% 16.7% 17.9%
7.7%5.1%
22.1%
14.3% 15.6% 16.9%
6.5% 5.2%
14.6%9.8% 11%
30.5%
9.8% 6.1%

Funding of Non-Medical Benefits
Life insurance and disability are most often 100% employer-paid, while dental and vision are mostly cost-shared.
Do not offer Paid in full by employer
Cost shared by employer and
employee
Employer-paid base plan with
employee buy-up options
Employee-paid (voluntary)
Dental 10.2% 19.8% 57.5% 5.4 7.2%
Life Insurance 4.2% 57% 20% 12.1% 6.7%
Long-term disability (LTD)
12.7% 47.9% 20% 7.3% 12.1%
Short-term disability (STD)
12.7% 44.8% 21.2% 6.1% 15.2%
Vision 19% 14.7% 41.1% 5.5% 19.6%
Average Annual Employer Contribution to the HSA, HRA, and/or HRP
$0 Up to $49 $50 to $99
$100 to $199
$200 to $499
$500 to $699
$700 to $999
$1,000 to $1,500
More than
$1,500
Health Savings Account (HSA) 18% 4% 10% 10% 18% 16% 10% 10% 4%
Health Reimbursement Account (HRA)
10% 8% 6% 10% 12% 6% 4% 20% 22%
Health Reimbursement Plan (HRP)
15% 3% 21% 15% 9% 18% 3% 0% 3%
SECTION 4: PLAN FUNDING & CONTRIBUTIONS
PPI Benefit Solutions 2017 Nonprofit Employee Benefits Survey 19

SECTION 4: PLAN FUNDING & CONTRIBUTIONS
PPI Benefit Solutions 2017 Nonprofit Employee Benefits Survey 20
ANNUAL Fixed Dollar Employer Contribution for the Medical Plan with the Medical Plan with the Most Enrolled Participants
Employee Only
Employee Plus Spouse
Employee Plus Family
Employee Plus Child(ren)
Less than$5,000
$,5000 to$5,999
$6,000 to$6,999
$7,000 to$7,999
$8,000 to$8,999
$9,000 to$9,999
$10,000 to$11,999
$12,000 to$13,999
$14,000 to$15,999
$16,000or more
$16,000or more
$16,000or more
$16,000or more
Less than$5,000
$,5000 to$5,999
$6,000 to$6,999
$7,000 to$7,999
$8,000 to$8,999
$9,000 to$9,999
$10,000 to$11,999
$12,000 to$13,999
$14,000 to$15,999
Less than$5,000
$,5000 to$5,999
$6,000 to$6,999
$7,000 to$7,999
$8,000 to$8,999
$9,000 to$9,999
$10,000 to$11,999
$12,000 to$13,999
$14,000 to$15,999
Less than$5,000
$,5000 to$5,999
$6,000 to$6,999
$7,000 to$7,999
$8,000 to$8,999
$9,000 to$9,999
$10,000 to$11,999
$12,000 to$13,999
$14,000 to$15,999
16%
14.3%
12.8%
8.2%
22%
10.2%
17%
16.3%
18%
24.5%
12.8%
20.4%
8%
6.1%
10.6%
6.1%
12%
4.1%
6.4%
4.1%
6%
4.1%
2.1%
2.0%
10%
12.2%
12.8%
8.2%
2% 2%
8.2%
10.6%
4.1%
4%
6.1%
6.4%
24.5%
10.2%
8.5%
6.1%

SECTION 4: PLAN FUNDING & CONTRIBUTIONS
PPI Benefit Solutions 2017 Nonprofit Employee Benefits Survey 21
ANNUAL Fixed Dollar Employer Contribution for the purchase of ALL insurance products (medical, dental, ancillary)
Employee Only
Employee Plus Spouse
Employee Plus Family
Employee Plus Child(ren)
Less than$5,000
$,5000 to$5,999
$6,000 to$6,999
$7,000 to$7,999
$8,000 to$8,999
$9,000 to$9,999
$10,000 to$11,999
$12,000 to$13,999
$14,000 to$15,999
$16,000or more
22.2% 22.2% 22.2%
0%
11.1% 11.1% 11.1%
0%
Less than$5,000
$,5000 to$5,999
$6,000 to$6,999
$7,000 to$7,999
$8,000 to$8,999
$9,000 to$9,999
$10,000 to$11,999
$12,000 to$13,999
$14,000 to$15,999
$16,000or more
20%
30%
18.2%
9.1%
10% 10% 10% 10% 10%
0%0% 0%
0% 0%
Less than$5,000
$,5000 to$5,999
$6,000 to$6,999
$7,000 to$7,999
$8,000 to$8,999
$9,000 to$9,999
$10,000 to$11,999
$12,000 to$13,999
$14,000 to$15,999
$16,000or more
9.1% 9.1%
0%
27.3%
18.2%
9.1% 9.1% 9.1%
0%
36.4%
18.2%
0% 0%
9.1% 9.1%
0%0%
9.1%
Less than$5,000
$,5000 to$5,999
$6,000 to$6,999
$7,000 to$7,999
$8,000 to$8,999
$9,000 to$9,999
$10,000 to$11,999
$12,000 to$13,999
$14,000 to$15,999
$16,000or more

SECTION 5: PLAN DETAILS
PPI Benefit Solutions 2017 Nonprofit Employee Benefits Survey 22
Medical EligibilityThe majority of surveyed nonprofits require employees to work 30 hours per week in order to be eligible for medical benefits. The number of surveyed employers who require employees to work more than 30 hours per week to be eligible for benefits has increased over last year, which, depending on the size of the employer, may not comply with ACA requirements.
2017 2016
Hours employees must work per week to be eligible for medical benefits
11.1%
59.8%
9.5%
18.6%
1.0%
More than 30hrs/wk
30 hrs/wk21 to 29hrs/wk
20 hrs/wkLess than 20hrs/week
Medical Waiting Period
1.9% of surveyed nonprofits use a medical waiting period of first of the month after 90 days, a .9% increase from 2016. This is noted because, under the ACA and in the absence of a bona-fide orientation period, a group health plan may not apply any waiting period that exceeds 90 days.
Date ofhire
Date ofhire
First of themonth following
date of hire
First of themonth following
date of hire
30 daysfrom date
of hire
30 daysfrom date
of hire
First of themonth after
60 days
First of themonth after
60 days
60 daysfrom date
of hire
60 daysfrom date
of hire
90 daysfrom date
of hire
90 daysfrom date
of hire
First of themonth after
90 days
First of themonth after
90 days
First of themonth after
30 days
First of themonth after
30 days
Employer-Paid Life Waiting Period
3.2%
16.1%
20.1%
19.9%
17.9%
11.8% 11.8% 11.8%
12.7%8.2%
6.8%
5.2%
1.9%
6%9.7%
19%
16.4%
15.8% 12%
43.7%
25.3%
(May not be compliant with
the ACA)

SECTION 5: PLAN DETAILS
PPI Benefit Solutions 2017 Nonprofit Employee Benefits Survey 23
In-Network Primary Care Physician (PCP) and Specialist Copayment Amounts for the Medical Plan with the Most Enrolled Participants
15.0%
21.3%
13.3%
31.3%
16.4%
15.6%
4.7%
0.8%
3.1%
4.7%
16.5%
33.9%
0.8%
7.0%
3.9%
11.7%
23.6%
8.5%
16.9%
26.7%
15.8%
8.5%
4.1%
5.3%
5.9%
33.7%
34.9%
16.0%Less than $20
$20 to $25
$30 to $35
$40 to $45
$50 to $55
More than $60
Less than $20
$20 to $25
$30 to $35
$40 to $45
$50 to $55
More than $60
PCP Copay: Specialist Copay:
PCP Coinsurance:
In-Network Primary Care Physician (PCP) and Specialist Coinsurance Amounts for the Medical Plan with the Most Enrolled Participants
Specialist Coinsurance:
Less than 10%
10% to 15%
20% to 25%
30% to 35%
40% to 45%
50% to 55%
60% to 65%
70% or more
Less than 10%
10% to 15%
20% to 25%
30% to 35%
40% to 45%
50% to 55%
60% to 65%
70% or more

SECTION 5: PLAN DETAILS
PPI Benefit Solutions 2017 Nonprofit Employee Benefits Survey 24
Annual, In-Network Deductible for the MEDICAL PLAN with the Most EnrolledParticipants
12.4%
13.7%
8.7%
12.6%4.9%
16.5%
26.2%
8.7%
13.9%
31.3%
15.7%
21.7%
27.2%
8.0%
9.5%
15.9%
24.9%
8.2%
20.7%14.9%
11.8%
6.6%
27.3%
12.6%
19.8%22.3%
6.5%
16.3%
40.0%
PPO POS HMO Indemnity EPO
$0
$1 to $999
$1,000 to $2,499
$2,500 to $3,999
$4,000 to $5,499
$5,500 or more
Annual Deductibles for the DENTAL PLAN with the Most Enrolled Participants
$1 to $4919.4%
$1 to $4919.4%
$011.0%
$200 to $2995.4% $300
or more10.0% $0
22.2%
$100 to $19914.4%
$50 to $9926.3%
$50 to $9928.4%
$100 to $19920.0%
$200 to $29916.5%
$300or more14.8%
In-Network Out-of-Network
11.1%

SECTION 5: PLAN DETAILS
PPI Benefit Solutions 2017 Nonprofit Employee Benefits Survey 25
30-day Supply (Retail) Coinsurance Amounts for the Prescription Drug Plan with the Most Enrolled Participants
30-day Supply (Retail) Copayment Amounts for the Prescription Drug Plan with the Most Enrolled Participants
0%
10%
20%
30%
40%
50%
60% $100 or more$90 to $99$80 to $89$70 to $79$60 to $69$50 to $59$40 to $49$30 to $39$20 to $29$10 to $19Less than $10Not applicable
Specialty DrugsFourth-tier drugsThird-tier drugs (often called
non-preferred/non-formulary)
Second-tier drugs (often called
preferred/formulary)
First-tier drugs (often called generics)
0%
10%
20%
30%
40%
50%
60%
Specialty DrugsFourth-tier drugsThird-tier drugs (often called non-preferred
/non-formulary)
Second-tier drugs (often called preferred/formulary)
First-tier drugs (often called generics)
90% to 100%80% to 89%70% to 79%60% to 69%50% to 59%40% to 49%30% to 39%20% to 29%10% to 19%Less than 10%Not applicable

The 2017 Nonprofit Employee Benefits Survey was conducted over a period of six weeks, beginning March 6, 2017 and ending April 28, 2017. A total of 236 responses were collected.
OVERVIEW OF SURVEY PARTICIPANTS
PPI Benefit Solutions 2017 Nonprofit Employee Benefits Survey 26
Nonprofit LocationsThe large majority of surveyed nonprofits are located in eastern states, with over 60% in the northeast and mid-Atlantic states and over 10% in the southeastern states.
Company SizeOne quarter of surveyed nonprofits have between 20 to 49 employees, and nearly one-quarter have between 200 to 500 employees. Nearly half, or 42.5% participants have between 50 to 199 employees. A small percentage of respondents have over 500 employees.
More than 500200 to 500
50 to 199
20 to 49
26.3%
42.5%
22.8%
8.4%
6.0%10.2% 61.1%
10.8%4.2%
Northeast
Southwest
South
Midwest
West

OVERVIEW OF SURVEY PARTICIPANTS
PPI Benefit Solutions 2017 Nonprofit Employee Benefits Survey 27
Nonprofit Classifications
Participant Job Title
Nearly one quarter of surveyed nonprofits are classified as human services, while 9% are classified as religious organizations and 6% as education.
The majority of surveyed participants (71.4%) are classified as 501(c)(3) - Charitable Organizations (Public Charity or Private Foundation).
14.3%
28.7%
5.8%5.4%
4.5%
18.4%
9.4%
13.5%
Over one fourth of survey responses were submitted by human resources managers, directors and coordinators, while around 18% were submitted by a program managers, directors and coordinators.
Executive Director/President/CEO/Managing Director
HR Manager/Director/Coordinator
Benefits Manager/Director/Coordinator
CFO/Controller/Director of Finance
COO/Operations Director/Manager
Program Manager/Director/Coordinator
Office Manager
Other
*Fewer than 5% of surveyed 501(c) organizations included: animal-related, arts, culture & humanities, community improvement & capacity building, crime & legal related, housing & shelter, employment, environment, international/foreign affairs/national security, medical research, mental health & crisis intervention, mutual & membership benefit, public & societal benefit, public safety/preparedness/relief, recreation/sports, science & technology, social science, and youth development.
Education
Healthcare
Civil Rights, Social Action, & Advocacy
Human Services
Religious Organizations
Other*
30%
9%
23.4%
5.4%9.6%
10.8%

ABOUT PPI BENEFIT SOLUTIONS
PPI Benefit Solutions 2017 Nonprofit Employee Benefits Survey 28
Inspired by the compassion and insight of our founder, Moses Malkin, PPI Benefit Solutions has a passion for helping nonprofit organizations access employee benefit programs that meet their unique fiscal and management needs. Professional Pensions, Inc. was founded in the 1960s as an innovator of insurance needs nonprofit organizations through the Association of Community Service Agencies (ACSA) Trust, and the group insurance needs of corporate companies through the Boston Insurance Employee Benefit Trust (BIEBT). The company has since evolved to become PPI Benefit Solutions, and has expanded its services to include online benefits administration and technology services. In May, 2007, PPI was purchased by NFP Corp., expanding its spectrum of benefits, HR and compliance services.
As the employee benefit market continues to evolve and pose new and greater challenges, PPI will continue its mission to deliver innovative insurance solutions that address the needs of the nonprofit sector.
For more information, visit www.ppibenefits.com.
Who We Are
PPI’s nonprofit clients view us as an extension of their human resources department, freeing up valuable time to perform other job functions more vital to their community mission.
Working exclusively through benefit brokers, PPI provides powerful, web-based technology to deliver a single solution for multiple carrier enrollments and eligibility processing (including online enrollment and employee self-service), electronic eligibility data and discrepancy management, consolidated premium billing, COBRA Administration, ACA Services, and member advocacy services.
PPI Benefit Solutions, with a home office in Wallingford, Connecticut, has a core team of experienced professionals with an average of 18 years of experience to meet the ever-changing needs of the employer marketplace. We provide the brokerage and employer communities with a wealth of experience through our diverse backgrounds in business management and development, information technology, client services, financial underwriting, compliance, marketing, and HR and benefits administration.
• We are committed to upholding the highest standards of integrity and honesty in our business.• We strive to fully understand each client’s objectives, and offer state of the art solutions. • We communicate clearly and openly. • We respond timely, supportively and efficiently.• We adhere to strict security and compliance standards.
Our Services