Nonnative species and the stability of desert fish communities

Article
Nonnative English Speaker Performance on the BasicEnglish Lexicon (BEL) SentencesStacey Rimikis,a Rajka Smiljanic,b and Lauren Calandruccioa
Purpose: The purpose of this study was to examinesentence-recognition performance for a large, diverse groupof nonnative speakers of English on the recently developedBasic English Lexicon (BEL) sentence materials and todetermine whether BEL sentence lists are equated in difficultyfor this population.Method: The BEL sentences were presented to 102nonnative speakers of English with normal hearing and variedlinguistic and cultural backgrounds. Five hundred sentenceswere presented mixed with noise spectrally matched to thetarget sentences. Subjects completed an online questionnaireproviding detailed demographic and linguistic information.Listeners’ spoken English proficiency was also assessedusing the Versant English Test (Pearson Education, 2010).
Results: Nonnative listeners showed equal word-recognitionperformance for 3 groups of BEL sentence lists, each groupcontaining sentence lists that had equivalent difficulty.In addition, spoken language proficiency and severaldemographic and linguistic factors were significantlycorrelated with BEL performance.Conclusion: The BEL sentence materials have been testedon a large cohort of nonnative speakers of English and havebeen found to be appropriate for use in speech-perceptiontesting with this population.
Key Words: speech perception, audiology, cultural andlinguistic diversity
The number of nonnative speakers of English residingin the United States has increased steadily over thepast three decades (U.S. Census Bureau, 2007).
The American Speech-Language-Hearing Association hasacknowledged this increase in cultural and linguistic diversitywithin the population, and the subsequent need for evidence-based practice to address this population’s unique needs(American Speech-Language-Hearing Association [ASHA],2011). With this increase in linguistic diversity, audiologistsand speech-language pathologists are faced with the task offinding effective tools to serve individuals from culturallyand linguistically diverse backgrounds. Despite the growingneed for test materials that would be appropriate for use withnonnative speakers, materials that take into account thespecific linguistic needs of this population remain scarce.With the goal of addressing this gap in availability ofappropriate test materials for diverse groups of nonnative(as well as native) speakers of English, Calandruccio andSmiljanic (2012) recently developed new sentence-recognition
materials, the Basic English Lexicon (BEL) sentences.Listening-in-noise results for native-English-speaking listenerswith normal hearing indicated similar performance across alarge set of BEL sentence lists. The main goal of this studywas to examine speech-in-noise performance using the BELsentences for a large, diverse cohort of nonnative Englishlisteners. In addition, we explored how BEL sentence-in-noiseperformance correlates with listener demographic andlinguistic backgrounds. In doing this, we were able to showthat BEL sentences are appropriate for use with speakers of awide range of linguistic backgrounds and levels of proficiency.
Although the comprehension of speech in noise is adifficult task in general, past studies have shown that thistask becomes even more challenging when the target speechis in a language not native to the listener (e.g., Bradlow &Pisoni, 1999; Takata & Nabelek, 1990). Less accurate speechrecognition in noise has been demonstrated by nonnativeEnglish speakers in comparison to native speakers, evenwhen the listener has a high level of English proficiency andhas been speaking the language for a significant amount oftime (Bergman, 1980; Mayo, Florentine, & Buus, 1997).Due to relatively poorer performance, speech audiometrybecomes problematic in the assessment of nonnative speakersof English. The main difficulty arises from an inability todistinguish what role auditory impairment as opposed tolinguistic inexperience plays in poor performance. Speech-recognition testing is a critical part of the audiological testingbattery that provides valuable information about the natureof a person’s hearing loss and how it affects individual
aQueens College of the City University of New York, FlushingbUniversity of Texas, Austin
Correspondence to Lauren Calandruccio:
Editor: Sid Bacon
Associate Editor: Eric Healy
Received June 7, 2012
Accepted September 28, 2012
DOI: 10.1044/1092-4388(2012/12-0178)
792 Journal of Speech, Language, and Hearing Research N Vol. 56 N 792–804 N June 2013 N � American Speech-Language-Hearing Association

communicative functioning. Unfortunately, many audio-logists omit speech-recognition testing when working withsubjects from linguistically diverse backgrounds (ASHA,2004). If speech-recognition testing is to be included in thetest battery for nonnative speakers of English, clinicians havetwo options: (a) test the listeners using recognition materialsin the listener’s native language or (b) use English recognitionmaterials.
Recently, the Hearing in Noise Test (HINT; Nilsson,Soli, & Sullivan, 1994), which was originally designed forclinical use with native speakers of English, has beenmodified for use with several different languages, such asCantonese, Mandarin, and Japanese (see Soli & Wong, 2008,for a description). Although these new materials provideclinicians with an alternative to English-recognition testing,several problems persist. Language-specific materials formany languages have yet to be created, and the language-specific materials that have been created may not be readilyavailable in all testing centers. Furthermore, in order toaccurately score these materials, the tester must be func-tionally proficient in the given language or have access toan interpreter who understands proper scoring for speech-recognition testing. Because the majority of audiologists inthe United States provide only monolingual services in theclinic (ASHA, 2000), most clinicians report using interpreterswhen serving linguistically diverse populations (ASHA,2004). This can be problematic if the interpreters are nottrained to administer speech-recognition testing and ratherserve only as direct translators, adding an element ofunreliability to results. Finally, many people who immigrateto the United States use English as their primary language ofcommunication even though it is not their native language,and they are likely to experience their communicationdisorder in English. Therefore, testing in English mayprovide a greater level of ecological validity than native-language testing for nonnative individuals who communicateon a day-to-day basis in English.
Testing sentence recognition in English for nonnativespeakers, however, gives rise to a separate set of challenges.Foremost, available recognition materials may be linguisti-cally biased for nonnative speakers of English due tounfamiliar vocabulary and complex grammatical structures(see Bradlow & Alexander, 2007). In addition, similar tolisteners with hearing loss, nonnative speakers of English are avery heterogeneous group. No two experiences learningEnglish are exactly the same, and the inherent differencesin linguistic and demographic experience that make upan individual’s background can create large variations inperformance. A large body of second-language-learningliterature has identified a host of factors that may impactadult learners’ ability to attain nativelike levels in second-language (L2) speech production and perception (e.g.,Bialystok & Hakuta, 1999; Flege, 1995; Flege et al., 2006;Flege, Yeni-Komshian, & Liu, 1999; MacKay, Flege, & Imai,2006; Piske, MacKay, & Flege, 2001; Smiljanic, 2012). Thesestudies underscore the importance of better understanding therole of linguistic variables, such as the age of acquisition ofL2, length of residence in L2-speaking country, relative
amount of native language (L1) and L2 use, quantity andquality of input from native L2-speakers, motivation, socialstigma associated with speaking with an accent, and so forth.These environment- and learner-related parameters contri-bute to the difficulty in interpreting the results of Englishspeech-recognition tests of nonnative English speakers.
In order tomove toward inclusion of speech-recognitiontesting as a standard part of the audiological test batteryfor the nonnative English speaker, there is a strong need tobetter understand English speech-in-noise recognition for thenonnative speaker of English. A crucial step toward this goalis the use of English speech-recognition materials that arelinguistically appropriate for nonnative speakers of English.To that end, Calandruccio and Smiljanic (2012) publisheda new corpus of sentence-recognition materials designedspecifically for use with nonnative speakers of English.A distinguishing factor in creating the BEL sentences incomparison to the other existing word-recognition materialswas that the BEL sentences were developed based onconversational samples, that is, the actual lexical items usedby 100 nonnative speakers of English. Language sampleswere collected using a set of predetermined, everydayconversational topics, such as travel or cooking. Theselanguage samples were analyzed in order to compile a lexiconof all unique words most commonly used across speakers.The lexicon was used in conjunction with simple syntacticframes to create 500 sentences, each containing fourkeywords (2,000 keywords total). These sentences weredivided into 20 lists of 25 sentences each, with lists beingrelatively equal on the following counts: number ofsyllables, number of high-frequency phonemes (fricativesand affricates), types of syntactic structures, and medianfrequency of keyword occurrence in the collected lexicon.
In an initial probe to determine equal list difficulty ofthe BEL sentence lists, Calandruccio and Smiljanic (2012)reported data for monolingual native speakers of Englishwith normal hearing. Listeners were presented all 20 lists inthe presence of spectrally matched noise at a fixed signal-to-noise ratio (SNR) of –5 dB. Results demonstrated similarspeech-in-noise performance for all but four sentence listpairs (see Calandruccio & Smiljanic, 2012, Table VII). Thatis, the majority of BEL lists showed equivalence of difficulty,suggesting that BEL test materials can be used to reliably testspeech recognition in native English speakers. It has beenreported that difficulty among sentence list materials mayvary depending upon the listening population (e.g., sentence-recognition materials that were equally difficult to oneanother for listeners with normal hearing were not equallydifficult for listeners with hearing loss; see Bilger, Nuetzel,Rabinowitz, & Rzeczkowski, 1984). Therefore, the next stepinvolves determining whether BEL sentence materials showequivalent difficulty across lists for nonnative listeners ofEnglish and would, therefore, be appropriate for use withthis diverse population. The purpose of the present study wasto test the difficulty of all 20 BEL sentence lists for a largecohort of nonnative English speakers with diverse linguisticand cultural backgrounds. Furthermore, we examined indetail how individual listeners’ linguistic experience and
Rimikis et al.: Nonnative Performance on the BEL Sentences 793
proficiency correlate with speech-in-noise performance onBEL sentences. This allowed us to assess whether BELsentences would be most appropriate for use with nonnativelisteners who have a certain linguistic profile.
Method
Participants
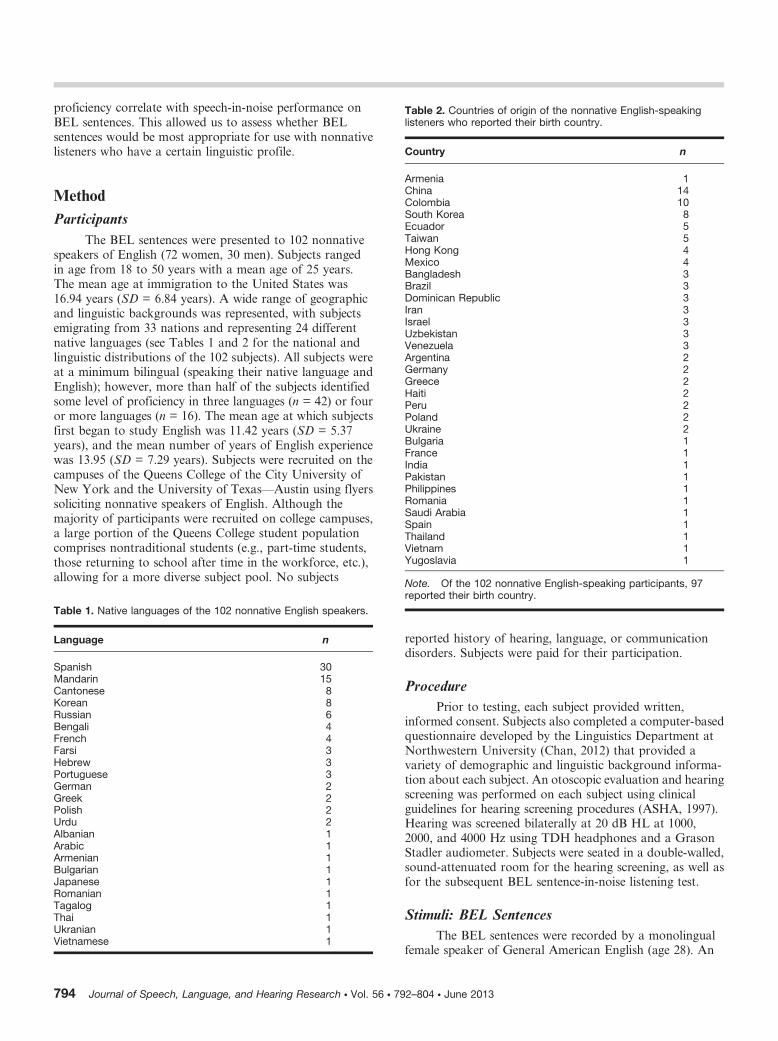
The BEL sentences were presented to 102 nonnativespeakers of English (72 women, 30 men). Subjects rangedin age from 18 to 50 years with a mean age of 25 years.The mean age at immigration to the United States was16.94 years (SD = 6.84 years). A wide range of geographicand linguistic backgrounds was represented, with subjectsemigrating from 33 nations and representing 24 differentnative languages (see Tables 1 and 2 for the national andlinguistic distributions of the 102 subjects). All subjects wereat a minimum bilingual (speaking their native language andEnglish); however, more than half of the subjects identifiedsome level of proficiency in three languages (n = 42) or fouror more languages (n = 16). The mean age at which subjectsfirst began to study English was 11.42 years (SD = 5.37years), and the mean number of years of English experiencewas 13.95 (SD = 7.29 years). Subjects were recruited on thecampuses of the Queens College of the City University ofNew York and the University of Texas—Austin using flyerssoliciting nonnative speakers of English. Although themajority of participants were recruited on college campuses,a large portion of the Queens College student populationcomprises nontraditional students (e.g., part-time students,those returning to school after time in the workforce, etc.),allowing for a more diverse subject pool. No subjects
reported history of hearing, language, or communicationdisorders. Subjects were paid for their participation.
Procedure
Prior to testing, each subject provided written,informed consent. Subjects also completed a computer-basedquestionnaire developed by the Linguistics Department atNorthwestern University (Chan, 2012) that provided avariety of demographic and linguistic background informa-tion about each subject. An otoscopic evaluation and hearingscreening was performed on each subject using clinicalguidelines for hearing screening procedures (ASHA, 1997).Hearing was screened bilaterally at 20 dB HL at 1000,2000, and 4000 Hz using TDH headphones and a GrasonStadler audiometer. Subjects were seated in a double-walled,sound-attenuated room for the hearing screening, as well asfor the subsequent BEL sentence-in-noise listening test.
Stimuli: BEL Sentences
The BEL sentences were recorded by a monolingualfemale speaker of General American English (age 28). An
Table 1. Native languages of the 102 nonnative English speakers.
Language n
Spanish 30Mandarin 15Cantonese 8Korean 8Russian 6Bengali 4French 4Farsi 3Hebrew 3Portuguese 3German 2Greek 2Polish 2Urdu 2Albanian 1Arabic 1Armenian 1Bulgarian 1Japanese 1Romanian 1Tagalog 1Thai 1Ukranian 1Vietnamese 1
Table 2. Countries of origin of the nonnative English-speakinglisteners who reported their birth country.
Country n
Armenia 1China 14Colombia 10South Korea 8Ecuador 5Taiwan 5Hong Kong 4Mexico 4Bangladesh 3Brazil 3Dominican Republic 3Iran 3Israel 3Uzbekistan 3Venezuela 3Argentina 2Germany 2Greece 2Haiti 2Peru 2Poland 2Ukraine 2Bulgaria 1France 1India 1Pakistan 1Philippines 1Romania 1Saudi Arabia 1Spain 1Thailand 1Vietnam 1Yugoslavia 1
Note. Of the 102 nonnative English-speaking participants, 97reported their birth country.
794 Journal of Speech, Language, and Hearing Research N Vol. 56 N 792–804 N June 2013
example of the BEL sentences (with keywords in capitalletters) is ‘‘The EGGS NEED MORE SALT.’’ The record-ings were made in a double-walled, sound-attenuated boothat a 44.1-kHz sampling rate with 16-bit resolution. Forfurther description of the development of these sentences andhow they were recorded, see Calandruccio and Smiljanic(2012).
All sentence files were root-mean-square (RMS)equalized to the same pressure level using Praat (Boersmaand Weenink, 2012). For sentence-recognition testing,all stimuli were controlled using Cycling 74’s MaxMSPcomputer software and were presented to the listeners viaEtymotic ER1 insert earphones. Sentences were presentedbinaurally in the presence of noise spectrally matched tothe long-term average spectra (LTAS) of the 500 targetsentences. The noise was generated in MATLAB by passinga Gaussian white noise through a finite impulse response(FIR) filter with a magnitude response equal to the LTAS of500 BEL sentences spoken by the target talker. The long-term average level of the sentences was fixed at 65 dB SPL,whereas the long-term average level of the noise was fixed at68 dB SPL, providing an SNR of –3 dB. The target sentenceand the noise masker were mixed in real time via theMaxMSP software interface. On each trial, one of the targetsentences was played with a random portion of the 60-snoise masker. The noise masker began 500 ms prior to thebeginning of the sentence and ended 500 ms after the end ofthe sentence. Subjects’ responses were recorded using a ShureSM81 cardioid-condenser microphone for offline scoring.
Subjects were told that they would hear a series ofsentences presented with noise and were instructed to try andignore the noise and repeat exactly what they heard followingeach sentence. In order to familiarize subjects with the taskas well as the voice of the talker, pretest sentences werepresented at gradually decreasing SNRs (three to fivesentences presented at each SNR of 3 dB, 0 dB, and –3 dB).Sentences used for familiarization were taken from theBamford-Kowal-Bench (BKB) sentences (Bench, Kowal, &Bamford, 1979) and were spoken by the same female talker.Following the pretest, subjects were presented with the BELsentence materials. Sentence-in-noise testing was conductedin two sessions. In each session, listeners heard 10 lists of theBEL sentences (25 sentences/list) presented in a randomlygenerated order, with sentences blocked by list. Subjects’responses were scored based on their response to the fourkeywords in each sentence (100 keywords/list). Criteria fora correct response involved a complete, accurate repetitionof a keyword, including morphological affixes. Twenty-fivepercent of subjects completed the two sessions on the sameday with a break between sessions. For the remainingsubjects, an average of 12 days passed between the completionof Sessions 1 and 2. If sessions were completed on separatedays, an otoscopic evaluation and warm-up were completedprior to the presentation of the second half of the BELsentence materials.
Following the completion of the second testing session,subjects completed the Versant English Test (Pearson),an automated assessment of spoken English proficiency
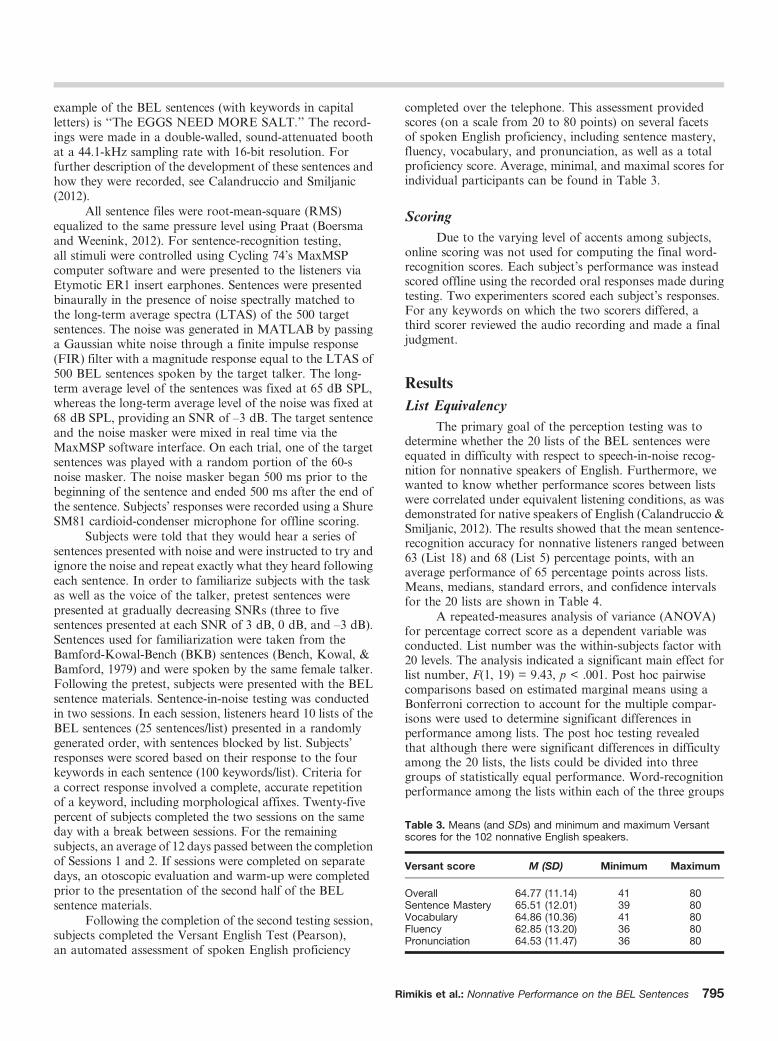
completed over the telephone. This assessment providedscores (on a scale from 20 to 80 points) on several facetsof spoken English proficiency, including sentence mastery,fluency, vocabulary, and pronunciation, as well as a totalproficiency score. Average, minimal, and maximal scores forindividual participants can be found in Table 3.
Scoring
Due to the varying level of accents among subjects,online scoring was not used for computing the final word-recognition scores. Each subject’s performance was insteadscored offline using the recorded oral responses made duringtesting. Two experimenters scored each subject’s responses.For any keywords on which the two scorers differed, athird scorer reviewed the audio recording and made a finaljudgment.
Results
List Equivalency
The primary goal of the perception testing was todetermine whether the 20 lists of the BEL sentences wereequated in difficulty with respect to speech-in-noise recog-nition for nonnative speakers of English. Furthermore, wewanted to know whether performance scores between listswere correlated under equivalent listening conditions, as wasdemonstrated for native speakers of English (Calandruccio &Smiljanic, 2012). The results showed that the mean sentence-recognition accuracy for nonnative listeners ranged between63 (List 18) and 68 (List 5) percentage points, with anaverage performance of 65 percentage points across lists.Means, medians, standard errors, and confidence intervalsfor the 20 lists are shown in Table 4.
A repeated-measures analysis of variance (ANOVA)for percentage correct score as a dependent variable wasconducted. List number was the within-subjects factor with20 levels. The analysis indicated a significant main effect forlist number, F(1, 19) = 9.43, p < .001. Post hoc pairwisecomparisons based on estimated marginal means using aBonferroni correction to account for the multiple compar-isons were used to determine significant differences inperformance among lists. The post hoc testing revealedthat although there were significant differences in difficultyamong the 20 lists, the lists could be divided into threegroups of statistically equal performance. Word-recognitionperformance among the lists within each of the three groups
Table 3. Means (and SDs) and minimum and maximum Versantscores for the 102 nonnative English speakers.
Versant score M (SD) Minimum Maximum
Overall 64.77 (11.14) 41 80Sentence Mastery 65.51 (12.01) 39 80Vocabulary 64.86 (10.36) 41 80Fluency 62.85 (13.20) 36 80Pronunciation 64.53 (11.47) 36 80
Rimikis et al.: Nonnative Performance on the BEL Sentences 795

was statistically equivalent. Group 1 included five lists: Lists4, 13, 15, 18, and 20. These lists were the most difficult of the20 lists, with mean performance ranging from 63 (List 18) to64 (List 20) percentage points. A second post hoc repeated-measures ANOVA indicated no significant differences inperformance among these five lists, F(1, 4) = 0.617, p = .650.Group 2 included 6 lists: Lists 3, 6, 12, 14, 16, and 19, withperformance ranging between 64 (List 16) and 65 (List 3)percentage points. A post hoc repeated-measures ANOVAconfirmed no significant differences in performance amongthese lists, F(1, 5) = 0.628, p = .678. Last, Group 3 included 9lists with best overall performance: Lists 1, 2, 5, 7, 8, 9, 10,11, and 17; mean performance ranged between 65.9 (List 8)and 67.9 (List 5) percentage points. A post hoc repeated-measures ANOVA confirmed no significant differences inperformance scores, F(1, 8) = 1.125, p = .343). Figures 1–3illustrate performance ranges for the 102 nonnative speakersof English across the 20 lists for the three list groups thatallowed for equivalent performance.
Linguistic Predictors of Performance
In the following analyses, we attempted to get a bettersense of a nonnative demographic for which the BELsentences would be most appropriate. That is, we examinedin detail which environment- and language background-related variables would serve as good predictors for BELsentence performance. We collected a detailed linguistichistory of all participants. Information was obtainedregarding the age the participant immigrated to the UnitedStates, the percentage of time daily spent speaking English,the number of years lived in the United States, the language
spoken in primary and secondary school (dichotomousreporting, English or other language), the language spoken athome (dichotomous reporting, English or other language),the number of years of English speaking experience, andthe age of English acquisition. All of these variables weresignificantly correlated with BEL performance (r range =–.248–.754, p < .001), except for years of English speakingexperience (r = .092, p = .193). The seven backgroundvariables that were significantly correlated with BELperformance as well as the participant’s overall performancescore on the Versant test of spoken language proficiencywere used as predictor variables in a multiple regressionanalysis to predict the criterion variable of overall BEL
Table 4. Mean and median performance on all 20 Basic EnglishLexicon (BEL) sentence lists for 102 nonnative English speakers withnormal hearing.
List M Median SE
95% CI
LL UL
1 66.91 67.50 1.36 64.25 69.582 67.02 67.00 1.37 64.33 69.713 65.21 68.00 1.54 62.18 68.234 62.87 62.50 1.39 60.15 65.605 67.92 68.00 1.34 65.30 70.556 64.31 63.00 1.56 61.25 67.387 66.92 68.50 1.51 63.97 69.888 65.99 65.50 1.40 63.25 68.739 66.91 69.00 1.44 64.09 69.7410 67.41 69.00 1.64 64.20 70.6211 66.84 66.00 1.39 64.13 69.5612 64.36 65.00 1.49 61.45 67.2813 62.62 63.50 1.43 59.81 65.4314 64.94 65.00 1.46 62.07 67.8115 62.70 62.50 1.32 60.11 65.2816 64.21 66.00 1.66 60.96 67.4517 67.74 67.00 1.28 65.23 70.2418 62.51 62.00 1.64 59.30 65.7219 65.10 66.50 1.43 62.29 67.9020 63.75 64.50 1.44 60.92 66.57
Note. CI = confidence interval; LL = lower limit; UL = upper limit.
Figure 1. Box plots for the 102 nonnative English-speaking, normal-hearing listeners for five BEL sentence lists: Lists 4, 13, 15, 18, and20 (Group 1). n.s. = nonsignificant statistical groupings.
Figure 2. Box plots for the 102 nonnative English-speaking, normal-hearing listeners for six BEL sentence lists: Lists 3, 6, 12, 14, 16, and19 (Group 2).
796 Journal of Speech, Language, and Hearing Research N Vol. 56 N 792–804 N June 2013
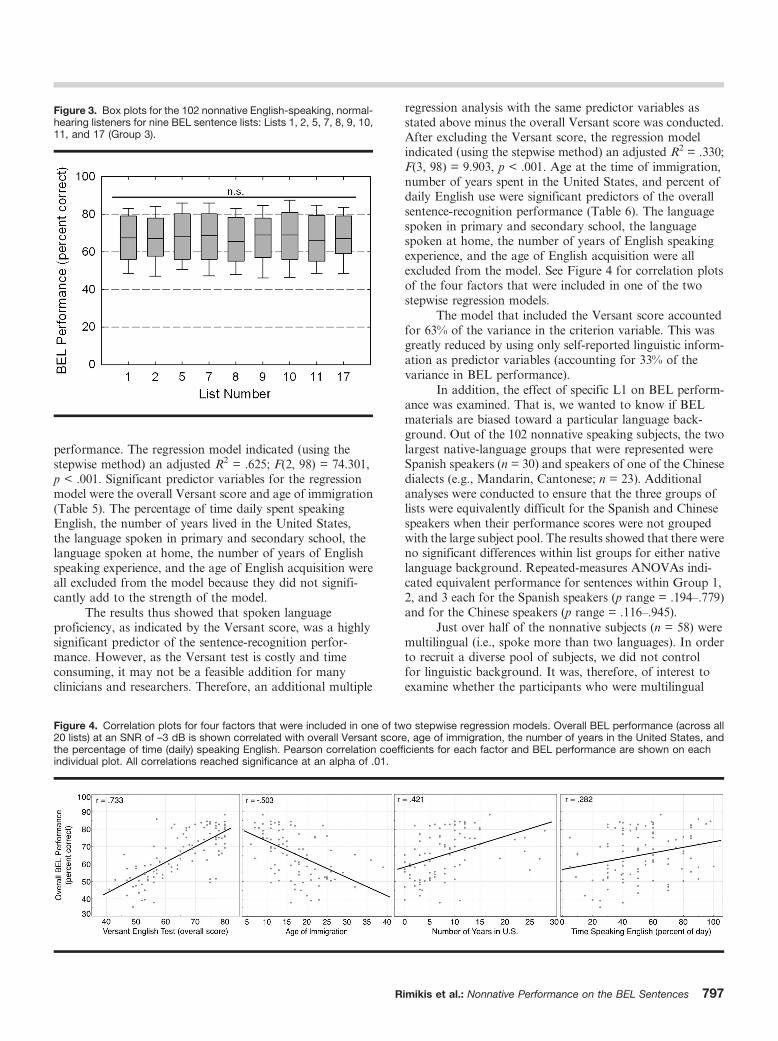
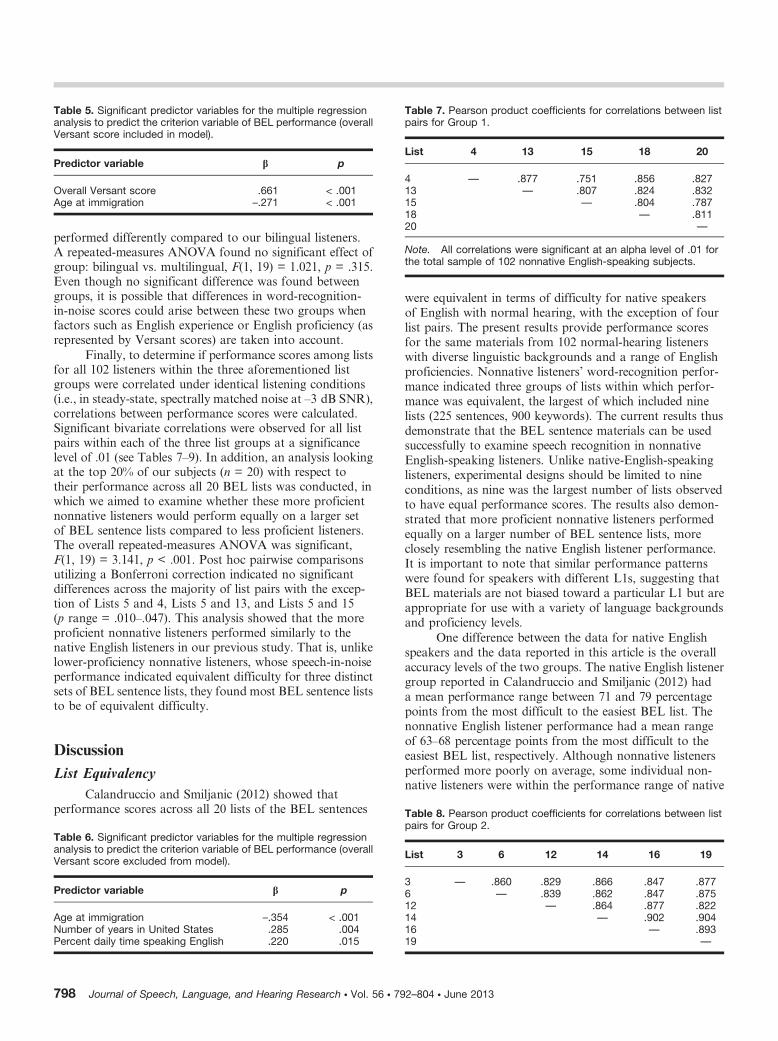
performance. The regression model indicated (using thestepwise method) an adjusted R2 = .625; F(2, 98) = 74.301,p < .001. Significant predictor variables for the regressionmodel were the overall Versant score and age of immigration(Table 5). The percentage of time daily spent speakingEnglish, the number of years lived in the United States,the language spoken in primary and secondary school, thelanguage spoken at home, the number of years of Englishspeaking experience, and the age of English acquisition wereall excluded from the model because they did not signifi-cantly add to the strength of the model.
The results thus showed that spoken languageproficiency, as indicated by the Versant score, was a highlysignificant predictor of the sentence-recognition perfor-mance. However, as the Versant test is costly and timeconsuming, it may not be a feasible addition for manyclinicians and researchers. Therefore, an additional multiple
regression analysis with the same predictor variables asstated above minus the overall Versant score was conducted.After excluding the Versant score, the regression modelindicated (using the stepwise method) an adjusted R2 = .330;F(3, 98) = 9.903, p < .001. Age at the time of immigration,number of years spent in the United States, and percent ofdaily English use were significant predictors of the overallsentence-recognition performance (Table 6). The languagespoken in primary and secondary school, the languagespoken at home, the number of years of English speakingexperience, and the age of English acquisition were allexcluded from the model. See Figure 4 for correlation plotsof the four factors that were included in one of the twostepwise regression models.
The model that included the Versant score accountedfor 63% of the variance in the criterion variable. This wasgreatly reduced by using only self-reported linguistic inform-ation as predictor variables (accounting for 33% of thevariance in BEL performance).
In addition, the effect of specific L1 on BEL perform-ance was examined. That is, we wanted to know if BELmaterials are biased toward a particular language back-ground. Out of the 102 nonnative speaking subjects, the twolargest native-language groups that were represented wereSpanish speakers (n = 30) and speakers of one of the Chinesedialects (e.g., Mandarin, Cantonese; n = 23). Additionalanalyses were conducted to ensure that the three groups oflists were equivalently difficult for the Spanish and Chinesespeakers when their performance scores were not groupedwith the large subject pool. The results showed that there wereno significant differences within list groups for either nativelanguage background. Repeated-measures ANOVAs indi-cated equivalent performance for sentences within Group 1,2, and 3 each for the Spanish speakers (p range = .194–.779)and for the Chinese speakers (p range = .116–.945).
Just over half of the nonnative subjects (n = 58) weremultilingual (i.e., spoke more than two languages). In orderto recruit a diverse pool of subjects, we did not controlfor linguistic background. It was, therefore, of interest toexamine whether the participants who were multilingual
Figure 3. Box plots for the 102 nonnative English-speaking, normal-hearing listeners for nine BEL sentence lists: Lists 1, 2, 5, 7, 8, 9, 10,11, and 17 (Group 3).
Figure 4. Correlation plots for four factors that were included in one of two stepwise regression models. Overall BEL performance (across all20 lists) at an SNR of –3 dB is shown correlated with overall Versant score, age of immigration, the number of years in the United States, andthe percentage of time (daily) speaking English. Pearson correlation coefficients for each factor and BEL performance are shown on eachindividual plot. All correlations reached significance at an alpha of .01.
Rimikis et al.: Nonnative Performance on the BEL Sentences 797
performed differently compared to our bilingual listeners.A repeated-measures ANOVA found no significant effect ofgroup: bilingual vs. multilingual, F(1, 19) = 1.021, p = .315.Even though no significant difference was found betweengroups, it is possible that differences in word-recognition-in-noise scores could arise between these two groups whenfactors such as English experience or English proficiency (asrepresented by Versant scores) are taken into account.
Finally, to determine if performance scores among listsfor all 102 listeners within the three aforementioned listgroups were correlated under identical listening conditions(i.e., in steady-state, spectrally matched noise at –3 dB SNR),correlations between performance scores were calculated.Significant bivariate correlations were observed for all listpairs within each of the three list groups at a significancelevel of .01 (see Tables 7–9). In addition, an analysis lookingat the top 20% of our subjects (n = 20) with respect totheir performance across all 20 BEL lists was conducted, inwhich we aimed to examine whether these more proficientnonnative listeners would perform equally on a larger setof BEL sentence lists compared to less proficient listeners.The overall repeated-measures ANOVA was significant,F(1, 19) = 3.141, p < .001. Post hoc pairwise comparisonsutilizing a Bonferroni correction indicated no significantdifferences across the majority of list pairs with the excep-tion of Lists 5 and 4, Lists 5 and 13, and Lists 5 and 15(p range = .010–.047). This analysis showed that the moreproficient nonnative listeners performed similarly to thenative English listeners in our previous study. That is, unlikelower-proficiency nonnative listeners, whose speech-in-noiseperformance indicated equivalent difficulty for three distinctsets of BEL sentence lists, they found most BEL sentence liststo be of equivalent difficulty.
Discussion
List Equivalency
Calandruccio and Smiljanic (2012) showed thatperformance scores across all 20 lists of the BEL sentences
were equivalent in terms of difficulty for native speakersof English with normal hearing, with the exception of fourlist pairs. The present results provide performance scoresfor the same materials from 102 normal-hearing listenerswith diverse linguistic backgrounds and a range of Englishproficiencies. Nonnative listeners’ word-recognition perfor-mance indicated three groups of lists within which perfor-mance was equivalent, the largest of which included ninelists (225 sentences, 900 keywords). The current results thusdemonstrate that the BEL sentence materials can be usedsuccessfully to examine speech recognition in nonnativeEnglish-speaking listeners. Unlike native-English-speakinglisteners, experimental designs should be limited to nineconditions, as nine was the largest number of lists observedto have equal performance scores. The results also demon-strated that more proficient nonnative listeners performedequally on a larger number of BEL sentence lists, moreclosely resembling the native English listener performance.It is important to note that similar performance patternswere found for speakers with different L1s, suggesting thatBEL materials are not biased toward a particular L1 but areappropriate for use with a variety of language backgroundsand proficiency levels.
One difference between the data for native Englishspeakers and the data reported in this article is the overallaccuracy levels of the two groups. The native English listenergroup reported in Calandruccio and Smiljanic (2012) hada mean performance range between 71 and 79 percentagepoints from the most difficult to the easiest BEL list. Thenonnative English listener performance had a mean rangeof 63–68 percentage points from the most difficult to theeasiest BEL list, respectively. Although nonnative listenersperformed more poorly on average, some individual non-native listeners were within the performance range of native
Table 5. Significant predictor variables for the multiple regressionanalysis to predict the criterion variable of BEL performance (overallVersant score included in model).
Predictor variable β p
Overall Versant score .661 < .001Age at immigration –.271 < .001
Table 6. Significant predictor variables for the multiple regressionanalysis to predict the criterion variable of BEL performance (overallVersant score excluded from model).
Predictor variable β p
Age at immigration –.354 < .001Number of years in United States .285 .004Percent daily time speaking English .220 .015
Table 7. Pearson product coefficients for correlations between listpairs for Group 1.
List 4 13 15 18 20
4 — .877 .751 .856 .82713 — .807 .824 .83215 — .804 .78718 — .81120 —
Note. All correlations were significant at an alpha level of .01 forthe total sample of 102 nonnative English-speaking subjects.
Table 8. Pearson product coefficients for correlations between listpairs for Group 2.
List 3 6 12 14 16 19
3 — .860 .829 .866 .847 .8776 — .839 .862 .847 .87512 — .864 .877 .82214 — .902 .90416 — .89319 —
798 Journal of Speech, Language, and Hearing Research N Vol. 56 N 792–804 N June 2013
listeners. The SNR used in this experiment had an addedbenefit of 2 dB as compared with that used in our previous2012 study (a –3 dB SNR condition for nonnative listenersvs. a –5 dB SNR condition used for native listeners). Theoverall accuracy results show that more proficient nonnativelisteners can be brought within the performance range ofnative listeners with the added benefit of a better (in this case,2 dB) SNR, but for other listeners, a greater improvement inSNR may be needed. These data are in line with previousfindings indicating that even for highly proficient nonnativelisteners, the added difficulty in processing a second languagemust be offset by an improved SNR (the amount of whichmay vary for different materials and listening conditions;Rogers, Lister, Febo, Besing, & Abrams, 2006; Smiljanic &Bradlow, 2011).
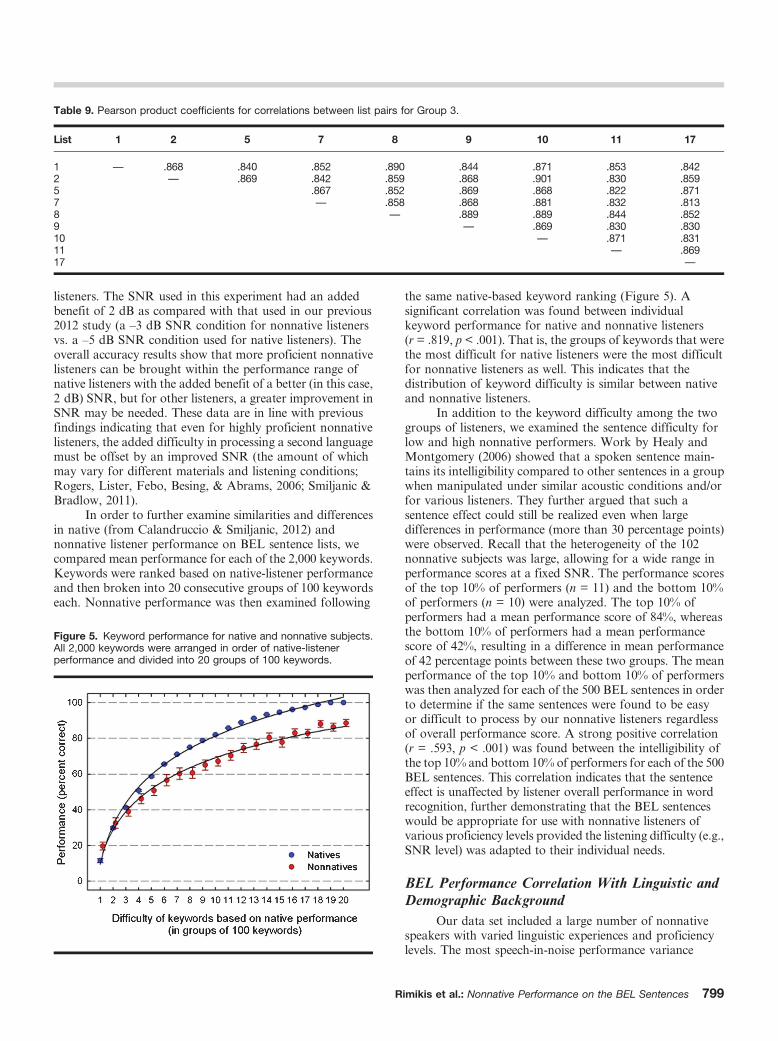
In order to further examine similarities and differencesin native (from Calandruccio & Smiljanic, 2012) andnonnative listener performance on BEL sentence lists, wecompared mean performance for each of the 2,000 keywords.Keywords were ranked based on native-listener performanceand then broken into 20 consecutive groups of 100 keywordseach. Nonnative performance was then examined following
the same native-based keyword ranking (Figure 5). Asignificant correlation was found between individualkeyword performance for native and nonnative listeners(r = .819, p < .001). That is, the groups of keywords that werethe most difficult for native listeners were the most difficultfor nonnative listeners as well. This indicates that thedistribution of keyword difficulty is similar between nativeand nonnative listeners.
In addition to the keyword difficulty among the twogroups of listeners, we examined the sentence difficulty forlow and high nonnative performers. Work by Healy andMontgomery (2006) showed that a spoken sentence main-tains its intelligibility compared to other sentences in a groupwhen manipulated under similar acoustic conditions and/orfor various listeners. They further argued that such asentence effect could still be realized even when largedifferences in performance (more than 30 percentage points)were observed. Recall that the heterogeneity of the 102nonnative subjects was large, allowing for a wide range inperformance scores at a fixed SNR. The performance scoresof the top 10% of performers (n = 11) and the bottom 10%of performers (n = 10) were analyzed. The top 10% ofperformers had a mean performance score of 84%, whereasthe bottom 10% of performers had a mean performancescore of 42%, resulting in a difference in mean performanceof 42 percentage points between these two groups. The meanperformance of the top 10% and bottom 10% of performerswas then analyzed for each of the 500 BEL sentences in orderto determine if the same sentences were found to be easyor difficult to process by our nonnative listeners regardlessof overall performance score. A strong positive correlation(r = .593, p < .001) was found between the intelligibility ofthe top 10% and bottom 10% of performers for each of the 500BEL sentences. This correlation indicates that the sentenceeffect is unaffected by listener overall performance in wordrecognition, further demonstrating that the BEL sentenceswould be appropriate for use with nonnative listeners ofvarious proficiency levels provided the listening difficulty (e.g.,SNR level) was adapted to their individual needs.
BEL Performance Correlation With Linguistic andDemographic Background
Our data set included a large number of nonnativespeakers with varied linguistic experiences and proficiencylevels. The most speech-in-noise performance variance
Table 9. Pearson product coefficients for correlations between list pairs for Group 3.
List 1 2 5 7 8 9 10 11 17
1 — .868 .840 .852 .890 .844 .871 .853 .8422 — .869 .842 .859 .868 .901 .830 .8595 .867 .852 .869 .868 .822 .8717 — .858 .868 .881 .832 .8138 — .889 .889 .844 .8529 — .869 .830 .83010 — .871 .83111 — .86917 —
Figure 5. Keyword performance for native and nonnative subjects.All 2,000 keywords were arranged in order of native-listenerperformance and divided into 20 groups of 100 keywords.
Rimikis et al.: Nonnative Performance on the BEL Sentences 799

observed across the nonnative subjects on the BEL sentenceswas accounted for by performance on the automated Versanttest. These data indicate a strong linear relationship betweenspoken language proficiency, as measured by Versant scores,and BEL performance in steady-state noise. The multiplelinear regression model that included the Versant scoreswas strongly predictive of BEL performance in noise.Nevertheless, the cost and time associated with administeringthe Versant test may be impractical for use outside of theresearch laboratory. For research purposes, however, con-ducting a Versant test on a large subject pool could helprecruit subjects for smaller experiments that will have similarspeech-in-noise performance levels. This could help alleviatesome of the natural variance that tends to occur acrosssubjects when conducting nonnative speech perception. Inaddition, the Versant test requires only a single administra-tion; subjects do not need to retake the assessment prior toeach speech-perception testing session. Therefore, the benefitof using the test may outweigh its cost if the same subjectsare used in multiple experimental conditions.
Age of immigration to the United States was anotherstrong predictor of BEL sentence-in-noise performance.Earlier age of immigration correlates strongly with perfor-mance on speech-in-noise tasks and English proficiency(Hakuta, Bialystok, & Wiley, 2003). Smaller correlationwas found between BEL performance and age of Englishacquisition. This difference may be due to the fact that theage one immigrates to the United States can be quantifiedprecisely. However, the age of English acquisition may bemore subjective in terms of reporting a number for thismarker. That is, some people may include the years theyspent learning basic vocabulary words whereas others mayonly count the years in which they felt proficient enough toconverse in English. One possible way to strengthen thesecorrelations may be for researchers to generate very specificquestions when collecting linguistic histories of nonnativeEnglish-speaking subjects (e.g., ‘‘How old were you whenyou were able to comfortably hold a conversation inEnglish?’’ as opposed to ‘‘How old were you when youlearned English?’’). Similarly, the relationship between BELperformance and age of immigration was also strongerthan the relationship between BEL performance and thereported number of years spent in the United States.One possible reason for the stronger relationship maybe the earlier age of English immersion and its effect onproficiency. Past research has shown a correlation in age ofEnglish immersion and speech-perception ability (Flege,1995). Many people may immigrate to the United Statesin adulthood and continue to live here for the remainderof their lives, equaling a high number of years spent inthe United States. These subjects may have a lower levelof proficiency in comparison to a younger person whoimmigrated in childhood but has lived fewer years in theUnited States. These data highlight the importance of betterunderstanding the influence of specific demographic andlinguistic experience factors on speech processing for such aheterogeneous listener population. They further demon-strate the importance of taking a detailed linguistic history
when conducting clinical work with a nonnative speakingpopulation to be able to better understand test results (seealso von Hapsburg & Pena, 2002).
Scoring
Due to the varying levels of accents among subjects,we did not use online scoring to compute the final wordrecognition levels. Each subject’s performance was insteadscored offline using the recorded oral responses made duringtesting. Two experimenters scored each subject’s responses.For any keywords on which the two scorers differed, a thirdscorer reviewed the audio recording and made a finaljudgment.
An analysis investigating the difference in scoresbetween the two offline testers indicated a mean difference of3.74%. This percent difference between scorers is higher thanwhat is typically observed in similar analyses on data fromnative-English-speaking listeners (e.g., see Calandruccio,Dhar, & Bradlow, 2010; Calandruccio, Van Engen, Dhar, &Bradlow, 2010, for reported discrepancies between onlineand offline scoring of 1.4% and 1%, respectively). This isexpected given that scoring for nonnative speakers of Englishis inherently more challenging than scoring for nativespeakers of English, due to varied English production. Forour data set, we found a significant bivariate correlationbetween Versant pronunciation scores and the percentagedifferences between the two offline testers, r(101) = –.439,p < .001. In other words, the tester variability was seen toincrease with higher levels of accent and overall lower spokenlanguage proficiency.
Two separate post hoc analyses were conducted todetermine the most effective way to score these data whenvariable levels of accent and performance were present. Thefirst analysis compared the original online scoring with thefinal data. This was conducted by comparing the onlinescores for each individual keyword for each subject withthe final, offline scores and calculating the total number ofdifferences found. A mean difference of 4.66% was foundbetween online and final, offline scores. The second analysiscompared the scores of the two offline testers to one anotherby comparing scores for each keyword and calculating thenumber of words on which the two testers disagreed. A meandifference of 3.74% was found between the two testers.
Although variability was indicated between online andoffline scoring, the difference between the two offline testerssuggests that variability in scoring remains a factor whetherscoring is performed online or offline. Given the considerabletime and effort needed to conduct full offline scoring, onlinescoring may be more cost effective considering the small gainin accuracy. However, as with any open-set speech-recognitiontesting with nonnative speakers of English, a wider marginof error should be expected than would occur when testingnative English speakers. The level of reliability can beaffected by a range of factors, including speaker accented-ness level, tester familiarity with speaker’s type of accent(Bradlow & Bent, 2008), and spoken English proficiency.
Another issue regarding scoring arose from the strictscoring criterion we used. A target word was scored as
800 Journal of Speech, Language, and Hearing Research N Vol. 56 N 792–804 N June 2013
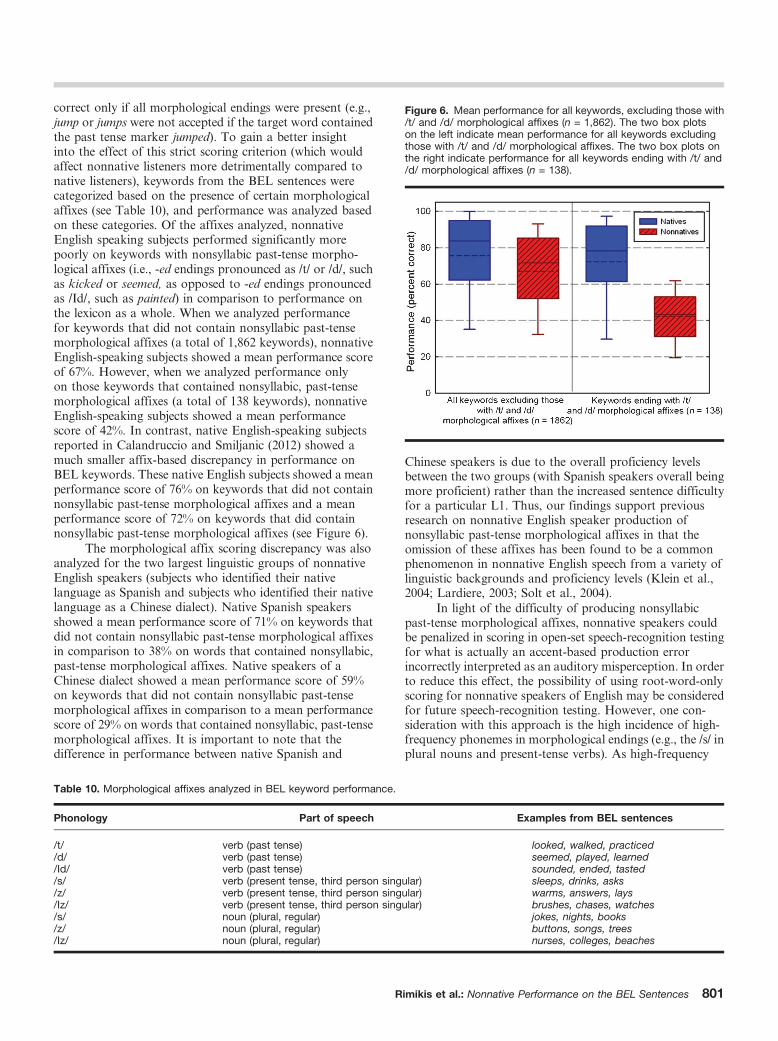
correct only if all morphological endings were present (e.g.,jump or jumps were not accepted if the target word containedthe past tense marker jumped). To gain a better insightinto the effect of this strict scoring criterion (which wouldaffect nonnative listeners more detrimentally compared tonative listeners), keywords from the BEL sentences werecategorized based on the presence of certain morphologicalaffixes (see Table 10), and performance was analyzed basedon these categories. Of the affixes analyzed, nonnativeEnglish speaking subjects performed significantly morepoorly on keywords with nonsyllabic past-tense morpho-logical affixes (i.e., -ed endings pronounced as /t/ or /d/, suchas kicked or seemed, as opposed to -ed endings pronouncedas /Id/, such as painted) in comparison to performance onthe lexicon as a whole. When we analyzed performancefor keywords that did not contain nonsyllabic past-tensemorphological affixes (a total of 1,862 keywords), nonnativeEnglish-speaking subjects showed a mean performance scoreof 67%. However, when we analyzed performance onlyon those keywords that contained nonsyllabic, past-tensemorphological affixes (a total of 138 keywords), nonnativeEnglish-speaking subjects showed a mean performancescore of 42%. In contrast, native English-speaking subjectsreported in Calandruccio and Smiljanic (2012) showed amuch smaller affix-based discrepancy in performance onBEL keywords. These native English subjects showed a meanperformance score of 76% on keywords that did not containnonsyllabic past-tense morphological affixes and a meanperformance score of 72% on keywords that did containnonsyllabic past-tense morphological affixes (see Figure 6).
The morphological affix scoring discrepancy was alsoanalyzed for the two largest linguistic groups of nonnativeEnglish speakers (subjects who identified their nativelanguage as Spanish and subjects who identified their nativelanguage as a Chinese dialect). Native Spanish speakersshowed a mean performance score of 71% on keywords thatdid not contain nonsyllabic past-tense morphological affixesin comparison to 38% on words that contained nonsyllabic,past-tense morphological affixes. Native speakers of aChinese dialect showed a mean performance score of 59%on keywords that did not contain nonsyllabic past-tensemorphological affixes in comparison to a mean performancescore of 29% on words that contained nonsyllabic, past-tensemorphological affixes. It is important to note that thedifference in performance between native Spanish and
Chinese speakers is due to the overall proficiency levelsbetween the two groups (with Spanish speakers overall beingmore proficient) rather than the increased sentence difficultyfor a particular L1. Thus, our findings support previousresearch on nonnative English speaker production ofnonsyllabic past-tense morphological affixes in that theomission of these affixes has been found to be a commonphenomenon in nonnative English speech from a variety oflinguistic backgrounds and proficiency levels (Klein et al.,2004; Lardiere, 2003; Solt et al., 2004).
In light of the difficulty of producing nonsyllabicpast-tense morphological affixes, nonnative speakers couldbe penalized in scoring in open-set speech-recognition testingfor what is actually an accent-based production errorincorrectly interpreted as an auditory misperception. In orderto reduce this effect, the possibility of using root-word-onlyscoring for nonnative speakers of English may be consideredfor future speech-recognition testing. However, one con-sideration with this approach is the high incidence of high-frequency phonemes in morphological endings (e.g., the /s/ inplural nouns and present-tense verbs). As high-frequency
Table 10. Morphological affixes analyzed in BEL keyword performance.
Phonology Part of speech Examples from BEL sentences
/t/ verb (past tense) looked, walked, practiced/d/ verb (past tense) seemed, played, learned/Id/ verb (past tense) sounded, ended, tasted/s/ verb (present tense, third person singular) sleeps, drinks, asks/z/ verb (present tense, third person singular) warms, answers, lays/Iz/ verb (present tense, third person singular) brushes, chases, watches/s/ noun (plural, regular) jokes, nights, books/z/ noun (plural, regular) buttons, songs, trees/Iz/ noun (plural, regular) nurses, colleges, beaches
Figure 6. Mean performance for all keywords, excluding those with/t/ and /d/ morphological affixes (n = 1,862). The two box plotson the left indicate mean performance for all keywords excludingthose with /t/ and /d/ morphological affixes. The two box plots onthe right indicate performance for all keywords ending with /t/ and/d/ morphological affixes (n = 138).
Rimikis et al.: Nonnative Performance on the BEL Sentences 801

phonemes can be valuable in assessing certain auditoryimpairments such as presbycusis, utilizing the root-word-onlyscoring model only for words with nonsyllabic past-tense /t/and /d/ endings may be an option. A pressing goal of futureresearch remains to determine the potential interactionbetween linguistic factors (i.e., nonnative language speechprocessing) and hearing loss for L2 listeners.
Another option in testing is closed-set scoring. With adecrease in spoken language fluency, foreign-accented speechis less reliably interpreted and understood by others. Recallthe correlation reported above between Versant pronuncia-tion score and offline tester agreement. For those speakerswith heavily accented speech, closed-set testing may serveto alleviate tester difficulty in scoring. However, closed-settesting may present other drawbacks, namely that the taskis not equal to open-set testing with respect to informationprocessing demands and level of chance performance (Luce& Pisoni, 1998). Therefore, this type of testing most likelyshould be considered only for groups for which it maypresent a marked benefit in scoring (i.e., those who speakEnglish on a daily basis, but have heavily accented speech).
It may be argued that in testing the speech recognitionof nonnative speakers of English, written scoring mayalleviate the difficulty of tester interpretation of subjectaccent. However, in an informal analysis in our lab in whichboth written and verbal responses were collected duringspeech-recognition testing, it was found that spelling errorsmimicked verbal-accent errors, in that many subjectsorthographically transcribed their phonetic pronunciation.For example, the keywords dull and urge were written as‘‘dool’’ and ‘‘earch,’’ respectively. Furthermore, Englishspelling is highly irregular and may pose additional problemsfor nonnative listeners, especially those who may not havehad formal schooling. Thus written responses presentedsimilar difficulties to verbal scoring, in that there was testerdisagreement concerning at which point such errors wouldbe interpreted as incorrect responses. In addition, writtenscoring is significantly less time-effective than verbal scoring,in that gathering written responses increases the timerequired for testing at least twofold.
Finally, we considered word frequency patterns forBEL sentence lists. Previous research established that wordfrequency (how often a word occurs in a lexicon) is animportant variable in speech processing. High-frequencywords are perceived and produced more quickly and moreefficiently and are easier to recall than low-frequency words(e.g., Balota & Chumbley, 1984; Glanzer & Bowles, 1976;Jescheniak & Levelt, 1994; Rayner & Duffy, 1986). Eventhough second-language learners may not share all lexicalknowledge with monolingual speakers, it is likely thatsome frequency effects play a role in speech processing fornonnative speakers (especially those with higher proficiency).In order to assess whether word-recognition results on theBEL sentences bear any relationship to lexical frequency, weanalyzed the BEL sentence keywords according to frequencyof occurrence in the English language using a measure offrequency per million. For frequency counts, we used theSUBTLEXus which is based on the subtitles from American
films and television series (for a total of 51 million words;Brysbaert & New, 2009). A value was assigned to eachindividual keyword, and medians (based on 100 keywords)were calculated for each of the 20 lists of the BEL sentences.When we compared these medians for frequency per millionto performance on the BEL sentence lists, we found nosignificant relationship between group difficulty and key-word frequency (r = .402, p = .079). The three groups of BELsentence lists with equivalent difficulty all had similar wordfrequency distribution, and the different word-recognitionperformance of our nonnative listeners between the three listgroups cannot be accounted for by the different frequenciesof the keywords across lists.
Keywords were also analyzed according to frequencyof occurrence within the original lexicon used to develop theBEL sentences. Recall that the original lexicon was derivedfrom the conversational speech samples of 100 nonnativespeakers of English, and, as such, it reflects familiarity withthe target words of a large number of nonnative speakers.Again, a value was assigned to each individual keyword andmedians were calculated for each of the 20 lists of the BELsentences. For the list medians, a relationship was foundbetween list difficulty and frequency of keyword occurrencewithin the BEL nonnative lexicon, such that the better word-recognition score (for each list) was significantly correlatedwith high word-frequency occurrence in the lexicon (r = .475,p = .034). This significant correlation between recognitionperformance and BEL lexicon word frequency may indicatethat the original lexicon used to create the BEL sentencesis a more accurate reflection of the nonnative population’sfamiliarity with some of the target keywords.
In analyzing the current data, we opted to usestatistical equivalence to determine differences in perfor-mance accuracy across lists. This analysis is aimed atestablishing the appropriateness of the BEL sentences for usein research where this type of analysis is most typically used.Establishing critical difference values for the BEL sentencelists will be an important next step in examining the clinicaluse of these materials (e.g., Cox, Alexander, & Gilmore,1987; Thornton & Raffin, 1978).
Conclusion
In this study, our goal was to extend the findings ofCalandruccio and Smiljanic (2012), who found that thenewly developed BEL sentence materials presented equiva-lent list difficulty for normal-hearing, native Englishlisteners. Here we showed that these materials are suitable fortesting the speech-recognition abilities of nonnative Englishspeakers as well. It is important to note that the resultsshowed that these materials are appropriate for use with awide variety of nonnative speakers, including different L1sand various levels of proficiency. The results from a largenumber (102) of nonnative listeners provided insights intothe factors that must be taken into consideration whentesting this target population. A detailed linguistic anddemographic history should be considered when interpretingnonnative listeners’ speech-recognition results, including
802 Journal of Speech, Language, and Hearing Research N Vol. 56 N 792–804 N June 2013
information regarding the listener’s age of immigration to theUnited States and percent of time daily speaking English.For research purposes, the results revealed that a quick,automated spoken language proficiency test (Versant)can aid in selecting a desired and less variable nonnativedemographic. Differences in list equivalencies in nonnativeEnglish speaker performance on BEL materials in relation tonative English speakers were also found. The list groupingsindicated by the current data should be taken into considera-tion when testing nonnative English speakers on multipleBEL lists. Nevertheless, the various analyses on the character-istics of the BEL sentence materials, which were created usinglexical items and syntactic structures that would reflect theactual English experience of nonnative speakers, suggest thatthese materials may be used to test speech recognition forvarious listener populations. Ultimately, more research ofnonnative speech-in-noise recognition on these and othertest materials will allow us to move closer to an end goalof including speech recognition in the standard battery ofaudiological assessment for the nonnative English-speakingpopulation.
Acknowledgments
This study was funded, in part, by The Capita Foundation.
We are indebted to the undergraduate and graduate researchassistants in the Speech and Auditory Research Laboratory atQueens College and the UTSoundLab at the University of Texas—Austin. Portions of these data were presented at the 2011 American
Speech-Language-Hearing Association convention in San Diego,California, the 2011 meeting of the Acoustical Society of Americain San Diego, California, and the 2012 New York State Speech-
Language-Hearing Association convention in Saratoga Springs,New York.
References
American Speech-Language-Hearing Association. (1997). Guidelines
for audiologic screening. Available from www.asha.org/policy.
American Speech-Language-Hearing Association. (2000). 2000
Omnibus survey: Practice trends in audiology. Rockville, MD:Author.
American Speech-Language-Hearing Association. (2004). Audiologysurvey: Practice trends in audiology. Rockville, MD: Author.
American Speech-Language-Hearing Association. (2011). Culturalcompetence in professional service delivery [Professional IssuesStatement]. Available from www.asha.org/policy.
Balota, D. A., & Chumbley, J. I. (1984). Are lexical decisions a goodmeasure of lexical access? The role of word frequency in the
neglected decision stage. Journal of Experimental Psychology:
Human Perception and Performance, 10, 340–357.
Bench, J., Kowal, A., & Bamford, J. (1979). The BKB (Bamford-Kowal-Bench) sentence lists for partially hearing children.British Journal of Audiology, 13, 108–112.
Bergman, M. (Ed.). (1980). Aging and the perception of speech.Baltimore, MD: University Park Press.
Bialystok, E., & Hakuta, K. (1999). Confounded age: Linguisticand cognitive factors in age differences for second language
acquisition. In D. Birdsong (Ed.), Second language acquisition
and the critical period hypothesis. Mahwah, NJ: Erlbaum.
Bilger, R. C., Nuetzel, J. M., Rabinowitz, W. M., & Rzeczkowski, C.(1984). Standardization of a test of speech perception in noise.Journal of Speech, Language, and Hearing Research, 27, 32–48.
Boersma, P., & Weenink, D. (2012). Praat: Doing phonetics bycomputer (Version 5.3.15) [Computer program]. Retrieved fromhttp://www.praat.org.
Bradlow, A. R., & Alexander, J. A. (2007). Semantic and phoneticenhancements for speech-in-noise recognition by native andnonnative listeners. The Journal of the Acoustical Society ofAmerica, 121, 2339–2349.
Bradlow, A. R., & Bent, T. (2008). Perceptual adaptation tononnative speech. Cognition, 106, 707–729.
Bradlow, A. R., & Pisoni, D. B. (1999). Recognition of spoken wordsby native and nonnative listeners: Talker-, listener-, and item-related factors. The Journal of the Acoustical Society of America,106, 2074–2085.
Brysbaert, M., & New, B. (2009). Moving beyond Kucera andFrancis: A critical evaluation of current word frequency normsand the introduction of a new and improved word frequencymeasure for American English. Behavior Research Methods, 41,977–990.
Calandruccio, L., Dhar, S., & Bradlow, A. R. (2010). Speech-on-speech masking with variable access to the linguistic content ofthe masker speech. The Journal of the Acoustical Society ofAmerica, 128, 860–869.
Calandruccio, L., & Smiljanic, R. (2012). New sentence-recognitionmaterials developed using a basic nonnative English lexicon.Journal of Speech, Language, and Hearing Research, 55, 1–34.
Calandruccio, L., Van Engen, K., Dhar, S., & Bradlow, A. R. (2010).The effectiveness of clear speech as a masker. Journal of Speech,Language, and Hearing Research, 5, 1458–1471.
Chan, C. L. (2012). NU-subdb: Northwestern University SubjectDatabase [Web application]. Department of Linguistics,Northwestern University. https://babel.ling.northwestern.edu/nusubdb2/.
Cox, R. M., Alexander, G. C., & Gilmore, C. (1987). Developmentof the Connected Speech Test (CST). Ear and Hearing, 8,119S–126S.
Flege, J. E. (1995). Second language speech learning: Theory,findings and problems. In W. Strange (Ed.), Speech perceptionand linguistic experience: Issues in cross-language research(pp. 233–272). Timonium, MD: York.
Flege, J., Birdsong, D., Bialystok, E., Mack, M., Sung, H., &Tsukada, K. (2006). Degree of foreign accent in English sentencesproduced by Korean children and adults. Journal of Phonetics,33, 153–175.
Flege, J. E., Yeni-Komshian, G. H., & Liu, S. (1999). Age constraintson second-language acquisition. Journal of Memory andLanguage, 41, 78–104.
Glanzer, M., & Bowles, N. (1976). Analysis of the word-frequencyeffect in recognition memory. Journal of ExperimentalPsychology: Human Learning and Memory, 2, 21–31.
Hakuta, K., Bialystok, E., & Wiley, E. (2003). Critical evidence: Testof the critical period hypothesis for 2nd language acquisition.Psychological Science, 14, 31–38.
Healy, E. W., & Montgomery, A. A. (2006). Consistency of sentenceintelligibility across difficult listening situations. Journal ofSpeech, Language, and Hearing Research, 49, 823–834.
Jescheniak, J. D., & Levelt, W. J. M. (1994). Word frequency effectsin speech production: Retrieval of syntactic information andof phonological form. Journal of Experimental Psychology:Learning, Memory, and Cognition, 20, 824–843.
Klein, E., Stoyneshka, I., Adams, K., Rose, T., Pugash, Y., & Solt, S.(2004). Past tense affixation in L2 English: The effects of lexical
Rimikis et al.: Nonnative Performance on the BEL Sentences 803
aspect and perceptual salience. In A. Brugos, L. Micciulla, &C. E. Smith (Eds.), BUCLD 28: Proceedings of the 28th AnnualBoston University Conference on Language Development: Onlinesupplement. Available from www.bu.edu/bucld/proceedings/supplement/.
Lardiere, D. (2003). Second language knowledge of [+/–Past] and[+/–Finite]. In J. M. Liceras et al. (Eds.), Proceedings of the6th Generative Approaches to Second Language AcquisitionConference (GASLA 2002; pp. 176–189). Somerville, MA:Cascadilla Proceedings Project.
Luce, P. A., & Pisoni, D. B. (1998). Recognizing spoken words: Theneighborhood activation model. Ear and Hearing, 19, 1–36.
MacKay, I. R. A., Flege, J. E., & Imai, S. (2006). Evaluating theeffects of chronological age and sentence duration on degree ofperceived foreign accent. Applied Psycholinguistics, 27, 157–183.
Mayo, L. H., Florentine, M., & Buus, S. (1997). Age of second-language acquisition and perception of speech in noise. Journalof Speech, Language, and Hearing Research, 40, 686–693.
Nilsson, M., Soli, S. D., & Sullivan, J. A. (1994). Development of theHearing in Noise Test for the measurement of speech receptionthresholds in quiet and in noise. The Journal of the AcousticalSociety of America, 95,1085–1099.
Pearson Education. (2010). Versant English Test description andvalidation manual. Palo Alto, CA: Author. Retrieved from www.versanttest.com/products/english.jsp
Piske, T., MacKay, I.R.A., & Flege, J. E. (2001). Factors affectingdegree of foreign accent in an L2: A review. Journal of Phonetics,29, 191–215.
Rayner, K., & Duffy, S. A. (1986). Lexical complexity and fixationtimes in reading: Effects of word frequency, verb complexity,and lexical ambiguity. Memory & Cognition, 14, 191–201.
Rogers, C. L., Lister, J. J., Febo, D. M., Besing, J. M., & Abrams,H. B. (2006). Effects of bilingualism, noise, and reverberation on
speech perception by listeners with normal hearing. AppliedPsycholinguistics, 27, 465–485.
Smiljanic, R. (2012). Second language learning. In A. C. Cohn, C.Fougeron, & M. Huffman (Eds.), The Oxford handbook oflaboratory phonology (pp. 417–426). Oxford, United Kingdom:Oxford University Press.
Smiljanic, R., & Bradlow, A. (2011). Bidirectional clear speechperception benefit for native and high proficiency nonnativetalker-listener pairs: Intelligibility and accentedness. The Journalof the Acoustical Society of America, 130, 4020–4031.
Soli, S. D., & Wong, L. L. N. (2008). Assessment of speechintelligibility in noise with hearing in noise test. InternationalJournal of Audiology, 47, 356–361.
Solt, S., Pugach, Y., Klein, E. C., Adams, K., Stoyneshka, I.,& Rose, T. (2004). L2 perception and production of theEnglish regular past: Evidence of phonological effects. InA. Brugos, L. Micciulla, & C. E. Smith (Eds.), BUCLD 28:Proceedings of the 28th annual Boston University Conferenceon Language Development (pp. 553–564). Somerville, MA:Cascadilla Press.
Takata, Y., & Nabelek, A. K. (1990). English consonant recognitionin noise and in reverberation by Japanese and Americanlisteners. The Journal of the Acoustical Society of America, 88,663–666.
Thornton, A. R., & Raffin, M. I. (1978). Speech-discriminationscores modeled as a binomial variable. Journal of Speech andHearing Research, 21, 507–518.
U. S. Census Bureau. (2007). Language use in the United States: 2007[American Community Survey Reports]. Retrieved from http://www.census.gov/prod/2010pubs/acs-12.pdf.
von Hapsburg, D., & Pena, E. D. (2002). Understanding bilingualismand its impact on speech audiometry. Journal of Speech,Language, and Hearing Research, 45, 202–213.
804 Journal of Speech, Language, and Hearing Research N Vol. 56 N 792–804 N June 2013