Nonlinear Backbone Modeling of Concrete Columns ...
12
53 ACI Structural Journal/January 2018 ACI STRUCTURAL JOURNAL TECHNICAL PAPER The use of nonlinear analysis procedures in seismic retrofitting of existing concrete structures has become commonplace in practice. Backbone curves are often used to capture the nonlinear response of components in a simplified but sufficiently accurate way. Proce- dures to construct curves for existing components of frames (beams, joints, and columns) have received considerable attention and have been modified over the years. In contrast, recommenda- tions to construct these backbone curves for retrofitted components are largely lacking. This paper presents recommendations that can be used to construct backbone curves of circular and rect- angular retrofitted columns using jacketing materials within the context of ASCE/SEI 41-13 and ACI 369R-11. The recommenda- tions are developed using a sectional model for force parameters and a statistical study of load-deformation results from a database of retrofitted columns for drift parameters when sufficient experi- mental data are available. Key points in the backbone response of jacketed columns are summarized in tabular form consistent with ASCE/SEI 41-13 to facilitate possible adoption in future updates of the standard. A probabilistic model is introduced to allow selection of drift values that correspond to selected exceedance probabilities. Keywords: backbone curves; column retrofitting; jacketed columns; nonlinear modeling parameters. INTRODUCTION The potential for failure of nonductile columns with details that do not conform to modern building codes has been recognized for many years. With local retrofitting such as external jacketing, the behavior of nonductile columns can be greatly improved, providing benefits to the global performance of building frames and reducing the potential for collapse. Jacketing materials are selected such that they can be easily applied to frame elements without disruption of building operations. The most common types of external jackets are concrete, steel, and fiber-reinforced polymer (FRP) materials. In any retrofitting project, it is paramount to be able to accurately assess the performance of the retrofitted structure to ensure adequacy in its performance. ASCE/SEI 41-13, “Standard on Seismic Evaluation and Retrofit of Existing Buildings,” provides detailed guidance for the evaluation of structures in their existing condition. In contrast, very little information is provided for engineers to verify the response of the structure in its retrofitted condition. Guidance on procedures to estimate strength and deformation capacity of retrofitted components is needed to adequately evaluate if the structure satisfies the intended performance objectives for the expected demands. Jacketing deficient columns can change the sequence of inelastic hinge formation of an existing frame such that hinges form at the ends of beams first instead of at the ends of columns. This causes the collapse mechanism to change from a failure involving limited lateral deformation capacity to one involving a more ductile mechanism. As a local retrofitting technique, jacketing can be selectively used in cases where other components of frames that make up the lateral load system have sufficient strength and deformation capacity. It is critical, however, to be able to calculate the expected sequence of hinge formation by developing reli- able nonlinear modeling techniques of retrofitted elements of potentially vulnerable reinforced frames. This paper focuses on developing a methodology to model reinforced concrete columns that are retrofitted using steel or FRP jackets applied locally in the region where inelastic hinges are anticipated to form. The methodology focuses on a recommended procedure to construct the nonlinear force-deformation backbone response of jacketed columns. The procedures used within this methodology result in backbone curves that compare favorably with the backbone response measured in available tests. Recommendations to construct backbone curves are provided in a similar format to the current approach for existing elements contained in ASCE/SEI 41-13 and ACI 369R-11 by defining key points in the nonlinear backbone response of reinforced concrete frame elements. The recommendations were developed in a way that they may provide the basis for future updates of these two documents. The backbone curves are defined in this paper by six parameters: the force at yield, the peak force, the residual capacity, the drift at yield, the drift at 80% of peak force, and the drift at which the force equals the residual capacity. A sectional model, validated against a database of experi- mental results, is used to calculate the force at yield and the peak force. Validated sectional models that can predict drift of jacketed columns are not currently available and, there- fore, a statistical model for the drift at 80% of peak force is developed and calibrated to a database of experimental results assembled from the open literature for cases when the axial force ratio is low. Unfortunately, insufficient data are available in the literature to develop a statistical model for the drift at 80% of peak load when the axial force ratio is high or for drift corresponding to the residual capacity of Title No. 115-S04 Nonlinear Backbone Modeling of Concrete Columns Retrofitted with Fiber-Reinforced Polymer or Steel Jackets by José C. Alvarez, Sergio F. Breña, and Sanjay R. Arwade ACI Structural Journal, V. 115, No. 1, January 2018. MS No. S-2016-121.R3, doi: 10.14359/51700779, received March 10, 2017, and reviewed under Institute publication policies. Copyright © 2018, American Concrete Institute. All rights reserved, including the making of copies unless permission is obtained from the copyright proprietors. Pertinent discussion including author’s closure, if any, will be published ten months from this journal’s date if the discussion is received within four months of the paper’s print publication.
Transcript of Nonlinear Backbone Modeling of Concrete Columns ...

53ACI Structural Journal/January 2018
ACI STRUCTURAL JOURNAL TECHNICAL PAPER
The use of nonlinear analysis procedures in seismic retrofitting of existing concrete structures has become commonplace in practice. Backbone curves are often used to capture the nonlinear response of components in a simplified but sufficiently accurate way. Proce-dures to construct curves for existing components of frames (beams, joints, and columns) have received considerable attention and have been modified over the years. In contrast, recommenda-tions to construct these backbone curves for retrofitted components are largely lacking. This paper presents recommendations that can be used to construct backbone curves of circular and rect-angular retrofitted columns using jacketing materials within the context of ASCE/SEI 41-13 and ACI 369R-11. The recommenda-tions are developed using a sectional model for force parameters and a statistical study of load-deformation results from a database of retrofitted columns for drift parameters when sufficient experi-mental data are available. Key points in the backbone response of jacketed columns are summarized in tabular form consistent with ASCE/SEI 41-13 to facilitate possible adoption in future updates of the standard. A probabilistic model is introduced to allow selection of drift values that correspond to selected exceedance probabilities.
Keywords: backbone curves; column retrofitting; jacketed columns; nonlinear modeling parameters.
INTRODUCTIONThe potential for failure of nonductile columns with
details that do not conform to modern building codes has been recognized for many years. With local retrofitting such as external jacketing, the behavior of nonductile columns can be greatly improved, providing benefits to the global performance of building frames and reducing the potential for collapse. Jacketing materials are selected such that they can be easily applied to frame elements without disruption of building operations. The most common types of external jackets are concrete, steel, and fiber-reinforced polymer (FRP) materials.
In any retrofitting project, it is paramount to be able to accurately assess the performance of the retrofitted structure to ensure adequacy in its performance. ASCE/SEI 41-13, “Standard on Seismic Evaluation and Retrofit of Existing Buildings,” provides detailed guidance for the evaluation of structures in their existing condition. In contrast, very little information is provided for engineers to verify the response of the structure in its retrofitted condition. Guidance on procedures to estimate strength and deformation capacity of retrofitted components is needed to adequately evaluate if the structure satisfies the intended performance objectives for the expected demands.
Jacketing deficient columns can change the sequence of inelastic hinge formation of an existing frame such that
hinges form at the ends of beams first instead of at the ends of columns. This causes the collapse mechanism to change from a failure involving limited lateral deformation capacity to one involving a more ductile mechanism. As a local retrofitting technique, jacketing can be selectively used in cases where other components of frames that make up the lateral load system have sufficient strength and deformation capacity. It is critical, however, to be able to calculate the expected sequence of hinge formation by developing reli-able nonlinear modeling techniques of retrofitted elements of potentially vulnerable reinforced frames.
This paper focuses on developing a methodology to model reinforced concrete columns that are retrofitted using steel or FRP jackets applied locally in the region where inelastic hinges are anticipated to form. The methodology focuses on a recommended procedure to construct the nonlinear force-deformation backbone response of jacketed columns. The procedures used within this methodology result in backbone curves that compare favorably with the backbone response measured in available tests. Recommendations to construct backbone curves are provided in a similar format to the current approach for existing elements contained in ASCE/SEI 41-13 and ACI 369R-11 by defining key points in the nonlinear backbone response of reinforced concrete frame elements. The recommendations were developed in a way that they may provide the basis for future updates of these two documents.
The backbone curves are defined in this paper by six parameters: the force at yield, the peak force, the residual capacity, the drift at yield, the drift at 80% of peak force, and the drift at which the force equals the residual capacity. A sectional model, validated against a database of experi-mental results, is used to calculate the force at yield and the peak force. Validated sectional models that can predict drift of jacketed columns are not currently available and, there-fore, a statistical model for the drift at 80% of peak force is developed and calibrated to a database of experimental results assembled from the open literature for cases when the axial force ratio is low. Unfortunately, insufficient data are available in the literature to develop a statistical model for the drift at 80% of peak load when the axial force ratio is high or for drift corresponding to the residual capacity of
Title No. 115-S04
Nonlinear Backbone Modeling of Concrete Columns Retrofitted with Fiber-Reinforced Polymer or Steel Jacketsby José C. Alvarez, Sergio F. Breña, and Sanjay R. Arwade
ACI Structural Journal, V. 115, No. 1, January 2018.MS No. S-2016-121.R3, doi: 10.14359/51700779, received March 10, 2017, and
reviewed under Institute publication policies. Copyright © 2018, American Concrete Institute. All rights reserved, including the making of copies unless permission is obtained from the copyright proprietors. Pertinent discussion including author’s closure, if any, will be published ten months from this journal’s date if the discussion is received within four months of the paper’s print publication.

54 ACI Structural Journal/January 2018
jacketed columns. Those parameters are therefore conser-vatively estimated as for unjacketed columns containing details similar to those in modern codes.
RESEARCH SIGNIFICANCEASCE/SEI 41-13 and ACI 369R-11 contain requirements
to model existing reinforced concrete building frames for retrofitting purposes. These documents focus on modeling of existing components but do not provide details on ways to treat retrofitted components. This paper is intended to fill this gap in information by developing a procedure that can be used to construct nonlinear backbone curves for jacketed columns, a technique that is frequently considered in retro-fitting projects.
GENERAL BACKBONE FORCE-DEFORMATION RELATIONSHIP
Both ASCE/SEI 41-13 and ACI 369R-11 use a simpli-fied backbone model to describe the nonlinear lateral load-drift response of existing reinforced concrete elements (Fig. 1). In this model, the nonlinear response is primarily characterized through the definition of two parameters (a and b) that are used to represent the plastic drift capacity of existing columns for given transverse reinforcement contents and axial load level. These documents tabulate values of nonlinear drift parameters for columns and other reinforced concrete components based on experience and the observed response during laboratory testing of compo-nents. One of the drawbacks in the currently used simplified backbone model in comparison with response of compo-nents measured during tests is that the strength drop after reaching peak strength is not as sudden, as indicated by the solid line in the figure, but it is rather gradual in most cases (dashed line). The simplified backbone response curves for jacketed columns proposed later in this paper will follow the general shape as indicated by the dashed line to better reflect observed response.
Because of the widespread use of simplified back-bone curves in nonlinear analysis of existing structures, the approach followed in this paper is to characterize the nonlinear lateral deformation response of jacketed columns through parameters a and b. Parameter a can be defined as the magnitude of plastic drift that corresponds to a 20%
reduction in lateral strength from peak. Parameter b is taken as the plastic drift that corresponds to the point where the lateral strength has degraded to the residual strength, gener-ally assumed equal to 0.2Vpeak. These two definitions are followed to construct simplified backbone curves using a database of existing tests of jacketed columns as discussed in the following section.
DATABASE OF JACKETED COLUMNSAn experimental database of available laboratory exper-
iments of circular and rectangular jacketed columns tested under cyclic loading was assembled for two main purposes. First, lateral load data were used to evaluate the accuracy of proposed sectional models described later in this paper to compute yield and peak strength of jacketed columns. Second, the data were also used to study the statistical distribution of drifts at key points of the force-deformation response of jacketed columns. The information obtained from the database, therefore, was used to evaluate the accu-racy of the methods proposed to construct the backbone response of jacketed columns.
The database consists of a total of 116 columns: 84 and 32 columns jacketed using fiber-reinforced polymer (FRP) or steel materials, respectively. Several challenges were encountered when assembling the database, given the vast variety of details in the columns tested. The specimens were designed and constructed to capture common deficient prop-erties typically found in columns of older existing build-ings such as low shear strength, short lap splices within the plastic hinge zone, and/or low volume of transverse reinforcement. Column jacket retrofitting using different materials and configurations was used to overcome these existing deficiencies that result in poor column performance. The laboratory specimens include columns with rectan-gular or circular cross sections, various levels of applied axial force (typically axial load levels below the balanced point in the column interaction diagram), and two different test setup configurations that generate single- or double- curvature bending of the columns during lateral loading. Relevant properties of jacketed columns in the database are given in Table 1 for circular columns and Table 2 for rect-angular columns, respectively. Many (not all) of the tests on retrofitted columns were compared with tests of an unretro-fitted reference column, but only the retrofitted specimens are provided in the tables. It can be seen that the highest number of specimens correspond to FRP-jacketed columns with rectangular cross sections and the fewest number of specimens obtained correspond to steel-jacketed circular columns. The range of values for key column properties in the database can also be found within these tables (material strength, reinforcement content, dimensions).
The original (unretrofitted) columns contained one of the primary three deficiencies that result in nonductile lateral-load behavior of columns: short lap splices in the plastic hinge region (LS); insufficient amounts of trans-verse reinforcement for concrete confinement (C); or low shear strength (S). The measured lateral load-deformation response of the column specimens was reported in the orig-inal reference through either hysteresis curves or backbone
Fig. 1—Simplified backbone curve.

55ACI Structural Journal/January 2018
curves as a measure of column performance. When only hysteresis curves were published, the backbone curve was constructed using a series of lines passing through selected points in the load-deformation response curve. These back-bone curves were subsequently simplified to be consistent
with those available in retrofitting guides and standards such as ACI 369R-11 and ASCE/SEI 41-13. The curves were constructed by connecting the shear force and drift coor-dinates obtained during the tests corresponding to column yielding, lateral strength corresponding to a 20% reduction
Table 1—Properties of jacketed columns in database: circular sections
Specimen Reference Dc, in.Height,
in. fc′, psi P/Ag fc′ ρ, % ρv, %Deficient property* Vy, kip Vpeak/Vy
Δy/H, %
Δp/H, %
Δmax/H, %
Par.a
FRP-jacketed circular columns
CFRP-05Breña and
Schlick (2007)
9.5 37.5 3467 0.05 2.54 0.333 LS 9.4 1.4 1.9 6.0 9.2 6.1
KFRP-05 9.5 37.5 3467 0.05 2.54 0.333 LS 9.6 1.4 1.4 6.3 9.5 6.8
CFRP-15 9.5 37.5 3467 0.15 2.54 0.333 LS 9.1 1.8 1.3 6.0 9.2 7.9
KFRP-15 9.5 37.5 3467 0.15 2.54 0.333 LS 9.5 1.4 1.1 6.2 10.0 8.8
CF-R1
Haroun and Elsanadedy (2005a,b)
24.0 135.0 5223 0.06 1.95 0.103 LS 25.4 1.4 0.4 5.3 6.4 6.0
CF-R2 24.0 135.0 5353 0.06 1.95 0.103 LS 28.3 1.4 0.4 4.4 5.9 5.5
CF-R3 24.0 135.0 4758 0.07 1.95 0.103 LS 31.2 1.4 0.5 3.8 5.6 5.1
CF-R4 24.0 135.0 5469 0.06 1.95 0.103 LS 30.7 1.4 0.4 3.9 5.9 5.5
CF-R5 24.0 135.0 5759 0.06 1.95 0.103 LS 31.1 1.3 0.5 3.9 5.9 5.4
CF-R6 24.0 135.0 4802 0.07 1.95 0.103 LS 30.3 1.4 0.4 4.8 7.0 6.6
CS-R1 24.0 96.0 5919 0.05 1.95 0.103 S 80.2 1.4 0.2 3.1 3.6 3.4
CS-R2 24.0 96.0 5687 0.05 1.95 0.103 S 83.2 1.4 0.2 3.0 3.7 3.5
CS-R3 24.0 96.0 4961 0.05 1.95 0.103 S 116.1 1.4 0.5 3.8 4.3 3.8
CS-R4 24.0 96.0 5455 0.06 1.95 0.103 S 112.1 1.4 0.5 2.1 3.1 2.5
CS-P1 24.0 96.0 5179 0.06 1.95 0.103 S 119.8 1.4 0.3 3.9 4.1 3.7
Lap Splice R Priestley et al. (1994a,b) 24.0 144.0 4998 0.18 2.53 0.103 LS 42.7 1.4 0.1 2.4 3.8 3.5
C2-RT4Xiao and
Ma (1997)
24.0 104.0 6501 0.05 1.94 0.103 LS 53.2 1.3 0.4 1.4 5.1 3.2
C3-RT5 24.0 104.0 6501 0.05 1.94 0.103 LS 52.7 1.4 0.4 2.5 5.0 3.7
C4-RP4 24.0 104.0 6501 0.05 1.94 0.103 LS 36.5 1.4 0.6 2.0 5.4 2.7
CAF1-2NGhosh and
Sheikh (2007)
14.0 57.9 3611 0.05 1.71 0.275 LS 17.0 1.3 1.0 1.2 4.9 1.1
CAF1-5N 14.0 57.9 3640 0.27 1.71 0.275 LS 12.2 1.4 0.8 4.3 12.3 5.1
CBF1-6N 14.0 57.9 3843 0.05 1.71 1.032 LS 13.6 1.3 1.0 5.5 8.7 6.2
ST-4NT 14.0 57.9 6497 0.27 1.71 1.032 LS 25.7 1.3 1.8 3.9 9.0 7.2
Steel-jacketed circular columns
2
Chai et al. (1991)
24.0 144.0 5601 0.16 2.53 0.174 C 38.8 1.4 0.8 2.5 2.5 1.7
4 24.0 144.0 5521 0.16 2.53 0.174 C 48.0 1.4 0.4 6.0 † 5.6
5 24.0 144.0 5095 0.17 2.53 0.174 C 36.8 1.3 0.4 1.1 6.0 2.9
6 24.0 144.0 5426 0.16 2.53 0.174 C 49.2 1.4 0.5 4.6 6.1 5.4
1-R 24.0 144.0 5541 0.16 2.53 0.174 C 38.0 1.4 0.9 2.7 5.1 3.9
SC1 Li et al. (2005)
29.9 128.0 3699 0.11 1.32 0.072 C 54.9 1.4 0.4 3.8 5.8 4.5
SC2 29.9 128.0 3699 0.11 1.15 0.067 C 51.3 1.4 0.3 3.8 5.8 5.5
C2R
Priestley et al. (1994a,b)
24.0 96.0 4931 0.06 2.53 0.082 S 115.4 1.4 0.3 4.4 ‡ 4.1
C4R 24.0 96.0 5101 0.17 2.53 0.082 S 150.4 1.4 0.3 4.1 ‡ 3.8
C6R 24.0 96.0 5801 0.05 2.53 0.082 S 160.9 1.4 0.4 5.5 ‡ 5.1
C8R 24.0 72.0 4521 0.06 2.53 0.082 S 193.0 1.4 0.3 5.2 ‡ 4.9
*S is shear-deficient; C is inadequate confinement; LS is short lap splice.†Test was stopped at peak load.‡Test stopped at maximum displacement capacity of actuator.
Notes: 1 in. = 25.4 mm, 1 kip = 4.45 kN, 1000 psi = 6.89 MPa.

56 ACI Structural Journal/January 2018
Table 2—Properties of jacketed columns in database: rectangular columns
Specimen Referencebc, in. hc, in. H, in. fc′, psi P/Agfc′ ρ, % ρv, %
Deficient property* Vy, kip Vpeak/Vy
Δy/H, %
Δp/H, %
Δmax/H, % Par. a
FRP-jacketed rectangular columns
S2
Ozcan et al. (2010)
15.8 7.9 70.8 1450 0.15 2.84 0.448 C 8.6 1.2 0.2 3.0 7.2 4.0
S3 15.8 7.9 70.8 1523 0.15 2.84 0.448 C 9.4 1.3 0.3 2.0 4.8 2.7
S4 15.8 7.9 70.8 1305 0.15 2.84 0.448 C 7.7 1.4 0.2 2.4 4.6 2.9
S5 15.8 7.9 70.8 2249 0.15 2.84 0.448 C 14.1 1.2 0.3 1.0 6.0 2.5
Confinement R Seible et al. (1997)
28.7 19.3 144.0 4998 0.14 4.65 0.128 C 107.2 1.4 0.4 2.7 3.3 2.8
Shear R 24.0 16.0 96.0 4998 0.06 2.52 0.154 S 97.9 1.2 0.1 1.5 2.3 2.1
C3
Wu et al. (2008)
7.9 7.9 52.0 6775 0.24 2.00 0.000 C 10.8 1.3 1.0 2.1 7.2 6.2
C4 7.9 7.9 52.0 6804 0.23 2.00 0.000 C 11.8 1.3 1.1 2.4 8.0 6.9
C5 7.9 7.9 52.0 5281 0.30 2.00 0.000 C 11.1 1.3 1.0 4.0 7.2 6.2
C6 7.9 7.9 52.0 5368 0.30 2.00 0.000 C 11.0 1.3 1.0 2.0 7.3 6.3
ASG-2NSS
Memon and Sheikh
(2005)
12.0 12.0 58.0 6165 0.15 2.44 0.316 C 24.6 1.4 0.7 4.6 23.7 2.6
ASG-3NSS 12.0 12.0 58.0 6195 0.15 2.44 0.316 C 24.9 1.4 0.2 6.0 12.0 3.5
ASG-4NSS 12.0 12.0 58.0 6282 0.15 2.44 0.316 C 24.2 1.4 0.3 2.4 11.4 2.0
ASG-5NSS 12.0 12.0 58.0 6340 0.15 2.44 0.316 C 24.4 1.4 0.6 4.3 11.2 2.0
ASG-6NSS 12.0 12.0 58.0 6412 0.15 2.44 0.316 C 29.8 1.4 0.9 11.8 20.7 5.4
ASGR-7NSS 12.0 12.0 58.0 6412 0.15 2.44 0.316 C 24.2 1.4 0.5 5.8 14.9 2.6
ASGR-8NSS 12.0 12.0 58.0 6412 0.15 2.44 0.316 C 25.8 1.4 1.0 4.7 12.2 3.4
ASC-2NS
Iacobucci et al.
(2003)
12.0 12.0 58.0 5295 0.15 2.44 0.321 C 30.4 1.3 0.3 0.7 2.3 1.3
ASC-3NS 12.0 12.0 58.0 5353 0.15 2.44 0.321 C 31.8 1.3 0.2 0.6 2.2 2.0
ASC-4NS 12.0 12.0 58.0 5353 0.15 2.44 0.321 C 26.7 1.3 0.1 0.3 2.2 0.7
ASC-5NS 12.0 12.0 58.0 5368 0.15 2.44 0.321 C 33.7 1.3 0.4 2.2 4.5 2.3
ASC-6NS 12.0 12.0 58.0 5368 0.15 2.44 0.321 C 31.0 1.3 0.2 0.8 3.8 1.7
ASCR-7NS 12.0 12.0 58.0 5368 0.15 2.44 0.321 C 29.3 1.3 0.4 0.7 5.2 2.5
ASCR-8NS 12.0 12.0 58.0 6136 0.15 2.44 0.321 C 24.5 1.3 0.6 2.0 3.0 2.3
F2Harries et al. (2006)
18.0 18.0 70.1 3597 0.22 1.48 0.180 C 35.0 1.4 1.1 7.7 13.4 6.2
L1 18.0 18.0 70.1 4162 0.22 1.48 0.180 LS 36.2 1.4 1.0 5.6 11.4 6.0
L2 18.0 18.0 70.1 4162 0.22 1.48 0.180 LS 36.4 1.4 1.2 5.8 8.6 5.4
RF-R1
Haroun and Elsanadedy (2005a,b)
24.0 24.0 135.0 5135 0.06 2.14 0.103 LS 55.9 1.3 0.7 2.4 2.8 2.1
RF-R2 24.0 24.0 135.0 6078 0.05 2.14 0.103 LS 56.2 1.3 0.7 1.1 4.5 3.8
RF-R3 24.0 24.0 135.0 6122 0.05 2.14 0.103 LS 60.3 1.4 0.7 2.0 3.6 2.8
RF-R4 24.0 24.0 135.0 6122 0.05 2.14 0.103 LS 59.2 1.3 0.8 1.7 3.5 2.7
RS-R1 24.0 18.0 96.0 5527 0.06 2.04 0.137 S 107.0 1.3 0.2 1.7 4.7 3.5
RS-R2 24.0 18.0 96.0 5701 0.06 2.04 0.137 S 104.6 1.3 0.3 1.1 4.7 3.5
RS-R3 24.0 18.0 96.0 6383 0.06 2.04 0.137 S 105.1 1.3 0.2 1.5 4.4 4.1
RS-R4 24.0 18.0 96.0 6383 0.06 2.04 0.137 S 95.8 1.4 0.1 2.1 4.6 4.5
RS-R5 24.0 18.0 96.0 6383 0.06 2.04 0.137 S 97.2 1.4 0.2 2.5 4.2 4.0
RS-R6 24.0 18.0 96.0 6180 0.06 2.04 0.137 S 107.0 1.3 0.2 1.8 4.9 4.7
C1FP1
Harajli and Rteil (2004)
11.8 5.9 39.4 3061 0.23 1.72 0.354 LS 10.9 1.4 0.9 3.0 6.0 3.4
C1FP2 11.8 5.9 39.4 3148 0.22 1.72 0.354 LS 5.5 3.9 0.6 3.0 5.1 3.3
C1F1 11.8 5.9 39.4 3177 0.22 1.72 0.354 LS 12.5 1.3 0.9 2.0 5.0 2.5
C1F2 11.8 5.9 39.4 3163 0.22 1.72 0.354 LS 11.2 1.4 1.0 3.0 5.1 3.4
C2FP1 11.8 5.9 39.4 3061 0.27 3.56 0.354 LS 15.2 1.4 0.8 3.0 5.1 3.0
C2FP2 11.8 5.9 39.4 3148 0.26 3.56 0.354 LS 15.1 1.4 0.7 3.0 5.1 3.2
C2F1 11.8 5.9 39.4 3177 0.26 3.56 0.354 LS 15.6 1.4 0.8 3.1 5.0 3.4
C2F2 11.8 5.9 39.4 3163 0.26 3.56 0.354 LS 15.3 1.4 0.8 3.0 5.1 3.4

57ACI Structural Journal/January 2018
from peak strength, maximum drift, and, if available, loss of axial load-carrying capacity. It should be noted that the results reported in the literature were used directly without modification to include P-∆ effects. The residual strength
after loss of axial capacity and maximum drift were assumed based on experience with unjacketed columns because of lack of experimental data reporting these values.
Table 2(cont.)—Properties of jacketed columns in database: rectangular columns
Specimen Referencebc, in. hc, in. H, in. fc′, psi P/Agfc′ ρ, % ρv, %
Deficient property* Vy, kip Vpeak/Vy
Δy/H, %
Δp/H, %
Δmax/H, % Par. a
SAF1-10NGhosh and
Sheikh (2007)
12.0 12.0 57.9 3887 0.33 2.44 0.321 LS 19.9 1.3 0.8 2.5 7.8 3.2
SBF1-11N 12.0 12.0 57.9 3916 0.05 2.44 1.205 LS 14.3 1.3 0.8 2.3 3.8 2.1
SBRF1-12N 12.0 12.0 57.9 3945 0.05 2.44 1.205 LS 10.2 1.4 1.9 3.9 8.1 3.5
ASC-2NS 12.0 12.0 57.9 5294 0.33 2.44 1.205 LS 24.3 1.3 0.8 1.7 7.5 2.8
C14FP1
Harajli and Dagher (2008)
15.7 7.9 59.1 5656 0.00 1.29 0.735 LS 15.4 1.3 0.6 2.1 6.4 2.8
C14FP2 15.7 7.9 59.1 5656 0.00 1.29 0.735 LS 16.3 1.3 0.5 3.2 6.4 3.8
C16FP1 15.7 7.9 59.1 7107 0.00 2.00 0.735 LS 20.0 1.3 0.9 2.1 6.5 2.3
C16FP2 15.7 7.9 59.1 7107 0.00 2.00 0.735 LS 19.3 1.3 0.9 2.2 6.5 3.8
C20FP1 15.7 7.9 59.1 4641 0.00 2.13 0.735 LS 22.8 1.3 1.0 2.1 6.5 2.2
C20FP2 15.7 7.9 59.1 4641 0.00 2.13 0.735 LS 25.5 1.3 1.0 3.2 6.4 2.9
SC2
Galal et al. (2005)
12.0 12.0 36.0 5658 0.14 6.11 0.904 S 76.6 1.3 0.1 1.8 5.7 5.6
SC1R 12.0 12.0 36.0 4932 0.16 6.11 0.904 S 72.8 1.2 0.3 1.8 5.8 3.8
SC2R 12.0 12.0 36.0 4932 0.16 6.11 0.904 S 76.4 1.3 0.3 1.8 4.2 2.4
SC1U 12.0 12.0 36.0 6238 0.12 6.11 0.904 S 45.4 2.2 0.1 0.9 5.6 3.2
SC3 12.0 12.0 36.0 5658 0.14 6.11 0.904 S 78.4 1.3 0.2 1.8 5.7 4.0
SC3R 12.0 12.0 36.0 4932 0.16 6.11 0.904 S 54.6 1.3 0.3 0.6 3.6 1.3
Steel-jacketed rectangular columns
C-66-R Alcocer and Durán-
Hernández (2002)
19.7 19.7 78.7 4047 0.15 2.44 0.142 C 42.0 1.4 1.0 2.5 † 1.5
C-66-S 19.7 19.7 78.7 4047 0.15 2.44 0.142 C 64.7 1.4 1.0 2.7 † 1.7
RC-2R
Xiao and Wu (2003)
10.0 10.0 40.0 8269 0.30 2.48 0.220 C 45.8 1.4 0.4 2.1 6.0 3.1
RC-3R 10.0 10.0 40.0 8269 0.30 2.48 0.220 C 51.4 1.4 0.5 3.0 8.0 7.5
RC-4R 10.0 10.0 40.0 8269 0.30 2.48 0.220 C 50.9 1.4 0.4 3.1 8.0 6.8
RC-5R 10.0 10.0 40.0 8704 0.30 2.48 0.220 C 52.7 1.4 0.4 3.1 8.5 8.1
FC9
Aboutaha et al. (1996)
18.0 36.0 144.0 2906 0.00 1.95 0.095 LS 38.4 1.4 0.5 2.7 4.9 3.2
FC11 18.0 36.0 144.0 2851 0.00 1.95 0.095 LS 45.4 1.4 0.8 2.4 5.5 2.5
FC12 18.0 36.0 144.0 3266 0.00 1.95 0.095 LS 43.1 1.4 0.6 2.7 5.5 3.7
FC17 18.0 18.0 144.0 2636 0.00 1.95 0.076 LS 45.6 1.4 0.2 2.4 5.4 5.2
FC6
Aboutaha et al. (1999b)
18.0 36.0 144.0 2851 0.00 1.95 0.095 LS 34.9 1.4 1.0 2.5 4.6 2.2
FC7 18.0 36.0 144.0 2981 0.00 1.95 0.153 LS 52.0 1.4 1.5 3.9 † 2.4
FC10 18.0 36.0 144.0 2596 0.00 1.95 0.095 LS 37.2 1.4 0.8 2.4 3.4 2.6
FC13 18.0 36.0 144.0 3266 0.00 1.95 0.095 LS 50.0 1.4 0.4 3.6 5.0 4.6
SC6
Aboutaha et al. (1999a)
18.0 36.0 48.0 2256 0.00 1.95 0.095 S 111.1 1.4 1.0 3.3 5.1 3.2
SC7 18.0 36.0 48.0 2941 0.00 1.95 0.095 S 101.2 1.4 0.5 4.2 6.3 5.8
SC8 18.0 36.0 48.0 2786 0.00 1.95 0.095 S 109.7 1.4 0.7 3.9 7.0 5.8
SC10 36.0 18.0 48.0 2391 0.00 1.95 0.191 S 205.2 1.4 0.6 4.0 5.3 4.7
R2RPriestley
et al. (1994a,b)
16.0 24.0 96.0 5601 0.05 2.52 0.163 S 104.4 1.4 0.3 3.6 ‡
R4R 16.0 24.0 96.0 5201 0.06 2.52 0.082 S 154.7 1.4 0.3 3.8 ‡
R6R 16.0 24.0 72.0 4801 0.06 2.52 0.082 S 205.6 1.4 0.4 3.7 ‡
*S is shear deficient; C is inadequate confinement; LS is short lap splice.†Test stopped when capacity of actuator was reached.‡Test stopped at maximum displacement capacity of actuator.
Notes: 1 in. = 25.4 mm; 1 kip = 4.45 kN; 1000 psi = 6.89 MPa.

58 ACI Structural Journal/January 2018
The procedure used to consistently define the key points in the force-deformation response of jacketed columns is illustrated schematically in Fig. 2. Shear at yield and defor-mation at yield (Vy, Δy) were determined as the coordinates of the point of intersection of two lines drawn on the hyster-esis curve. One line was parallel to the initial slope of the measured force-deformation response of the specimens and the second line was drawn horizontally at a shear force equal to either 0.8Vpeak or 0.7Vpeak, depending on the shape of the hysteresis curve. A shear force of 0.8Vpeak was chosen if the drift at peak was equal or less than 2% followed by rapid strength loss at increasing drift amplitudes. Otherwise, the shear force at yield was assumed equal to 0.7Vpeak (Alvarez and Breña 2014). The peak shear force Vpeak was simply taken as the highest applied lateral load during testing. Almost all the columns in the database were not tested beyond a strength degradation corresponding to a 20% drop from Vpeak. Therefore, the residual strength of the columns was assumed equal to 0.2Vpeak. The force values thus determined were used to evaluate whether the simple sectional models described later in this paper can be used to estimate yield and peak force of retrofitted columns. Drifts were studied statis-tically to propose values corresponding to different exceed-ance probabilities that can be used in practice.
NONLINEAR MODELING OF JACKETED COLUMNS
Nonlinear modeling of reinforced concrete frames has become widespread in structural engineering practice with the availability of software capable to perform these types of analyses efficiently. Although significant efforts have been made to develop modeling procedures for existing reinforced concrete components, recommendations on how to approach modeling of retrofitted frame components are lacking. One retrofitting approach is to jacket frame components to improve performance, particularly in regions anticipated to undergo inelastic deformations. Typical reinforcing details found in columns in older reinforced concrete frames have been identified as the cause for nonductile column perfor-mance in past earthquakes and related experimental testing. The performance of these columns can be improved by jack-
eting the region of anticipated inelastic action, but the effect of this local retrofitting technique on the global response of a frame is not well understood. This section focuses on developing an approach to construct the nonlinear backbone response of jacketed columns for use in nonlinear analyses of retrofitted frames.
The response of jacketed columns has been studied exten-sively in laboratory tests conducted over the last 30 years. These studies were initiated after dramatic failures of bridges containing columns with deficient details occurred during earthquakes in the two decades that followed the 1970s (for example, 1971 San Fernando Earthquake; and Hanshin Expressway in 1994 Kobe Earthquake). Although failures of columns in frames have not been pervasive, the reinforcing details that these elements contain are known to result in unsatisfactory performance under large earthquakes. The potentially high consequence caused by failures of defi-cient columns in framed buildings can be mitigated using local retrofitting—for example, by using jacketing in plastic hinge zones near the end of columns. Development of local retrofitting techniques by jacketing of columns was accom-plished through laboratory testing, but modeling guidelines aimed at capturing the nonlinear response of these jacketed components were not developed accordingly.
The data from experiments of jacketed columns presented in the previous section of this paper were used to compare the calculated values with measured response to provide confidence in the proposed recommendations developed to construct the nonlinear backbone response of jacketed columns. Constructing the nonlinear backbone response of jacketed columns requires knowledge of the force developed and its corresponding deformation at various lateral load demands. The procedures followed to determine these two groups of parameters (force and deformation) at various demands were different. Internal forces at different demand levels (yield strength, peak strength, and residual strength) were determined using well-established sectional models calibrated to closely capture the measured response of jacketed columns in the experiments. The deformations (lateral drift) corresponding to each force level (yield, peak, drift at residual strength) were determined through statis-
Fig. 2—Simplified backbone curve obtained from measured hysteretic response: (a) hysteresis curve with superimposed back-bone; and (b) simplified nonlinear backbone curve and nonlinear parameters.

59ACI Structural Journal/January 2018
tical analysis of available data given the large variation of drifts observed during the tests and the lack of a robust drift model that captures drift values reliably. The procedures to determine these force and deformation parameters required to construct nonlinear backbone curves of jacketed columns are presented in more detail in the following sections. These methods can be easily applied in practice, as their use only requires knowledge of the geometric and material properties of a given jacketed column.
Lateral load strength of jacketed column sectionsThe sectional model used to determine yield and peak
force of jacketed columns assumed that behavior is governed by flexure (no shear failure) after retrofitting and that shear-moment interaction can be neglected. These assump-tions were verified by calculating the shear strength of retro-fitted columns using the models proposed by Priestley et al. (1994a,b) and Seible et al. (1997) for steel jacketed and FRP jacketed columns, respectively. At the maximum imposed displacement in the tests, the ratio of applied load to calcu-lated shear strength did not exceed 0.86 for FRP-jacketed and 0.89 for steel-jacketed columns, respectively. These results imply that the jacketed columns included in this study would be expected to develop flexural hinges prior to shear failure, at the largest displacement demands experienced during the tests. Flexural yield and flexural strength were there-fore calculated using a moment-curvature analysis of the retrofitted cross sections. Moment-curvature analysis was chosen because of its computational efficiency and accuracy for sections controlled by flexure. After the moment associ-ated with each of these two conditions was computed, the shear force corresponding to yield (Vy) and peak strength (VPeak) was determined based on the relationship between moment and shear in each test column. The yield and peak shear values were compared with the database of jacketed column test results and found to perform well for undam-aged columns prior to retrofitting and for columns with an axial force ratio (P/(Agfc′)) equal or less than 0.10.
To determine flexural yield and peak moment with the sectional model, the column section was discretized using fibers to represent concrete, reinforcing steel, and jacket materials. The behavior of each fiber was assumed to be governed by the uniaxial stress-strain response of each material, as is commonly done when using fiber section models. It is worth noting that the behavior of concrete was represented by a confined concrete model for concrete in compression, assuming that the externally applied jacket was effective in confining the concrete throughout the cross section. The decrease in confinement efficiency of the jacket, particularly in the case of rectangular cross sections, was considered as will be described as follows.
The uniaxial stress-strain behavior of concrete was modeled including the effects of confinement for concrete in compression and a linear elastic model for concrete in tension. The strength of concrete confined by steel or FRP jackets was calculated using the models proposed by Priestley et al. (1994a,b) or Lam and Teng (2003a,b), respec-tively. The use of these models is suitable for the range of concrete strengths found in the jacketed column database
(maximum of 8300 psi [56 MPa]). Once the confined concrete strength was determined, the model developed by Mander et al. (1988) was used to construct the complete uniaxial stress-strain relation for confined concrete, therefore neglecting the further increase in confined concrete strength that results from FRP confinement, particularly at large axial strains. It was considered that, for the load levels applied during testing of the columns included in the database, the axial strains generated in the compression zone from flexure would not result in a significant further increase in confined concrete strength. The effects of confinement from steel or FRP jackets was represented as confinement by an equivalent amount of transverse reinforcement by equating the lateral confining stress from each jacket type to that developed by transverse reinforcement at a given spacing (Alvarez and Breña 2014). Confinement efficiency is reduced by arching that develops between layers of transverse steel and between longitudinal bars laterally restrained by the corners of hoops or ties. These two effects were considered in the model by decreasing the confining stress efficiency of jackets as appli-cable (refer to Alvarez and Breña [2014] for further details).
Longitudinal reinforcing steel was modeled using an elas-toplastic material model with strain hardening. The contri-bution of the steel or FRP jackets to flexural strength of the cross section was only considered for their effect on concrete confinement. For steel jackets, their contribution to increase the total tension force in the cross section was neglected because of the potential for slip between the jacket and grout used to fill the concrete-steel gap. FRP jackets are typically applied with fibers oriented perpendicular to the column axis so their contribution to increased flexural strength was also neglected. The confinement provided by jacketing is passive, activated when the concrete expands due to microcracking. Similar to confinement provided by closely spaced hoops, jacket confinement efficiency depends on the properties of the jacket (strength and stiffness) and cross-sectional geom-etry (circular or rectangular column).
The sectional model provided reasonably accurate results when the original column had not been damaged prior to jacketing, and the existing longitudinal reinforcement was continuous. The yield and peak strength of columns that were damaged before jacketing could not be accurately calculated using a moment-curvature approach as described in this paper. In columns containing lapped longitudinal reinforcement within the plastic hinge region, the maximum stress in the longitudinal reinforcement was calculated using a modified version of the equation proposed by Cho and Pincheira (2006), which estimates bar stress as a nonlinear function of splice length lb in accordance with
fs = 1.25(lb/ld)2/3fy ≤ fy (1)
where ld is the calculated development length of the bars in accordance with ACI 318-14, and fy is the nominal yield stress of the bar. Figure 3 compares yield strength (Vy) and peak strength (Vpeak) values determined using the moment-curvature analysis of the column cross section and the experimentally determined values of jacketed columns in the database. For most columns in the database, the discrep-

60 ACI Structural Journal/January 2018
ancy between calculated and measured values at yield and peak do not exceed 10%, as shown in the figure. Given the simple sectional model used, a difference of 10% in calculated and measured shear strength at yield and peak is considered adequate, given the large variations in jacketing configurations between testing programs and the diverse deficiencies that the original columns contained. A sectional model that incorporates the assumptions described in this paper is therefore recommended in practice to estimate yield and peak force of jacketed columns.
Lateral deformation (drift) of jacketed columnsSeveral deformation components contributed to the total
drift in jacketed columns in the database. These components, also common in other reinforced concrete elements, include flexural deformation, shear deformation, and rigid body rotation induced by bar slippage. Any mechanistic model that would capture these effects would be too complex for use in design (in contrast to the relatively straightforward sectional model for force levels presented in the previous section). Therefore, the database of experimental results was used to directly calibrate an empirical model for drift at 80% of peak force for columns with low axial force ratios. These values could then be used to find nonlinear drift param-eter a to construct the backbone nonlinear response curves of jacketed columns. When the axial force ratio was high (>0.60), insufficient data were available and, therefore, the value of parameter a for well-designed unjacketed columns was adopted. For drift parameter b, the drift at which only residual shear capacity remains, values from well-designed unjacketed columns were adopted for both low and high axial force ratios because insufficient test data on jacketed
columns are available. The statistical analysis procedure employed in this process is described in this section.
Statistical analysis of drift data for jacketed columns in database—Histograms that show plastic drift data (param-eter a) of columns in the database are presented in Fig. 4, distinguished only by jacket type (FRP or steel) without separation by cross-sectional shape. Instead of illustrating the distribution of measured deformation data directly, parameter a (plastic drift capacity) was chosen as a directly meaningful parameter to represent the nonlinear drift data in accordance with ASCE/SEI 41-13. Parameter a was determined for each jacketed column in the database as the difference between the drift corresponding to a 20% reduc-tion in lateral load and the drift at yield defined as described previously. The data show differences in parameter a between FRP-jacketed and steel-jacketed columns. FRP-jack-eted columns have a range of parameter a from 0.0073 to 0.0882—a mean value of 0.0380 and a ±1 standard devia-tion range of 0.0213 to 0.0547. In contrast, steel-jacketed columns have parameter a-values that range from 0.0149 to 0.0812, a mean value of 0.0413, and a ±1 standard deviation range of 0.0246 to 0.0580. The drift data and the general behavior observed from the reported hysteresis curves also indicated that cross-sectional shape was an important factor that influenced the deformation behavior of jack-eted columns. The average plastic deformation capacity of circular sections for both FRP- and steel-jacketed columns was slightly higher than for rectangular columns, primarily due to the higher confining and lap-splice clamping effi-ciency of circular jackets over rectangular ones.
Cross section shape appears to have a meaningful effect on structural response; therefore, Fig. 4 shows the data histo-
Fig. 3—Comparison between calculated and laboratory jacketed column strength: (a) and (b) shear at yield; and (c) and (d) shear at peak strength. (Note: 1 kip = 4.45 kN.)

61ACI Structural Journal/January 2018
grams separated by cross-sectional shape. Although sepa-rating data into groups in this way results in modest sample sizes for each group, it is needed because the mechanics of confinement differ for circular and rectangular columns and, furthermore, the number of samples is not inconsistent with the amount of data available for other reinforced concrete components for which limited laboratory tests have been conducted. A comparison of parameter a data with three typical statistical distributions (lognormal, Weibull, and Rayleigh) is presented in Fig. 5. These three distributions were chosen because they all satisfy the physical constraint that parameter a must always have values exceeding zero. Although both the Weibull and lognormal distributions provide good fits to central values of the data, the lognormal distribution has a much heavier upper tail than is indicated by the data, which would lead to significant probability of highly unconservative values of drift. Therefore, the Weibull distribution was selected as the appropriate statistical model for drift, and fitting parameters for the data shown in Fig. 5 are listed in Table 3. Using this distribution, parameter a values were calculated for a range of probabilities of exceedance between 50 and 95%, as given in Table 4. These data are provided to allow for selection of design values for param-eter a based on exceedance probability in place of the mean value. For both jacketing materials, there is a clear differ-ence between parameter a depending on section shape. It is clear that plastic drift capacity (parameter a) is greater in circular columns than in rectangular columns, as would be expected given the higher confining and clamping efficiency of jackets on circular cross sections. The estimated plastic drifts that columns can sustain are comparable between jack-eted circular columns independent of jacket material. For rectangular columns, steel-jacketed columns are estimated to reach higher plastic drifts than FRP-jacketed columns, as would be expected because of the higher bending stiff-ness of steel jackets. The comparisons are in line with the anticipated differences in behavior of circular and rectan-gular columns jacketed with either steel or FRP materials. It should be noted that although a similar statistical analysis of parameter b would be desirable, insufficient data exist in the open literature to perform such an analysis because many of the published tests were stopped prior to the column
reaching residual capacity. This points to a need for further testing that extends the testing protocol to the point where the force decays to residual capacity.
RECOMMENDED BACKBONE PARAMETERS FOR JACKETED COLUMNS
The ACI 369R-11 contains modeling parameters for components of existing frame buildings and is in the process of being updated by using recent test data and statistical studies of available component tests. As noted previously, modeling recommendations for retrofitted components are lacking, so there is a need to provide this information. The approach being followed by ACI 369R is to use mean defor-mation values from tests to define modeling parameters. The suggested values in this section were developed with this approach in mind to facilitate future adoption of the tabulated values in updates of the ACI 369R and ASCE/SEI 41 docu-ments. It is important to note that, due to differences in the ability to model force and drift levels for retrofitted columns and differences in the availability of data for different param-eters in the backbone curve, a hybrid approach to specifying backbone curve parameters is used herein. For the force levels at yield and peak, a mechanistic sectional model was proposed and validated. For drift parameter a, experimental data were analyzed and a probabilistic model was fit to the data. Although herein the mean value is recommended to be consistent with current recommended practice, the proba-bilistic model is described so that in the future, it will be possible to specify design values based on desired exceed-ance probability rather than simply using the mean value. For drift parameter b, recommendations for unretrofitted columns were adopted in the absence of sufficient data for
Table 3—Fitting parameters for Weibull distribution of parameter a
Jacketing material Cross section shape
Weibull fitting parameters
μ k
FRPCircular 0.0553 2.91
Rectangular 0.0380 2.64
SteelCircular 0.0471 4.74
Rectangular 0.0458 2.36
Fig. 4—Histograms of parameter a for FRP- and steel-jacketed columns.

62 ACI Structural Journal/January 2018
jacketed columns. This assumption is conservative because jacketing would be expected to increase drift relative to an unjacketed column.
Based on the statistical analysis of jacketed columns, mean values of parameter a for the two cross sections studied (circular and rectangular) and the two jacket materials included in the database (FRP and steel) were computed (Table 5). These four categories are consistent with the way the data were organized and statistically studied. Because of the limitations found in the jacketed column experimental data-
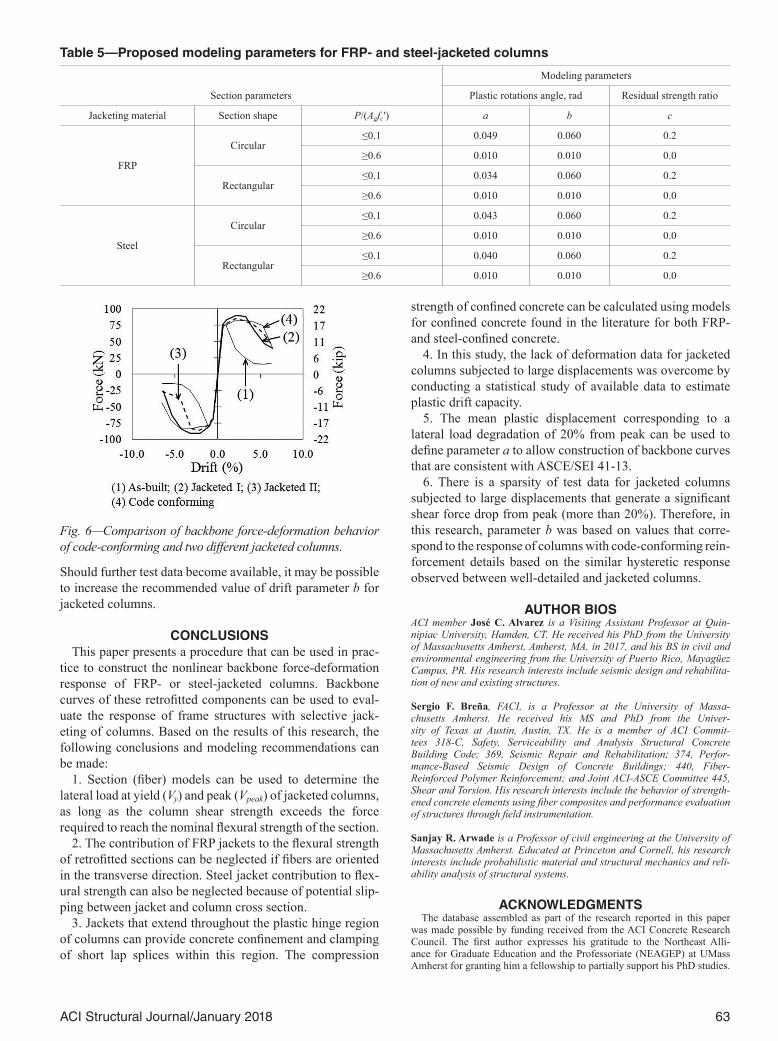
base, mean data were only computed for parameter a and for columns tested under low values of axial force (P/(Agfc′) ≤ 0.10). Recommended values of other parameters (b and c, the residual capacity ratio) are based on the similarities observed in the behavior of jacketed columns in comparison with columns containing reinforcing details representative of new design (code conforming columns). The similarities in backbone behavior of an originally deficient column that has been retrofitted using two different jacketing configura-tions with the behavior of a similar code-conforming column is shown in Fig. 6. The behavior of the jacketed columns is remarkably similar to that of columns with well-detailed reinforcement, providing support for using modeling param-eters of these columns for jacketed columns where there are no available laboratory data.
Very few jacketed column tests have been conducted to the large displacement demands needed to generate axial load failures. One of the few test series of jacketed column tests conducted to the point of residual lateral load levels is the work reported by Ghosh and Sheikh (2007). The tests included reinforced concrete columns containing short lap splices retrofitted with FRP jackets. Some of the tests reported in this research reached rupture of the jacket and lateral load degradation of 90% from the peak strength at a plastic drift of 11%. These tests demonstrate that plastic drift at strength degradation reaches values that exceed those being proposed based on results of well-detailed columns and provides support for the conservative adoption of param-eter b values based on well-detailed but unjacketed columns.
Table 4—Values of parameter a for selected probabilities of exceedance
Probability of exceedance, %
Parameter a
FRP-jacketed Steel-jacketed
Circular Rectangular Circular Rectangular
95 0.0199 0.0123 0.0251 0.0130
90 0.0255 0.0161 0.0293 0.0176
85 0.0296 0.0190 0.0321 0.0212
80 0.0330 0.0214 0.0343 0.0242
75 0.0360 0.0236 0.0362 0.0270
70 0.0388 0.0256 0.0379 0.0295
65 0.0414 0.0275 0.0394 0.0320
60 0.0439 0.0294 0.0408 0.0344
55 0.0463 0.0312 0.0422 0.0368
50 0.0487 0.0330 0.0436 0.0392
Fig. 5—Distribution of parameter a and fitted lognormal, Weibull, and Rayleigh statistical distributions.
63ACI Structural Journal/January 2018
Should further test data become available, it may be possible to increase the recommended value of drift parameter b for jacketed columns.
CONCLUSIONSThis paper presents a procedure that can be used in prac-
tice to construct the nonlinear backbone force-deformation response of FRP- or steel-jacketed columns. Backbone curves of these retrofitted components can be used to eval-uate the response of frame structures with selective jack-eting of columns. Based on the results of this research, the following conclusions and modeling recommendations can be made:
1. Section (fiber) models can be used to determine the lateral load at yield (Vy) and peak (Vpeak) of jacketed columns, as long as the column shear strength exceeds the force required to reach the nominal flexural strength of the section.
2. The contribution of FRP jackets to the flexural strength of retrofitted sections can be neglected if fibers are oriented in the transverse direction. Steel jacket contribution to flex-ural strength can also be neglected because of potential slip-ping between jacket and column cross section.
3. Jackets that extend throughout the plastic hinge region of columns can provide concrete confinement and clamping of short lap splices within this region. The compression
strength of confined concrete can be calculated using models for confined concrete found in the literature for both FRP- and steel-confined concrete.
4. In this study, the lack of deformation data for jacketed columns subjected to large displacements was overcome by conducting a statistical study of available data to estimate plastic drift capacity.
5. The mean plastic displacement corresponding to a lateral load degradation of 20% from peak can be used to define parameter a to allow construction of backbone curves that are consistent with ASCE/SEI 41-13.
6. There is a sparsity of test data for jacketed columns subjected to large displacements that generate a significant shear force drop from peak (more than 20%). Therefore, in this research, parameter b was based on values that corre-spond to the response of columns with code-conforming rein-forcement details based on the similar hysteretic response observed between well-detailed and jacketed columns.
AUTHOR BIOSACI member José C. Alvarez is a Visiting Assistant Professor at Quin-nipiac University, Hamden, CT. He received his PhD from the University of Massachusetts Amherst, Amherst, MA, in 2017, and his BS in civil and environmental engineering from the University of Puerto Rico, Mayagüez Campus, PR. His research interests include seismic design and rehabilita-tion of new and existing structures.
Sergio F. Breña, FACI, is a Professor at the University of Massa-chusetts Amherst. He received his MS and PhD from the Univer-sity of Texas at Austin, Austin, TX. He is a member of ACI Commit-tees 318-C, Safety, Serviceability and Analysis Structural Concrete Building Code; 369, Seismic Repair and Rehabilitation; 374, Perfor-mance-Based Seismic Design of Concrete Buildings; 440, Fiber- Reinforced Polymer Reinforcement; and Joint ACI-ASCE Committee 445, Shear and Torsion. His research interests include the behavior of strength-ened concrete elements using fiber composites and performance evaluation of structures through field instrumentation.
Sanjay R. Arwade is a Professor of civil engineering at the University of Massachusetts Amherst. Educated at Princeton and Cornell, his research interests include probabilistic material and structural mechanics and reli-ability analysis of structural systems.
ACKNOWLEDGMENTSThe database assembled as part of the research reported in this paper
was made possible by funding received from the ACI Concrete Research Council. The first author expresses his gratitude to the Northeast Alli-ance for Graduate Education and the Professoriate (NEAGEP) at UMass Amherst for granting him a fellowship to partially support his PhD studies.
Fig. 6—Comparison of backbone force-deformation behavior of code-conforming and two different jacketed columns.
Table 5—Proposed modeling parameters for FRP- and steel-jacketed columns
Section parameters
Modeling parameters
Plastic rotations angle, rad Residual strength ratio
Jacketing material Section shape P/(Agfc′) a b c
FRP
Circular≤0.1 0.049 0.060 0.2
≥0.6 0.010 0.010 0.0
Rectangular≤0.1 0.034 0.060 0.2
≥0.6 0.010 0.010 0.0
Steel
Circular≤0.1 0.043 0.060 0.2
≥0.6 0.010 0.010 0.0
Rectangular≤0.1 0.040 0.060 0.2
≥0.6 0.010 0.010 0.0

64 ACI Structural Journal/January 2018
REFERENCESAboutaha, R. S.; Engelhardt, M. D.; Jirsa, J. O.; and Kreger, M. E., 1996,
“Retrofit of Concrete Columns with Inadequate Lap Splices by the Use of Rectangular Steel Jackets,” Earthquake Spectra, V. 12, No. 4, pp. 693-714. doi: 10.1193/1.1585906
Aboutaha, R. S.; Engelhardt, M. D.; Jirsa, J. O.; and Kreger, M. E., 1999a, “Rehabilitation of Shear Critical Concrete Columns by Use of Rectangular Steel Jackets,” ACI Structural Journal, V. 96, No. 1, Jan.-Feb., pp. 68-78.
Aboutaha, R. S.; Engelhardt, M. D.; Jirsa, J. O.; and Kreger, M. E., 1999b, “Experimental Investigation of Seismic Repair of Lap Splice Fail-ures in Damaged Concrete Columns,” ACI Structural Journal, V. 96, No. 2, Mar.-Apr., pp. 297-307.
ACI Committee 369, 2011, “Guide for Seismic Rehabilitation of Existing Concrete Frame Buildings (ACI 369R-11),” American Concrete Institute, Farmington Hills, MI, 35 pp.
Alcocer, S. M., and Durán-Hernández, R., 2002, “Seismic Perfor-mance of a RC Building with Columns Rehabilitated with Steel Angles and Straps. Innovations in Design with Emphasis on Seismic, Wind, and Environmental Loading,” Quality Control and Innovations in Materials/Hot Weather Concreting, pp. 531-552.
Alvarez, J. C., and Breña, S. F., 2014, “Non-Linear Modeling Param-eters for Jacketed Columns Used in Seismic Rehabilitation of RC Build-ings,” Seismic Assessment of Reinforced Concrete Buildings, SP-297, K. J. Elwood, J. Dragovich, and I. Kim, eds., American Concrete Institute, Farm-ington Hills, MI. (CD-ROM)
ASCE/SEI 41-13, 2013, “Seismic Rehabilitation of Existing Buildings,” American Society of Civil Engineers, Reston, VA.
Breña, S. F., and Schlick, B. M., 2007, “Hysteretic Behavior of Bridge Columns with FRP-Jacketed Lap Splices Designed for Moderate Ductility Enhancement,” Journal of Composites for Construction, ASCE, V. 11, No. 6, pp. 565-574. doi: 10.1061/(ASCE)1090-0268(2007)11:6(565)
Chai, Y. H.; Nigel Priestley, M. J. N.; and Seible, F., 1991, “Seismic Retrofit of Circular Bridge Columns for Enhanced Flexural Performance,” ACI Structural Journal, V. 88, No. 5, Sept.-Oct., pp. 572-584.
Cho, J.-Y., and Pincheira, J. A., 2006, “Inelastic Analysis of Reinforced Concrete Columns with Short Lap Splices Subjected to Reversed Cyclic Loads,” ACI Structural Journal, V. 103, No. 2, Mar.-Apr., pp. 280-290.
Galal, K.; Arafa, A.; and Ghobarah, A., 2005, “Retrofit of RC Square Short Columns,” Engineering Structures, V. 27, No. 5, pp. 801-813. doi: 10.1016/j.engstruct.2005.01.003
Ghosh, K. K., and Sheikh, S. A., 2007, “Seismic Upgrade With Carbon Fiber-Reinforced Polymer of Columns Containing Lap-Spliced Reinforcing Bars,” ACI Structural Journal, V. 104, No. 2, Mar.-Apr., pp. 227-236.
Harajli, M. H., and Dagher, F., 2008, “Seismic Strengthening of Bond-Critical Regions in Rectangular Reinforced Concrete Columns Using Fiber-Reinforced Polymer Wraps,” ACI Structural Journal, V. 105, No. 1, Jan.-Feb., pp. 68-77.
Harajli, M. H., and Rteil, A. A., 2004, “Effect of Confinement Using Fiber-Reinforced Polymer or Fiber-Reinforced Concrete on Seismic Performance of Gravity Load-Designed Columns,” ACI Structural Journal, V. 101, No. 1, Jan.-Feb., pp. 47-56.
Harries, K. A.; Ricles, J. R.; Pessiki, S.; and Sause, R., 2006, “Seismic Retrofit of Lap Splices in Nonductile Square Columns Using Carbon Fiber- Reinforced Jackets,” ACI Structural Journal, V. 103, No. 6, Nov.-Dec., pp. 708-716.
Haroun, M. A., and Elsanadedy, H. M., 2005a, “Fiber-Reinforced Plastic Jackets for Ductility Enhancement of Reinforced Concrete Bridge Columns
with Poor Lap-Splice Detailing,” Journal of Bridge Engineering, ASCE, V. 10, No. 6, pp. 749-757. doi: 10.1061/(ASCE)1084-0702(2005)10:6(749)
Haroun, M. A., and Elsanadedy, H. M., 2005b, “Behavior of Cyclically Loaded Squat Reinforced Concrete Bridge Columns Upgraded with Advanced Composite-Material Jackets,” Journal of Bridge Engineering, ASCE, V. 10, No. 6, pp. 741-748. doi: 10.1061/(ASCE)1084-0702(2005)10:6(741)
Iacobucci, R. D.; Sheikh, S. A.; and Bayrak, O., 2003, “Retrofit of Square Concrete Columns with Carbon Fiber-Reinforced Polymer for Seismic Resistance,” ACI Structural Journal, V. 100, No. 6, Nov.-Dec., pp. 785-794.
Lam, L., and Teng, J., 2003a, “Design-Oriented Stress-Strain Model for FRP-Confined Concrete,” Construction and Building Materials, V. 17, No. 6-7, pp. 471-489. doi: 10.1016/S0950-0618(03)00045-X
Lam, L., and Teng, J., 2003b, “Design-Oriented Stress-Strain Model for FRP-Confined Concrete in Rectangular Columns,” Journal of Rein-forced Plastics and Composites, V. 22, No. 13, pp. 1149-1186. doi: 10.1177/0731684403035429
Li, Y.-F.; Hwang, J.-S.; Chen, S.-H.; and Hsieh, Y.-M., 2005, “A Study of Reinforced Concrete Bridge Columns Retrofitted by Steel Jackets,” Zhongguo Gongcheng Xuekan, V. 28, No. 2, pp. 319-328. doi: 10.1080/02533839.2005.9670997
Mander, J. B.; Priestley, M. J. N.; and Park, R., 1988, “Theoret-ical Stress-Strain Model for Confined Concrete,” Journal of Struc-tural Engineering, ASCE, V. 114, No. 8, pp. 1804-1826. doi: 10.1061/(ASCE)0733-9445(1988)114:8(1804)
Memon, M. S., and Sheikh, S. A., 2005, “Seismic Resistance of Square Concrete Columns Retrofitted with Glass Fiber-Reinforced Polymer,” ACI Structural Journal, V. 102, No. 5, Sept.-Oct., pp. 774-783.
Ozcan, O.; Binici, B.; and Ozcebe, G., 2010, “Seismic Strengthening of Rectangular Reinforced Concrete Columns Using Fiber Reinforced Poly-mers,” Engineering Structures, V. 32, No. 4, pp. 964-973. doi: 10.1016/j.engstruct.2009.12.021
Priestley, M. J. N.; Seible, F.; Xiao, Y.; and Verma, R., 1994a, “Steel Jacket Retrofitting of Reinforced Concrete Bridge Columns for Enhanced Shear Strength—Part 1: Theoretical Considerations and Test Design,” ACI Structural Journal, V. 91, No. 4, July-Aug. pp. 394-405.
Priestley, M. J. N.; Seible, F.; Xiao, Y.; and Verma, R., 1994b, “Steel Jacket Retrofitting of Reinforced Concrete Bridge Columns for Enhanced Shear Strength Part 2: Test Results and Comparison with Theory,” ACI Structural Journal, V. 91, No. 5, Sept.-Oct., pp. 537-551.
Seible, F.; Priestley, M. J. N.; Hegemier, G. A.; and Innamorato, D., 1997, “Seismic Retrofit of RC Columns with Continuous Carbon Fiber Jackets,” Journal of Composites for Construction, ASCE, V. 1, No. 2, pp. 52-62. doi: 10.1061/(ASCE)1090-0268(1997)1:2(52)
Wu, Y.-F.; Wang, L.; and Liu, T., 2008, “Experimental Investigation on Seismic Retrofitting of Square RC Columns by Carbon FRP Sheet Confine-ment Combined with Transverse Short Glass FRP Bars in Bored Holes,” Journal of Composites for Construction, ASCE, V. 12, No. 1, pp. 53-60. doi: 10.1061/(ASCE)1090-0268(2008)12:1(53)
Xiao, Y., and Ma, R., 1997, “Seismic Retrofit of RC Circular Columns Using Prefabricated Composite Jacketing,” Journal of Struc-tural Engineering, ASCE, V. 123, No. 10, pp. 1357-1364. doi: 10.1061/(ASCE)0733-9445(1997)123:10(1357)
Xiao, Y., and Wu, H., 2003, “Retrofit of Reinforced Concrete Columns Using Partially Stiffened Steel Jackets,” Journal of Struc-tural Engineering, ASCE, V. 129, No. 6, pp. 725-732. doi: 10.1061/(ASCE)0733-9445(2003)129:6(725)