Noncontact Detection of Vital Signs and Vibrations Using...
48
Noncontact Detection of Vital Signs and Vibrations Using Micro-Radar Prof. Jenshan Lin University of Florida Gainesville, Florida
Transcript of Noncontact Detection of Vital Signs and Vibrations Using...
Noncontact Detection of Vital Signs
and Vibrations Using Micro-Radar
Prof. Jenshan Lin
University of Florida
Gainesville, Florida
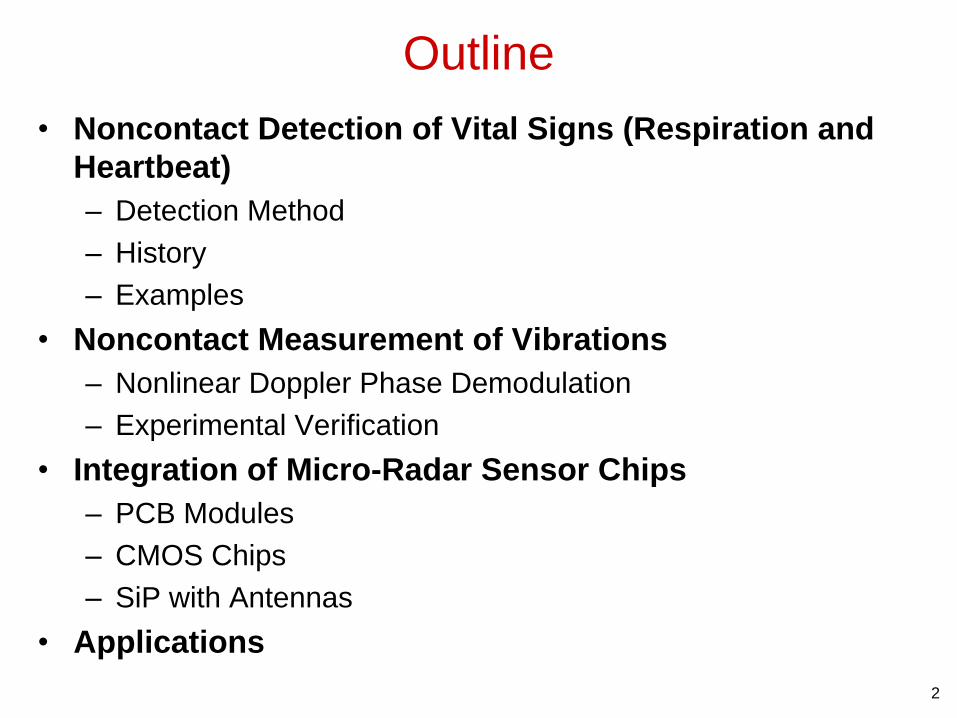
• Noncontact Detection of Vital Signs (Respiration and
Heartbeat)
– Detection Method
– History
– Examples
• Noncontact Measurement of Vibrations
– Nonlinear Doppler Phase Demodulation
– Experimental Verification
• Integration of Micro-Radar Sensor Chips
– PCB Modules
– CMOS Chips
– SiP with Antennas
• Applications
Outline
2

3
Video
This video explains:
http://news.ufl.edu/2008/12/03/baby-vital-signs/

How does it work? Doppler Effect!
Constant Velocity
Frequency Shift
Periodic Chest Wall Movement
Phase Shift
( )R t
( )T t
0d( )x t
0( )x t v t
4
( ) sin( )x t t
x(t)
T t ft t ( ) cos 2 ( )
d dx tR t ft t
c
0 04 24 ( )
( ) cos 2 ( )
d
0
4 x t
4 ( )Antenna-to-target
round-trip delay Phase modulation due to
chest-wall movement
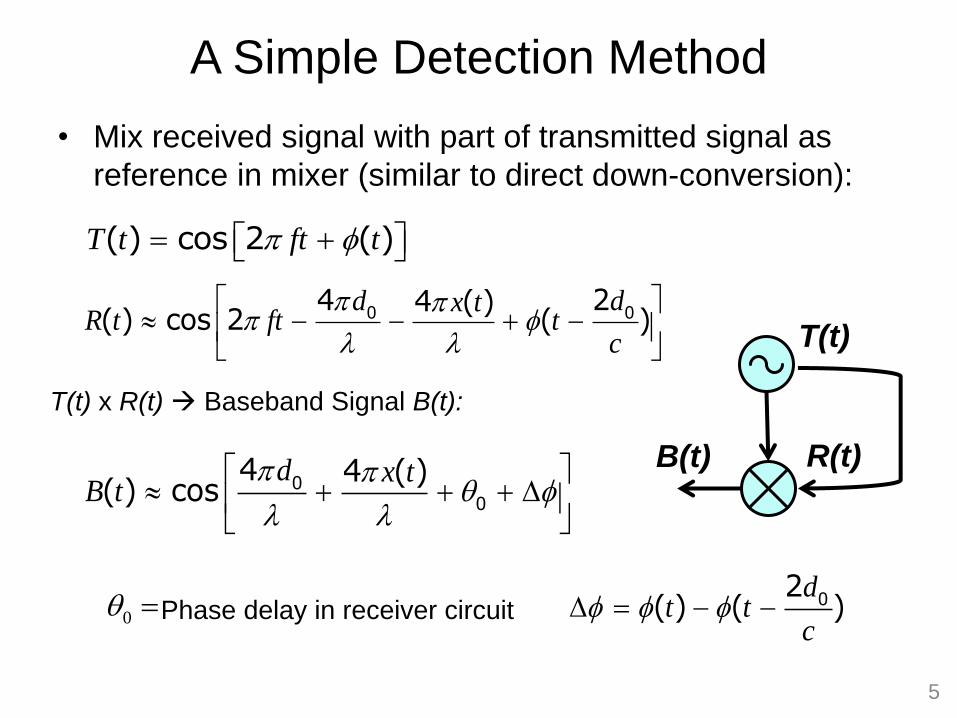
• Mix received signal with part of transmitted signal as
reference in mixer (similar to direct down-conversion):
A Simple Detection Method
T t ft t ( ) cos 2 ( )
d dx tR t ft t
c
0 04 24 ( )
( ) cos 2 ( )
T(t) x R(t) Baseband Signal B(t):
d x tB t
00
4 4 ( )( ) cos
0 d
t tc
02
( ) ( )Phase delay in receiver circuit
5
T(t)
R(t) B(t)
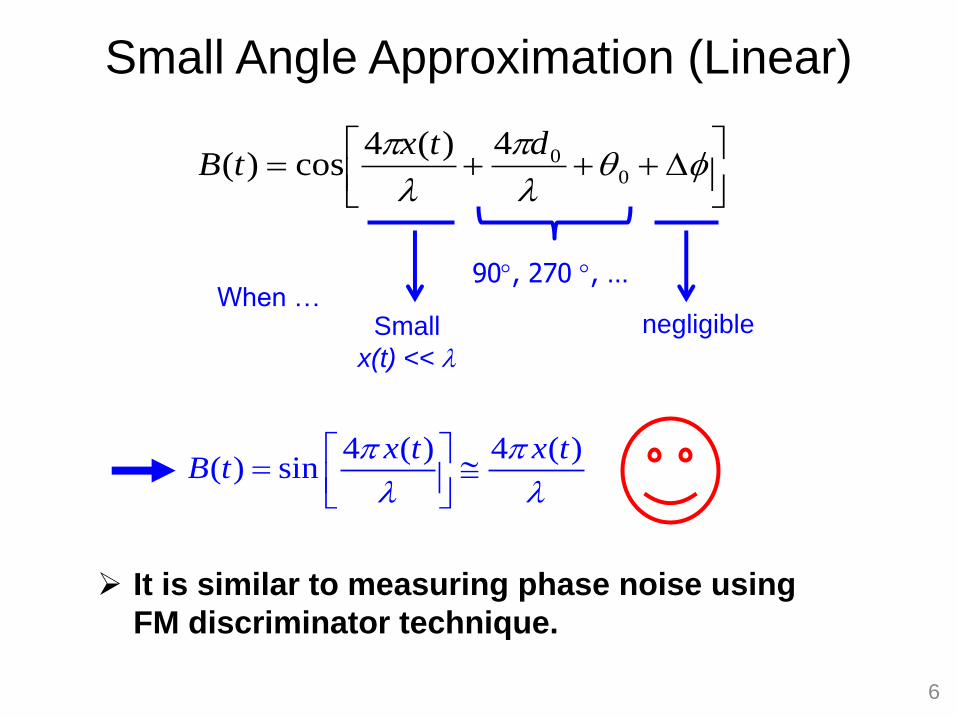
Small Angle Approximation (Linear)
4 ( ) 4 ( )( ) sin
x t x tB t
It is similar to measuring phase noise using
FM discriminator technique.
6
0
04)(4cos)(
dtxtB
90, 270 , … When …
Small
x(t) <<
negligible
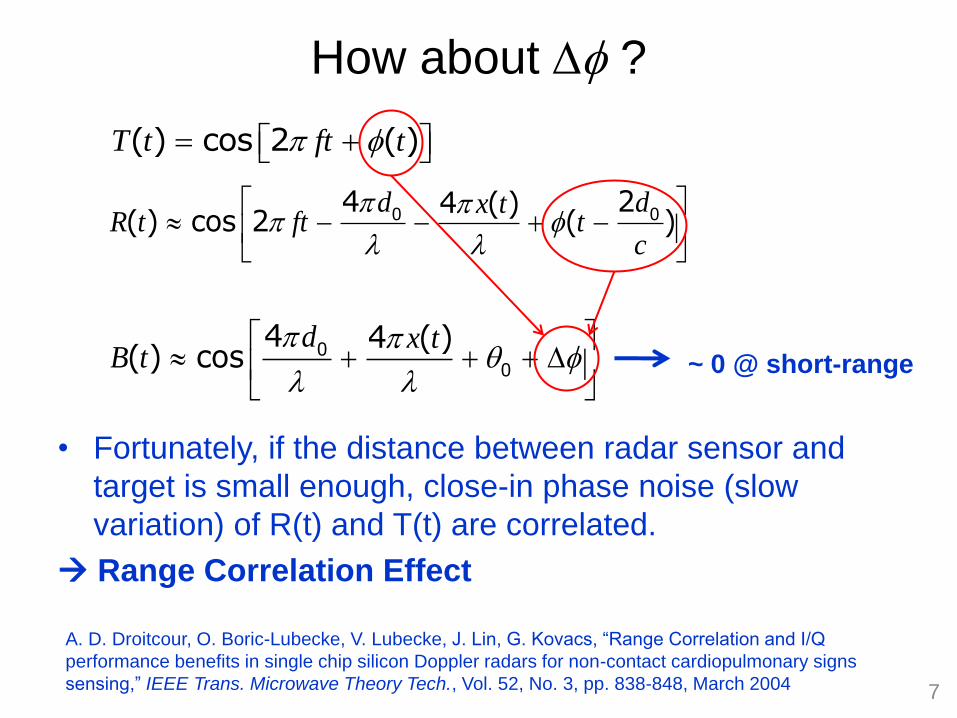
• Fortunately, if the distance between radar sensor and
target is small enough, close-in phase noise (slow
variation) of R(t) and T(t) are correlated.
Range Correlation Effect
How about ?
T t ft t ( ) cos 2 ( )
d dx tR t ft t
c
0 04 24 ( )
( ) cos 2 ( )
d x tB t
00
4 4 ( )( ) cos ~ 0 @ short-range
A. D. Droitcour, O. Boric-Lubecke, V. Lubecke, J. Lin, G. Kovacs, “Range Correlation and I/Q
performance benefits in single chip silicon Doppler radars for non-contact cardiopulmonary signs
sensing,” IEEE Trans. Microwave Theory Tech., Vol. 52, No. 3, pp. 838-848, March 2004 7

Earliest Research Report
8
• J. C. Lin, "Noninvasive Microwave Measurement of Respiration," Proceedings of the IEEE, vol. 63, no. 10, p. 1530, Oct. 1975.
Rabbit
Human

Early Research Effort
9
• K.-M. Chen and H.-R. Chuang, “Measurement of Heart and Breathing Signals of Human Subjects Through Barriers with Microwave Life-Detection Systems,” IEEE EMBC 1988. – 10GHz: 1.5 ft of dry bricks – 2GHz: 3 ft of dry bricks
• H.-R. Chuang, Y.-F. Chen, and K.-M. Chen, “Automatic Clutter-Canceler for Microwave Life-Detection System,” IEEE Trans. Instrumentation and Measurement, Vol. 40, No. 4, August 1991.
10 GHz
RF Out to
Tx Antenna
Baseband +
Baseband -
RF In from
Rx Antenna
Buffer LO
Buffer
VCORF
Buffer
Mixer
RF Out to
Tx Antenna
Baseband +
Baseband -
RF In from
Rx Antenna
Buffer LO
Buffer
VCORF
Buffer
Mixer
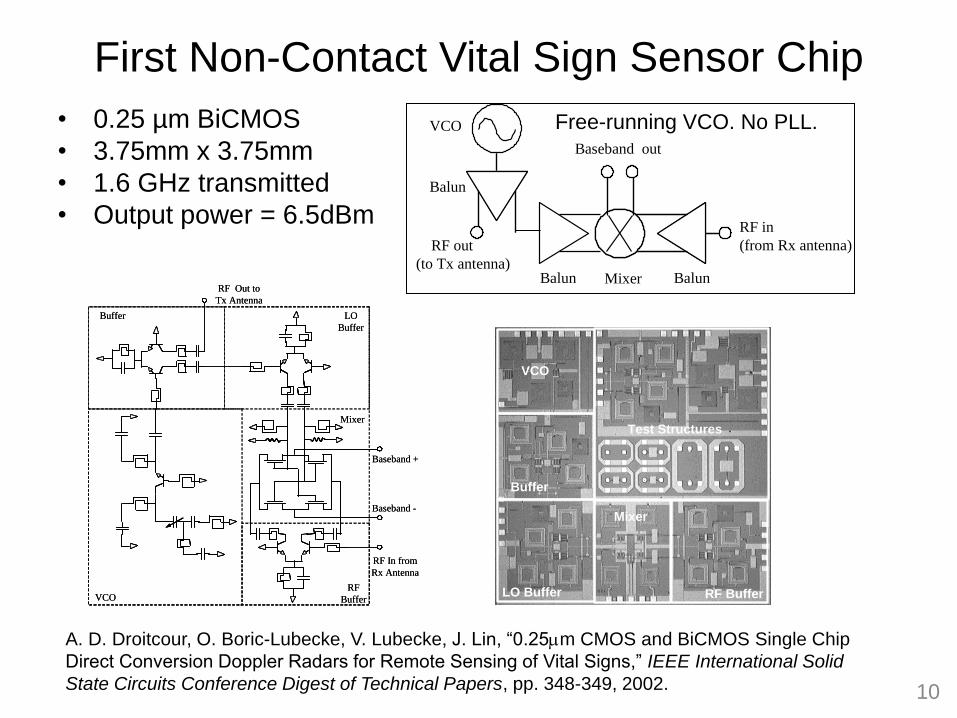
• 0.25 µm BiCMOS
• 3.75mm x 3.75mm
• 1.6 GHz transmitted
• Output power = 6.5dBm
First Non-Contact Vital Sign Sensor Chip
10
Balun
Balun
Balun
VCO
Mixer
RF out
(to Tx antenna)
RF in
(from Rx antenna)
Baseband out
Test Structures
VCO
LO Buffer
Buffer
RF Buffer
Mixer
Test Structures
VCO
LO Buffer
Buffer
RF Buffer
Mixer
A. D. Droitcour, O. Boric-Lubecke, V. Lubecke, J. Lin, “0.25m CMOS and BiCMOS Single Chip
Direct Conversion Doppler Radars for Remote Sensing of Vital Signs,” IEEE International Solid
State Circuits Conference Digest of Technical Papers, pp. 348-349, 2002.
Free-running VCO. No PLL.

• 0.25 µm CMOS
• 2.4 GHz transmission frequency
• Direct-conversion – no IF and no image-reject filter
• Free running VCO – no PLL, no crystal.
• Quadrature receiver – to avoid null-point problem.
2nd Non-Contact Vital Sign Sensor Chip
11
0
1
2
3
4
5
0 2 4 6 8Time (sec)
Am
plit
ude
A. Droitcour, O. Boric-Lubecke, V. Lubecke, J. Lin, G. Kovacs, “Range Correlation Effect on ISM Band I/Q
CMOS Radar for Non-Contact Vital Signs Sensing,” IEEE MTT-S International Microwave Symposium
Digest, Vol. 3, pp. 1945-1948, 2003.

2003 – present
Research @ University of Florida
12
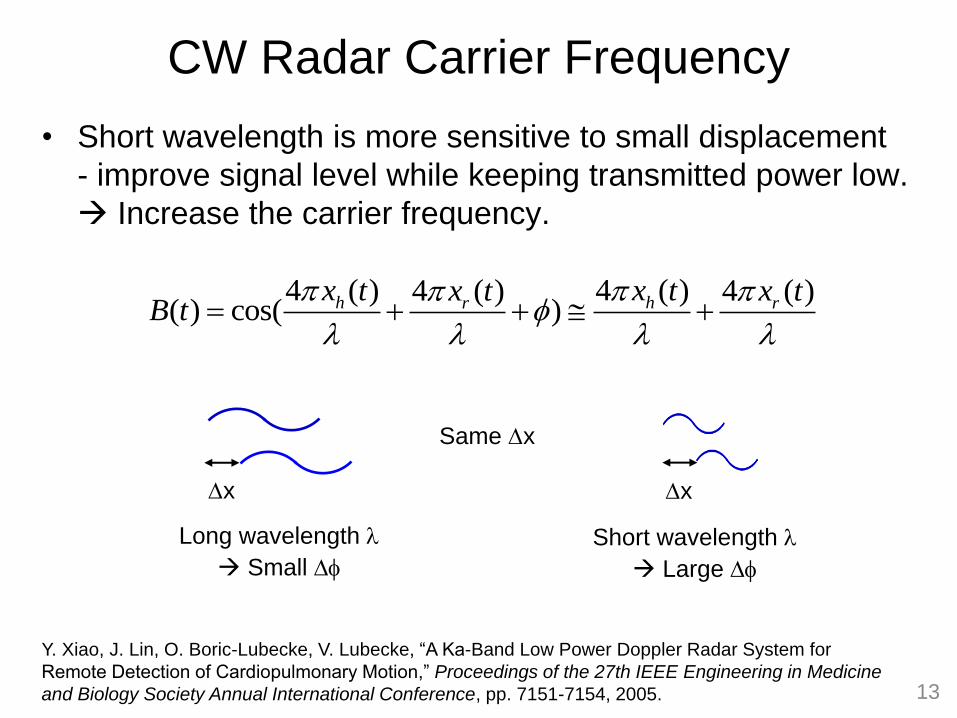
CW Radar Carrier Frequency
4 ( ) 4 ( )4 ( ) 4 ( )( ) cos( )h hr r
x t x tx t x tB t
Y. Xiao, J. Lin, O. Boric-Lubecke, V. Lubecke, “A Ka-Band Low Power Doppler Radar System for
Remote Detection of Cardiopulmonary Motion,” Proceedings of the 27th IEEE Engineering in Medicine
and Biology Society Annual International Conference, pp. 7151-7154, 2005. 13
• Short wavelength is more sensitive to small displacement
- improve signal level while keeping transmitted power low.
Increase the carrier frequency.
Long wavelength
Small
Short wavelength
Large
Same x
x x

Double-Sideband Transmission/Detection
Example @ Ka-Band
Baseband Output
B(t)
LO2 LO1
LNA Mixer IF_AMP
Mixer
Mixer AMP BPF AMP
(0.1-10 Hz) (26-40 GHz)
Double-sideband transmission and detection
no image rejection needed simple architecture
Feasible for monolithic integration on one chip
RF
0 5 10 15 20 25 -3
-2
-1
0
1
2
3
Time (Sec)
Dete
cte
d S
ignal (V
) LO2+LO1
LO2-LO1
14
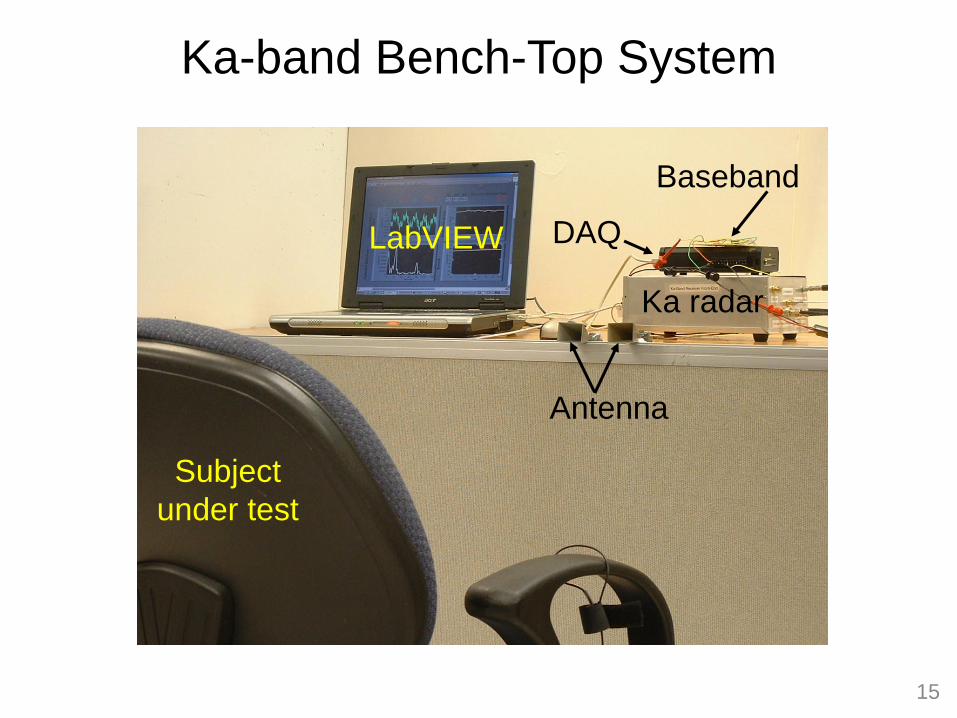
Ka-band Bench-Top System
LabVIEW
Ka radar
Antenna
Subject
under test
Baseband
DAQ
15
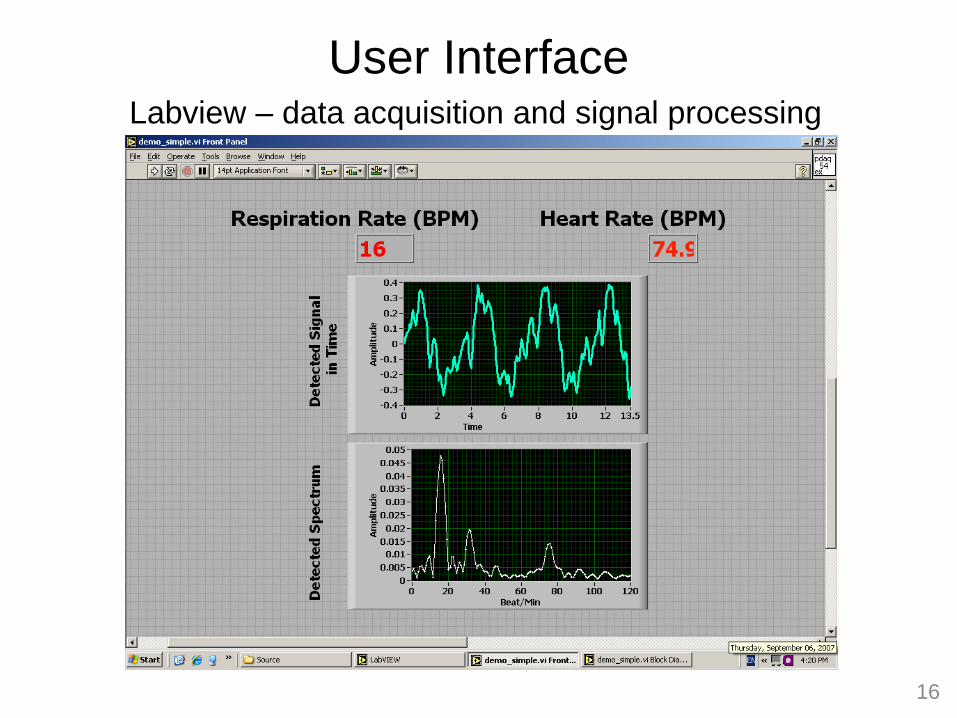
User Interface Labview – data acquisition and signal processing
16
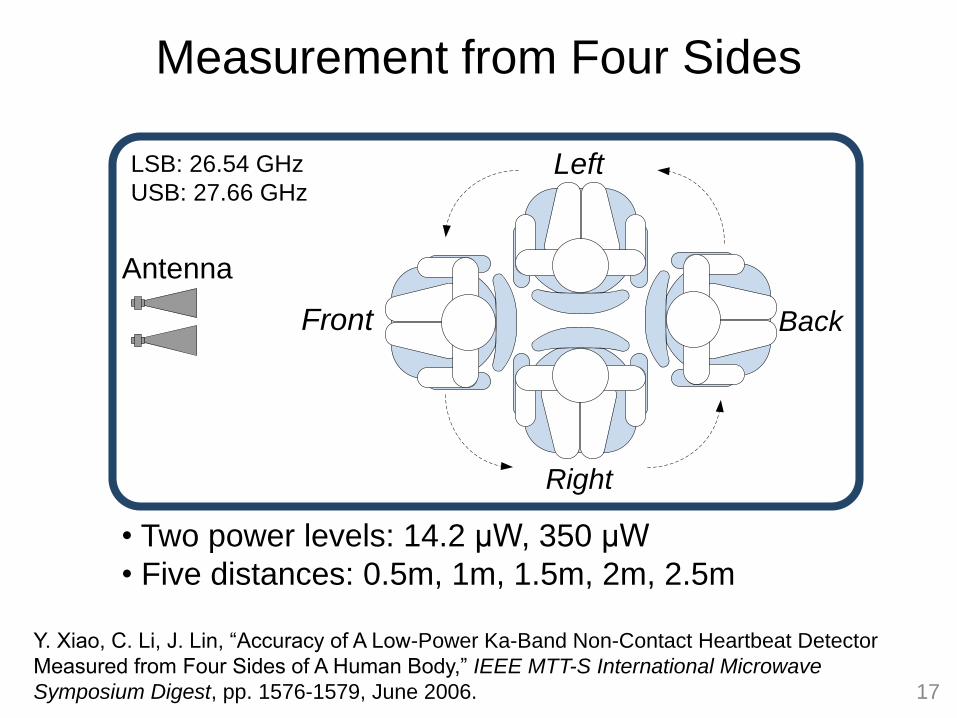
Measurement from Four Sides
Antenna
BackFront
Left
Right
LSB: 26.54 GHz
USB: 27.66 GHz
• Two power levels: 14.2 μW, 350 μW
• Five distances: 0.5m, 1m, 1.5m, 2m, 2.5m
Y. Xiao, C. Li, J. Lin, “Accuracy of A Low-Power Ka-Band Non-Contact Heartbeat Detector
Measured from Four Sides of A Human Body,” IEEE MTT-S International Microwave
Symposium Digest, pp. 1576-1579, June 2006. 17

Typical Test Result
0 5 10 15 20 25-3
-2
-1
0
1
2
3
Time (Sec)D
ete
cte
d S
ign
al (V
)
0 5 10 15 20 2580
85
90
95
Time (Sec)
Be
ats
/Min
Detected heart beatReference heart beat2 % Higher than
Reference
2 % Lower thanReference
Time-Domain Signal
Calculated Heart Rate
18
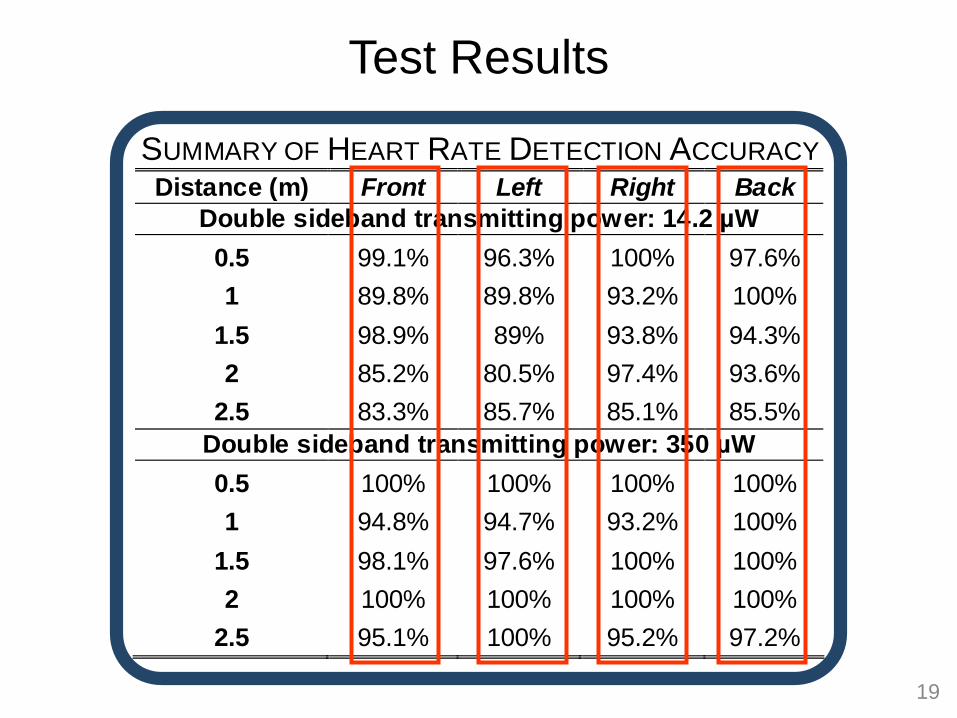
Test Results
SUMMARY OF HEART RATE DETECTION ACCURACY Distance (m) Front Left Right Back
Double sideband transmitting power: 14.2 µW
0.5 99.1% 96.3% 100% 97.6%
1 89.8% 89.8% 93.2% 100%
1.5 98.9% 89% 93.8% 94.3%
2 85.2% 80.5% 97.4% 93.6%
2.5 83.3% 85.7% 85.1% 85.5%
Double sideband transmitting power: 350 µW
0.5 100% 100% 100% 100%
1 94.8% 94.7% 93.2% 100%
1.5 98.1% 97.6% 100% 100%
2 100% 100% 100% 100%
2.5 95.1% 100% 95.2% 97.2%
19
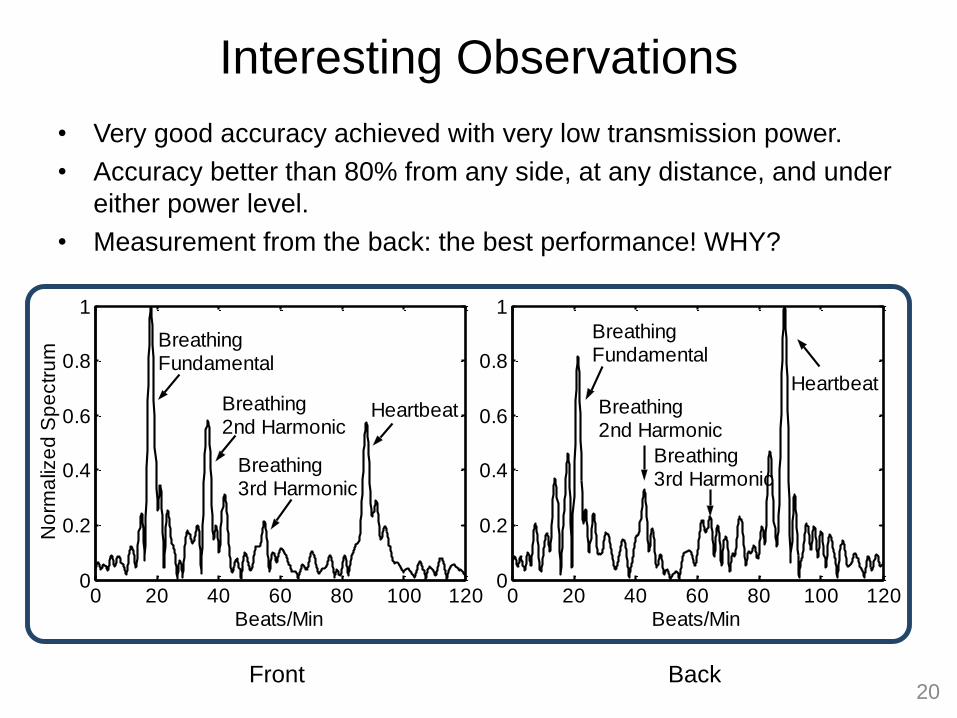
• Very good accuracy achieved with very low transmission power.
• Accuracy better than 80% from any side, at any distance, and under
either power level.
• Measurement from the back: the best performance! WHY?
Interesting Observations
0 20 40 60 80 100 1200
0.2
0.4
0.6
0.8
1
Beats/Min
No
rma
lize
d S
pe
ctr
um
Breathing Fundamental
Breathing 2nd Harmonic
Breathing 3rd Harmonic
Heartbeat
0 20 40 60 80 100 1200
0.2
0.4
0.6
0.8
1
Beats/Min
Breathing Fundamental
Breathing 2nd Harmonic
Breathing 3rd Harmonic
Heartbeat
Front Back 20
Nonlinear Doppler Phase Demodulation
and
Measurement of Vibrations
21
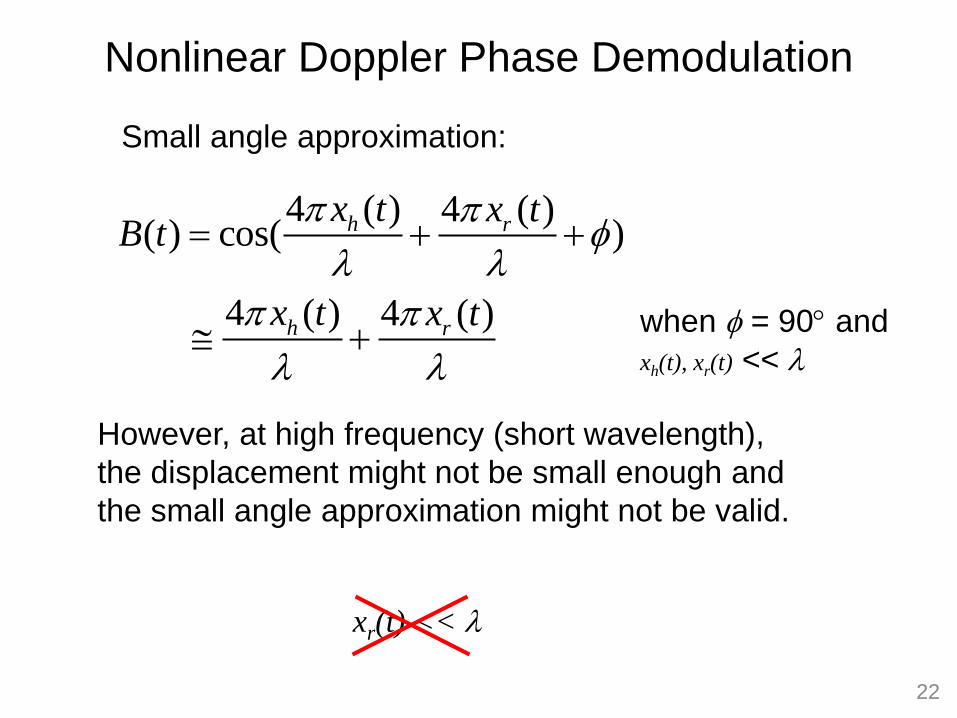
Nonlinear Doppler Phase Demodulation
when = 90 and
xh(t), xr(t) <<
xr(t) <<
However, at high frequency (short wavelength),
the displacement might not be small enough and
the small angle approximation might not be valid.
4 ( ) 4 ( )( ) cos( )
4 ( ) 4 ( )
h r
h r
x t x tB t
x t x t
22
Small angle approximation:
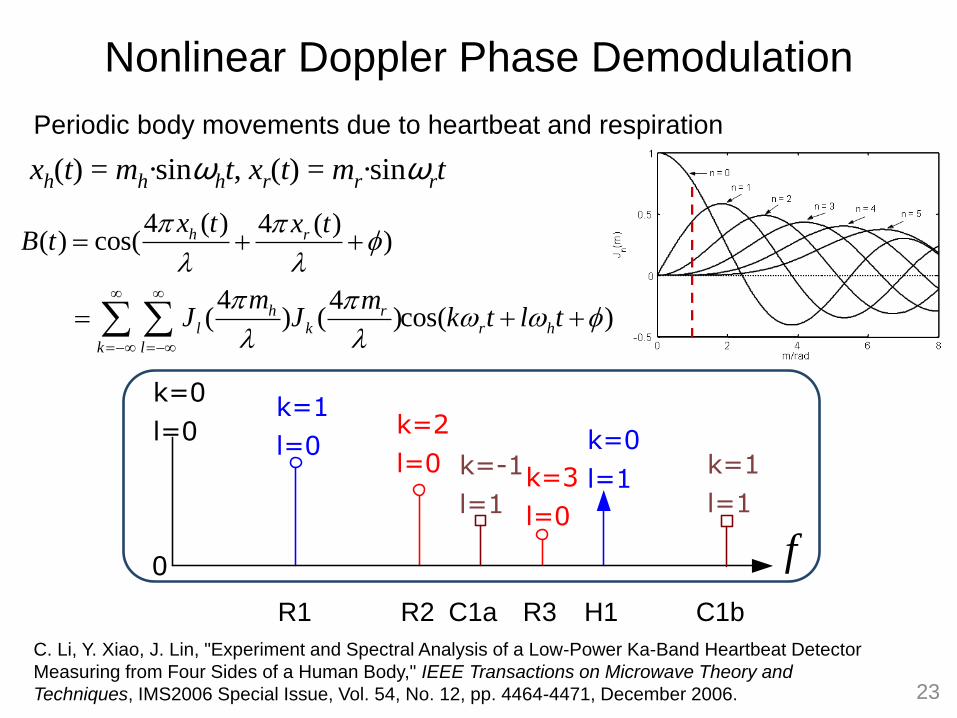
Nonlinear Doppler Phase Demodulation
4 ( ) 4 ( )( ) cos( )
4 4( ) ( )cos( )
h r
h rl k r h
k l
x t x tB t
m mJ J k t l t
Periodic body movements due to heartbeat and respiration
xh(t) = mh·sinωht, xr(t) = mr·sinωrt
f
k=1
l=0k=2
l=0k=3
l=0
k=0
l=1
0
k=0
l=0
k=-1
l=1
k=1
l=1
R1 R3 H1 R2 C1a C1b
C. Li, Y. Xiao, J. Lin, "Experiment and Spectral Analysis of a Low-Power Ka-Band Heartbeat Detector
Measuring from Four Sides of a Human Body," IEEE Transactions on Microwave Theory and
Techniques, IMS2006 Special Issue, Vol. 54, No. 12, pp. 4464-4471, December 2006. 23
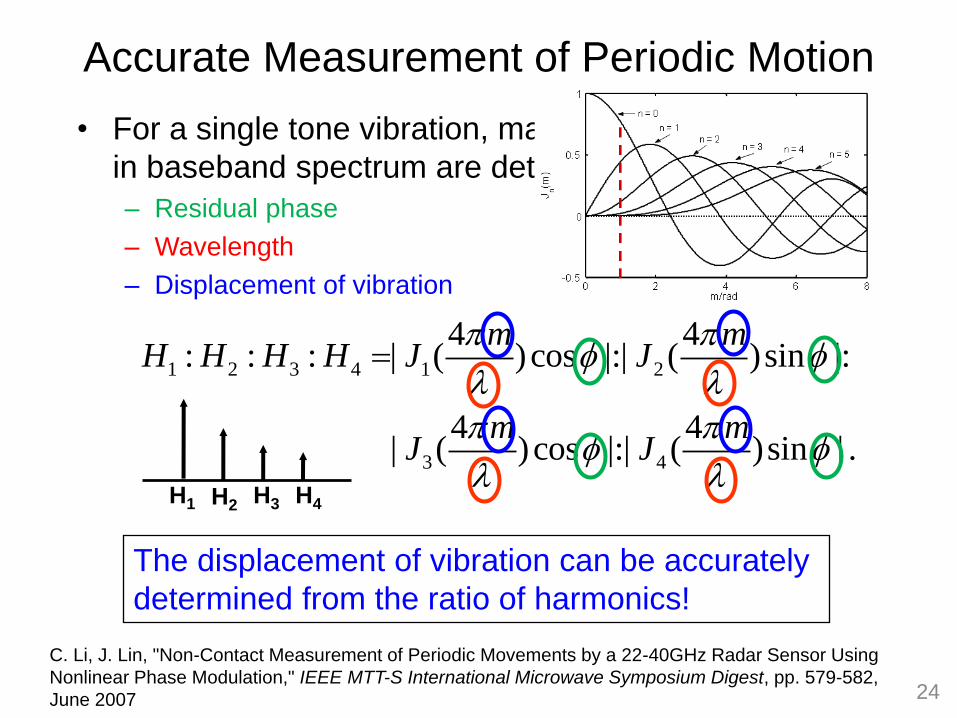
Accurate Measurement of Periodic Motion
• For a single tone vibration, magnitudes of harmonics
in baseband spectrum are determined by:
– Residual phase
– Wavelength
– Displacement of vibration
1 2 3 4 1 2
3 4
4 4: : : | ( )cos |:| ( )sin |:
4 4| ( )cos |:| ( )sin | .
m mH H H H J J
m mJ J
The displacement of vibration can be accurately
determined from the ratio of harmonics!
C. Li, J. Lin, "Non-Contact Measurement of Periodic Movements by a 22-40GHz Radar Sensor Using
Nonlinear Phase Modulation," IEEE MTT-S International Microwave Symposium Digest, pp. 579-582,
June 2007 24
H1 H2 H3 H4

Measurement Example
0 5 10 15-0.5
0
0.5
1
Time (Second)
Ba
se
ba
nd
Sig
na
l (V
)
0 1/3 2/3 1 4/3 5/3 20
0.5
1
Frequency (Hz)
No
rma
lize
d S
pe
ctr
um
1 1.5 2 2.5 30
1
2
3
4
5
Displacement (mm)
Ha
rmo
nic
Ra
tio
H3/H1 ratioH4/H2 ratio
Meaured H3/H1
Meaured H4/H2
• Movement period T = 3 sec amplitude = 2 mm
• fRF: 40 GHz,
• Transmission power: 50 µW
• Distance: 1.65m
(a) Baseband signal, spectrum (b) Displacement extraction,
self-verification 25
2.056 mm
2.045 mm
• PCB modules
• IC chips: RFIC
• System-in-Package: Antennas integrated
Development of Integrated Radar Sensors
at University of Florida
26
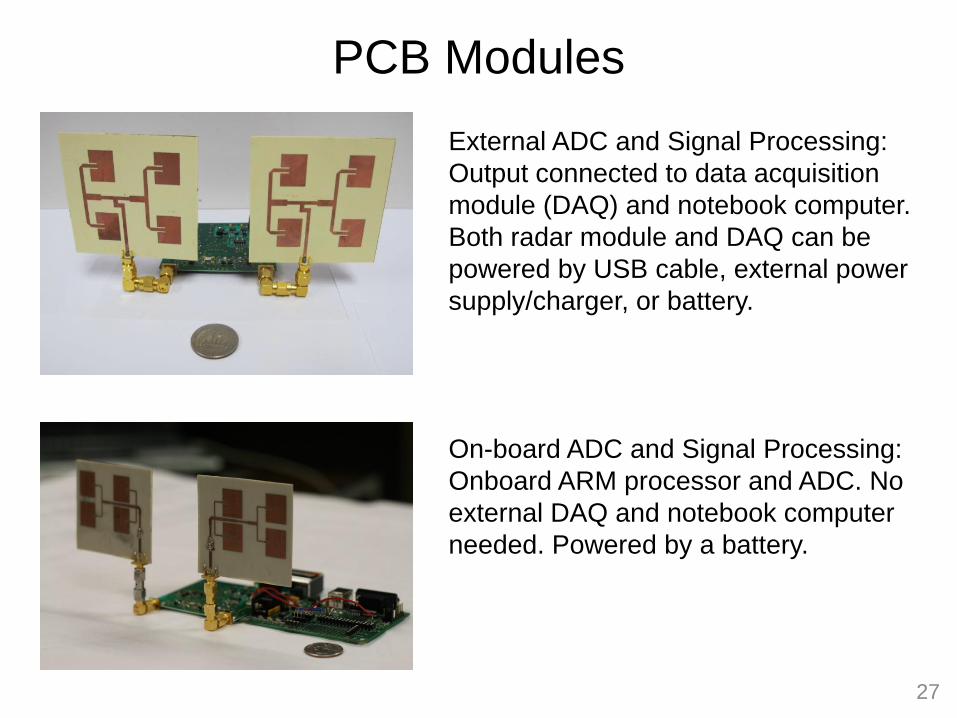
PCB Modules
27
External ADC and Signal Processing:
Output connected to data acquisition
module (DAQ) and notebook computer.
Both radar module and DAQ can be
powered by USB cable, external power
supply/charger, or battery.
On-board ADC and Signal Processing:
Onboard ARM processor and ADC. No
external DAQ and notebook computer
needed. Powered by a battery.
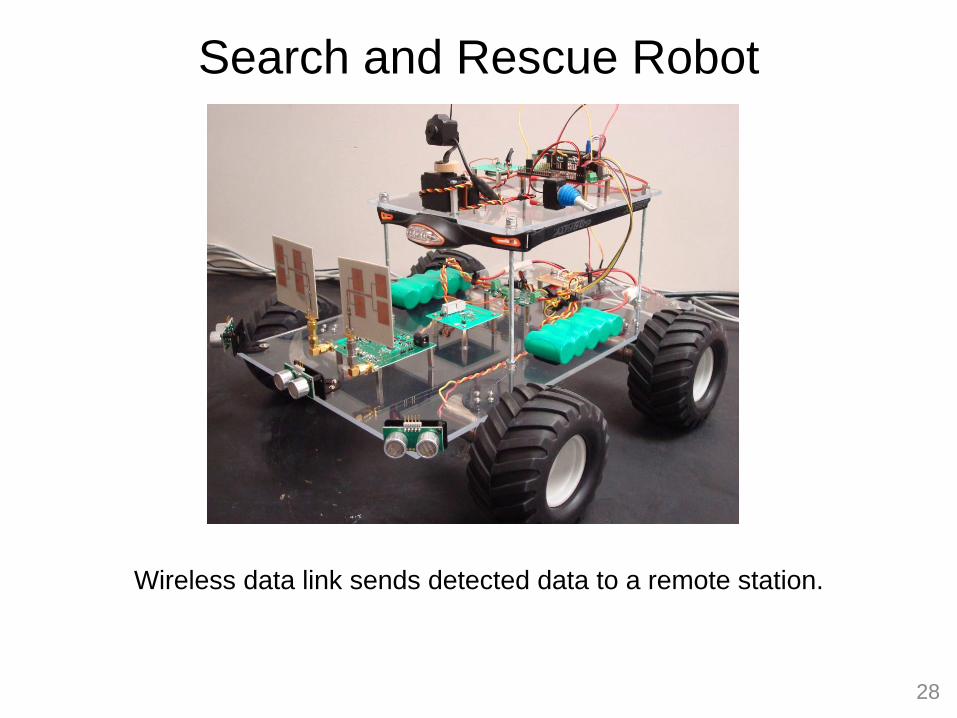
Search and Rescue Robot
28
Wireless data link sends detected data to a remote station.

Double-Sideband Radar Sensor Chip
IF-Amp LNA
IF-VCO RF-VCO
Bas
eban
d
IF-Mixer
Test
Down-Conv
Up-Conv
G=18 dBG=23 dB
1f 2f
5 GHz Radar Chip
Balun
f1 = 60~520 MHz; f2 = 4.6~5.7 GHz UMC 0.18 µm CMOS
1.3×1.6 mm2
C. Li, Y. Xiao, J. Lin, "A 5-GHz Double-Sideband Radar Sensor Chip in 0.18-µm CMOS
for Non-contact Vital Sign Detection," accepted, IEEE Microwave and Wireless
Components Letters, 2008 29
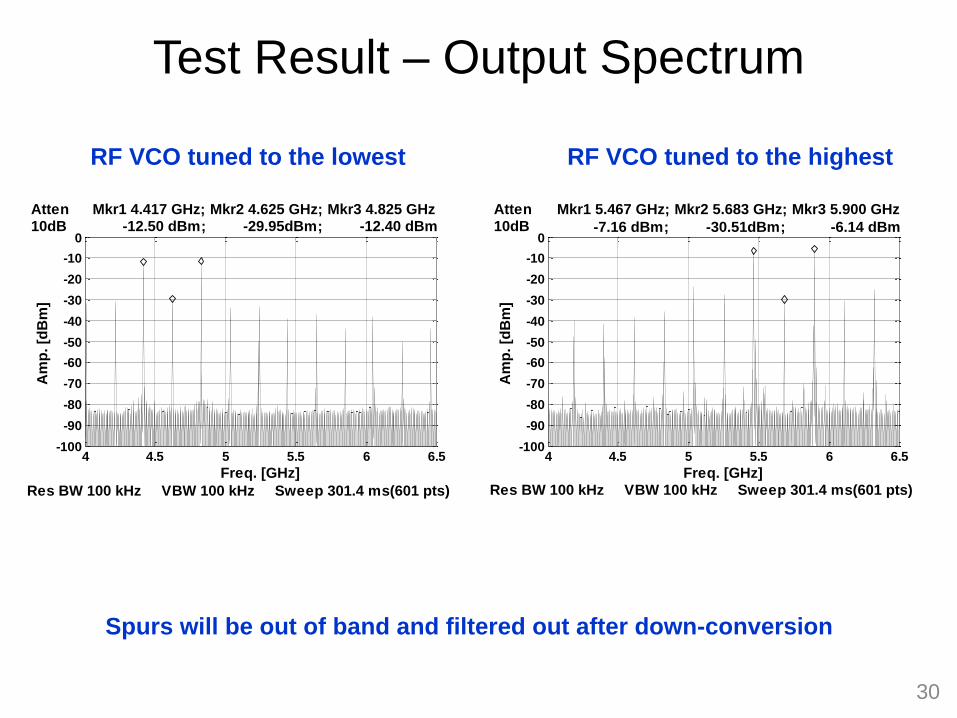
Test Result – Output Spectrum
4 4.5 5 5.5 6 6.5-100
-90
-80
-70
-60
-50
-40
-30
-20
-10
0
Freq. [GHz]
Am
p.
[dB
m]
Res BW 100 kHz VBW 100 kHz Sweep 301.4 ms(601 pts)
Atten10dB
Mkr1 5.467 GHz; Mkr2 5.683 GHz; Mkr3 5.900 GHz
-7.16 dBm; -30.51dBm; -6.14 dBm
4 4.5 5 5.5 6 6.5-100
-90
-80
-70
-60
-50
-40
-30
-20
-10
0
Freq. [GHz]
Am
p.
[dB
m]
Res BW 100 kHz VBW 100 kHz Sweep 301.4 ms(601 pts)
Atten10dB
Mkr1 4.417 GHz; Mkr2 4.625 GHz; Mkr3 4.825 GHz -12.50 dBm; -29.95dBm; -12.40 dBm
RF VCO tuned to the lowest RF VCO tuned to the highest
30
Spurs will be out of band and filtered out after down-conversion
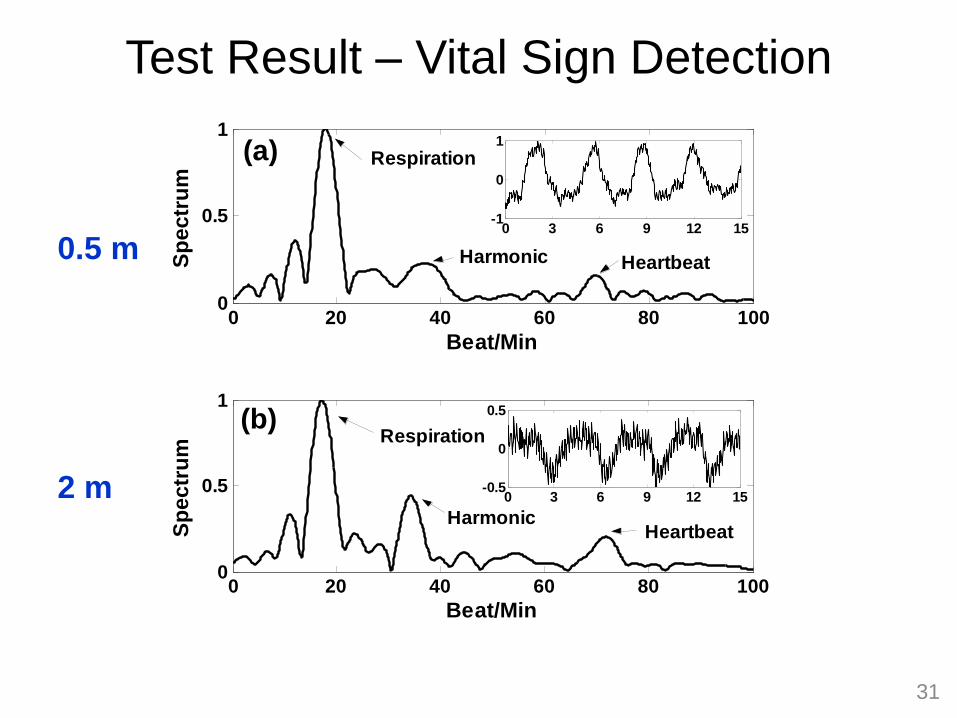
Test Result – Vital Sign Detection 0 3 6 9 12 15
-1
0
1
0 20 40 60 80 1000
0.5
1
Beat/Min
Sp
ectr
um
Respiration
Harmonic Heartbeat
0 3 6 9 12 15-1
0
1
0 20 40 60 80 1000
0.5
1
Beat/Min
Sp
ec
tru
m
Respiration
Harmonic Heartbeat
(a)
0 3 6 9 12 15-0.5
0
0.5
0 20 40 60 80 1000
0.5
1
Beat/Min
Sp
ec
tru
m
Respiration
Heartbeat Harmonic
0 3 6 9 12 15-0.5
0
0.5
0 20 40 60 80 1000
0.5
1
Beat/Min
Sp
ectr
um
Respiration
Heartbeat Harmonic
(b)
0.5 m
2 m
31

Radar Receiver with Gain Control
inRF
outI +
outI -
outQ +
outQ -
Load Clk DataQ
LO +Q
LO
ILO +
ILO
LNAPre-Amp
MixerI
MixerQ
VGA
I
VGA
Q
Gm-boosted
biasBandgap Const-Gm
3-wire control
Gm Boosted Bias
Bandgap Constant Gm
LNA PreAmp
Mixer VGA
3 Wire Control Unit
RFin
Clock Data Load
Q
I
DAQ CPLD
5.8 GHz Radar Receiver
UMC 0.13 µm CMOS
1.2×1.2 mm2
C. Li, X. Yu, D. Li, L. Ran, J. Lin, "Software Configurable 5.8 GHz Radar Sensor Receiver
Chip in 0.13 μm CMOS for Non-contact Vital Sign Detection," IEEE RFIC Symposium
Digest of Papers, June 2009
32

Test Result
Power: 1.5 V battery
3-wire program: Xilinx XC9536 CPLD
Antenna: 2-by-2 patch array, 9 dB gain
DAQ: NI USB-6008, 12 bit, 0-5V input
0 5 10 15 20 25
-20
0
20
Time (Second)
I/Q
Sig
na
l [m
V]
0 20 40 60 80 100 1200
0.5
1
Beats/Min
CS
D S
pe
ctr
um
Respiration Heartbeat
0 5 10 15 20 25-40
-20
0
20
Time (Second)
I/Q
Sig
na
l [m
V]
0 20 40 60 80 100 1200
0.5
1
Beats/Min
CS
D S
pe
ctr
um
Respiration
Heartbeat
Detect from the back @ 0.5m away Detect from the front @ 1.5m away 33
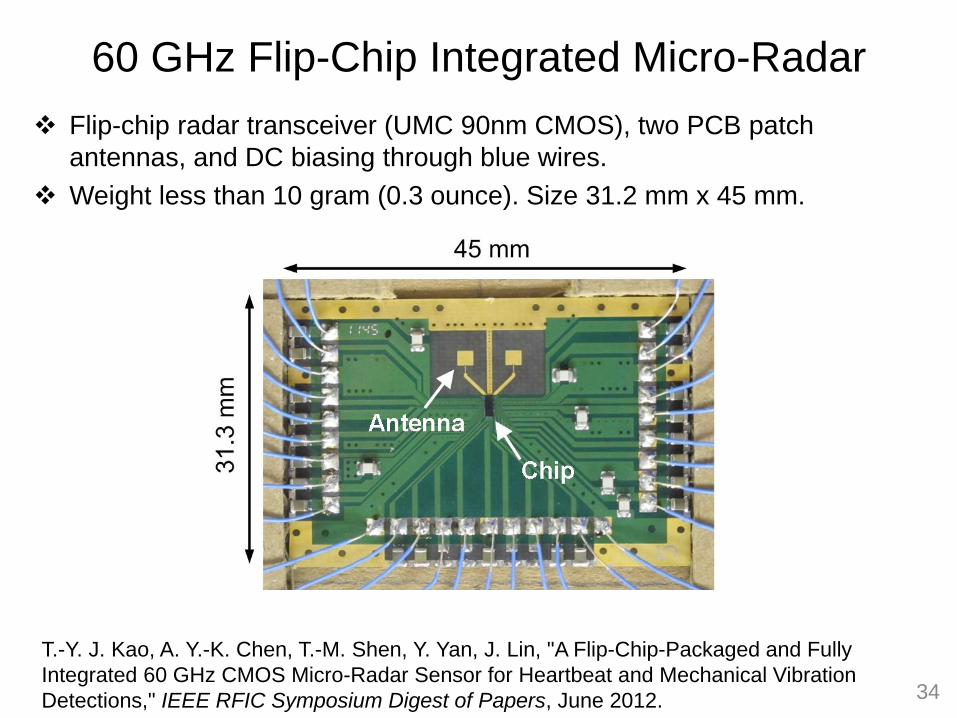
Flip-chip radar transceiver (UMC 90nm CMOS), two PCB patch
antennas, and DC biasing through blue wires.
Weight less than 10 gram (0.3 ounce). Size 31.2 mm x 45 mm.
60 GHz Flip-Chip Integrated Micro-Radar
34
T.-Y. J. Kao, A. Y.-K. Chen, T.-M. Shen, Y. Yan, J. Lin, "A Flip-Chip-Packaged and Fully
Integrated 60 GHz CMOS Micro-Radar Sensor for Heartbeat and Mechanical Vibration
Detections," IEEE RFIC Symposium Digest of Papers, June 2012.
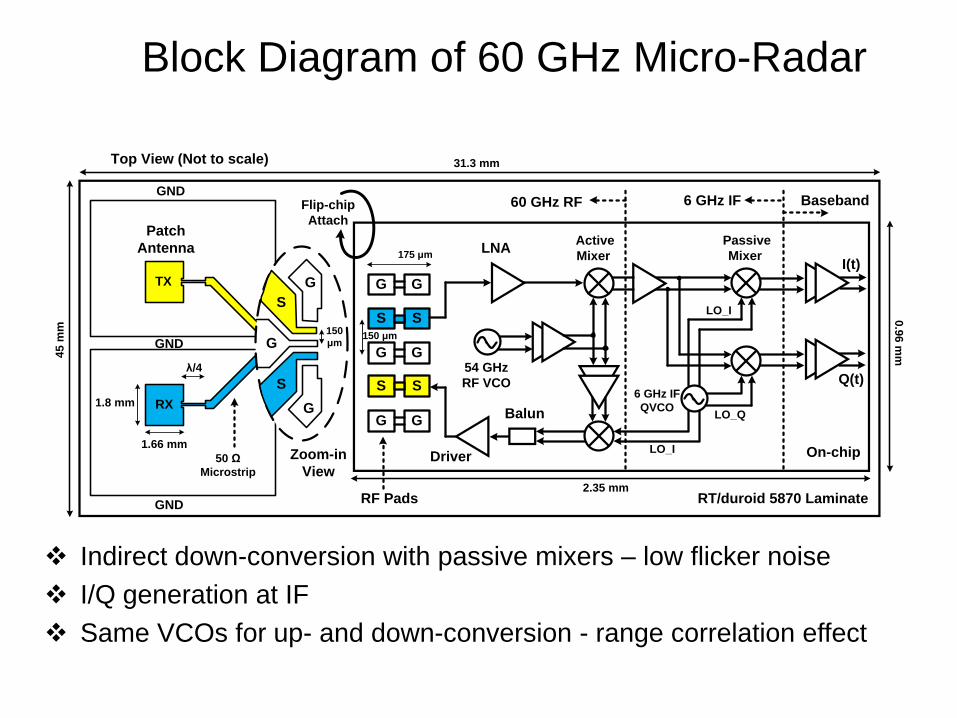
Block Diagram of 60 GHz Micro-Radar
54 GHz
RF VCO
LNA
Balun
Driver On-chip
60 GHz RF
Passive
Mixer
6 GHz IF
QVCO
LO_I
I(t)
Q(t)
S
G
S
G
GG
G
S
S
G150 μm
150
μm
Top View (Not to scale)
Zoom-in
View
RT/duroid 5870 Laminate
GND
GND
GND
1.66 mm
1.8 mm
λ/4
TX
RX
Flip-chip
AttachPatch
Antenna
6 GHz IF Baseband
RF Pads
S
G
S
G
G
175 μm
31.3 mm
50 Ω
Microstrip
45
mm
0.9
6 m
m
2.35 mm
Active
Mixer
LO_Q
LO_I
Indirect down-conversion with passive mixers – low flicker noise
I/Q generation at IF
Same VCOs for up- and down-conversion - range correlation effect
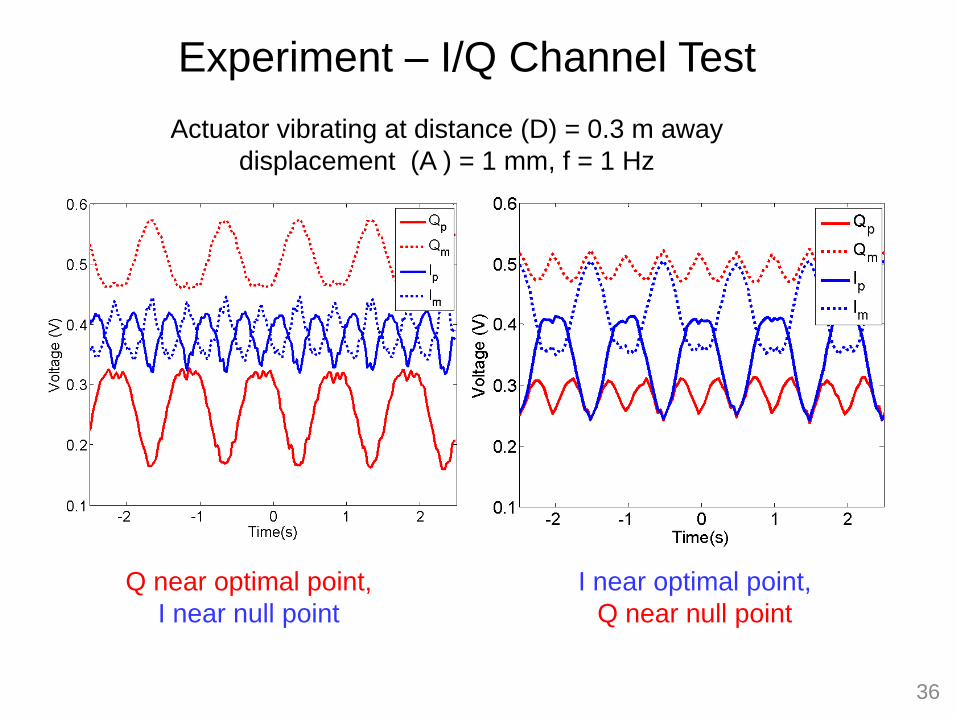
Experiment – I/Q Channel Test
Actuator vibrating at distance (D) = 0.3 m away
displacement (A ) = 1 mm, f = 1 Hz
Q near optimal point,
I near null point
I near optimal point,
Q near null point
36

Complex Signal Demodulation
Optimal and null detection points
Complex signal demodulation (CSD):
( ) ( ) ( )
4 ( ) 4 ( )cos + sin
4 ( ) 4 ( )= exp = exp .exp
t t
t t
S t I t j Q t
x t x tj
x t x tj jj
Quadrature(I/Q) radar receiver needed
4 ( )( ) cos .t
x tB t
Combining I and Q channels
37

Experiment – Small Mechanical Vibration Detection
38
Vibration (f = 1 Hz, D = 0.3m):
→ minimum “detectable”
displacement A = 20 μm
All data points are
normalized to the largest
CSD spectrum peak (A = 1
mm, D = 0.3 m)
→ A = 0.2 mm can be
detected at D =2.1 m away
increase
distance
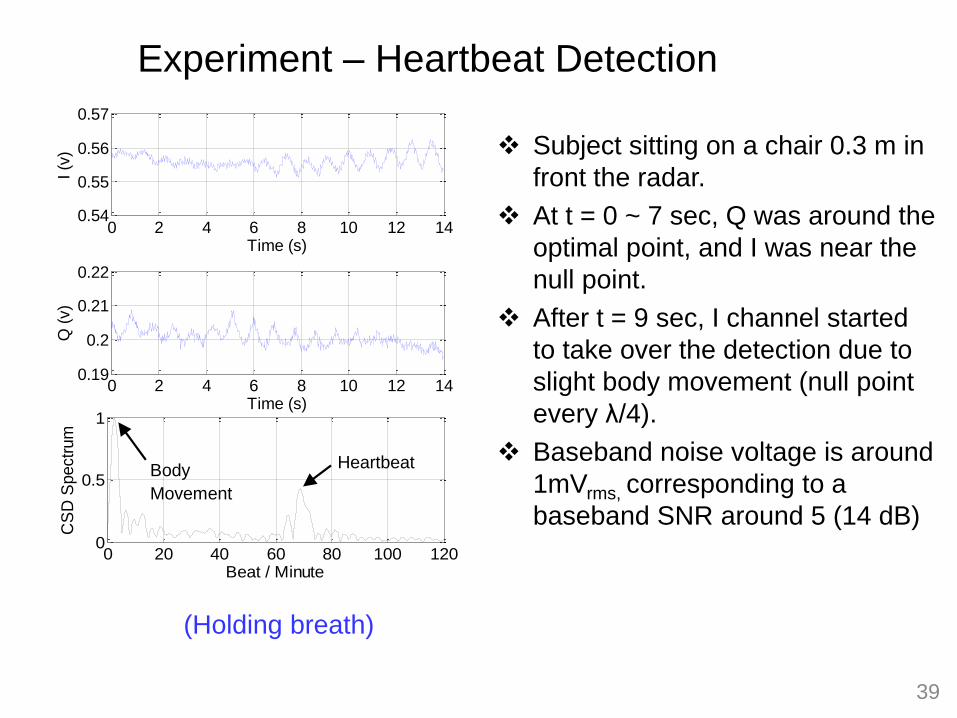
Experiment – Heartbeat Detection
Subject sitting on a chair 0.3 m in
front the radar.
At t = 0 ~ 7 sec, Q was around the
optimal point, and I was near the
null point.
After t = 9 sec, I channel started
to take over the detection due to
slight body movement (null point
every λ/4).
Baseband noise voltage is around
1mVrms, corresponding to a
baseband SNR around 5 (14 dB)
(Holding breath)
0 2 4 6 8 10 12 140.19
0.2
0.21
0.22
Q (
v)
Time (s)
0 2 4 6 8 10 12 140.54
0.55
0.56
0.57
I (v
)
Time (s)
0 20 40 60 80 100 1200
0.5
1
CS
D S
pectr
um
Beat / Minute
Heartbeat Body
Movement
39
Problem of Random Body Movement
During Vital Sign Measurement
A Solution…
40
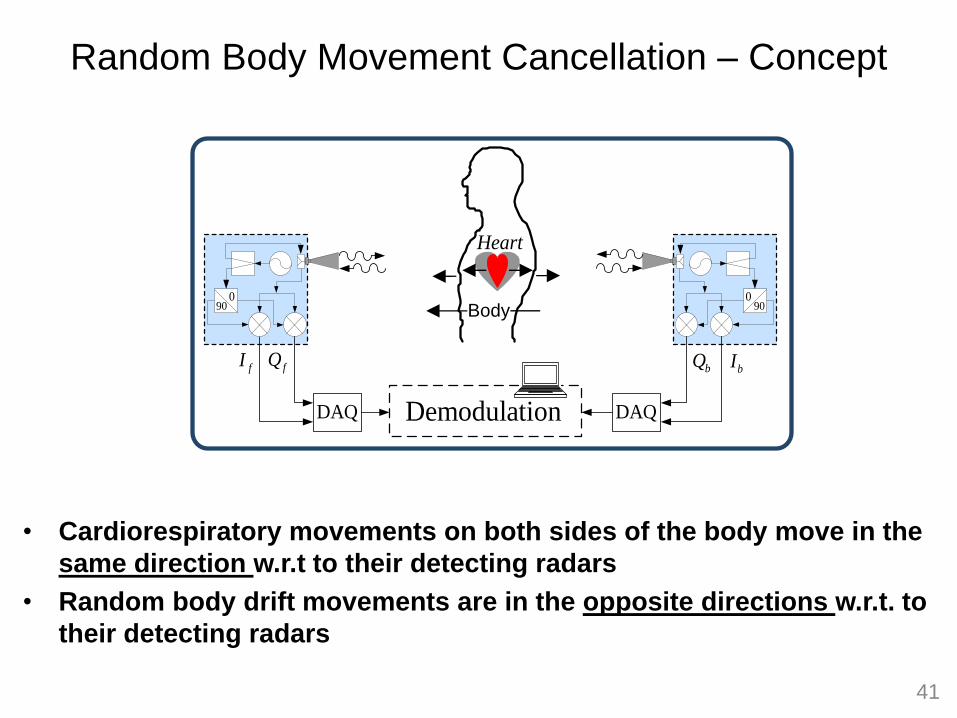
Random Body Movement Cancellation – Concept
Heart
fI fQ
090
bIbQ
DAQ DAQDemodulation
090Body
41
• Cardiorespiratory movements on both sides of the body move in the
same direction w.r.t to their detecting radars
• Random body drift movements are in the opposite directions w.r.t. to
their detecting radars
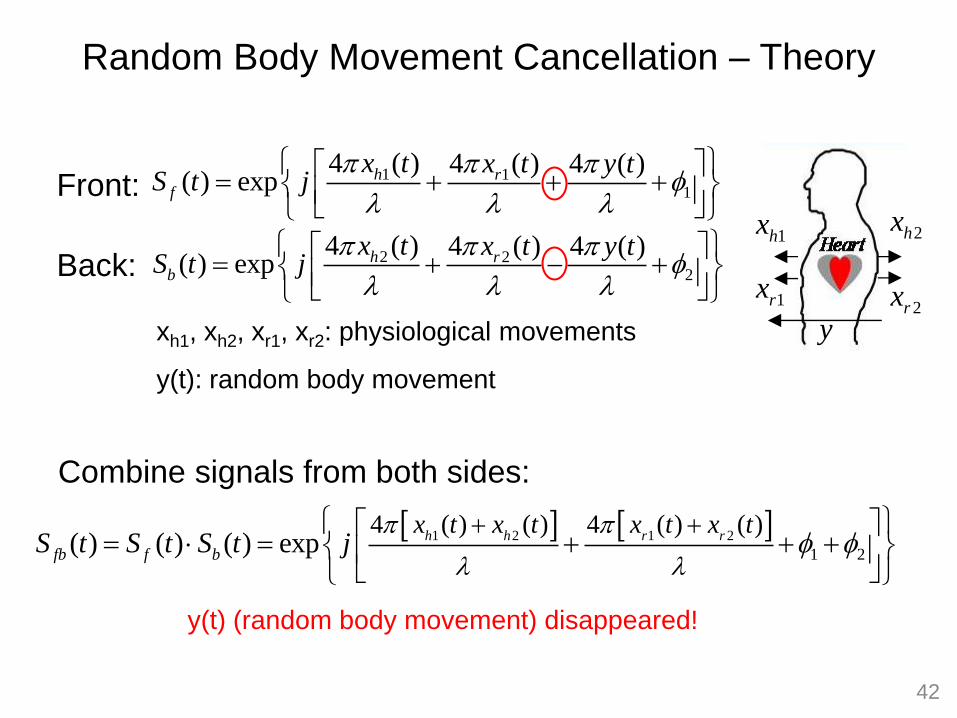
Random Body Movement Cancellation – Theory
1 11
4 ( ) 4 ( ) 4 ( )( ) exp h r
f
x t x t y tS t j
2 22
4 ( ) 4 ( ) 4 ( )( ) exp h r
b
x t x t y tS t j
1 2 1 2
1 2
4 ( ) ( ) 4 ( ) ( )( ) ( ) ( ) exp h h r r
fb f b
x t x t x t x tS t S t S t j
Front:
Back:
Combine signals from both sides:
xh1, xh2, xr1, xr2: physiological movements
y(t): random body movement
1hx 2hx
1rx2rx
y
42
y(t) (random body movement) disappeared!
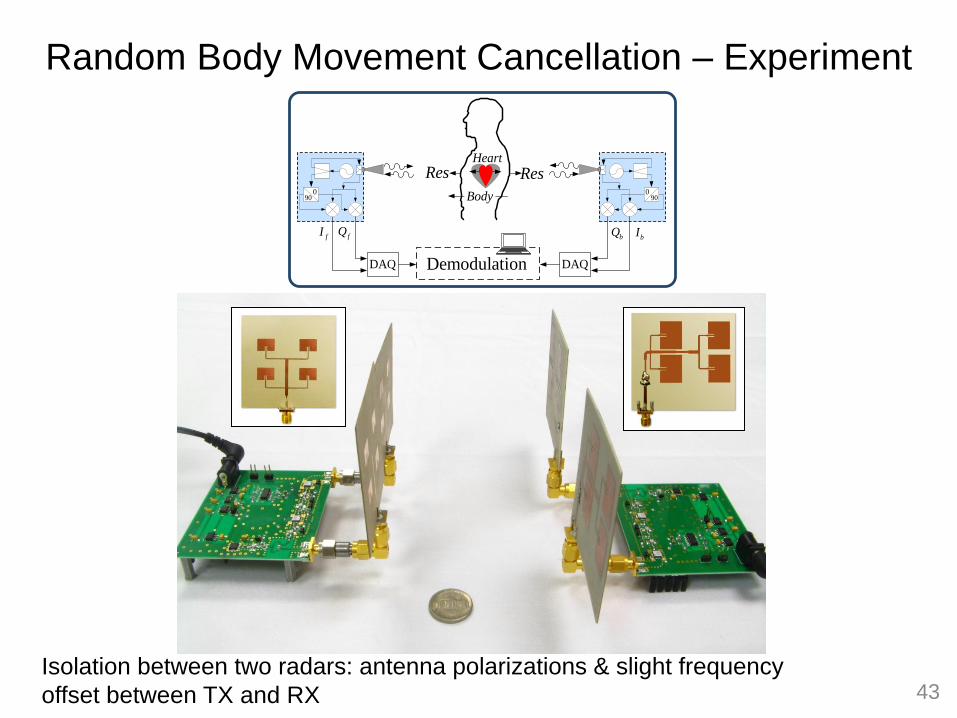
Random Body Movement Cancellation – Experiment
Body
ResHeart
fI fQ
090
bIbQ
DAQ DAQDemodulation
Res0
90
43 Isolation between two radars: antenna polarizations & slight frequency
offset between TX and RX
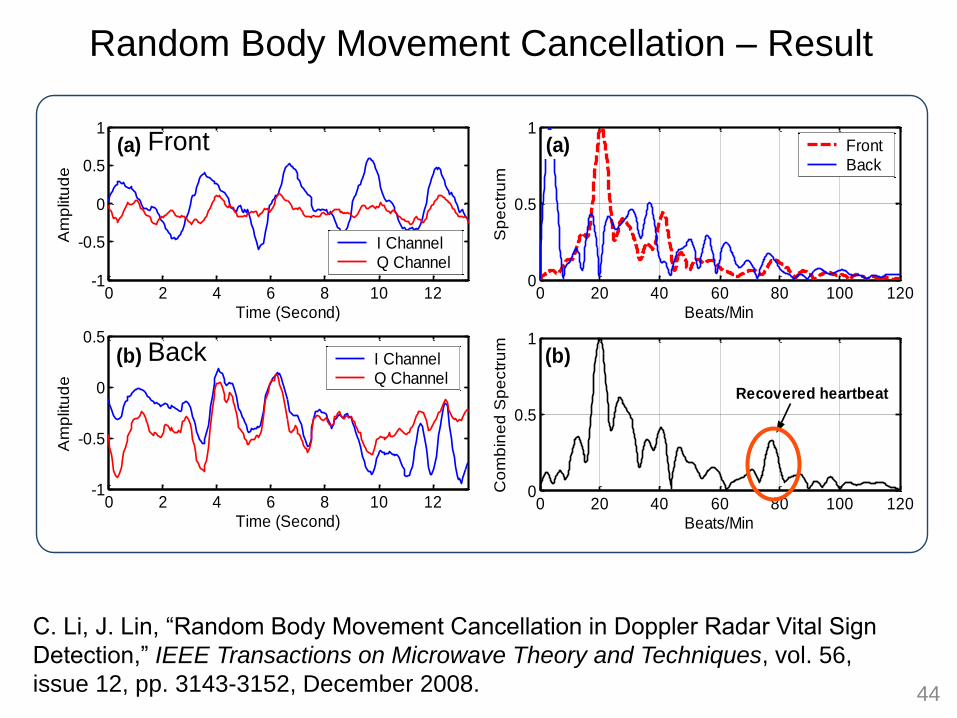
Random Body Movement Cancellation – Result
0 20 40 60 80 100 1200
0.5
1
Beats/Min
Co
mb
ine
d S
pe
ctr
um
Recovered heartbeat
(b)
0 20 40 60 80 100 1200
0.5
1
Beats/Min
Sp
ectr
um
FrontBack
(a)
0 2 4 6 8 10 12-1
-0.5
0
0.5
1
Time (Second)
Am
plit
ud
e
I ChannelQ Channel
(a)
0 2 4 6 8 10 12-1
-0.5
0
0.5
Time (Second)
Am
plit
ud
e
I ChannelQ Channel
(b)
Front
Back
C. Li, J. Lin, “Random Body Movement Cancellation in Doppler Radar Vital Sign
Detection,” IEEE Transactions on Microwave Theory and Techniques, vol. 56,
issue 12, pp. 3143-3152, December 2008. 44
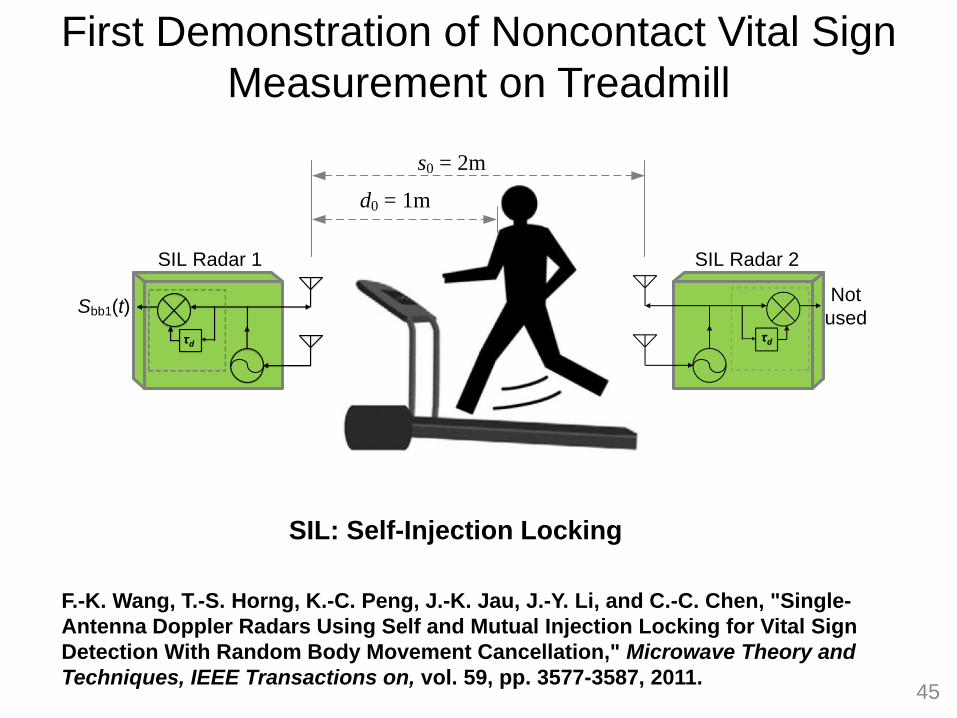
First Demonstration of Noncontact Vital Sign
Measurement on Treadmill
45
τd
SIL Radar 1
Sbb1(t)
SIL Radar 2
Not
usedτd
d0 = 1m
s0 = 2m
SIL: Self-Injection Locking
F.-K. Wang, T.-S. Horng, K.-C. Peng, J.-K. Jau, J.-Y. Li, and C.-C. Chen, "Single-
Antenna Doppler Radars Using Self and Mutual Injection Locking for Vital Sign
Detection With Random Body Movement Cancellation," Microwave Theory and
Techniques, IEEE Transactions on, vol. 59, pp. 3577-3587, 2011.
Applications
• Search-and-rescue
• Human healthcare; Animal care
• Radar in cell phone - lie (or emotion) detection radar
• Sports, video games, …
• When the complete radar system can be made very small… – small radar sensor chip + small antenna + small robot + wireless
ad hoc network + wireless energy or energy harvesting
– Searching survivors under rubbles will be much more effective with a swarm of small robots, e.g., robotic ants.
• Doppler micro-radar sensors have been demonstrated – PCB modules, RFIC, System-in-Package (SiP).
• Small micro-radars can be added to many electronic devices – computers, phones, tablets
• The technology can be used to detect any motion of an object reflecting radio waves
• With proper signal processing, useful and interesting information can be extracted for various applications (biomedicine, biometrics, …).
• New hardware architectures and sign processing algorithms are being developed by many groups in the world.
Summary
47

48