NON-TENURE-TRACK FACULTY JOB SATISFACTION AND ...
155
NON-TENURE-TRACK FACULTY JOB SATISFACTION AND ORGANIZATIONAL SENSE OF BELONGING by Barbara Krall Hudson A dissertation submitted in partial fulfillment of the requirements for the degree of Doctor of Education in Education MONTANA STATE UNIVERSITY Bozeman, Montana April, 2013
Transcript of NON-TENURE-TRACK FACULTY JOB SATISFACTION AND ...

NON-TENURE-TRACK FACULTY JOB SATISFACTION AND
ORGANIZATIONAL SENSE OF BELONGING
by
Barbara Krall Hudson
A dissertation submitted in partial fulfillment
of the requirements for the degree
of
Doctor of Education
in
Education
MONTANA STATE UNIVERSITY
Bozeman, Montana
April, 2013

©COPYRIGHT
by
Barbara Krall Hudson
2013
All Rights Reserved

ii
APPROVAL
of a dissertation submitted by
Barbara Krall Hudson
This dissertation has been read by each member of the dissertation committee and
has been found to be satisfactory regarding content, English usage, format, citation,
bibliographic style, and consistency, and is ready for submission to The Graduate School.
Dr. Carrie B. Myers
Approved for the Department of Education
Dr. Jane Downey
Approved for The Graduate School
Dr. Ronald W. Larsen

iii
STATEMENT OF PERMISSION TO USE
In presenting this dissertation in partial fulfillment of the requirements for a
doctoral degree at Montana State University, I agree that the Library shall make it
available to borrowers under rules of the Library. I further agree that copying of this
dissertation is allowable only for scholarly purposes, consistent with “fair use” as
prescribed in the U.S. Copyright Law. Requests for extensive copying or reproduction of
this dissertation should be referred to ProQuest Information and Learning, 300 North
Zeeb Road, Ann Arbor, Michigan 48106, to whom I have granted “the right to reproduce
and distribute my dissertation in and from microform along with the non-exclusive right
to reproduce and distribute my abstract in any format in whole or in part.”
Barbara Krall Hudson
April, 2013

iv
DEDICATION
This dissertation is dedicated to my Mother and Dad who always inspired in me a
love for life-long learning. I regret they are still not on earth to share in my
accomplishment and help celebrate with me. I also dedicate this dissertation to my
husband, Tom whose patience and support were unwavering. In addition, I would like to
dedicate this to my daughters, Mary and Stephanie, and son Joseph who always
encouraged me and never let me quit pursuing my dream. They and their families have
been an inspiration to me.

v
ACKNOWLEDGEMENTS
I would like to acknowledge, most importantly, my advisor and mentor Dr. Carrie
Myers. She always encouraged, had the expertise and above all the patience in every step
of this process. Every time I met with her or communicated in so many ways, I came
away believing I could do it. Her belief that I could accomplish this sustained me on
many an evening pouring over data or writing. I would also like to acknowledge my
husband Tom who was always supportive and kept everything else in my life from falling
apart. I want to acknowledge my children, Mary, Stephanie and Joe, who when I
completed the courses and wondered about doing any research at all, said I couldn’t quit
because they were never allowed to. There are many friends who, although questioning
my sanity at times, were always supportive and stepped in to help with my other
responsibilities when they could. The most important are Rhonda, Donna, Karen and
Eleanor. Several other emotionally-supportive friends include, Linda, Kari and Jennifer.
Lastly, I would like to acknowledge my students who have always been supportive and
were truly excited when this journey was finally completed.

vi
TABLE OF CONTENTS
1. INTRODUCTION ...........................................................................................................1
Background .....................................................................................................................1
Context of Study ..............................................................................................................6
Research Purpose ............................................................................................................8
Research Questions .........................................................................................................8
Definition of Terms .........................................................................................................9
Non-Tenure-Track Faculty ...................................................................................9
Part-Time NTT Faculty........................................................................10
Full-Time NTT Faculty........................................................................10
Collective Bargaining Agreement.......................................................................10
Job Satisfaction ...................................................................................................11
Organizational Sense of Belonging ....................................................................11
Conceptual Framework .................................................................................................12
Research Design ............................................................................................................14
Job Satisfaction Survey .......................................................................................15
Organizational Sense of Belonging Survey ........................................................15
Assumptions ..................................................................................................................16
Limitations of Study ......................................................................................................17
Significance of Study ....................................................................................................18
Summary of Chapter .....................................................................................................19
2. LITERATURE REVIEW ..............................................................................................21
Non-Tenure-Track Faculty ............................................................................................22
Historical Development of Non-Tenure-Track Faculty ......................................22
Portrait of Who They Are ...................................................................................26
Nature of Their Work and Working Conditions .................................................33
Job Satisfaction ..............................................................................................................38
Assessment of Job Satisfaction ...........................................................................39
Research on Job Satisfaction in Higher Education .............................................41
Job Satisfaction and Non-Tenure-Track Faculty ................................................42
Organizational Sense of Belonging ...............................................................................46
Sense of Belonging Theory .................................................................................46
Organizational Sense of Belonging ....................................................................48
Organizational Sense of Belonging and Non-Tenure-Track Faculty ............................49
Organizational Sense of Belonging and Job Satisfaction Relationship ........................52
Summary .......................................................................................................................53
3. METHODOLOGY ........................................................................................................54
Introduction ...................................................................................................................54
vii
TABLE OF CONTENTS - CONTINUED
Context ..........................................................................................................................55
Research Design ............................................................................................................55
Sampling Procedures .....................................................................................................56
Sample Participants .......................................................................................................57
Sample Characteristics ..................................................................................................59
Instrument ..................................................................................................................... 60
Measurement of Organizational Sense of Belonging .........................................61
Measurement of Job Satisfaction ........................................................................64
Data Analysis ................................................................................................................67
External Validity .................................................................................................67
Internal Validity ..................................................................................................69
Study Variables ...................................................................................................69
Summary .......................................................................................................................72
4. RESULTS ......................................................................................................................73
Introduction ...................................................................................................................73
Descriptive Data Results ...............................................................................................73
NTT Faculty Characteristics ...............................................................................75
Dependent Variables ...........................................................................................78
Analyses ........................................................................................................................79
Analysis of Variance ...........................................................................................79
Regression Analysis of Variables .......................................................................82
Organizational Sense of Belonging and Non-Tenure Track Faculty Typology ............84
Underlying Predictors of OSB and NTT Faculty Typology ...............................87
Job Satisfaction and Non-Tenure Track Faculty Typology ..........................................91
Summary of Results and Ancillary Analysis ................................................................95
5. CONCLUSIONS ...........................................................................................................98
Introduction ...................................................................................................................98
Overview of Study .........................................................................................................98
Methodology ...............................................................................................................100
Discussion of Results ..................................................................................................101
Research Question #1 .......................................................................................101
Research Question #2 .......................................................................................105
Research Question #3 .......................................................................................108
Research Question #4 .......................................................................................109
Recommendations from Study ....................................................................................114
Limitations of Study ....................................................................................................118
Recommendations for Future Research ......................................................................121
Conclusions .................................................................................................................122

viii
TABLE OF CONTENTS - CONTINUED
REFERENCES CITED ....................................................................................................124
APPENDICES .................................................................................................................133
APPENDIX A: Survey of Non-Tenure-Track Faculty ...............................................134
APPENDIX B: Descriptive Statistics of NTT Faculty ...............................................141

ix
LIST OF TABLES
Table Page
3.1 MSU Non-Tenure-Track Faculty Distribution of Respondents ............................ 58
3.2 Non-Tenure-Track Faculty Response Rate ........................................................... 59
3.3 NTT Faculty Characteristics of MSU Survey Participants ................................... 60
3.4 Survey Sections Used to Answer Research Questions ......................................... 61
3.5 Correlations Between the Questions and OSB Factors ......................................... 63
3.6 Internal Reliability of Job Satisfaction Survey ..................................................... 67
3.7 Type of Variable and Code Used to Analyze the Data ......................................... 70
4.1 Descriptive Statistics of NTT Faculty Type ......................................................... 74
4.2 Analysis of Variance of Job Satisfaction .............................................................. 81
4.3 Correlation Matrix of Study Variables ................................................................. 82
4.4 Unstandardized Regression Coefficients for Organizational Sense
of Belonging on NTT Faculty Typology .............................................................. 86
4.5 Additional Unstandardized Regression Coefficients for OSB
on NTT Faculty Typology .................................................................................... 89
4.6 Unstandardized Regression Coefficients for Job Satisfaction
on NTT Faculty Typology .....................................................................................93
4.7 Pearson Correlation Analysis of JS and OSB for each NTT Category ................. 97

x
LIST OF FIGURES
Figure Page
1.1 Relationship of Job Satisfaction and Organizational
Sense of Belonging ............................................................................................... 13

xi
ABSTRACT
Non-tenure-track (NTT) faculty members are playing an increasingly larger role
in the instruction of students in higher education. They provide a flexible workforce with
specialized expertise, often prefer to work part-time and frequently teach large
introductory courses. Concerns about their treatment and the environment in which they
work are often investigated because their attitudes about their jobs and the workplace can
have an impact on their students and institution as a whole. This study seeks to further
investigate the psychological health of this diverse group of faculty and more specifically
studies the job satisfaction (JS) and organizational sense of belonging (OSB) of NTT
instructional faculty at a public research intensive university. The study used survey
methods to determine the distribution of different NTT faculty types at the institution,
obtain demographic information about their employment and determine their level of JS
and OSB. An electronic survey was sent to 397 identified NTT faculty and 194
responded to a 77 item survey. The respondents self-selected themselves into one of four
previously determined NTT faculty categories. A variety of methods were used to
analyze the data including descriptive statistics, ANOVAs and multiple linear regression
analyses. Results indicate that this institution has three different types of NTT faculty
and that their JS and OSB vary. One of the groups has significantly more job satisfaction
but lower sense of belonging scores than the other two groups. The other two groups
have significantly less job satisfaction but have a greater sense of belonging to their
department and university. These results support previous findings that NTT faculty
members are a complex group of faculty who have different motivations and expectations
for teaching. This diverse group of faculty should not be treated uniformly and distinct
group variations should be considered when initiating recommendations for improving
their professionalism.

1
CHAPTER 1
INTRODUCTION
Background
Over the last four decades there has been a fundamental shift in the make-up of
the faculty in higher education. The shift is from a professoriate which is primarily
tenure-track with the associated job security to an instructional faculty who are not on the
tenure-track with little or no job security. Currently the non-tenure-track faculty (NTT)
are estimated to be 65% of new appointments at universities and are considered by some
to be the new normal professoriate on college campuses (American Association of
University Professors [AAUP], 2009; American Federation of Teachers, 2010; Cataldi,
Fahimi, & Bradburn, 2005; June, 2012).
With the shift in the professoriate to NTT faculty who do much of the teaching at
universities, there is an increased interest in determining who they are, what they do and
how they are treated. Many studies during the last twenty years show that they are a
heterogenous group of faculty with many different types of employment, job
descriptions, motivations and experiences (Gappa and Leslie, 1993; Kezar and Sam,
2010b). To better understand the relatively new and diverse NTT professorate, I
explored in this study their sense of belong to the university community. I also studied
their job satisfaction and the association between job satisfaction and their sense of
belonging.

2
In addition to the term non-tenure-track, approximately fifty other terms have
been used to categorize this group. Other common NTT faculty terms include adjunct,
contingent, instructor, lecturer, part-time and contract labor (Berry, 2005). Some NTT
titles may reflect professional affiliations in specialty professions, but often the
individuals engaged in similar job responsibilities may have titles which vary from
department to department and institution to institution. Even if the same title is given at
one institution, it may mean something very different at other institutions. Frequently,
the term used to identify NTT faculty is linked to specifics of their employment contract.
This variation in terminology makes it difficult to conduct rigorous and consistent
national studies or to make clear and coherent generalizations about NTT faculty. Studies
that aim to understand the roles and differences in NTT faculty, however, are still
possible and important to conduct.
NTT faculty are employed both part-time and full-time. Part-time NTT faculty
account for 47% of all faculty, both NTT and TT, who teach in higher education. Several
national surveys of part time NTT faculty have found that NTT instructors teach almost
half of undergraduate courses in U.S public colleges and universities (American
Federation of Teachers [AFT], 2010; Forrest Cataldi, et al, 2005). Further, if the 18% of
full time NTT faculty are included in the statistics, almost two-thirds of all instructional
faculty are being appointed on the non-tenure-track (Kezar and Sam, 2010b). In
community colleges the percentages of NTT faculty who teach can be as high as 80 to
90% which means that only 10 to 20% of all faculty members are on the tenure-track
(AFT, 2010; National Education Association Research Center [NEARC], 2007).

3
The steady increase in the proportion of faculty who are NTT has been the
prevailing pattern over the last three decades. Schuster and Finkelstein (2006) have
determined that since 1970, part-time faculty appointments have increased five times
faster than full time faculty appointments (tenured and non-tenured). The role of NTT
faculty in educating a growing population of college students is significant even though
many higher education institutions still consider them a supplementary or short-term,
additional workforce (Kezar and Sam, 2010b).
The growing numbers of NTT faculty are not, however, a homogeneous group
and studies which attempt to ascertain variations within the ranks of NTT faculty are
needed to fully understand this heterogenous group of faculty. A number of studies use
typologies to better categorize and describe the shared experiences of NTT faculty (Kezar
and Sam, 2010b). These typologies are used because they provide a rich description of
each type of NTT faculty and better characterize their diversity. Baldwin and Chronister
(2001) have suggested that terms of employment such as teachers, researchers,
administrators or other academic professionals qualify as types of NTT faculty and
Maynard and Joseph (2008) have suggested that categorization of NTT faculty should be
based on whether they have voluntary or involuntary contracts. One commonly used
typology that provides a more descriptive categorization of NTT faculty was developed
by Gappa and Leslie (1993) after conducting extensive research on part-time faculty.
These researchers suggest there are four different categories of NTT faculty and they are:
1. Career Enders - faculty who are in the process of retiring or who are retired

4
2. Specialists, Experts, and Professionals – faculty who are hired for their
specialized knowledge and who are usually employed outside of academia
3. Aspiring Academics – faculty who are looking for full-time or tenure-track
positions
4. Freelancers – faculty who use the position for supplemental income because
they have other jobs not in academia.
Although typologies may vary from study to study they help researchers
understand that there are distinct differences in NTT faculty and applying these
typologies to studies will give us further insight into their motivations and circumstances
for employment (Kezar & Sam, 2010b). It may also demonstrate the difficulties that
universities face in developing plans to better incorporate NTT faculty into the
institution. Incorporating each type of NTT faculty member more fully into the
university could improve the overall health of the learning community and provide a
means of bringing equity into a two-class university system.
Fair treatment and respect are at the core of a sense of belonging and job
satisfaction. Both organizational sense of belonging (OSB) and job satisfaction (JS) are
directly related to the overall functioning of an organization (Cranny, Smith & Stone,
1992; Spector, 1997). Both may be particularly important for NTT faculty who may
experience less control of some conditions of their employment, such as salary, benefits,
job security, promotion or professional development (Benjamin, 1998; Kezar & Sam,
2010b; Maynard & Joseph, 2008).
5
Recent literature has begun to address the issues of job satisfaction among NTT
faculty (Antony & Valadez, 2002; Conley & Leslie, 2002; Hoyt, Howell, & Eggett,
2007). Most of the research has focused on faculty who teach part-time and no major
studies have included full-time NTT instructors (Kezar & Sam, 2010b). The research has
provided a valuable foundation about the reasons why people accept NTT positions and
provided insight into some of the experiences of NTT faculty. Most studies have relied
on national survey data from the National Study of Postsecondary Faculty (NSOPF) and
have found that overall part-time NTT faculty have similar job satisfaction when
compared to their full-time tenure-track counterparts (Anthony & Valdez, 2002; Conley
& Leslie, 2002). However, when particular facets of their job are investigated closer,
differences between part-time NTT faculty, full-time NTT and tenure-track faculty do
exist. For example, many NTT faculty members usually have a lower status or academic
rank and sometimes are classified as nonprofessionals. In addition, they have little job
security, are paid significantly less for teaching the same course and depending upon the
institution and employment status (part-time or full-time) have few opportunities for
professional growth and development (NEARC, 2007). Ultimately, different rates of job
security and pay will influence the level of satisfaction of NTT faculty (AFT, 2010;
Gappa, 2000; Maynard & Joseph, 2008).
In the general population, the link between the social theory of sense of belonging
as part of our social integration and a person’s satisfaction with their job in the
organization in which they work was verified years ago (March & Simon, 1965; Sayles &
Strauss, 1966; Vroom, 1964). People not only want to have friends but they want to
6
belong to a larger organization and share information and experiences with colleagues in
a positive way. The desire for interactions and attachments to others is a fundamental
human motivation (Leary & Baumeister, 1995). Both Vroom in 1964 and March and
Simon in 1965 confirmed that when people belonged to a group, they have an increase in
their job satisfaction.
Another aspect of NTT faculty which is beginning to be studied more is their
organizational sense of belonging (Merriman, 2010, Steele, 1996). A sense of belonging
to a group is an important need if humans are going to grow and be happy (Leary &
Baumeister, 1995, Steele, 1996). Maslow (1962) in his theory of motivation felt it was so
important that he placed belonging to a group right after our need for food and shelter in
his hierarchy of healthy human development. According to his theory, in order for
humans to grow, and eventually reach the ultimate state of self-actualization, they must
first feel part of a group. Since work is an important part of our lives and work groups
are an integral part of work, the organizational sense of belonging to a work group by all
faculty members is important to understand. In addition, because NTT faculty are
playing a greater and greater role in higher education, their growth and happiness is an
important part of the culture and learning environment in the university.
Context of Study
This study of the different types of NTT faculty as defined by Gappa and Leslie
(1993) and their job satisfaction and organizational sense of belonging is done at
Montana State University. MSU is a very high research intensive university (Carnegie

7
classification), is the land grant university in the state of Montana and has a student body
of over 14,600 undergraduate and graduate students (fall 2012 statistics). At MSU, NTT
faculty are collectively called adjuncts and some have part-time teaching positions and
part-time professional positions on campus.
MSU has some unique aspects for conducting research on NTT instructional
faculty. First, faculty are employed in colleges of agriculture, letters and science,
nursing, education, engineering and arts and architecture which means a highly diverse
academic body. Second, some researchers have suggested that NTT faculty who teach at
research intensive universities have lower levels of academic performance and
commitment which affects undergraduate education more so than faculty at general
baccalaureate institutions (Umbach, 2007). Third, NTT faculty at MSU have recently
become unionized due to discontent at many different levels. In addition, since per capita
income in the state is below average (ranks 35th
in the nation), salaries of university
faculty are also lower than at peer institutions. Fourth, there is a large number of NTT
faculty at MSU to survey. According to the Office of Planning and Analysis, in the fall
of 2012, there are 445 individual NTT faculty. As with other universities their identity is
difficult to track because they may also have professional, administrative or classified
appointments as well as instructional responsibilities. Finally, their contracts range from
part-time to full-time appointments and, although they tend to be concentrated in
business, architecture, nursing, education and agriculture, NTT faculty are hired for
instructional purposes in every department on campus. The data on NTT faculty at MSU
are comparable to national statistics and their distribution nationwide (NEARC, 2007).
8
In contrast to the NTT faculty, current statistics show that there are 438 tenure-track (TT)
instructional faculty at MSU.
Research Purpose
The purpose of this research is to investigate the different types of NTT faculty at
MSU and the relationship between their organizational sense of belonging and job
satisfaction. More specifically, the research determines whether different types of NTT
faculty have differences in their sense of belonging to their institution and whether they
have different levels of job satisfaction that are associated with specific facets of their
jobs. For the purposes of this study, I use the term NTT faculty to refer to instructional
faculty knowing that at some research universities, a small percentage of NTT faculty are
hired to conduct research only.
This quantitative study used an electronic survey to identify the different
categories of NTT faculty as described by Gappa and Leslie (1993) and to determine their
job satisfaction and organizational sense of belonging. The survey results were used to
investigate the relationship between job satisfaction and the organizational sense of
belonging in four types of NTT faculty at MSU. The information gained from this
research may help inform people in higher education about the many aspects of the
working environment for different types of NTT instructional faculty.
Research Questions
The study asks four different research questions of MSU NTT faculty.

9
The four questions are:
1. What are the different categories as defined by Gappa and Leslie (1993) that
comprise the instructional NTT faculty at MSU?
2. What is the difference across the NTT faculty categories and their job
satisfaction?
3. What is the difference across the NTT faculty categories and their
organizational sense of belonging?
4. What is the association between the job satisfaction and organizational sense of
belonging for NTT faculty at MSU?
This study considered additional control variables such as gender, length of time
teaching, part-time to full-time appointment, and number of classes currently teaching.
Definition of Terms
For the purposes of this study the following terms are defined.
Non-Tenured-Track Faculty (NTT)
The term non-tenure-track faculty is used for the term adjunct which is the title
used at Montana State University. The term NTT is an umbrella term often used in the
literature today that better profiles this group of faculty who have both part-time and full-
time appointments and who are ineligible for tenure at the university. Unless specifically
identified as having an adjunct instructional appointment separate from their graduate
teaching assistant employment, graduate students are not included as NTT faculty in this

10
study. NTT faculty members at MSU have also recently become unionized under a title
of “non-tenure-track faculty.”
To determine who the NTT instructional faculty for this study were, class
schedules were accessed for each curriculum, titles of the instructors were determined by
accessing the university directory and all instructors with tenure-track titles were
eliminated from the study. Once the list of potential NTT faculty who were teaching in
the fall of 2012 was determined, department chairs/directors were contacted to verify the
instructors. In some instances a visit to the department office was also used to verify the
NTT faculty and obtain their e-mail address.
Part-Time NTT Faculty: For purposes of explanation and analyses the term part-
time NTT faculty is any instructor who is employed less than a full-time equivalency.
Participants provided this information in the survey.
Full-Time NTT Faculty: For purposes of explanation and analyses the term full-
time NTT faculty is any instructor who is employed at a 1.0 FTE or full-time
equivalency. This information was self-reported by the participants in the survey and
used to describe differences in the amount of teaching done by this group of faculty.
Collective Bargaining Agreement (CBA)
In 2010, the NTT faculty voted to form a union to pursue a collective bargaining
agreement. The agreement was confirmed by the NTT faculty and subsequently any .5
FTE or greater NTT faculty member is represented under the contract. Although it is
unclear whether internal contract titles are changing because of unionization, the NTT

11
faculty received raises as negotiated through the CBA. Many NTT faculty received
raises for the first time in many years or in some cases ever. Unfortunately, the CBA is
only for NTT faculty who are employed .5 FTE and above which was a policy
determined by the state labor board. As a result, a significant number of NTT faculty not
represented under the CBA and often do not receive raises, may feel less a part of the
university.
Job Satisfaction
Job satisfaction is defined as the degree to which people are happy in their jobs
(Hackman & Oldham, 1976; Spector, 1997). In this study, job satisfaction was measured
using the Job Satisfaction Survey (JSS) (Spector, 1985) and includes nine facets: pay,
promotion, supervision, fringe benefits, contingent rewards, operating procedures or
conditions, coworkers, nature of work and communication.
Organizational Sense of Belonging
Organizational sense of belonging is defined in this study as the extent to which
NTT faculty at MSU feel part of their university. The model of Baumeister and Leary
(1995) indicates that belongingness has two primary components which are
connectedness (fitting in) and esteem (feeling valued and respected by others). In
addition, the construct occurs in four major environments: (a) family (b) friends (c)
work/school and (d) neighborhood/community. In this study, only the work/school
subscale environment was used to measure the two components of organizational sense
of belonging, connectedness and esteem, in this group of faculty.

12
Conceptual Framework
The conceptual framework for this study is based on a job characteristics model
of Hackman & Oldham (1976). It is also based on Maslow’s hierarchy of needs
motivational theory (1968) and the need to belong theory of Baumeister and Leary
(1995). The job characteristics theory has as its basis the idea that people can be
motivated by the satisfaction they find in doing their job. When their jobs are meaningful
and enjoyable, they are happy and motivated to do their job well. The model has job
satisfaction as an important outcome. According to Spector (1997), the antecedents of
job satisfaction are both environmental (nature of task, people we work with and other
factors) as well as personal (our own personalities and prior experiences).
The need to belong is fundamental to all humans and the theory says we must
have a minimum quantity of positive interpersonal relationships in order to survive and
be happy. Maslow (1968) claimed that a sense of belonging is part of a social need that
is a crucial step before gaining self-esteem and self-actualization. Other research since
Maslow’s theory has shown that although all the needs in his hierarchy are important,
each need may not be satisfied along a continuum and some of the needs may be satisfied
simultaneously or before the lower level need is activated (Robbins, 2005).
Organizational sense of belonging is a person’s belief that they are included in
opportunities available to all members of the organization and that their presence in the
organization matters (Baumeister & Leary, 1995; Steel, 1996; Quinn, 2006).
Organizational sense of belonging and job satisfaction influence each other as well as
commitment to the organization (March & Simon, 1965; Maynard & Joseph, 2008;

13
Merriman, 2010; Sayles & Strauss, 1966; Vroom, 1964). The purpose of this research is
to understand the relationship between job satisfaction and sense of belong across the
different types of NTT faculty. To help determine what that relationship is, all the
primary facets of job satisfaction and the two primary components of sense of belonging
were measured. The framework for this relationship is pictured Figure 1.1.
The theoretical framework for this study is grounded in the theory of met
expectations. This theory states that people have certain expectations when they take a
job and when they are not satisfied they will become unhappy and may leave the
workplace. It goes on further to postulate that no matter what the rewards may be, if our
expectations for the job have note be met, we probably will have dissatisfaction with our
Figure 1.1. Relationship of Job Satisfaction and Organizational Sense of
Belonging
University Environment
a b
Figure 1.1. Model showing the relationship of job satisfaction and organizational
sense of belonging of NTT faculty in a university environment. a = factors which
contribute to job satisfaction; b = components of organizational sense of belonging.
Job
Satisfaction
Organizational
Sense of
Belonging
Pay, Promotion, Supervision, Fringe Benefits, Contingent Rewards, Operating Procedures, Coworkers, Nature of Work, Communication
Connectedness,
Esteem

14
jobs (Porter & Steers, 1973). Using this theory it can be predicted that certain types of
NTT faculty may have different levels of job satisfaction and sense of belonging to the
university because the expectations for their jobs may or may not have been met.
Research Design
To conduct this quantitative study, one large three part survey was sent to NTT
faculty at MSU. It was used to obtain information about the background and category of
NTT faculty, as well as their job satisfaction (JS) and organizational sense of belonging
(OSB). The survey was conducted electronically using Survey Monkey™. The
instructional NTT faculty members were identified with the help of the Office of
Planning and Analysis and Department Heads or Directors. The latter confirmed the
status of NTT faculty in their department as instructors during the fall of 2012 and
provided email addresses when not available through the campus directory. Prior to
conducting the research and disseminating the confidential survey, the Institutional
Review Board at MSU reviewed and approved the study.
The quantitative approach of the study examines differences between NTT faculty
and uses a two-step strategy. First an Analysis of Variance (ANOVA) was conducted to
examine the between-group differences across the faculty typologies (four different
groups) on the two study variables, OSB and JS. Next, multiple regression analyses were
conducted to determine the relationship between JS and OSB for each type of NTT
faculty while controlling for demographic variables. This two-stage strategy allowed me
to examine group differences and answer all four study questions.

15
The measures or dependent variables are the job satisfaction scores from the Job
Satisfaction Survey (JSS) and the Organizational Sense of Belonging subscale scores
from the belongingness survey. Both surveys are described below. Other variables used
to determine differences in NTT faculty types include level of employment (part-time to
full-time), length of time teaching, gender and average number of courses taught each
semester. Each participant was asked to self-select the category which best describes
them as NTT instructors at MSU.
Job Satisfaction Survey
To measure JS, a 36 question JSS survey was used. According to Spector (1997),
the JSS has internal consistency reliability on most of the subset or factors which make
up the survey. I performed reliability analysis using Cronbach’s alpha on each factor and
total job satisfaction with the data from this study (Table 3.6). The reliability was high to
marginally acceptable on each factor with total job satisfaction having an alpha of .92.
The JSS also correlates well with a number of other scales and variables that measure JS
found in the literature (Spector, 1985). Permission was given by Spector for people to
use and modify his JSS survey if it is used for noncommercial academic and research
purposes (Spector, 1997).
Organizational Sense of Belonging Survey
To measure OSB, I used a 34 item survey first adapted by Merriman (2010) to
survey adjunct faculty at a research university similar to MSU. This survey contained the
work/school subscale of the revised belongingness scale developed by Somers (1999) to
16
measure sense of belonging in each of the four environments – family, friends,
work/school and neighborhood/community. Sommers (1999) reported that the revised
belongingness scale was valid and reliable. I conducted a Cronbach’s alpha test for
reliability with the data in my survey and found an alpha of 0.858 for the Department
Factor and 0.913 for the Faculty factor, the two underlying factors which constitute the
total OSB in my study (Table 3.5). It is generally accepted that an alpha of 0.8 or better
means the construct is reliable. Merriman provided permission to use the work/school
subscale of questions for determining the OSB of the different types of NTT faculty at
MSU.
Assumptions
There are several assumptions made in this study. First, the participants are asked
to self-select themselves into one of the defined typologies categorized into one of the
four classifications as described by Gappa and Leslie (1993) after reading a brief
description of the categories. An assumption of this study is that individuals can self-
select accurately into a single category on the survey form even if they may not exactly
fit into one of these categories.
This study only measures one aspect of sense of belonging of NTT faculty, their
work environment. I used a single subscale out of four possible (work, family, friends
and community) and there is an assumption that this measurement of OSB is an adequate
reflection of the person’s overall OSB in relation to this study. Measuring the

17
work/school subscale of sense of belongingness, reveals important information about
NTT faculty and the environment in which they work.
Other assumptions made in this study include: 1) that participants who completed
the survey did so in an honest manner so that their scores reflect the underlying concept
of the study; 2) that the electronic version of the survey will yield similar results to a
paper version or in-person version; and 3) that the results obtained at this particular point
in time are somewhat similar to other points in time and therefore, are somewhat
generalizable.
Limitations of Study
One limitation of the study is that it was conducted at only one research intensive
university. However, there is no reason to believe that MSU is so different from other
similar universities that the results cannot be generalized to other research universities.
Another potential limitation is that the randomness of the sample (actual respondents)
may be reduced because of subject loss. To reduce this, every effort was made to identify
all NTT faculty at MSU through personnel at the Office of Planning and Analysis and
communication with Deans and Department Heads. Also, since this was a voluntary
survey, the participants who did respond could have been disproportionately biased or
happy with their situation or have a greater job satisfaction and sense of belonging
(response bias). To help reduce response bias, every effort was made to encourage as
many NTT faculty as possible to respond to the survey. An additional message
encouraging all non-respondents to respond to the survey was sent after two weeks.

18
An additional limitation of the study is that the four categories of the NTT faculty
are unequally represented. A significant number of respondents from each category were
needed to determine their job satisfaction and organizational sense of belonging.
Categories that did not have adequate cell size were combined with a similar category.
Also, only NTT instructional faculty who teach at MSU were surveyed so no
comparisons were made with other faculty groups on campus, i.e., tenure-track faculty or
research faculty. This is a limitation if the overall climate on campus for all faculty is
unhealthy.
A final limitation of the study is that only one environment (work/school) is
measured to determine a person’s sense of belonging. However, research has shown that
this environment is one of the most important because work plays a central role in our
lives and is where many strong personal attachments are formed (Baumesiter & Leary,
1995; Quinn, 2006; Somers, 1999; Steel, 1996).
Significance of the Study
The study is significant because it provides a description of the NTT instructional
faculty at a research institution, Montana State University. The information not only
informs administrators about the types of NTT faculty on campus but also provides them
with information about the environment in which they work. If some NTT faculty are
unhappy with certain facets of their jobs this could translate into ambivalence about their
teaching and contact with students. Since studies show that one of the greatest influences
on student retention is faculty contact, the attitudes of NTT instructional faculty who do

19
most of the undergraduate teaching should be of concern to university administrators
(Pascarella & Terenzini, 2005). An improved, happier environment for NTT faculty will
improve the climate on campus and foster better student learning and retention. It is also
significant because it shows that certain types of NTT faculty have higher levels of job
satisfaction than others. In addition, there is a significant association between job
satisfaction and organizational sense of belonging in different NTT faculty typologies. A
closer look at these individuals will prove valuable to administrators who seek to create a
positive learning environment for both students and faculty.
Summary of Chapter
NTT faculty are playing an increasingly larger role in the instruction of students
in higher education (AFT, 2010; NEARC, 2007; Schuster & Finkelstein, 2006). Many
categorize them as the new faculty majority (Kezar & Sam, 2010b) and concerns about
their treatment and the environment in which they work have been written about
extensively. This study examines, through a survey of the different NTT faculty types,
their job satisfaction and organizational sense of belonging at one research intensive
university, Montana State University. Survey results were used to determine if there are
significant differences in the dependent measures, job satisfaction and organizational
sense of belonging, among the four different categories as classified in the NTT typology
created by Gappa and Leslie (1993). It also uses the results to determine the relationship
between JS and OSB in the different types of NTT instructional faculty. Research has
shown that an individual’s psychological health influences their attitudes and

20
commitment to their university (Merriman, 2010). A satisfied group of NTT faculty may
in turn translate into a positive learning environment for students and provide more
effective instructors in the classroom (Umbach, 2007). The findings of this study will
help inform many decision-makers about aspects of the psychological health of different
types of NTT faculty and help provide a nurturing, inclusive environment for all faculty
on campus.

21
CHAPTER 2
LITERATURE REVIEW
In this review several topics are investigated pertaining to the study of non-tenure-
track (NTT) faculty and their job satisfaction and organizational sense of belonging.
There is an extensive body of literature on NTT faculty and it often focuses on their
workplace environment and their status in the university. This review will focus on a
discussion of (a) the historical events that lead to the development of non-tenure-track
faculty; (b) a portrait of who they are; and (c) the nature of their work and working
conditions. Following this is a review of job satisfaction and a discussion of the psycho-
social theory of sense of belonging and more specifically, organizational sense of
belonging. Included under each review is the relevant literature on these subjects as they
relate to the study of NTT faculty. It will conclude with a review of the literature which
indicates the relationship between belonging to an organization and job satisfaction. The
theoretical lens of “met expectations” will also be discussed as it is used in this study to
understand the research and theory on NTT faculty (Murray, 2008; Porter & Steers,
1973). Since this research used a quantitative survey approach to study the different
types of NTT faculty at Montana State University, assessment methods of job satisfaction
and organizational sense of belonging will also be reviewed. This review is only about
NTT faculty who teach and whenever studies focus exclusively on either part-time or
full-time NTT faculty, a distinction will be made.

22
Non-Tenure-Track Faculty
Historical Development of
Non-Tenure-Track Faculty
In the multitude of studies of non-tenure-track (NTT) faculty, there seems to be
some common consensus about how this group of faculty became so prominent in our
higher education system (Baldwin & Chronister, 2001; Benjamin, 1998; Cross &
Goldenberg, 2009; Kezar & Sam, 2010b; Schuster & Finkelstein, 2006). History shows
that higher education’s increased reliance on NTT faculty can be traced to two critical
time periods (Kezar & Sam, 2010b; Thedwall, 2008). The first was their increased use in
the community colleges in the 1940s and 1950s. The second was in the last part of the
20th
century when four-year institutions began to hire full-time NTT faculty instead of
tenure-track faculty. During this time, especially from the 1940s to 1970s, there was an
unprecedented growth in higher education resulting in large and diverse public
institutions. This translated into an increase in the need for faculty and their ranks grew
from 120,00 to 474,000 (Schuster & Finkelstein, 2006). Part of the reason for the growth
in our higher education system was the recognition that anyone who sought a degree
should be allowed to obtain one (universal access) (Gumport, 2007). The student body
became bigger, more diverse and in virtually all professions there was an increase in
women and minorities. In addition, the GI Bill of 1944 provided federal funding for
servicemen returning from WWII who sought a higher education. Colleges and
universities were unprepared for this new influx of students, especially the community
colleges. They responded by hiring part-time or contract faculty to teach the additional

23
larger classes. The expansion in all types of NTT faculty appointments from the 1970s
and into the 21st century has continued for reasons which I will soon explain. The rate of
these appointments has grown five times faster than tenure-track faculty positions
(NCES, 2002; Schuster & Finkelstein, 2006). Statistics now show that 65-70% of all
instructional faculty are being appointed on the non-tenure-track and the percentages of
NTT faculty in community colleges can be as high as 80-90% (AFT, 2010; June, 2012;
NEARC, 2007).
The increase in NTT faculty coincided with the public’s growing concern about
our higher education system, both in terms of quality and cost. The increase in scrutiny
by the public coupled with poor economic conditions caused federal and state funding to
dwindle (Baldwin & Chronister, 2001; Kezar & Sam, 2010b). Therefore, it comes as no
surprise that an increase in NTT faculty can also be attributed to the emergence of the
corporate business model in higher education (Baldwin & Chronister, 2001; Bousquet,
2008; Slaughter & Rhoades, 2004).
The operation of a university as if it is a business became common in community
colleges where budgets are tight and tuitions cannot be raised as easily as in four-year
institutions. As a result, NTT faculty members were hired and continue to be hired
because they provide community colleges more flexibility both in terms of cost and
availability (Levin, Kater and Wagoner, 2006). Public four-year institutions followed
suit in the 1990s as they too experienced diminished funding and began to adopt a
business model to survive (Slaughter & Rhoades, 2004). Instead of hiring expensive
tenure-track faculty they hired more full-time NTT faculty (Schuster & Finkelstein, 2006;
24
Thedwall, 2008). The more flexible and diverse contracts of NTT faculty make it easier
for administrators to hire faculty at the last minute to meet enrollment demands and to
forego long expensive nation-wide searches. In addition, administrators found their
availability, and their flexibility in teaching lower-division, high demand courses
including evening and on-line courses, has benefited the operation of the university
(Bousquet, 2008; Kezar & Sam, 2010b; Slaughter & Rhoades, 2004). This market
demand staffing practice has created a two-class faculty system and has led many to
examine the way NTT faculty are treated in higher education (Baldwin & Chronister,
2001; Berry, 2005; Bousquet, 2008; Gappa & Leslie, 1993; Kezar & Sam, 2010b; Levin,
Kater, & Wagoner, 2006).
A final aspect which has affected the trend of hiring more NTT faculty is the
change in the role of the tenured faculty member. After the American Association of
University Professors (AAUP) provided a document in 1940 which formalized academic
freedom and tenure, the profile of a faculty member began to change. During WWI and
WWII, many faculty members were pressed into government service. Therefore, AAUP
expanded the contemporary role of a faculty member to include service to their institution
and public (Schuster & Finkelstein, 2006). The modern tenure-track faculty member has
a highly differentiated role of teaching, research and service. That being said, the modern
research-intensive university places the most emphasis for tenure on research
productivity (Cross & Goldenberg, 2009). This model is also being followed by non-
research intensive universities including comprehensive and liberal arts institutions who
want to become more like the most prestigious universities in their structure and norms, a

25
term called “academic drift” (Morphew & Huisman, 2002). In order to conduct
productive research, tenure-track faculty have sought NTT faculty to assume their
teaching responsibilities. Some are highly qualified professionals who also work in
nonacademic positions (Gappa & Leslie, 1993; Thedwall, 2008). Therefore, although the
“course buyout” practice is another reason for the increase in NTT faculty it is not
without its benefits (Ehrenberg, 2006; Thedwall, 2008). This practice has provided
students with professors who could share real life experiences, especially in the
professions of law, medicine, business, engineering, arts and education.
In summary, it can be said that the development of faculty who are not on the
tenure track has benefited both the institution and tenure-track faculty. It has also
provided opportunities for NTT faculty to do what they like to do, which is teach.
However, this mutual relationship has been shown by some to affect the quality of a
higher education (Umbach, 2007). It can be argued, however, that studies such as this
which use national data bases are limited because they aggregate all NTT faculty into one
category and do not take into consideration different faculty types which are important
when studying NTT faculty (Gappa & Leslie, 1993; Kezar & Sam, 2010b; Merriman,
2010). This mutual relationship has also created a two-class faculty which has created
some discontent among NTT faculty especially in terms of their jobs and sense of
belonging to their university (Merriman, 2010). Therefore, this study compares the
content or discontent among the different types of NTT faculty using a quantitative
analysis approach.
26
Using the theory of met expectations it could be predicted that certain types of
NTT faculty will have different levels of job satisfaction and sense of belonging to their
university. According to Porter & Steers (1973), the concept of met expectations is the
difference between what a person encounters in their job and what they expected to
encounter. People have different expectations in terms of rewards in their organization.
This theory predicts that no matter what the payoffs or rewards, if these expectations are
not met substantially, people will be unhappy, have job dissatisfaction and may withdraw
from their work situation. The theory of met expectations has previously been used to
study new tenure-track faculty and the perceptions of their work life (Murray, 2008).
Portrait of Who They Are
Many studies articulate the characteristics of both part-time and full-time non-
tenure-track faculty (Gappa, 2000; Gappa & Leslie, 1993; Kezar & Sam, 2010b; Schuster
& Finkelstein, 2006). Some of the initial studies focused on categorizing NTT faculty
according to their employment circumstances. These came to be known as typologies and
Howard Tuckman in 1978 is one of the first who developed a typology for NTT faculty
based upon their motives for becoming part-time employees. He conducted a study
through AAUP of 3,763 part-timers at 128 institutions and determined the various
characteristics of the different categories of part-time instructors (Tuckman, 1978). He
distinguished the part-timers by creating seven different categories: the semiretired,
students, hopeful full-timers, full-mooners, homeworkers, part-mooners and part-
unknowners. The “semiretired” are part-timers who are ex-full time academic faculty
who are winding down their careers or ex-full-time professionals outside of academics
27
who are semiretired. The “students” are graduate students who are teaching to gain
experience in teaching or augment their income. The semiretired and students are not as
concerned about long-term job prospects at their current employer. The “hopeful full-
timers” constitute the highest percentage in Tuckman’s study (27.6%). They are part-
time faculty who could not find full-time academic positions and prefer a full-time
position. They are usually younger, more educated, and the least satisfied with their
employment. The “full-mooners” are part-timers who have a second job which is their
primary means of employment. They teach part-time as a supplement to their full-time
careers and are people with a wide range of work histories, education and experience.
The “homeworkers” are part-time faculty who have home responsibilities (children or
other relatives) and are only able to work part-time as an instructor. The sixth category
created by Tuckman (1978) was called the “part-mooners”. They are people who piece
together part-time jobs either at other institutions or elsewhere because none of their
employers can offer full-time jobs. They are concerned about their future employment at
an institution, pursue contracts in several places to hedge their bets and like working in
academics part-time because it is rewarding to teach. The final category is called the
“part-unknowners.” This category included all part-timers who work in academia that
don’t fit into the other categories. These people are in a career transition, make life-style
choices to pursue more leisure activities or they just like staying in touch with the
academic world. In addition to categorizing NTT faculty, Tuckman also provided a
comprehensive list of personal and job-related characteristics of part-time faculty that
laid the foundation for future studies.
28
Subsequent to Tuckman’s work, Gappa and Leslie (1993) conducted another
study of part-time faculty in eighteen institutions of higher education. They developed
different employment profiles of part-time faculty, which were published in a book called
The Invisible Faculty (Gappa & Leslie, 1993). This study is the most often cited resource
for researchers who study non-tenure-track faculty. They interviewed academic officers,
deans, department chairs and part-time faculty, individually and in small-groups, and on
the basis of their work broadened the categories of Tuckman to four employment types.
The categories include: career enders; specialists, experts and professionals; aspiring
academics; and freelancers.
The career enders are similar to the semiretired category of Tuckman but it was
broadened to include academic faculty who are already retired as well as people outside
of education who are transitioning to retirement or are retired from a professional career.
The specialists, experts, and professionals are faculty who are hired for their specialized
knowledge and are usually employed elsewhere. This group was renamed from the full-
mooner category of Tuckman and constitutes over half (52.5%) of part-time faculty
teaching at a university (Gappa & Leslie, 1993). They have full-time jobs as
professionals or managers and have advanced training in fields such as medicine, allied
health, education, business, engineering, social work, law, mathematics and statistics.
They usually have little economic need to teach because they have job security elsewhere
and teaching represents a professional commitment or source of personal satisfaction.
They bring real-life experiences into the classroom and often do not care to understand or
be a part of the academic world of tenure-track faculty. They are often satisfied with their
29
teaching positions but teach at a great personal sacrifice (over and above their other full-
time work).
The aspiring academics category of Gappa and Leslie (1993) is similar to the
hopeful full-timers of Tuckman and consists of part-time faculty who are looking for full-
time or tenure-track positions. They usually have terminal degrees and often manage to
piece together several part-time positions in academia while waiting for a full-time,
tenure-track appointment. They are often the least satisfied with their employment and
many feel they are “stuck” in a marginal role in the academic world. The number of
aspiring academics is on the rise at universities because tenure-track positions are
becoming less prevalent (Baldwin & Chronister, 2001; Schuster & Finkelstein, 2006). In
addition, more colleges are transitioning to universities with graduate programs
(Morphew & Huisman, 2002) where more people are graduating with PhD’s, creating an
even greater demand for TT positions (Bousquet, 2008).
The final category created by Gappa and Lesilie (1993) is called the freelancers
which is a combination of part-mooners, homeworkers, and part-unknowners categorized
by Tuckman (1978). They are the people who have multiple part-time jobs and teaching
at the university is just one of them. They do this by choice and are people such as
artists, musicians, writers or the self-employed. However, unlike the specialists, experts
and professionals they need the part-time employment to supplement their income. It is
important to note that both Tuckman (1978) and Gappa and Leslie (1993) defined part-
time faculty as individuals who are temporary, non-tenure-track faculty and employed

30
less than full-time. They did not include full-time non-tenure-track faculty in their
studies as this category was not as prevalent as it is today.
Other investigators who have since studied this heterogenous group of faculty
include Baldwin and Chronister (2001) who focused their studies on “full-time” non-
tenure track faculty and the growth of these appointments in our university system. They
suggested that the previous categories used to describe NTT faculty should be expanded
to include teachers, researchers, administrators and other academic professionals who
work full-time. Some teachers have split appointments between administrative tasks and
some research but their primary job is teaching. Others are researchers who spend the
majority of their time conducting research with a smaller percentage spent on teaching.
Still others are administrators or professionals such as lab technicians who spend most of
their time either doing research or conducting administrative duties and spend less than
25% of their time teaching (Baldwin & Chronister, 2001).
One final typology of NTT faculty is based on whether their employment is
voluntary (prefer part-time positions) or involuntary (are part-time but prefer a full-time
position). Maynard and Joseph (2008) used these categories to study job satisfaction and
commitment to the institution of NTT faculty. They concluded that future studies of NTT
faculty should include a faculty member’s actual and preferred employment situation as
this may be a better predictor of variables such as job satisfaction and commitment to
their university. For purposes of this research, I used the broad typology of Gappa and
Leslie (1993) to categorize NTT faculty who have declared teaching as their primary
31
responsibility. These categories reflect the diverse backgrounds and reasons for their
employment and have been used by other researchers (Merriman, 2010).
To further describe a profile of NTT faculty, the following is a summary of their
distribution in academia, as well as their composition in terms of gender, race and
terminal degrees. As predicted, NTT faculty can be found in all academic fields.
However, the highest percentages occur in education (48.7%), fine arts (47.0%) and
business (46.0%) (Cataldi, Fahimi, & Bradburn, 2005). According to the National
Education Association Research Center (2007) the greatest increase in part-time faculty
appointments occurred in education from 1987 to 2003 with a 27.7% increase over the 16
year period. The greatest increase in the use of full-time non-tenure-track faculty came in
the health sciences where the numbers rose from 1.9% in 1969 to 22.4% in 1998
(Schuster & Finkelstein, 2006). The increase of full-time NTT faculty is also most
notable in comprehensive, research universities. According to Schuster and Finkelstein
(2006) only 3.4% of all full-time faculty were on the non-tenure track in 1969, but that
number rose to 16.4% by 1998.
Women, in both part-time and full-time NTT appointments, are disproportionately
represented. They are more than twice as likely than men to be off the tenure track
(Baldwin & Chronister, 2001; Cross & Goldenberg, 2009; Schuster & Finkelstein, 2006).
The Association of American Universities (2001) in their Non-Tenure-Track Faculty
Report concluded that only 45% of NTT faculty are women but this represents a
disproportionate number because men outnumber women in tenure track positions by two
to one in doctorial universities. Gappa and Leslie (1993) found similar results in their

32
study of part-time faculty and others who have studied full-time NTT faculty have found
the same (Baldwin & Chronister, 2001; Cross & Goldenberg, 2009; Harper, Baldwin,
Gansneder, & Chronister, 2001). Reasons for this disparity include the difficulty that
women face because they are the primary care-givers in a family (Schuster & Finkelstein,
2006). It also reflects the statistics obtained by AAUP in 2005 that women at all types of
universities are still 10-15% less likely to be in tenure-eligible positions than men (Curtis,
2005). Racial and ethnic minorities are also dispprotionately represented in NTT faculty
positions even though there has been a substantial increase in their rates of graduation
with advanced degrees (Gappa & Leslie, 1993; Kezar & Sam, 2010a). The American
Federation of Teachers (2009) reported that the number of ethnic minorities among part-
time faculty is still at 9%, a figure that Gappa and Leslie reported in 1993. However, the
number of non-white, full-time NTT faculty rose to 17% (Schuster & Finkelstein, 2006).
One final characteristic of NTT faculty is that they tend not to have the same
degree level as tenure-track faculty. The AFT (2003) reported that about 41% of full-
time NTT faculty have a doctorate or professional degree compared to 71% of tenure
track faculty. While most do not have doctorates, 60-80% of all NTT faculty held a
master’s or professional equivalent (Antony & Valadez, 2002; Baldwin & Chronister,
2001). The lack of a PhD or equivalent gives fuel to some scholars to argue that this
group of faculty is not serving our students well (Benjamin, 2003; Ehrenberg, 2006). It
may also lead to an explanation for the disparity in salaries between the two-class
professorate.

33
Nature of Their Work and Working Conditions
In a review of the literature, it was found that generalizations about NTT faculty,
the nature of their work and their working conditions are difficult to make. Their
responsibilities and working conditions are inconsistent and vary by discipline,
department, type of institution and their motivations to teach (Baldwin & Chronister,
2001; Hollenshead, Waltman, August, Miller, & Bergom, 2007). What we do know is
that although their primary role is teaching, many institutions now expect both part-time
and full-time NTT faculty to advise students, serve on committees and sometimes
conduct research (Hollenshead et al., 2007; Kezar & Sam, 2010b). Their role in the
department is usually dependent upon the immediate needs of the department and often
times it is an accumulation of activities that tenure-track faculty do not want to do. These
include teaching lower division courses, overseeing teaching assistants and administering
programs (Baldwin & Chronister, 2001; Gappa & Leslie, 1993; Hollenshead et al., 2007).
Full-time NTT faculty members often teach more courses, have larger classes and, unlike
tenure-track faculty, may not receive teaching assistants. Even though their role in the
department is more defined, they rarely receive additional compensation or time to
perform their increased teaching load (Baldwin & Chronister, 2001; Hollenshead et al.,
2007; Schuster & Finkelstein, 2006). The literature is replete with stories of burdensome
course loads with no rewards, particularly in disciplines like English (Shaker, 2008).
Part-time NTT faculty are frequently at the whim of their department chairs when it
comes to assignments and teaching loads (Gappa & Leslie, 1993) and may or may not be
assigned other duties such as advising.
34
In addition to course assignments, the inclusion of NTT faculty in the
development of curriculum or designing a new course is highly dependent upon the
department and academic field (Kezar & Sam, 2010b). Usually full-time NTT faculty are
allowed to participate but part-time faculty are most often given a standard curriculum to
teach (Baldwin & Chronister, 2001; Gappa & Leslie, 1993). It is also more likely that
NTT faculty in professional areas such as nursing, business or engineering, have more
participation in development and creation of curriculum because their specialized
expertise is respected and welcomed (Kezar & Sam, 2010b). Studies show that when
NTT faculty are not allowed input into curriculum, course creation, syllabi or textbook
selection, it affects their morale and status as a professional (Baldwin & Chronister,
2001).
Research on the working conditions of NTT faculty is extensive. It ranges from
Tuckman’s study with AAUP in 1978 to the AFT survey in 2010. What has been
concluded is that over the last three decades the pay for all NTT faculty is less than their
tenure-track counterparts. They are most often paid less per hour and less per class
section for teaching the same course (Curtis, 2005; Toutkoushian & Bellas, 2003). In
terms of benefits, only 51% of part-time faculty received some benefits. However, full-
time NTT faculty receive benefits similar to tenure-track faculty which include health
insurance, retirement and sick leave (Hollenshead et al., 2007). Gappa and Leslie (1993)
discovered that some universities don’t provide contracts to part-time NTT faculty,
inform them of potential benefits and in some cases don’t rehire them because continuous
employment may mean the provision of benefits at a cost to the university. While they

35
are often paid less, some types of NTT faculty still choose to teach in a university
because they recognize other benefits of teaching, i.e., freedom to do other things, love of
teaching, or contributions to a profession. In this study, I determined the satisfaction of
each type of NTT faculty with their salary and benefits in the job satisfaction survey.
Support services for NTT faculty differ from campus to campus but part-time
more than full-time faculty may have limited access to supplies, office space, equipment
and computers including email accounts (Gappa & Leslie, 1993). Many institutions are
now providing programs for improving teaching and learning and are including NTT
faculty in these programs (Baldwin & Chronister, 2001). However, providing funding
for professional development to attend meetings or perform research is less common
(Baldwin & Chronister, 2001; Gappa & Leslie, 1993). This leads many NTT faculty to
perceive they are falling behind in professional knowledge which is important for their
success and teaching.
In addition to the often inconsistent support of NTT faculty in institutions, their
evaluation is diverse and erratic at best (Kezar & Sam, 2010b). They often are evaluated
on the same criteria as tenure-track faculty which includes research and service. Their
teaching, which is their primary function, is frequently only evaluated by student
evaluations rather than by a diverse portfolio of criteria used to assess teaching
effectiveness (Baldwin & Chronister, 2001). Promotional opportunities are also very
rare, especially for part-time NTT faculty (Gappa & Leslie, 1993). For full-time NTT
faculty less than 50% have career ladder opportunities (Baldwin & Chronister, 2001) and
very few have policies and procedures to encourage application and movement from a
36
NTT faculty position to a tenure-track position (Hollenshead et al., 2007). In fact one of
the greatest causes of concern among the aspiring academics is their perception of being
stuck in NTT positions after they have taught for several years (Kezar & Sam, 2010b).
One of the top concerns of NTT faculty, both part-time and full-time, is job
security. As many as 42% of institutions set term limits for employment of full-time
NTT faculty (Baldwin & Chronister, 2001) and job security for part-time faculty is even
worse. Multi-year contracts seem to be rare and job instability is a frequent reason for
dissatisfaction with working conditions. For faculty who are place bound, it can be even
more disconcerting to think you are being rehired only to learn that days before the term
starts, you will not be teaching (Gappa & Leslie, 1993). Fortunately, most institutions
tend to rehire all types of NTT faculty and unions for NTT faculty have usually bargained
to maintain seniority provisions for part-time faculty so they are the first to be rehired
back (Gappa & Leslie, 1993).
The method for hiring NTT faculty is another inconsistency that many NTT
faculty members experience. Many colleges have no formal way of hiring or orienting
faculty to the workplace. The literature is replete with stories of part-time faculty hired
just days before the class starts and given no office, textbook or course goals (Foreman,
2008). In addition, they may never have any contact with other faculty, except for the
department head that hired them, and must learn on their own what administrative
support is available. Several researchers have found that these local, spur-of-the moment
hiring decisions of NTT faculty are common and many institutions have no formal

37
criteria for hiring NTT faculty (Baldwin & Chronister, 2001; Cross & Goldenberg, 2009;
Gappa & Leslie, 1993).
In most of the literature on NTT faculty, it has been consistently noted that it is
hard to conduct studies of NTT faculty when most universities often have difficulty in
identifying who they are in their institutions (Cross & Goldenberg, 2009). According to
some investigators, even universities who think they can identify NTT faculty
significantly underestimate their numbers (Cross & Goldenberg, 2009; Gappa & Leslie,
1993). Often this is because some departments may hire part-time or full-time NTT
faculty to perform diverse duties other than teaching or they may be employed by
multiple departments which give them different titles and contracts. All these working
scenarios make it difficult to conduct studies to determine their working conditions,
concerns and how they feel about their university (Kezar & Sam, 2010b).
There are many different theories which are used to study NTT faculty (Kezar &
Sam, 2010a). They include economic theories (market theories), sociological theories
and psychological or social psychological theories. The psychological theories lay the
foundation for helping us understand the experiences that NTT faculty share under the
conditions in which they work. According to Kezar and Sam (2010a) too few studies
have been done of NTT faculty from the perspective of their shared jobs and experiences.
Understanding their satisfactions or dissatisfactions and their sense of belonging on
campus will enable us to better understand their perspective of campus life. This in turn
may lead us to better policies and procedures that may improve the climate for NTT
faculty in academic institutions.

38
Job Satisfaction
Job satisfaction is, simply put, how happy people are with their jobs. It is the
degree to which people either like (are satisfied with) or dislike (are dissatisfied with)
their employment circumstances. Cranny, Smith and Stone (1992) described a general
agreement in the definition of the construct of job satisfaction. They said job satisfaction
“…. is an affective (that is, emotional) reaction to a job that results from the incumbent’s
comparison of actual outcomes with those that are desired (expected, deserved, and so
on)” (p.1). The construct of job satisfaction is closely linked to the theory of met
expectations described by Porter and Steers (1973). They examined the factors that
contributed to employee turnover and found that job satisfaction is inversely related to
employee turnover. Therefore, using the theory of met expectations would suggest that
job satisfaction in NTT faculty would vary depending upon the reason for their
employment. The reason for employment is embedded in a description of each category
of NTT faculty used in this study.
To date there are thousands of written reports on studies of job satisfaction of
employees in every segment of our society. The construct of job satisfaction grew out of
work initially done by industrial psychologists when they were asked to determine what
facets of a person’s job might contribute to an increase in happiness and therefore, an
increase in productivity. It is also a primary variable which is often studied in behavioral
research of organizations because it relates to job design and supervisory roles (Spector,
1997). In higher education, it is used to determine the attitudes of faculty, staff and

39
administration in all types of institutions from community colleges to research
institutions and private colleges.
Job satisfaction is studied by many organizations for humanitarian reasons or the
fair treatment of people. People who are treated with respect experience a good quality
of life, have good health (both mental and physical), and have job stability. People who
are satisfied with their jobs cooperate with people around them and usually exhibit trust
in management (Cranny, Smith, & Stone, 1992). A sense of trust in management will
lead to a sense of belonging in the environment in which they work. Therefore,
organizations usually seek to understand the important aspects of the jobs of their
employees so that they are productive (Cranny et al., 1992; Rosser, 2005; Spector, 1997).
Assessment of Job Satisfaction
In the early 1960s organizational sociologists began to treat job satisfaction as a
complex set of variables and not just a single condition (Vroom, 1964). Soon other
researchers began to study the best way to measure job satisfaction and discover the
variables of work that contribute to enjoyment of the job. Smith, Kendall, & Hulin (1969)
developed a Job Description Index (JDI) that broke down job satisfaction into five facets
or components (work, pay, promotion, supervision and coworkers). Other measures of
job satisfaction include the Minnesota Satisfaction Questionnaire (MSQ) developed by
Weiss and colleagues in 1967 (Weiss, Dawis, England, & Lofquist, 1967) and the Job
Diagnostic Survey (JDS) developed by Hackman and Oldham in 1976. These surveys
are used extensively to study the psychological states of employees and the reactions to
their jobs including satisfactions with pay, job security, coworkers, supervisors and their
40
feelings of worth with accomplishment of a job. All the measures of job satisfaction are
developed by organizational and industrial psychologists who study companies.
In 1985 Spector developed a job satisfaction survey that was specific for human
service employees (Spector, 1985). It measures nine subscales and is called the Job
Satisfaction Survey (JSS). The JSS uses factors that are more applicable to human
service employees including people who work in public and nonprofit organizations. I
used the JSS to assess job satisfaction in different types of NTT faculty in this study.
Spector conducted extensive research in developing the survey and tested its
validity and reliability in 19 human service samples (Spector, 1985). The nine subscales
created are consistent with other major survey instruments used to determine job
satisfaction (MSQ, JDI, and JDS). Spector also provided evidence through factor
analysis that the subscales are relatively independent. The JSS survey contains 36 items
with four questions used to assess each subscale and a total satisfaction score determined
by combining all of the items. The nine subscales or facets include: pay – satisfaction
with pay and pay raises; promotion – satisfaction with promotion opportunities;
supervision – satisfaction with a person’s immediate supervisor; fringe benefits –
satisfaction with fringe benefits such as medical insurance, vacation time, or sick leave;
contingent rewards – satisfaction with rewards which are not necessarily monetary and
given for good performance; operating conditions – satisfaction with rules and
procedures; coworkers – satisfaction with coworkers; nature of work – satisfaction with
the type of work done and communication – satisfaction with communication within the

41
organization. In Spector’s book on Job Satisfaction he gave permission to use or modify
the survey for noncommercial academic and research purposes (Spector, 1997).
Research on Job Satisfaction in Higher Education
There are a substantial number of studies that focus on the work life of faculty
and their satisfaction with the various aspects of their jobs. Although most of this
research is on tenure track faculty and their work lives, some key demographic
characteristics have emerged that will lend themselves to the study of job satisfaction in
NTT faculty (Rosser, 2005; Seifert & Umbach, 2008). Most of the research uses national
data bases such as the National Study of Postsecondary Faculty (NSOPF) which surveys
the work life of faculty members throughout the United States. Rosser (2005) used the
results of three studies to conceptualize the characteristics which contribute to a faculty
members’ satisfaction or dissatisfaction. These characteristics include advising, course
load, quality of students and an overall self-report of job satisfaction. The selected
demographics in many of these studies were sex, race/ethnicity, academic rank and tenure
status. An additional study by Seifert and Umbach (2008) studied the demographic
characteristics of gender and academic disciplines to determine differences in job
satisfaction. Their findings showed that women are consistently less satisfied than their
male counterparts with aspects of their academic life and this varied by discipline. The
extensive research on the demographics of faculty helped determine the background
characteristics used in this study – gender, number of years teaching, number of courses
currently teaching, employment status, and academic discipline.

42
Job Satisfaction and Non-Tenure-Track Faculty
Researchers have found a vast array of conditions and factors that influence the
job satisfaction of NTT faculty. Many of these studies used data from the National Study
of Postsecondary Faculty (Antony & Valadez, 2002; Benjamin, 1998; Conley & Leslie,
2002; Gappa, 2000; Toutkoushian & Bellas, 2003). Most often researchers used this data
to study part-time NTT faculty and often comparisons were made to tenure-track (TT)
faculty. In a study by Gappa (2000), it was found that 77% of part-time NTT faculty have
jobs outside of the university and 85% have an intrinsic satisfaction with their teaching.
Most of these people are the category “specialists, experts and professionals” initially
described in the typology of Gappa and Leslie (1993). However, when specific aspects
of their job such as opportunities to advance, job security and benefits are assessed, part-
time faculty are greatly dissatisfied compared with their tenure-track faculty counterparts.
The treatment of part-time faculty varied with their type of appointment which in turn
influenced their satisfaction.
In another study, Antony and Valdez (2002) used the 1993 NSOPF data to study
job satisfaction of part-time college faculty. They constructed three very different scales
in which satisfaction was determined – personal autonomy, students (advising and quality
of students) and demands and rewards such as work load, salary, and advancement
opportunities. They determined that part time NTT faculty are significantly less satisfied
than full-time NTT faculty in autonomy and students scales but in overall job satisfaction
(one response to overall satisfaction), part-time faculty are significantly (p < .001) more
satisfied than full-time NTT faculty. They lumped eight major facets of job satisfaction
43
into one demands and rewards scale, even though most of these facets have been shown
in other studies to be independent of each other (Cranny et al., 1992; Hackman &
Oldham, 1976; Spector, 1985; Vroom, 1964; Weiss et al., 1967). Since they used a
national data set, they too considered all NTT faculty members as being the same (part
time only) and were not able to distinguish between different categories of NTT faculty.
Benjamin (1998) approached the study of part-time faculty using 1993 NSOPF
data to look at clusters of faculty. He divided faculty into a vocationally oriented cluster
(VOC) and a liberal arts cluster (LAC). The VOC cluster includes allied health
professions, engineering, law, business, physical sciences and teacher education while the
LAC cluster includes liberal arts fields, such as sociology, philosophy, English, history,
fine arts, foreign languages, and political sciences. His findings about the attitudes of
these part-time faculty showed that the VOC cluster is substantially more satisfied with
their jobs than the LAC cluster. The category of the part-time faculty member is not
differentiated and while faculty in the VOC cluster teach primarily for intrinsic reasons
(they also have other jobs outside of academia), many within the LAC cluster often
depend upon their part-time employment within the academe for their livelihood. The
LAC cluster was concerned about their job security, salaries and keeping current in their
field (Benjamin, 1998). Conley and Leslie (2002) had similar findings as they too found
different levels of satisfaction between NTT faculty in the humanities versus those in
other program areas. They also found that some NTT faculty (50-54%) desire only part-
time work while others (40-47%) are working part-time only because they could not find
full time employment. Their claim is that work status could lead to differences in their
44
attitudes and job satisfaction, a claim that has been verified by others (Maynard &
Joseph, 2008).
Another study using the 1993 NSOPF data researched differences in gender of
part-time NTT faculty and perceptions of job satisfaction (Toutkoushian & Bellas, 2003).
They concluded that females are less satisfied than males with three variables –
advancement opportunities, job security and salary. They also concluded that women are
6% more likely to prefer part-time employment and more married women than married
men prefer part-time positions. As with other studies using NSOPF data, they considered
all NTT (part-time) faculty members as one group and did not differentiate their
categories.
In 2009, the American Federation of Teachers published the results of a telephone
survey of 500 part-time, NTT faculty at 2-year and 4-year institutions (AFT, 2010). The
part-time faculty had mixed results on their assessment of job satisfaction with their
employment. Of the 50% who want part-time teaching, 75% are satisfied with their
employment. Of the 47% of the part-time faculty who want full-time teaching positions,
only 49% are satisfied with their jobs. The AFT study coincides with the results obtained
by Maynard and Joseph (2008). They studied job satisfaction in different groups of part-
time faculty – those with voluntary or involuntary employment. In their study, which is
limited to one university, they surveyed the job satisfaction of all full-time and part-time
NTT faculty members and also asked about their conditions of employment. They found
differences between the groups as the involuntary part-time faculty are not as satisfied
with their job security, salaries or their ability to advance as are the voluntary part-time or
45
full-time counterparts. For many involuntary NTT faculty, they desire a tenure-track
position and only teach as a part-time faculty member until an opening occurs. Other
studies confirm these findings (Gappa & Leslie, 1993; Hollenshead et al., 2007; Levin et
al., 2006). Maynard and Joseph (2008) argue that using the voluntary-involuntary or
person-job fit model is important when trying to predict or understand a person’s attitude
toward their job and that faculty status preference has a greater impact on job satisfaction
than other measures of job satisfaction. A weakness of this study is that no distinction
between full-time NTT faculty and TT faculty is apparent and there was a relatively small
sub-sample for each faculty type. As part of the survey for this study, I ask a question
concerning their preference for a NTT or TT faculty position. I also believe that implicit
in each category of NTT faculty are the characteristics which lend themselves to
determining if they have voluntary or involuntary employment. The career enders and
specialists, experts and professionals probably have voluntary employment while the
aspiring academics and freelancers may not.
A final study by Feldman and Turnley (2001) included a small number of non-
tenure-track faculty (105) at a large university. The focus of the study was the career
stage of NTT faculty (early or late-career stage). One of their three measures of attitude
was job satisfaction and they found that late-career NTT faculty had more positive work
attitudes than either mid-career or early-career faculty (Feldman & Turnley, 2001). This
is not surprising since late-career faculty are often near retirement, have had successful
careers within or outside academics and for intrinsic reasons are satisfied teachers. Early

46
or mid-career faculty are often more anxious about their careers and want full-time jobs
either within or outside of academia.
The purpose of this review on job satisfaction is to illustrate the complex nature of
a diverse group of faculty who teach most of the students on college campuses. The
review also summarizes how different aspects of the work life of NTT faculty have been
studied and the importance of including gender and academic department as control
variables. Most importantly, the mixed results indicate the importance of differentiating
the types of NTT faculty so it can be determined if one group is more satisfied with their
NTT appointment than another. The differences may lead to improvement of working
conditions for those who are dissatisfied. In many studies, researchers often state that
when NTT faculty members are involved with campus life, including departmental affairs
and service, they have a greater satisfaction with their work. Improvement in these
aspects of their work life may also contribute to their sense of belonging and commitment
to their university.
Organizational Sense of Belonging
Sense of Belong Theory
The term “sense of belonging” is grounded in many theories of motivation. One
of the early theories of motivation was Maslow’s Hierarchy of Needs Theory (Maslow,
1943). He postulated that within every human there are five needs which are ranked in a
hierarchal order: physiological, safety, social, esteem and self-actualization. As each of
these needs becomes more and more satisfied, the next need becomes dominant.

47
Although over time his classic theory has not been fully supported by some psychologists
or sociologists, he is the first to describe “sense of belonging” or social need as an
important part of healthy human happiness (Maslow, 1962). Later motivational theories
such as Alderfer’s E.R.G. theory condenses Maslow’s five hierarchy of needs into three
categories called Existence (E), Relatedness (R), and Growth (G) (Alderfer,1972). A
central part of this theory is Relatedness, which highlights the need for interpersonal and
social relationships (Ivancevich & Matteson, 1996).
Other motivational theories such as Herzberg’s Motivation-Hygiene Theory and
McClelland’s “three-needs theory” discuss the many intrinsic factors that lead to attitudes
about work and the importance of the need for affiliation or a sense of belonging to a
group (Robbins, 2005). Also, Kohurt, a psychologist who studied self needs, believed it
is important for people to sense they belong or feel part of a group in order to avoid
feelings of loneliness (Lee & Robbins, 1995).
In 1995, Baumeister and Leary, conducted an extensive meta-analysis of existing
literature on interpersonal behavior and the belongingness hypothesis. They proposed the
Need to Belong theory and provided evidence that the need to belong is a fundamental
human motivation (Baumeister & Leary, 1995). Subsequent to this work, Steele (1996)
conducted qualitative and quantitative research on social integration. She created a scale
to represent the sense of belonging construct and determined the basic components which
could be measured. The construct was tested and was valid for one community college
employee group (Steele, 1996). After the work of Steele, Somers (1999) developed a 140
item Belongingness Scale (BES) and identified belongingness in four environments:

48
family, friends, work/school and neighborhood. It was tested on 330 men and women
and revised to remove redundant items (BES-R). She then provided proof of construct
validity in her study (Somers, 1999). Both studies have led to methods of assessing
people for their level of social integration or sense of belongingness.
Organizational Sense of Belonging
Although the sense of belonging has been studied for decades, it has only been
recently that “organizational” belongingness was described. Some believe that an
individual’s desire for social contact or belongingness corresponds with their ability to
identify with the organization (Dutton, Dukerich, & Harquail, 1994; Wiesenfeld,
Raghuram, & Garud, 2001). Others studied belonging to organizations through the lens
of the social identity theory and found that identification with an organization was
positively related to variables like job satisfaction, motivation and well-being (Van Dick,
Wagner, Stellmacher, Christ, & Tissington, 2005). Still others studied organizational
sense of belonging in terms of the concept of perceived cohesion of a group (Bollen &
Hoyle, 1990).
The concept of organizational sense of belonging was recently used to study
students in our higher education system. Sense of belonging scales were developed for
counselors to assess the factors associated with student belongingness in a college setting
(Tovar & Simon, 2010). In addition, the measures of sense of belonging were used to
determine factors that may contribute to students leaving after their first year of college
(Hoffman, Richmond, Morrow, & Salomone, 2002). These factors are used be to develop
retention activities on campus. It was also used to study recent nursing graduates to help

49
identify problems new graduates face in their first job (Winter-Collins & McDaniel,
2000). Since retention in nursing is such an important issue, the information from this
study can be used to inform employers about better ways to make first time employees
feel a part of the organization, improve their morale and increase their likelihood of
staying longer than one year. Although these studies may not directly relate to this study
of organizational sense of belonging of NTT faculty, they do point out that measuring
this construct may lead to information about the different types of NTT faculty and
recommendations that would improve their working environment.
Organizational Sense of Belonging
and Non-Tenure-Track Faculty
In reviewing the literature on non-tenure-track faculty a few articles articulate the
working conditions of this group of faculty (Dobson, 2001; Fulton, 2000; Van Arsdale,
1978). In these articles, NTT faculty are often characterized as having daily insults to
their professional status with few opportunities for strong institutional bonding. Many of
these articles are written by people who are angered with the unethical treatment of NTT
faculty and, more often than not, the reports do not contain documented research on how
the different types of NTT feel about their workplace environment.
In the last six years there has been some research on the organizational sense of
belonging (OSB) of non-tenure-track faculty. The first study was a national institution-
level survey of NTT faculty from the University of Michigan (Hollenshead et al., 2007).
They conducted a random survey of 545 public and private four-year schools and asked
administrators (deans, provosts, or human resource officers) about their perceptions of
50
NTT faculty. Their findings indicate that NTT faculty are most frequently concerned
about compensation, job security, respect and working conditions. The researchers
framed their results using Maslow’s hierarchy of human motivations and believed the
belongingness of NTT faculty is their desire for respect, recognition and appreciation. Of
the administrators who responded to the survey, 70% believe respect is the most
important thing for NTT faculty. Unfortunately, the survey was only conducted with
administrators and not NTT faculty themselves so the information reported was only the
“perceived” desires of NTT faculty.
The second study was a mixed methods approach to study NTT faculty (adjunct)
in a small liberal arts college in the northeastern United States (Quinn, 2006). Interviews
were conducted with five NTT faculty and 72 others were surveyed to assess their
organization-based self-esteem, “institutional belongingness” and career development
opportunities. Quinn (2006) found that the experiences of the NTT faculty produced an
overall negative institutional belongingness score. Most have a negative response on the
subscales which included no opportunities for social interaction with full-time (TT)
faculty (65.4%) and administrators (71.2%), inadequate supervision (76.9%), no feedback
on their work (71.2%) and no opportunity to respond to evaluations by students (69.2%).
The limitations of this study include the difficulty in making generalizations from the
small number surveyed and there was no attempt to categorize the adjuncts into the
different types of NTT faculty. However, it was the first study to assess the theory of
belongingness in adjunct or NTT faculty.

51
A more recent study on OSB of tenure-track and NTT faculty (adjunct) was
conducted by Merriman (2010). She surveyed NTT faculty and TT faculty at one four-
year, research intensive public university and explored the relationship between OSB and
affective organizational commitment in these two groups of faculty. She also asked the
NTT faculty to self-report their category based on the typology developed by Gappa and
Leslie (1993). Her results indicated that, after controlling for length of time teaching,
there was a significant difference (p < .05) between NTT faculty and TT faculty in their
OSB with TT faculty having a greater sense of belonging. When she compared the OSB
scores of the NTT faculty types, she found that there are significant differences (p < .05)
between NTT faculty who teach for 7 or more years. More specifically, there is a
significantly higher mean score for OSB in NTTs who are “career enders” than in those
who are “specialists, experts or professionals.” She also reported a statistically
significant linear relationship between OSB and affective organizational commitment
among both NTT faculty as well as TT faculty (p<.001) (Merriman, 2010). In other
words, faculty in both groups who have a strong OSB also have a strong commitment to
their university. Her study is important because it begins to uncover a psycho-social
aspect of the environment in which different types of NTT faculty work.
These previous studies provide a backdrop for my study of OSB and JS in NTT
faculty at Montana State University. After measuring the OSB and JS of different types
of instructional NTT faculty, the study describes the differences in NTT faculty at MSU.
The results then provide a better understanding of who they are and how they experience

52
their workplace. This new information may be useful to faculty and administrators who
want to help NTT faculty feel more a part of the university in which they teach.
Organizational Sense of Belonging
and Job Satisfaction Relationship
Studies in the 1960s indicate there is a relationship between OSB and JS. Vroom
in 1964 drew upon the work of Elton Mayo in 1945 who strongly opposed the principles
of management that viewed workers as economic machines. Vroom determined that the
work group, or man’s desire to be associated with fellow humans in work, is one of the
strongest human characteristics that exists and may be a major source of satisfaction in
work (Vroom, 1964). March and Simon (1965) also confirm that belonging to a group
increased job satisfaction. In Herzberg’s studies of motivation, he found that the lack of
several factors such as a relationship with a supervisor, with peers or with subordinates
could be a source of extreme “dissatisfaction” with humans in their work environment
(Hoyt et al., 2007). Also, when Sayles and Strauss discuss work groups, they indicate
that identification with groups and organizations is very important (Sayles & Strauss,
1966). In drawing upon the work of psychologists, they state that:
“The difference may be subtle-but people want more than just to have
friends, they want to belong. One can sense that he is part of a larger
organization only by indirection, but the shared experiences of one’s
immediate colleagues are among the most meaningful and potent sources
of job satisfaction” (p. 84).
These studies and earlier theories on organizational behavior show a strong relationship
between these two constructs.
In a review of the literature of OSB and JS, I was unable to identify any research
that indicates these two constructs have been studied in NTT faculty members. In fact, in

53
a meta-review of NTT faculty by Kezar and Sam (2010a, 2010b), it was noted that not
enough studies have been conducted concerning the psycho-social issues of this group of
faculty. As shown by Merriman (2010), the OSB of NTT faculty is significantly lower
than their TT counterparts. Therefore, this study on the JS and OSB of NTT faculty
provides new information about their feelings concerning the environment in which they
work and adds to the growing body of literature on NTT faculty.
Summary
This chapter contains a review of some of the literature on the status of non-
tenure-track faculty. In addition, a summary of the information that is known about job
satisfaction, including how it is assessed, was discussed. Also provided is a review of
important theories of motivation which include the sense of belonging as a primary
motivator in our lives. All pertinent literature on the construct of job satisfaction and the
psycho-social theory of organizational sense of belonging in NTT faculty was also
discussed. The purpose of this review is to use this information as a foundation for
studying job satisfaction and its relationship to organizational sense of belonging in
different types of NTT faculty at one research intensive university. Information gained
from this study may lend itself to providing support for NTT faculty, encourage a happy,
integrated faculty, and provide a better learning environment for all students.

54
CHAPTER 3
METHODOLOGY
Introduction
The growth in a group of faculty labeled the non-tenure-track (NTT) faculty who
teach at universities in the United States has been well documented. In many institutions
they are well over half of the employed faculty who teach students (June, 2012). In
research intensive universities, such as Montana State University, there are also a small
number of NTT faculty whose primary mission is to conduct research. This study only
focuses on one group of NTT faculty, the instructional faculty, who devote most of their
time teaching students. The intent of the study is to determine if they are satisfied in their
role as an instructor and if they feel they belong to the MSU community. In addition,
because it is well documented that there are different types of NTT faculty, this study
determines if their satisfaction and sense of belonging varied in each of the four
categories described by Gappa and Leslie (1993). To that end, the study surveyed the job
satisfaction (JS) and organizational sense of belonging (OSB) of NTT faculty at MSU
and analyzed the association between these two constructs across the four categories of
NTT faculty. This chapter describes the context of the study, the research design, the
survey participants, the survey instrument and the data analysis of the results.
55
Context
The research was conducted at Montana State University, a public land-grant
institution, located in Bozeman, Montana. Founded in 1893, it is one of only 108
institutions (out of 4,600) designated as having a very high research activity by the
Carnegie Foundation for the Advancement of Teaching (http://classifications.carnegie
foundations.org/descriptions/basic.php). It boasts an inquiry and research-based
curriculum in which every student participates in a research or creative experience in the
arts, humanities, natural sciences, physical sciences or social sciences. MSU is the home
to over 14,000 students in eight academic colleges: Agriculture, Arts and Architecture,
Business, Education and Health and Human Development, Engineering, Letters and
Science, Nursing and Gallatin College. The student body is predominately white (86%),
male (53%) and from Montana (62%). As with most universities, it is experiencing the
high costs of recruiting and retaining tenure-track faculty. It has also experienced an
increase in students primarily and as a result, there has been an increase in the number of
NTT faculty who are hired to teach classes.
Research Design
This correlational study used an electronic survey to investigate the level of job
satisfaction (Spector, 1997) and level of sense of belonging (Merriman, 2010) of different
types of NTT faculty. Additional data about several characteristics of NTT faculty was
collected to serve as independent variables in the statistical analysis. These
characteristics include number of years teaching, number of courses currently teaching,

56
gender, academic unit in which they teach, level of employment (full-time or part-time)
and whether they were in a NTT faculty position by choice. The survey method used
quantitative analyses that rely on a regression-based strategy to understand how NTT
faculty members influence OSB and JS. It also used ANOVA analyses to determine the
between-group differences among the different categories of NTT faculty with the two
study variables, OSB and JS. An electronic survey was used to obtain results to answer
the following four questions of the study:
1. What are the different categories as defined by Gappa and Leslie (1993) that
comprise the instructional NTT faculty at MSU?
2. What is the difference across the NTT faculty categories and their job
satisfaction?
3. What is the difference across the NTT faculty categories and their
organizational sense of belonging?
4. What is the association between job satisfaction and organizational sense of
belonging for NTT faculty at MSU?
Sampling Procedure
The population for this study was all NTT faculty who were teaching at MSU in
the fall of 2012. After obtaining Institutional Review Board approval to conduct the
survey, an initial list of individuals was obtained from the Office of Planning and
Analysis. This list included names of NTT faculty who taught in the 2011-2012
academic year but only those faculty who taught at a .5 FTE and above, the level at
57
which employees receive benefits. In order to obtain a current and more complete list
which included all NTT instructional faculty regardless of employment level (less than .5
FTE to full-time), I scanned every class being taught in the fall of 2012. The names were
cross checked with their titles and rank and all tenure-track faculty were eliminated from
the list. The campus directory contains the email addresses for most of the faculty on
campus so while creating the list from each department an electronic address was also
obtained. After each department list was completed, the department/head or director was
contacted or the department’s office was visited to verify that these individuals were NTT
faculty who were teaching during the semester. Off campus emails were provided, in
most cases, for individuals who did not use a university email address. Numerous emails
and phone calls resulted in a list of NTT faculty to which the survey was sent. The
survey was delivered through Survey Monkey™ and participants were directed to it after
an email explained the purpose of the study. The email also explained their voluntary
participation, confidentiality of information, and an incentive to be entered into a drawing
for a monetary reward if the survey was completed.
Sample Participants
After completing the list it was determined that 443 NTT faculty members were
teaching at MSU in the fall of 2012. According to MSU’s web site there were 438
tenure-track faculty at MSU during this time period. Therefore, tenure-track faculty
represent 49.7% of the instructional faculty on campus. Two departments would not
provide emails for NTT faculty who had off campus addresses but did notify them of my

58
study and many responded with contact information so they could participate in the
survey. In other instances, the department had no record of email contact with the
individual. Therefore, 35 individuals were eliminated from the study because they were
unable to be reached electronically. Consequently, on November 1st, I sent the survey to
408 NTT faculty. Nine participants were not reached because of an incorrect email
addresses and two more opted out of the survey. Therefore, 397 or 89.6% of the
identified NTT instructional faculty received the survey. A second invite was sent two
weeks later and by January 15th when the survey ended, the final response for the survey
was 194 respondents or 48.8%. After examining the data it was determined that 12
respondents did not complete the survey (failed to answer greater than 50% of survey)
and they were removed from the data set. This left a total of 182 respondents for data
analysis and a 45.8% response rate. Table 3.1 shows the distribution of NTT participants
within each College at MSU and their response rate.
Table 3.1 Non-Tenure-Track Faculty Distribution of Respondents
________________________________________________________________________
College Survey Sent Responded Response Rate
_______________________________________________________________________
Letters and Science 119 62 52%
Arts and Architecture 50 22 40%
Education, Health & Human Development 47 27 57%
Nursing 79 27 34%
Agriculture 12 8 67%
Business 34 13 38%
Engineering 22 9 41%
Gallatin College 14 5 36%
Other (University Studies/Honors) 31 21 68%___

59
Because the number of respondents was low for several of the colleges, several
colleges were grouped together for the data analysis. Therefore, a combined category
was created which consists of Agriculture, Business, Engineering, Gallatin College and
Other. The combined category is labeled “Other” throughout the remainder of the study.
The five groups used to analyze the information and their percent of the total response are
listed in Table 3.2.
Table 3.2 Non-Tenure-Track Faculty Response by College
________________________________________________________________________
College Responded Response Percent
________________________________________________________________________
Letters and Science 62 32%
Arts and Architecture 22 12%
Education, Health & Human Development (EHHD) 27 14%
Nursing 27 14%
Other: Agriculture, Business, Engineering, 56 28%
Gallatin College, Other (University Studies/Honors)
________________________________________________________________________
Total: 194 100%_______
Sample Characteristics
In addition to obtaining information about the academic unit in which they do the
majority of their teaching, other demographic information about each participant was
asked in the survey. This includes gender, number of years teaching, level of
employment (FTE), average number of courses taught each semester and whether they
prefer a NTT teaching position or desire a tenure-track position. Most importantly,
participants are asked to select one of four categories of NTT faculty that best describes

60
them. Table 3.3 provides a summary of the demographic characteristics for the
participants in this study of NTT faculty.
Table 3.3 NTT Faculty Characteristics of MSU Survey Participants
________________________________________________________________________
______Frequency (N) Percent______
Gender
Male 69 38%
Female 113 62%
Number years teaching as NTT faculty
First year (first semester) 20 11%
1-2 years 27 15%
3-5 years 42 23%
5-10 years 46 25%
Greater than 10 years 47 26%
Average number of courses taught/semester
One course 59 32%
Two courses 52 29%
Three courses 39 21%
Four or more courses 32 18%
Average level of employment (FTE)
.25 FTE or less 21 11%
.25 - .50 FTE 34 19%
.50 - .75 FTE 31 17%
.75 - 1.0 FTE 22 12%
1.0 FTE (Full time) 74 41%
NTT by choice
NTT by choice 123 68%
Prefer TT position 59 32%
Category of NTT faculty
Specialist, Expert or Professional 73 40%
Aspiring Academic 61 33%
Free-Lancer 36 20%
Career Ender 12 7%
Instrument
A three part survey was used to conduct this study. The first part of the survey
asked demographic and professional questions of the NTT faculty. Each participant was

61
also asked to self-select one of the four categories of NTT faculty that best fits them. The
second part of the survey consists of a 34 item Organizational Sense of Belonging (OSB)
survey developed by Somers (1999) and used by Merriman (2010). The 34 questions
collectively determine the OSB of NTT faculty at MSU. The original survey of Merriman
(2010) had 38 questions but because there are questions that overlapped with the measure
“supervision” on the job satisfaction survey, four questions were removed to shorten the
survey. The third part of the survey is a 36 item Job Satisfaction Survey (JSS), which
was developed by Spector (1997). The study’s research questions and the portion of the
NTT survey instrument used to answer each question are summarized in Table 3.4. The
entire survey is included in Appendix A.
Table 3.4 Survey Sections Used to Answer Research Questions
________________________________________________________________________
Research Question Instrument___
1. What are the different categories as defined Gappa and Leslie (1993) Self-Report in
that comprise the instructional NTT faculty at MSU? NTT survey
2. What is the difference across the NTT faculty categories JSS items in
and their job satisfaction? NTT survey
3. What is the difference across the NTT faculty categories OSB items in
and their organizational sense of belonging? NTT survey
4. What is the association between job satisfaction and organizational JSS items and
sense of belonging for NTT faculty at MSU? OSB items in
NTT survey
Measurement of Organizational Sense of Belonging
Permission was received to use the survey by Merriman (2010) to determine the
organizational sense of belonging of NTT faculty at MSU. The survey determines the

62
level of their connectedness to the university (being a part of, fitting in and feeling
accepted) and their esteem (being cared about, valued and/or respected). The 34 items
are measured on a Likert scale and each question has a scale of five responses which
range from always true to never true. To determine the OSB of each type of NTT
faculty, all items on the survey were measured as a continuous measurement. When
Sommers tested the reliability of the instrument on study participants, all items had a high
correlation and reliability with a coefficient alpha of .94 (Somers, 1999).
In order to begin the analysis of this data set for OSB, the results for each
question in the OSB survey are coded as follows: 1 = never true, 2= rarely true, 3 =
sometimes true, 4 = often true and 5 = always true. It was also determined that three
questions should be recoded as reverse values (1=5, 2=4, 3=3, 4=2 and 5=1). In addition,
a factor analysis was done to determine if there are groups or clusters of variables that are
highly correlated so that the data can be reduced to more than one factor. The Kaiser-
Meyer-Olkin (KMO) measure of sample adequacy was .938 and Bartelett’s test of
sphericity had a significance of .000. Values of KMO close to 1.0 indicate that factor
analysis should yield distinct and reliable factors and the Bartlet’s test should be
significant. The scree plot indicated that the construct with 34 dimensions had more than
one dimension and based on the plot two factors were rotated using Varimax rotation.
The analysis which included the extraction and rotation using the principle components
method indicated that there are two factors that accounted for 49.8% of the variance.
The two interpretable factors were named Department, with a variance of 26.1%, and
Faculty with a variance of 23.6%. A new index was created with a sum of the questions

63
for each factor. A correlation matrix was run for each factor and all items were
significantly correlated at the 0.01 or 0.05 level. A Cronbach’s alpha test for reliability
on each factor indicated α = 0.858 for the Department factor and α = 0 .913 for the
Faculty factor. It is generally accepted that an alpha of 0.8 or better means the construct
is reliable and is measuring what it should be measuring (Field, 2005). Table 3.5 shows
the correlations between the factors and the questions associated with each factor. Even
though there seemed to be two OSB factors associated with this data, when regression
analyses were conducted, only a total OSB variable was used as no significant differences
emerge when separate Factor variables were analyzed.
Table 3.5 Correlations Between the Questions and OSB Factors
________________________________________________________________________
Factors
Questions Department Faculty
________________________________________________________________________
Factor 1 - Department
I like the department where I teach. .794 .049
I like the faculty I work with in my department. .774 .182
It seems that faculty I work with in my department like me. .726 .387
Faculty in my department accept me when I am just being myself. .714 .230
I feel understood by others in my department. .699 .479
I view my department as a place to experience a sense of belonging .689 .467
I feel like I fit in with other faculty in my department. .675 .427
When I approach a group of faculty coworkers, I feel welcomed. .670 .444
There are faculty I work with in my department who share my values. .670 .293
I receive support from other faculty in my department when I need it. .658 .380
Others in my department offer to help me when they sense I need it. .629 .366
I am uncomfortable attending social functions at my department .607 .366
because I feel I don’t belong.
Faculty I work with in my department see me as a competent person. .603 .298
I ask other faculty in my department for help when I need it. .582 .440
I am supportive of other faculty in my department. .581 .487
As a faculty member in my department, I feel like an outsider. .491 .010
I feel discriminated against in my department. .304 .049
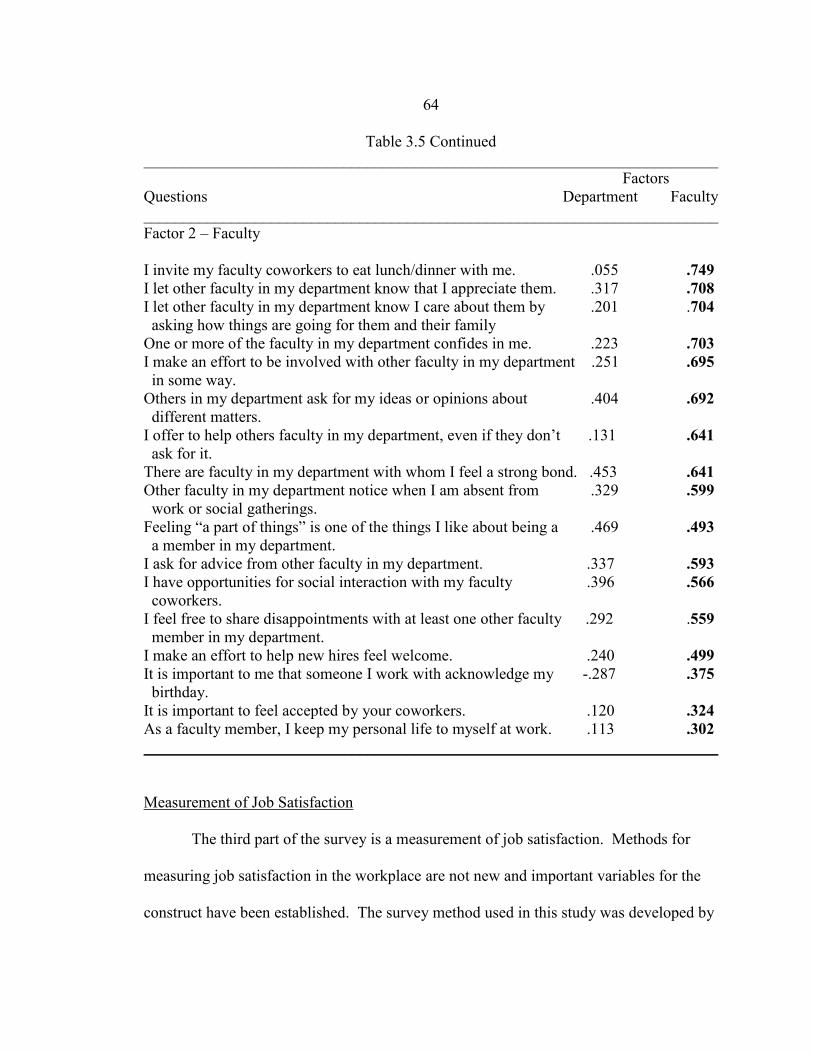
64
Table 3.5 Continued
________________________________________________________________________
Factors
Questions Department Faculty
________________________________________________________________________
Factor 2 – Faculty
I invite my faculty coworkers to eat lunch/dinner with me. .055 .749
I let other faculty in my department know that I appreciate them. .317 .708
I let other faculty in my department know I care about them by .201 .704
asking how things are going for them and their family
One or more of the faculty in my department confides in me. .223 .703
I make an effort to be involved with other faculty in my department .251 .695
in some way.
Others in my department ask for my ideas or opinions about .404 .692
different matters.
I offer to help others faculty in my department, even if they don’t .131 .641
ask for it.
There are faculty in my department with whom I feel a strong bond. .453 .641
Other faculty in my department notice when I am absent from .329 .599
work or social gatherings.
Feeling “a part of things” is one of the things I like about being a .469 .493
a member in my department.
I ask for advice from other faculty in my department. .337 .593
I have opportunities for social interaction with my faculty .396 .566
coworkers.
I feel free to share disappointments with at least one other faculty .292 .559
member in my department.
I make an effort to help new hires feel welcome. .240 .499
It is important to me that someone I work with acknowledge my -.287 .375
birthday.
It is important to feel accepted by your coworkers. .120 .324
As a faculty member, I keep my personal life to myself at work. .113 .302
________________________________________________________________________
Measurement of Job Satisfaction
The third part of the survey is a measurement of job satisfaction. Methods for
measuring job satisfaction in the workplace are not new and important variables for the
construct have been established. The survey method used in this study was developed by

65
Spector (1985) and is called the Job Satisfaction Survey (JSS). He tested the survey and
provided considerable empirical evidence that by combining certain factors which
indicate satisfaction with a job, an adequate measure of overall job satisfaction will be
obtained (Spector, 1985, 1997). Spector (1997) gave permission for people to use his
survey for noncommercial or academic purposes. The 36 item survey is included in
Appendix A.
The JSS survey is designed to test nine facets or factors of job satisfaction. It is
used in this study to determine total job satisfaction for the each of the categories of NTT
faculty. The level of satisfaction of each factor is determined by four questions. The
questions are randomly distributed throughout the survey and each question is scaled for
four different responses which range from “strongly agree” to “strongly disagree.” The
nine factors measured and the questions used to determine each factor is included below.
Appendix A contains the question which corresponds to the number listed after each
factor.
1. Pay – satisfaction with pay and pay raises (questions 1, 10, 19, 28)
2. Promotion – satisfaction with promotion opportunities (questions 2, 11, 20, 33)
3. Supervision – satisfaction with a person’s immediate supervisor (questions 3,
12, 21, 30)
4. Fringe benefits – satisfaction with any fringe benefits (questions 4, 13, 21, 29)
5. Contingent rewards – satisfaction with rewards (not necessarily monetary)
given for good performance (questions 5, 14, 23, 32)
6. Operating conditions – satisfaction with rules and procedures (questions 6, 15,
24, 31)
7. Coworkers – satisfaction with coworkers (questions 7, 16, 25, 34)

66
8. Nature of work – satisfaction with the type of work done (questions 8, 17, 27,
35)
9. Communication – satisfaction with communication within the organization
(questions 9, 18, 26, 36)
To analyze the results obtained from 182 respondents, the data was coded using
the following: 1 = Strongly Disagree, 2 = Somewhat Disagree, 3 = Somewhat Agree, 4 =
Strongly Agree. Half of the questions are reverse questions and therefore, were recoded
before analysis. The reverse responses are important because they crosscheck a response
to verify satisfaction or dissatisfaction with the factor. The total of all nine factors are
added together to produce a total job satisfaction index.
A correlational analysis was done on the data from this study and the 36 questions
from the survey. Most of the questions are significantly correlated at the .01 or .05 level.
Each factor also correlates and all but one, operating conditions, is significant at the 0.01
or 0.05 level. An index of each factor was created as a separate variable and a correlation
matrix indicates that all nine factors as well as total job satisfaction are significantly
correlated at a 0.01 to 0.05 level. A factor analysis of the survey data revealed a
minimum of eight factors within the construct of job satisfaction, supporting the original
design of the survey.
To test the reliability of the survey questions, a coefficient alpha test was
conducted to insure the four questions in each factor correlated with each other. Table
3.6 lists the alpha values for the factors. In addition, the reliability tests conducted by
Spector (1985) are also presented. The reliability of the instrument is high if above .80
and at least marginally acceptable if above .60 (Gliner & Morgan, 2000). Spector (1985)

67
tested the validity of the instrument with other subscales from other surveys. All the
factors added together measure the total job satisfaction of each respondent.
Table 3.6 Internal Reliability of Job Satisfaction Survey
________________________________________________________________________
Factor Coefficient Alpha, Coefficient Alpha,
NTT Survey Spector (1996)
________________________________________________________________________
Pay 0.78 0.75
Promotion 0.76 0.73
Supervision 0.88 0.82
Fringe Benefits 0.83 0.73
Contingent rewards 0.78 0.76
Operating procedures 0.55 0.62
Coworkers 0.73 0.60
Nature of work 0.72 0.78
Communication 0.66 0.71
Total job satisfaction 0.92 0.91
Sample Size 182 2,870
________________________________________________________________________
Data Analysis
External Validity
Every attempt was made to obtain external validity by identifying all the NTT
faculty instructors who taught in the fall of 2012 and contacting as many as possible to
complete the confidential survey. A high response rate provides a representative sample
68
of the categories of NTT faculty. Typically surveys have a response rate of 29-30% (Sax,
Gilmartin, & Bryant, 2003) and the response of NTT faculty to this survey was 48.8%.
Therefore, some of the external validity of the study was eliminated. However, since this
survey was only sent to NTT faculty at MSU, the sample may or may not represent NTT
faculty at other postsecondary institutions. A higher than usual response rate to
electronic surveys also decreases external bias which may be present if only those NTT
faculty members who are happy with their positions answer the survey.
The response to the survey provided a representative sample of three of the four
categories of NTT faculty at MSU. As noted in Table 3.3, only 12 of the respondents are
from the category “Career Enders.” This may have been due in part because
approximately ten retired MSU faculty who were teaching in the fall of 2012, were not
sent the survey. The reason was that although they may have been hired to teach under a
short-term NTT faculty-type contract, they consider themselves as a TT faculty member.
Since it is important to have a minimum of 30 respondents from each category before
analysis (Gliner & Morgan, 2000), I made a decision to combine this category with the
“Free-Lancers.” The new category of Free-Lancers/Career Ender makes sense
theoretically because faculty who fit these categories only want to teach part-time to
supplement their income, pursue professional growth to keep themselves intellectually
alive, or teach after completing other careers before phasing into full time retirement
(Gappa & Leslie, 1993).

69
Prior to beginning extensive data analyses, descriptive statistics were obtained on
all four categories of NTT faculty. These statistics are included in Appendix B. Chapter
4 contains the descriptive statistics of the remaining three categories used in the study.
Internal Validity
There may be limitations of the data which would adversely affect the internal
validity of the study. One of these includes the unionization culture on campus.
Currently there is dissension among the TT faculty about the union which is now only
three years old. Although NTT faculty have not expressed the same concerns as TT
faculty concerning dues assessment, the negative attitude about unions has permeated the
departmental ranks and may affect the study results. In addition, because the union
determined that only NTT faculty who are .5 FTE and above would be represented in the
CBA, there are 30% of the respondents that may feel more disenfranchised than others.
This could affect the internal validity of the data. Ethnicity was not determined and
probably is not a variable that affects this study because MSU has a low minority student
and faculty population (85% white). The study design also did not include terminal
degree of the respondents which may have provided an alternate explanation for some of
the findings. Finally, the study is not cross sectional and therefore, determining a cause
and effect for the study variables is not possible and is another limitation of the study.
Study Variables
Table 3.7 contains a list of the independent and dependent variables. It also
provides the code, range and data type when the data was analyzed using SPSS™.

70
Several items in the survey had categories collapsed into one category because the
response rate was low.
Table 3.7 Type of Variable and Code Used to Analyze the Data
________________________________________________________________________
Independent Variables Code Range Data Type
Typologies of NTT faculty 1-4 Nominal
Specialists, experts, and professionals 1
Aspiring academics 2
Freelancers 3
Career enders 4
NTT faculty characteristics
Gender 0-1 Nominal
Male 1
Female 0
Number years teaching as NTT faculty 1-5 Ordinal
First year (first semester) 1
1-2 years 2
3-5 years 3
5-10 years 4
>10 years 5
Average number of courses taught/semester 1-4
Ordinal
One course 1
Two courses 2
Three courses 3
Four or more courses 4
Average level of employment (FTE) 1-5
Ordinal
.25 FTE or less 1
.25 -.50 FTE 2
.50 - .75 FTE 3
.75 – 1.0 FTE 4
1.0 FTE (Full time) 5
NTT by choice
NTT by choice 0 0-1
Nominal
Prefer TT position 1
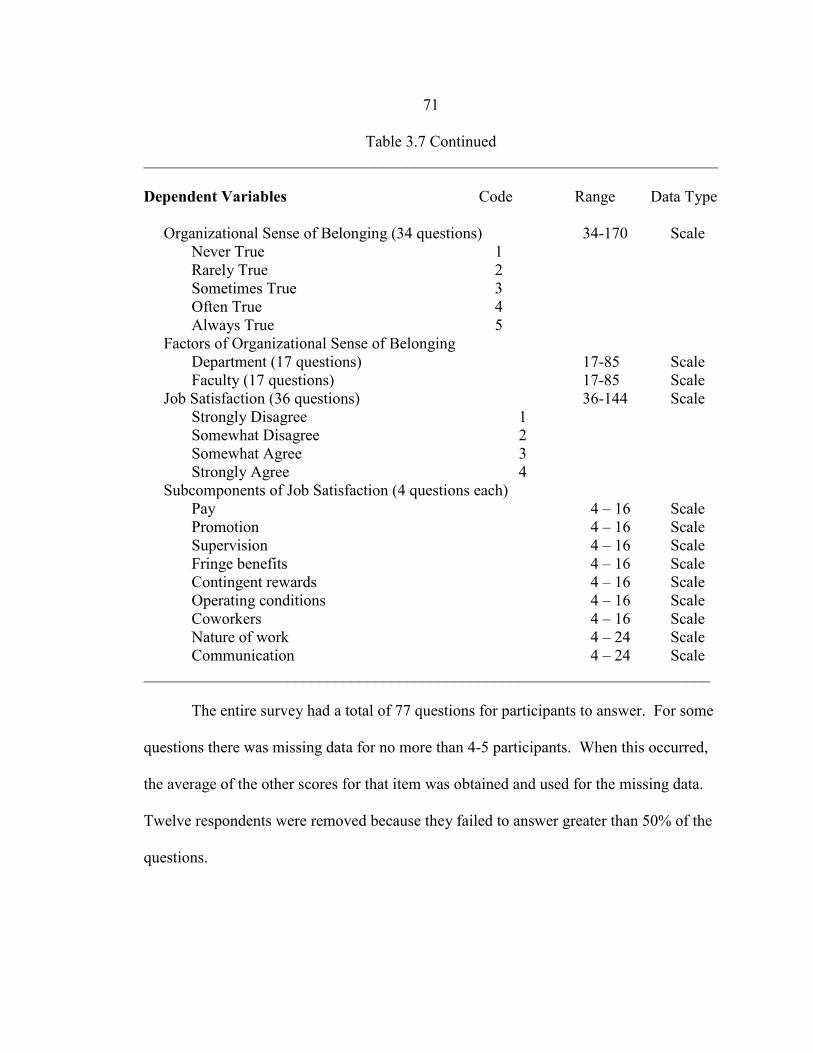
71
Table 3.7 Continued
________________________________________________________________________
Dependent Variables Code Range Data Type
Organizational Sense of Belonging (34 questions) 34-170 Scale
Never True 1
Rarely True 2
Sometimes True 3
Often True 4
Always True 5
Factors of Organizational Sense of Belonging
Department (17 questions) 17-85 Scale
Faculty (17 questions) 17-85 Scale
Job Satisfaction (36 questions) 36-144 Scale
Strongly Disagree 1
Somewhat Disagree 2
Somewhat Agree 3
Strongly Agree 4
Subcomponents of Job Satisfaction (4 questions each)
Pay 4 – 16 Scale
Promotion 4 – 16 Scale
Supervision 4 – 16 Scale
Fringe benefits 4 – 16 Scale
Contingent rewards 4 – 16 Scale
Operating conditions 4 – 16 Scale
Coworkers 4 – 16 Scale
Nature of work 4 – 24 Scale
Communication 4 – 24 Scale
_______________________________________________________________________
The entire survey had a total of 77 questions for participants to answer. For some
questions there was missing data for no more than 4-5 participants. When this occurred,
the average of the other scores for that item was obtained and used for the missing data.
Twelve respondents were removed because they failed to answer greater than 50% of the
questions.

72
Summary
This quantitative study investigated differences in NTT faculty in their job
satisfaction and sense of belonging to their department and MSU. After determining who
the participants were, a survey was sent to each NTT faculty member in the fall of 2012.
The methods used to answer the questions of this study included a 36 item job
satisfaction survey, a 34 item belongingness survey and background information about
the different categories of NTT faculty as determined by Gappa and Leslie (1993). The
survey was distributed electronically using email and Survey Monkey™. It was answered
by 182 of 397 NTT faculty members who received the survey for a 48.8% response rate.
The data was analyzed and the instrument was determined to be reliable. The survey
instrument was then used to determine the relationship between job satisfaction and
organizational sense of belonging in different types of NTT faculty at MSU. The study
had adequate external validity and some limitations which may affect internal validity.
The information gained from the study may provide insight into the conditions under
which NTT faculty work and a perspective of the environment in which they work.
73
CHAPTER 4
RESULTS
Introduction
This chapter contains the results of an investigation into the organizational sense
of belonging (OSB) and job satisfaction (JS) of NTT instructional faculty at Montana
State University. In this part of the dissertation, I will provide the results of a survey of
OSB and JS sent to all identified NTT faculty who were teaching in the fall of 2012. The
first part of the chapter contains the quantitative descriptive analysis of the NTT faculty
including some demographic information. Following this will be the results of an
Analysis of Variance (ANOVA) of each category of NTT faculty and their OSB and JS.
The final section will include the results of multiple linear regressions of OSB and JS for
the NTT faculty at MSU.
Descriptive Data Results
A summary of the descriptive statistics obtained during the analysis of the data is
provided in Table 4.1. It includes the frequency data for the background characteristics
for each category of NTT faculty which includes gender, NTT preference, academic
college, number of classes taught each semester, length of time teaching, and level of
employment (part-time to full-time). It also provides the means and standard deviations
for the dependent measures OSB and JS.

74
Table 4.1 Descriptive Statistics of NTT Faculty Categories
______________________________________________________________________ NTT Faculty Categories
____________________________________________________________________________ Variable Specialist, Aspiring Freelancers/ Total
Experts (%) Academics (%) Career Enders (%) (%)
____________________________________________________________________________
Study Sample N (%) 73 (40%) 61 (33%) 48 (27%) 182
Gender
Female 47 (42%) 35 (31%) 31 (27%) 113 (62%)
Male 26 (38%) 26 (38%) 17 (24%) 69 (38%)
NTT by choice
NTT by choice 55 (45%) 36 (29%) 32 (26%) 123 (68%)
Prefer TT position 18 (31%) 25 (42%) 16 (27%) 59 (32%)
Academic College
Letters and Science 21 (36%) 17 (29%) 20 (35%) 58 (32%)
Arts and Architecture 8 (35%) 10 (43%) 5 (22%) 23 (12%)
EHHD 8 (32%) 12 (48%) 5 (20%) 25 (14%)
Nursing 9 (36%) 9 (36%) 6 (24%) 24 (13%)
Other Colleges 27 (52%) 13 (25%) 12 (23%) 52 (29%)
Average number of courses
taught each semester
One course 25 (34%) 20 (33%) 14 (29%) 59 (32%)
Two courses 21 (29%) 16 (26%) 15 (31%) 52 (29%)
Three courses 19 (26%) 11 (18%) 9 (19%) 39 (21%)
Four or more courses 8 (11%) 14 (23%) 10 (21%) 32 (18%)
Number of years teaching
First year (first semester) 9 (13%) 6 (10%) 5 (11%) 20 (11%)
1-2 years 15 (20%) 6 (10%) 6 (12%) 27 (15%)
3-5 years 18 (25%) 14 (23%) 10 (21%) 42 (23%)
5-10 years 16 (22%) 20 (33%) 10 (21%) 46 (25%)
Greater than 10 years 15 (22%) 15 (24%) 17 (35%) 47 (26%)
Level of employment (FTE)
.25 FTE or less 10 (14%) 4 (6%) 7 (15%) 21 (11%)
.25 - .50 FTE 19 (26%) 9 (15%) 6 (12%) 34 (19%)
.50 - .75 FTE 14 (19%) 9 (15%) 8 (17%) 31 (17%)
.75 – 1.0 FTE 10 (14%) 6 (10%) 6 (12%) 22 (12%)
1.0 FTE 20 (27%) 33 (54%) 21 (44%) 74 (41%)
Sample
Range Mean (SD) Mean (SD)
OSB 1-5a 3.61 (0.56) 3.76 (0.58) 3.62 (0.77) 3.67 (0.63)
JS 1-4b 2.88 (0.39) 2.79 (0.40) 2.64 (0.44) 2.79 (0.42)
_______________________________________________________________________ a response range (1 = never true, 2 = rarely true, 3 = sometimes true, 4 = often true, 5 = always true)
b response range (1 = strongly disagree, 2 = somewhat disagree, 3 = somewhat agree, 4 = strongly agree)

75
NTT Faculty Characteristics
According to the university’s website, in the fall of 2012, 50.3% of the
instructional faculty at MSU are classified as being on the non-tenure-track. After
sending the electronic survey to all identifiable NTT faculty in early November, along
with a follow-up reminder two weeks later, a total of 194 responded (48.5 %). As
mentioned in chapter 3, I created a combined category of Freelancers/Career Enders
because there was a small number of participants who identified themselves as Career
Enders (N = 12). Therefore, the results were analyzed using three categories of NTT
faculty who teach. The largest group was the Specialists, Experts and Professionals
(hired for their expertise) with 40% of the survey respondents (N=73). This was followed
by the Aspiring Academics (want a tenure-track position) as 33% of the respondents
indentified themselves with this group (N=61). The last combination category, the
Freelancers (have multiple part-time jobs) and the Career Enders (retired or in transition
to retirement), comprise a total of 27% of the total respondents (N=48).
Almost two-thirds of the NTT faculty who answered the survey were female
(62%) which is consistent with the literature (Baldwin & Chronsiter, 2001; Cross &
Goldenberg, 2009). The category with the nearly equal ratio of females to males is the
Aspiring Academics, with 57% of this group being female. The other two categories had
about a 2:1 ratio of females to males. The Specialists, Experts and Professionals had
42% of all the females who answered the survey.
One of the questions in the survey is “Are you in a NTT (adjunct) position by
choice or do you desire a tenure-track position?” Over two thirds or 68% of the
76
respondents indicated they preferred a NTT faculty position while 32% replied that a TT
position was preferable. This two- to-one ratio is consistent in two of the three
categories. Of the 55 respondents who preferred a TT position, the Aspiring Academics
category had the highest percentage (41%) who preferred a TT position (N=25) and
appeared not to want a NTT contract.
The data about their length of time teaching indicates that NTT faculty at MSU
are experienced instructors with 26% having taught for greater than 10 years (Table 3.3).
When categories were combined, a total of 74% have taught at least three years or longer.
Only 11% (N=20) indicated that the fall of 2012 was their first time teaching. The
percentages in each category were somewhat similar except that more Specialists,
Experts and Professionals have taught less than two years as compared to the other two
categories – Aspiring Academics and Freelancers/Career Enders (Table 4.1). This
indicates that this group of faculty has more members with less teaching experience.
Another characteristic asked in this survey is the average number of courses each
NTT faculty teaches each semester. In this sample there are 59 participants or 32% of the
NTT faculty who teach only one class per semester. However, 32 or 18% teach four or
more courses and 39 or 21% teach three classes per semester (Table 4.1). Therefore, a
total of 39% of the respondents teach three or more classes a semester (N=71). Most
Specialists, Experts and Professionals teach only one or two classes each semester which
is also indicative of their careers elsewhere. The Aspiring Academics had more
instructors teaching 4 or more classes which also speaks to their full-time employment.
77
The literature frequently categorizes NTT faculty as either part time or full time.
In this survey, I asked about their level of employment (full-time equivalent) for two
reasons. First, as a member of an organization increases their level of employment, they
feel more a part of the unit and derive satisfaction from being employed. Second, the
NTT faculty union at MSU will only recognize and represent a NTT faculty member who
is employed at least .5 FTE and above. This leaves all NTT faculty employed less than
.50 FTE not represented for raises or other benefits and potentially less satisfied with
their employment. The results from this survey show that 55 NTT faculty (30%) were
employed less than .50 FTE. In addition, there are large differences in the level of
appointment between the Specialists, Experts and Professionals who teach fewer number
of courses and are employed less that .5 FTE (40%) and the 64% of the Aspiring
Academics who are employed from .75 to 1.0 FTE and may teach 3 to 4 or more courses
per semester. This corresponds to the literature and a description of these categories.
Analysis of the data from this sample also shows that 74 or 41% of all NTT faculty
members at MSU were employed as a full time faculty. This study did not, however,
determine if their level of employment (full-time) was entirely instructional or involved
other aspects of their job such as advising, service, or administering programs.
The results from the distribution of the faculty by academic college indicate that
most of the respondents (32%) were from the College of Letters and Science (CLS). This
is not surprising given that CLS consists of many departments and has faculty members
who teach most of the general core curriculum on campus (liberal arts and science
courses). In CLS the number in each NTT group was evenly distributed between the

78
three categories. Table 4.1 shows the frequency of the respondents in each of the colleges
on campus and the frequency of each category of NTT faculty in each college. Because
of the low number of respondents from some colleges, colleges were combined to make
an “Other” category which consists of colleges such as Agriculture, Business,
Engineering and other units (Table 3.2). The distribution of NTT faculty across the
colleges is presented to demonstrate that the study contains a cross-section of subjects
across the main colleges represented at MSU. However, in all further analyses I omit the
Academic College variable because of confidentiality concerns. Specifically, it is
possible that certain individuals could be identified given that some departments employ
only a few NTT faculty and some colleges contain only a few departments.
Dependent Variables
The dependent variables for the study are the measures of OSB and JS. The
descriptive statistics in Table 4.1 for OSB indicate that Specialists, Experts and
Professionals have comparable means (M=3.61) to the Freelancers/Career Enders
(M=3.62). The means were determined from a scale of 1-5, with 1= never true, 2 = rarely
true, 3 = sometimes true, 4 = often true and 5 = always true. To determine OSB, 34
questions asked a variety of questions about a person’s sense of belonging to their
department and university (See Appendix A). The Aspiring Academics have a mean of
3.76 for OSB which is slightly higher than the other two groups. The means tilt toward a
positive sense of belonging for the total NTT faculty respondents.
The JS measure in each category indicates that a mean for Freelancers/Career
Enders was 2.64 which is less than the mean of 2.88 for the Specialists, Experts and

79
Professionals (Table 4.1). The entire sample mean is 2.79 which is the same as the mean
for the Aspiring Academics. The means were determined from a scale of 1- 4 with 1 =
strongly disagree, 2 = somewhat disagree, 3 = somewhat agree, and 4 = strongly agree.
The survey has 36 questions that ask a variety of questions about a person’s job
satisfaction (See Appendix A).
Analyses
Analysis of Variance of Variables
A one-way analysis of variance (ANOVA) was conducted to evaluate the
relationship between the NTT faculty typology and organizational sense of belonging.
This allowed me to determine statistical differences between the types of NTT faculty
and their feelings of belonging to their department and university. The independent
variables, the NTT faculty typology, included three types of NTT faculty: Specialists,
Experts or Professionals; Aspiring Academics; and Freelancers/Career Enders. The
dependent variable was the total OSB score from 34 questions in the survey. The
ANOVA was not significant, F(2, 179) = .955, p = .387. In addition, ANOVA analyses
were run on each of the two factors in OSB that were determined by running a factor
analysis. The ANOVA for Factor 1 was not significant, F(2,179) = .597, p = .551 and the
ANOVA for Factor 2 was not significant, F(2,179) = 2.436, p = .090. Tests for
homogeneity of variance were performed and the variances were roughly equal indicating
homogeneity of variance was not violated. In summary, these ANOVA results suggest

80
that there is not a statistical difference among each category of NTT faculty and their
sense of belonging to their department and MSU.
A one-way ANOVA was conducted to evaluate the relationship between the
NTT faculty typology and job satisfaction. This was to determine if there are statistical
differences across the types of NTT faculty and their satisfaction with their jobs. The
independent variables are the three categories of NTT faculty - Specialists, Experts and
Professionals; Aspiring Academics; and Freelancers/Career Enders. The dependent
variable is the total JS score from 36 questions in the survey. Total JS was obtained from
the summation of 36 questions in the survey. The questions provide answers to the nine
different factors which contribute to total JS (Spector, 1997). The ANOVA for total JS is
significant, F(2, 179) = 4.621, p = .011. This suggests that there is a statistical difference
in the mean levels of JS across the NTT faculty categories. The strength of the
relationship between JS and the three types of faculty as assessed by η2 is small to
medium. When post hoc tests were done, the significant difference in NTT faculty types
is between the Freelancers/Career Enders (M = 2.64) and the Specialists, Experts and
Professionals (M = 2.88) and their total JS (p =.008). In other words, the
Freelancers/Career Enders category has significantly less job satisfaction than the
Specialists, Experts and Professionals group.
Since job satisfaction has nine factors that influence total job satisfaction, each
was analyzed to determine the group differences for each factor of job satisfaction. This
allowed me to understand if there were group differences for individual factors of job
satisfaction. Table 4.2 contains the ANOVA results of each factor.

81
Table 4.2 Analysis of Variance of Job Satisfaction
_________________________________________________________________
Factor df F Sig.
_________________________________________________________________
JS1 – Pay 2,179 2.13 .12
JS2 – Promotion 2,179 2.67 .07
JS3 – Supervision 2,179 1.91 .15
JS4 – Fringe Benefits 2, 179 1.50 .23
JS5 – Contingent Rewards 2, 179 2.45 .09
JS6 – Operating Procedures 2, 179 4.03 .02*
JS7 – Coworkers 2, 179 3.22 .04*
JS8 – Nature of Work 2, 179 2.41 .09
JS9 – Communication 2, 179 2.45 .09
Total Job Satisfaction 2, 179 4.62 .01**
_________________________________________________________________
*p < .05. **p < .01. ***p < .001.
Of the nine ANOVA analyses, two of the JS factors were significant – Coworkers
and Operating Procedures. The JS6 Factor called Coworkers has a one-way ANOVA of
F(2,179) = 3.222, p = .042. The second factor, JS7 or Operating Procedures, had a
significant ANOVA of F(2, 179) = 4.027, p = .019. The significance occurred between
the same two types of NTT faculty as was determined in total job satisfaction. The Free-
Lancers/Career Enders have significantly less job satisfaction in these factors (JS6 M =
3.33, JS7 M = 2.60) than the Specialists, Experts or Professionals group (JS6 M = 3.57,
JS7 M =2.86). The other seven factors did not show significance at the p < .05 level but
four of these factors showed significance at the p < .10 level which is marginally
significant.

82
Regression Analysis of Variables
A series of multiple regression equations were estimated to examine the
associations among NTT faculty categories and the outcome measures of OSB and JS.
Several of these equations include controls for a variety of demographic characteristics.
The demographic characteristics included in the regression models are gender, numbers
of years teaching, average number of classes taught, and level of employment (part-time
to full-time). Before running the regression analysis a correlation analysis was performed
to determine the association among all the predictor variables including OSB and JS. The
correlation matrix helped determine if multicollinearity is present among the independent
variables in the regression equations. Table 4.3 shows the results of the analysis.
Table 4.3 Correlation Matrix of Study Variables
_____________________________________________________________________
# Courses #Years Level Gender OSB JS
Taught Taught FTE
_____________________________________________________________________
Number Courses Taught 1
Number Years Taught .214** 1
Level of Employment (FTE) .306** .314** 1
Gender -.024 .063 -.096 1
OSB, Total .070 .103 .173* -.038 1
JS, Total -.051 -.085 .020 .016 .608** 1
____________________________________________________________________
* p < .05. ** p < .01. *** p < .001.
The results of the bivariate analysis show correlations of -.024 to .314 among the
independent variables. This does not reach the threshold of .60 which the literature
suggests may indicate the presence of multicollinearity in regression equations (Field,
2005). However, I still wanted to further investigate any possibility of multicollinearity

83
by conducting variance inflation factors (VIF) and tolerance testing. All indicated that
multicollinearity did not exist as the average VIF was 1.1, which is well below the VIF of
10 that is indicative of multicollinearity (Field, 2005). In addition, all tolerances are .82
to .98, which is well above the .20 level which is a cause for concern for multicollinearity
of the variables. The dependent variables are correlated at .608, but this does not indicate
multicollinearity because both dependent variables are not in the regression equation
simultaneously.
The previously created variables for the three different NTT faculty categories
were analyzed for their association with OSB and JS. The three categorical variables are:
(a) Specialist, Experts and Professionals, (b) Aspiring Academics and (c) Freelancers/
Career Enders. In the regression analyses, the reference group was the Specialist, Experts
and Professionals because they are the modal category.
The first multiple regression analysis was used to determine the association of
each category of NTT instructional faculty and OSB. In conducting the regression
analyses, a model-building strategy was used. Model 1 is the baseline association of
OSB on each category of NTT faculty. Model 2 includes the baseline association of OSB
on each category of NTT faculty plus the NTT faculty background characteristics as
independent variables. The four variables were gender, average number of courses taught
each semester, years of teaching, and level of employment (FTE). In Model 3, the
measure of total JS is added to the regression equation to control for the different levels
of satisfaction across the categories of NTT faculty. A summary of the model building
steps is below.

84
Model 1: Y = NTT faculty category
Model 2: Y = Model 1 + background characteristics of NTT faculty
Model 3: Y = Model 2 + job satisfaction
A second regression analysis was performed exactly as above except in Model 3 the two
most significant factors in job satisfaction, operating procedures and coworkers, are
added as variables instead of total JS.
The third multiple regression analysis determined the association between each
category of NTT instructional faculty and JS. It followed a similar model building
strategy to conduct the regression analyses. Model 1 is the baseline association of JS on
each category. Model 2 includes the baseline association of JS on each category plus the
NTT faculty background characteristics as variables. The four variables were gender,
average number of courses taught each semester, years of teaching, and level of
employment (FTE). In Model 3, the measure of OSB was added to the regression
equation to control for the different levels of sense of belonging across the NTT faculty
categories. A summary of the model building steps is below.
Model 1: Y = NTT faculty category
Model 2: Y = Model 1 + background characteristics of NTT faculty
Model 3: Y = Model 2 + OSB
Organizational Sense of Belonging and
Non-Tenure Track Faculty Typology
This section describes the results from the regression analysis of OSB on the NTT
faculty typology. The results of the three models which include background

85
characteristics and the variable job satisfaction are provided in Table 4.4. The results of
Model 1 present an evaluation of how well OSB is predicted by each of the NTT faculty
categories. All three independent variables or categories do not explain a significant
amount of OSB variability, R2 = .011, F(2, 179) = .955, p = .387. They only account for
1.1% of the variance in the model. Model 2 asks the question “How well is the OSB
predicted by each of the NTT faculty categories while controlling for background
characteristics?” The four background characteristics are gender, numbers of courses
taught, length of time teaching and level of employment (FTE). For Model 2, R2 = .038,
F(6,175) = 1.158, p = .331 and it was still not significant after adding the background
characteristics to the regression equation. The model only accounts for 3.8% of the
variance. The regression parameters from Models 1 and 2 show that there is no statistical
significant association between NTT faculty type and levels of OSB after entering
controls for their background characteristics.
In Model 3, however, there was statistical significance as R2 = .430, F(7,174) =
18.721, p = .000. A statistically significant F-value indicates that, as a group, the
variables in Model 3 account for a significant variation in levels of OSB. Together, these
variables explain about 43% of the variation in OSB levels across the sample. When
examining the coefficients for NTT faculty types across the three models, we see that JS
has been acting as a suppressor variable in Models 1 and 2. Specifically, given the strong
association between JS and OSB (see Table 4.3), the omission of the JS variable in the
regression equation in Models 1 and 2 is suppressing the empirical associations between
NTT faculty type and OSB.
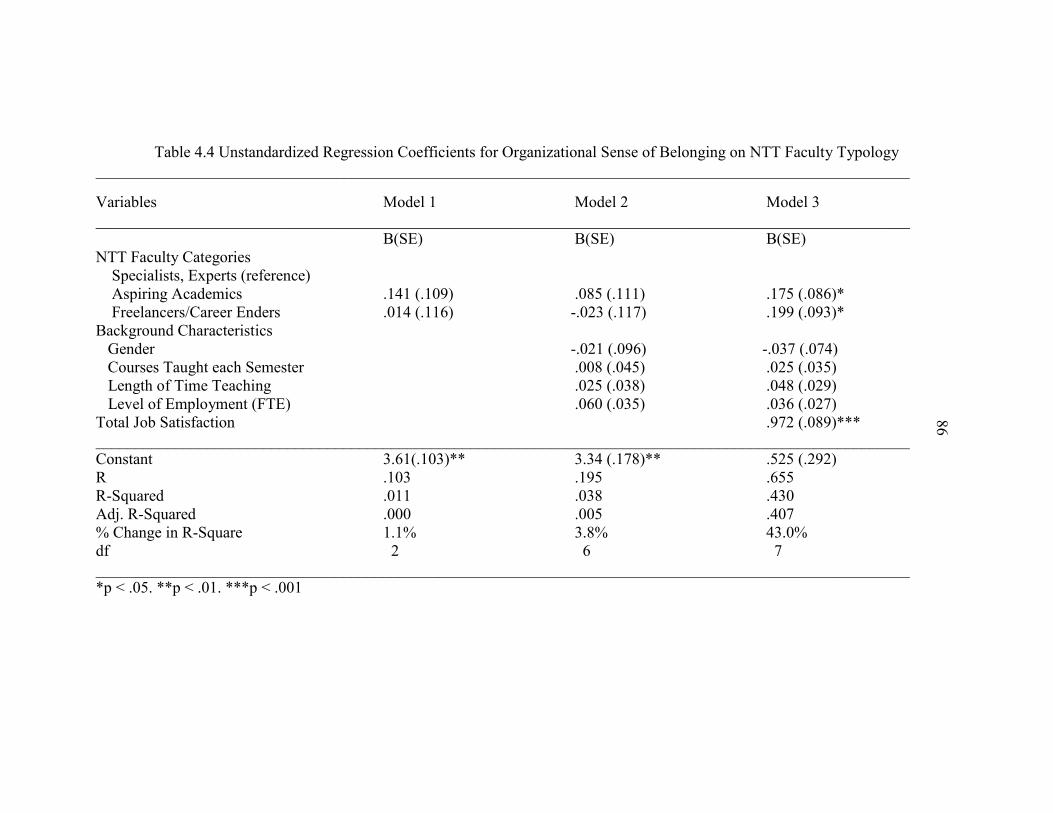
Table 4.4 Unstandardized Regression Coefficients for Organizational Sense of Belonging on NTT Faculty Typology
______________________________________________________________________________________________________
Variables Model 1 Model 2 Model 3
______________________________________________________________________________________________________
B(SE) B(SE) B(SE)
NTT Faculty Categories
Specialists, Experts (reference)
Aspiring Academics .141 (.109) .085 (.111) .175 (.086)*
Freelancers/Career Enders .014 (.116) -.023 (.117) .199 (.093)*
Background Characteristics
Gender -.021 (.096) -.037 (.074)
Courses Taught each Semester .008 (.045) .025 (.035)
Length of Time Teaching .025 (.038) .048 (.029)
Level of Employment (FTE) .060 (.035) .036 (.027)
Total Job Satisfaction .972 (.089)***
______________________________________________________________________________________________________
Constant 3.61(.103)** 3.34 (.178)** .525 (.292)
R .103 .195 .655
R-Squared .011 .038 .430
Adj. R-Squared .000 .005 .407
% Change in R-Square 1.1% 3.8% 43.0%
df 2 6 7
______________________________________________________________________________________________________
*p < .05. **p < .01. ***p < .001
86

87
When the JS variable was added to the regression equation in Model 3, the
association between NTT faculty type and OSB was allowed to emerge statistically. The
two faculty types, Aspiring Academics and Freelancers/Career Enders when compared to
the reference group Specialists, Experts and Professionals emerged as significant
predictors of OSB. The Aspiring Academics had a statistical significance of p = .045 and
Freelancers/Career Enders had a statistical significance of p = .034 meaning there was
less than 5% chance that the results occurred by chance. The unstandardized coefficient
of .175 for the Aspiring Academics (p = .045) means that their average OSB score is .175
points higher than the average scores for the Specialists, Experts and Professionals. The
same is true for the Freelancers/Career Enders who have an unstandardized coefficient of
.199 (p = .034). This means that their average OSB score is .199 points higher than the
average score for the reference group, Specialists, Experts and Professionals. The
coefficient for the JS variable of .972 (p = .000) means that a one-unit increase in JS is
associated with a .972 increase in OSB or the more satisfied you are the more your sense
of belonging.
Underlying Predictors of OSB
and NTT Faculty Typology
During the ANOVA analysis of the nine factors which comprise total job
satisfaction, it was determined that two factors emerged as statistically significant factors
in the measurement of total job satisfaction. These factors were Operating Procedures
and Coworkers. This section describes the results from a regression analysis of OSB on

88
the three different types of NTT instructional faculty, when controlling for background
characteristics and the two JS factors.
The results of the three models which include background characteristics and the
two JS factor variables are provided in Table 4.5. The results of Model 1 present an
evaluation of how well the OSB is predicted by each of the categories of NTT faculty.
All three independent variables or categories do not account for a significant amount of
OSB variability, R2 = .011, F(2, 179) = .955, p = .387. They only account for 1.1% of
the variability. Model 2 is meant to determine how well the OSB is predicted by each
type of NTT faculty while controlling for background characteristics. The four
background characteristics are gender, number of courses taught, length of time teaching
and level of employment (FTE). For Model 2, R2 = .038, F(6,175) = 1.158, p = .331 and
it is still not significant after adding the background characteristics to the regression
equation. The model only accounts for 3.8% of the variance. In Model’s 1 and 2, there is
no statistical significant difference among the three categories of NTT faculty and their
OSB even when controlling for background characteristics.

Table 4.5 Additional Unstandardized Regression Coefficients for OSB on NTT Faculty Typology
___________________________________________________________________________________________________
Variables Model 1 Model 2 Model 3
___________________________________________________________________________________________________
B (SE) B (SE) B (SE)
NTT Faculty Categories
Specialists, Experts (reference)
Aspiring Academics .141 (.109) .085 (.111) .208 (.082)*
Freelancers/Career Enders .014 (.116) -.023 (.117) .177 (.088)*
Background Characteristics
Gender -.021 (.096) -.098 (.071)
Courses Taught each Semester .008 (.045) .002 (.033)
Length of Time Teaching .025 (.038) .039 (.028)
Level of Employment (FTE) .060 (.035) .085 (.026)**
JS factor 6, Operating Procedures .132 (.067)*
JS factor 7, Coworkers .777 (.068)***
___________________________________________________________________________________________________
Constant 3.61(.103)*** 3.34 (.178)*** .143 (.315)
R .103 .195 .699
R-Squared .011 .038 .488
Adj. R-Squared .000 .005 .464
% Change in R-Square 1.1% 3.8% 45.0%
df 2 6 8
__________________________________________________________________________________________________
*p <.05. **p <.01. ***p < .001.
89
90
In Model 3, however, instead of controlling for total Job Satisfaction, two factors
of JS, Operating Procedures and Coworkers, were included in a regression analysis and
there was statistical significance as R2 = .488, F(8,174) = 20.606, p = .000. A statistically
significant F-value indicates that, as a group, the variables in Model 3 account for a
significant variation in levels of OSB. Together, these variables explain about 45% of the
variation in OSB levels across the sample. As with the regression results that contained
the total JS variable (Table 4.4), we once again see a suppressor effect emerge across the
regression equations. Specifically, given the strong association between JS and OSB
(Table 4.3), the omission of the two factors of JS as variables in the regression equations
in Models 1 and 2 is suppressing the empirical associations between NTT faculty
categories and OSB. When the two JS factors are added as variables to the regression
equation in Model 3, the association between NTT faculty types and OSB was allowed to
emerge statistically. Factor 6, Operating Procedures has a coefficient that is statistically
significant at p = .050 and Factor 7, Coworkers has a coefficient that is statistically
significant at p =.000. These two factors are the significant variables that influence total
job satisfaction when it is used as a control variable. The unstandardized coefficient of
.208 for the Aspiring Academics (p = .013) means that their average OSB score is .208
points higher than the average score for the Specialists, Experts and Professionals. The
same is true for the Freelancers/Career Enders who have an unstandardized coefficient of
.177 (p = .046). This means that their average OSB score is .177 points higher than the
average scores for the reference group, Specialists, Experts and Professionals. The
coefficient for the JS Factor 6 is .132 (p = .05) which means that a one-unit increase in JS
91
is associated with a .132 increase in OSB. In addition, the coefficient for JS Factor 7 is
.777 (p = .000) which means that a one-unit increase in JS is associated with a .777
increase in OSB. The Aspiring Academics and Freelancers/Career Enders when
compared to the reference group Specialists, Experts and Professionals emerge as
significant predictors of OSB and there is also only a 5% chance that the results occur by
chance. Therefore, when compared to the Specialists, Experts and Professionals, these
two categories are more likely to have a higher OSB when controlling for background
characteristics and the JS factors, Operating Procedures and Coworkers.
During the regression analyses with the two JS factors, a background
characteristic emerged that was not previously significant in the previous Model 3. This
characteristic is the level of employment of NTT Faculty. The characteristic measures
less than 25% employment to full time or 100% employment. The results indicate that as
your level of employment increases from part time to full time, your OSB increases
significantly in this model (p = .001).
Job Satisfaction and Non-Tenure Track Faculty Typology
This section describes the results from the regression analysis of JS on the of NTT
faculty typology. The results of the three models which include background
characteristics and the variable OSB are provided in Table 4.6. Model 1 indicates an
evaluation of how well JS is predicted by each of the categories of NTT faculty. All
three independent variables or categories together explain a significant amount of JS
variability, R2 = .049, F(2,179) = 4.621, p = .011. The two categories, Aspiring

92
Academics and Freelancers/Career Enders were compared to the reference group
Specialists, Experts and Professors and the Freelancers/Career Enders emerged as a
statistically significant negative predictor of JS. The unstandardized coefficient of -.230
(p < .01) for the Freelancers/Career Enders means that their average JS score is .230
points lower than that for the Specialists, Experts and Professionals group. There was no
statistical association at the p < .05 level for the Aspiring Academics as the
unstandardized coefficient is -.087.
Model 2 asks the question “How well is JS predicted by each of the NTT faculty
categories while controlling for background characteristics?” The four background
characteristics were gender, number of courses taught, length of time teaching and level
of employment (FTE). In Model 2, R2 = .059, F(6, 175) = 1.836, p = .095 and the
inclusion of the background characteristics resulted in a poorer model fit. This was due
to the increase in degrees of freedom between Models 1 and 2 and lack of a statistically
significant coefficient for the background variables. As in Model 1, when the two
categories, Aspiring Academics and Freelancers/Career Enders were compared to the
reference group Specialists, Experts and Professionals, the Freelancers/Career Enders
emerged as a statistically significant negative predictor of JS. The unstandardized
coefficient of -.228 (p < .01) for the Freelancers/Career Enders means that their average
JS score is .228 points lower than the average scores for the Specialists, Experts and
Professionals. There is no statistical association at p < .05 level for the Aspiring
Academics as the unstandardized coefficient is -.093.
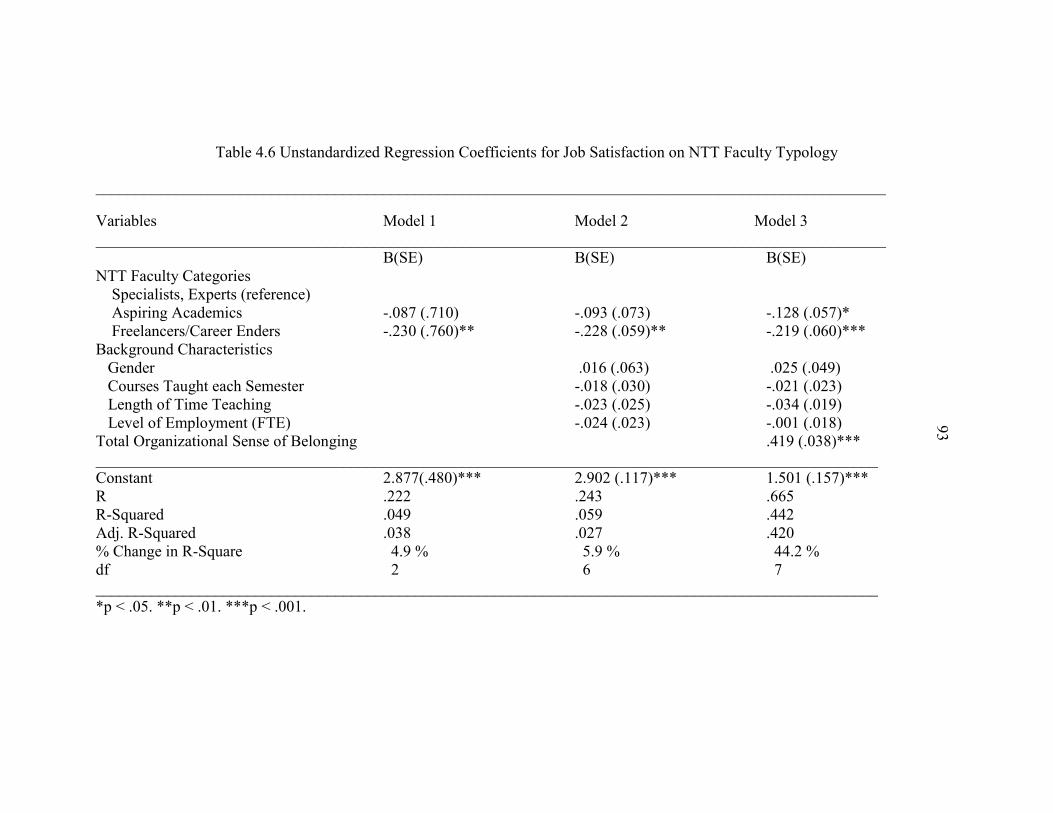
Table 4.6 Unstandardized Regression Coefficients for Job Satisfaction on NTT Faculty Typology
___________________________________________________________________________________________________
Variables Model 1 Model 2 Model 3
___________________________________________________________________________________________________
B(SE) B(SE) B(SE)
NTT Faculty Categories
Specialists, Experts (reference)
Aspiring Academics -.087 (.710) -.093 (.073) -.128 (.057)*
Freelancers/Career Enders -.230 (.760)** -.228 (.059)** -.219 (.060)***
Background Characteristics
Gender .016 (.063) .025 (.049)
Courses Taught each Semester -.018 (.030) -.021 (.023)
Length of Time Teaching -.023 (.025) -.034 (.019)
Level of Employment (FTE) -.024 (.023) -.001 (.018)
Total Organizational Sense of Belonging .419 (.038)***
__________________________________________________________________________________________________
Constant 2.877(.480)*** 2.902 (.117)*** 1.501 (.157)***
R .222 .243 .665
R-Squared .049 .059 .442
Adj. R-Squared .038 .027 .420
% Change in R-Square 4.9 % 5.9 % 44.2 %
df 2 6 7
__________________________________________________________________________________________________
*p < .05. **p < .01. ***p < .001.
93

94
In Model 3, however, there is a statistical significance as R2 = .442, F(7, 174) =
19.694, p <.001. With the inclusion of the OSB measure, the fit of the model improves
significantly as indicated by the large increase in R-square and the statistically significant
F-value. A statistically significant F-value indicates that, as a group, the variables in
Model 3 account for a significant variation in levels of JS. Together, these variables
explain 44.2% of the variation in the JS levels across the sample. When examining the
coefficients for NTT faculty types across the three models, we see the omission of the
OSB variable in Models 1 and 2 is suppressing the empirical association between the
Aspiring Academics and JS. When OSB is added to the regression equation in Model 3,
the association between Aspiring Academics and JS was allowed to emerge statistically.
When the two categories, Aspiring Academics and Freelancers/Career Enders were
compared to the reference group Specialists, Experts and Professionals, both the Aspiring
Academics and the Freelancers/Career Enders emerged as statistically significant
negative predictors of JS. The unstandardized coefficient of -.128 (p = .025) for the
Aspiring Academics means that their average JS score is .128 lower than the average
scores for the reference group, Specialists, Experts and Professionals. The same is true of
the Freelancers/Career Enders who have an unstandardized coefficient of -.219 (p =.000).
This means that their average JS score is .219 point lower than the average score for the
Specialists, Experts and Professionals. In other words, when compared to the Specialists,
Experts and Professionals, the two categories of NTT faculty are more likely to have a
lower job satisfaction in this model. The coefficient for the OSB variable of .419 means
that a one-unit increase in OSB is associated with a .419 increase in JS.

95
Summary of Results and Ancillary Analysis
The purpose of this research is to survey the different types of NTT instructional
faculty at MSU to determine their job satisfaction (JS) and organizational sense of
belonging (OSB). An electronic survey which was sent to all identified NTT faculty in
the fall of 2012 had a response rate of 48.5% for a total of 182 respondents. The
descriptive statistics for the three categories of NTT faculty revealed that the means for
all three categories were similar for OSB and all three tilted toward a positive sense of
belonging. The means for JS for the Freelancers and Career Enders were less than the
means for the Specialists, Experts and Professionals and slightly less than the means for
Aspiring Academic.
Other analyses include a one-way ANOVA analysis which is conducted to
determine the relationship between each NTT faculty category and OSB, and it was
determined there was not a significant relationship between any of the faculty types.
When a one-way ANOVA was conducted to determine the relationship between different
NTT faculty categories and JS, it was determined there were significant differences
between the Freelancer/Career Enders and the Specialists, Experts and Professionals and
their total JS (p = .008). In addition, it was determined that in two factors, Operating
Procedures and Coworkers, the Freelancers/Career Enders had significantly less job
satisfaction than the Specialists, Experts and Professionals at the p = .05 level.
The final analyses included a series of multiple regressions run on the variables
coded to determine the OSB on three different types of NTT faculty. When three

96
different models were created it was determined that the Aspiring Academics and
Freelancers/Career Enders when compared to the Specialists, Experts and Professionals,
have a statistically significant higher level OSB when background characteristics and JS
were added to the regression equation. The variables JS and background characteristics,
account for a significant amount of variance in this model (43%) and Model 3 is a
significant predictor of OSB. Multiple regression analyses were also run on the variables
coded to determine JS on three different types of NTT faculty. When three different
models were created it was determined that when the Aspiring Academics and
Freelancers/Career Enders were compared to the Specialists, Experts and Professionals,
they are a statistically significant negative predictor of JS, when their background
characteristics and OSB are added to the regression equations. By adding the variables
OSB and background characteristics, the model accounted for 44.2% of the variance and
it is a significant negative predictor of JS.
In summary, it can be said that the results show the findings are in opposite
directions. The Aspiring Academics and Freelancers/Career Enders have significantly
higher levels of organizational sense of belonging when compared to the Specialists,
Experts and Professionals but they have lower levels of job satisfaction. The emergence
of these results occurs most conclusively in the series of Model 3s throughout the
regression analyses when the suppressor role of Js and OSB are explicitly modeled.
I conducted ancillary analyses in order to tease out the potential processes
underlying the suppressor findings and the contradictory patterns of results for the
associations between NTT faculty and JS and OSB. Specifically, I conducted a

97
correlation analysis between JS and OSB separately for each NTT typology. As shown
in Table 4.7, there is little difference in the correlation coefficients between JS and OSB
across the three NTT categories. Indeed, the correlation coefficient is .615 for
Specialists, Experts, and Professionals, .573 for Aspiring Academics, and .694 for
Freelancers/Career Enders. All three of these coefficients are moderately large in size,
positive, and significant at p < .01. Therefore, it does not appear that the differential
associations between JS and OSB across the NTT faculty are the underlying processes
driving the regression findings.
Table 4.7 Pearson Correlation Analysis of JS and OSB for each NTT Typology
_____________________________________________________________________
Category N OSB JS
_____________________________________________________________________
Specialist, Expert, or Professional 73 OSB 1 .615**
JS .615** 1
Aspiring Academics 61 OSB 1 .573**
JS .573** 1
Freelancers/Career Enders 48 OSB 1 .694**
JS .694** 1
_____________________________________________________________________
*p < .05. **p < .01. ***p < .001.

98
CHAPTER 5
CONCLUSIONS
Introduction
The purpose of this study is to investigate the organizational sense of belonging
(OSB) and job satisfaction (JS) of different types of non-tenure-track (NTT) faculty at
Montana State University. More specifically, the study determines whether the different
types of NTT faculty have differences in their sense of belonging to MSU. In addition, it
determines whether there are differences in the types of NTT faculty and their level of JS
and whether these differences are associated with specific facets of their job. After
surveying the NTT faculty, the results indicate that two of the categories, the Aspiring
Academics and Freelancers/Career Enders, have a greater sense of belonging to MSU
than the Specialists, Experts and Professionals. However, these same two categories
have less job satisfaction than the Specialists, Experts and Professionals. This chapter
includes an overview of the study, methodology, and a discussion of the results. It also
includes the limitations of the study as well as recommendations for practice and future
research.
Overview of Study
The reports on NTT faculty who teach in higher education repeatedly show that
they are playing an increasingly larger role in the instruction of students in higher
education (AFT, 2010; June, 2012; NEARC, 2007; Schuster and Finkelstein, 2006).
99
Many studies have been published about who they are, the types of jobs they have and
how they are treated. The authors often categorize them as the new faculty majority
(Kezar and Sam, 2010b) and concerns about the environment in which they work have
been written about extensively. In the early 1990s, Gappa and Leslie conducted a large
study in which many interviews were conducted on NTT faculty (part-time faculty in
their study). They published their findings in a book called the Invisible Faculty (1993).
From their investigations they describe four types of NTT faculty who teach at
universities. These four categories are called (a) Specialists, Experts and
Professionals,(b) Aspiring Academics, (c) Freelancers and (d) Career enders and are
categories used in my study on NTT faculty.
Since the publication of this typology, other research studies have described their
working conditions and characteristics which make them uniquely different than tenure-
track (TT) faculty. In chapter 2, I trace their historical increase in the university system
which is subsequently followed with a portrait of who they are and the nature of their
work. Although there is much rhetoric in many publications about NTT faculty in
general, only a few studies focus on psycho-social issues surrounding this group of
faculty. One such issue is their sense of belonging to the university (Quinn, 2006;
Merriman, 2010). In addition, although many studies have been done on JS in TT
faculty, few have studied JS in the NTT faculty. Those that do study JS in NTT faculty,
do not account for their differences when they are studied (Umbach, 2007).
This study is designed to determine, through an electronic survey, the JS and OSB
of different types of NTT faculty at Montana State University. The NTT faculty were

100
asked to self-select themselves as one of the four categories determined by Gappa and
Leslie (1997). The method for the study and research design which asks four different
questions are explained in chapter 3. Upon completion of the survey, the data was
analyzed to determine if significant differences in OSB or JS exist in the four categories
of NTT faculty. Chapter 4 explains the results of the descriptive statistics, analysis of
variance, (ANOVA) and multiple regression analyses of the respondents who answered
the survey. The following sections will provide a brief discussion of the method used in
the study and a discussion of the results.
Methodology
The study was conducted using a confidential electronic survey which has three
parts. The first part asks demographic questions that were determined to be important
characteristics of NTT faculty for this study. The second part of the survey is a 34
question survey on OSB used by Merriman (2010) and the third part consists of 36
questions from a job satisfaction survey (JSS) developed by Spector (1997). The JSS
contains nine factors that are important in determining total JS. The OSB survey uses a
summation of all the questions to determine OSB. The large three part survey was sent to
397 NTT faculty who taught in the fall of 2012 and data from 182 people who responded
was used in the study.
The data was analyzed using SPSS™ software. Because the number of
respondents in one category, Career Enders, was small (N=12), it was combined with
another category, Freelancers due to the similar nature of these groups. Descriptive

101
statistics, ANOVA and multiple regression analyses were obtained. The dependent
measures for the study are scores from the OSB and JS portion of the survey. The
independent variables include the three categories of NTT faculty and their background
characteristics - gender, years of teaching, number courses taught and level of
employment (part-time to full-time). Also obtained in the survey was information on the
academic college in which they teach and whether they prefer a NTT position or would
like a TT position. Multiple regression analysis using a model building approach was
done to further determine if there is an association among the categories of NTT faculty
and their OSB and JS. The four questions asked in the research design were then
answered and a discussion of those results is included below.
Discussion of Research Results
This section will focus on a discussion of the research questions and the results
used to answer each question. It will also include the relevant literature that relates to
each question and the results I obtained with the survey of NTT faculty.
Research Question #1
What are the different categories as defined by Gappa and Leslie (1993) that
comprise the instructional NTT faculty at MSU?
The NTT faculty who responded to the survey self-select themselves into one of
four categories. The majority of the respondents (40%) say they were Specialists,
Experts or Professionals in their chosen field. These NTT faculty are probably
instructors because they like teaching and teaching is not their primary job. The results
102
from this study support this finding because as a group it is also the category in which the
largest number of respondents said they prefer a NTT faculty position (42%).
The second category in which 33% of the NTT faculty classify themselves is the
Aspiring Academics. As originally described, the faculty are either recent graduates who
are just beginning to look for a full-time position or faculty who have taught for years but
for a variety of reasons have not been successful in securing a full-time TT position. The
results of this study verified the description of Aspiring Academics as it had the largest
number of respondents (42%) who said they preferred a TT position. It also corresponds
to studies which speak to the academic drift of universities and the increase in the number
of PhDs even though TT positions are declining (Baldwin & Chronister, 2001, Schuster
and Finkelstein, 2006, Morphew & Huisman, 2002). One-third of the NTT faculty in this
sample “aspire” to have a full-time TT position and are currently classified as NTT
faculty. The results of this study indicate that this group has less job satisfaction than the
Specialists, Experts and Professionals.
The third category of NTT faculty are the Freelancers as described by Gappa and
Leslie (1993). These individuals have multiple part-time jobs and teaching at MSU is
just one of them. They teach for economic reasons (need the extra money) and do not
desire to teach full-time for a variety of reasons (are caregivers, enjoy other activities, or
are experimenting with other job opportunities). They are 20% of this sample. They
along with the Career Enders (7% of sample) prefer NTT positions. Because the Career
Enders category had a small number of respondents, it has been combined with the
Freelancers to form one category called Freelancers/Career Enders. This combined

103
category has a total of 27% of the sample of NTT faculty. The combined group also
corresponds to an increasing number of reports that indicate a part-time teaching
appointment while phasing into retirement or a part-time instructional position because of
the need for additional income, is desirable and not uncommon at universities. This is
congruent with the fact that costly TT positions have not been filled and are being
replaced by an increasing number of NTT faculty who are more flexible and cost less to
hire (AFT, 2009, AAUP, 2009). In this sample, both the Freelancers and Career Enders
have a two-to-one preference for a NTT faculty position. It is important to know that I
did not send the survey to retired TT professors who teach part time and could technically
be called Career Enders. This number is estimated to be about ten at MSU and was
determined through my research with departments, websites and class schedules. These
individuals are often emeritus faculty who consider themselves as TT faculty even though
after retirement they are on short-term NTT faculty contracts. This is another illustration
of the diverse types of NTT faculty that teach at universities and demonstrates the
difficulty of doing meaningful studies (Kezar & Sam, 2010).
When conducting this study, background characteristics of NTT faculty are also
determined. Results show that there are twice as many females as males in NTT faculty
positions at MSU in all three categories. The literature also provides evidence that
verifies these findings as Schuster & Finkelstein (2006) and Harper, Baldwin, Gansneder
& Chronister, (2001) noted that more women than men are in NTT faculty positions.
There are various reasons for this statistic such as women are more often care givers or
they are place bound because of a significant other. However, the ratio of more women

104
to men in NTT positions is of special concern because statistics show that greater than
50% of all PhDs in the last ten years are being awarded to women and yet more men
than women are in TT positions (NCES, 2003, NEARC, 2007).
Another result from this study of NTT faculty, which seems to be consistent with
the literature, is the level of employment of Aspiring Academics. They are employed at a
higher level of employment or more full-time than the other two categories. As initially
described by Gappa & Leslie (1993) these NTT faculty want a full-time TT position and
are usually young, new PhDs, waiting for an academic position. Therefore, they fill
numerous teaching positions, some in multiple departments, and may even do part-time
research or administrative duties in an effort to secure full-time employment.
Determining the complexity of appointments was not determined in this survey, but
several respondents commented at the end of the survey on their multiple positions and
the difficulty they had assigning themselves to one of the categories. National statistics
indicate that the proportion of full-time NTT faculty has risen to almost 25% of the total
NTT faculty workforce (June, 2012) and determining the type of employment these
individuals becomes even more complex. This is also one of the reasons that in their
study of full-time NTT faculty, Baldwin and Chronister (2001) stated that new categories
should be created which include not only their teaching responsibilities but also other
aspects of their job such as administration, advising or research.
To summarize, what I learned from the people who respond to this study, was that
of the four categories of NTT faculty, 40% are Specialists, Experts and Professionals,
33% are Aspiring Academics, 20 % are Freelancers and 7% are Career Enders. At MSU
105
there are twice as many women who fill these positions as men and NTT faculty are
greater than 50% of the faculty who instruct students. They are found in every college
and department on campus and 30% teach less than .5FTE while 41% work full time. In
addition, 32% of the NTT faculty teach only one course each semester whiole 39% teach
three or more courses per semester. They are a rather stable workforce at MSU because
74% have taught for three or more years. This information provides a broad overview of
the types and characteristics of NTT faculty at MSU. It also provides information which
assists in the answer of the other research questions.
Research Question #2
What is the difference across the NTT faculty categories and their job
satisfaction?
When the results of the survey of NTT faculty were analyzed using ANOVA
analyses, it showed that there is a statistical difference across the mean levels of JS and
the three categories in this study. The post hoc tests also revealed that the significant
difference was between the Freelancers/Career Enders and the Specialists, Expert or
Professionals categories. The Freelancers/Career Enders typology has significantly less
JS than the Specialists, Experts or Professionals category.
Since JS, as determined by Spector (1997), has nine different facets which
determine total JS, ANOVAs are run on each factor. This enabled me to determine if
there were significant differences in individual factors that may contribute to the
differences in total JS between the Freelancers/Career Enders and Specialists, Experts
and Professionals. Two of the factors, Operating Procedures and Coworkers, emerged as

106
significantly different between these two groups of NTT faculty. The Freelancers/Career
Enders have less JS than the Specialists, Experts or Professionals in the questions asked
about their coworkers and the operating procedures. In the four questions asked about
their coworkers (questions 7, 16, 25 and 34 – Appendix A), information is obtained about
whether they like or enjoy their coworkers or felt that their coworkers were either
incompetent, fight or often bicker. The Freelancers/Career Enders have significantly
more negative responses to these questions than the Specialists, Experts and
Professionals. In the four questions asked about the operating procedures or conditions in
their jobs (questions 6, 15, 24 and 31 – Appendix A), the respondents were asked about
excessive work, rules, procedures, red tape and paperwork blocking job performance.
The Freelancers/Career Enders had more negative responses and significantly less JS in
this factor than the Specialists, Experts and Professionals.
The results on job satisfaction are not surprising given the nature of the category
and circumstances for hire of each faculty type. By definition the Specialists, Experts
and Professionals are hired in a given academic discipline that needs their expertise in
teaching specialized academic information. They bring real world applications to the
classroom and are often respected by both their students and peer faculty. In addition,
they teach because they enjoy it and have implicit satisfaction with the teaching they do.
They are usually not hired at the last minute, are asked to contribute to the curriculum in
significant ways and, for the most part, are satisfied with their jobs. Examples of these
people are professionals who teach in business, engineering, allied health professions or
architecture. In comparison, Freelancers are trying to piece together full-time

107
employment and even though they may be excellent instructors, they often are hired at
the last minute if openings are available. They feel less secure in their teaching
appointments which are often decided by student enrollment and yet they need the
teaching position for financial support. The Specialists, Experts and Professionals most
often do not depend on their teaching position for financial security so losing their part-
time income is not as critical. The Career Enders may or may not be hired at the last
minute but no part-time job is usually not as big a concern as it is for Freelancers.
The studies of JS in NTT faculty vary but one study by Benjamin (1998)
classified NTT faculty in a vocationally oriented cluster (VOC) such as engineers, allied
health professionals, business people or lawyers and in a liberal arts cluster (LAC),
people who teach in the arts and humanities. The NTT faculty in the VOC were
significantly happier with their jobs than those in the LAC. Another study by Conley and
Leslie supports these findings. In my opinion, the VOC cluster corresponds closely to the
description of Specialists, Experts and Professionals and my findings are similar to their
research. Other findings such as those by the American Federation of Teachers (2009)
and researchers such as Antony and Valdez (2002) have mixed results on the satisfaction
of NTT faculty. The mixed results are not surprising since they do not differentiate
between the types of NTT faculty in their studies.
Two factors of JS, pay and fringe benefits, are often described as being important
concerns because NTT faculty are paid significantly less that TT faculty to teach the
same class (Kezar and Sam, 2010). However, in this study , pay and fringe benefits did
not emerge as significant factors in total JS differences among the three categories of

108
NTT faculty. Promotion, however, at a significance of p = .07, was a stronger factor
underlying the differences in JS among the groups. Questions in this factor dealt with the
opportunity for promotion and fairness of the process. Since NTT faculty at MSU often
do not have the opportunity to advance in their positions, it is not a surprise that
promotion is a greater contributor to dissatisfaction with the job than other factors.
To summarize, it was found that after ANOVA analysis of responses from
different types of NTT faculty, the Freelancers/Career Enders have less job satisfaction
than the Specialists, Experts and Professionals. In addition, there are two facets of job
satisfaction, Coworkers and Operating Procedures, in which the Freelancers/Career
Enders have significantly more negative responses in the JS survey than the Specialists,
Experts and Professionals. These findings indicate there are differences between two
categories of NTT faculty and their job satisfaction.
Research Question #3
What is the difference across NTT faculty categories and their organizational
sense of belonging?
When the results of the survey of NTT faculty were analyzed using ANOVA
analyses, it showed that there is a not a statistical difference across the mean levels of
OSB and the three categories used in this study. Few studies have been published on
OSB of NTT faculty to compare results. Quinn (2006) conducted a small study in a
liberal arts college and found that adjunct faculty had an overall negative institutional
belongingness score. However, he did not differentiate categories of NTT faculty in his
study. In 2010 Merriman conducted a study of OSB in NTT faculty (adjunct) and TT

109
faculty at a research intensive university. She asked them to report the categories that I
used in this study. She reported a significantly higher mean score for OSB in NTT faculty
who are Career Enders than those who are Specialists, Experts or Professionals. The
ANOVA results in my study did not support this difference in significance of the two
categories until other variables were added to the analyses in multiple regression analysis
equations described below.
Research Question #4
What is the relationship between the job satisfaction and organizational sense of
belonging for the NTT faculty at MSU?
To determine the answer to this question, I ran a series of regression equations to
examine the association among the three NTT faculty typologies and the measures of
OSB and JS. The multiple regressions used a model building strategy to first look at the
three different categories and either their OSB (Table 4.4 and 4.5) or JS (Table 4.6)-
Model 1. Two of the categories, created by coding dummy variables, are Aspiring
Academics and Freelancers/Career Enders and they were analyzed with the reference
group, Specialists, Experts and Professionals, the group that serves as the modal category.
The second model added the background characteristics of gender, average number of
courses taught each semester, years teaching and level of employment as independent
variables. The third model added the background characteristics above plus either JS
(Tables 4.4 and 4.5) or OSB (Table 4.6) as independent variables to the equations. This
model building strategy enabled me to examine the net effect of the different categories

110
of NTT faculty on OSB while sequentially adding additional control variables to the
regression equation.
Results from the regression equations which analyzed OSB on the different types
of NTT faculty reveal that in Model 1, all three categories do not explain a significant
amount of OSB variability. This confirms the results from the ANOVA analysis. In
Model 2, when the background characteristics are added as independent variables to
Model 1, there is still no significant difference among the three categories and their OSB.
However, when JS was added as an independent variable to Model 3, all three categories
account for a significant amount of OSB variance (Table 4.4). Because there is a strong
association between OSB and JS (Table 4.3) it appears that JS may be acting as a
suppressor variable in Models 1 and 2. When the JS variable was added to the regression
equation in Model 3, the association between OSB and JS was allowed to emerge
statistically causing there to be significant differences between the Aspiring Academics
and Specialists, Experts and Professionals as well as between the Freelancers/Career
Enders and the Specialists, Experts and Professionals in their OSB. All three sets of
independent variables in Model 3 of this regression analysis account for 43% of the
variance. These analyses show that the two categories of Aspiring Academics and
Freelancers/Career Enders have significantly more OSB than the Specialists, Experts and
Professionals when background characteristics and JS are added as variables. The study
by Merriman (2010) which surveyed the OSB of NTT faculty also found no statistical
difference between the four categories and their OSB. However, when further analysis
was conducted, she found a significant effect for the interaction of adjunct faculty type

111
and length of time teaching. She found a statistically significant higher OSB in Career
Enders than the Specialists, Experts, and Professionals when teaching for seven years or
more. This is somewhat similar to my results from this study which reveal that the
Freelancers/Career Enders have a significantly higher OSB than the Specialists, Experts
and Professionals after all background characteristics and JS were added to the equations.
However, years of teaching did not by itself emerge as a statistically significant
independent variable as in this study.
The second set of regression analyses which analyzed OSB of the different types
of NTT faculty showed similar results to the first series of regressions (Models 1 and 2).
However, in Model 3, instead of total JS, the two factor variables of Coworkers and
Operating Procedures were added to the regression equation. When the two JS Factors
were added as independent variables to Model 2, all three categories account for a
significant amount of OSB variance (Table 4.5). They also revealed that the two
categories of Aspiring Academics and Freelancers/Career Enders have significantly more
OSB than the Specialists, Experts and Professionals when background characteristics and
the JS Factors, Coworkers and Operating Procedures were added as variables to the
model. Together they account for 45% of the variance and the two factors appear to be
acting as suppressor variables in Model 1 and 2 as in the previous models. In addition, a
background characteristic of level of employment of NTT faculty emerged as a
significant predictor. The results indicate that as the level of employment of NTT faculty
increases from part-time to full-time, this characteristic is a significant predictor of

112
greater OSB in Aspiring Academics and Freelancers/Career Enders than in Specialists,
Experts and Professionals.
Both analyses concerning the statistical differences in these categories of NTT
faculty are somewhat predictable when thinking about the characteristics of each
typology as described by Gappa and Leslie (1993). The Specialist, Experts and
Professionals are described as being members of their distinct fields of expertise and may
not need to feel connected to a department or university. They may derive their
“belongingness” from their professions, careers and jobs outside the university and teach
because they love to do so. They often teach for altruistic reasons and a desire to
contribute to their profession by teaching the next generation of professionals. This may
account for their significantly less OSB than the other two categories.
The last multiple regressions analyses determine the association of JS among the
three different categories of NTT faculty. Table 4.6 shows the results of the three
different models that were analyzed. All three categories explain a significant amount of
JS variability. These results are consistent with the results of the ANOVA analysis. In
those results it was shown that the Specialists, Experts and Professionals have a
significantly greater JS than the Freelancers/Career Enders. The regression analysis
shows that the Freelancers/Career Enders are a significantly negative predictor of JS or
they have less JS when compared to the Specialists, Experts and Professionals. As
explained earlier, this is predictable, and has been verified in other studies of job
satisfaction in NTT faculty. The second model in Table 4.6 continues to show that
Freelancers/Career Enders are a significantly negative predictor of JS when compared to

113
the reference typology Specialists, Experts and Professionals even when background
characteristics are added to the model. In other words, the independent variables gender,
number of courses taught each semester, length of time teaching and level of employment
are not significant predictors of JS in this model. However, when OSB scores are added
to the Model 3, the Aspiring Academics as well as the Freelancers/Career Enders are
significantly negative predictors of JS. This model predicts 44.2% of the variance in the
regression analyses. Because there is a strong association between JS and OSB, it
appears that OSB is acting as a suppressor variable in Models 1 and 2. When OSB was
added to the regression equation, the association between JS and OSB was allowed to
emerge statistically causing the two categories to be significantly negative predictors of
JS.
To summarize, it can be said that the results of this study indicate that certain
categories of NTT faculty, namely the Specialists, Experts and Professionals have a
greater job satisfaction than the other categories, Aspiring Academics and
Freelancers/Career Enders who often do not have the same motives for teaching.
However, the Aspiring Academics and Freelancers/Career Enders have a greater sense of
belonging to their departments and MSU than the Specialists, Experts and Professionals
who probably have a greater affiliation with their profession and careers and not to MSU.
These seemingly disparate results have not been reported in other studies and provide
evidence that not all NTT faculty are alike especially in these psycho-social issues. It
may also help administrators better understand ways of providing a better working

114
environment for the different types of NTT faculty who do most of the teaching on
college campuses.
Recommendations from Study
After conducting this study and reviewing the literature on NTT faculty, several
recommendations are suggested in this section. The most important finding in this study,
which is verified in other studies, is that although administratively it is convenient to treat
all NTT faculty alike, there are distinct differences in who they are, how they view their
jobs and the environment in which they work. Therefore, their contracts and evaluation
should be designed to reflect these differences. Included below is a discussion of each
category of NTT faculty and recommendations for employment contracts.
There are some NTT faculty such as the Specialists, Experts and Professionals
who want to remain part time and have satisfaction with their teaching. However,
according to this study, they do not necessarily feel a part of their department or
university. Their expertise should be valued and rewarded in ways that would encourage
their citizenship on campus. This includes the professionalization of their NTT positions
with multiyear contracts. Part of their contracts should include professional development
opportunities such as attending regional or national meetings in their academic
disciplines. They should be encouraged and rewarded for attendance at seminars, faculty
retreats and university wide opportunities to improve their teaching. Their contributions
to the curriculum should be sought and valued as members of the department or program
and they should be invited to curriculum meetings. Research has shown that campuses
115
that institute policies and practices for NTT faculty that start by communicating their
value and respect, will foster a greater socialization and sense of belonging for this group
to their department and university (Baldwin and Chronister, 2001; Cross and Goldenberg,
2009; Gappa and Leslie, 1993; Kezar and Sam, 2010a). Research from this study shows
that when questions such as “I receive support from other faculty or I have opportunities
to interact with other faculty”, the Specialists, Experts and Professionals respond more
negatively to the questions than the other categories of NTT faculty
The Aspiring Academics should be encouraged to continue their professional
development through formal mentoring with other faculty in their areas of expertise.
This group of faculty is seeking full time employment in the academy and rather than
being treated as second-class citizens they should be rewarded for the long hours they
spend in the teaching roles in their department or program. They often work almost full
time but multi-year contracts for young, new graduates in this category are not something
they necessarily want. What they do want and need is help in seeking their long term
goals of an academic TT position, something that was verified in this study. All faculty
members should help with opportunities to continue their research and administrators
should encourage their application to full-time positions. Too often Aspiring Academics
feel they are “stuck” in teaching positions and their worth as a scholar is never
encouraged by others (Gappa and Leslie, 1993, Kezar and Sam, 2010b). In many
departments, after a certain period of time teaching, they are even discouraged from
applying for TT positions when they become available. Communicating a respect for the
Aspiring Academics as professionals by valuing their opinion and including them in

116
discussions with coworkers will foster an increase in their job satisfaction (Kezar and
Sam, 2010b) Results from this study show that the Aspiring Academics have
significantly less job satisfaction because of coworker interactions than the Specialists,
Experts and Professionals. By encouraging interactions with coworkers and encouraging
professional development with research, it will provide hope that a TT position is
possible and foster a greater JS in this group of NTT faculty.
The Freelancers try to piece together full-time employment by teaching in many
different courses and departments or performing extra administrative duties. This group
should be rewarded with long term contracts because a concern they have is job security
(Gappa and Leslie, 1993). Many have called for modifying the tenure process and
perhaps this group of faculty would benefit from the modifications (Kezar and Sam,
2010b). Modifications would include replacing the single standard for tenure which
focuses on research with a broader profile that focuses more on teaching or service and
less on research. Until that time, providing this group of NTT faculty with long term
contracts and higher pay will improve their overall attitude and job satisfaction. Policies
should be put in place that reward more stable, long term contracts to NTT faculty who
spend years teaching in multiple classes trying to piece together full time employment.
These are often the NTT faculty who teach in large classes and are never given the
opportunity for promotion including teaching upper division courses that would foster
their professionalism (Gappa and Leslie, 1993; Kezar and Sam, 2010b). Instead of the
associated insecurity of no guarantee of a teaching contract, this group of faculty, who
teach a large share of the students on campus, should be rewarded with long term

117
contracts. This will foster an increase in JS and provide a more dedicated faculty in
classrooms or web-based courses. Information from this study shows that Freelancers
have less total job satisfaction particularly in the areas of promotion and coworkers.
Recommendations for the Career Enders, the smallest group of NTT faculty,
would be very dependent upon the person in these positions and their reasons for taking a
teaching position. Since these are older professionals who are transitioning into
retirement, many may simply want to feel part of the department by having more
interactions with coworkers and share their collective years of wisdom with students.
They also should be appreciated for the years of experience that they bring to their
teaching. Courteous professional treatment of this group of faculty is important and may
give them a greater job satisfaction.
A common thread through all these recommendations is that NTT faculty need to
be recognized as having different motives and desires in their jobs. Too often they are
wrongly evaluated and compared to TT faculty who have clearly defined roles of
teaching, service and research (American Federation of Teachers, 2009; Baldwin and
Chronister, 2001; Kezar and sam, 2010b). By understanding their differences and motives
for teaching, administrators and fellow faculty members can provide unique contracts and
working environments that foster the differences among this diverse group of faculty. In
addition, administrators and TT faculty can create a respectful professionalism in this
group of faculty who do most of the teaching on college campuses. This in turn will
foster a greater job satisfaction and sense of belonging to their departments and the
university. The results of this change in the treatment of NTT faculty will be to create a

118
vital learning community in which students want to enter and complete their higher
education.
Limitations of Study
There are several limitations of the study that I will address in this section. As
mentioned in chapter 1, the study is only being conducted at Montana State University
with the NTT faculty who taught in the Fall of 2012. The NTT faculty at other
institutions may not be representative of faculty at MSU, so generalizations to faculty at
other institutions may not be appropriate. However, there is no reason to believe that
MSU is so different from other research intensive universities that the results cannot be
generalized to similar universities.
A second limitation of the study is the inability to electronically contact all the
NTT faculty who taught during the Fall of 2012. Every effort was made to include
everyone in the survey but because some of the potential respondents had off-campus
emails and several directors of programs chose not to provide their emails, 35 individuals
are not contacted electronically for the voluntary survey. In addition, because the Office
of Planning and Analysis does not have access to NTT faculty information until after
November 1st, they are unable to provide their most current list of instructional NTT
faculty by the time the survey was sent in early November. The timing of November 1st
was determined to be the most ideal time for distribution of the survey in order to obtain
maximum participation. Therefore, because some electronic emails were not available,
not all identifiable NTT faculty members had an opportunity to answer the survey. That

119
being said, 397 NTT faculty did receive the survey and after a second reminder, 194
responded.
A third limitation was my initial concern of sample bias due to a low response
rate. The response rate for the survey is 48.5% which is more than twice the normal
response rate of 19.8% as reported in the literature for electronic surveys (Sax, Gilmartin
& Bryant, 2003). Therefore, because the response rate is high, the bias in the survey was
reduced. This is particularly important if only those happy with their OSB and JS
responded to the survey.
A fourth limitation is the concern about the overall climate of the university and
whether this would influence the answers in the survey. This survey did not determine
the overall climate at MSU for NTT faculty. However, we do know that the collective
bargaining unit for NTT faculty secured raises for NTT faculty who are employed at .5
FTE and above. This may or may not have influenced the response to the questions on
job satisfaction survey depending on your level of employment.
A fifth limitation was the identification of each participant’s academic discipline
or whether they teach in the humanities, sciences or professions such as engineering,
business or health professions. The information gained by asking participants to identify
the college in which they teach is not specific enough to identify their disciplines. I
would have to identify each participant who answered the survey instead of keeping the
information confidential through a coding process. In addition, several departments have
few respondents so this also threatens the confidentiality of the study and therefore, was
not determined. This is a limitation of the study because academic discipline was proven

120
to be important in several studies of NTT faculty (Benjamin, 1998, Conley & Leslie,
2002).
A sixth limitation may be the bias in the response rates in the question concerning
their preference of a being in a NTT position or a TT position. The respondents from the
survey are almost 2:1 in their preference for a NTT position. At least one researcher has
suggested that involuntarily employed NTT faculty (part time faculty in his study) have
less JS and this measure has a greater impact on JS than other measures (Maynard &
Joseph, 2008). The bias of many more respondents preferring a NTT position may
influence the JS results of this study. That being said, the results of this study show that
the Aspiring Academics, who may be classified as involuntarily employed, have
significantly less job satisfaction than the Specialists, Experts, and Professionals who
perhaps may be classified as voluntarily employed. This result is similar to the findings
of Maynard & Joseph (2008).
Final limitations of the study include the difficulty in selecting a category from
the list presented. The responses of some of the respondents indicated they had a difficult
time assigning themselves to a category as they felt they were a hybrid of several
categories. In addition, the study had a low number of respondents from the Career
Enders category. With only 12 respondents, this group does not have the required 30
which is necessary for group analysis (Gliner & Morgan, 2000). Therefore, the Career
Enders category was not included as a separate category during the analysis of JS and
OSB. Both Gappa and Leslie (1997) and Tuckman (1978) acknowledged in their
studies that this category consists of the fewest number of all NTT faculty. This proved

121
to be true of this sample as well. Therefore, in order to retain study participants, their
scores were combined with another category, Freelancers who most closely match the
defined characteristics of the Career Enders. This means that the independent variables
consist of only three categories of NTT faculty instead of the four which have been used
in other studies (Merriman, 2010).
Recommendations for Future Research
The recommendations for future research on NTT faculty include conducting a
qualitative study of selected NTT faculty to redefine the categories. The study I used to
originally define these categories was done in the 1990s. Today we have a more diverse
NTT faculty who may teach on-line courses or have other administrative duties such as
advising or service to their department and university. In addition, there are many more
full-time NTT faculty working in universities than when the original studies were done.
A modern typology of NTT faculty would lead to a better understanding of their roles in
the university.
Some other recommendations include conducting a survey with TT faculty at
MSU to determine their OSB and JS and compare these two types of faculty. Also,
conducting a survey at another university of similar size and mission would increase the
sample size and validity so that generalizations could be made. The same study could
also be conducted at a community college to determine the differences in NTT faculty, as
well as their OSB and JS. Statistics show that 80-90% of NTT faculty who teach at
vocational and community colleges are NTT faculty so understanding if they have

122
differences in their JS and OSB would be useful in developing policy on treatment of
NTT faculty at these campuses.
Finally, since coworkers and operating procedures are two significantly important
factors in the dissatisfaction in many of the categories, designing a study to further
elucidate the reasons for this would be useful. Administrators and other faculty could use
the information to change or enhance policies for the treatment of the different types of
NTT faculty. This would lend itself to improving the climate for all faculty on campus.
In summary, the recommendations include:
1. Conduct a qualitative study of NTT faculty on campus to further elucidate and
redefine the categoreis of this diverse group of faculty.
2. Survey the TT faculty at MSU to determine their OSB and JS and compare
differences with NTT faculty.
3. Conduct a survey at another university of similar size and mission to increase
the validity of study.
4. Conduct the same survey at a community college to determine differences in
the categories and their OSB and JS.
5. Further investigate why the two factors, coworkers and operating procedures,
are important factors in determining total JS in NTT faculty.
Conclusions
Results from this investigation show there are differences in the types of NTT
faculty who teach at MSU. The research indicates that there is a statistically significant

123
greater OSB in Aspiring Academics and Freelancers/Career Enders than in the
Specialists, Experts and Professionals. However, the opposite is true of their JS. The
Specialists, Experts and Professionals have a greater JS than the Aspiring Academics and
Freelancers/Career Enders. In particular, the Aspiring Academics and Freelancers/Career
Enders are less satisfied with two important factors in job satisfaction, their coworkers
and the operating procedures that can complicate their jobs.
The study did reveal only one significant background characteristics that made a
difference in the three categories of NTT faculty and their OSB and JS. It appears that as
they increase their level of employment from part-time to full-time, it is a greater
predictor of OSB in Aspiring Academics and Freelancers/Career Enders than in
Specialists, Experts and Professionals. The other background characteristics did not
make a significant difference in the NTT faculty in this study. When both JS and OSB
were added as independent variables to the models in the regression analyses there was a
significant difference in the three categories of NTT faculty in their OSB or JS. Each
appears to act as a suppressor variable in Models 1 and 2 and when they are added as
independent variables in both Models 3s, it caused a significant difference between the
categories that would not have emerged otherwise.
This study adds to the growing body of evidence that NTT faculty at universities
and institutions of higher education are a diverse group of professionals. They have
different motives and reasons for teaching and this study provides further insight into the
differences in NTT faculty on two important psycho-social issues - their job satisfaction
and their organizational sense of belonging.

124
REFERENCES CITED

125
American Association of University Professors (AAUP). (2009). Trends in instructional
staff employment status, 1975-2009. Retreived from http://www.aaup.org/aaup/
pubres/researchtrends1975-2009.
American Federation of Teachers (AFT). (2003). American academic: Full-time non-
tenure- track faculty report. Washington, D.C.: American Federation of Teachers.
American Federation of Teachers (AFT). (2009). American academic: The state of higher
education workforce, 1997-2007. Washington, D.C.: American Federation of
Teachers.
American Federation of Teachers (AFT). (2010). American academic: A national survey
of part-time/adjunct faculty. Washington, D.C.: American Federation of
Teachers.
Alderfer, C. (1972). Existence, Relatedness and Growth. New York: The Free Press.
Antony, J. S., & Valadez, J. R. (2002). Exploring the satisfaction of part-time college
faculty in the United States. [Project MUSE]. The Review of Higher Education,
26(1), 41-56. doi: 10.135/rhe.2002.0023
Baldwin, R. G., & Chronister, J. L. (2001). Teaching without tenure: Policies and
practices for a new era. Baltimore, Md.: Johns Hopkins University Press.
Baumeister, R. F., & Leary, M. R. (1995). The need to belong: Desire for interpersonal
attachments as a fundamental human motivation. Psychological bulletin, 117(3),
497-529. doi: 10.1037/0033-2909.117.3.497
Benjamin, E. (1998). Variations in the characteristics of part-time faculty by general
fields of instruction and research. New Directions for Higher Education, 104, 45-
59.
Benjamin, E. (2003). Reappraisal and implications for policy and research. New
Directions for Higher Education 123, 79-113.
Berry, J. (2005). Reclaiming the ivory tower: Organaizing adjuncts to change higher
education. New York: Monthly Review Press.
Bollen, K. A., & Hoyle, R. H. (1990). Perceived cohesion: A conceptual and empirical
examination. Social Forces, 69(2), 479-504.
Bousquet, M. (2008). How the university works: Higher education and the low-wage
nation. New York: New York University Press.

126
Bozeman, B., & Gaughan, M. (2011). Job satisfaction among university faculty:
Individual, work and institutional determinants. The Journal of Higher Education,
82(2), 154-186.
Cataldi, E.F.., Fahimi, M., & Bradburn, E.M. (2005). 2004 National Study of
Postsecondary Faculty (NSOPF:04): Report on Faculty and Instructional Staff in
Fall 2003 (NCES 2005-172). U.S. Department of Education. Washington, D.C.
Conley, V. M., & Leslie, D. W. (2002). Part-time instructional faculty and staff: Who
they are, what they do, and what they think. Education Statistics Quarterly, 4(2),
9.
Cranny, C. J., Smith, P. C., & Stone, E. F. (1992). Job satisfaction: How people feel
about their jobs and how it affects their performance. New York: Lexington
Books.
Cross, J. G., & Goldenberg, E. N. (2009). Off-track profs: Nontenured teachers in higher
education. Cambridge, MA: MIT Press.
Curtis, J. W. (2005). Inequities persist for women and non-tenure-track faculty: The
annual report on the economic status of the profession 2004-05. Academe, 91(2),
21.
Dobson, M. (2001). Ghosts in the classroom: Stories of college adjunct faculty-and the
price we all pay: Quincy, MA: Camel's Back Books.
Dutton, J. E., Dukerich, J. M., & Harquail, C. V. (1994). Organizational images and
member identification. Administrative Science Quarterly, 39(2), 239-263.
Ehrenberg, R. G. (2006). What's happening to public higher education? Westport, CT:
Praeger Publishers.
Feldman, D. C., & Turnley, W. H. (2001). A field study of adjunct faculty: The impact of
career stage on reactions to non-tenure-track jobs. Journal of Career
Development, 28(1), 1-16. doi: 10.1177/089484530102800101
Field, A. (2005). Discovering Statistics Using SPSS (2nd ed.). Thousand Oaks, CA:
SAGE Publications Inc.
Foreman, D. (2008). We're not your colleagues. Chronicle of Higher Education, 54(46),
A27-A30.
Fulton, R. D. (2000). The plight of part-timers in higher education. Change, 32(3), 38.

127
Gappa, J. M. (2000). The new faculty majority: Somewhat satisfied but not eligible for
tenure. New Directions for Institutional Research, 2000(105), 77-86.
Gappa, J. M., & Leslie, D. W. (1993). The invisible faculty: Improving the status of part-
timers in higher education. San Francisco, CA: Jossey-Bass.
Gliner, J. A., & Morgan, G. A. (2000). Research methods in applied settings: An
integrated approach to design and analysis. Mahwah, NJ: Lawrence Erlbaum.
Gumport, P. J. (2007). Sociology of higher education: Contributions and their contexts.
Baltimore, MD: Johns Hopkins University Press.
Hackman, J. R., & Oldham, G. R. (1976). Motivation through the design of work: Test of
a theory. Organizational Behavior and Human Performance, 16, 250-279.
Hagerty, B., Lynch-Sauer, J., Patusky, K., Bouwsema, M., & Collier, P. (1992). Sense of
belonging: A vital mental health concept. Archives of Psychiatric Nursing, VI(3),
172-177.
Harper, E. P., Baldwin, R. G., Gansneder, B. G., & Chronister, J. L. (2001). Full-time
women faculty off the tenure track: Profile and practice. Review of Higher
Education, 24(3), 237-257.
Hoffman, M., Richmond, P., Morrow, J., & Salomone, P. (2002). Investigating "sense of
belonging" in first-year college students. Journal of College Student Retention:
Research, Theory and Practice, 4(3), 227-256.
Hollenshead, C., Waltman, A., August, L., Miller, J., & Bergom, I. (2007). Making the
best of both worlds: Findings from a national institution-level survey on non-
tenure track faculty. Center for the Education of Women. Ann Arbor, MI:
Univeristy of Michigan.
Hoyt, J. E., Howell, S. L., & Eggett, D. (2007). Dimensions of part-time faculty job
satisfaction: Development and factor analysis of a survey instrument. Journal of
Adult Education, 36(2), 23-34.
Ironson, G. H., Smith, P. C., Brannick, M. T., Gibson, W. M., & Paul, K. B. (1989).
Construction of a job in general scale: A comparison of global, composite, and
specific measures. Journal of Applied Pscyology, 74(2), 193-200.
Ivancevich, J. M., & Matteson, M. T. (1996). Organizational behavior and management
(4th ed.). Chicago: Irwin.

128
June, A.W. (2012). Adjuncts build strength in numbers. Chronicle of Higher Education,
9(11), A1-A8.
Kezar, A., & Sam, C. (2010a). Special issue: Non-tenure-track faculty in higher
education--theories and tensions. ASHE Higher Education Report, 36(5), 1-91.
Kezar, A., & Sam, C. (2010b). Special issue: Understanding the new majority of non-
tenure-track faculty in higher education--demographics, experiences, and plans of
action. ASHE Higher Education Report, 36(4), 1-133.
Lee, R. M., & Robbins, S. B. (1995). Measuring belongingness: The social
connnectedness and the social assurance scales. Journal of Counseling
Psychology, 42(2), 232-241.
Levin, J. S., Kater, S., & Wagoner, R. L. (2006). Community college faculty: At work in
the new economy. New York: Palgrave Macmillan.
March, J., & Simon, H. (1965). Organizations. New York: John Wiley and Sons.
Maslow, A. (1943). A theory of human motivation. Psychological Review, Vol 50 (4),
370-396.
Maslow, A. (1962). Toward a psychology of being. Princeton, N.J.: Van Nostrand.
Maynard, D., & Joseph, T. (2008). Are all part-time faculty underemployed? The
influence of faculty status preference on satisfaction and commitment. Higher
Education, 55(2), 139-154. doi: 10.1007/s10734-006-9039-z
Merriman, C. L. (2010). Adjunct faculty organizational sense of belonging and affective
organizational commitment. (Doctorial dissertation) Retrieved from
http://gateway. proquest.com openurl?url_ver=Z39.88-
2004&rft_dat=xri:pqdiss:3411382.
Morgan, R. M., & Hunt, S. D. (1994). The commitment-trust theory of relationship
marketing. Journal of Marketing, 58(3), 20.
Morphew, C. C., & Huisman, J. (2002). Using institutional theory to refram research on
academic drift. Higher Education in Europe, 27(4), 492-506.
Murray, J. P. (2008). New faculty members' perceptions of the academic work life.
Journal of Human Behavior in the Social Environment, 17(1-2), 107-128.
National Center for Education Statistics (NCES). (2004). Digest of Education Statistics,
2003. Retrieved from ttp://nces.ed.gov/programs/digest/d04/tables/dt04_227.asp.

129
National Education Association Research Center (NEARC) (2007). Part-time faculty: A
look at data and issues. Washington, DC: National Education Association.
Pascarella, E. T., & Terenzini, P. T. (2005). How college affects students: A third decade
of research (2nd ed.). San Francisco: Jossey-Bass.
Porter, L. W., & Steers, R. M. (1973). Organizational, work, and personal factors in
employee turnover and absenteeism. Psychological bulletin, 80(2), 151-176.
Quinn, S. (2006). A descriptive case study of the organization-based self-esteem,
institutional belongingness, and career development opportunities of adjunct
faculty at a small northeastern college. Journal of Social Change, 1(1), 48-71.
Robbins, S. P. (2005). Essentials of organizational behavior (8th ed.). Upper Saddle
River, N.J.: Pearson/Prentice Hall.
Rosser, V. J. (2005). Measuring the change in faculty perceptions over time: An
examination of their worklife and satisfaction. Research in Higher Education,
46(1), 81-107.
Sax, L.J., Gilmartin, S.K., & Bryant, A.N. (2003). Assessing response rates and
nonresponse bias in web and paper surveys. Research in Higher Education, 44(4),
409-432.
Sayles, L. R., & Strauss, G. (1966). Human behavior in organizations. Englewood Cliffs,
N.J.,: Prentice-Hall.
Schuster, J. H., & Finkelstein, M. J. (2006). The american faculty: The restructuring of
academic work and careers. Baltimore: Johns Hopkins University Press.
Seifert, T. A., & Umbach, P. D. (2008). The effects of faculty demographic
characteristics and disciplinary context on dimensions of job satisfaction.
Research in Higher Education, 49(4), 357-381.
Shaker, G. (2008). Off the track: The full-time nontenure-track faculty experience in
English. Retrieved from http://search.proquest.com//docview/
304607830?accountid=28148
Slaughter, S., & Rhoades, G. (2004). Academic capitalism and the new economy:
Markets, state, and higher education. Baltimore: Johns Hopkins University Press.

130
Smith, P. C., Kendall, L. M., & Hulin, C. L. (1969). The measurement of satisfaction in
work and retirement; A strategy for the study of attitudes. Chicago, Ill.,: Rand
McNally.
Somers, M. D. (1999). Development and preliminary validation of a measure of
belongingness. (Doctoral dissertation) Ann Arbor, Michigan: UMI (#9938702).
Spector, P. E. (1985). Measurement of human service staff satisfaction: Development of
the job satisfaction survey. American Journal of Community Psychology, 13(6),
693-712.
Spector, P. E. (1997). Job satisfaction: Application, assessment, cause, and
consequences. Thousand Oaks, Calif.: Sage Publications.
Steele, T.L. (1996). A sense of belonging as a dimension of social integration:
Exploration, validation, and measurement construction. (Doctoral dissertation).
Ann Arbor, Michigan: UMI. (#9719498).
Thedwall, K. (2008). Nontenure-track faculty: Rising numbers, lost opportunities. New
Directions for Higher Education, 143, 11-19.
Toutkoushian, R. K., & Bellas, M. L. (2003). The effects of part-time employment and
gender on faculty earnings and satisfaction. Journal of Higher Education, 74(2),
172-195.
Tovar, E., & Simon, M. A. (2010). Factorial structure and invariance analysis of the
sense of belonging scales. Measurement & Evaluation in Counseling &
Development, 43(3), 199-217. doi: 10.1177/0748175610384811
Tuckman, H. P. (1978). Who Is Part-Time in Academe? AAUP Bulletin, 64(4), 305-315.
Umbach, P. D. (2007). How effective are they? Exploring the impact of contingent
faculty on undergraduate education. Review of Higher Education, 30(2), 91-123.
Van Arsdale, G. (1978). De-professionalizing a part-time teaching faculty: How many,
feeling small, seeming few, getting less, dream of more. The American
Sociologist, 13, 195-201.
Van Dick, R., Wagner, U., Stellmacher, J., Christ, O., & Tissington, P. A. (2005). To
be(long) or not to be(long): Social identification in organizational contexts.
Genetic, Social & General Psychology Monographs, 131(3), 189-218.
Vroom, V. H. (1964). Work and motivation. New York,: Wiley.
131
Weiss, D. J., Dawis, R. V., England, G. W., & Lofquist, L. H. (1967). Manual for the
Minnesota Satisfaction Questionnaire. Minneapolis, MN: University of
Minnesota.
Wiesenfeld, B. M., Raghuram, S., & Garud, R. (2001). Organizational identification
among virtual workers: the role of need for affiliation and perceived work-based
social support. Journal of Management, 27, 213-229.
Winter-Collins, A., & McDaniel, A. M. (2000). Sense of belonging and new graduate job
satisfaction. J Nurses Staff Dev, 16(3), 103-111.

132
APPENDICES
133
APPENDIX A
SURVEY OF NON-TENURE-TRACK FACULTY

134

135
Demographic Information
1. Please indicate the average number of courses you teach each semester at MSU
(choose one)
o One
o Two
o Three
o Four
o More than four
2. Please indicate the number of years teaching as a non-tenure-track (NTT) faculty at
Montana State University. (choose one)
o first year (first semester)
o one year (2-3 semesters)
o two years
o 3-5 years
o 5-10 years
o >10 years
3. On average, what is your type of employment (FTE)? (choose one)
o .25 FTE or less
o .25 - .50 FTE
o .50 - .75 FTE
o .75 - 1.0 FTE
o 1.0 FTE
4. What is your gender? (choose one)
o Female
o Male
o Prefer not to answer
5. What is the college where you teach the majority of your classes? (choose one)
o Letters and Science
o Agriculture
o Engineering
o Business
o Arts and Architecture
o Education, Health and Human Development
o Nursing
o Gallatin College
o Other
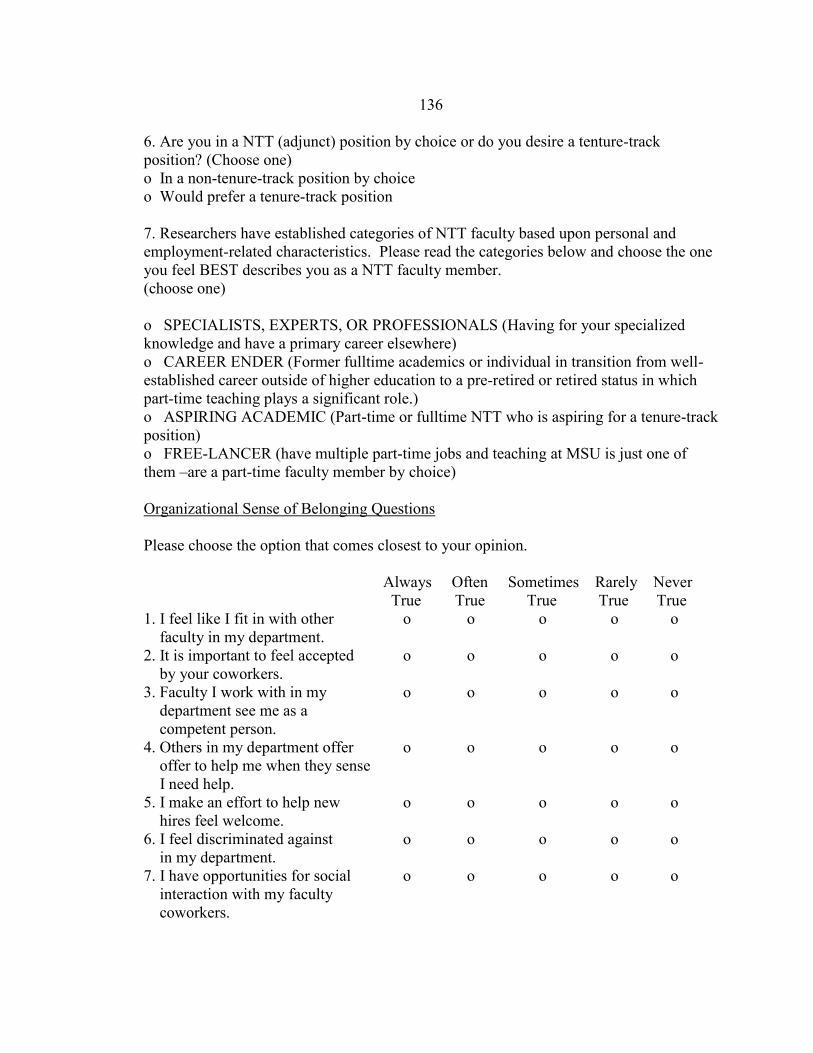
136
6. Are you in a NTT (adjunct) position by choice or do you desire a tenture-track
position? (Choose one)
o In a non-tenure-track position by choice
o Would prefer a tenure-track position
7. Researchers have established categories of NTT faculty based upon personal and
employment-related characteristics. Please read the categories below and choose the one
you feel BEST describes you as a NTT faculty member.
(choose one)
o SPECIALISTS, EXPERTS, OR PROFESSIONALS (Having for your specialized
knowledge and have a primary career elsewhere)
o CAREER ENDER (Former fulltime academics or individual in transition from well-
established career outside of higher education to a pre-retired or retired status in which
part-time teaching plays a significant role.)
o ASPIRING ACADEMIC (Part-time or fulltime NTT who is aspiring for a tenure-track
position)
o FREE-LANCER (have multiple part-time jobs and teaching at MSU is just one of
them –are a part-time faculty member by choice)
Organizational Sense of Belonging Questions
Please choose the option that comes closest to your opinion.
Always Often Sometimes Rarely Never
True True True True True
1. I feel like I fit in with other o o o o o
faculty in my department.
2. It is important to feel accepted o o o o o
by your coworkers.
3. Faculty I work with in my o o o o o
department see me as a
competent person.
4. Others in my department offer o o o o o
offer to help me when they sense
I need help.
5. I make an effort to help new o o o o o
hires feel welcome.
6. I feel discriminated against o o o o o
in my department.
7. I have opportunities for social o o o o o
interaction with my faculty
coworkers.
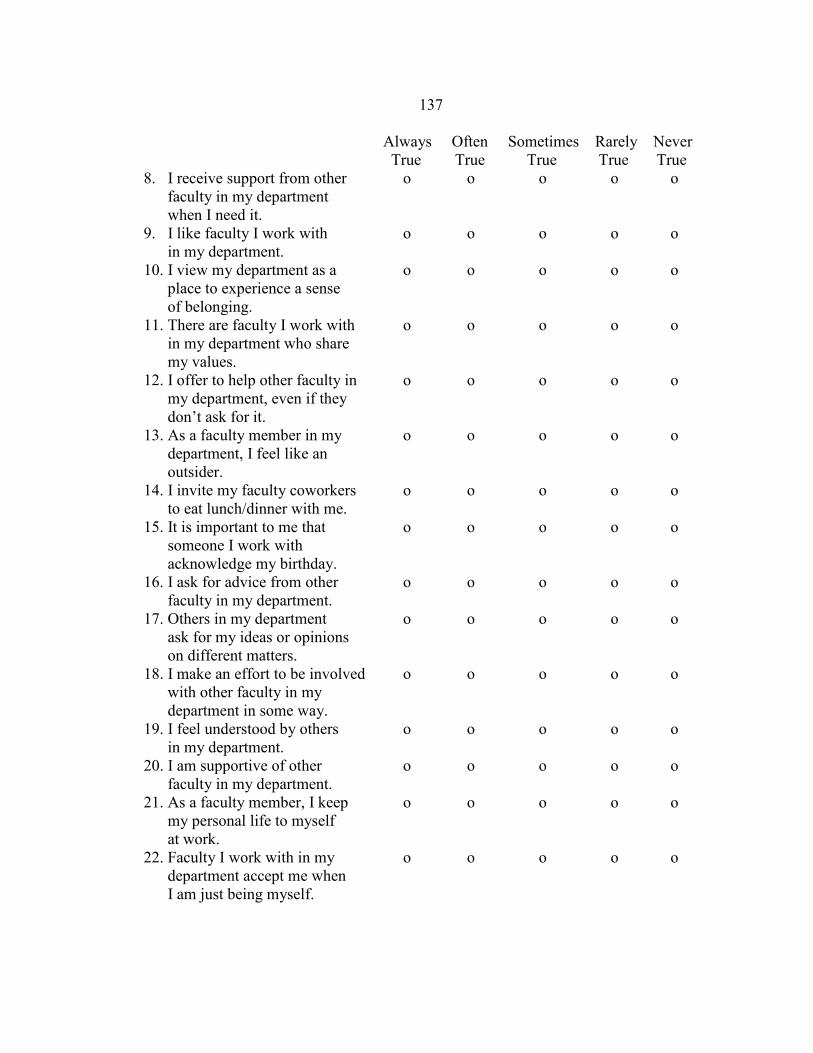
137
Always Often Sometimes Rarely Never
True True True True True
8. I receive support from other o o o o o
faculty in my department
when I need it.
9. I like faculty I work with o o o o o
in my department.
10. I view my department as a o o o o o
place to experience a sense
of belonging.
11. There are faculty I work with o o o o o
in my department who share
my values.
12. I offer to help other faculty in o o o o o
my department, even if they
don’t ask for it.
13. As a faculty member in my o o o o o
department, I feel like an
outsider.
14. I invite my faculty coworkers o o o o o
to eat lunch/dinner with me.
15. It is important to me that o o o o o
someone I work with
acknowledge my birthday.
16. I ask for advice from other o o o o o
faculty in my department.
17. Others in my department o o o o o
ask for my ideas or opinions
on different matters.
18. I make an effort to be involved o o o o o
with other faculty in my
department in some way.
19. I feel understood by others o o o o o
in my department.
20. I am supportive of other o o o o o
faculty in my department.
21. As a faculty member, I keep o o o o o
my personal life to myself
at work.
22. Faculty I work with in my o o o o o
department accept me when
I am just being myself.

138
Always Often Sometimes Rarely Never
True True True True True
23. There are faculty in my o o o o o
department with whom I
feel a strong bond.
24. I am uncomfortable attending o o o o o
social functions at my
department because I
feel like I don’t belong.
25. Feeling “a part of things” is o o o o o
one of the things I like about
being a faculty member in
my department.
26. When I approach a group of o o o o o
faculty members, I feel
welcomed.
27. It seems that faculty I work o o o o o
with in my department like me.
28. One or more of the faculty in my o o o o o
department confides in me.
29. I let other faculty in my o o o o o
department know that I care
about them by asking how
things are going for them and
their families.
30. Other faculty in my department o o o o o
notice when I am absent from
work or social gatherings.
31. I let other faculty in my o o o o o
department know that I
appreciate them.
32. I ask other faculty in my o o o o o
department for help when I
need it.
33. I like the department where o o o o o
I teach.
34. I feel free to share o o o o o
disappointments with at
least one other faculty
member in my department.
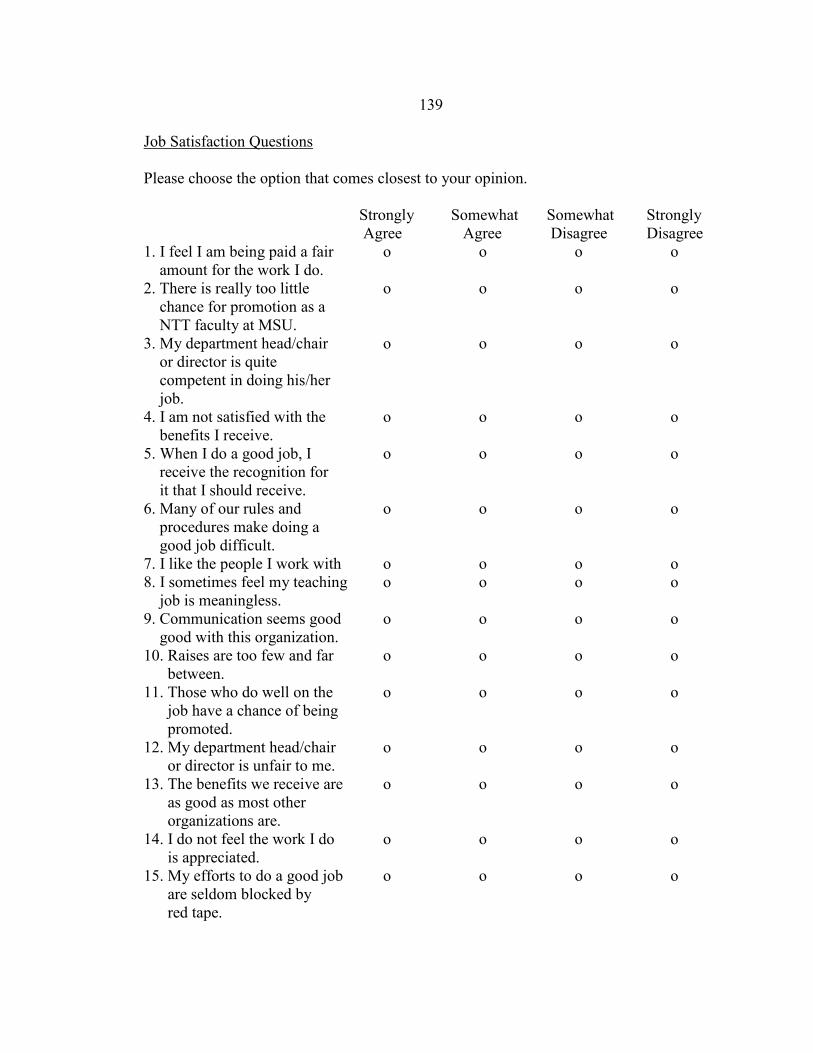
139
Job Satisfaction Questions
Please choose the option that comes closest to your opinion.
Strongly Somewhat Somewhat Strongly
Agree Agree Disagree Disagree
1. I feel I am being paid a fair o o o o
amount for the work I do.
2. There is really too little o o o o
chance for promotion as a
NTT faculty at MSU.
3. My department head/chair o o o o
or director is quite
competent in doing his/her
job.
4. I am not satisfied with the o o o o
benefits I receive.
5. When I do a good job, I o o o o
receive the recognition for
it that I should receive.
6. Many of our rules and o o o o
procedures make doing a
good job difficult.
7. I like the people I work with o o o o
8. I sometimes feel my teaching o o o o
job is meaningless.
9. Communication seems good o o o o
good with this organization.
10. Raises are too few and far o o o o
between.
11. Those who do well on the o o o o
job have a chance of being
promoted.
12. My department head/chair o o o o
or director is unfair to me.
13. The benefits we receive are o o o o
as good as most other
organizations are.
14. I do not feel the work I do o o o o
is appreciated.
15. My efforts to do a good job o o o o
are seldom blocked by
red tape.

140
Strongly Somewhat Somewhat Strongly
Agree Agree Disagree Disagree
16. I find I work harder at my job o o o o
because of the incompetence
of the people I work with.
17. I like doing the things I do o o o o
at my teaching job.
18. The goals of this organization o o o o
are not clear to me.
19. I feel underappreciated by the o o o o
organization when I think
about what they pay me.
20. People get ahead as fast o o o o
here as they do in other
organizations.
21. My department head/chair o o o o
or director shows too little
interest in the feelings of
subordinates.
22. The benefit package we o o o o
Have is equitable.
23. There are few rewards for o o o o
faculty who work here.
24. I have too much to do at o o o o
work.
25. I enjoy my coworkers. o o o o
26. I often feel I do not know o o o o
what is going on with the
organization.
27. I feel a sense of pride in o o o o
doing my job.
28. I feel satisfied with my o o o o
chances for salary increases.
29. There are benefits we do not o o o o
have which we should have.
30. I like my department chair. o o o o
31. I have too much paperwork. o o o o
32. I don’t feel my efforts are o o o o
rewarded the way they
should be.
33. I am satisfied with my o o o o
chances for promotion.

141
Strongly Somewhat Somewhat Strongly
Agree Agree Disagree Disagree
34. There is too much o o o o
bickering and fighting
at work.
35. My job is enjoyable. o o o o
36. Teaching assignments are o o o o
not fully explained.
If you so choose, please provide any additional information about your experiences as a
NTT faculty member at MSU.

142
APPENDIX B
DESCRIPTIVE STATISTICS OF NTT-FACULTY
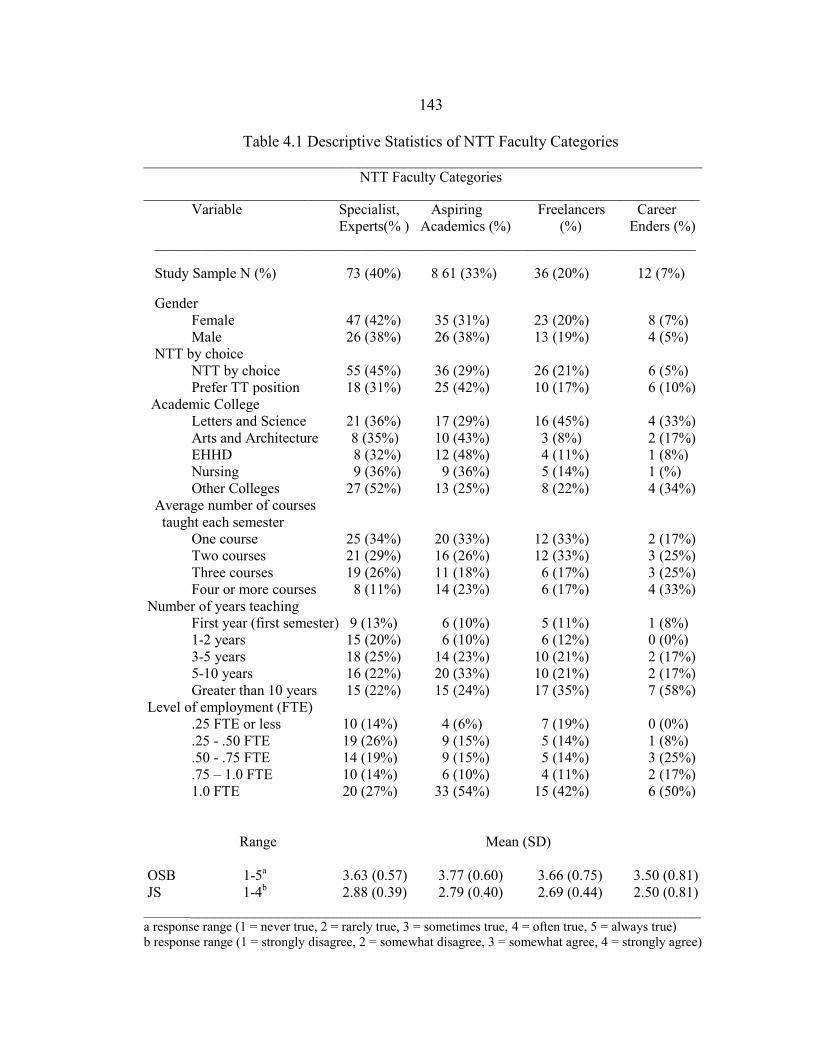
143
Table 4.1 Descriptive Statistics of NTT Faculty Categories
______________________________________________________________________ NTT Faculty Categories
____________________________________________________________________________ Variable Specialist, Aspiring Freelancers Career
Experts(% ) Academics (%) (%) Enders (%)
__________________________________________________________________________
Study Sample N (%) 73 (40%) 8 61 (33%) 36 (20%) 12 (7%)
Gender
Female 47 (42%) 35 (31%) 23 (20%) 8 (7%)
Male 26 (38%) 26 (38%) 13 (19%) 4 (5%)
NTT by choice
NTT by choice 55 (45%) 36 (29%) 26 (21%) 6 (5%)
Prefer TT position 18 (31%) 25 (42%) 10 (17%) 6 (10%)
Academic College
Letters and Science 21 (36%) 17 (29%) 16 (45%) 4 (33%)
Arts and Architecture 8 (35%) 10 (43%) 3 (8%) 2 (17%)
EHHD 8 (32%) 12 (48%) 4 (11%) 1 (8%)
Nursing 9 (36%) 9 (36%) 5 (14%) 1 (%)
Other Colleges 27 (52%) 13 (25%) 8 (22%) 4 (34%)
Average number of courses
taught each semester
One course 25 (34%) 20 (33%) 12 (33%) 2 (17%)
Two courses 21 (29%) 16 (26%) 12 (33%) 3 (25%)
Three courses 19 (26%) 11 (18%) 6 (17%) 3 (25%)
Four or more courses 8 (11%) 14 (23%) 6 (17%) 4 (33%)
Number of years teaching
First year (first semester) 9 (13%) 6 (10%) 5 (11%) 1 (8%)
1-2 years 15 (20%) 6 (10%) 6 (12%) 0 (0%)
3-5 years 18 (25%) 14 (23%) 10 (21%) 2 (17%)
5-10 years 16 (22%) 20 (33%) 10 (21%) 2 (17%)
Greater than 10 years 15 (22%) 15 (24%) 17 (35%) 7 (58%)
Level of employment (FTE)
.25 FTE or less 10 (14%) 4 (6%) 7 (19%) 0 (0%)
.25 - .50 FTE 19 (26%) 9 (15%) 5 (14%) 1 (8%)
.50 - .75 FTE 14 (19%) 9 (15%) 5 (14%) 3 (25%)
.75 – 1.0 FTE 10 (14%) 6 (10%) 4 (11%) 2 (17%)
1.0 FTE 20 (27%) 33 (54%) 15 (42%) 6 (50%)
Range Mean (SD)
OSB 1-5a 3.63 (0.57) 3.77 (0.60) 3.66 (0.75) 3.50 (0.81)
JS 1-4b 2.88 (0.39) 2.79 (0.40) 2.69 (0.44) 2.50 (0.81)
_______________________________________________________________________ a response range (1 = never true, 2 = rarely true, 3 = sometimes true, 4 = often true, 5 = always true)
b response range (1 = strongly disagree, 2 = somewhat disagree, 3 = somewhat agree, 4 = strongly agree)