NON-STANDARD MONETARY POLICY MEASURES AND …
29
DISCUSSION PAPER SERIES ABCD www.cepr.org Available online at: www.cepr.org/pubs/dps/DP8125.asp www.ssrn.com/xxx/xxx/xxx No. 8125 NON-STANDARD MONETARY POLICY MEASURES AND MONETARY DEVELOPMENTS Domenico Giannone, Michele Lenza, Huw Pill and Lucrezia Reichlin INTERNATIONAL MACROECONOMICS
Transcript of NON-STANDARD MONETARY POLICY MEASURES AND …

DISCUSSION PAPER SERIES
ABCD
www.cepr.org
Available online at: www.cepr.org/pubs/dps/DP8125.asp www.ssrn.com/xxx/xxx/xxx
No. 8125
NON-STANDARD MONETARY POLICY MEASURES AND MONETARY
DEVELOPMENTS
Domenico Giannone, Michele Lenza, Huw Pill and Lucrezia Reichlin
INTERNATIONAL MACROECONOMICS

ISSN 0265-8003
NON-STANDARD MONETARY POLICY MEASURES AND MONETARY DEVELOPMENTS
Domenico Giannone, ECARES, Université Libre de Bruxelles and CEPR Michele Lenza, European Central Bank
Huw Pill, European Central Bank Lucrezia Reichlin, London Business School and CEPR
Discussion Paper No. 8125 November 2010
Centre for Economic Policy Research 53–56 Gt Sutton St, London EC1V 0DG, UK
Tel: (44 20) 7183 8801, Fax: (44 20) 7183 8820 Email: [email protected], Website: www.cepr.org
This Discussion Paper is issued under the auspices of the Centre’s research programme in INTERNATIONAL MACROECONOMICS. Any opinions expressed here are those of the author(s) and not those of the Centre for Economic Policy Research. Research disseminated by CEPR may include views on policy, but the Centre itself takes no institutional policy positions.
The Centre for Economic Policy Research was established in 1983 as an educational charity, to promote independent analysis and public discussion of open economies and the relations among them. It is pluralist and non-partisan, bringing economic research to bear on the analysis of medium- and long-run policy questions.
These Discussion Papers often represent preliminary or incomplete work, circulated to encourage discussion and comment. Citation and use of such a paper should take account of its provisional character.
Copyright: Domenico Giannone, Michele Lenza, Huw Pill and Lucrezia Reichlin
CEPR Discussion Paper No. 8125
November 2010
ABSTRACT
Non-standard Monetary Policy Measures and Monetary Developments*
Standard accounts of the Great Depression attribute an important causal role to monetary policy errors in accounting for the catastrophic collapse in economic activity observed in the early 1930s. While views vary on the relative importance of money versus credit contraction in the propagation of this policy error to the wider economy and ultimately price developments, a broad consensus exists in the economics profession around the view that the collapse in financial intermediation was a crucial intermediary step. What lessons have monetary policy makers taken from this episode? And how have they informed the conduct of monetary policy by leading central banks in recent times? This paper sets out to address these questions, in the context of the financial crisis of 2008-09 and with application to the euro area.
JEL Classification: E32, E4 and E5 Keywords: credit, Great Recession, monetary policy shocks, money and non-standard monetary policy
Domenico Giannone Université Libre de Bruxelles ECARES 50 Av. F.D. Roosevelt, CP 114 B-1050 Bruxelles BELGIUM Email: [email protected] For further Discussion Papers by this author see: www.cepr.org/pubs/new-dps/dplist.asp?authorid=154334
Michele Lenza DG Research, EMO European Central Bank Kaiserstrasse, 29 D-60311 Frankfurt am Main GERMANY Email: [email protected] For further Discussion Papers by this author see: www.cepr.org/pubs/new-dps/dplist.asp?authorid=154336
Huw Pill Monetary Policy Stance Division European Central Bank Kaiserstrasse 29 (Eurotower) 60311 Frankfurt am Main GERMANY Email: [email protected] For further Discussion Papers by this author see: www.cepr.org/pubs/new-dps/dplist.asp?authorid=135612
Lucrezia Reichlin Department of Economics London Business School Regent's Park London NW1 4SA Email: [email protected] For further Discussion Papers by this author see: www.cepr.org/pubs/new-dps/dplist.asp?authorid=109257
* The views expressed in this paper are those of the authors and do not necessarily reflect the views of the ECB or the Eurosystem. Material underlying this paper was presented at the CIMF conference on unconventional monetary policy measures in March 2010 and at the Bank of England CCBS research workshop in July 2010.
Submitted 14 November 2010

1
NON-STANDARD MONETARY POLICY MEASURES AND MONETARY DEVELOPMENTS
D. Giannone,‡ M. Lenza,* H. Pill* and L. Reichlin†
June 2010; this version September 2010
1. Introduction1
Standard accounts of the Great Depression (notably the seminal offering of Friedman and Schwartz,
1963) attribute an important causal role to monetary policy errors in accounting for the catastrophic
collapse in economic activity observed in the early 1930s. In particular, the Federal Reserve’s failure to
halt the collapse in the money stock following the banking crisis of 1931 is seen as a crucial mistake.2
While views vary on the relative importance of money versus credit contraction in the propagation of
this policy error to the wider economy and ultimately price developments,3 a broad consensus exists in
the economics profession around the view that the collapse in financial intermediation was a crucial
intermediary step.
What lessons have monetary policy makers taken from this episode? And how have they informed the
conduct of monetary policy by leading central banks in recent times? Using the frameworks developed
by Giannone et al. (2010) and Lenza et al. (2010), this paper sets out to address these questions, in the
context of the financial crisis of 2008-09 and with application to the euro area. In doing so, the paper
draws together two strands of literature: one that explores the nature and rationale of non-standard
monetary policy measures, understood as those relying on instruments other than changes to short-
term official interest rates;4 and another which investigates the evolution of bank balance sheets, as
reflected in monetary and credit developments, and their impact on monetary policy transmission.
We believe that connecting these two literatures is essential when assessing the success of non-standard
monetary policy measures during the recent crisis episode. A growing number of papers evaluate the
impact of central bank balance sheet expansion on the slope and level of the yield curve.5 Yet the first-
order objective of the non-standard measures – especially in a bank-centred financial system, like that
‡ Université Libre de Bruxelles – ECARES. * European Central Bank. † London Business School and CEPR.
1 The views expressed in this paper are those of the authors and do not necessarily reflect the views of the ECB or the
Eurosystem. Material underlying this paper was presented at the CIMF conference on unconventional monetary policy measures in March 2010 and at the Bank of England CCBS research workshop in July 2010.
2 See: Meltzer (2007). 3 See: e.g., Bernanke (1983). 4 For a brief summary of measures, see: Borio and Disyata (2009). 5 See: e.g., Kozicki et al. (2010) and the references therein; Gagnon et al. (2010); and Joyce et al. (2010).
2
of the euro area – has been to support ongoing financial intermediation and market functioning: in
other words, to avoid the mistakes of the early 1930s. This cannot meaningfully be evaluated by
looking at the marginal impact of measures on specific asset markets. A more comprehensive approach
is required – one that entails a rich analysis of developments in money and credit aggregates and an
evaluation of the effectiveness of monetary policy transmission.
While recognizing the practical and methodological challenges entailed, in this paper we set out to
construct counterfactual macroeconomic scenarios that accord a central place to the financial and
monetary variables at the heart of recent experience, against which observed outcomes can be
compared. To simplify, we focus on a specific phase of the financial crisis, namely the period after the
failure of Lehman Brothers (specifically, September 2008 through early 2010).6
To anticipate our results, we show that the behaviour of key financial and monetary aggregates –
notably M1, short-term bank loans to non-financial corporations and (albeit to a somewhat lesser
extent) loans to households – can be explained on the basis of historical regularities estimated in the
pre-crisis sample, once developments are conditioned on the actual path of economic activity. In other
words, one does not need to rely on exceptional or aberrant behaviour in the financial sector to explain
developments in money and credit following the failure of Lehman. The ensuing weakness of
economic activity suffices to account for what was observed.
To be clear: we do not claim that such exercises demonstrate that financial shocks played no part in the
dramatic fall in economic activity observed in the second half of 2008. Nor do we claim that the
evolution of loan dynamics in the euro area can be attributed solely to credit demand, rather than credit
supply, factors. These are important questions. But answering them requires robust identification of
the underlying economic shocks within a fully-specified structural model of the euro area economy and
financial system, something the analysis employed in this paper does not provide.
Nonetheless we believe that our results are informative. In particular, they are consistent with the view
that the recent evolution of the euro area economy can be explained as the incidence of a ‘big shock’,
which propagated to economic activity largely through conventional channels, rather than as a
fundamental change in the behaviour of the economy (a ‘structural break’). Thus, while we necessarily
remain agnostic regarding the factors that led to the simultaneous downturn in real activity and
financial intermediation in September 2008, we argue that the interactions between financial and
monetary flows, on the one hand, and the real economy, on the other, in the subsequent period largely
reflect historical regularities, given the introduction of non-standard monetary policy measures by the
Eurosystem (and other initiatives by the policy authorities).
6 i.e., before the euro area sovereign debt crisis that emerged in Spring 2010 had exerted a strong influence on the time
series for monetary and financial variables.

3
We interpret these results as evidence that the non-standard measures introduced by the ECB
following Lehman’s demise were successful in, at least partially, insulating the liquidity and credit
conditions facing households and firms from the breakdown of financial intermediation seen in the
interbank money market.7 By implication, ‘propagation via financial collapse’ – seen as central to the
emergence of the Great Depression in the 1930s – was largely avoided in the recent episode. In this
sense, the non-standard monetary policy measures introduced by the ECB in the autumn of 2008 can
be viewed as successful.
The remainder of the paper is organized as follows. As background to the discussion, Section 2 recalls
important features of the two financial crisis episodes discussed above. Section 3 then describes how
the Eurosystem responded to the financial crisis of 2007-09, emphasising how this response differed
from that of other central banks and to that of the Federal Reserve in the 1930s. Section 4 presents
two model-based exercises to explore the impact of non-standard measures, while Section 5 offers
some brief concluding remarks deriving from this analysis.
2. ‘Text-book’ models of broad money supply and some monetary facts
Text-book models of the broad money supply process revolve around the manipulation of a number of
accounting identities describing banks’ holdings of central bank reserves and private sector holdings of
cash and deposits. The standard ‘money multiplier’ formulation leads to the following expression:
Hrk
k
HmM
1
where: M is broad money; H is high-powered money (i.e. central bank monetary liabilities); k is the
ratio of cash holdings to deposit holdings for the non-bank private sector; r is the ratio of central bank
reserves to deposits issued by the banking sector; and m is the money multiplier.
Figure 1 illustrates the significant drop in the money supply in the US during the Great Depression: on
the basis of data presented by Rasche (1987), the stock of M1 fell by approximately 20% between 1931
and 1933. The fall in M1 occurred notwithstanding a substantial rise in currency in circulation, which
increased by almost half over the same period. Taken together, these developments mechanically imply
a substantial fall in the money multiplier.8
7 Of course, we recognise that these measures cannot be seen in isolation. Governments also took substantial action in
early October 2008, notably by offering guarantees and other fiscal support to the financial system. However, as is argued in Section 3 below, we view the malfunctioning of the money market as being a key element of transmission during this episode: and this is where the ECB’s actions were most relevant.
8 Defined here as the ratio of M1 to currency in circulation.

4
Figure 1: Behaviour of US money stocks during the Great Depression, 1929-39
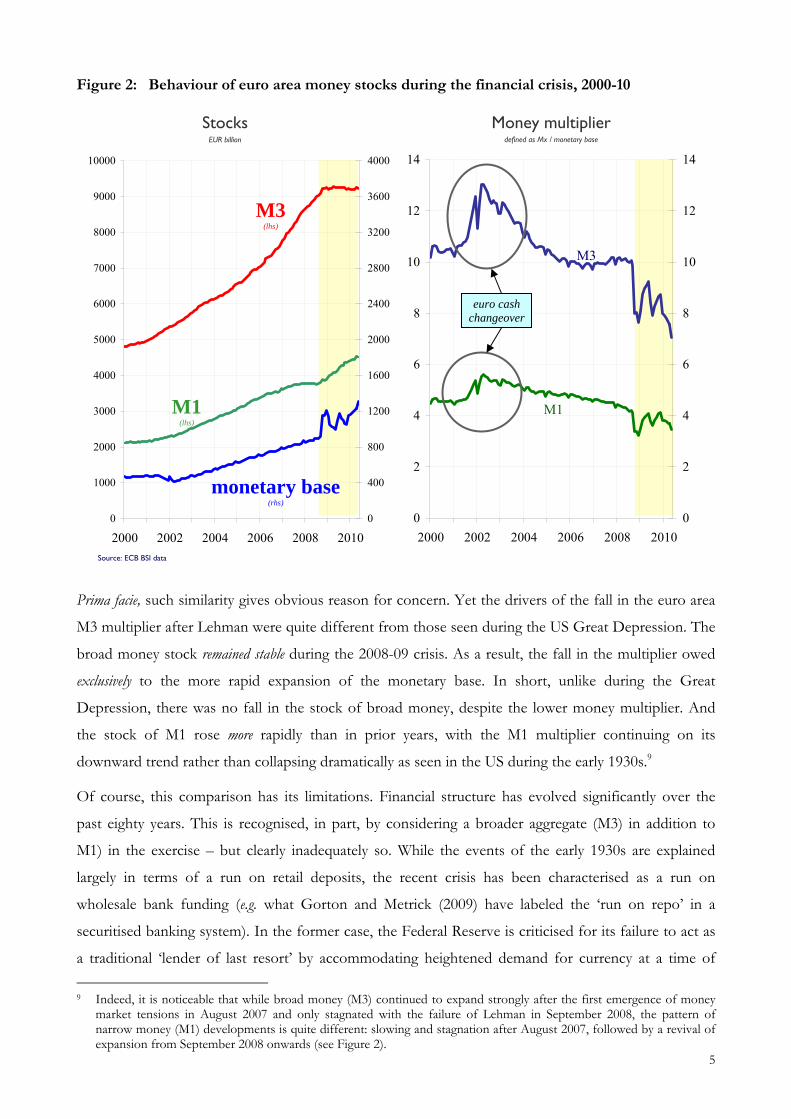
It is interesting to compare these developments with those observed during the 2007-09 financial crisis.
Figure 2 shows data for the euro area. In this chart, we also include the broader monetary aggregate
M3, which (inter alia) includes time and savings deposits, in addition to the overnight deposits included
in M1. Moreover, we have adopted a more comprehensive definition of the monetary base, including
not only currency and central bank reserves held by banks, but also recourse made by central bank
counterparties to the ECB deposit facility.
In the euro area, money multipliers demonstrate some volatility after the collapse of Lehman in
September 2008. This reflects the increased volatility of the monetary base from October 2008, as a
variety of non-standard monetary policy measures were introduced by the ECB. That said,
notwithstanding this volatility, several features of the data stand out. In particular, the M3 multiplier
behaved quite differently to the M1 multiplier: the latter gyrated around its relatively stable, pre-existing
downward trend during the two years after Lehman’s failure, whereas the M3 multiplier fell
significantly, mirroring the fall seen in the US multiplier after 1931.
Stocks US $ billion
0
1
2
3
4
5
6
7
8
1929 1931 1933 1935 1937 1939
0
1
2
3
4
5
6
7
8
0
5
10
15
20
25
30
35
40
1929 1931 1933 1935 1937 1939
0
2
4
6
8
10
12
14
16
M1 (lhs)
currency(rhs)
Source: Rasche (1987)
Money multiplier defined as M1 / currency
5
Figure 2: Behaviour of euro area money stocks during the financial crisis, 2000-10
Prima facie, such similarity gives obvious reason for concern. Yet the drivers of the fall in the euro area
M3 multiplier after Lehman were quite different from those seen during the US Great Depression. The
broad money stock remained stable during the 2008-09 crisis. As a result, the fall in the multiplier owed
exclusively to the more rapid expansion of the monetary base. In short, unlike during the Great
Depression, there was no fall in the stock of broad money, despite the lower money multiplier. And
the stock of M1 rose more rapidly than in prior years, with the M1 multiplier continuing on its
downward trend rather than collapsing dramatically as seen in the US during the early 1930s.9
Of course, this comparison has its limitations. Financial structure has evolved significantly over the
past eighty years. This is recognised, in part, by considering a broader aggregate (M3) in addition to
M1) in the exercise – but clearly inadequately so. While the events of the early 1930s are explained
largely in terms of a run on retail deposits, the recent crisis has been characterised as a run on
wholesale bank funding (e.g. what Gorton and Metrick (2009) have labeled the ‘run on repo’ in a
securitised banking system). In the former case, the Federal Reserve is criticised for its failure to act as
a traditional ‘lender of last resort’ by accommodating heightened demand for currency at a time of
9 Indeed, it is noticeable that while broad money (M3) continued to expand strongly after the first emergence of money
market tensions in August 2007 and only stagnated with the failure of Lehman in September 2008, the pattern of narrow money (M1) developments is quite different: slowing and stagnation after August 2007, followed by a revival of expansion from September 2008 onwards (see Figure 2).
Stocks EUR billion
Source: ECB BSI data
Money multiplier defined as Mx / monetary base
0
1000
2000
3000
4000
5000
6000
7000
8000
9000
10000
2000 2002 2004 2006 2008 2010
0
400
800
1200
1600
2000
2400
2800
3200
3600
4000
monetary base(rhs)
M3 (lhs)
M1 (lhs)
0
2
4
6
8
10
12
14
2000 2002 2004 2006 2008 2010
0
2
4
6
8
10
12
14
euro cash changeover
M1
M3
6
financial stress.10 In the latter case (and as discussed further in Section 3 below), the ECB has stepped
up its provision of intermediation services through its operational framework for the implementation
of monetary policy in order to complement (and, at times, replace) the frozen interbank money market
at the centre of wholesale bank funding activity.
The traditional characterisation of the broad money supply process obscures these nuances. For
example, one simplistic interpretation of recent events – suggested by the money multiplier identity
described above – is that the ECB ‘injected’ sufficient high-powered money into the financial system so
as to offset the contractionary impact of a declining money multiplier on the broad money stock. In
other words, the ECB avoided the mistake of the 1930s Federal Reserve identified by Friedman and
Schwartz. But such a view begs new questions: why did the ECB not inject more base money, so as to
allow M3 to contain to expand at pre-crisis rates? And what was the cause of the fall in the money
multiplier? Can it really be viewed as exogenous to the ECB’s policy decisions, as this treatment
suggests?
Answering these questions requires a more structural interpretation of the evolution of various
monetary quantities. And, in turn, this requires development of a deeper understanding of the
intentions and actions of the central bank, the banking sector, and borrowers and depositors in the
private sector. As Goodhart (2010) emphasises, the money multiplier framework is an inadequate lens
for this purpose. In the remainder of this paper, we employ the empirical framework presented in
Giannone et al. (2010) to explore these interactions in a data-rich setting. This model has been
developed for use in the ECB’s regular monetary analysis. It allows us to establish some ‘stylised facts’
or regularities in the pre-crisis monetary and financial data that can be used as a benchmark against
which to compare actual monetary developments (observed in real time) during the financial crisis
itself.
3. The ECB’s non-standard monetary policy measures after Lehman11
Following the failure of Lehman on 15 September 2008, panic gripped global financial markets. Money
market interest rate spreads rose substantially, as interbank liquidity dried up and markets ‘froze’. At its
peak following Lehman’s collapse, the spread between unsecured interbank deposit rates (EURIBOR)
and secure repo rates at the three-month maturity exceeded 200 basis points in the euro area (see
Figure 3) – and the equivalent spreads were even higher in the US and UK.
10 More specifically, one might argue that the criticism centres on the Federal Reserve’s failure to signal clearly ex ante that
it would fulfil such a lender of last resort function. In line with the literature on policy rules, this approach would have altered private expectations and stabilised private behaviour prior to the financial crisis. See, for example, the simulations presented in Christiano et al. (2003).
11 This section draws heavily on Lenza et al. (2010), to which readers are referred for more details.

7
On the basis of a structural model of the money market where the existence of informational
asymmetries between market participants gives rise to adverse selection among banks, Heider et al.
(2009) offer a compelling explanation of these developments. While their model is inevitably highly
stylised, it demonstrates how concerns about the solvency of specific banks can lead to the breakdown
of interbank trading.
The model distinguishes three regimes: first, a situation of low interest rate spreads and active
interbank trading; second, a market exhibiting elevated spreads and adverse selection, with continued
but lower trading volumes; and third, a regime where market trading breaks down. What determines
the transition from one regime to another in this model is the extent of concerns about counterparty
solvency. But when such concerns emerge, the outcome is heightened liquidity risk for all banks, not
just those which are perceived to face a heightened threat of insolvency as credit risks mount.
At a conceptual level, the various regimes identified in this model can be associated with the different
phases observed during the financial crisis: the pre-crisis normality; the initial tensions in the euro
money market after August 2007; and the sudden intensification of those tensions after Lehman failed,
leading to a money market ‘freeze’ in late September 2008. Once it was demonstrated that significant
institutions such as Lehman could default, concerns about counterparty risk mushroomed to the extent
that the interbank money market dried up almost completely. For a banking sector reliant on the
wholesale money market for its marginal funding needs, this posed serious risks to the financial system,
-50
0
50
100
150
200
250
15/06/07 15/09/07 15/12/07 15/03/08 15/06/08 15/09/08 15/12/08 15/03/09 15/06/09 15/09/09 15/12/09 15/03/10 15/06/10
-50
0
50
100
150
200
250
Source: Reuters
Figure 3: Spread between 3-month EURIBOR and 3-month GC repo rate basis points
Failure of Lehman 15 September 2008
8
to the flow of credit to the productive sectors and thus to financial, macroeconomic and, ultimately,
price stability.
Against this background, the authorities stepped into action. While it should be recognised that the
non-standard measures introduced by the Eurosystem in this context were part of a broader policy
response,12 they were nonetheless the crucial element in addressing the immediate liquidity crisis.
The main objective of the non-standard measures introduced by the Eurosystem was the expansion of
central bank intermediation. This was intended to substitute for interbank transactions that could no longer
take place owing to the malfunctioning private money market. Allowing greater intermediation across
the Eurosystem balance sheet prevented a collapse of the financial sector and mitigated the impact of
market turmoil on the real economy. In other words, the Eurosystem’s actions can be seen as the
modern-day equivalent of a ‘lender-of-last-resort’. Rather than providing cash to banks so that they can
meet retail deposit runs – as the Federal Reserve conspicuously failed to do in the early 1930s – the
ECB set out to provide ‘intermediation-of-last-resort’ as the interbank money market froze, with the
goal of preventing a fire-sale of marketable assets and the costly premature liquidation of loans, as
banks lost access to market sources of liquidity and short-term funding.13
How was central bank intermediation expanded? In line with the description of financial
intermediation that can be found in any standard banking text book, the Eurosystem’s activities grew
along a number of dimensions.
First, maturity transformation performed by the Eurosystem increased significantly. By: (a) increasing the
share of liquidity supplied at its long-term refinancing operations (LTROs) relative to its regular main
refinancing operations (MROs); and (b) increasing the maturity structure of its LTROs by offering one-
year operations; the Eurosystem substantially increased the average maturity of its outstanding repo
operations. And since these operations were ‘funded’ by the accumulation of excess liquidity at the
Eurosystem’s (overnight maturity) deposit facility, this resulted in substantial maturity transformation,
allowing the banking sector to become less reliant on (very) short-term financing and passing at least
part of the maturity mis-match inherent in banking activities to the central bank.
Second, the Eurosystem increased its provision of liquidity transformation. In particular, the Eurosystem
accepted as collateral in its refinancing operations assets that had become illiquid in financial markets
(notably mortgage-backed securities, given the freezing of the private market for securitised
instruments). In its operations, the Eurosystem provided cash loans against the security of these assets.
The banking sector was therefore able to transform illiquid instruments into cash at relatively low cost,
12 Involving (inter alia): a substantial easing of monetary policy by conventional means (i.e., lower key ECB interest rates);
fiscal stimulus; and substantial government support to the financial sector (e.g., in the form of government guarantees to bonds issued by banks or outright recapitalisation of banks facing solvency problems).
13 For the ECB’s official description of the specific measures taken as part of its programme of ‘enhanced credit support’, see: Trichet (2009).
9
avoiding a need to engage in disorderly ‘fire sales’ of those assets to raise liquidity. Such fire sales may
have led to a self-sustaining downward spiral in asset markets and collateral values, imposing capital
losses and liquidity squeezes on the banks themselves. In short, the systemic threat posed by fire sale
externalities was contained by central bank action.
Third, the Eurosystem increased its provision of transactions services and its support to the distribution of
liquidity within the financial sector. This was facilitated by the very large number of counterparties
eligible for Eurosystem operations, which allowed the central bank to establish itself as a central ‘hub’
in the network of interbank transactions. Participation in Eurosystem operations increased over the
course of the crisis as central bank intermediation replaced interbank transactions: at the peak, more
than one thousand different counterparties bid at the operations.
Finally, the Eurosystem contributed to addressing the information problems that were widely seen – for
example, in the Heider et al. (2009) model – as underlying the financial crisis. In particular, the
Eurosystem conducted operations in a manner that protected counterparties’ anonymity and thus
avoided the danger that operations were ‘stigmatized’ leading to an exacerbation of adverse selection
problems.14
The details of the specific operational actions implemented to achieve these objectives have been
discussed elsewhere (e.g., by Lenza et al, 2010). Rather than repeat them here, we focus on the key
feature of the Eurosystem’s approach, namely its adoption of a fixed rate / full allotment (FRFA) tender
procedure.
Adopting such a procedure in its operations implied that the Eurosystem accommodated banks’
demand for liquidity and central bank intermediation in full, at price conditions determined by the ECB.
In other words, there was no rationing of access to central bank intermediation: at the pre-announced
price (i.e. the fixed rate at the MROs), the supply of central bank liquidity and intermediation was
perfectly elastic. In line with the prescription offered by Cùrdia and Woodford (2010) on the basis of
their theoretical model, banks’ demand for central bank liquidity was satiated. In an environment of
financial crisis and dysfunctional markets where the demand for central bank intermediation was
strong, this led to a significant increase in the volume of outstanding repo operations (on the asset side
of the central bank balance sheet) and in the monetary base (on the liabilities side) (see Figure 4).
What is crucial to see is that the expansion of the Eurosystem balance sheet illustrated in Figure 4
should not be understood in terms of either: (a) an attempt to expand the money supply directly by
‘printing money’; or (b) an ‘injection of liquidity’ into the money market by the central bank. Rather the
14 Of course, this approach implicitly protected banks from the scrutiny of market discipline in their (very) short-term
financing. By implication, the Eurosystem’s risk control measures became the key monitoring and disciplining mechanism. The ECB emphasised that the responsible authorities (regulators, supervisors and ultimately the government) would need to address, in a timely way, any underlying solvency and other fundamental problems in the banking sector.

10
Figure 4: Eurosystem balance sheet
EUR billions
-2000
-1600
-1200
-800
-400
0
400
800
1200
1600
2000
2007W01 2007W21 2007W41 2008W09 2008W29 2008W49 2009W17 2009W37 2010W04 2010W24
-2000
-1600
-1200
-800
-400
0
400
800
1200
1600
2000
Main refinaning operations (MROs) Banknotes in circulation
Longer-term refinancing operations (LTROs) Current accounts (including minimum reserves)
Marginal lending facility (MLF) Deposit facility (DF)
Euro securities held for monetary policy purposes Liquidity absorbing fine tuning operations (FTOs)
Other euro securities issued by euro area residents Liabilities to other euro area residents denominated in euro
General government debt denominated in euro Other autonomous factors (net)
Net foreign assets hhh
Liquidity providing fine tuning operations (FTOs) Series16
First moneymarket tensions
Lehmanfailure
11
balance sheet expansion was a by-product of a set of non-standard measures aimed at supporting the
functioning of crucial segments of the financial market, thereby promoting effective monetary policy
transmission and avoiding a financial collapse similar to that of the 1930s.
This characterisation distinguishes the Eurosystem’s actions from the ‘quantitative easing’ policies
adopted by some other central banks from Spring 2009 onwards.15,16 Quantitative easing involves
purchases of assets in functioning and liquid markets, in an attempt to increase money holdings (and
reduce bond holdings) in the private sector so as to prompt further portfolio balance effects with
potential implications for the structure of yields and returns in the economy.17
Two further observations develop the distinction between quantitative easing and the Eurosystem’s
employment of FRFA tenders as the central part of its programme of ‘enhanced credit support’.
First, by adopting the FRFA procedure, the Eurosystem ceded control over volumes allotted in its
operations to its counterparties. Thus quantities on the Eurosystem balance sheet were driven by
private choices, not policy decisions.
Second, the ‘active’ choice made by the counterparties concerned the asset side of the Eurosystem
balance sheet (i.e. bidding volumes at the refinancing operations). Recourse to the deposit facility and
expansion of the monetary base (as shown in Figure 4) was a ‘passive’ consequence of the excess
central bank liquidity in the money market. Since the banking sector’s aggregate demand for central
bank intermediation led to a stock of central bank liquidity in excess of that required to meet reserve
requirements, those ‘cash-rich’ banks with structurally long liquidity positions simply accumulated
reserve holdings at the deposit facility. In the dysfunctional money market, they were not prepared to
lend these holdings in the market given concerns about counterparty risk. And even if they bought
financial assets and/or made loans when seeking higher returns than available at the deposit facility,
such transactions merely transferred the excess liquidity to another bank. Ultimately, the increase in the
deposit facility was inevitable – the result of an accounting identity.
15 It should be recognised that the Eurosystem’s covered bond purchase programme (introduced in June 2009) and
securities markets programme (introduced in May 2010) did involve outright asset purchases at the initiative of the ECB. However, the overall volume of these measures (reflected in the item ‘euro securities held for monetary policy purposes’ in Figure 4) was small compared with the overall balance sheet and its expansion. Moreover, these asset purchases tool place in dysfunctional markets with the goal of supporting the improvement of market functioning. They were not explicitly intended to expand liquidity (e.g. with the intent to prompt portfolio re-allocation in the private sector). Indeed, the liquidity implications of asset purchases under the SMP were offset by special liquidity absorbing fine-tuning operations conducted by the Eurosystem.
16 As described in Lenza et al. (2010), greater cross-country similarity characterised the central bank response to the emergence of money market tensions in August 2007 and the immediate reaction to Lehman’s failure. As in the euro area, in the US and UK these measures focused on supporting money market functioning, even if the precise means employed varied according to the design of central banks’ operational frameworks for monetary policy implementation and the structure of the financial system in the respective jurisdictions.
17 See: Joyce et al. (2010) for a discussion of the various channels envisaged and an empirical evaluation of their efficacy in the UK context.

12
Figure 5: Substitution of central bank intermediation for interbank transactions
50
55
60
65
70
75
2006Jan 2006Jul 2007Jan 2007Jul 2008Jan 2008Jul 2009Jan 2009Jul 2010Jan 2010Jul
50
55
60
65
70
75
banks (incl. Eurosystem)to banks
banks (excl. Eurosystem)to banks
Source: ECB
intra-MFI (bank) sector credit as a percentage of credit to the non-financial sector
Note: The term “banks” is used here to refer to the statistical category “monetary financial institutions”(MFIs), which include the Eurosystem, credit institutions and money market mutual funds.
In sum, the Eurosystem’s non-standard measures should be understood as an attempt to accommodate
heightened demand for central bank intermediation from the private sector at a time when private
markets were dysfunctional. This is reflected (albeit imperfectly18) in Figure 5, which demonstrates that
the decline in interbank credit positions from September 2008 disappears when positions vis-à-vis the
Eurosystem are included in the data.
In the money market, this can be characterised as a switch of regimes: from a ‘normal’ regime, where the
Eurosystem supplied sufficient liquidity to meet the aggregate banking sector’s net (or consolidated)
liquidity needs and relied on the market to distribute that liquidity efficiently across individual banks; to
a ‘crisis’ regime, where tensions implied that the market could no longer be relied upon to distribute
liquidity efficiently. In the latter case, the Eurosystem was forced to accommodate the gross liquidity
needs of individual banks, since the market’s netting mechanism no longer worked. Since gross
transactions among institutions within the banking sector are much higher than the net liquidity needs
of the consolidated banking sector, even a partial switch from normal to crisis regime implied a
substantial expansion of the Eurosystem balance sheet – including the monetary base.
These measures were not without their repercussions on market interest rates. The expansion of
central bank intermediation allowed banks to by-pass money market tensions as necessary. As shown 18 In particular, the economically-relevant nature of this substitution of central bank intermediation for interbank activity
refers to the flow of transactions (many of which have a short maturity) rather than the stock of outstanding positions at end-month (illustrated in Figure 5). However, transactions data for the money market is sparse.
13
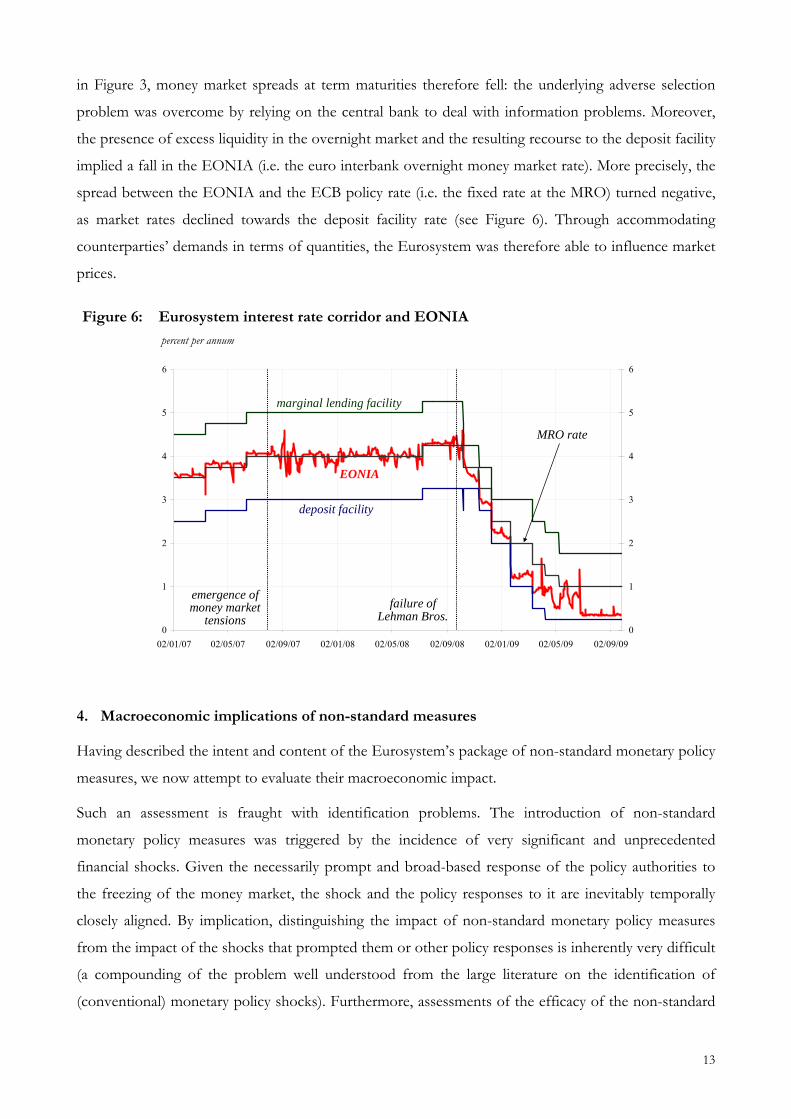
in Figure 3, money market spreads at term maturities therefore fell: the underlying adverse selection
problem was overcome by relying on the central bank to deal with information problems. Moreover,
the presence of excess liquidity in the overnight market and the resulting recourse to the deposit facility
implied a fall in the EONIA (i.e. the euro interbank overnight money market rate). More precisely, the
spread between the EONIA and the ECB policy rate (i.e. the fixed rate at the MRO) turned negative,
as market rates declined towards the deposit facility rate (see Figure 6). Through accommodating
counterparties’ demands in terms of quantities, the Eurosystem was therefore able to influence market
prices.
0
1
2
3
4
5
6
02/01/07 02/05/07 02/09/07 02/01/08 02/05/08 02/09/08 02/01/09 02/05/09 02/09/09
0
1
2
3
4
5
6
marginal lending facility
deposit facility
MRO rate
emergence ofmoney market
tensionsfailure of
Lehman Bros.
EONIA
4. Macroeconomic implications of non-standard measures
Having described the intent and content of the Eurosystem’s package of non-standard monetary policy
measures, we now attempt to evaluate their macroeconomic impact.
Such an assessment is fraught with identification problems. The introduction of non-standard
monetary policy measures was triggered by the incidence of very significant and unprecedented
financial shocks. Given the necessarily prompt and broad-based response of the policy authorities to
the freezing of the money market, the shock and the policy responses to it are inevitably temporally
closely aligned. By implication, distinguishing the impact of non-standard monetary policy measures
from the impact of the shocks that prompted them or other policy responses is inherently very difficult
(a compounding of the problem well understood from the large literature on the identification of
(conventional) monetary policy shocks). Furthermore, assessments of the efficacy of the non-standard
Figure 6: Eurosystem interest rate corridor and EONIA
percent per annum

14
measures will depend on what is seen as the counterfactual: if the alternative is a repeat of the Great
Depression, this will lead to quite different conclusions than an alternative of a return to normality.
In this paper, we adopt a more limited approach, focusing on a much more specific issue: the
transmission of non-standard measures via monetary and financial variables. This is a topic of special
interest in the ECB context, given the emphasis that it has traditionally placed on monetary analysis in
the formulation of monetary policy decisions.19 Yet many other central banks and commentators have
come to place renewed interest on monetary, credit and balance sheet developments as a consequence
of the financial crisis: we thus believe that the analysis is of more general interest.
While recognising that we are creating something of a ‘straw man’, for expositional purposes it is useful
to establish a benchmark for our discussion. This derives from the concerns expressed in some
quarters about the effectiveness of the transmission of the ECB’s non-standard measures to the
economy as a whole. In particular, doubts have surrounded whether the expansion of the monetary
base has ‘passed-through’ to stronger broad money and bank credit growth, as the traditional text book
‘money multiplier view of the world’ (discussed in Section 2) would imply.
As discussed above, this text book characterisation relies on the mechanical application of various
accounting identities to describe the interactions among central bank measures, bank behaviour, the
decisions of borrowers and lenders in the productive sectors, and the evolution of the real economy.
Our approach sets out to replace these accounting identities with a richer, behavioural view of how the
non-standard measures are transmitted through the financial sector to the real economy, and ultimately
to longer-term price developments. It offers a lens to understand this transmission process, taking an
empirical view of the behaviour of banks, borrowers and money holders.
Taking this perspective, an entirely different view of the impact of the Eurosystem’s non-standard
measures emerges. On the basis of the discussion in Section 3, this starts from the recognition that the
expansion of the monetary base reflects the ECB’s attempt to use central bank intermediation to
‘bridge the gap’ created by the freezing of the interbank money market and its impact on interbank
transactions, rather than a mechanism to expand bank balance sheets mechanically.
Viewed in this light, the Eurosystem’s non-standard measures aim at insulating monetary and credit
developments from the immediate impact of the financial crisis in the money market. Their success
should thus be evaluated on whether they prevented a disorderly deleveraging – associated with a
premature calling of outstanding bank loans and asset ‘fire sales’ – not on whether they induced an
immediate renewed expansion of bank credit equi-proportional to the expansion of the monetary base.
19 See: Fischer et al. (2009) and Papademos and Stark (2010) for discussions.
15
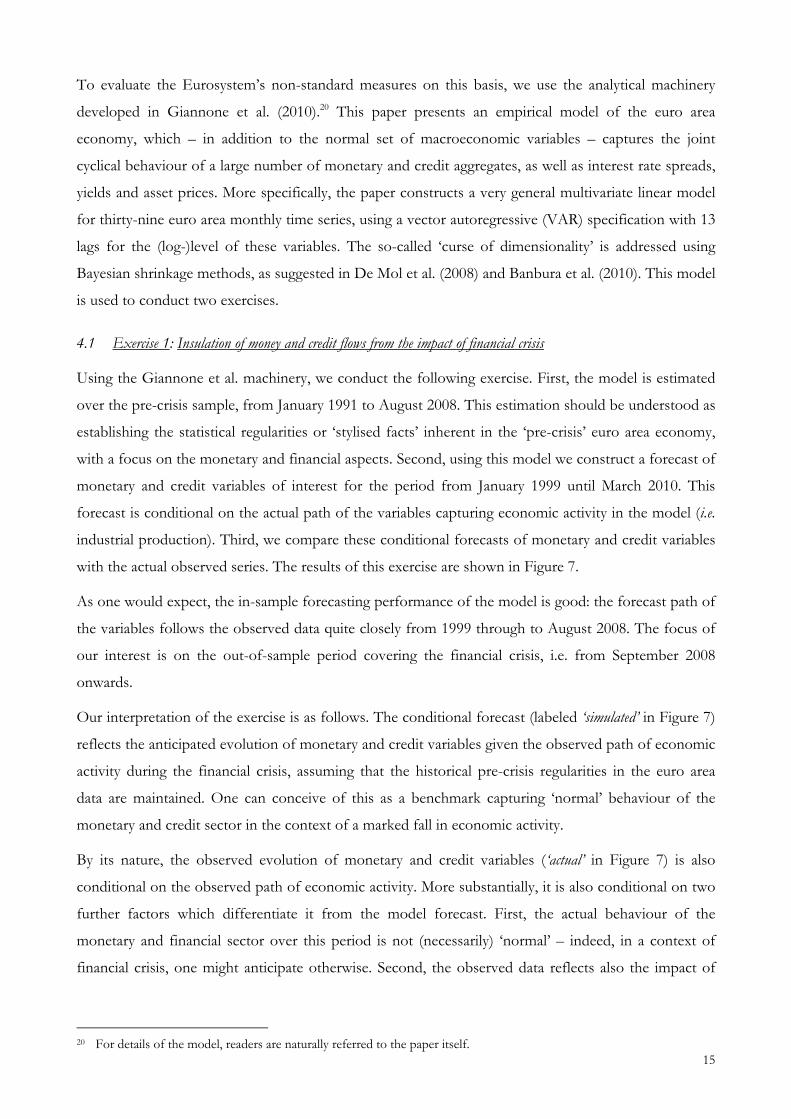
To evaluate the Eurosystem’s non-standard measures on this basis, we use the analytical machinery
developed in Giannone et al. (2010).20 This paper presents an empirical model of the euro area
economy, which – in addition to the normal set of macroeconomic variables – captures the joint
cyclical behaviour of a large number of monetary and credit aggregates, as well as interest rate spreads,
yields and asset prices. More specifically, the paper constructs a very general multivariate linear model
for thirty-nine euro area monthly time series, using a vector autoregressive (VAR) specification with 13
lags for the (log-)level of these variables. The so-called ‘curse of dimensionality’ is addressed using
Bayesian shrinkage methods, as suggested in De Mol et al. (2008) and Banbura et al. (2010). This model
is used to conduct two exercises.
4.1 Exercise 1: Insulation of money and credit flows from the impact of financial crisis
Using the Giannone et al. machinery, we conduct the following exercise. First, the model is estimated
over the pre-crisis sample, from January 1991 to August 2008. This estimation should be understood as
establishing the statistical regularities or ‘stylised facts’ inherent in the ‘pre-crisis’ euro area economy,
with a focus on the monetary and financial aspects. Second, using this model we construct a forecast of
monetary and credit variables of interest for the period from January 1999 until March 2010. This
forecast is conditional on the actual path of the variables capturing economic activity in the model (i.e.
industrial production). Third, we compare these conditional forecasts of monetary and credit variables
with the actual observed series. The results of this exercise are shown in Figure 7.
As one would expect, the in-sample forecasting performance of the model is good: the forecast path of
the variables follows the observed data quite closely from 1999 through to August 2008. The focus of
our interest is on the out-of-sample period covering the financial crisis, i.e. from September 2008
onwards.
Our interpretation of the exercise is as follows. The conditional forecast (labeled ‘simulated’ in Figure 7)
reflects the anticipated evolution of monetary and credit variables given the observed path of economic
activity during the financial crisis, assuming that the historical pre-crisis regularities in the euro area
data are maintained. One can conceive of this as a benchmark capturing ‘normal’ behaviour of the
monetary and credit sector in the context of a marked fall in economic activity.
By its nature, the observed evolution of monetary and credit variables (‘actual’ in Figure 7) is also
conditional on the observed path of economic activity. More substantially, it is also conditional on two
further factors which differentiate it from the model forecast. First, the actual behaviour of the
monetary and financial sector over this period is not (necessarily) ‘normal’ – indeed, in a context of
financial crisis, one might anticipate otherwise. Second, the observed data reflects also the impact of
20 For details of the model, readers are naturally referred to the paper itself.
16
the non-standard monetary policy measures by the Eurosystem, which – again, by their nature – are
not part of the ‘normal’ regime of the pre-crisis regularities captured in the model.
We assume – not unreasonably in our view, given the narrative offered in Section 3 – that the
behaviour of the euro area banking system, and thus the evolution of monetary and credit variables,
was influenced by the financial crisis. Other things equal, this would point to a divergence of the actual
and simulated paths of these variables shown in Figure 7. But other things are not equal, in particular
along one dimension. The actual paths also include the impact of the Eurosystem’s non-standard
measures. Divergence between the actual and simulated paths can thus be interpreted as a measure of
the extent to which the introduction of non-standard measures failed to offset the impact of the
financial crisis on the banking sector, resulting in an overall (‘reduced form’) impact on money and
credit growth and their relationship with other macroeconomic variables. And, by the same token,
similar actual and simulated paths can be seen as evidence of the success of the non-standard measures
in insulating macroeconomic monetary and credit dynamics from the impact of the financial crisis on
financial institutions and markets; that is, the extent to which they avoided the failures of the Federal
Reserve in the early 1930s identified by Friedman and Schwartz.
Inspection of Figure 7 gives rise to the following conclusions.
First, the observed behaviour of narrow money (M1) after the collapse of Lehman Brothers is not
statistically distinguishable from the model’s conditional forecast. This reflects the strong liquidity
effect driving the behaviour of M121 – the sharp fall in short-term interest rates both observed in the
data and predicted by the model (given the contraction of real activity) gives rise to stronger demand
for the overnight deposits and currency comprising M1. By implication, conditional on the
introduction of non-standard monetary policy measures, the onset of financial crisis does not appear to
have weakened the liquidity effect found in the pre-crisis data. The availability of short-term monetary
liquidity to the non-financial sector was therefore not impaired by the crisis itself. At a minimum, runs
on retail overnight deposits – characteristic of the 1931 financial crisis in the United States, as discussed
briefly in Section 2 – were successfully avoided during the recent episode.
Second, in general the behaviour of credit variables has followed a path consistent with the pre-crisis
regularities captured by the Giannone et al. model. In particular, the observed evolution of short-term
loans to the non-financial corporate sector – a credit component that is seen as particularly crucial at
times of economic distress, given its buffering role in corporate cash flows – also closely mimics that
which would have been anticipated by the model in the event of a sharp fall in economic activity. This
21 The analysis presented in Giannone et al. (2010) shows that the effect of a monetary policy shock on euro area M1 is
large and persistent in normal (‘pre-crisis’) times, i.e. there is a strong liquidity effect. In the exercise presented in Figure 7, the underlying structural shock is not identified. Nonetheless, we find that M1 behaves during the crisis period as expected by the model conditionally on the cycle. This suggests that there was no change in the liquidity effect. This view is supported by the analysis of Lenza et al. (2010) presented below.

17
Figure 7: Comparison of outturns with conditional forecasts in Giannone et al model annual percentage change, seasonally adjusted; 68% confidence intervals
Short-term loans to non-financial corporations
-30
-25
-20
-15
-10
-5
0
5
10
15
20
25
Jan-96 Jan-98 Jan-00 Jan-02 Jan-04 Jan-06 Jan-08 Jan-10
-30
-25
-20
-15
-10
-5
0
5
10
15
20
25
Simulated
Actual
Loans to households for house purchase
-10
-5
0
5
10
15
Jan-96 Jan-98 Jan-00 Jan-02 Jan-04 Jan-06 Jan-08 Jan-10
-10
-5
0
5
10
15
Simulated
Actual
M3
-5
0
5
10
15
20
Jan-96 Jan-98 Jan-00 Jan-02 Jan-04 Jan-06 Jan-08 Jan-10
-5
0
5
10
15
20
Simulated
Actual
Long-term loans to non-financial corporations
-30
-25
-20
-15
-10
-5
0
5
10
15
20
25
Jan-96 Jan-98 Jan-00 Jan-02 Jan-04 Jan-06 Jan-08 Jan-10
-30
-25
-20
-15
-10
-5
0
5
10
15
20
25
Simulated
Actual
Loans to households for consumption
-10
-5
0
5
10
15
Jan-96 Jan-98 Jan-00 Jan-02 Jan-04 Jan-06 Jan-08 Jan-10
-10
-5
0
5
10
15
Simulated
Actual
M1
-5
0
5
10
15
20
Jan-96 Jan-98 Jan-00 Jan-02 Jan-04 Jan-06 Jan-08 Jan-10
-5
0
5
10
15
20
Simulated
Actual
19
again supports the view that the Eurosystem’s non-standard monetary policy measures were effective
in supporting financial intermediation and maintaining monetary policy transmission.
Long-term loans to firms appear are more significantly affected (in both economic and statistical
senses) by the financial crisis, especially from the middle of 2009. While prima facie this raises some
doubts about the effectiveness of the non-standard measures, one possible explanation is a shift out
of longer-term bank borrowing to the issuance of debt securities by large euro area companies.
Taking a broader view of the corporate balance sheet rather than focusing solely on bank loans is an
important future extension to analysis within this framework. Turning to the household sector, we
again see that observed loan growth was weaker (in a statistically significant sense) than the model
would have predicted, both for house purchase and for consumption. That said, at least for housing
loans, the observed dynamic pattern is similar to that anticipated by the model with both actual and
simulated series showing a recovery from mid-2009 onwards.
Where the biggest deviation between actual and simulated paths emerges is in the evolution of M3
growth. Part of the explanation of this discrepancy comes from the model’s failure to explain the
observed evolution of the slope of the yield curve during the financial crisis. The slope of the yield
curve is an important determinant of M3 behaviour in the Giannone et al. model. The significant
steepening of the yield curve during the financial crisis (as short-term rates were cut aggressively
from October 2008 on) is not well-captured by the model simulation (which would have foreseen
long and short-term rates falling by more similar amounts): therefore, the model anticipates less
substitution out of monetary assets prompted by higher returns available on longer maturity non-
monetary assets. Yet this feature alone cannot fully explain the unanticipated weakness of M3 growth
observed during the financial crisis. Developing a better understanding of the behaviour of M3 both
in the lead up to and during the financial crisis is an important issue for future study.
This final observation poses a number of interesting and potentially important questions. In seeking
behaviour that differs from pre-crisis historical regularities, our analysis focuses attention on the
liability side of bank balance sheets, rather than the asset side. In consequence, one might ask – in
contrast with much of the existing literature – whether the propagation of the 2007-10 financial crisis
should be seen as via a ‘bank funding crunch’, rather than as a ‘bank credit crunch’. Equally, one
might ask whether offering to provide greater central bank intermediation through the introduction
of non-standard monetary policy measures has led to a switch from traditional deposit sources of
funding to reliance (and potentially dependence) on central bank facilities. More generally, the
analysis suggests that, conditional on developments in the real economy, the interaction between the
financial and non-financial sectors was in line with historical regularities. In seeking explanations for

20
the financial crisis, one may therefore focus on frictions within the financial sector in the manner
suggested by Gertler and Karadi (2009), rather than between the financial and non-financial sectors.22
All these issues entail connections to the narrative discussion of the design and implementation of
non-standard monetary policy measures in Section 3. Ideally, we would endeavour to test some of
the implications of this narrative discussion in a more structured way. But such an approach requires
identification of the structural shocks driving the behaviour of the data, which – as already
mentioned – poses significant practical challenges. This is therefore left for further work. Such work
would need to start with the development of a model of bank behaviour in the money market, which
could provide a theoretical basis for making identifying assumptions. Against this background, the
results described above should be characterised as a set of ‘stylised facts’ for the crisis sample. If it is
to be considered an empirically plausible framework to address the underlying substantial questions,
any theoretical model should be able to replicate these data regularities.
4.2 Exercise 2: Effect of spreads on monetary and credit variables
To complement the exercise discussed above and relate the results back to the money multiplier
discussion in Section 2, we also briefly recall and comment upon the analysis presented in Lenza et
al. (2010). Since the details of that exercise are discussed at length in the paper itself, here we simply
sketch the main elements of the approach.
The analysis derives from the impact of non-standard measures on money market interest rate
spreads, which was described briefly at the end of Section 3. (One aspect of) the effect of non-
standard measures is quantified by tracing the implications of changes in these spreads on monetary
and financial variables through the Giannone et al. model. In other words, the analysis assumes that
the financial sector continues to behave more or less in line with pre-crisis regularities captured by
the model23 and evaluates how the impact of non-standard measures on money market spreads
influences other macroeconomic variables. Moreover, by construction the exercise explores only one
channel of transmission, namely via interest rate spreads. Effects operating through confidence or
other channels are neglected, and may (substantially) augment the impact of the non-standard
measures on the real economy and financial system.
22 Note that this statement should not be read as suggesting that frictions between the financial and non-financial
sectors are negligible or unimportant. On the contrary, the information content of money and credit flows rests on the existence of such frictions. The relevant point here is that such frictions between the financial and non-financial sectors exert influence at all times: in seeking explanations of the crisis, one needs to identify frictions that became more important at the onset of the crisis. In this respect, our analysis suggests that intra-financial sector frictions – and thus heterogeneity within the financial sector – may have a more important role to play.
23 Note we assume that the crisis did affect the behaviour of the financial sector, but we also assume that the non-standard measures introduced by the Eurosystem served to offset this impact (at least with regard to the expansion of loans by banks), conditional on developments in real activity. The assumption that the economy behaves in line with pre-crisis regularities is thus consistent with – indeed, draws upon – the previous exercise described in Section 4.1.

21
More precisely, two conditional forecasts are constructed on the basis of the model: one based on
the observed path of money market spreads (which is labeled the ‘policy scenario’ (P) since it
incorporates the effects of the non-standard measures) (EA(L)(Xt…T│ X0…t-1; P)), and the other based
on the levels of spread observed immediately after the failure of Lehman (which is labeled the ‘no
policy scenario’ (NP) since it is intended to capture the effect of the financial shock coming from
Lehman if this had not been offset by a policy response) (EA(L)(Xt…T│ X0…t-1; NP)). The impact of
the non-standard measures is then quantified as the difference between these two conditional
forecasts, i.e.
Impactns = EA(L)(Xt…T│ X0…t-1; P) - EA(L)(Xt…T│ X0…t-1; NP)
As described in Lenza et al., the spread assumptions differ between the two scenarios along three
dimensions: (a) the spread between EURIBOR and OIS rates at 3 month maturity (see Figure 3); (b)
the spread between the EONIA and the ECB’s MRO rate (see Figure 5); and (c) the spread between
the 1-year and 1-month EURIBOR (capturing the slope of the money market yield curve, which was
influenced by the conduct of the 12-month LTROs in the second half of 2009).
Figure 8 reproduces the results of this exercise that are relevant for the discussion here. These are
based on different paths from the spread starting from October 2008 (i.e. at the Lehman failure) and
show the impact of spread effects through end-2012. Focusing exclusively on these money market
spread-related effects allows a number of complementary observations to be made. First, overall the
results from this exercise are consistent with the view that non-standard measures supported the
growth of bank loans, even though the impact differed between households and corporations, and
was non-monotonic in the latter case.24 At the same time, these results caution against interpreting
month-to-month evolution of sectoral loan data as an indicator of the success of non-standard
measures in real time: given differences in impact across sectors and over time, a more medium-term
perspective is required for the assessment to be meaningful. Second, the results suggest that the non-
standard measures leant (modest) support to real activity and employment, even if this was not
sufficient to offset the significant macroeconomic shocks associated with the onset of financial crisis.
Third – and most relevantly for the discussion in this chapter – the exercise demonstrates that, even
while non-standard measures supported loan growth and the expansion of narrow money M1, they
had only a very modest (and non-monotonic) effect on the evolution of the broad monetary
aggregate M3.
24 As shown in Figure 8, the spread related impact of non-standard measures on short-term loans to non-financial
corporations and unemployment is negative (and thus perverse) in the short run, reflecting the lagged responses to monetary policy shocks reported in Giannone et al. (2010).

22
Figure 8: Impact of spread effects of non-standard measures in Lenza et al.
differences in annual growth rates between P and NP scenarios, percentage points, seasonally adjusted
Short-term loans to non-financial corporations
-5
-4
-3
-2
-1
0
1
2
3
4
Jan-07 Jan-08 Jan-09 Jan-10 Jan-11 Jan-12
-5
-4
-3
-2
-1
0
1
2
3
4
Industrial production
-2
-1
0
1
2
3
Jan-07 Jan-08 Jan-09 Jan-10 Jan-11 Jan-12
-2
-1
0
1
2
3
M3
-1
-0.5
0
0.5
1
1.5
2
2.5
3
Jan-07 Jan-08 Jan-09 Jan-10 Jan-11 Jan-12
-1
-0.5
0
0.5
1
1.5
2
2.5
3
Loans to households for house purchase
0
0.2
0.4
0.6
0.8
1
1.2
1.4
1.6
Jan-07 Jan-08 Jan-09 Jan-10 Jan-11 Jan-12
0
0.2
0.4
0.6
0.8
1
1.2
1.4
1.6
Unemployment
-0.8
-0.6
-0.4
-0.2
0.0
0.2
Jan-07 Jan-08 Jan-09 Jan-10 Jan-11 Jan-12
-0.8
-0.6
-0.4
-0.2
0.0
0.2
M1
-2
-1
0
1
2
3
4
Jan-07 Jan-08 Jan-09 Jan-10 Jan-11 Jan-12
-1.5
-0.5
0.5
1.5
2.5
3.5

22
Recall that the Eurosystem’s non-standard measures were associated with a strong increase in the
monetary base. More precisely, high-powered money expanded by slightly more than 20% in the
months after the failure of Lehman. By contrast, from the analysis summarised by the charts in
Figure 8, the measures appear to have little impact on broad money M3, which – even at its
maximum – only increases by 1% relative to the baseline in the model exercise. As a result, the
money multiplier falls significantly.
Using Figure 8, one can argue that non-standard measures were supportive of credit and economic
activity, notwithstanding the absence of stronger broad money growth. The richer understanding of
the joint dynamic interactions among monetary and financial variables and the real economy offered
by the Giannone et al. model demonstrates that non-standard measures can be successful (at least
through the specific money market spread-related effects analysed in this exercise) even if they do
not lead to an expansion of broad money that is equi-proportional to the expansion of high-powered
money associated with the implementation of those measures. In short, a deeper empirical and
behavioural view of financial intermediation that that reflected in the traditional text book money
multiplier model helps to develop a better understanding of the impact of non-standard measures.
The Giannone et al. framework for monetary analysis represents an important advance in that
direction.
5. Concluding remarks
Understanding the macroeconomic impact of non-standard monetary policy measures during the
recent financial crisis is a challenging task. Against the background of experiences during the Great
Depression analysed in detail by Friedman and Schwartz, we have argued that an important element
in quantifying this impact is to explore the interaction of non-standard measures with financial
intermediation, especially through the banking sector. This requires development of a framework to
relate bank balance sheets (or, equivalently, monetary and credit aggregates) to monetary policy
actions (and thus developments on the central bank balance sheet).
Existing text book models of this relationship in the money multiplier tradition are clearly
inadequate. This assertion has been amply illustrated in the narrative presented in this chapter. Yet
theoretical modeling has not advanced sufficiently to offer an adequate replacement. In line with the
ECB’s regular monetary analysis, we have therefore adopted an empirical approach: identifying
regularities in the pre-crisis data and using these as a benchmark against which to make a real time
empirical assessment of the evolution of money, credit, bank behaviour and their impact on the
macroeconomy during the financial crisis. Such considerations are of special relevance in the euro
area, given the bank-centred structure of the financial system.

23
The results of our analysis are preliminary and multifaceted. It would therefore be misleading to draw
definitive or sharp conclusions, especially at this early stage when non-standard measures are still in
place and financial tensions persist. Nonetheless, a number of observations about the impact of the
Eurosystem’s non-standard measures can still be made.
First, we have found evidence that non-standard measures did support financial intermediation,
credit expansion and economic activity in the euro area in the face of financial crisis. They were
successful in that sense.
Second, we have shown that such support is possible even in an environment where the expansion
of the monetary base associated with the implementation of non-standard measures does not lead to
an equi-proportional (or indeed any) expansion in broad money. This both illustrates the weakness of
the money multiplier model – which would see such an expansion of broad money as key – and
points to a need for further work to understand better the behaviour of the banking system and its
interaction with the real economy. In particular, we view the impact of heterogeneity within the
financial sector as a crucial element in explaining recent developments.
In sum, we interpret our results as offering evidence in support of the view that the introduction of
non-standard measures has supported the availability of monetary liquidity to the non-bank private
sector and flow of bank loans to households and, especially, corporations – resulting in an outcome
that largely mimics what would have been anticipated in the face of the observed sharp fall in
economic activity were the financial sector to be functioning normally. Since many concerns
surrounding the impact of financial crisis stem from worries about a ‘credit crunch’ and drying up of
bank loan supply, this evidence offers a favourable view of the non-standard measures.
Yet the measures appear less successful in supporting the dynamics of broad money, which is usually
seen as having a relationship with macroeconomic stability over longer horizons. Should the impact
of the financial crisis be prolonged and broad money exhibit a persistent abnormal weakness, this
would be a cause for concern. However, since such persistent weakness is more likely to be
symptomatic of structural weaknesses in the financial sector (e.g. underlying solvency problems,
governance issues and inefficiencies), the scope for the non-standard monetary policy measures
discussed here to manage such concerns may be limited. Thoroughgoing financial reform – involving
bank recapitalisations, restructuring of the financial sector and improved regulation and supervision –
are the more relevant mechanisms to address such underlying weaknesses.
Experience in recent years demonstrates the potentially powerful stabilising effects of non-standard
monetary policy measures. But the limits of such measures also need to be recognised and respected.

24
References
Banbura, M., D. Giannone, and L. Reichlin (2010). “Large Bayesian VARs,” Journal of Applied Econometrics 25(1), pp. 71-
92.
Bernanke, B.S. (1983). “Non-monetary effects of the financial crisis in the propagation of the Great Depression,”
American Economic Review 73(3), pp. 257-76.
Borio, C. and P. Disyata (2009). “Unconventional monetary polices: An appraisal,” BIS working paper no. 292.
Christiano, L.J., R. Motto and M. Rostagno (2003). “The Great Depression and the Friedman-Schwartz hypothesis,”
Journal of Money, Credit and Banking 35(6), pp. 1119-98.
Cùrdia, V. and M. Woodford (2010). “The central bank balance sheet as an instrument of monetary policy,” Carnegie-
Rochester Series on Public Policy, forthcoming.
De Mol, C., D. Giannone, and L. Reichlin (2008). “Forecasting using a large number of predictors: Is Bayesian regression
a valid alternative to principal components?” Journal of Econometrics 146(2), pp. 318-328.
Fischer, B., M. Lenza, H. Pill and L. Reichlin (2009). “Monetary analysis and monetary policy in the euro area,” Journal of
International Money and Finance 28(7), pp. 1138-1164.
Friedman, M. and A.J. Schwartz (1963). A monetary history of the United States, Princeton University Press.
Gagnon, J., M. Raskin, J. Remache and B. Sack (2010). “Large-scale asset purchases by the Federal Reserve: Did they
work?” FRB New York staff report no. 441.
Gertler, M. and P. Karadi (2009). “A model of unconventional monetary policy,” New York University (available at
http://www.econ.nyu.edu/user/gertlerm/gertlerkaradiapril2010conference.pdf).
Giannone, D., M. Lenza and L. Reichlin (2010). “Money, credit, monetary policy and the business cycle in the euro area,”
ECB (available at http://www.ecb.int/events/conferences/html/moneymechanism.en.html).
Goodhart, C.A.E. (2010). “Money, credit and bank behaviour: Need for a new approach,” National Institute Economic
Review, forthcoming.
Gorton, G.B. and A. Metrick (2009). “Securitized banking and the run on repo,” Yale ICF working paper no. 09-14.
Heider, F., M. Hoerova and C. Holthausen (2009). “Liquidity hoarding and interbank market spreads: The role of
counterparty risk,” ECB working paper no. 1126.
Joyce, M., A. Lasaosa, I. Stevens and M. Tong (2010). “The financial market impact of quantitative easing,” Bank of
England working paper no. 393.
Kozicki, S., E. Santor and L. Suchanek (2010). “Central bank balance sheets and long-term forward rates,” in this
volume.
Lenza, M., H. Pill and L. Reichlin (2010). “Monetary policy in exceptional times,” Economic Policy 62, pp. 295-339.
Meltzer, A.H. (2007). A history of the Federal Reserve, vol. 1, Chicago University Press.
Papademos, L. and J. Stark (eds.) (2010). Enhancing monetary analysis, Frankfurt: European Central Bank.
Rasche, R.H. (1987). “M1 velocity and money demand functions: Do stable relationships exist?” Carnegie-Rochester
Conference Series on Public Policy 17, pp. 9–88.

25
Trichet, J-C. (2009). “The ECB’s enhanced credit support,” Address at the University of Munich annual symposium,
http://www.ecb.europa.eu/press/key/date/2009/html/sp090713.en.html.