non-staff model medical rfp results for plan year effective 1/1/2014
56
NON-STAFF MODEL MEDICAL RFP RESULTS FOR PLAN YEAR EFFECTIVE 1/1/2014 CITY OF LOS ANGELES JUNE 3, 2013
Transcript of non-staff model medical rfp results for plan year effective 1/1/2014

NON-STAFF MODEL MEDICAL RFP RESULTS FOR PLAN YEAR EFFECTIVE 1/1/2014 CITY OF LOS ANGELES JUNE 3, 2013

NON-STAFF MODEL MEDICAL RFP RESULTS FOR PLAN YEAR E FFECTIVE 1/1/2014
CITY OF LOS ANGELES
MERCER g:\group\client\cityla\2013\rfps\medicalrfpnonstaffresults\analysis\coflamedrfpreport012014v3-1.doc
i
CONTENTS
1. Executive Summary ..................................................................................................................................................................................1 • Financial Summary ............................................................................................................................................................................3 • Overall scoring ...................................................................................................................................................................................4 • Considerations ...................................................................................................................................................................................6
2. Marketing Overview...................................................................................................................................................................................7 • Process ..............................................................................................................................................................................................7 • Contents ............................................................................................................................................................................................7 • RFP Submissions ..............................................................................................................................................................................8 • Response to Options ..........................................................................................................................................................................9
3. Evaluation Results .................................................................................................................................................................................. 10 • Overview .......................................................................................................................................................................................... 10 • Rating Method .................................................................................................................................................................................. 10
4. Financial Marketing Results .................................................................................................................................................................... 13 • Rate Guarantees (Rate Caps) .......................................................................................................................................................... 13 • Participating vs. Non-participating Contract ...................................................................................................................................... 14 • Funding Agreements ........................................................................................................................................................................ 15 • Performance Guarantees ................................................................................................................................................................. 17 • Health Care Reform Fees ................................................................................................................................................................ 18 • Additional Health Care Reform Requirements .................................................................................................................................. 19 • Financial Results .............................................................................................................................................................................. 20 • HMO Benefit Pricing Options ........................................................................................................................................................... 25 • PPO Benefit Pricing Options ............................................................................................................................................................ 29

NON-STAFF MODEL MEDICAL RFP RESULTS FOR PLAN YEAR E FFECTIVE 1/1/2014
CITY OF LOS ANGELES
MERCER g:\group\client\cityla\2013\rfps\medicalrfpnonstaffresults\analysis\coflamedrfpreport012014v3-1.doc
ii
5. Quality, Service, and Provider Disruption ................................................................................................................................................ 31 • Quality - NCQA ................................................................................................................................................................................ 31 • Quality - State of California HMO Report Card ................................................................................................................................. 33 • Quality - Board Certification ............................................................................................................................................................. 35 • Quality - Member Engagement Employee Self-Service and Decision Support Tools........................................................................ 35 • Quality - Wellness Initiative and Innovations .................................................................................................................................... 36 • Service - Claims Administration........................................................................................................................................................ 38 • Service – Customer Services Center Operations ............................................................................................................................. 39 • Access - GeoAccess Network Analysis ............................................................................................................................................ 40 • Access - PPO provider and HMO PCP Provider Group Disruption ................................................................................................... 42 • PPO Provider Disruption Results ..................................................................................................................................................... 42 • HMO Inpatient Hospital Disruption Results ...................................................................................................................................... 46 • Access - Status of provider groups ................................................................................................................................................... 48
6. Appendix A .............................................................................................................................................................................................. 50

NON-STAFF MODEL MEDICAL RFP RESULTS FOR PLAN YEAR E FFECTIVE 1/1/2014
CITY OF LOS ANGELES
MERCER g:\group\client\cityla\2013\rfps\medicalrfpnonstaffresults\analysis\coflamedrfpreport012014v3-1.doc
1
1 Executive Summary The non-staff model RFP had four respondents: Anthem, Blue Shield, Health Net, and UHC. Health Net did not pass the Level One review (preliminary review of proposal completeness and completion of required documentation) and was therefore not included in the Level Two review (RFP response evaluation) detailed in this report. Two large national carriers, Aetna and CIGNA, did not quote on the City benefits for 2014. The enrollment used to derive premiums is based upon the full time employees. Aggregate pricing between Anthem and UHC was relatively close while Blue Shield proposed premiums significantly lower than the others. All proposed pricing for 2014 included Healthcare Reform (HCR) fees that added a significant cost to the overall premiums. Annual HCR fees added approximately $3.99M to $4.38M or a load of about 3.5%-3.6% of premium The overall medical renewal premium from Anthem is a $12.85 million increase from 2013 or +11.7% including Healthcare Reform (HCR) Fees. Without HCR fees the renewal is an increase of $8.57 million or +7.8%. The UHC RFP financial offer for status quo benefits was an increase of $11.05 million or +10.1% over current with HCR fees included. Without HCR fees UHC’s offer is $6.68 million or +6.1% from the current Anthem Cost. UHC did offer a 2nd year rate cap of 9.0% on the narrow network HMO and 13% on the PPO. Rate caps do not include fees associated with HCR. UHC’s narrow network HMO would have about 13.4% member disruption over the current Anthem Select HMO. The Blue Shield RFP financial offer was an increase of $2.03 million or +1.8% over current with HCR fees included. Without HCR fees the Blue Shield offer is -$1.96 million or -1.8% from the current Anthem Cost. The Blue Shield offer is about $10.8 million lower than Anthem’s quote and included a 2nd year rate cap of 9.9%. Rate caps do not include fees associated with HCR. Blue Shield’s price point is very aggressive and a much greater spread from other quoting carriers than their prior RFP submission. Blue Shield’s narrow network HMO

NON-STAFF MODEL MEDICAL RFP RESULTS FOR PLAN YEAR E FFECTIVE 1/1/2014
CITY OF LOS ANGELES
MERCER g:\group\client\cityla\2013\rfps\medicalrfpnonstaffresults\analysis\coflamedrfpreport012014v3-1.doc
2
would have about 12.6% member disruption over the current Anthem Select HMO. Cedars and UCLA are not part of the Blue Shield full HMO network. Vendors were asked to quote on various options along with specific plan design requested. In light of the City’s move to a narrow network HMO for plan year 2013, there are no other significant savings other than moving to Blue Shield or utilizing a narrow network PPO product - Anthem was the only vendor to quote this option. During the transition from 2012 to 2013, Anthem had 345 HMO and 84 PPO members move to Kaiser. Kaiser had 60 employees move to the Anthem narrow network and 60 employees move to the Anthem PPO. There are some savings generated through plan design changes which increase employee cost sharing. Changing the plan providers, networks or plan design will cause changes to the premium rates, plan utilization and member disruption. Some of the disadvantages of implementing plan changes can be mitigated and will be addressed in this report. During vendor interviews with the RFP raters, all respondents indicated that they would not recommend moving back to the full HMO network. Kaiser was the only vendor that responded to the Staff model RFP. The Kaiser increase including HCR is $10.87 million or 7.9%. The Kaiser per capita cost and family rate are still higher than those of Anthem. Plan 2013 Per Capita 2014 Per Capita 2013 Family Rate 20 14 Family Rate
Anthem Narrow Network $927.24 $1,037.10 $1,176.40 $1,315.71
Kaiser $1,011.45 $1,091.07 $1,305.86 $1,408.68
Difference $ $84.21 $53.97 $129.46 $92.97
Difference % 9.1% 5.2% 11.0% 7.1%

NON-STAFF MODEL MEDICAL RFP RESULTS FOR PLAN YEAR E FFECTIVE 1/1/2014
CITY OF LOS ANGELES
MERCER g:\group\client\cityla\2013\rfps\medicalrfpnonstaffresults\analysis\coflamedrfpreport012014v3-1.doc
3
Financial Summary The following is a summary of the financial offers for the options requested in the RFP. The enrollment used to derive premiums is based upon the full time employees. Requested Options Observations – Premiums reflect t he inclusion of HCR fees
Option A – Narrow Network HMO (Status Quo)
Keep existing number of HMOs(HMO Narrow Network along side a HMO Full Network) and PPO (Full Network)
Total Health Plan Premium Low $2.0 million 1.8% to $12.8 million 11.7%
Anthem HMO and PPO @ $12.849 million 11.7%, HMO member disruption = 0%
Blue Shield HMO and PPO @ $2.031 million 1.8%, HMO member disruption = 12.6%
UHC HMO and PPO @ $11.051 million 10.1%, HMO member disruption = 13.4%
Option B Full Network HMO and PPO
Keep existing PPO (Full Network) option and replace HMO Narrow Network with a HMO Full Network option only (restore Full HMO)
Low $12.7 million 11.6% to $18.85 million 17.2%
Anthem HMO and PPO @$18.85 million 17.2%, HMO member disruption = 0%
Blue Shield HMO and PPO @$12.7 million 11.6%, HMO member disruption = 9.9%
UHC HMO and PPO $16.1 million 14.7%, HMO member disruption = 0.7%
Option C – PPO Narrow Network
Replace PPO (Full Network) with a PPO Narrow Network (high performance restrictive network)
Anthem was the only vendor to quote
Anthem PPO @$11.92 million 10.9%
Blue Shield PPO - did not quote
UHC PPO - did not quote
Option D – Tier Network
Replace HMO and/or PPO with a tiered network structure (plan has benefit structure where employees pay a different cost share for using different tiers of providers)
Low $12.86 million 11.7% to $13.17 million 12.0%
Anthem HMO and PPO @$13.17 million 12.0%, HMO member disruption = 0%
Blue Shield HMO and PPO – did not quote
UHC HMO and PPO @$12.86 million 11.7%, HMO member disruption = dependent on member utilization between provider tiers

NON-STAFF MODEL MEDICAL RFP RESULTS FOR PLAN YEAR E FFECTIVE 1/1/2014
CITY OF LOS ANGELES
MERCER g:\group\client\cityla\2013\rfps\medicalrfpnonstaffresults\analysis\coflamedrfpreport012014v3-1.doc
4
Requested Options Observations – Premiums reflect t he inclusion of HCR fees
Option E – Deductible HMO
Replace both HMOs with a deductible Full Network HMO with a $250 deductible; $3,000 person / $5,000 family OOP maximum; $15 OV copays; $10 generic / $20 brand non-formulary / $40 brand formulary Rx.
Low $1.83 million 1.7% to @$17.98 million 16.4%
Anthem HMO and PPO @$16.44 million 15.0%, HMO member disruption = 0%
Blue Shield HMO and PPO @$1.83 million 1.7%, HMO member disruption = 9.9%
UHC HMO and PPO @$17.98 million 16.4%, HMO member disruption = 0.7%
Note: UCLA and Cedars are currently not part of the Blue Shield full HMO or PPO networks. Overall scoring The RFP’s were evaluated by four raters (two Personnel Department, one County of Orange, one Aon, and one Mercer rater). The rating was based on the evaluation criteria reviewed by the JL-MBC and scores were averaged for all raters. HMO Scoring The overall scoring was close in most of the categories, except provider disruption. The provider disruption results had the largest spread, ranging from the max score of 30 and the lowest score of 21.5. Anthem and Blue Shield had the highest scores, 93.4 and 89.5 respectively, and the most viable options for the non-Kaiser plan offerings. All of the plans have very strong network service area coverage. Provider disruption for their narrow networks relative to the current Anthem Narrow network is about 13% for both Blue Shield and UHC. The plans have very similar member service tool functionality. On the quality component, the overall accreditation status from NCQA was commendable for the HMO. The CA Office of Patient Advocacy health plan report cards gave three stars to each vendor with respect to “HMO Ratings at a Glance”. The plans had similar wellness programs but varying degrees of financial support and structure around support and roll out of the programs. PPO Scoring The overall scoring was much closer than under the HMO plan where provider disruption had a larger impact on scoring. Provider disruption results for the PPO showed a narrower spread ranging from a max score of 30 and the lowest score of 27.7. Anthem and Shield again had the highest scores at 93.1 and 91.7, respectively. All other areas of evaluation resulted in similar scores and comments to the HMO portion of the RFP.
NON-STAFF MODEL MEDICAL RFP RESULTS FOR PLAN YEAR E FFECTIVE 1/1/2014
CITY OF LOS ANGELES
MERCER g:\group\client\cityla\2013\rfps\medicalrfpnonstaffresults\analysis\coflamedrfpreport012014v3-1.doc
5
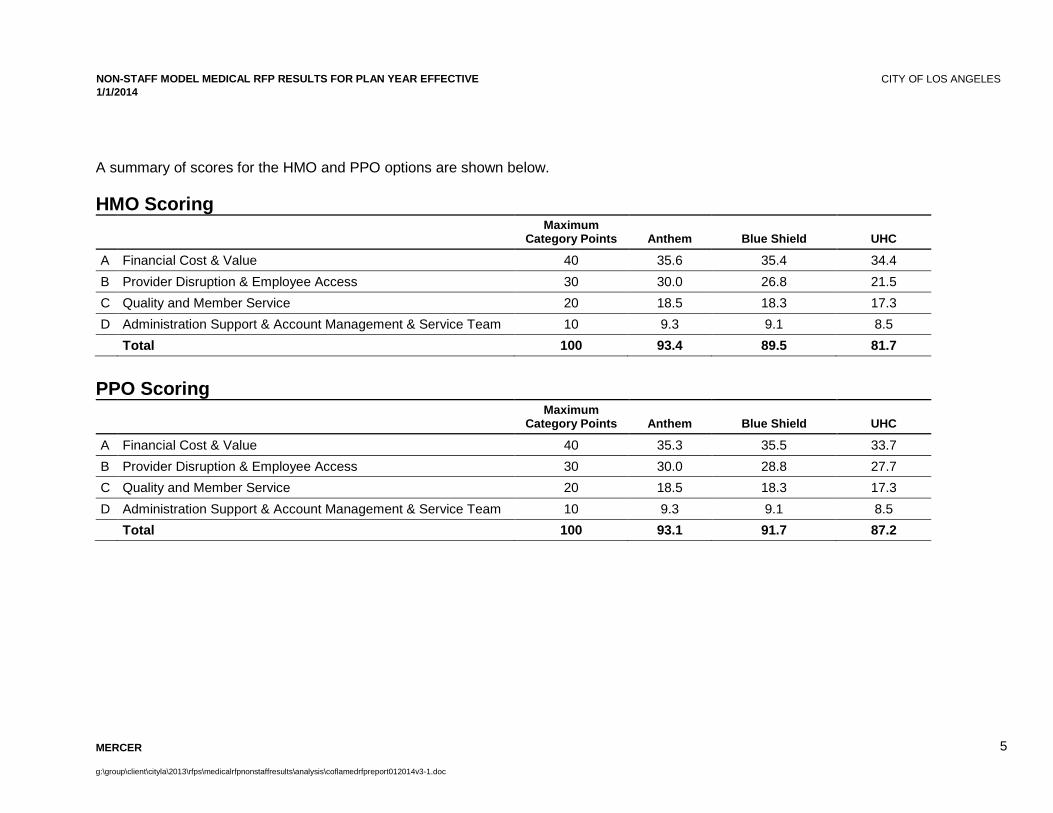
A summary of scores for the HMO and PPO options are shown below. HMO Scoring
Maximum
Category Points Anthem Blue Shield UHC
A Financial Cost & Value 40 35.6 35.4 34.4
B Provider Disruption & Employee Access 30 30.0 26.8 21.5
C Quality and Member Service 20 18.5 18.3 17.3
D Administration Support & Account Management & Service Team 10 9.3 9.1 8.5
Total 100 93.4 89.5 81.7
PPO Scoring
Maximum
Category Points Anthem Blue Shield UHC
A Financial Cost & Value 40 35.3 35.5 33.7
B Provider Disruption & Employee Access 30 30.0 28.8 27.7
C Quality and Member Service 20 18.5 18.3 17.3
D Administration Support & Account Management & Service Team 10 9.3 9.1 8.5
Total 100 93.1 91.7 87.2

NON-STAFF MODEL MEDICAL RFP RESULTS FOR PLAN YEAR E FFECTIVE 1/1/2014
CITY OF LOS ANGELES
MERCER g:\group\client\cityla\2013\rfps\medicalrfpnonstaffresults\analysis\coflamedrfpreport012014v3-1.doc
6
Considerations Based upon the review of the RFP and scoring, the Anthem program was scored the highest. The RFP responses provided some of options to minimize the healthcare costs increases further. If the City opts to consider additional savings opportunities, the following considerations are: • Changing the plan to Blue Shield and consider a non-participating contract
─ There may be significant budget increases for plan year 2016, after the second year rate cap. Seeking a rate cap for 2016 would help to delay a significant budget increase
─ UCLA and Cedars are not part of the full HMO network – which is the reason for providing a full network HMO option ─ There are some benefit and contractual provisions that would change, such as elimination of the $0 copy for children OV to age 5
• Changing office visit, emergency room, and pharmacy copays or adding hospital inpatient copays are additional design changes that can help reduce the premium increases
• Modify contributions to mitigate the impact of the premium increases In addition to the RFP structure scoring, there are some factors that should be considered in selecting a medical provider such as additional cost associated in a consolidation of plans or change of vendors ranging from: • Added communications around vendor change along with notifying about employees about exchanges • Changes in eligibility data feeds • Coordination of transition of care • Additional staff resources for contract close out and new contract negotiations • Additional net member migration to Kaiser which continues to have a higher cost structure

NON-STAFF MODEL MEDICAL RFP RESULTS FOR PLAN YEAR E FFECTIVE 1/1/2014
CITY OF LOS ANGELES
MERCER g:\group\client\cityla\2013\rfps\medicalrfpnonstaffresults\analysis\coflamedrfpreport012014v3-1.doc
7
2 Marketing Overview Process On February 14, 2013, Staff, with the assistance of Mercer and by request of the Joint Labor-Management Benefits Committee, sent a request for proposal for the civilian employees FLEX medical benefits. The purpose of the RFP was to verify competitiveness and evaluate alternatives to the current program. The deadline for response was 4:00 PM, Thursday April 15, 2013. The responses were sent to the Personnel Department at City Hall to the attention of Alex Basquez. Staff held an informational bidders conference on Thursday, March 7, 2013 in the Personnel Department conference room. Staff and Mercer provided background on the RFP and addressed questions from the carriers attending the meeting. Personnel Department Staff also provided instructions on how to complete the City contracting requirements portion of the RFP. Questions and answers were distributed to all meeting participants and posted online. All RFP raters also conducted an interview with each of the carriers that included discussions on rating methodology, Healthcare Reform fees, provider contracting, network disruption, transition care, and various other relevant issues. The interview provided an opportunity to meet with the carrier team and learn more about the how the team works. The interview was not separately scored. Contents The entire contents of the RFP were provided electronically through the City of Los Angeles – Business Assistance Virtual Network (LABAVN). Staff, with the assistance of Mercer, collected the pertinent information for the City contracting process and the benefits program that were being bid. Proposers were required to provide hard copies of the proposal and a copy of the proposal in Adobe PDF and Microsoft Word format on a USB flash drive, CD or DVD (original and redacted).

NON-STAFF MODEL MEDICAL RFP RESULTS FOR PLAN YEAR E FFECTIVE 1/1/2014
CITY OF LOS ANGELES
MERCER g:\group\client\cityla\2013\rfps\medicalrfpnonstaffresults\analysis\coflamedrfpreport012014v3-1.doc
8
The contents included the following: • City Portion
─ City Request for Proposal ─ Standard provisions and attachments ─ Flex benefits program information and sample communication pieces ─ Carrier contracts for current programs
• Mercer ─ Questionnaire ─ Census ─ Claims experience for Anthem ─ Historical rates and contributions ─ Rate, benefit charts and disruption analysis charts to complete
Overall feedback from the carriers was positive on both the structure content and completeness of the RFP. There were minimal questions for clarification. RFP Submissions Each of the incumbents responded to the RFP. Anthem, Blue Shield, Health Net and United Healthcare all responded. Health Net submitted a proposal but was disqualified during the Level One evaluation of the City’s contracting requirements.
Carrier Received RFP Attended Bidders Conference Re sponded to RFP Passed City
Requirements
Anthem Yes Yes Quoted Yes
Blue Shield Yes Yes Quoted Yes
Health Net Yes Yes Quoted No
UHC Yes Yes Quoted Yes

NON-STAFF MODEL MEDICAL RFP RESULTS FOR PLAN YEAR E FFECTIVE 1/1/2014
CITY OF LOS ANGELES
MERCER g:\group\client\cityla\2013\rfps\medicalrfpnonstaffresults\analysis\coflamedrfpreport012014v3-1.doc
9
Response to Options The following table shows the various options that each of the carriers responded to in the submission. Carrier Anthem Blue Shield UHC
Option A – Narrow Network HMO (Status Quo)
Keep existing number of HMOs(HMO Narrow Network along side a HMO Full Network) and PPO (Full Network))
Yes Yes Yes
Option B Full Network HMO and PPO
Keep existing PPO (Full Network) option and replace HMO Narrow Network with a HMO Full Network option only (restore Full HMO)
Yes Yes Yes
Option C – PPO Narrow Network
Replace PPO (Full Network) with a PPO Narrow Network (high performance restrictive network)
Yes No No
Option D – Tier Network
Replace HMO and/or PPO with a tiered network structure (plan has benefit structure where employees pay a different cost share for using different tiers of providers)
Yes No Yes – UHC offered three HMO networks that would be tiered based upon member contributions and not the copays based upon providers
Option E – Deductible HMO
Replace both HMOs with a deductible Full Network HMO with a $250 deductible; $3,000 person / $5,000 family OOP maximum; $15 OV copays; $10 generic / $20 brand non-formulary / $40 brand formulary Rx.
Yes Yes – Blue Shield does not have a true deductible HMO product. They would utilize separate copay structures for the IP facility.

NON-STAFF MODEL MEDICAL RFP RESULTS FOR PLAN YEAR E FFECTIVE 1/1/2014
CITY OF LOS ANGELES
MERCER g:\group\client\cityla\2013\rfps\medicalrfpnonstaffresults\analysis\coflamedrfpreport012014v3-1.doc
10
3 Evaluation Results Overview Vendors were required to duplicate the current plan design for the City’s active civilian FLEX plans and provide rates for different carrier replacement options on the non-Kaiser. In addition, vendors were asked to: • Provide options for a narrow/high performance network HMO and or PPO program • Provide benefit options for a full network HMO, a tiered HMO, and a deductible HMO • Price some copay plan design changes on the HMO office visits and Rx copay • Price some changes on the vision and ancillary benefits • Provide options that are new and innovative alternatives that help to improve quality and cost including wellness programs Rating Method The RFP responses were evaluated on the following categories and weightings: Table 3.1 Category Max Total Points
Financial Cost & Value - Reasonableness of costs to services and best overall value to City 40
Provider Disruption and Employee Access - Ability t o duplicate the current network and maximize employ ee access
30
Quality and Member Service – Demonstrated ability t o deliver high quality services and Wellness Progra ms to public agencies of similar size and/or scope
20
Administration Support and Account Management and S ervice Team – Ability to provide excellent administ ration support and proactive and highly responsive account management services
10
Total 100

NON-STAFF MODEL MEDICAL RFP RESULTS FOR PLAN YEAR E FFECTIVE 1/1/2014
CITY OF LOS ANGELES
MERCER g:\group\client\cityla\2013\rfps\medicalrfpnonstaffresults\analysis\coflamedrfpreport012014v3-1.doc
11
Financial Cost and Value The cost and value will be based upon the following components: • Premium rates and rate adequacy over the term of the contract • Rate assumptions used • Underwriting terms and conditions • Retention levels • Funding arrangement options • Multi-year rate guarantee or cost increase caps on outlying years • Performance Guarantees • Resource commitments to innovative ideas, programs, tools and or coverage that would improve quality and cost for health care
program • Firm’s financial position will be used as an indicator of the ability to provide the requested services over the full term of the contract • The organization’s size in the market for these services • Strong financial ratings from rating agencies Provider Disruption and Employee Access • HMO - Percent of employee experiencing disruption with Primary Care Physician (PCP) • HMO - Employee disruption by provider groups, facilities, hospitals, claims costs • PPO - Employee disruption with providers used based on the number of additional claims that would be considered out of network • PPO- Employee disruption based on number and dollar value of additional claims that would be considered out-of-network • Geo Access - Network access will be based upon network service area coverage Quality and Member Service • Quality and member services will be based upon the following components: • Ability to replicate RFP scope of services • Ability to implement the City's benefit eligibility definitions for employees and dependents • High quality of customer service for employees and dependents • Member service - customer service staffing, hours of operation, language assistance • Claims operations, appeals process, transition assistance • Self-service tools (provider/facility selection, education services, claim processing)

NON-STAFF MODEL MEDICAL RFP RESULTS FOR PLAN YEAR E FFECTIVE 1/1/2014
CITY OF LOS ANGELES
MERCER g:\group\client\cityla\2013\rfps\medicalrfpnonstaffresults\analysis\coflamedrfpreport012014v3-1.doc
12
• Wellness Programs and Wellness resource commitment • Disease Management Programs and other programs aimed at improving member health outcomes • Proposed wellness program is feasible based on City structure • Firm’s experience of providing high quality services to similar sized clients In addition to the above, information from the following sources will also be considered: Quality measure is a composite of different quality measures: NCQA Accreditation, Health Plan Employer Data and Information Set (HEDIS) results for California plans, State of California Office of Patient Advocate carrier report cards, and board certification. Services will be based upon claims administration, operations, and the self-serve tools available for members. This includes Web based tools that help in determining benefit levels, decision support, member education and provider/facility selection. Administration Support and Account Management and S ervice Team This section was evaluated based on the following components: • The level of applicable administrative support services will be considered (claims processing, member services, billing and eligibility,
contracts, enrollment, and firm’s business operation etc.) • Administrative services - open enrollment support, billing, and eligibility issues • Support services to City concerning utilization, data reporting, responding to employee complaints or services issues • The Account Management and Service Team evaluation will be based on the quality and quantity of staff assigned to the City account
necessary to deliver the services outlined in the scope of services. The provider disruption is based upon evaluating the vendors’ responses on their provider groups and facility networks in relation to those that City employees have utilized under the existing programs. Network access is based upon geographic service area coverage

NON-STAFF MODEL MEDICAL RFP RESULTS FOR PLAN YEAR E FFECTIVE 1/1/2014
CITY OF LOS ANGELES
MERCER g:\group\client\cityla\2013\rfps\medicalrfpnonstaffresults\analysis\coflamedrfpreport012014v3-1.doc
13
4 Financial Marketing Results Aggregate pricing between Anthem and UHC was relatively close while Blue Shield proposed premiums significantly lower than the others. All proposed pricing for 2014 included Healthcare Reform (HCR) fees that added a significant cost to the overall premiums. Annual HCR fees added approximately $3.99M to $4.38M or a load of about 3.5%-3.6% of premium The overall marketing results for the non-Kaiser plans provide a viable option to the Anthem renewal. The experience that the market received was through 2012, which reflected Anthem’s full network. Blue Shield’s offer reflects significant financial savings. Their rate development does include higher expenses than those of Anthem and UHC. This is offset by other factors which reflect their assumptions of having more efficient contractual provider arrangements and utilization controls than Anthem along with a significant credit for their narrow network, over the Anthem full network. Blue Shield also utilized lower pricing trends in their projection than Anthem and UHC. Blue Shield has fewer full risk arrangements with provider groups that put the provider group more at risk for facility cost in addition to physician cost, than both Anthem and UHC. Rate Guarantees (Rate Caps) Carriers quoted rates that are guaranteed for twelve months effective January 1, 2014 and renewable for a minimum of 12 months for subsequent periods. Blue Shield and UHC provided rate caps for the January 1, 2015 renewal. Anthem did not provide rate caps or caps on renewal components such as trend, admin, etc.
• Anthem did not provide any rate caps or guarantees Anthem did provide the documentation for the rate development • Blue Shield is willing to cap the HMO and PPO at 9.9%. Rate caps do not include fees associated with HCR. This assumes no
changes to plan design, contributions or significant shifts in enrollment. Blue Shield did provide the documentation for the rate development

NON-STAFF MODEL MEDICAL RFP RESULTS FOR PLAN YEAR E FFECTIVE 1/1/2014
CITY OF LOS ANGELES
MERCER g:\group\client\cityla\2013\rfps\medicalrfpnonstaffresults\analysis\coflamedrfpreport012014v3-1.doc
14
• UHC is willing to cap the Narrow Network HMO renewal increase at 9.0% and the PPO at 13%. Rate caps do not include fees associated with HCR. This assumes no changes to plan design, contributions or significant shifts in enrollment. UHC did provide the documentation for the rate development
Participating vs. Non-participating Contract The current medical programs are insured participating contracts (except Kaiser). They are insured in that the City pays fixed monthly premium rates to the insurance providers to cover the liability. The City’s annual liability is limited to the premium payments. The contracts are participating in that at the end of each policy period, the cost of claims, expenses, and an Incurred But Not Reported (IBNR) factor for run out liability are compared to premium. If the sums of these expenditures are less than the premium paid, then the plan generated a surplus which is shared with the City via being placed in a premium stabilization reserve or being returned to the Civilian FLEX Plan Trust. If the expenditures are greater than the premium, then a deficit is generated which is either applied to the Premium Stabilization Reserve (PSR) or carried over into future renewals. While the results of a surplus or deficit vary from year to year, over the past several years these arrangements have produced significant dividends for the City. Non-participating contracts are established such that the insurer has all of the risk and the results are not shared with the client. The City should consider moving to a non-participating arrangement if there is consideration of a financial offer that is very aggressive.

NON-STAFF MODEL MEDICAL RFP RESULTS FOR PLAN YEAR E FFECTIVE 1/1/2014
CITY OF LOS ANGELES
MERCER g:\group\client\cityla\2013\rfps\medicalrfpnonstaffresults\analysis\coflamedrfpreport012014v3-1.doc
15
Funding Agreements Both Anthem and Shield have agreed to a funding arrangement that is similar to the current arrangement that the City has with Anthem. UHC did offer a risk sharing arrangement but was not explicit on how surplus and deficits are handled. Anthem Blue Shield United Healthcare Refunding Description
Anthem’s offer is to continue their participating funding arrangement with annual accounting. Plan year deficits are carried forward and plan year surpluses in excess of any existing deficits are refundable to the City
Blue Shield is offering a participating funding arrangement with annual accounting. Plan year deficits are carried forward and plan year surpluses in excess of any existing deficits and a premium stabilization reserve are refundable to the City. The Premium Stabilization Reserve (PSR) would be funded over time by plan surpluses, not to exceed 5% of premium. If the plan did start with a deficit then future surpluses would be used to offset deficits and fund the PSR prior to being returned to the City.
United Healthcare is willing to enter into a participating contract arrangement that will give the City of Los Angeles refunding capability. Under this arrangement, the billed and contract rates will be the same with no retro premium calls. UnitedHealthcare will structure the arrangement so that settlements are based upon premiums less non-pooled benefit charges and expenses. Settlements will occur three to six months after the close of the contracted period. Under the participating arrangement, UnitedHealthcare will guarantee pre-PPACA retention at $33.00 PMPM for the HMO product and $37.00 PMPM for the PPO product.
Administration of Deficits
Deficits are carried forward. Deficits are offset by any future surpluses until eliminated. No recourse to recoup deficits at termination
Deficits are carried forward. Deficits are offset by any future surpluses until eliminated. No recourse to recoup deficits at termination
Not indicated. It is unknown if UHC will carry forward deficits.

NON-STAFF MODEL MEDICAL RFP RESULTS FOR PLAN YEAR E FFECTIVE 1/1/2014
CITY OF LOS ANGELES
MERCER g:\group\client\cityla\2013\rfps\medicalrfpnonstaffresults\analysis\coflamedrfpreport012014v3-1.doc
16
Administration of Surpluses
Surpluses are used to offset any prior deficits. If no deficit exists, surpluses may be refunded to the City or used to offset rates increases. The City currently has a contractual obligation to retain a portion of surpluses with Anthem in lieu of Anthem including a margin in their renewal calculation. Amounts remaining at the end of the contract are refundable to the City unless another agreement is made to offset margin in future renewals.
Surpluses are used to offset any prior deficits. If no deficit exists, surpluses may be refunded to the City or used to offset rates increases. The PSR would be funded over time by plan surpluses, not to exceed 5% of premium, in lieu of Blue Shield of California including a margin in their renewal calculation. Amounts remaining at the end of the contract are refundable to the City unless another agreement is made to offset margin in future renewals.
Not indicated. It is unknown how deficits carried forward (if any) will be applied.

NON-STAFF MODEL MEDICAL RFP RESULTS FOR PLAN YEAR E FFECTIVE 1/1/2014
CITY OF LOS ANGELES
MERCER g:\group\client\cityla\2013\rfps\medicalrfpnonstaffresults\analysis\coflamedrfpreport012014v3-1.doc
17
Performance Guarantees Carriers were asked to allocate 5% of projected premium to any one or any combination of the performance objectives provided in the RFP for both the HMO and PPO. Performance objectives included ID card turn around time, telephone response time, call abandonment rate, satisfaction with account management, satisfaction with implementation, member satisfaction with plan, timeliness and accuracy of loading eligibility feeds and claims processing within 14 and 28 days. Additionally carriers were asked to provide Wellness performance guarantees for any one or any combination of Lifestyle, Disease and Case Management objectives. Anthem proposed performance guarantees based on a few major service categories. Anthem’s fees at risk are 8% of retention for the HMO and PPO and included telephone response time, call abandonment rate, claims processing within 14 days and within 30 days as the measurable service categories. Anthem also included Wellness performance guarantees consisting of case management and care management objectives. The total amount at risk 1% of retention and 20% of health and welfare fees only respectively. Blue Shield proposed performance guarantees based on a majority of service categories. Blue Shield fees at risk are a 1.5% of premium for the HMO and PPO. Wellness performance guarantees are 0.5% of premium at risk for HMO and PPO. These include disease management and case management metrics. Blue Shield agreed to offer a total 2.0% of premium at risk for three years. Blue Shield is willing to discuss additional Wellness performance guarantees for years two and three. UHC proposed performance guarantees based on a majority of service categories. UHC fees at risk are 2% of premium for the HMO and PPO. UHC did not specify any specific total fees at risk for Wellness specific metrics, however they did mention that a second-year guarantee on their fully-Insured rates as well as a Wellness Budget of $500,000 to support the City's Wellness and Clinical Program Goals.

NON-STAFF MODEL MEDICAL RFP RESULTS FOR PLAN YEAR E FFECTIVE 1/1/2014
CITY OF LOS ANGELES
MERCER g:\group\client\cityla\2013\rfps\medicalrfpnonstaffresults\analysis\coflamedrfpreport012014v3-1.doc
18
Health Care Reform Fees Health care reform has several direct and indirect fees that are required. The direct fees are added to the premium rates by the health plans. The following table is a summary of the direct fees .Fee Effective Year Who Pays Estimated Cost
Patient-Centered Outcomes Research Institute (PCORI) Fee
Policy or plan year that ends on or after Oct. 1, 2012, and before Oct. 1, 2019
Insurer for fully insured plans; group health plan sponsor for self insured plans (e.g., employer maintaining a single-employer plan)
$1 PMPY for policy or plan years ending on or after Oct. 1, 2012 but before Oct. 1, 2013, increasing in subsequent years
Fee on Health Insurance Providers
Begins in 2014 and continues thereafter
Health insurance companies offering fully insured coverage
Estimated at 1.9% - 2.3% in 2014 certain non for profits like Kaiser fee is 50% of the others
Transitional Reinsurance Fee 2014 and sunsets in 2016 Insurance providers; TPAs on behalf of self-insured plans
Estimated at $63 PMPY in 2014, decreasing in subsequent years
Indirect fees are placed on manufactures of brand drugs and medical devices. These will likely be passed through in the cost.
Fee Effective Year Who Pays Estimated Cost
Manufacturers of Branded Prescription Drugs
2011 and continues thereafter Companies who manufacture or sell branded prescription drugs to certain government programs
Fees likely to be passed through indirectly to employers (impact unclear)
Manufacturers of Medical Devices
2013 and continues thereafter Companies who manufacture or sell medical devices
2.3% of every sale (indirect)
NON-STAFF MODEL MEDICAL RFP RESULTS FOR PLAN YEAR E FFECTIVE 1/1/2014
CITY OF LOS ANGELES
MERCER g:\group\client\cityla\2013\rfps\medicalrfpnonstaffresults\analysis\coflamedrfpreport012014v3-1.doc
19
Additional Health Care Reform Requirements The City’s 2014 medical benefits will need to comply with the mandatory out-of-pocket maximum cost-sharing requirements for non-grandfathered plans. Medical and Rx deductibles, copayments, and coinsurance will count toward the out-of-pocket cap. The carriers will need to confirm if this requirement was included in the proposed rates and provide plan design details.

NON-STAFF MODEL MEDICAL RFP RESULTS FOR PLAN YEAR E FFECTIVE 1/1/2014
CITY OF LOS ANGELES
MERCER g:\group\client\cityla\2013\rfps\medicalrfpnonstaffresults\analysis\coflamedrfpreport012014v3-1.doc
20
Financial Results Option A – Narrow Network HMO (Status Quo)
Keep existing number of HMOs (HMO Narrow Network along side a HMO Full Network) and PPO (Full Network) The Blue Shield quote reflects a significant savings over the Anthem renewal and includes a rate cap of 9.9% for 2015. Their rate development did have some aggressive pricing components. Their non-participating contract would be more advantageous to the City over the two years than the participating contract in light of the price point and rate cap. The enrollment used to derive premiums is based upon the full time employees.
Anthem Renewal Blue Shield UHC
2013 2014 $ Change over 2013
% Change
over 2013 2014 $ Change over 2013
% Change over 2013 2014
$ Change over 2013
% Change over 2013
HMO Select $77,442,929 $86,618,245 $9,175,316 11.8% $78,875,379 $1,432,450 1.8% $82,629,792 $5,186,863 6.7% HMO Traditional $1,313,751 $1,468,456 $154,705 11.8% $1,338,052 $24,301 1.8% $1,370,843 $57,092 4.3%
PPO $31,043,568 $34,562,681 $3,519,113 11.3% $31,617,781 $574,213 1.8% $36,850,584 $5,807,017 18.7%
Total Annual Cost $109,800,248 $122,649,382 $12,849,134 11.7% $111,831,212 $2,030,964 1.8% $120,851,219 $11,050,972 10.1%
Total HMO w/o HCR $78,756,680 $84,866,250 $6,109,570 7.8% $77,228,844 ($1,527,836) -1.9% $80,766,577 $2,009,896 2.6% HMO HCR $3,220,451 $2,984,587 $3,234,058
Total PPO w/o HCR $31,043,568 $33,504,667 $2,461,099 7.9% $30,611,020 ($432,547) -1.4% $35,708,892 $4,665,324 15.0%
PPO HCR $1,058,014 $1,006,760 $1,141,692
Total Annual w/o HCR $109,800,248 $118,370,917 $8,570,670 7.8% $107,839,865 ($1,960,383) -1.8% $116,475,468 $6,675,221 6.1%

NON-STAFF MODEL MEDICAL RFP RESULTS FOR PLAN YEAR E FFECTIVE 1/1/2014
CITY OF LOS ANGELES
MERCER g:\group\client\cityla\2013\rfps\medicalrfpnonstaffresults\analysis\coflamedrfpreport012014v3-1.doc
21
Option B Full Network HMO and PPO
Keep existing PPO (Full Network) option and replace HMO Narrow Network with a HMO Full Network option only (restore Full HMO) Moving back to the full HMO network would be a significant increase regardless of the health plan. All vendors indicated they would not recommend moving back to a traditional network structure. The enrollment used to derive premiums is based upon the full time employees.
Anthem Blue Shield UHC
2013 2014 $ Change over 2013
% Change over 2013 2014
$ Change over 2013
% Change
over 2013 2014 $ Change over 2013
% Change
over 2013 HMO Select $77,442,929 $93,050,483 $15,607,553 20.2% $89,883,876 $12,440,946 16.1% $88,076,612 $10,633,683 13.7%
HMO Traditional $1,313,751 $1,036,099 ($277,652) -21.1% $1,000,760 ($312,991) -23.8% $980,647 ($333,104) -25.4% PPO $31,043,568 $34,562,681 $3,519,113 11.3% $31,617,781 $574,213 1.8% $36,850,584 $5,807,017 18.7%
Total Annual Cost $109,800,248 $128,649,262 $18,849,014 17.2% $122,502,416 $12,702,169 11.6% $125,907,843 $16,107,596 14.7%

NON-STAFF MODEL MEDICAL RFP RESULTS FOR PLAN YEAR E FFECTIVE 1/1/2014
CITY OF LOS ANGELES
MERCER g:\group\client\cityla\2013\rfps\medicalrfpnonstaffresults\analysis\coflamedrfpreport012014v3-1.doc
22
Option C – PPO Narrow Network
Replace PPO (Full Network) with a PPO Narrow Network (high performance restrictive network) Only Anthem quoted on the Narrow Network PPO option. This would eliminate Cedars and UCLA medical groups as network providers but members could still access them as non-network providers. The enrollment used to derive premiums is based upon the full time employees.
Anthem Blue Shield UHC
2013 2014 $ Change over 2013
% Change
over 2013 2014 $ Change over 2013
% Change
over 2013 2014 $ Change over 2013
% Change
over 2013 HMO Select $77,442,929 $86,618,245 $9,175,316 11.8% N/A N/A N/A N/A N/A N/A
HMO Traditional $1,313,751 $1,468,456 $154,705 11.8% N/A N/A N/A N/A N/A N/A PPO $31,043,568 $33,634,208 $2,590,641 8.3% N/A N/A N/A N/A N/A N/A
Total Annual Cost $109,800,248 $121,720,910 $11,920,662 10.9%

NON-STAFF MODEL MEDICAL RFP RESULTS FOR PLAN YEAR E FFECTIVE 1/1/2014
CITY OF LOS ANGELES
MERCER g:\group\client\cityla\2013\rfps\medicalrfpnonstaffresults\analysis\coflamedrfpreport012014v3-1.doc
23
Option D – Tier Network
Replace HMO and/or PPO with a tiered network structure (plan has benefit structure where employees pay a different cost share for using different tiers of providers) Anthem provided a quote with a tiered network. This would utilize the traditional HMO network but have copay differentials between the Narrow Network providers and those not in the Narrow Network. Blue shield did not provide a Tiered Network option. UHC utilizes a different approach to network tiers. Providers fall into one of three network levels. Members pick which network level at the beginning of the year. Levels are determined by either significant contributions or benefit differentials. These options do not reflect savings and add to some benefit and communications complexity. The enrollment used to derive premiums is based upon the full time employees.
Anthem Blue Shield UHC
2013 2014 $ Change over 2013
% Change
over 2013 2014 $ Change over 2013
% Change
over 2013 2014 $ Change over 2013
% Change
over 2013 HMO Select $77,442,929 $89,376,656 $11,933,726 15.4% N/A N/A N/A $84,438,565 $6,995,636 9.0%
HMO Traditional $1,313,751 $995,137 ($318,614) -24.3% N/A N/A N/A $1,370,856 $57,105 4.3% PPO $31,043,568 $32,603,053 $1,559,486 5.0% N/A N/A N/A $36,850,584 $5,807,017 18.7%
Total Annual Cost $109,800,248 $122,974,846 $13,174,599 12.0% $122,660,005 $12,859,758 11.7%

NON-STAFF MODEL MEDICAL RFP RESULTS FOR PLAN YEAR E FFECTIVE 1/1/2014
CITY OF LOS ANGELES
MERCER g:\group\client\cityla\2013\rfps\medicalrfpnonstaffresults\analysis\coflamedrfpreport012014v3-1.doc
24
Option E – Deductible HMO
Replace both HMOs with a deductible Full Network HMO with a $250 deductible; $3,000 person / $5,000 family OOP maximum; $15 OV copays; $10 generic / $20 brand non-formulary / $40 brand formulary Rx. Only Anthem offered a deductible HMO product. Blue Shield proposed their SaveNet HMO network with a separate $250 Inpatient Copay. UHC did not offer a deductible HMO but their SignatureValue Alliance network which is more restrictive than their narrow network for the current Narrow network and Full Network plans. The enrollment used to derive premiums is based upon the full time employees.
Anthem Blue Shield UHC
2013 2014 $ Change over 2013
% Change over 2013 2014
$ Change over 2013
% Change over 2013 2014
$ Change over 2013
% Change over 2013
HMO Select $77,442,929 $90,669,708 $13,226,779 17.1% $78,677,916 $1,234,987 1.6% $89,929,043 $12,486,113 16.1% HMO Traditional $1,313,751 $1,009,591 ($304,160) -23.2% $1,338,052 $24,301 1.8% $1,001,298 ($312,453) -23.8%
PPO $31,043,568 $34,562,681 $3,519,113 11.3% $31,617,781 $574,213 1.8% $36,850,584 $5,807,017 18.7%
Total Annual Cost $109,800,248 $126,241,980 $16,441,732 15.0% $111,633,750 $1,833,502 1.7% $127,780,925 $17,980,677 16.4%

NON-STAFF MODEL MEDICAL RFP RESULTS FOR PLAN YEAR E FFECTIVE 1/1/2014
CITY OF LOS ANGELES
MERCER g:\group\client\cityla\2013\rfps\medicalrfpnonstaffresults\analysis\coflamedrfpreport012014v3-1.doc
25
HMO Benefit Pricing Options Each of the vendor’s quoting on the Anthem HMO provided a majority of the requested plan design changes. The credit for each benefit option is different by vendor. Anthem had the lowest pricing credit for the design changes while Blue Shield had the highest credit for most of the benefit provisions. Anthem Narrow HMO Anthem BlueShield UHC
Benefit Current Proposed % Change $ Total
Cost/(Savings) %
Change $ Total
Cost/(Savings) %
Change $ Total
Cost/(Savings)
1 Office visit copay $15 PCP/SCP $20 PCP/SCP -0.35% ($298,779) -0.68% ($536,353) -0.34% ($280,941)
2 Office visit copay $15 PCP/SCP $25 PCP/SCP -0.69% ($590,610) -1.31% ($1,033,267) -0.65% ($537,094)
3 Office visit copay $15 PCP/SCP $30 PCP/SCP -1.00% ($861,596) -1.90% ($1,498,632) -0.94% ($776,720)
4 Office visit copay $15 PCP/SCP $35 PCP/SCP -1.21% ($1,042,253) -2.44% ($1,924,559) -1.19% ($983,295)
5 Office visit copay $15 PCP/SCP $40 PCP/SCP -1.45% ($1,243,755) -2.97% ($2,342,599) -1.43% ($1,181,606)
6 Office visit copay $15 PCP/SCP $15 PCP/ $25
SCP -0.16% ($138,967) -0.01% ($7,888) -0.36% ($297,467)
7 Office visit copay $15 PCP/SCP $20 PCP/ $30 SCP -0.51% ($437,746) -0.69% ($544,240) -0.66% ($545,357)
8 Office visit copay $15 PCP/SCP $25 PCP/ $35
SCP -0.84% ($722,629) -1.32% ($1,041,155) -0.94% ($776,720)
9 Inpatient Hospital Copay None $250 -0.20% ($173,709) -0.25% ($197,188) -0.29% ($239,626)
10 Inpatient Hospital Copay
None $500 -0.41% ($354,366) -0.50% ($394,377) -0.54% ($446,201)
11 Rx:
generic/brand/non-formulary
$10/$20/$40 retail (30 day);
2 x MO (90 day)
$10/$25/$50 retail;
2 x MO (no supply limit
change)
-0.44% ($375,004) -0.88% ($694,103) -1.87% ($1,545,177)
12 Rx:
generic/brand/non-formulary
$10/$20/$40 retail (30 day);
2 x MO (90 day)
$10/$30/$50 retail;
2 x MO (no supply limit
change)
-0.74% ($637,506) -1.33% ($1,049,043) -2.37% ($1,958,326)

NON-STAFF MODEL MEDICAL RFP RESULTS FOR PLAN YEAR E FFECTIVE 1/1/2014
CITY OF LOS ANGELES
MERCER g:\group\client\cityla\2013\rfps\medicalrfpnonstaffresults\analysis\coflamedrfpreport012014v3-1.doc
26
HMO Benefit Pricing Options (cont’d) Anthem Narrow HMO (cont’d ) Anthem BlueShield UHC
Benefit Current Proposed %
Change $ Total
Cost/(Savings) %
Change $ Total
Cost/(Savings) %
Change $ Total
Cost/(Savings)
13 Rx:
generic/brand/non-formulary
$10/$20/$40 retail (30 day);
2 x MO (90 day)
$15/$25/$50 retail; 2 x MO (no supply
limit change) -1.02% ($872,291) -1.49% ($1,175,243) -2.71% ($2,239,267)
14 Rx:
generic/brand/non-formulary
$10/$20/$40 retail; 2 x MO
20% coinsurance with
a $10 minimum/ $100 maximum (no supply limit change)
-0.86% ($733,703) -0.74% ($583,678) -2.81% ($2,321,897)
15 Rx/Dx pairing None
Rx/Dx pairing – when a maintenance Rx is provided along with a diagnosis for a
condition like (diabetes, COPD,
CAD) The member copay will be half of the normal copay.
NA NA N/A N/A N/A N/A
16 Rx/Dx pairing None
Rx/Dx pairing – when a maintenance Rx is provided along with a diagnosis for a
condition like (diabetes, COPD,
CAD) The member copay will waived.
NA NA N/A N/A N/A N/A

NON-STAFF MODEL MEDICAL RFP RESULTS FOR PLAN YEAR E FFECTIVE 1/1/2014
CITY OF LOS ANGELES
MERCER g:\group\client\cityla\2013\rfps\medicalrfpnonstaffresults\analysis\coflamedrfpreport012014v3-1.doc
27
HMO Benefit Pricing Options (cont’d) Anthem Full HMO Anthem BlueShield UHC
Benefit Current Proposed % Change $ Total
Cost/(Savings) %
Change $ Total
Cost/(Savings) %
Change $ Total
Cost/(Savings)
1 Office visit copay $15 PCP/SCP $20 PCP/SCP -0.35% ($5,082) -0.68% ($9,099) -0.34% ($4,661)
2 Office visit copay $15 PCP/SCP $25 PCP/SCP -0.69% ($10,046) -1.31% ($17,528) -0.65% ($8,910)
3 Office visit copay $15 PCP/SCP $30 PCP/SCP -1.00% ($14,655) -1.90% ($25,423) -0.94% ($12,886)
4 Office visit copay $15 PCP/SCP $35 PCP/SCP -1.21% ($17,728) -2.44% ($32,648) -1.19% ($16,313)
5 Office visit copay $15 PCP/SCP $40 PCP/SCP -1.45% ($21,155) -2.97% ($39,740) -1.43% ($19,603)
6 Office visit copay $15 PCP/SCP $15 PCP/ $25
SCP -0.16% ($2,364) -0.01% ($134) -0.36% ($4,935)
7 Office visit copay $15 PCP/SCP $20 PCP/ $30 SCP -0.51% ($7,446) -0.69% ($9,233) -0.66% ($9,048)
8 Office visit copay $15 PCP/SCP $25 PCP/ $35
SCP -0.84% ($12,291) -1.32% ($17,662) -0.94% ($12,886)
9 Inpatient Hospital Copay None $250 -0.20% ($2,955) -0.25% ($3,345) -0.29% ($3,975)
10 Inpatient Hospital Copay
None $500 -0.41% ($6,027) -0.50% ($6,690) -0.54% ($7,403)
11 Rx:
generic/brand/non-formulary
$10/$20/$40 retail (30 day);
2 x MO (90 day)
$10/$25/$50 retail;
2 x MO (no supply limit
change)
-0.44% ($6,378) -0.88% ($11,775) -1.87% ($25,635)
12 Rx:
generic/brand/non-formulary
$10/$20/$40 retail (30 day);
2 x MO (90 day)
$10/$30/$50 retail;
2 x MO (no supply limit
change)
-0.74% ($10,843) -1.33% ($17,796) -2.37% ($32,489)

NON-STAFF MODEL MEDICAL RFP RESULTS FOR PLAN YEAR E FFECTIVE 1/1/2014
CITY OF LOS ANGELES
MERCER g:\group\client\cityla\2013\rfps\medicalrfpnonstaffresults\analysis\coflamedrfpreport012014v3-1.doc
28
HMO Benefit Pricing Options (cont’d) Anthem Full HMO (cont’d) Anthem BlueShield UHC
Benefit Current Proposed %
Change $ Total
Cost/(Savings) %
Change $ Total
Cost/(Savings) %
Change $ Total
Cost/(Savings)
13 Rx:
generic/brand/non-formulary
$10/$20/$40 retail (30 day);
2 x MO (90 day)
$15/$25/$50 retail; 2 x MO (no supply
limit change) -1.02% ($14,837) -1.49% ($19,937) -2.71% ($37,150)
14 Rx:
generic/brand/non-formulary
$10/$20/$40 retail; 2 x MO
20% coinsurance with
a $10 minimum/ $100 maximum (no supply limit change)
-0.86% ($12,479) -0.74% ($9,902) -2.81% ($38,521)
15 Rx/Dx pairing None
Rx/Dx pairing – when a maintenance Rx is provided along with a diagnosis for a
condition like (diabetes, COPD,
CAD) The member copay will be half of the normal copay.
NA NA N/A N/A N/A N/A
16 Rx/Dx pairing None
Rx/Dx pairing – when a maintenance Rx is provided along with a diagnosis for a
condition like (diabetes, COPD,
CAD) The member copay will waived.
NA NA N/A N/A N/A N/A

NON-STAFF MODEL MEDICAL RFP RESULTS FOR PLAN YEAR E FFECTIVE 1/1/2014
CITY OF LOS ANGELES
MERCER g:\group\client\cityla\2013\rfps\medicalrfpnonstaffresults\analysis\coflamedrfpreport012014v3-1.doc
29
PPO Benefit Pricing Options Each of the vendor’s quoting on the Anthem PPO provided a majority of the requested plan design changes. The credit for each benefit option is different by vendor. Anthem had the lowest pricing credit for the design changes while UHC had the highest credit for most of the benefit provisions. Anthem PPO Anthem BlueShield UHC
Benefit Current Proposed %
Change $
Cost/(Savings) %
Change $
Cost/(Savings) %
Change $
Cost/(Savings)
1 Office visit copay $30 PCP/SCP $35 PCP/SCP -0.22% ($76,925) -0.41% ($129,633) -1.06% ($390,616)
2 Office visit copay $30 PCP/SCP $40 PCP/SCP -0.44% ($151,198) -0.81% ($256,104) -2.11% ($777,547)
3
Inpatient Hospital Copay None $250 -0.11% ($37,136) -0.06% ($18,971) 0.99% $364,821
4
Inpatient Hospital Copay None $500 -0.21% ($71,620) -0.11% ($34,780) 0.41% $151,087
5
Rx: generic/brand/non-
formulary
$10/$20/$40 retail (30 day); 2 x MO (90 day)
$10/$25/$50 retail; 2 x MO (no supply limit
change) -0.56% ($192,238) -1.44% ($455,296) -0.73% ($269,009)

NON-STAFF MODEL MEDICAL RFP RESULTS FOR PLAN YEAR E FFECTIVE 1/1/2014
CITY OF LOS ANGELES
MERCER g:\group\client\cityla\2013\rfps\medicalrfpnonstaffresults\analysis\coflamedrfpreport012014v3-1.doc
30
Anthem PPO (cont’d) Anthem BlueShield UHC
Benefit Current Proposed %
Change $
Cost/(Savings) %
Change $
Cost/(Savings) %
Change $
Cost/(Savings)
6 Rx:
generic/brand/non-formulary
$10/$20/$40 retail (30 day); 2 x MO (90 day)
$10/$30/$50 retail; 2 x MO (no supply limit
change) -0.86% ($293,827) -2.09% ($660,812) -1.20% ($442,207)
7 Rx:
generic/brand/non-formulary
$10/$20/$40 retail (30 day); 2 x MO (90 day)
$15/$25/$50 retail; 2 x MO (no supply limit
change) -1.06% ($364,939) -2.20% ($695,591) -1.67% ($615,405)
8 Rx:
generic/brand/non-formulary
$10/$20/$40 retail; 2 x MO
20% coinsurance with
a $10 minimum/ $100 maximum (no supply limit change)
-0.83% ($286,012) -1.17% ($369,928) -2.67% ($983,911)
9 Rx/Dx pairing None
Rx/Dx pairing – when a maintenance Rx is provided along with a diagnosis for a
condition like (diabetes, COPD,
CAD) The member copay will be half of the normal copay.
NA NA N/A N/A N/A N/A
10 Rx/Dx pairing None
Rx/Dx pairing – when a maintenance Rx is provided along with a diagnosis for a
condition like (diabetes, COPD,
CAD) The member copay will waived.
NA NA N/A N/A N/A N/A

NON-STAFF MODEL MEDICAL RFP RESULTS FOR PLAN YEAR E FFECTIVE 1/1/2014
CITY OF LOS ANGELES
MERCER g:\group\client\cityla\2013\rfps\medicalrfpnonstaffresults\analysis\coflamedrfpreport012014v3-1.doc
31
5 Quality, Service, and Provider Disruption Quality - NCQA The National Committee of Quality Assurance (NCQA) is a non-profit organization that accredits managed care organizations. The accreditation process is an evaluation of clinical quality, member satisfaction and an assessment of key systems and processes. The report card aggregates the results into five categories and an overall score: Table 5.1: NCQA Accreditations Select HMO Health Plan Anthem Blue Shield UHC
Access and Service Commendable Excellent Commendable
Qualified Providers Accredited Excellent Accredited
Staying Healthy Accredited Commendable Accredited
Getting Better Commendable Accredited Commendable
Living with Illness Accredited Commendable Commendable
Overall Accreditation Status Commendable Commendable Commendable
HMO Health Plan Anthem Blue Shield UHC
Access and Service Commendable Excellent Commendable
Qualified Providers Accredited Excellent Accredited
Staying Healthy Accredited Commendable Accredited
Getting Better Commendable Accredited Commendable
Living with Illness Accredited Commendable Commendable

NON-STAFF MODEL MEDICAL RFP RESULTS FOR PLAN YEAR E FFECTIVE 1/1/2014
CITY OF LOS ANGELES
MERCER g:\group\client\cityla\2013\rfps\medicalrfpnonstaffresults\analysis\coflamedrfpreport012014v3-1.doc
32
Overall Accreditation Status Commendable Commendable Commendable
PPO Health Plan Anthem Blue Shield UHC
Access and Service Commendable Excellent Excellent
Qualified Providers Excellent Commendable Commendable
Staying Healthy Accredited Denied Accredited
Getting Better Commendable Accredited Commendable
Living with Illness Accredited Accredited Commendable
Overall Accreditation Status Commendable Accredited Commendable
Excellent: NCQA awards its highest accreditation status of Excellent to organizations with programs for service and clinical quality that meet or exceed rigorous requirements for consumer protection and quality improvement. HEDIS results are in the highest range of national performance. Commendable: NCQA awards a status of Commendable to organizations with well-established programs for service and clinical quality that meet rigorous requirements for consumer protection and quality improvement. Accredited: NCQA awards an accreditation status of Accredited to organizations with programs for service and clinical quality that meet basic requirements for consumer protection and quality improvement. Organizations awarded this status must take further action to achieve a higher accreditation status. All of the plans that responded have received an overall NCQA Accreditation of either Accredited or Commendable.

NON-STAFF MODEL MEDICAL RFP RESULTS FOR PLAN YEAR E FFECTIVE 1/1/2014
CITY OF LOS ANGELES
MERCER g:\group\client\cityla\2013\rfps\medicalrfpnonstaffresults\analysis\coflamedrfpreport012014v3-1.doc
33
Quality - State of California HMO Report Card The State of California HMO Report Card is compiled by the Office of the Patient Advocate. The report card rates plans on several quality of care. The overall HMO rating for Anthem, Blue Shield and UHC is good. Table 5.2: State of CA HMO Report Card
Select HMO Health Plan Anthem Blue Shield UHC HMO Ratings at a Glance *** *** *** Asthma Care ** ** ** Checking for Cancer *** *** *** Diabetes Care *** *** *** Heart Care *** *** *** Maternity Care ** *** **** Mental Health ** *** ** Sexually Transmitted Infections *** *** *** Treating Adults *** ** *** Treating Children *** ** *** HMO Health Plan Anthem Blue Shield UHC HMO Ratings at a Glance *** *** *** Asthma Care ** ** ** Checking for Cancer *** *** *** Diabetes Care *** *** *** Heart Care *** *** *** Maternity Care ** *** **** Mental Health ** *** ** Sexually Transmitted Infections *** *** *** Treating Adults *** ** *** Treating Children * ** ***

NON-STAFF MODEL MEDICAL RFP RESULTS FOR PLAN YEAR E FFECTIVE 1/1/2014
CITY OF LOS ANGELES
MERCER g:\group\client\cityla\2013\rfps\medicalrfpnonstaffresults\analysis\coflamedrfpreport012014v3-1.doc
34
PPO Health Plan Anthem Blue Shield UHC PPO Ratings at a Glance ** ** *** Asthma Care ** ** ** Checking for Cancer ** ** *** Diabetes Care ** * *** Heart Care *** * *** Maternity Care ** ** *** Mental Health ** *** *** Sexually Transmitted Infections *** ** *** Treating Adults * * * Treating Children ** ** **
**** Excellent: HMO performance is in the top 10% of all plans nationwide *** Good: HMO performance is in the 50th-89th percentile plans nationwide ** Fair: HMO performance is in the 25th-49th percentile plans nationwide * Poor: HMO performance is in the bottom 24% of all plans nationwide

NON-STAFF MODEL MEDICAL RFP RESULTS FOR PLAN YEAR E FFECTIVE 1/1/2014
CITY OF LOS ANGELES
MERCER g:\group\client\cityla\2013\rfps\medicalrfpnonstaffresults\analysis\coflamedrfpreport012014v3-1.doc
35
Quality - Board Certification Under the broad HMO and PPO networks Blue Shield has a higher number of board certified PCPs and SCPs. Blue Shield does not track this for their narrow network product. Anthem and UHC have similar levels in the 70% range. Table 5.3: Board Certification Select HMO 2012 Results Anthem Blue Shield* UHC PCP 72.30% N/A 70.60% Specialist 68.00% N/A 70.50% HMO 2012 Results Anthem Blue Shield UHC PCP 67.40% 75.00% 72.00% Specialist 63.90% 83.00% 68.60% PPO 2012 Results Anthem Blue Shield UHC PCP 72.30% 76.00% 65.00% Specialist 68.00% 81.00% 66.00%
Quality - Member Engagement Employee Self-Service a nd Decision Support Tools All of the plans have websites with member tools that allow access to member benefits, reissue ID cards, and finding doctors and facilities. All of the plans also have relationships with outside organizations like: WebMD, Health Dialog, HealthWise, Health Media, Leapfrog, Hospital Compare, and others. These organizations have tools like: Health Risk Assessments, Personal Health Records, Health Trackers, and information about health lifestyle issue. All of the plans have a variety of Disease Management (DM) or condition care programs that identify, stratify, and engage members in the management of their chronic conditions.

NON-STAFF MODEL MEDICAL RFP RESULTS FOR PLAN YEAR E FFECTIVE 1/1/2014
CITY OF LOS ANGELES
MERCER g:\group\client\cityla\2013\rfps\medicalrfpnonstaffresults\analysis\coflamedrfpreport012014v3-1.doc
36
Quality - Wellness Initiative and Innovations All of the plans responded to the wellness initiative and innovations questions. There were consistent recommendations on the usage of Health Risk Assessment (HRA), incentives around Lifestyle changes, onsite worksite wellness, need to create a culture of health and partnership around a sustained communications effort. All carriers proposed an annual Wellness Program Budget that can be used for member tools, funding of incentives and or communication campaign. Most of the carriers also proposed a designated account team representative specific to Wellness program. The chart below highlights the carriers’ responses to their proposed Wellness programs. Table 5.4: Wellness Initiatives Wellness Program Anthem Blue Shield UHC Funding of Wellness Programs
$876,860 Wellness Budget $800,000 Wellness Budget $500,000 included in proposal
Types of Programs − Healthy Lifestyles Well Being Assessment
− Wellness 2.0 web gamification includes; − SimplyEngaged includes;
− On-going H&W/ Lunch n’ Learns − Daily Challenge − On-line Health Coaching
− On-site fitness classes − Healthrageous/Walkadoo − Health Risk Assessment
− Testing and Screening Healthy Lifestyle Rewards Program, includes
− Testing and Screening
− Online Wellness Assessment
Funding of Incentive Programs & Rewards
Yes – included in Wellness Budget Yes – included in Wellness Budget (Wellness 2.0 price upon request)
Wellness incentives: tracking and management for health assessment ($75), online programs ($25) and telephonic wellness coaching ($75)
SimplyEngaged: $3.86 PMPM

NON-STAFF MODEL MEDICAL RFP RESULTS FOR PLAN YEAR E FFECTIVE 1/1/2014
CITY OF LOS ANGELES
MERCER g:\group\client\cityla\2013\rfps\medicalrfpnonstaffresults\analysis\coflamedrfpreport012014v3-1.doc
37
Incentive Program Health Rewards, includes: Healthy Lifestyle Rewards Program with financial incentive buy-up includes;
MyRewards includes;
− HRA Campaign − Online Wellness Assessment − Health Risk Assessment
− Future Moms − Biometric screening events − Biometric screening events − Condition Care − Online Health Education Modules − On-site health events
− On-line Health Coaching − Smoking Cessation − Personalized on-line 5 week program
− Preventive Screenings − EToolKit Types of Rewards − Premium contributions − Cash rewards − Gift cards
− Gift cards − Premium discounts − Merchandise − Prizes
Communication Campaign
$20,000 Funding amount has not been determined. Will work with City as needed to meet objectives and goals
Included in Wellness Budget depending on level of customization required
Designated Account Manager
Yes – current account team and the executive account manager for health and wellness
Yes – assigned Account manager, designated wellness consultant and designated communications consultant
Yes - account management team, wellness director and health & productivity coordinator

NON-STAFF MODEL MEDICAL RFP RESULTS FOR PLAN YEAR E FFECTIVE 1/1/2014
CITY OF LOS ANGELES
MERCER g:\group\client\cityla\2013\rfps\medicalrfpnonstaffresults\analysis\coflamedrfpreport012014v3-1.doc
38
Service - Claims Administration The plans were asked to provide 2012 actual claims administration performance metrics for the offices that would be serving the City of Los Angeles employees. Some of the plans do not track all of the metrics requested. All of the plans have above a 99% accuracy rate on financial payments. All of them have a 96% of claims processed in 30 days. The table below shows results. Table 5.5: Claims Administration 2012 Results Anthem Blue Shield UHC – PPO UHC - HM O Financial Payment Accuracy
99.83% 99.61% 98.90% 99.50%
Payment Accuracy Not tracked Not tracked 98.30% 98.50% Procedural Accuracy 99.61% 95.46% 99.70% 99.20% Overall Error Rate No tracked Not tracked 98.90% 97.80%
Claims Turn Around % in 0 to 14 days
98.51% 96.21% 97.00% Not tracked
Claims Turn Around % in 0 to 30 days
99.72% 99.16% Not tracked 96.70%

NON-STAFF MODEL MEDICAL RFP RESULTS FOR PLAN YEAR E FFECTIVE 1/1/2014
CITY OF LOS ANGELES
MERCER g:\group\client\cityla\2013\rfps\medicalrfpnonstaffresults\analysis\coflamedrfpreport012014v3-1.doc
39
Service – Customer Services Center Operations Anthem and Blue Shield would be administering the City of LA contract and servicing its members from California operations. All have hours during normal business hours with Anthem having the longest daily hours of operation UHC would service the City out of their Alabama and Texas location. Anthem does have the shortest average speed to answer and the lowest abandonment rate. Table 5.6: Customer Service Center
Anthem HMO & PPO
Blue Shield HMO & PPO
United HealthCare
HMO PPO Location
Woodland Hills, CA El Dorado Hills & Lodi,
CA Huntsville, Alabama and
San Antonio, TX San Antonio, TX
Hours M -F 8a.m. to 8p.m., PT M -F 7a.m. to 7p.m., PT M-F 7am to 7pm CT M-F 8am to 8pm CT Average seconds to answer 9.14 sec 26 sec 32 sec 25 sec Average hold time Not tracked 110 sec Not tracked Not tracked Abandonment rate 0.38% 1.10% 2.53% 1.0%

NON-STAFF MODEL MEDICAL RFP RESULTS FOR PLAN YEAR E FFECTIVE 1/1/2014
CITY OF LOS ANGELES
MERCER g:\group\client\cityla\2013\rfps\medicalrfpnonstaffresults\analysis\coflamedrfpreport012014v3-1.doc
40
Access - GeoAccess Network Analysis Each plan was asked to provide a GeoAccess network service area analysis for the City population. This analysis identifies a member’s geographic access to providers based on specific access standards. The access standards were:
Provider Type Access Standard
PCPs 2 in 10 miles
Hospitals 1 in 15 miles
Specialty Physicians 2 in 10 miles
The Anthem submission did not include all members. All of the plans have network service area coverage of 99% or greater for the proposed full networks and coverage of 97% or greater for the proposed narrow and or tiered networks. Below is a table of the results for the HMO and PPO plans. Table 5.7: GeoAccess regular network
Anthem Blue Shield UHCNarrow HMO PCP Meeting Access Standard 1,738 99.9% 7,701 99.5% 7,727 99.8%
Total 1,740 7,741 7,741Specialist Meeting Access Standard 1,737 99.8% 7,701 99.5% 7,723 99.8%
Total 1,740 7,741 7,741Hospital Meeting Access Standard 1,738 99.9% 7,711 99.6% 7,725 99.8%
Total 1,740 7,741 7,741HMO PCP Meeting Access Standard 114 100.0% 100 100.0% 100 100.0%
Total 114 100 100Specialist Meeting Access Standard 114 100.0% 100 100.0% 100 100.0%
Total 114 100 100Hospital Meeting Access Standard 114 100.0% 100 100.0% 100 100.0%
Total 114 100 100PPO PCP Meeting Access Standard 2,755 99.9% 2,752 99.8% 2,760 99.9%
Total 2,758 2,758 2,762Specialist Meeting Access Standard 2,754 99.9% 2,751 99.7% 2,760 99.9%
Total 2,758 2,758 2,762Hospital Meeting Access Standard 2,752 99.8% 2,753 99.8% 2,760 99.9%
Total 2,758 2,758 2,762

NON-STAFF MODEL MEDICAL RFP RESULTS FOR PLAN YEAR E FFECTIVE 1/1/2014
CITY OF LOS ANGELES
MERCER g:\group\client\cityla\2013\rfps\medicalrfpnonstaffresults\analysis\coflamedrfpreport012014v3-1.doc
41
Table 5.8: GeoAccess – Narrow network
Anthem Select Network
Blue Shield SaveNet
UHCAdvantage Network
UHCAlliance Network
UHCTiered Flex 1
Network
UHCTiered Flex 2
Network
UHCTiered Flex 3
NetworkNarrow HMO PCP Meeting Access Standard 1,738 99.9% 7,546 97.5% 7,722 99.8% 7,724 99.8% 7,713 99.6% 7,711 99.6% 7,712 99.6%
Total 1,740 7,741 7,741 7,741 7,741 7,741 7,741Specialist Meeting Access Standard 1,737 99.8% 7,637 98.7% 7,723 99.8% 7,723 99.8% 7,717 99.7% 7,714 99.7% 7,714 99.7%
Total 1,740 7,741 7,741 7,741 7,741 7,741 7,741Hospital Meeting Access Standard 1,738 99.9% 7,711 99.6% 7,725 99.8% 7,691 99.4% 7,626 98.5% 7,632 98.6% 7,706 99.5%
Total 1,740 7,741 7,741 7,741 7,741 7,741 7,741HMO PCP Meeting Access Standard 114 100.0% 98 98.0% 100 100.0% 99 99.0% 99 99.0% 99 99.0% 99 99.0%
Total 114 100 100 100 100 100 100Specialist Meeting Access Standard 114 100.0% 99 99.0% 100 100.0% 100 100.0% 100 100.0% 100 100.0% 100 100.0%
Total 114 100 100 100 100 100 100Hospital Meeting Access Standard 114 100.0% 100 100.0% 100 100.0% 99 99.0% 99 99.0% 99 99.0% 99 99.0%
Total 114 100 100 100 100 100 100PPO PCP Meeting Access Standard 2,752 99.8% 2,711 98.3%
Total 2,758 2,758 N/A N/A N/A N/A N/A N/A N/A N/A N/A N/ASpecialist Meeting Access Standard 2,749 99.7% 2,738 99.3%
Total 2,758 2,758 N/A N/A N/A N/A N/A N/A N/A N/A N/A N/AHospital Meeting Access Standard 2,752 99.8% 2,753 99.8%
Total 2,758 2,758 N/A N/A N/A N/A N/A N/A N/A N/A N/A N/A

NON-STAFF MODEL MEDICAL RFP RESULTS FOR PLAN YEAR E FFECTIVE 1/1/2014
CITY OF LOS ANGELES
MERCER g:\group\client\cityla\2013\rfps\medicalrfpnonstaffresults\analysis\coflamedrfpreport012014v3-1.doc
42
Access - PPO provider and HMO PCP Provider Group Di sruption Provider disruption causes interference to member’s access to care. For example, a member’s current provider may no longer be in-network due to a network and or carrier change. This requires the member to seek care at a new provider and essentially disrupts the patients’ access to health care. The provider disruption analysis is conducted during the RFP process to evaluate the network differences in the proposed bidder’s network vs. the current utilized providers (physicians and hospitals). This analysis will help to quantify the disruption. For the PPO, the RFP included a list of the providers used by members with the total paid and number of claimants. Carriers were evaluated based on the percent of providers, paid claim dollar amounts and number of claimants that are currently in-network and out-of-network under the carrier plan. Carriers with low disruption rates and are rated better than carriers with high disruption. Although some members currently using in-network providers would be disrupted by a carrier or network change, there will also be some members that utilize non-network providers under Anthem that will benefit from the change and will be able to use their provider in-network. For the HMO, the RFP included a list of physician medical groups, primary care physicians, and the total number of members assigned to them. A list for the end of plan year 2012 with Anthem’s full network and a list reflecting 2013 enrollment in the narrow network were provided. Each vendor was asked to compare their provider network to the providers actually utilized by City of LA FLEX plan members. Carriers were evaluated based on the amount of member, provider, and hospital disruption that would occur as a result of changing carriers or networks. Disruption would occur when members, providers, or hospitals that are currently being utilized by City members under the existing Anthem networks would fall out-of-network under the proposed network. The following tables show each carrier’s disruption rates for the PPO and HMO plans. PPO Provider Disruption Results PPO Provider Disruption analysis included looking at network disruption rates in the areas of providers, dollars, claimants, and claims. The overlap consisted of the following combinations: current in-network and in-network under other plan, current in-network and out-network under other plan, current out-network and in-network under other plan, current out-network and out-network under other plan.

NON-STAFF MODEL MEDICAL RFP RESULTS FOR PLAN YEAR E FFECTIVE 1/1/2014
CITY OF LOS ANGELES
MERCER g:\group\client\cityla\2013\rfps\medicalrfpnonstaffresults\analysis\coflamedrfpreport012014v3-1.doc
43
Current in-network provider usage is about 87% of the providers, 83% of the dollars, 92% of the claimants, and 91% of the claims. Anthem had the lowest provider disruption as the incumbent, followed by UHC’s full PPO network. Blue Shield’s full PPO network had the highest disruption. Anthem’s narrow network PPO disruption results are high when compared to the current network. Narrow networks are based on smaller more efficient provider networks. PPO Providers Table 5.9: In-Network Percentages (percent in each category that would fall under a network contract)
AnthemAnthem
Select PPO (1) Blue Shield (2) UHC% of providers 86.9% 66.5% 82.4% 86.9%% of paid claims 82.6% 74.4% 78.9% 92.1%% of claimants 92.1% 69.6% 83.4% 91.0%% of claims 91.3% 69.0% 84.0% 88.6%
Table 5.10: Disruption (In-Network currently / Out-of-network Under Proposed Plan)
AnthemAnthem
Select PPO (1) Blue Shield (2) UHC% of providers 0.0% 17.3% 9.4% 6.3%% of paid claims 0.0% 5.9% 6.1% 3.4%% of claimants 0.0% 14.8% 11.8% 5.2%% of claims 0.0% 16.5% 10.8% 6.6%
Notes:1) Anthem's Select PPO is only located in CA and therefore any out of state providers were marked as NA Mercer was unable to substantiate this claim and therefore counted N/A as out-of-network2) Blue Shield indicated some providers are not considered a physician and tracked by the network, e.g. a foreign provider and or pharmacy. Mercer was unable to substantiate this claim and therefore counted N/A responses as out-of-network3) Some members that utilize non-network providers under Anthem will be covered as in-network under another carrier

NON-STAFF MODEL MEDICAL RFP RESULTS FOR PLAN YEAR E FFECTIVE 1/1/2014
CITY OF LOS ANGELES
MERCER g:\group\client\cityla\2013\rfps\medicalrfpnonstaffresults\analysis\coflamedrfpreport012014v3-1.doc
44
The current PPO Inpatient Hospital usage is about 89% of the providers, 98% of the dollars, 97% of admits, and 97% of the claims. UHC had the highest inpatient hospital coverage with minimal disruption. Blue Shield has lowest inpatient coverage and highest disruption. Anthem’s narrow network PPO disruption results are high when compared to the current network. Narrow networks are based on smaller more efficient provider networks. PPO Inpatient Hospitals Table 5.11: In-Network Percentages (percent in each category that would fall under a network contract)
AnthemAnthem
Select PPO (1) Blue Shield (2) UHC% of providers 89.3% 86.9% 86.9% 90.5%% of paid claims 98.3% 98.1% 98.0% 98.7%% of claimants 96.8% 95.2% 95.2% 97.1%% of claims 96.7% 94.9% 94.9% 97.0%
Table 5.12: Disruption (In-Network currently / Out-of-network Under Proposed Plan)
AnthemAnthem
Select PPO (1) Blue Shield (2) UHC% of providers 0.0% 7.1% 7.1% 2.4%% of paid claims 0.0% 1.1% 1.1% 0.2%% of claimants 0.0% 2.9% 2.9% 0.6%% of claims 0.0% 3.0% 3.0% 0.6%
Notes:1) Anthem's Select PPO is only located in CA and therefore any out of state providers were marked as NA Mercer was unable to substantiate this claim and therefore counted N/A as out-of-network2) Blue Shield indicated some providers are not considered a physician and tracked by the network, e.g. a foreign provider and or pharmacy. Mercer was unable to substantiate this claim and therefore counted N/A responses as out-of-network3) Some members that utilize non-network providers under Anthem will be covered as in-network under another carrier

NON-STAFF MODEL MEDICAL RFP RESULTS FOR PLAN YEAR E FFECTIVE 1/1/2014
CITY OF LOS ANGELES
MERCER g:\group\client\cityla\2013\rfps\medicalrfpnonstaffresults\analysis\coflamedrfpreport012014v3-1.doc
45
HMO Provider Disruption Results HMO PCP Enrollment analyzed network disruption in the areas of providers, members, and subscribers. Carriers have taken different approaches to selecting providers for their narrow networks. As a result, if the current City’s narrow network moves to a narrow network with another vendor there will around 13% disruption of members for both Blue Shield and UHC. Since the current plan offering includes a full network HMO buy-up option, disruption for this population must also be considered. Under Blue Shield’s full network, about 53% of the members would be disrupted, essentially making their full network HMO not a viable option. Under UHC, there would be no disruption for their full network. HMO Provider Disruption Table 5.13: Disruption rates under each carrier’s narrow network option
Anthem Blue Shield UHC# of providers (1) 0 395 136% of providers (1) 0.0% 13.8% 4.7%# of subscribers 0 987 1,040% of subscribers 0.0% 12.7% 13.4%# of members 0 2,653 2,748% of members 0.0% 12.6% 13.0% Table 5.14: Disruption rates under each carrier’s full network option
Anthem Blue Shield UHC# of providers (1) 0 69 0 % of providers (1) 0.0% 51.9% 0.0%# of subscribers 0 59 0% of subscribers 0.0% 53.6% 0.0%# of members 0 124 0% of members 0.0% 52.8% 0.0%
Notes:1) Providers include IPAs and or Medical Groups

NON-STAFF MODEL MEDICAL RFP RESULTS FOR PLAN YEAR E FFECTIVE 1/1/2014
CITY OF LOS ANGELES
MERCER g:\group\client\cityla\2013\rfps\medicalrfpnonstaffresults\analysis\coflamedrfpreport012014v3-1.doc
46
Respondents were also asked to provide a network disruption based upon the Anthem full network enrollment as the end of 2012. Table 5.14: Disruption rates under each carrier’s full network option relative to Anthem’s full network utilization at December 2012
Anthem Blue Shield UHC# of providers (1) 0 333 23 % of providers (1) 0.0% 9.3% 0.6%# of subscribers 0 875 23% of subscribers 0.0% 10.1% 0.3%# of members 0 2,162 61% of members 0.0% 9.4% 0.3%
Notes:1) Providers include IPAs and or Medical Groups HMO Inpatient Hospital Disruption Results The hospital disruption analyzed network disruption in the areas of providers, paid claims, admits and claims. In order to include enough experience data to be a credible comparison, we used HMO inpatient hospital utilization over a 12 month period ending January 2013. This information includes utilization under the full network in 2012. For the narrow network, Blue Shield has similar disruption to the Anthem Select HMO. UHC’s HMO Hospital network is much smaller, resulting in significantly higher disruption rates. Under the full network HMO, a change to Blue Shield would result in some disruption, while UHC would result in significant hospital disruption.

NON-STAFF MODEL MEDICAL RFP RESULTS FOR PLAN YEAR E FFECTIVE 1/1/2014
CITY OF LOS ANGELES
MERCER g:\group\client\cityla\2013\rfps\medicalrfpnonstaffresults\analysis\coflamedrfpreport012014v3-1.doc
47
HMO Inpatient Hospital Disruption Table 5.15: Disruption rates under each carrier’s narrow network option
Anthem Blue Shield (1) UHC# of providers 17 16 64 % of providers 9.4% 8.9% 35.6%$ amount of paid claims $255,886 $218,332 $6,800,101% of paid claim amount 1.7% 1.5% 45.6%# of claimants 23 23 275% of claimants 2.7% 2.7% 32.7%# of claims 26 25 314% of claims 2.9% 2.8% 35.0% Table 5.16: Disruption rates under each carrier’s full network option
Anthem Blue Shield (1) UHC# of providers 0 16 46 % of providers 0.0% 8.9% 25.6%$ amount of paid claims $0 $218,332 $792,891% of paid claim amount 0.0% 1.5% 5.3%# of claimants 0 23 112% of claimants 0.0% 2.7% 13.3%# of claims 0 25 134% of claims 0.0% 2.8% 15.0%
1) Blue Shield indicated some providers are not considered a physician and tracked by the network, e.g. a foreign provider and or pharmacy. Mercer was unable to substantiate this claim and therefore counted N/A responses as out-of-network
NON-STAFF MODEL MEDICAL RFP RESULTS FOR PLAN YEAR E FFECTIVE 1/1/2014
CITY OF LOS ANGELES
MERCER g:\group\client\cityla\2013\rfps\medicalrfpnonstaffresults\analysis\coflamedrfpreport012014v3-1.doc
48
Access - Status of provider groups All of the plans have a standard credentialing and re-credentialing process that looks at a variety of licenses, training, and malpractice. In addition, the plans monitor provider performance and quality through a variety of metrics and periodic audits. Over the past two years, some of the carriers have terminated provider hospital groups while other carriers have seen no significant changes. Several IPA’s have closed practices and are not accepting new members. This can have an impact on member physician relationships. Most have a policy with the provider groups that if you are an existing patient under another plan you would not be considered a new patient and would be able to maintain that relationship.

NON-STAFF MODEL MEDICAL RFP RESULTS FOR PLAN YEAR E FFECTIVE 1/1/2014
CITY OF LOS ANGELES
MERCER g:\group\client\cityla\2013\rfps\medicalrfpnonstaffresults\analysis\coflamedrfpreport012014v3-1.doc
49
All estimates are based upon the information availa ble at a point in time, and are subject to unforese en and random events. Therefore, any projection must be interpreted as ha ving a likely range of variability from the estimat e. Any estimate or projection must be interpreted as having a likely range of var iability from the estimate. Any estimate or project ion may not be used or relied upon by any part for any other purpose than for whi ch it was issued by Mercer. Mercer is not responsib le for the consequences of any unauthorized use. Further, the estimates set forth in this report hav e been prepared before all regulations needed to im plement the Patient Protection and Affordable Care Act (PPACA) and Heal th Care Education and Reconciliation Act (HCERA) ha ve been issued, including clarifications and technical corrections, and without guidance on complex financial calculat ions that may be required. (For example, some Health Care Reform provisions wi ll likely involve calculations at the individual em ployee level.) Accordingly, these estimates are not Actuarial Opinions. The Ci ty of Los Angeles is responsible for all financial and design decisions regarding PPACA and HCERA. Such decisions should b e made only after The City of Los Angeles careful c onsideration of alternative future financial conditions and legisla tive scenarios and not solely on the basis of the e stimates illustrated here. The City of Los Angeles understands that Mercer is not engaged in the practice of law and this report, which may include commenting on legal issues or regulations, does not constitute and is not a substitute for legal advic e. Accordingly, Mercer recommends that The City of Los Angeles secures the advice of competent legal counsel with respect to any legal matters related to this report or otherwise. The information contained in this document and in a ny attachments is not intended by Mercer to be used , and it cannot be used, for the purpose of avoiding penalties under the Int ernal Revenue Code or imposed by any legislative bo dy on the taxpayer or plan sponsor.

NON-STAFF MODEL MEDICAL RFP RESULTS FOR PLAN YEAR E FFECTIVE 1/1/2014
CITY OF LOS ANGELES
MERCER g:\group\client\cityla\2013\rfps\medicalrfpnonstaffresults\analysis\coflamedrfpreport012014v3-1.doc
50
APPENDIX A

NON-STAFF MODEL MEDICAL RFP RESULTS FOR PLAN YEAR E FFECTIVE 1/1/2014
CITY OF LOS ANGELES
MERCER g:\group\client\cityla\2013\rfps\medicalrfpnonstaffresults\analysis\coflamedrfpreport012014v3-1.doc
51
PARTICIPATING QUOTES Anthem Blue Shield UHC
MEDICALNarrow Network
HMOFull Network
HMOFull Network
PPO Narrow Network
HMOFull Network
HMOFull Network
PPO Narrow Network
HMOFull Network
HMOFull Network
PPO Current Enrollment (RFTE Only)Employee 1,592 42 1,603 1,592 42 1,603 1,592 42 1,603Employee and Spouse 1,072 8 315 1,072 8 315 1,072 8 315Employee and Child(ren) 936 10 474 936 10 474 936 10 474Family 3,360 32 315 3,360 32 315 3,360 32 315Total 6,960 92 2,707 6,960 92 2,707 6,960 92 2,707
Current 2013 RatesEmployee $430.44 $655.80 $647.28 $430.44 $655.80 $647.28 $430.44 $655.80 $647.28Employee and Spouse $945.48 $1,441.48 $1,429.68 $945.48 $1,441.48 $1,429.68 $945.48 $1,441.48 $1,429.68Employee and Child(ren) $856.90 $1,305.66 $1,240.68 $856.90 $1,305.66 $1,240.68 $856.90 $1,305.66 $1,240.68Family $1,176.40 $1,792.10 $1,622.04 $1,176.40 $1,792.10 $1,622.04 $1,176.40 $1,792.10 $1,622.04Total $77,442,929.28 $1,313,750.88 $31,043,567.52 $77,442,929.28 $1,313,750.88 $31,043,567.52 $77,442,929.28 $1,313,750.88 $31,043,567.52PEPM $927.24 $1,189.99 $955.66 $927.24 $1,189.99 $955.66 $927.24 $1,189.99 $955.66
Option A Status Quo Status Quo Status Quo Status Quo Status Quo Status Quo Status Quo Status Quo Status QuoEmployee $481.43 $733.03 $720.66 $438.40 $667.93 $659.25 $459.27 $684.30 $768.36Employee and Spouse $1,057.71 $1,611.44 $1,591.95 $962.97 $1,468.15 $1,456.13 $1,008.81 $1,504.12 $1,697.12Employee and Child(ren) $958.44 $1,459.43 $1,381.30 $872.75 $1,329.81 $1,263.63 $914.29 $1,362.40 $1,472.76Family $1,315.71 $2,003.07 $1,805.73 $1,198.16 $1,825.25 $1,652.05 $1,255.19 $1,869.98 $1,925.46Total $86,618,245.44 $1,468,455.84 $34,562,680.56 $78,875,378.88 $1,338,052.32 $31,617,780.84 $82,629,792.00 $1,370,843.04 $36,850,584.24PEPM $1,037.10 $1,330.12 $1,063.99 $944.39 $1,212.00 $973.33 $989.34 $1,241.71 $1,134.42
11.8% 11.8% 11.3% 1.8% 1.8% 1.8% 6.7% 4.3% 18.7%Option B Restore Full HMO Restore Full HMO Status Quo Restore Full HMO Restore Full HMO Status Quo Restore Full HMO Restore Full HMO Status QuoEmployee $517.14 $517.14 $720.66 $499.53 $499.53 $659.25 $489.52 $489.52 $768.36Employee and Spouse $1,135.88 $1,135.88 $1,591.95 $1,097.97 $1,097.97 $1,456.13 $1,075.99 $1,075.99 $1,697.12Employee and Child(ren) $1,034.04 $1,034.04 $1,381.30 $994.56 $994.56 $1,263.63 $974.61 $974.61 $1,472.76Family $1,412.32 $1,412.32 $1,805.73 $1,365.22 $1,365.22 $1,652.05 $1,337.71 $1,337.71 $1,925.46Total $93,050,482.56 $1,036,098.72 $34,562,680.56 $89,883,875.52 $1,000,759.92 $31,617,780.84 $88,076,612.16 $980,646.96 $36,850,584.24PEPM $1,114.11 $938.50 $1,063.99 $1,076.20 $906.49 $973.33 $1,054.56 $888.27 $1,134.42
20.2% -21.1% 11.3% 16.1% -23.8% 1.8% 13.7% -25.4% 18.7%Option C Status Quo Status Quo Narrow PPO Status Quo Status Quo Narrow PPO Status Quo Status Quo Narrow PPOEmployee $481.43 $733.03 $701.30 N/A N/A N/A N/A N/A N/AEmployee and Spouse $1,057.71 $1,611.44 $1,549.14 N/A N/A N/A N/A N/A N/AEmployee and Child(ren) $958.44 $1,459.43 $1,344.20 N/A N/A N/A N/A N/A N/AFamily $1,315.71 $2,003.07 $1,757.26 N/A N/A N/A N/A N/A N/ATotal $86,618,245.44 $1,468,455.84 $33,634,208.40 $0.00 $0.00 $0.00 $0.00 $0.00 $0.00PEPM $1,037.10 $1,330.12 $1,035.41 $0.00 $0.00 $0.00 $0.00 $0.00 $0.00
11.8% 11.8% 8.3% -100.0% -100.0% -100.0% -100.0% -100.0% -100.0%Option D Tiered or Status Quo Tiered or Status Quo Tiered or Status Quo Tiered or Status Quo Tiered or Status Quo Tiered or Status Quo Tiered or Status Quo Tiered or Status Quo Tiered or Status QuoEmployee $496.76 $496.76 $679.80 N/A N/A N/A $0.00 $0.00 $768.36Employee and Spouse $1,091.45 $1,091.45 $1,501.59 N/A N/A N/A $0.00 $0.00 $1,697.12Employee and Child(ren) $988.97 $988.97 $1,302.99 N/A N/A N/A $0.00 $0.00 $1,472.76Family $1,357.59 $1,357.59 $1,703.44 N/A N/A N/A $0.00 $0.00 $1,925.46Total $89,376,655.68 $995,137.20 $32,603,053.32 $0.00 $0.00 $0.00 $84,438,565.44 $1,370,855.76 $36,850,584.24PEPM $1,070.12 $901.39 $1,003.66 $0.00 $0.00 $0.00 $1,011.00 $1,241.72 $1,134.42
15.4% -24.3% 5.0% -100.0% -100.0% -100.0% 9.0% 4.3% 18.7%Option E Deductible HMO Deductible HMO Status Quo Deductible HMO Full Network Status Quo Deductible HMO Deductible HMO Status QuoEmployee $503.91 $503.91 $720.66 $437.30 $667.93 $659.25 $499.84 $499.84 $768.36Employee and Spouse $1,106.77 $1,106.77 $1,591.95 $960.56 $1,468.15 $1,456.13 $1,097.92 $1,097.92 $1,697.12Employee and Child(ren) $1,007.58 $1,007.58 $1,381.30 $870.57 $1,329.81 $1,263.63 $995.06 $995.06 $1,472.76Family $1,376.20 $1,376.20 $1,805.73 $1,195.16 $1,825.25 $1,652.05 $1,366.07 $1,366.07 $1,925.46Total $90,669,708.48 $1,009,590.96 $34,562,680.56 $78,677,916.48 $1,338,052.32 $31,617,780.84 $89,929,042.56 $1,001,297.76 $36,850,584.24PEPM $1,085.60 $914.48 $1,063.99 $942.02 $1,212.00 $973.33 $1,076.74 $906.97 $1,134.42
17.1% -23.2% 11.3% 1.6% 1.8% 1.8% 16.1% -23.8% 18.7%Notes:1. HMO standalone includes both Narrow and Full network HMO. PPO standalone is only the PPO. 2. Bundled Product Rates assume selected carrier will be awarded all non-staff HMO and PPO products.3. Medical rates should include Vision

NON-STAFF MODEL MEDICAL RFP RESULTS FOR PLAN YEAR E FFECTIVE 1/1/2014
CITY OF LOS ANGELES
MERCER g:\group\client\cityla\2013\rfps\medicalrfpnonstaffresults\analysis\coflamedrfpreport012014v3-1.doc
52
Non-PARTICIPATING QUOTES Anthem Blue Shield UHC
MEDICALNarrow Network
HMOFull Network
HMOFull Network
PPO Narrow Network
HMOFull Network
HMOFull Network
PPO Narrow Network
HMOFull Network
HMOFull Network
PPO Current Enrollment (RFTE Only)Employee 1,592 42 1,603 1,592 42 1,603 1,592 42 1,603Employee and Spouse 1,072 8 315 1,072 8 315 1,072 8 315Employee and Child(ren) 936 10 474 936 10 474 936 10 474Family 3,360 32 315 3,360 32 315 3,360 32 315Total 6,960 92 2,707 6,960 92 2,707 6,960 92 2,707
Current 2013 RatesEmployee $430.44 $655.80 $647.28 $430.44 $655.80 $647.28 $430.44 $655.80 $647.28Employee and Spouse $945.48 $1,441.48 $1,429.68 $945.48 $1,441.48 $1,429.68 $945.48 $1,441.48 $1,429.68Employee and Child(ren) $856.90 $1,305.66 $1,240.68 $856.90 $1,305.66 $1,240.68 $856.90 $1,305.66 $1,240.68Family $1,176.40 $1,792.10 $1,622.04 $1,176.40 $1,792.10 $1,622.04 $1,176.40 $1,792.10 $1,622.04Total $77,442,929.28 $1,313,750.88 $31,043,567.52 $77,442,929.28 $1,313,750.88 $31,043,567.52 $77,442,929.28 $1,313,750.88 $31,043,567.52PEPM $927.24 $1,189.99 $955.66 $927.24 $1,189.99 $955.66 $927.24 $1,189.99 $955.66
Option A Status Quo Status Quo Status Quo Status Quo Status Quo Status Quo Status Quo Status Quo Status QuoEmployee $0.00 $0.00 $0.00 $438.40 $667.93 $659.25 $459.27 $684.30 $768.36Employee and Spouse $0.00 $0.00 $0.00 $962.97 $1,468.15 $1,456.13 $1,008.81 $1,504.12 $1,697.12Employee and Child(ren) $0.00 $0.00 $0.00 $872.75 $1,329.81 $1,263.63 $914.29 $1,362.40 $1,472.76Family $0.00 $0.00 $0.00 $1,198.16 $1,825.25 $1,652.05 $1,255.19 $1,869.98 $1,925.46Total $0.00 $0.00 $0.00 $78,875,378.88 $1,338,052.32 $31,617,780.84 $82,629,792.00 $1,370,843.04 $36,850,584.24PEPM $0.00 $0.00 $0.00 $944.39 $1,212.00 $973.33 $989.34 $1,241.71 $1,134.42
-100.0% -100.0% -100.0% 1.8% 1.8% 1.8% 6.7% 4.3% 18.7%Option B N/A Restore Full HMO Status Quo Restore Full HMO Restore Full HMO Status Quo Restore Full HMO Restore Full HMO Status QuoEmployee $0.00 $0.00 $499.53 $499.53 $659.25 $489.52 $489.52 $768.36Employee and Spouse $0.00 $0.00 $1,097.97 $1,097.97 $1,456.13 $1,075.99 $1,075.99 $1,697.12Employee and Child(ren) $0.00 $0.00 $994.56 $994.56 $1,263.63 $974.61 $974.61 $1,472.76Family $0.00 $0.00 $1,365.22 $1,365.22 $1,652.05 $1,337.71 $1,337.71 $1,925.46Total $0.00 $0.00 $89,883,875.52 $1,000,759.92 $31,617,780.84 $88,076,612.16 $980,646.96 $36,850,584.24PEPM $0.00 $0.00 $1,076.20 $906.49 $973.33 $1,054.56 $888.27 $1,134.42
-100.0% -100.0% 16.1% -23.8% 1.8% 13.7% -25.4% 18.7%Option C Status Quo Status Quo Narrow PPO Status Quo Status Quo Narrow PPO Status Quo Status Quo Narrow PPOEmployee $0.00 $0.00 $0.00 N/A N/A N/A N/A N/A N/AEmployee and Spouse $0.00 $0.00 $0.00 N/A N/A N/A N/A N/A N/AEmployee and Child(ren) $0.00 $0.00 $0.00 N/A N/A N/A N/A N/A N/AFamily $0.00 $0.00 $0.00 N/A N/A N/A N/A N/A N/ATotal $0.00 $0.00 $0.00 $0.00 $0.00 $0.00 $0.00 $0.00 $0.00PEPM $0.00 $0.00 $0.00 $0.00 $0.00 $0.00 $0.00 $0.00 $0.00
-100.0% -100.0% -100.0% -100.0% -100.0% -100.0% -100.0% -100.0% -100.0%Option D Tiered or Status Quo Tiered or Status Quo Tiered or Status Quo Tiered or Status Quo Tiered or Status Quo Tiered or Status Quo Tiered or Status Quo Tiered or Status Quo Tiered or Status QuoEmployee $0.00 $0.00 $0.00 N/A N/A N/A $0.00 $0.00 $768.36Employee and Spouse $0.00 $0.00 $0.00 N/A N/A N/A $0.00 $0.00 $1,697.12Employee and Child(ren) $0.00 $0.00 $0.00 N/A N/A N/A $0.00 $0.00 $1,472.76Family $0.00 $0.00 $0.00 N/A N/A N/A $0.00 $0.00 $1,925.46Total $0.00 $0.00 $0.00 $0.00 $0.00 $0.00 $84,438,565.44 $1,370,855.76 $36,850,584.24PEPM $0.00 $0.00 $0.00 $0.00 $0.00 $0.00 $1,011.00 $1,241.72 $1,134.42
-100.0% -100.0% -100.0% -100.0% -100.0% -100.0% 9.0% 4.3% 18.7%Option E Deductible HMO N/A Status Quo Deductible HMO Full Network Status Quo Deductible HMO Deductible HMO Status QuoEmployee $0.00 $0.00 $437.30 $667.93 $659.25 $499.84 $499.84 $768.36Employee and Spouse $0.00 $0.00 $960.56 $1,468.15 $1,456.13 $1,097.92 $1,097.92 $1,697.12Employee and Child(ren) $0.00 $0.00 $870.57 $1,329.81 $1,263.63 $995.06 $995.06 $1,472.76Family $0.00 $0.00 $1,195.16 $1,825.25 $1,652.05 $1,366.07 $1,366.07 $1,925.46Total $0.00 $0.00 $78,677,916.48 $1,338,052.32 $31,617,780.84 $89,929,042.56 $1,001,297.76 $36,850,584.24PEPM $0.00 $0.00 $942.02 $1,212.00 $973.33 $1,076.74 $906.97 $1,134.42
-100.0% -100.0% 1.6% 1.8% 1.8% 16.1% -23.8% 18.7%Notes:1. HMO standalone includes both Narrow and Full network HMO. PPO standalone is only the PPO. 2. Bundled Product Rates assume selected carrier will be awarded all non-staff HMO and PPO products.3. Medical rates should include Vision

Services provided by Mercer Health & Benefits LLC.
California Insurance License 0E75483
Mercer Health & Benefits LLC 777 South Figueroa Street, Suite 2400 Los Angeles, CA 90017 +1 213 346 2200