Non Renewable Natural Resources and the and
29
Non‐Renewable Natural Resources and the Newfoundland and Labrador Economy A Presentation to the Chartered Professional Accountants, Newfoundland and Labrador Wade Locke Department of Economics, Memorial University Thursday, February 23, 2017 Capital Hotel
Transcript of Non Renewable Natural Resources and the and

Non‐Renewable Natural Resources and the Newfoundland and Labrador Economy
A Presentation to the Chartered Professional Accountants, Newfoundland and Labrador
Wade LockeDepartment of Economics, Memorial University
Thursday, February 23, 2017Capital Hotel

GDP per Capita
NL’s absolute and relative position have improved over time, but they have been declining in recent years.
We are starting to see the impacts of lower oil prices with two years of real decline in GDP
The budget is forecasting several years of negative growth
Real GDP in 2015 fell by 2% relative to 2014

Employment (1)
There is a noticeable decline in employment and a noticeable increase in the seasonally adjusted unemployment rate in the last three years, which pre‐dates the fall in the price of oil.
Employment levels expected to be 42,350 lower than they were in 2013, when annual and monthly employment peaked. This represents a 17.5% reduction in employment levels from 2013 to 2022.
To put this in perspective, in the last three years, employment fell by 4.2% from peak or there are 10,100 fewer people working in 2016 than in 2013
Unemployment rates have been increasing and by 2019, they are expected to increase to 19.8%, which is just below the 20.2% record in 1985
Hard to know how much of it is caused by oil price falls, but certainly some of the deterioration is due to a slow down in the oil economy

Employment (2)
SEPH is employment in Newfoundland and Labrador and Labour Force Survey is employment of Newfoundlanders and Labradorians, whether within the province or outside
Both are starting to flatten out and decline

Public Jobs per 1,000 PeopleGeography 1997 1998 1999 2000 2001 2002 2003 2004 2005 2006 2007 2008 2009 2010 2011 2012 2013 2014 2015Newfoundland and Labrador 78 79 76 77 85 87 89 88 86 88 92 95 99 99 100 102 97 95 94Prince Edward Island 82 75 78 81 81 80 82 87 85 83 84 87 92 92 91 87 85 83 82Nova Scotia 76 77 81 80 79 82 80 78 78 79 79 81 82 82 83 82 84 86 88New Brunswick 71 71 72 72 76 72 74 72 75 77 77 78 80 82 79 75 73 72 71Quebec 76 74 74 73 75 77 78 77 76 76 77 77 78 78 78 78 79 80 78Ontario 49 49 49 48 50 51 52 53 54 54 55 56 55 56 55 55 55 55 55Manitoba 73 75 76 78 78 82 85 86 85 83 84 87 88 87 89 88 88 87 87Saskatchewan 77 78 81 83 85 84 84 85 87 89 90 90 92 92 90 89 88 88 86Alberta 58 57 57 58 60 60 61 61 61 62 64 66 65 65 65 66 65 63 63British Columbia 60 60 61 61 61 60 59 58 58 59 60 60 60 60 61 61 61 59 61Canada (Provincial and Territorial Public Sector) 62 62 62 62 63 64 64 64 64 65 66 67 67 67 67 67 67 67 67

Public Sector Jobs per 1,000 People ‐Disaggregated
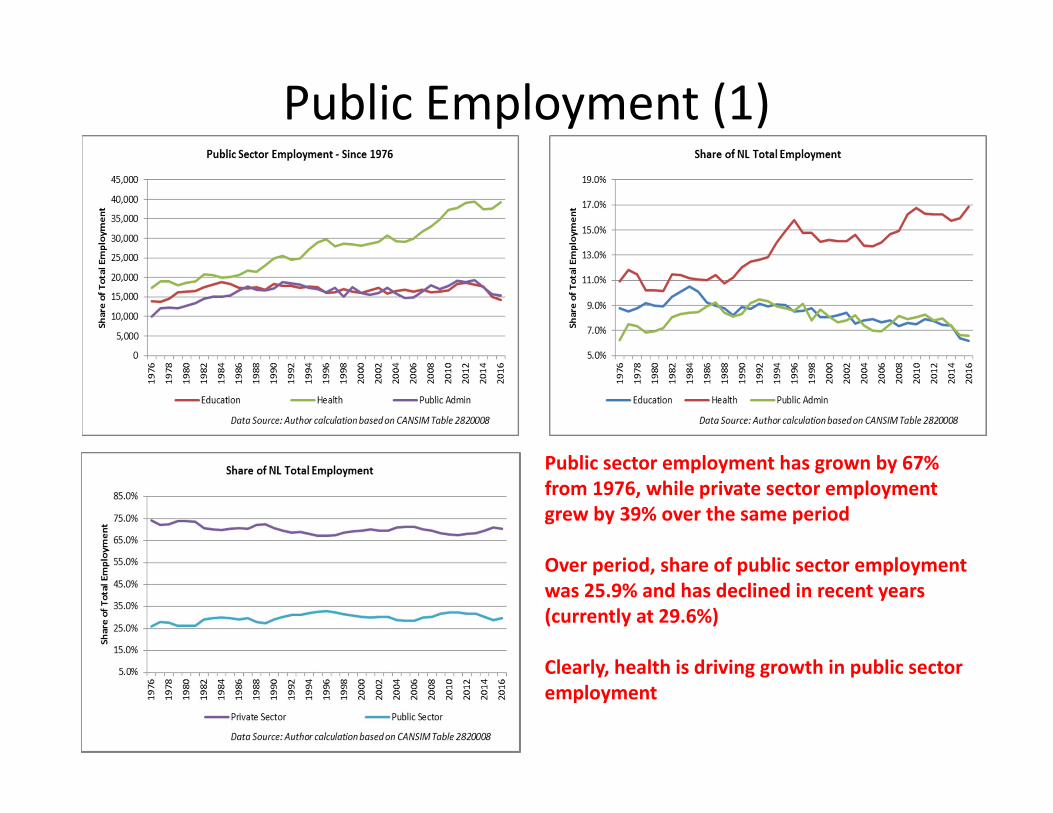
Public Employment (1)
Public sector employment has grown by 67% from 1976, while private sector employment grew by 39% over the same period
Over period, share of public sector employment was 25.9% and has declined in recent years (currently at 29.6%)
Clearly, health is driving growth in public sector employment

Wages – NL Relative to CDN
Wages starting to decline relative to CDN average and are flattening out in absolute terms. This will have implications for revenues measures introduced in the budget. That is, it will constrain the province’s ability to raise revenue s from PIT, HST, and Gas tax.

Bankruptcies – NL and Canada
9
Consumer bankruptcies up 11% in NL from 2014 to 2015 (but down 3.3% 2015Q3 to 2016Q3) and business bankruptcies down by 22% 2014 to 2015 (and down 17% 2015Q3 to 2016Q3).
Consistent with strains on the economy as commodity prices have fallen, but it does not appear to be the crisis that some people have portrayed

Demographic Time Bomb: Declining Population
10
Between 1961 and 2016, 154,576 more people left NL than moved to NL from other provinces, which average 2,836 per year and between 2015 to 2038, population expected to fall by 8.5% with low, 5% with medium and 1.3% with high
2016 median age NL = 45.3 and median age CDN = 40.6

Demographic Time Bomb: Declining and Aging Population
11
NL is getting older and quickly. By 2038, NL is expected to have 34.8% (31% utilizing NL projections) of population over 65 years of age, while Canada will have 25,4%. This will have implications for public services (health in particular), housing, labour markets and demand for various types of projects
Source: Pat Parfey’s Choosing Wisely NL presentation to MUN Economics February 16, 2017

Per Capital Health Care Expenditures
12
NL per capita expenditures on total health exceeds that in any other provinces

Per Capita Expenditure on Health Care – NL (2014)
An aging population would normally be expected to put more pressure on health care costs
On average, it costs NL $5,060 per capita for health care costs in 2014, which compares to $3,975 per capita Canada‐wide or we were 27.3% higher in per capita terms in 2014. We exceed all other provinces on average – closest is Alberta where we were 8.5% higher in 2014
Also, NL exceed CDN average in every age category, with the older categories representing the biggest difference. For example, NL per capita cost for the 85‐89 category is 54% higher than Canadian average
If no other cost drivers change (doctor’s salaries, cost of band aids, etc.), then the median age (currently 45 years) person’s health cost will increase by 48% in 10 years, increase by a further 61% in the next 10 years or in 20 years time, it will cost 139% ($3,706 to $7,363) more to treat that person
Health care is so important to Newfoundlanders and Labradorians and is the biggest expenditure in the budget (36% of expenditure on the Health Care Sector)
It is one of the most significant cost drivers for the government and it may be time to have a Royal Commission to look at all aspects of health care (funding, delivery, infrastructure and what we want and can pay for) seems to make a lot of sense at this point in time.13

NL Housing Market
Aging population, lower employment, higher taxes (including HST), lower expenditures and lower confidence do not bode well for the housing market
Provincial expenditure cuts in the range of $240 to $250 M would have a significant and negative impact on the housing market
At $60,000 average wages and 50% of expenditure on wages, this could translate into in excess of 2,000 fewer people working directly for government
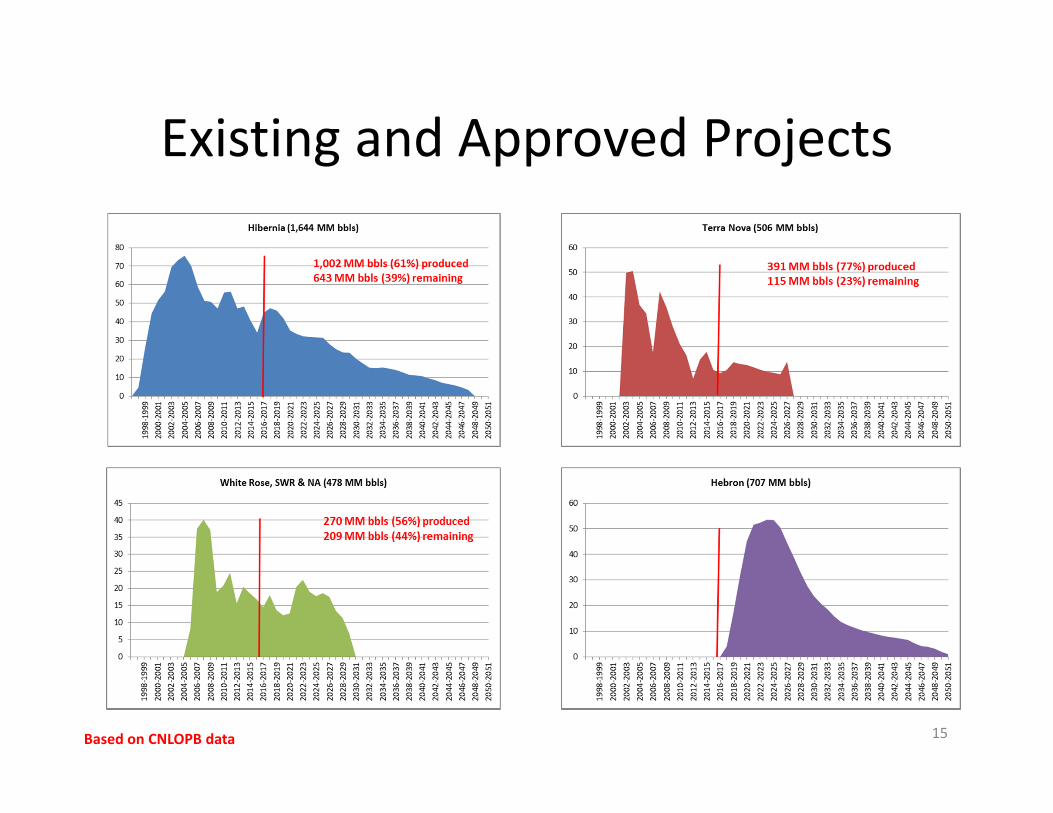
Existing and Approved Projects
15Based on CNLOPB data
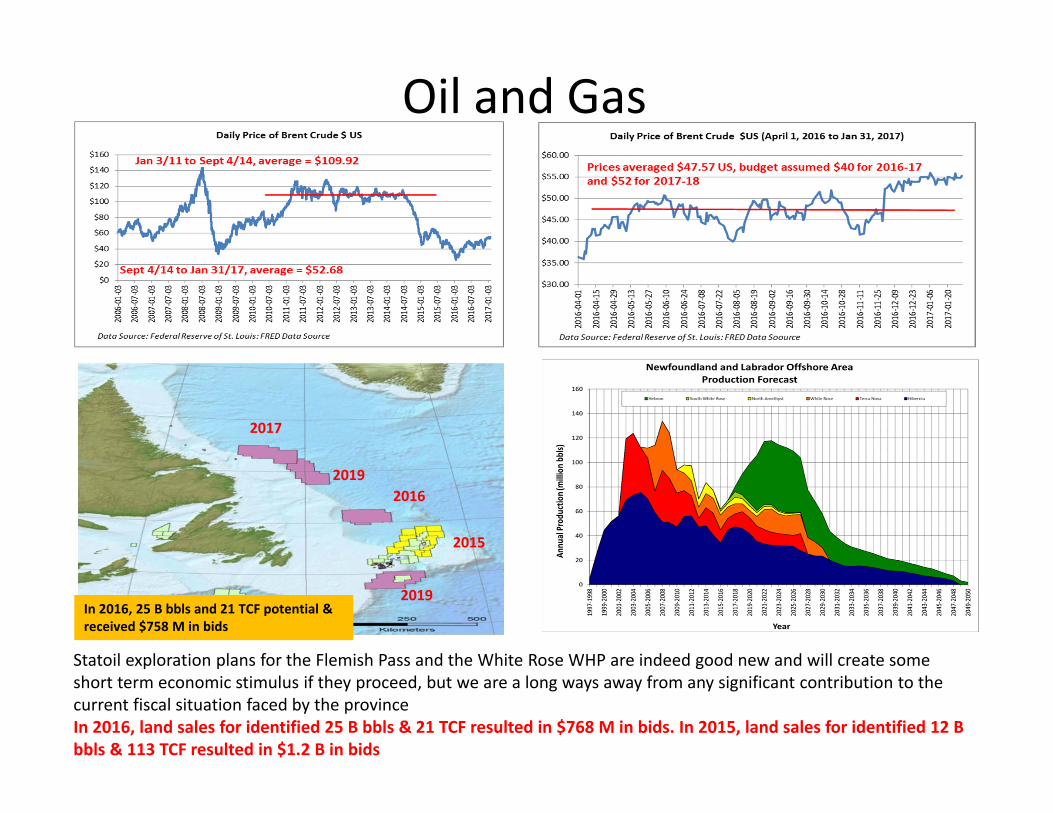
Oil and Gas
Statoil exploration plans for the Flemish Pass and the White Rose WHP are indeed good new and will create some short term economic stimulus if they proceed, but we are a long ways away from any significant contribution to the current fiscal situation faced by the provinceIn 2016, land sales for identified 25 B bbls & 21 TCF resulted in $768 M in bids. In 2015, land sales for identified 12 B bbls & 113 TCF resulted in $1.2 B in bids
2017
20192016
2015
2019In 2016, 25 B bbls and 21 TCF potential & received $758 M in bids

United Nations Convention on the Law of the SeaArticle 82
• The coastal State shall make payments or contributions in kind in respect of the exploitation of the non‐living resources of the continental shelf beyond 200 nautical miles from the baselines from which the breadth of the territorial sea is measured.
• 2. The payments and contributions shall be made annually with respect to all production at a site after the first five years of production at that site. For the sixth year, the rate of payment or contribution shall be 1 per cent of the value or volume of production at the site. The rate shall increase by 1 per cent for each subsequent year until the twelfth year and shall remain at 7 per cent thereafter. Production does not include resources used in connection with exploitation.
• 3. A developing State which is a net importer of a mineral resource produced from its continental shelf is exempt from making such payments or contributions in respect of that mineral resource.
• 4. The payments or contributions shall be made through the Authority, which shall distribute them to States Parties to this Convention, on the basis of equitable sharing criteria, taking into account the interests and needs of developing States, particularly the least developed and the land‐locked among them.
This has real implications for NL and for intergovernmental fiscal relations within Canada

Demand and Supply Affect Price

Demand and Supply – Not Always in Balance
When supply exceeds demand, inventories build and prices fall

Oil, GDP and Royalties
From its peak in 2011‐12, oil royalties have fallen by 79% and since 2003, oil as a share of the economy has fallen by half
There has been over $51 B invested in the offshore up to the end of 2015
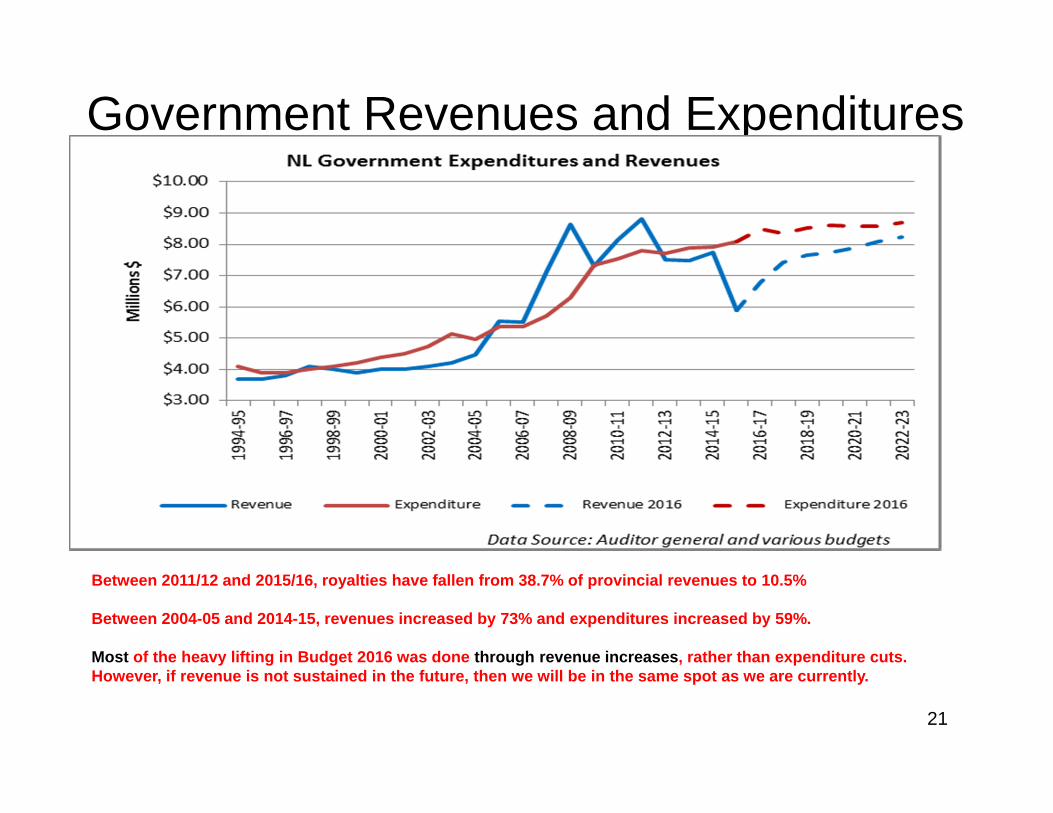
Government Revenues and Expenditures
Between 2011/12 and 2015/16, royalties have fallen from 38.7% of provincial revenues to 10.5%
Between 2004-05 and 2014-15, revenues increased by 73% and expenditures increased by 59%.
Most of the heavy lifting in Budget 2016 was done through revenue increases, rather than expenditure cuts. However, if revenue is not sustained in the future, then we will be in the same spot as we are currently.
21

PIT – NL and Other Provinces
22NL is now in the middle of the pack on PIT for taxable income brackets

Implied Budgetary Changes to Meet Stated Targets
23
Forecast Revenue Budget 2016
Forecast Program
Expenditure Budget 2016
Forecast Debt Serving Expenditure Budget 2016
Revenue Risk Adjustment
(Fudge Factor)
Revenue minus Expenditure or Implied Deficit
Target Deficit Budget 2016
Additional Adjustment Required to Meet Target Deficit (Either Reduced
Expenditure or Enhanced Revenue)
2016-17 $6,776.30 -$7,499.00 -$982.30 -$125.00 -$1,830.00 -$1,830.00 $0.00
2017-18 $7,409.60 -$7,307.30 -$1,033.50 -$125.00 -$1,056.20 -$800.00 -$256.20
2018-19 $7,659.20 -$7,390.30 -$1,125.20 -$125.00 -$981.30 -$650.00 -$331.30
2019-20 $7,737.00 -$7,432.50 -$1,166.70 -$125.00 -$987.20 -$500.00 -$487.20
2020-21 $7,871.80 -$7,406.70 -$1,181.80 -$125.00 -$841.70 -$250.00 -$591.70
2021-22 $8,096.60 -$7,362.90 -$1,229.10 -$125.00 -$620.40 $0.00 -$620.40
Implied Annual Changes in Variables to Meet Target Deficit
Forecast Revenue Budget 2016
Forecast Program
Expenditure Budget 2016
Forecast Debt Serving Expenditure Budget 2016
Revenue Risk Adjustment
(Fudge Factor)
Revenue minus Expenditure or Implied Deficit
Target Deficit Budget 2016
Additional Adjustment Required to Meet Target Deficit (Either Reduced
Expenditure or Enhanced Revenue)
2016-17
2017-18 $633.30 ‐$191.70 $51.20 $0.00 ‐$773.80 ‐$1,030.00 $256.20
2018-19 $249.60 $83.00 $91.70 $0.00 ‐$74.90 ‐$150.00 $75.10
2019-20 $77.80 $42.20 $41.50 $0.00 $5.90 ‐$150.00 $155.90
2020-21 $134.80 ‐$25.80 $15.10 $0.00 ‐$145.50 ‐$250.00 $104.50
2021-22 $224.80 ‐$43.80 $47.30 $0.00 ‐$221.30 ‐$250.00 $28.70
Cum Total $1,320.30 ‐$136.10 $246.80 $0.00 ‐$1,209.60 ‐$1,830.00 $620.40
To get to balance, $1.3 B ($8.1 B - $6.8 B) in extra revenue plus $140 M ($7.50 B - $7.36 B) in indicated program reductions (1.8%) and another $620 M in implied program expenditure cuts (8.3% reduction) for a total implied reduction on program expenditure of $760 M (10.1% reduction) If the expenditure were made up by cutting labour costs, then, utilizing an average wage of $60,000, this would imply a reduction of 1,667 full-time equivalent jobs for $200 M reduction in program expenditure, assuming half comes from wages.

Fiscal Update and Way Forward
24
Summary of Fiscal Update - Relevant Parameters
Change Since Budget 2016 Change Since Budget 2016oil revenues (royalties and CIT from higher prices) $120 Oil Prices $5
Government Business Enterprises $17 Oil Production (MM bbls) $4Prior Year Base Adjustments (PIT and CIT) $80 Exchange Rate ?Total Change in Revenue $217
Real GDP -0.4%Program Expenditures -$111 Household Income -0.5%Debt Servicing Expenses $132 Retail Sales -0.7%Total Change in Expenses $21 Housing Starts -0.3%
Capital Investment -1.3%Revised Change in Deficit $197 Employment -0.3%
Unemployment Rate 0.4%
Change in Accounting Assumption (reduce $125M to $75M) -$50 Participation Rate -0.2%
Population 0.3%
Change in Adjusted Deficit $247HST Over Payment $140 M (while $89 M already included in estimates, there is still $51 M that needs to be taken into account)
Note: with the fiscal update, all the indicators appear to be going in the wrong direction. It does not bode well for hitting future budget targets. The 2016 AG report states: “Most economic indicators have deteriorated in the 6 months since the economic forecast released as part of Budget 2016 – this indicates there may be some risk for the revenue forecast for the remainder of 2016-17 and, also, future years.”
The Way Forward lays out a vision, but one that does not appear to be fully integrated with the economic and fiscal realities of the province. It is certainly not a roadmap. It appears to be more in line what the government hopes will transpire.

NL Borrowing Challenges: Another Risk
25
Clearly, the risk associated with NL long term debt has increase relative to Ontario since 2015 when the yield was basically the same, but now the premium required to attract financing is higher by 65 to 70 basis points
NL Borrowing Challenges: Another Risk
26
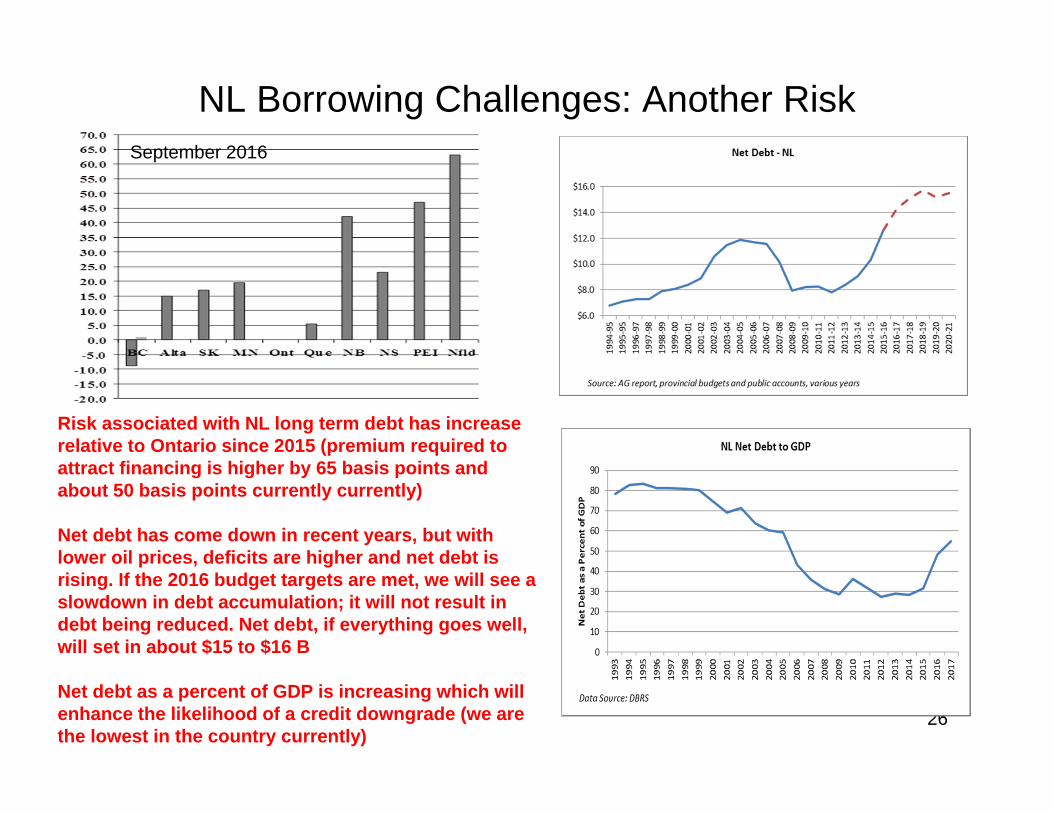
Risk associated with NL long term debt has increase relative to Ontario since 2015 (premium required to attract financing is higher by 65 basis points and about 50 basis points currently currently)
Net debt has come down in recent years, but with lower oil prices, deficits are higher and net debt is rising. If the 2016 budget targets are met, we will see a slowdown in debt accumulation; it will not result in debt being reduced. Net debt, if everything goes well, will set in about $15 to $16 B
Net debt as a percent of GDP is increasing which will enhance the likelihood of a credit downgrade (we are the lowest in the country currently)
September 2016

NL is Already Challenged in terms of Borrowing
27

Iron Ore and Nickel Prices
28
Iron ore prices starting to recover. Currently around $80/DMT and this may help iron ore developments in Labrador
Nickel prices relatively stable and this should help with Voisey due to go underground

Conclusion• We have Demographic Challenges
• We have Economic and Employment Challenges
• We have Fiscal Challenges
• We have Debt and Borrowing Challenges
• We have a Temporal Challenge – Is Waiting a Real Option?
• There is significant energy and non‐renewable resource potential
• We are short‐term challenged, we are medium‐term challenged and the longer–term is positive, but depends upon how we react in the short and medium terms
• Even though people seem recognize the current fiscal and economic circumstances, it seems to me that we, as a province, have not fully appreciated just how difficult the solution will have to be and that waiting may make the adjustment costs more unmanageable.
• There is hope with the offshore and that oil prices will rise, but these are medium to longer term and we do not know by how much they will rise and for how long. Yet, we do need to do something now and the political will and social acceptability may not be there to cut expenditures.
• This might be a good time for a Royal Commission on Health Care
• We need to move beyond a vision statement for the province. We need a firm grounding in the economic and fiscal realities of the province. We need to have the will to implement it.