Non -PFOS/non -PFAS Photoacid Generators: · PDF fileNon -PFOS/non -PFAS Photoacid Generators:...
40
Non Non - - PFOS/non PFOS/non - - PFAS Photoacid Generators: PFAS Photoacid Generators: Environmentally Friendly Candidates for Next Environmentally Friendly Candidates for Next Generation Lithography Generation Lithography Victor M Gamez 1 , Ramakrishan Ayothi 2 , Yi Yi 2 , James A Field 1 , Chris K Ober 2 , Reyes Sierra 1 1 Department of Chemical & Environmental Engineering, University of Arizona 2 Department of Materials Science and Engineering, Cornell University 1
Transcript of Non -PFOS/non -PFAS Photoacid Generators: · PDF fileNon -PFOS/non -PFAS Photoacid Generators:...
NonNon--PFOS/nonPFOS/non--PFAS Photoacid Generators: PFAS Photoacid Generators:
Environmentally Friendly Candidates for Next Environmentally Friendly Candidates for Next
Generation LithographyGeneration Lithography
Victor M Gamez1, Ramakrishan Ayothi 2, Yi Yi 2, James A Field1, Chris K Ober 2, Reyes Sierra1
1 Department of Chemical & Environmental Engineering, University of Arizona2 Department of Materials Science and Engineering, Cornell University
1

Project ObjectivesProject Objectives
To develop novel PFOS-free PAGs that meet the stringent performance demands required by semiconductor manufacturing and do not pose a risk to public health or the environment.
2
Why the development of new PAGs is Why the development of new PAGs is
necessary?necessary?
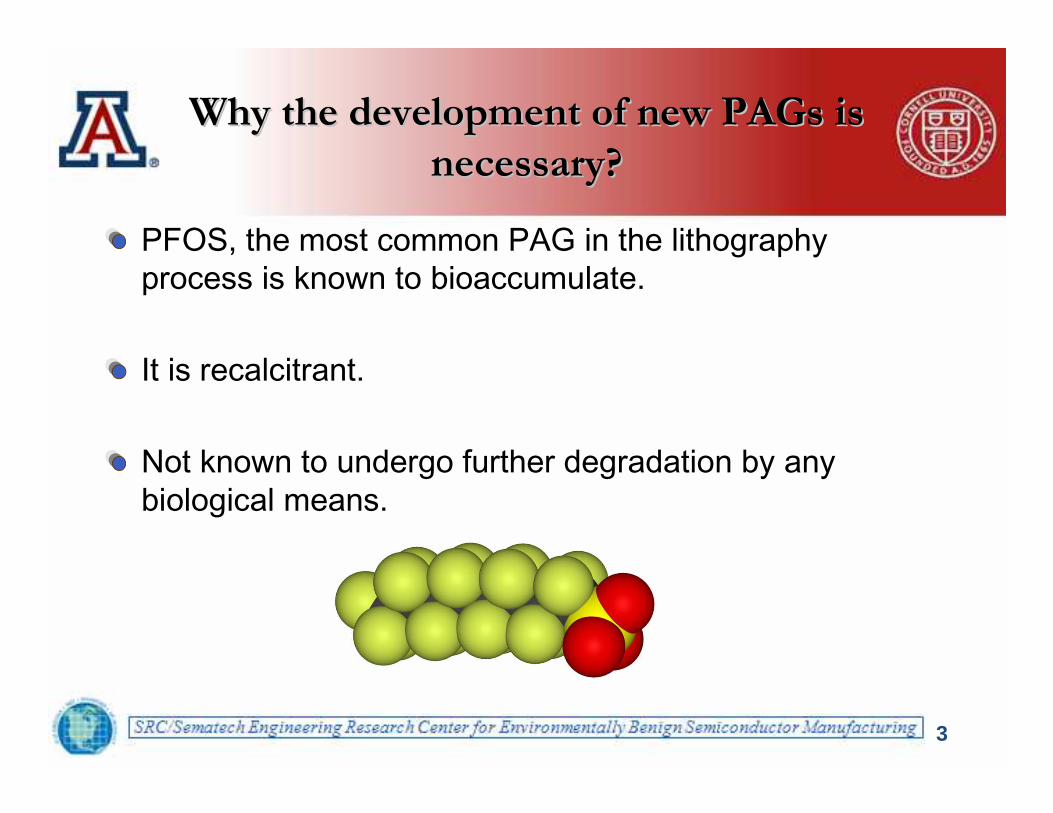
PFOS, the most common PAG in the lithography process is known to bioaccumulate.
It is recalcitrant.
Not known to undergo further degradation by any biological means.
3

Why the development of new PAGs is Why the development of new PAGs is
necessary?necessary?
Relatively high concentrations of PFOS have been reported in mammals, birds, and fish from locations throughout the world.
Giesy et al. (2001) Environ. Sci. Tech. 35:1339Giesy et al. (2001) Environ. Sci. Tech. 35:1339
4

Why the development of new PAGs is Why the development of new PAGs is
necessary?necessary?
PFOS use is being regulated and forbidden for many industries by the EPA:
2002: Proposed Toxic Substances Control Act (TSCA) and Significant New User Rule (SNUR) forbidding the use of PFOS with exemptions for semiconductor industry.2006: Reduction of PFOA emissions by 95% by 2010 and 100% by 2015.2006: SNUR issued to limit the use of 183 PFOAS.
5

Why the development of new PAGs is Why the development of new PAGs is
necessary?necessary?
Replacements for PFOS based on shorter alkyl perfluoronated chains (i.e. PFBS) challenge the same problems that their predecessor:
Recalcitrance
6

Why the development of new PAGs is Why the development of new PAGs is
necessary?necessary?
Any replacement PAG will need to have:
Comparable acidity, sensitivity, miscibility, and superior line edge roughness characteristics in a photoresist formulation.
Will also need to demonstrate improved environmental compatibility.
7

New PAGsNew PAGs
We therefore propose to develop new PFOS-free (and PFAS-free) PAGs (Cornell University) and investigate the environmental behavior of these PFOS-free alternatives (Univ. of Arizona).
8

PAGs and Counterions TestedPAGs and Counterions Tested
9

PAGs and Counterions TestedPAGs and Counterions Tested
10
Environmental Toxicity
MICROTOX MTT ASSAY
METHANOGENIC INHIBITION TEST
11
Material and MethodsMaterial and Methods
The inhibitory potential of three non-PFOS PAGs (SF1, SF2 and PF1) and their counter ions, diphenyl iodonium (DPI) and triphenyl sulfonium (TPS), (Fig. 1) was evaluated using three different bioassays:
the Mitochondrial Toxicity Test (MTT);
MicrotoxⓇ (a widely-used, commercial assay utilizing a marine bacterium that emits fluorescence),
and the methanogenic inhibition test.
12

MTT AssayMTT Assay
WHAT? WHAT? WHAT? WHAT? MTT assay is a laboratory test and a standard colorimetric assay for measuring cellular proliferation (cell growth).
WHY? WHY? WHY? WHY? It is used to determine cytotoxicity of potential toxic materials.The main reaction happens in the mitochondria of living cells. Mitochondria is a component of all Eukaryotic cells (Humans cells are Eukaryotes). Thus this test can be correlated withHuman toxicity.
13

MTT AssayMTT Assay
HOW? HOW? HOW? HOW? Yellow MTT (3-(4,5-Dimethylthiazol-2-yl)-2,5-diphenyltetrazolium bromide) is reduced to purple formazan in the mitochondria of living cells.
This reduction takes place only when mitochondrial reductase enzymes are active, and therefore conversion is directly related to the number of viable (living) cells.
14
YELLOW PURPLE

MTT AssayMTT Assay
A solubilization solution (usually either dimethyl sulfoxide) is added to dissolve the insoluble purple formazan product into a coloredsolution.
The absorbance of this colored solution can be quantified by measuring at a certain wavelength (usually between 500 and 600 nm) by a spectrophotometer.
When compared to untreated control cells, the effectiveness of the agent in causing death of cells can be deduced, through the production of a dose-response curve.
15

MTT AssayMTT Assay
16
Positive control (a known toxicant
is added)
Negative control (no toxicant)
Treatment wells
Less color change indicates more toxicity at that concentration.

MTT AssayMTT Assay
The PAG counter ions, DPI and TPS, showed the highest toxic effects in the MTT assay (Fig. 2). PF1 was the only PAG displaying toxicity in this bioassay.
Fig. 2Fig. 2Fig. 2Fig. 2---- Inhibitory effect of the new non-PFOS PAGs and the PAG counter ions in the MTT bioassay.
17

Microtox AssayMicrotox Assay
WHAT? WHAT? WHAT? WHAT? Microtox is a standardized toxicity test system which is rapid and sensitive. It has a high reproducibility is ecologically relevant and cost effective.
WHY?WHY?WHY?WHY? There exists numerous studies and a large body of published data comparing the Microtox® system with toxicity values for fish, crustaceans and algae for a wide range of organic and inorganic chemicals.
Microtox® assays can be completed withinan hour and a report available within 24
hours, making them a very rapid form of testing.
18

Microtox AssayMicrotox Assay
19

Microtox AssayMicrotox Assay
HOW? HOW? HOW? HOW? The Procedure employs the bioluminescent marine bacterium Vibrio fischeri as the test organism. The bacteria are exposed to a range of concentrations of the material being tested.
The reduction in intensity of light emitted from the bacteria is measured along with standard solutions and control samples. The change in light output and concentration of the toxicant produce a dose / response relationship.
20

Microtox AssayMicrotox Assay
In agreement with the findings of the MTT assay, the PAG counter ions were also the most inhibitory compounds in the Microtox assay (Table 1). PF1 also displayed microbial inhibition, albeit at relatively high concentrations (50% inhibitory concn. (IC50)= 1.6-2.2 mM).
IC50 (µµµµM) IC80 (µµµµM)
Compound 5 min 15 min 30 min 5 min 15 min 30 min
SF1 NT* NT NT NT NT NT
SF2 NT NT NT NT NT NT
PF1 2195 1705 1614 9698 5467 4371
PFBS NT NT NT NT NT NT
DPI 40 10 5 179 48 22
TPS 40 29 38 145 78 76
Table 2.Table 2. Inhibitory effect of the new PAGs and their counter ions in the Microtox bioassay. IC50 and IC80 are the concentrations of the compounds causing 50 and 80% inhibition in the assay.
*NT= Not toxic at the highest concn. tested: SF1 ( 11250 *NT= Not toxic at the highest concn. tested: SF1 ( 11250 µµM); SF2 ( 11250 M); SF2 ( 11250 µµM), PFBS (11250 M), PFBS (11250 µµM)M)
21

Methanogenic InhibitionMethanogenic Inhibition
WHAT?WHAT?WHAT?WHAT? The Methanogenic Inhibition test consist on the measurement of the rate of methane production under anaerobic conditions of a mixed methanogenic inoculate. Usually this inoculate is obtained from Municipal or Industrial Wastewater treatment plants, or sediments.
WHY? WHY? WHY? WHY? Methanogenic-toxicity data are important, since methanogenesis is the final step in the degradation of organic matter in many anaerobic environments, including sediments, wetlands, and wastewater treatment systems.
22

23
Typical Wastewater Treatment Plant
Flow Diagram
Methanogenesis

Methanogenic InhibitionMethanogenic Inhibition
HOW? HOW? HOW? HOW? The test consists of dosing a methanogenic mixed culture with the desired toxicant, then analyze the production rate of methane and compare the results to a control non-dosed set.
Two classes of methanogens were evaluated: hydrogen-utilizing and acetatoclastic methanogens.
24
Mineral Medium
Methanogenic Sludge
%CH4 Measured

Methanogenic InhibitionMethanogenic Inhibition
The counter ions displayed inhibition towards H2 and acetate-utilizing methanogenic microorganisms (Table. 3). In contrast, the PAGs were generally not toxic. SF2 was an exception, with an IC50 value of 1470 µM.Methanogens constitute an important microbial population in anaerobic sludge digestors. Severe methanogenic inhibition can result in process failure.
25
AcetatoclasticAcetatoclasticAcetatoclasticAcetatoclastic HydrogenHydrogenHydrogenHydrogen----utilizingutilizingutilizingutilizingNAMENAMENAMENAME Concentration Concentration Concentration Concentration
((((µµµµM)M)M)M) InhibitionInhibitionInhibitionInhibition Concentration Concentration Concentration Concentration ((((µµµµM)M)M)M) InhibitionInhibitionInhibitionInhibition
SF Sulfonate 1SF Sulfonate 1SF Sulfonate 1SF Sulfonate 1 2589 6.98% ± 0.95% 2589 3.03% ± 3.06%
SF Sulfonate 2SF Sulfonate 2SF Sulfonate 2SF Sulfonate 2 1850 62.60% ± 2.83% 1850 4.45% ± 5.04%
PF Sulfonate 1PF Sulfonate 1PF Sulfonate 1PF Sulfonate 1 1830 42.71% ± 3.63% 1830 -1.68% ± 0.61%
Perfluorobutane sulfonatePerfluorobutane sulfonatePerfluorobutane sulfonatePerfluorobutane sulfonate 1672 15.08% ± 1.46% 1672 7.41% ± 2.21%
TriphenylsulfoniumTriphenylsulfoniumTriphenylsulfoniumTriphenylsulfonium 1519 31.28% ± 2.52% 1519 51.01% ± 20.61%
DiphenyliodoniumDiphenyliodoniumDiphenyliodoniumDiphenyliodonium 1779 55.90% ± 0.72% 711 27.74% ± 4.58%

26
Environmental Behavior
Bioaccumulation
Kow
Biodegradation
Aerobic Anaerobic

BioaccumulationBioaccumulation
The octanol-water partition coefficient (Kow) is a parameter that measures the ability of a compound to dissolve in an organic matrix.
This definition is what allows us to correlate Kow values with bioaccumulation potential.
27
KowBioaccumulation

BioaccumulationBioaccumulation
Log Kow coefficients were estimated and calculated using three different methods:
Fragment addition: based on structural properties.
Software: KOWWIN program to estimate Log Kow.
Chromatography: Linear regression using well-known compounds and comparing retention times.
28

BioaccumulationBioaccumulation
29
Estimation Method
SF1 SF2 PF1 PFBS PFOS
Fragment Addition
-2.35 -2.01 -0.02 NE NESoftware KOWWIN
-2.55 -2.17 0.18 0.26 4.13Chromatograph
y-2.52 -2.06 0.10 0.13 4.20
Due to their intrinsic low acidification constant (strong acidity), the ionic form of the PAGs will be the dominant under normal environmental conditions (neutral PH). Therefore the Log Kow of the ionic form was calculated.
Table 4. Estimates of Log Kow for the ionic PAGs
NE = Not Estimated

BiodegradationBiodegradation
The biodegradation study consisted of three different treatments:
Aerobic Degradation: Compounds as solely carbon and energy source.Methane cooxidation.
Anaerobic Degradation: Hydrogen as electron donor.
30

BiodegradationBiodegradation
31
H2 / CO280% / 20%
O2 / CH4 / CO260% / 20% / 20%
O2 / CO280% / 20%
AEROBICAEROBICAEROBICAEROBIC ANAEROBICANAEROBICANAEROBICANAEROBICCarbon and
Energy SourceMethane
CooxidationHydrogen as
Electron Donor
ACTIVATED SLUDGE DIGESTER SLUDGE

BiodegradationBiodegradation
Biodegradation is a biologically catalyzed transformation of a chemical resulting in simpler forms
Mineralization: Mineralization: Mineralization: Mineralization: Conversion of organic compounds to mineral products.
Biotransformation: Biotransformation: Biotransformation: Biotransformation: transformation of pollutant by a biological process
32

BiodegradationBiodegradation
In this study we measured both mineralization and biotransformation.
Mineralization was estimated by measuring the fluoride released in solution with a fluoride electrode.
Biotransformation was estimated by liquid chromatography with shifting of retention times.
33

Biodegradation: MineralizationBiodegradation: Mineralization
34
Aerobic Treatment Anaerobic Treatment
PAGSolely Carbon and
Energy Source(After 26 days)
Methane Cooxidation(After 75 days)
Hydrogen as Electron Donor (after 158 days)
SF1 0.63 ± 0.04 1.58 ± 0.09 0.53 ± 0.30
SF2 1.57 ± 0.25 1.28 ± 0.05 9.23 ± 0.46
PF1 0.42 ± 0.00 1.29 ± 0.07 0.39 ± 0.13
PFBS ND ND ND
ND= Not Detected (Detection Limit 0.1 ppm Fluoride)
Table 5. Fluoride Released as a % of total fluoride content of PAG

Biodegradation: BiotransformationBiodegradation: Biotransformation
Of the three new PAGs treated, only SF2 showed complete biotransformation, with 100 % of the PAG being biotransformed under anaerobic conditions.
Even though the actual structure of the new compound has not been characterized, based on previous knowledge the most probably path followed is:
35
F- + CO2?
Original Probable intermediate
Unknown intermediates
Mineralization

Conclusions : ToxicityConclusions : Toxicity
The counterions, diphenyl iodonium (DPI) and triphenyl sulfonium(TPS), showed the highest toxic effects in all three tests.
The new PAGs, SF1 and SF2, were not inhibitory, or only at veryhigh concentrations.
PF1 displayed inhibition in the MTT and Microtox assays but the toxicity levels were 1-2 orders of magnitude lower compared to those determined for the counter ions.
36
Conclusions : BiodegradationConclusions : Biodegradation
SF2 was the more biodegradable PAG. Being mineralized to up to 10% under anaerobic conditions.
The addition of a nitro group proved to be favorable for biotransformation, allowing 100% biotransformation for PAG SF2.
37

SummarySummary
Counterions were much more toxic than the PAGs studied.
Addition of different functional groups (aromatic rings, nitro groups), allow the PAGs to be more favorable to biodegradation.
38

Future WorkFuture Work
Complete ongoing studies of the toxicity of PAGs and counter ions under aerobic and nitrifying conditions.
Further investigate the susceptibility of the novel PAGs to biodegradation by microorganisms commonly found in wastewater treatment systems.
39

AcknowledgementsAcknowledgements
SRC/Sematech Engineering Research Center for Environmentally Benign Semiconductor Manufacturing.
Dr. Ober’s Group at Cornell University.
Dr. Reyes Sierra and Dr. Jim Field at University of Arizona.
40