non-OECD (developing countries). - WPMU DEV
27
Transcript of non-OECD (developing countries). - WPMU DEV


•
•
•
•
•
•

Growth in oil demand is slowing.
Growth dominated by China, other
non-OECD (developing countries).
Source: OGJ Forecast & Review, Jan. 7, 2019
2019 2018
OECD 48.1 47.8
Non-OECD 52.5 51.4
Total 100.6 99.2
Quarterly growth

OPEC is yielding to non-OPEC supply:
North American unconventionals, Brazil
Source: OGJ Forecast & Review, Jan. 7, 2019
2019F 2018E
OPEC crude 31.5* 32.5
OPEC NGL 7.0 7.0
Non-OPEC 61.9 60.4
Total 100.4 99.9
*OGJ estimate. Other from IEA.
Quarterly
growth

2019 Vs. 2018
Demand 100.6 +1.4
Non-OPEC supply 61.9 +1.5
OPEC NGL 7.0 NC
Need for OPEC
crude
31.7 -0.1
OPEC crude 31.5 -1.0
Stock change -0.2 -0.9
Main changes in IEA February:
Non-OPEC supply--64.4
Stock change--+0.3
Key
uncertainties:
Demand growth
(and, therefore,
global
economy)
OPEC restraint
after agreement
expires in JuneSource: IEA Oil Market Report,
December 2018 with OGJ
projection for OPEC crude

THE LEADERS (MMB/D)
Saudi
Arabia Russia
Orig. quota 10.54 11.597
Oct. 2017 10.05 11.303
Oct. 2018 10.65 11.79
Agreed in
December:
Needed
cut +
Cut 0.230
December 2018 agreement: Cut
1.2 MMb/d from October levels,
800 Mb/d OPEC, 400 Mb/d non-
OPEC
Inventories
Vienna, Dec. 2016: Cuts of 1.2 MMb/d by 12 OPEC members, 600
Mb/d by 10 nonmembers, effective Jan. 2017.
Production surged late 2018 to compensate for losses from Venezuela,
others, expected from Iranian sanctions scheduled for November but
waived for 6 months (until May, one month before OPEC meets).
Source:
OGJ F&R
OPEC production;
world supply
The oil market seems to crave
coordinated supply management
*OPEC+ cuts started
Jan. 2017
*

•
•
•
•
•
•
•
•
•
•
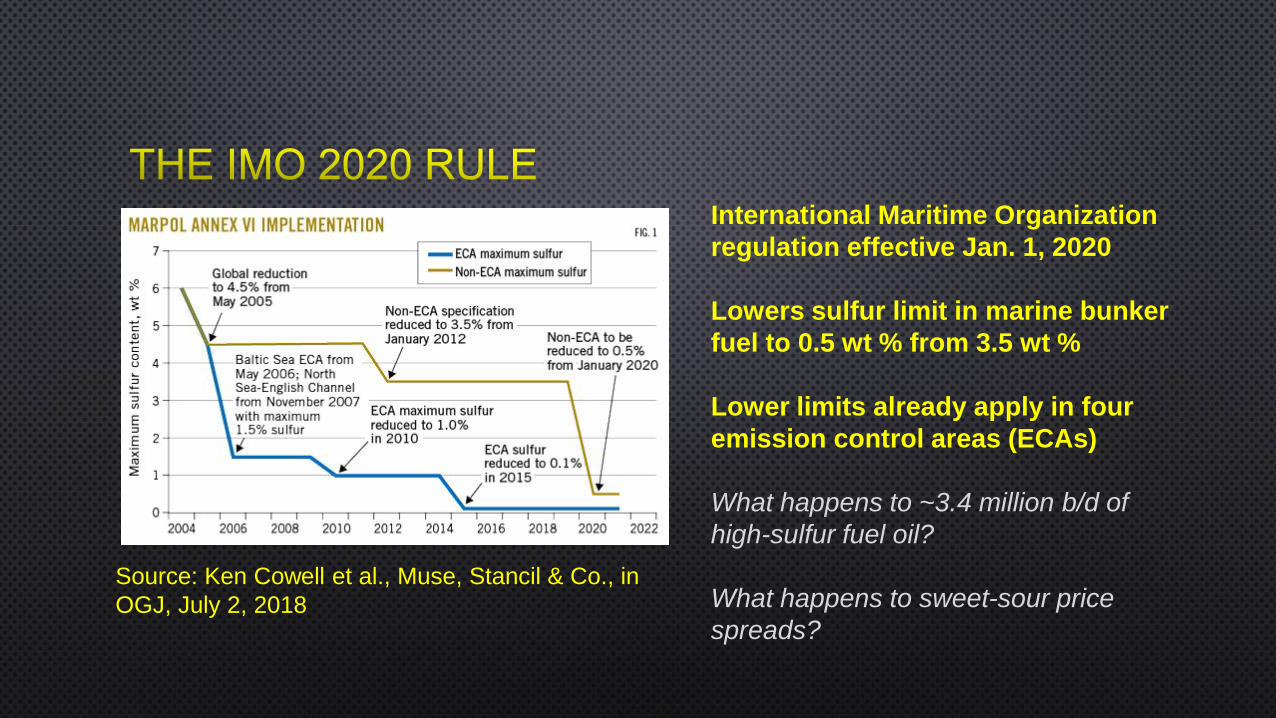
International Maritime Organization
regulation effective Jan. 1, 2020
Lowers sulfur limit in marine bunker
fuel to 0.5 wt % from 3.5 wt %
Lower limits already apply in four
emission control areas (ECAs)
What happens to ~3.4 million b/d of
high-sulfur fuel oil?
What happens to sweet-sour price
spreads?
Source: Ken Cowell et al., Muse, Stancil & Co., in
OGJ, July 2, 2018

LNG=liquefied natural gas
MGO=marine gas oil
ECA=Emission control area
LSFO=low sulfur fuel oil
HSFO=high sulfur fuel oil
● Refinery runs will rise
● Sweet-sour crude spreads
will increase
● Prices of distillate-range
products (diesel) will rise
Source: “Ship compliance will determine IMO 2020 market impact,” Chris Cote, ESAI Energy LLC,
OGJ, Jan. 7, 2019

2019 2018
Amount
MMb/d
Change
%
Amount
MMb/d
Change
%
Motor gasoline 9.370 +0.6 9.311 -0.2
Jet fuel 1.780 +3.5 1.720 +2.3
Distillate 4.200 +1.7 4.130 +5.0
Residual 0.320 +0.6 0.318 -7.0
LPG + ethane 3.150 +5.4 2.990 +13.1
Other products 2.060 +0.5 2.050 +0.9
TOTAL 20.880 +1.8 20.519 +2.8
Source: OGJ Forecast & Review, Jan. 7, 2019
Gasoline is no longer the growth market

2019 2018
Amount
MMb/d
Change
%
Amount
MMb/d
Change
%
Crude & cond. 12.070 +10.7 10.900 +16.6
NGPL 5.000 +14.2 4.380 +15.8
TOTAL FIELD 17.070 +11.7 15.280 +16.3
Renewables,
oxygenates
1.220 -0.8 1.230 +3.4
Proc. gain, etc. 1.120 -0.9 1.130 +1.7
TOTAL
SUPPLY
19.41 +10.0 17.64 +14.0
Source: OGJ Forecast & Review, Jan. 7, 2019
Unless oil prices crash, growth
constraint is physical until Permian
pipelines open in 2H 2019

2019 2018
Amount
MMb/d
Change
%
Amount
MMb/d
Change
%
Crude imports 7.700 -1.9 7.850 -1.5
Product imports 2.250 -0.9 2.270 +4.4
TOT. IMPORTS 9.950 -1.7 10.120 -0.2
Crude exports 2.800 +33.3 2.100 +81.3
Product exports 5.890 +6.1 5.550 +6.4
TOT. EXP’TS 8.690 +13.6 7.650 +20.0
NET IMPORTS 1.26 2.47
Source: OGJ Forecast & Review, Jan. 7, 2019
Net-exporter status
is in view

2019 2018
Amount
MMb/d
Change
%
Amount
MMb/d
Change
%
Crude runs 17.03 +0.7 16.92 +2.0
Total inputs 17.20 -0.3 17.26 +2.1
Refining cap. 18.62 +0.1 18.60 +0.2
Cap. utilization 92% 93%
High refinery utilization reflects
margins widened by US crude price
discount to Brent

2019 2018
Amount
tcf
Change
%
Amount
tcf
Change
%
Production 35.697 +9.1 32.715 +12.0
Pipeline
imports
2.612 -8.4 2.851 -3.8
LNG imports 0.073 +5.3 0.069 -11.1
Pipeline
exports
3.066 +15.1 2.665 +8.3
LNG exports 2.044 +89.8 1.077 +52.1
Net exports 2.425 0.822
Source: OGJ Forecast & Review, Jan. 7, 2019
Exports will
grow with LNG
project starts


Source: US Energy Information Administration, 2018 Annual Energy Outlook

•
•
•
•
•

New Policies ScenarioSustainable Development
Scenario
Source: International Energy Agency World Energy Outlook 2018
2017-40:
Oil -29%
Gas +11%
2017-40:
Oil +10%
Gas +43%

New Policies Scenario Sustainable Development Scenario
Source: International Energy Agency World Energy Outlook 2018

Source: International Energy Agency World Energy Outlook 2018
103.4
MMb/d
68
MMb/d
2017:
92.8
MMb/d
Change vs. 2017:
New Policies +11.4%
Sustainable
Development -26.7%
Policy is important!
Oil and gas investment
still needed because
depletion exceeds the
demand-decline rate!

Source: International Energy Agency World Energy Outlook 2018
Net petrochem change: 4.81 MMbd
Oil demand for
petrochemical feedstocks
grows in both scenarios

Source: International Energy Agency World Energy Outlook 2018

Source: International Energy Agency World Energy Outlook 2018
Consumption,
production
declining by
2040 but still
above 2017
levels

Source: International Energy Agency World Energy Outlook 2018

Source: International Energy Agency World Energy Outlook 2018
LNG will overtake
pipeline share of gas
trade in this period
US LNG growing
rapidly under uniquely
flexible contracts
Economically, gas will
act increasingly like oil
(but never totally)

•
•
•
•
•
•
•

BOB TIPPEE, EDITOR, OIL & GAS JOURNAL
1455 W. LOOP S., SUITE 400
HOUSTON, TX 77027
OGJ ONLINE: WWW.OGJ.COM
OIL & GAS COMMUNITY: WWW.OGJ.COM/OILANDGASCOMMUNITY


![[OECD. Published by OECD Publishing] Regionalism(BookFi.org)](https://static.fdocuments.us/doc/165x107/55cf9387550346f57b9dbc6c/oecd-published-by-oecd-publishing-regionalismbookfiorg.jpg)