Non-Newtonian Blood Flow in Left Coronary Arteries with ... · Non-Newtonian Blood Flow in Left...
21
Copyright © 2016 Tech Science Press MCB, vol.13, no.1, pp.1-21, 2016 Non-Newtonian Blood Flow in Left Coronary Arteries with Varying Stenosis: A Comparative Study PoojaJhunjhunwala 1 , P.M. Padole 2 and S.B. Thombre 3 Abstract: This paper presents Computational fluid dynamic (CFD) analysis of blood flow in three different 3-D models of left coronary artery (LCA). A comparative study of flow parameters (pressure distribution, velocity distribution and wall shear stress) in each of the models is done for a non-Newtonian (Carreau) as well as the Newtonian nature of blood viscosity over a complete cardiac cycle. The difference between these two types of behavior of blood is studied for both transient and steady states of flow. Additionally, flow parameters are compared for steady and transient boundary conditions considering blood as non-Newtonian fluid. The study shows that the highest wall shear stress (WSS), velocity and pressure are found in artery having stenosis in all the three branches of LCA. The use of Newtonian blood model is a good approximation for steady as well as transient blood flow boundary conditions if shear rate is above 100 s -1 . However, the assumption of steady blood flow results in underestimating the values of flow parameters such as wall shear stress, pressure and velocity. Keywords: Left coronary artery, computational fluid dynamics, non-newtonian, plaque, transient. 1 Introduction Computational Fluid Dynamics (CFD) is a branch of Fluid Mechanics which helps in predicting fluid flow, mass transfer, heat transfer etc. related phenomena of complex bodies by solving governing non-linear mathematical equations using a numerical process. Recently, CFD has gained popularity in biomedical research of cardiovascular related problems. Since, in-vivo measurements for quantification of the hemodynamic of healthy and stenosed arteries are complicated and expensive, CFD is a very useful tool for studying such type of artery flows [Govindaraju, Badruddin, Viswanathan, et al., 1 Department of Mechanical Engineering, VNIT, Nagpur, India Pooja Jhunjhunwala- +91-8149884920; [email protected] 2 Department of Mechanical Engineering, VNIT, Nagpur, India P. M. Padole- +91-9822220713; [email protected] 3 Department of Mechanical Engineering, VNIT, Nagpur, India S.B. Thombre- +91- 9422803441; [email protected]
-
Upload
hoanghuong -
Category
Documents
-
view
216 -
download
2
Transcript of Non-Newtonian Blood Flow in Left Coronary Arteries with ... · Non-Newtonian Blood Flow in Left...
Copyright © 2016 Tech Science Press MCB, vol.13, no.1, pp.1-21, 2016
Non-Newtonian Blood Flow in Left Coronary Arteries with
Varying Stenosis: A Comparative Study
PoojaJhunjhunwala1, P.M. Padole2and S.B. Thombre3
Abstract: This paper presents Computational fluid dynamic (CFD) analysis of blood
flow in three different 3-D models of left coronary artery (LCA). A comparative study of
flow parameters (pressure distribution, velocity distribution and wall shear stress) in each
of the models is done for a non-Newtonian (Carreau) as well as the Newtonian nature of
blood viscosity over a complete cardiac cycle. The difference between these two types of
behavior of blood is studied for both transient and steady states of flow. Additionally,
flow parameters are compared for steady and transient boundary conditions considering
blood as non-Newtonian fluid.
The study shows that the highest wall shear stress (WSS), velocity and pressure are found
in artery having stenosis in all the three branches of LCA. The use of Newtonian blood
model is a good approximation for steady as well as transient blood flow boundary
conditions if shear rate is above 100 s-1. However, the assumption of steady blood flow
results in underestimating the values of flow parameters such as wall shear stress,
pressure and velocity.
Keywords: Left coronary artery, computational fluid dynamics, non-newtonian, plaque,
transient.
1 Introduction
Computational Fluid Dynamics (CFD) is a branch of Fluid Mechanics which helps in
predicting fluid flow, mass transfer, heat transfer etc. related phenomena of complex
bodies by solving governing non-linear mathematical equations using a numerical
process. Recently, CFD has gained popularity in biomedical research of cardiovascular
related problems. Since, in-vivo measurements for quantification of the hemodynamic of
healthy and stenosed arteries are complicated and expensive, CFD is a very useful tool
for studying such type of artery flows [Govindaraju, Badruddin, Viswanathan, et al.,
1 Department of Mechanical Engineering, VNIT, Nagpur, India
Pooja Jhunjhunwala- +91-8149884920; [email protected]
2 Department of Mechanical Engineering, VNIT, Nagpur, India
P. M. Padole- +91-9822220713; [email protected]
3 Department of Mechanical Engineering, VNIT, Nagpur, India
S.B. Thombre- +91- 9422803441; [email protected]

2 Copyright © 2016 Tech Science Press MCB, vol.13, no.1, pp.1-21, 2016
(2013)]. The flow parameters like wall shear stress (WSS), velocity and pressure
distributions can be obtained through CFD simulations for both steady and transient
states [Johnston, Johnston, Corney, et al., (2006), Perktold, Hofer, Rappitsch,et al.,
(1997)]. These results can help doctors to improve clinical decisions.
In the present world, Coronary artery disease (CAD) is major cause of death and
morbidity [Sun and Xu(2014)]. This is an inflammatory disease with plaque deposition in
the wall of arteries [Hansson (2005)]. It is known from clinical practice that specific
locations in coronary arteries are prone to the development of stenosis (plaque
deposition). Left coronary bifurcation is the most common site for plaque origination
[Chaichana, Sun and Jewkes (2011)]. Local haemodynamics plays an important role in
the origination and development of these plaques at left coronary bifurcation [Gijsen, van
de Vosse and Janssen (1999)]. Wall shear stress, pressure distribution, velocity
distribution, secondary flow and flow separation have crucial role in growth and
origination of stenosis [Govindaraju, Badruddin, Viswanathan, et al., (2013)]. The
stenosis is predominantat bends and bifurcation as it results into disturbance in bloodflow,
creation of secondary flow and flow separation [Wellnhofer, Osman, Kertzscher, et al.,
(2010)]. Hence, in the present work, the effects of different types of stenosis in a left
coronary artery (LCA) on flow parameters such as WSS, velocity and pressure
distribution have been analysed under different boundary conditions. Chaichana, Sun and
Jewkes [Chaichana, Sun andJewkes (2013)] have made haemodynamic analysis of the
effects of different types of plaques in LCA assuming blood as a Newtonian fluid.
However, it is known that blood is a shear thinning fluid and hence it needs to be
considered as a non-Newtonian fluid.
Many previous works have been done assuming blood as a Newtonian fluid, giving
argument that in large arteries, shear rates are high and blood behaves as a Newtonian
fluid if shear rate is greater than100 s-1 [Gijsen, van de Vosse and Janssen (1999)].
Johnston, Corney and Kilpatrick [Johnston, Johnston, Corney, et al., (2004)] have
suggested that for flow velocities in steady state simulations, non-Newtonian effects are
important. However, for unsteady flow in coronary arteries, there is no consensus in the
literatures on importance of effects of non-Newtonian model of blood. On one hand some
studies [Gijsen, Vosse and Janssen (1999), Deville(1996)] claim non-Newtonian
rheology to be important, on the other handsome studies [Ballyk, Steinman and Ethier
(1994), Johnston, Johnston, Corney, et al., (2006)] found it relatively unimportant. The
present study, therefore, has been made for both models (Newtonian and non-Newtonian)
of blood under steady as well as transient state of flow.
The aims of this research work are:
To study the results of flow parameters in a complete cardiac cycle for three different
(idealized 3-D) models of LCA.
To compare the results derived by Newtonian and non-Newtonian (Carreau) models
of blood for steady state as well as transient state separately.
To compare the results of non-Newtonian model of blood for steady and transient
state, so as to study the justification for assumption of steady state flow.
In the present study, the artery walls have been assumed to be rigid, smooth and
impermeable. Although, it is known that actual artery walls are irregular and elastic in

on-Newtonian Blood Flowin Left Coronary Arteries 3
nature because of which alteration in geometry during a cardiac cycle occurs. Also in this
work, flow is simulated on a fixed mesh, but it is also known that coronary artery moves
during a cardiac cycle. However, Santamarina, Weydahl, Siegel and Moore [Santamarina,
Weydahl, Siegel, et al., (1998)] mentioned in their work that no significant change in
velocity is observed due to movement of coronary artery if it's frequency is up to 1 Hz.
Hence, these assumptions can be made as it may not significantly influence the obtained
results.
2 Materials and methods
2.1 Geometry modeling and mesh generation
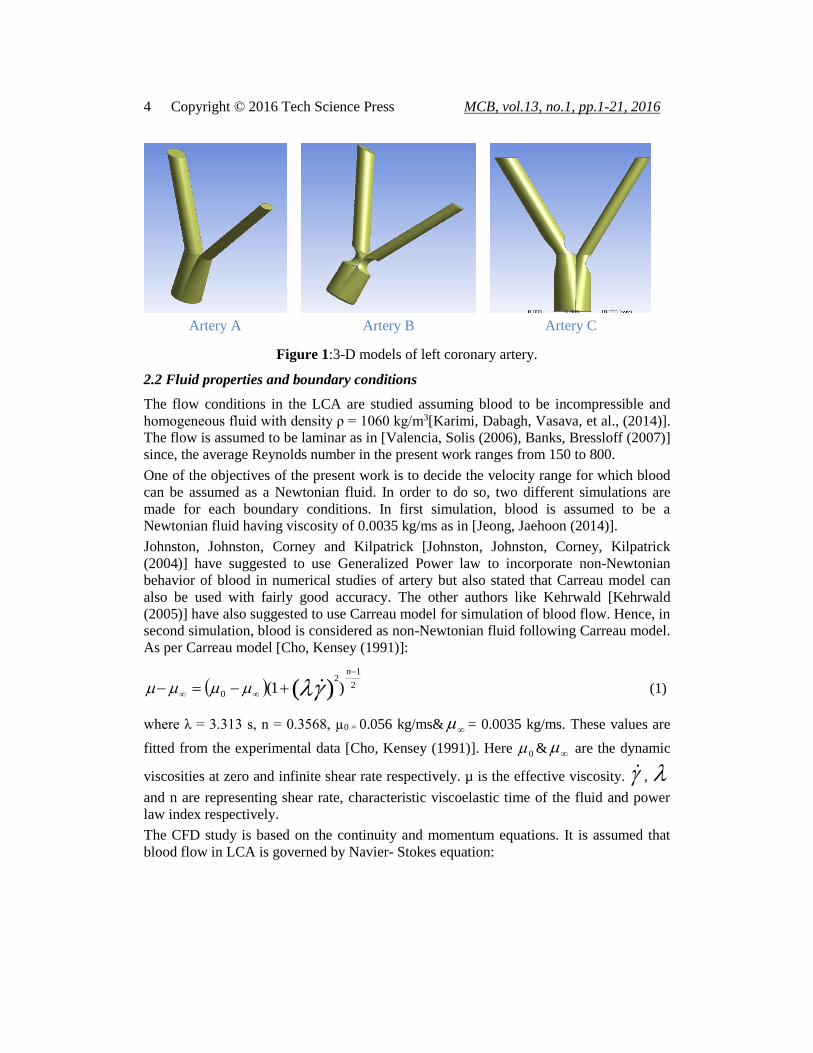
In order to compare the effects of plaque deposition (stenosis) on the flow parameters
inside the left coronary artery (LCA), three different models - healthy LCA (artery A),
LCA having stenosis at single location (artery B) and LCA having multiple stenosis
(artery C) are modeled as shown in Fig. 1. Many earlier research papers have stated
complex flow in certain locations of arteries leads to deposition of plaque. Branching,
bifurcation and curvature of arteries causes complex flow in arteries [Valencia, Solis
(2006)]. Deposition of plaque in LCA is most common at location where it gets
bifurcated [Sun, Cao (2011)]. It is also supported by clinical results. Therefore, plaque
deposition in models B and C are made in accordance with the previous literatures and
clinical practice. In some literatures [Pericevic, Lally, Toner, et al., (2009)], it is
mentioned that geometry of artery can be assumed to be almost tubular and symmetrical.
In the present work, 3-D models of LCA are modeled with this assumption. All three
models are constructed in SolidWorks (a commercial 3D CAD software). The length and
diameter of LCA before bifurcation (LMS) are considered to be 8 mm and 5 mm
respectively as per the clinical values. The length of LCA after bifurcation i.e. of LAD
(Left Anterior Descending) and LCx (Left Circumflex) both is 16 mm. However,
diameter of LAD is 3 mm and that of LCx is 2mm. The bifurcation angle is 60˚. The
geometries of all three models are nearly same. The only difference between these is
reduction in volume due to stenosis near point of bifurcation at single location in artery B
and multiple locations in artery C. In artery B, the deposited plaque is assumed to be
circular and symmetrical. However, in artery C plaque deposition at distal wall of LAD is
noncircular.
The 3-D CAD models are imported into pre-processing program for mesh generation
(ANSYS v 14.5). The models A, B and C are discretized into 141699, 146898 and
1000770 elements respectively. Meshes were further refined to perform grid
independency test. The relative errors in the results were negligible. However, further
refinement of mesh is neglected in order to save the computational time.
4 Copyright © 2016 Tech Science Press MCB, vol.13, no.1, pp.1-21, 2016
Artery A Artery B Artery C
Figure 1:3-D models of left coronary artery.
2.2 Fluid properties and boundary conditions
The flow conditions in the LCA are studied assuming blood to be incompressible and
homogeneous fluid with density ρ = 1060 kg/m3[Karimi, Dabagh, Vasava, et al., (2014)].
The flow is assumed to be laminar as in [Valencia, Solis (2006), Banks, Bressloff (2007)]
since, the average Reynolds number in the present work ranges from 150 to 800.
One of the objectives of the present work is to decide the velocity range for which blood
can be assumed as a Newtonian fluid. In order to do so, two different simulations are
made for each boundary conditions. In first simulation, blood is assumed to be a
Newtonian fluid having viscosity of 0.0035 kg/ms as in [Jeong, Jaehoon (2014)].
Johnston, Johnston, Corney and Kilpatrick [Johnston, Johnston, Corney, Kilpatrick
(2004)] have suggested to use Generalized Power law to incorporate non-Newtonian
behavior of blood in numerical studies of artery but also stated that Carreau model can
also be used with fairly good accuracy. The other authors like Kehrwald [Kehrwald
(2005)] have also suggested to use Carreau model for simulation of blood flow. Hence, in
second simulation, blood is considered as non-Newtonian fluid following Carreau model.
As per Carreau model [Cho, Kensey (1991)]:
2
12
0 )1( )(
n
(1)
where λ = 3.313 s, n = 0.3568, µ0 = 0.056 kg/ms& = 0.0035 kg/ms. These values are
fitted from the experimental data [Cho, Kensey (1991)]. Here 0 & are the dynamic
viscosities at zero and infinite shear rate respectively. µ is the effective viscosity. ,
and n are representing shear rate, characteristic viscoelastic time of the fluid and power
law index respectively.
The CFD study is based on the continuity and momentum equations. It is assumed that
blood flow in LCA is governed by Navier- Stokes equation:

on-Newtonian Blood Flowin Left Coronary Arteries 5
pvvt
v
. (2)
and Continuity equation:
p = 0 (3)
for incompressible fluid.
In the above equations, v is 3-dimensional velocity vector, ρ is density, t is time, τ is
stress tensor and p is the pressure. Writing Navier-Stokes equation in the form of stress
tensor gives the flexibility to use any non-Newtonian model. These highly non-linear
governing equations are solved numerically using finite volume method (FVM) as
implemented in the software package ANSYS FLUENT v 14.5 for CFD related problems.
A set of boundary conditions are required for solving the governing equations. The solid
walls of the LCA models are assumed to be rigid as in Johnston, Johnston, Corney and
Kilpatrick [Johnston, Johnston, Corneyet al., (2006)]. The no-slip condition is imposed
on velocities of artery walls. At the outlets of artery, the gauge pressure is set to 100 mm
Hg (mean of normal systolic and diastolic pressure). Physiologically, blood flow inside
artery is pulsatile in nature. At the inlet of the artery, an uniform time-varying velocity
profile [Jhunjhunwala, Padole andThombre (2015)] as shown in Fig. 2 is imposed to
include pulsatile flow in the simulation. The flow pattern of sinusoidal wave during
systole [Sinnott, Clearly and Prakash (2006), He, Duraiswamy, Frank et al., (2005);
Duraiswamy, Schoephoerster and Moore (2009)] is used as an approximation to
physiological pulse. Diastole phase in the assumed velocity profile represents cut-off of
supply from the heart having constant velocity of 0.1 m/s. The assumed velocity wave
form yields a maximum inlet velocity of 0.5 m/s with a rapid heartbeat (during exercise)
of 120 per minute. The duration of a complete cycle is 0.5s. The uniform-transient
velocity profile at the inlet is defined in the software by user defined function (UDF). To
compare Newtonian and non-Newtonian models of blood for steady flow, a constant inlet
velocity of 0.36 m/s [Owega, Klingelhofer, Sabri et al., (1998)] is assumed.

6 Copyright © 2016 Tech Science Press MCB, vol.13, no.1, pp.1-21, 2016
Figure 2: Blood flow velocity profile into LCA
The used CFD code utilizes a solver of implicit formulation. The 'SIMPLE' algorithm is
selected for the pressure-velocity coupling. For spatial discretization of pressure,
Standard technique is used. Second Order Upwind discretization method is applied for
momentum equations. The transient flow analysis is conducted with time step size of
0.01 s. Two cycles (100 time steps) are required to achieve a period independent solution.
Therefore, results of the second cycle are only presented in the result section. The
convergence criterion (difference between two consecutive iterations) is 10-4 for all
equations since it gives satisfactory result for each time step.
3 Results and discussion
3.1 Analysis of flow parameters in the three artery models
A set of plots of flow parameters (velocity, pressure and WSS) for each of the three LCA
models were obtained for the non-Newtonian model (Carreau) of blood under transient
state at various time instances. As an illustration, Figs. 3-5 contains plots of velocity,
pressure and WSS respectively for the three arteries at t = 0.55s. If these are studied, flow
parameters can be compared in the three models.
3.1.1 Description of velocity inside the LCA
In the velocity vector plot (Fig. 3), the velocity values ranged from 0 m/s to 2.4 m/s
corresponding to five contour levels, approximately 0.5 m/s at per level. Fig. 3 (b & c)
shows the region of high velocities, ranging from 1.64 m/s to 2.4 m/s at the stenotic
locations in the yellow and red contour levels. Artery B had the plaques located in the
LMS (left main stem), so the high velocity was observed at the stenotic regions of LMS.
Artery C had stenosis in the regions of LMS, LAD and LCx branches, so high velocity
00.05
0.10.15
0.20.25
0.30.35
0.40.45
0.50.55
0.6
0 0.1 0.2 0.3 0.4 0.5 0.6
Infl
ow
ve
loci
ty (
m/s
)
Flow time (s)
Blood flow velocity profile in a cardiac cycle

on-Newtonian Blood Flowin Left Coronary Arteries 7
was observed at the stenosed locations of these branches of LCA in the plot. However,
velocity is also high downstream of stenosis which eventually gets reduced as blood
flows forward in both artery B and C. It shows flow reversal occurs (due to recirculation)
downstream the plaque locations in the two stenosed models (B & C) which does not
occur in case of artery A (healthy artery).
Artery A
Artery B
Artery C
Figure 3: Velocity distribution at t = 0.55 s
3.1.2 Description of pressure inside the LCA
The pressure contour plot (Fig. 4) indicates the pressure ranges from 12748 Pa to 16099
Pa, corresponding to 5 contour levels. The high pressure region in all three models is at
the point of bifurcation and near entrance which extends downstream with the growth of
stenosis and increase in velocity within a cardiac cycle. It is due to the fact, that flow
does not have stagnation point in stenosed artery [Valencia A., Solis F. (2006)]. In the
post stenotic regions, pressure gets reduced.

8 Copyright © 2016 Tech Science Press MCB, vol.13, no.1, pp.1-21, 2016
Artery C
Figure 4: Pressure distribution at t = 0.55 s
3.1.3 Description of WSS inside the LCA
The WSS ranges from 0 Pa to 223 Pa as shown in Fig. 5. The high WSS ranging from
164 Pa to 223 Pa lies in the stenotic regions [Fig. 5 (b & c)]. WSS is minimum near the
entrance which reaches its maximum at stenotic regions and gradually decreases
downstream the flow. Wall shear stress is maximum at the point of bifurcation for artery
A {Fig. 5 (a)}. This, in fact is responsible for the development of growth of stenosis near
bifurcation region [Jhunjhunwala, Padole andThombre. (2015)].
Artery A
Artery B
Artery C
Figure 5: Wall shear stress distribution at t = 0.55 s
3.1.4Variation of flow parameters for a cardiac cycle

on-Newtonian Blood Flowin Left Coronary Arteries 9
The maximum values attained by velocity, pressure and WSS over a cardiac cycle for the
three models are shown in Figs. 6-8. It is observed that, the maximum values of flow
parameters increase and reaches its peak at peak value of systole while wave form is
accelerating, then decreases (during decelerating phase) and becomes constant in diastole.
It shows that during a cardiac cycle, there is continuous variation in hemodynamic
parameters which will eventually affects the physiology of blood. A drastic increase
(maximum for artery C) in values of flow parameters can also be observed from Figs. 6-8,
which shows it is important to study arteries having different types of plaques with
varying percentage of stenosis.
Figure 6: Variation in maximum velocity during a cardiac cycle
Figure 7: Variation in maximum pressure during a cardiac cycle
Figure 8: Variation in maximum wall shear stress during a cardiac cycle

10 Copyright © 2016 Tech Science Press MCB, vol.13, no.1, pp.1-21, 2016
3.2 Comparison of flow parameters
For each of the three geometric models of left coronary artery and for the two blood viscosity
models (described in section 2.2), series of simulations were performed separately under steady
as well as transient states. However, same trend in results were observed for all the three left
coronary arteries. Therefore, for comparison purpose of different models of blood and flow,
results of only artery C have been illustrated in the subsequent sections. Artery C is selected
because it represents the worst physiological conditions.
3.2.1Newtonian vs non-Newtonian model fortransient flow
The WSS, velocity and pressure distribution contour plots of artery C for Carreau blood
viscosity and Newtonian models are shown in Figs. 9-11 respectively. Distributions are
presented at the time instants of 0.55 s, 0.6 s, 0.65 s, 0.7 s, 0.75 s and 1 s within the
cardiac cycle. Results at these time instants were chosen as they represent:
t1 = 0.55 s, middle of the accelerating phase of systole
t2 = 0.6 s, peak of systole
t3 = 0.65 s, middle of the decelerating phase of systole
t4 = 0.7 s, just before onset of diastole
t5 = 0.75 s, initial diastolic phase
t6 = 1 s, end of cardiac cycle
t = 0.55 s
t = 0.6 s

on-Newtonian Blood Flowin Left Coronary Arteries 11
t = 0.65 s
t = 0.7 s
t = 0.75 s
t = 1 s
(a) (b)

12 Copyright © 2016 Tech Science Press MCB, vol.13, no.1, pp.1-21, 2016
Figure 9: Distribution of wall shear stress in artery C at different time instants of
transient state simulations for (a) Newtonian (b) non-Newtonian models of blood
t = 0.55 s
t = 0.6 s
t = 0.65 s
t = 0.7 s

on-Newtonian Blood Flowin Left Coronary Arteries 13
t = 0.75 s
t = 1 s
(a) (b)
Figure 10: Distribution of velocity in artery Cat different time instants of transient state
simulations for (a) Newtonian (b) non-Newtonian models of blood
t = 0.55 s
t = 0.6 s

14 Copyright © 2016 Tech Science Press MCB, vol.13, no.1, pp.1-21, 2016
t = 0.65 s
t = 0.7 s
t = 0.75 s
t = 1 s
(a) (b)
Figure 11: Distribution of pressure in artery Cat different time instants of transient state
simulations for (a) Newtonian (b) non-Newtonian models of blood

on-Newtonian Blood Flowin Left Coronary Arteries 15
It can be observed from the Figs. 9-11, that there is almost no visual difference in WSS,
velocity and pressure distributions between the two blood viscosity models of LCA
throughout the cardiac cycle. The inlet velocity throughout the cardiac cycle ranges
between 0.1 -0.5 m/s. The maximum value reached by these flow parameters at above
mentioned time instants are presented in Table 1. Evidently, quantity wise there is no
difference in the two blood models under transient state which is in close agreement with
the results of [Johnston, Johnston, Corney, et al., (2006)].
Table 1: Maximum values attained by flow parameters in artery C for the two blood
models at different time instants of transient state simulation
Time
(s)
Artery C
Newtonian Non-Newtonian
Velocity
(m/s)
Pressure
( mm Hg)
Wall Shear
Stress (Pa)
Velocity
(m/s)
Pressure
( mm Hg)
Wall Shear
Stress (Pa)
0.55 2.3973 120.742 222.729 2.3973 120.742 222.729
0.6 3.1619 130.502 341.892 3.1619 130.502 341.892
0.65 2.7651 123.616 278.35 2.7651 123.616 278.35
0.7 1.3913 106.13 90.348 1.3913 106.13 90.348
0.75 0.7487 102.631 35.233 0.7487 102.631 35.233
1 0.7655 102.651 36.33 0.7655 102.651 36.33
This similarity in the results of the two blood models is due to the fact that at high shear
rates, Carreau blood model behaves as a Newtonian fluid [Sun, Xu (2014)]. It is also
worth to mention here that at high shear rates, approximately all non-Newtonian models
of blood behaves as a Newtonian fluid [Perktold, Hofer, Rappitsch et al., (1997)]. It can
be concluded here, that assumption of blood as a Newtonian fluid in the arteries where
shear rate is high can be valid. However, many previous studies have suggested that at
low shear rates or low inlet velocities, blood behaves as a non-Newtonian fluid and
during a cardiac cycle, there comes a point when shear rate is below 100 s-1 or inlet
velocity is very low (less than 0.05 m/s) [Banks, Bressloff (2007)]. In the present results
throughout the cardiac cycle, there is no point where blood is behaving as a non-
Newtonian fluid. It could be due to the fact, that in the presented case, the assumed
cardiac cycle profile is for the condition of moderate exercise with the rapid heartbeat of
120 per minute. During the whole cycle, inlet velocity ranges from 0.1 m/s to 0.5 m/s
which corresponds to shear rates of 150 s-1 -750 s-1. Hence, it is worth to perform
transient simulations with an inflow profile which incorporates the instants of low shear
rate during a cardiac cycle. This work will give an insight whether assumption of blood
as a Newtonian fluid under transient state for low inlet velocities is valid?
3.2.2Newtonian vs non-Newtonian model for steady flow
A series of steady state simulations were performed for each of the three arteries and for
each of the two blood viscosity models. The inlet velocity was taken to be 0.36 m/s.

16 Copyright © 2016 Tech Science Press MCB, vol.13, no.1, pp.1-21, 2016
The plots of WSS, pressure and velocity distributions for two of the blood models are
presented for artery C in Figs. 12-14. It can be observed (Figs. 12-14) that the pattern of
plots is similar for the two blood models. However, the magnitude of the maximum
values attained by these flow parameters differs slightly for the two blood models (for all
three arteries) as presented in Table 2. The difference between the results of two blood
models is even less than 5 % which is negligible. For inlet velocity of 0.36 m/s this result
is not surprising, as Carreau model tends to the Newtonian model at high shear rates. As
the inlet velocity increases, magnitude of the flow parameters becomes similar for the
two blood models and are almost indistinguishable.
(a)
(b)
Figure 12: Distribution of wall shear stress in artery Cover steady flow (v = 0.36 m/s) for
(a) Newtonian (b) non-Newtonian models of blood
(a)
(b)
Figure 13: Distribution of pressure in artery Cover steady flow (v = 0.36 m/s) for (a)
Newtonian (b) non-Newtonian models of blood

on-Newtonian Blood Flowin Left Coronary Arteries 17
(a)
(b)
Figure 14: Distribution of velocity in artery Cover steady flow (v = 0.36 m/s) for (a)
Newtonian (b) non-Newtonian models of blood
Table 2: Maximum values attained by flow parameters for the two blood models in
steady flow.
Artery
Models
V = 0.36 m/s
Newtonian Non-Newtonian
Velocity
(m/s)
Pressure
( mm Hg)
Wall Shear
Stress (Pa)
Velocity
(m/s)
Pressure
( mm Hg)
Wall Shear
Stress (Pa)
A 1.2965 107.32 43.4475 1.2942 107.42 44.3697
B 2.3408 115.96 185.7776 2.3418 116.08 186.579
C 2.5795 118.19 208.61 2.584 118.29 209.7272
Ballyk, Steinman and Ethier [Ballyk, Steinman andEthier (1994)] in their study found
that visually, patterns of WSS for Newtonian and non-Newtonian flow was almost same,
but magnitude of WSS for non-Newtonian case was greater than the Newtonian case.
However, this result was obtained for low inlet velocities (0.01 m/s- 0.05 m/s), which
again emphasises on the fact that blood behaves as a non-Newtonian fluid only at low
inlet velocities or low shear rates.
3.2.3Steady vs transient state
The comparison between the two states can be made if the boundary conditions are
assumed similar for the two states. For these two states of simulation for non-Newtonian
model of blood, all the boundary conditions are same except the inlet velocity profile. In
order to get correct comparison between the two states, steady state simulations were
performed for inlet velocities corresponding to the inlet velocity in transient state at first
five times instances as mentioned in section 3.2.1. The velocities at these time instants
are 0.36 m/s, 0.5 m/s, 0.4 m/s, 0.2 m/s and 0.1 m/s respectively. This set of velocity was
selected so that effect of pulsatile nature of flow during transient state could also be

18 Copyright © 2016 Tech Science Press MCB, vol.13, no.1, pp.1-21, 2016
incorporated while making the comparison. The maximum value of WSS and pressure
attained into the three artery models at v = 0.36 m/s (t = 0.55 s) for the two states is
shown in Figs. 15-16 (trend of results at all time instants are same, so result for only a
single time instant is presented here). It is clear from Figs. 15-16, that the values of
hemodynamic parameters are underestimated if steady state flow is assumed. In fact, it is
observed (Fig. 15) that for artery A (healthy artery) the deviation in result is negligible.
However, for artery B, difference is more than 10 %. Stenosis in the artery depends on
the wall shear stress [Jhunjhunwala, Padole and Thombre (2015)], so this
underestimation in the values of WSS in steady state can influence the clinical decisions.
It is, therefore, suggested to incorporate transient flow (pulsatile nature of blood flow)
while doing CFD analysis of human arteries.
Figure 15: Comparison of maximum wall shear stress attained by the three arteries under
transient (t = 0.55 s) and steady (v = 0.36 m/s) states of flow for non-Newtonian model of
blood

on-Newtonian Blood Flowin Left Coronary Arteries 19
Figure 16: Comparison of maximum pressure attained by the three arteries under
transient (t = 0.55 s) and steady (v = 0.36 m/s) states of flow for non-Newtonian model of
blood
4 Conclusions
This paper has presented a numerical (CFD) study of blood flow through three idealized
3-D models of left coronary artery. The study has been done for two different blood
viscosity models (Carreau and Newtonian) under transient as well as steady state.
The comparative study of the three artery models for non-Newtonian viscosity model of
blood under transient state shows that the WSS distribution is complex and it changes
significantly during a cardiac cycle. High WSS predominates at point of bifurcation for
artery A (healthy artery) and at stenosed regions for artery B and C (diseased arteries).
WSS, velocity and pressure increase significantly in the presence of different types of
stenosis. In the post-stenotic regions, disturbances are observed in the physiological
pattern of blood flow. High pressure region gets extended with increase in inlet velocity
and regions of stenosis. This attributes to increase in blood pressure which is being used
as indicator in clinical practice to assess the severity of stenosis.
A comparison of the two blood viscosity models for both steady and transient state shows
that assumption of blood as a Newtonian fluid is a good approximation in regions of
shear rates more than 100 s-1. This conclusion is based on simulations for a cardiac cycle
having heart rate of 120 beats per minute (during exercise) with medium-high inflow
velocities. It would be interesting to see the significance of non-Newtonian model if heart
rate is normal (during rest) and inflow velocity is low.
Another comparison of steady and transient flow for non-Newtonian viscosity model of

20 Copyright © 2016 Tech Science Press MCB, vol.13, no.1, pp.1-21, 2016
blood shows that assumption of steady flow underestimates the values of flow parameters
specially WSS. It is known that WSS plays an important role in formation and growth of
stenosis. It is, therefore, suggested to employ pulsatile nature of flow in numerical study
of blood vessels to assess results close to real scenario.
The conclusions presented here are under assumption of idealized artery models and
boundary conditions. Hence, a patient specific set up of boundary conditions and artery
models can lead to more accurate results. Also, simulations were performed for a fixed
mesh. However, results may show some discrepancy if simulation for elastic arterial wall
and a moving artery (dynamic mesh) with beats of heart is performed.
References
Ballyk, P. D.; Steinman, D. A.; Ethier, C. R. (1994): Simulations of non-Newtonian
blood flow in an end-to-end anastomosis. Biorheology,vol. 31, pp. 565-586.
Banks, J.; Bressloff, N. (2007): Turbulence modeling in three-dimensional stenosed
arterial bifurcations. Journal of Biomechanical Engineering,vol. 129, pp. 40-50.
Chaichana, T.; Sun, Z.; Jewkes, J. (2011): Computation of haemodynamics in the left
coronary artery with variable angulations. Journal of Biomechanics,vol. 44, pp. 1869-
1878.
Chaichana, T.; Sun, Z.; Jewkes, J.(2013):Haemodynamic analysis of the effect of different
types of plaques in the left coronary artery. Computerized Medical Imaging and Graphics,vol.
37, pp. 197-206.
Cho, Y. I.; Kensey, K. R. (1991): Effects of the non-Newtonian viscosity of blood on
flows in a diseased arterial vessel. Part 1: steady flows. Biorheology,vol. 28, pp. 241-262.
Duraiswamy, N.; Schoephoerster, R. T.; Moore, J. J. E. (2009): Comparison of near
wall hemodynamic parameters in stented artery models. J. Biomech. Eng.vol. 131, pp.
061006 (unbound).
Gijsen, F. J. H.; Van de Vosse, F. N.; Janssen J.D. (1999): The influence of the non-
Newtonian properties of blood on the flow in large arteries: steady flow in a carotid
bifurcation model. Journal of Biomechanics,vol. 32, pp. 601-608.
Govindaraju, K.; Badruddin, I. A.; Viswanathan, G. N.; Ramesh, S. V.;Badarudin,
A.(2013): Evaluation of functional severity of coronary artery disease and fluid
dynamics' influence on hemodynamic parameters: A review. Europian Journal of
Medical Physics (Physics Medica),vol. 29, pp. 225-232.
Hansson, G. K. (2005): Inflammation, atherosclerosis, and coronary artery disease. The
New EnglandJournal of Medicine,vol. 352, pp. 1685-1695.
He, Y.;Duraiswamy,N.;Frank, A. O.; Moore, Jr. J. E. (2005): Blood flow in stented
arteries: a parametric comparison of strut design parameters in three dimensions. J.
Biomech. Eng,vol. 127, pp. 637-647.
Jeong,W.; Jaehoon, S.(2014): Comparison of effects on technical variances of computational
fluid dynamics (CFD) software based on finite element and finite volume methods.
International Journal of Mechanical Sciences,vol. 78, pp. 19-26.

on-Newtonian Blood Flowin Left Coronary Arteries 21
Jhunjhunwala, P.; Padole, P. M.; Thombre S. B.(2015): CFD analysis of pulsatile flow
and non-Newtonian behavior of blood in arteries. Molecular & Cellular Biomechanics,vol.12,
pp. 37-47.
Johnston, B. M.; Johnston, P. R.; Corney. S.; Kilpatrick, D. (2004): Non-Newtonian
blood flow in human right coronary arteries: steady state simulations.Journal of
Biomechanics,vol. 37, pp.709-720.
Johnston, B. M.; Johnston, P. R.; Corney, S.; Kilpatrick, D.(2006): Non-Newtonian
blood flow in human right coronary arteries: transient simulations. Journal of
Biomechanics,vol. 39, pp. 1116-1128.
Karimi, S.; Dabagh, M.; Vasava, P.;Dadvar, M.;Dabir, B.;Jalali, P. (2014): Effect of
rheological models on the hemodynamics within human aorta: CFD study on CT image-
based geometry. Journal of Non-Newtonian Fluid Mechanics,vol. 207, pp. 42-52.
Kehrwald, D. (2005): Lattice Boltzmann simulation of shear thinning fluids. Journal of
Statistical Physics,vol. 121, pp. 223-237.
Owega, A.; Klingelhofer, J.; Sabri, O.; Kunert, H. J.; Albers, M.; Sab, H. (1998):
Cerebral blood flow velocity in acute schizophrenic patients: a transcaranial Doppler
ultrasonography study. Stroke,vol. 29, pp. 1149-1154.
Perktold, K.; Hofer, M.; Rappitsch, G.; Loew, M.; Kuban, B. D.; Friedman, M. H. (1997):
Validated computation of physiologic flow in a realistic coronary artery branch. Journal
of Biomechanics,vol. 31, pp. 217-228.
Pericevic, I.; Lally, C.; Toner, D.; Kelly, D. J. (2009): The influence of plaque
composition on underlying arterial wall stress during stent expansion: The case for lesion-
specific stents. Med. Eng. Phys. vol. 31, pp. 428-433.
Santamarina, A.; Weydahl, E.; Siegel Jr, J. M.; Moore Jr, J. E. (1998):
Computational analysis of flow in a curved tube model of the coronary arteries: effects of
time varying curvature. Ann Biomed Eng,vol. 26, pp. 944-954.
Sun, Z.; Cao, Y. (2011): Multislice CT angiography assessment of left coronary artery:
correlation between bifurcation angle and dimensions and development of coronay artery
disease. European Journal of Radiology,vol. 79, pp. 90-95.
Sinnott, M.; Clearly, P. W.; Prakash, M.(2006): An investigation of pulsatile blood
flow in a bifurcation artery using a grid-free method. Fifth International Conference on
CFD in the Process Industries, vol. 15, pp. 273-278.
Sun, Z.; Xu, L. (2014): Computational fluid dynamics in coronary artery disease.
Computerized Medical Imaging and Graphics,vol. 38, pp.651-663.
Tu, C.; Deville, M. (1996): Pulsatile flow of non-Newtonian fluids through arterial
stenoses. Journal of Biomechanics,vol. 29, pp. 899-908.
Valencia, A.; Solis, F. (2006): Blood flow dynamics and arterial wall interaction in a
saccular aneurysm model of the basilar artery. Computers and Structures,vol.84, pp.
1326-1337.
Wellnhofer, E.; Osman, J.;Kertzscher, U.;Affeld, K.; Fleck, E.;Goubergrits, L.(2010):
Flow simulation studies in coronary arteries- impact of side branches. Atherosclerosis,vol.
213, pp. 475-481.