
Non-negative factorization methods for extracting semantically relevant features in Intelligent Data...
135
Non-negative factorization methods for extracting semantically relevant features in Intelligent Data Analysis Università degli Studi di Bari "Aldo Moro" Dipartimento di Informatica Dottorato di Ricerca in Informatica CICLO XXVII Supervisor: Dott. Corrado Mencar Co-supervisor: Prof. Nicoletta Del Buono Coordinator: Prof. Donato Malerba ESAME FINALE 2015 Gabriella Casalino
-
Upload
gabriella-casalino -
Category
Education
-
view
24 -
download
2
Transcript of Non-negative factorization methods for extracting semantically relevant features in Intelligent Data...

Non-negative factorization methods for extracting semantically relevant features
in Intelligent Data Analysis
Università degli Studi di Bari "Aldo Moro"Dipartimento di Informatica
Dottorato di Ricerca in InformaticaCICLO XXVII
Supervisor: Dott. Corrado MencarCo-supervisor: Prof. Nicoletta Del BuonoCoordinator: Prof. Donato Malerba
ESAME FINALE 2015
Gabriella Casalino

Gabriella Casalino Non-negative factorization methods for extracting semantically relevant features in Intelligent Data Analysis
• Non-negative matrix factorization background
• Non-negative factorization methods for extracting semantically relevant features in Intelligent Data Analysis
• Subtractive clustering for seeding non-negative matrix factorizations
• Part-based data analysis with Masked Nonnegative Matrix Factorization
• Priors for Nonnegative Matrix Underapproximation of Hyperspectral Images
2
Outline

Gabriella Casalino Non-negative factorization methods for extracting semantically relevant features in Intelligent Data Analysis
• Information overload
• Intelligent Data Analysis (IDA)
• Dimensionality reduction methods
• Non-negative Matrix Factorization
3
The ‘whys’ of my research
Gabriella Casalino Non-negative factorization methods for extracting semantically relevant features in Intelligent Data Analysis
• Information overload
• Intelligent Data Analysis (IDA)
• Dimensionality reduction methods
• Non-negative Matrix Factorization
3
The ‘whys’ of my research
• extract useful information from data • emphasize the role of the analyst
8>>><
>>>:

Gabriella Casalino Non-negative factorization methods for extracting semantically relevant features in Intelligent Data Analysis
• Information overload
• Intelligent Data Analysis (IDA)
• Dimensionality reduction methods
• Non-negative Matrix Factorization
3
The ‘whys’ of my research
• represent data in low dimensional spaces • discover hidden structures in data • some examples:
- Singular value decomposition (SVD),- Factor analysis (FA), - Principal component analysis (PCA)
8>>><
>>>:

Gabriella Casalino Non-negative factorization methods for extracting semantically relevant features in Intelligent Data Analysis
• Information overload
• Intelligent Data Analysis (IDA)
• Dimensionality reduction methods
• Non-negative Matrix Factorization
3
The ‘whys’ of my research
• Not able to maintain the non-negativity of
the data
• Difficulties to provide interpretation of the mathematical factors
• represent data in low dimensional spaces • discover hidden structures in data • some examples:
- Singular value decomposition (SVD),- Factor analysis (FA), - Principal component analysis (PCA)
8>>><
>>>:

Gabriella Casalino Non-negative factorization methods for extracting semantically relevant features in Intelligent Data Analysis
• Information overload
• Intelligent Data Analysis (IDA)
• Dimensionality reduction methods
• Non-negative Matrix Factorization
3
The ‘whys’ of my research
8>>><
>>>:
• low rank approximation method • dimensionality reduction • clustering
• non-negativity constraint • data representations semantically relevant,
easily interpretable • suitable for IDA

Gabriella Casalino Non-negative factorization methods for extracting semantically relevant features in Intelligent Data Analysis 4
Why nonnegativity?
Non-negative data

Gabriella Casalino Non-negative factorization methods for extracting semantically relevant features in Intelligent Data Analysis 4
Why nonnegativity?
Non-negative data

Gabriella Casalino Non-negative factorization methods for extracting semantically relevant features in Intelligent Data Analysis 4
Why nonnegativity?
Non-negative data

Gabriella Casalino Non-negative factorization methods for extracting semantically relevant features in Intelligent Data Analysis 4
Why nonnegativity?
Non-negative data

Gabriella Casalino Non-negative factorization methods for extracting semantically relevant features in Intelligent Data Analysis 4
Why nonnegativity?
Non-negative data

Gabriella Casalino Non-negative factorization methods for extracting semantically relevant features in Intelligent Data Analysis
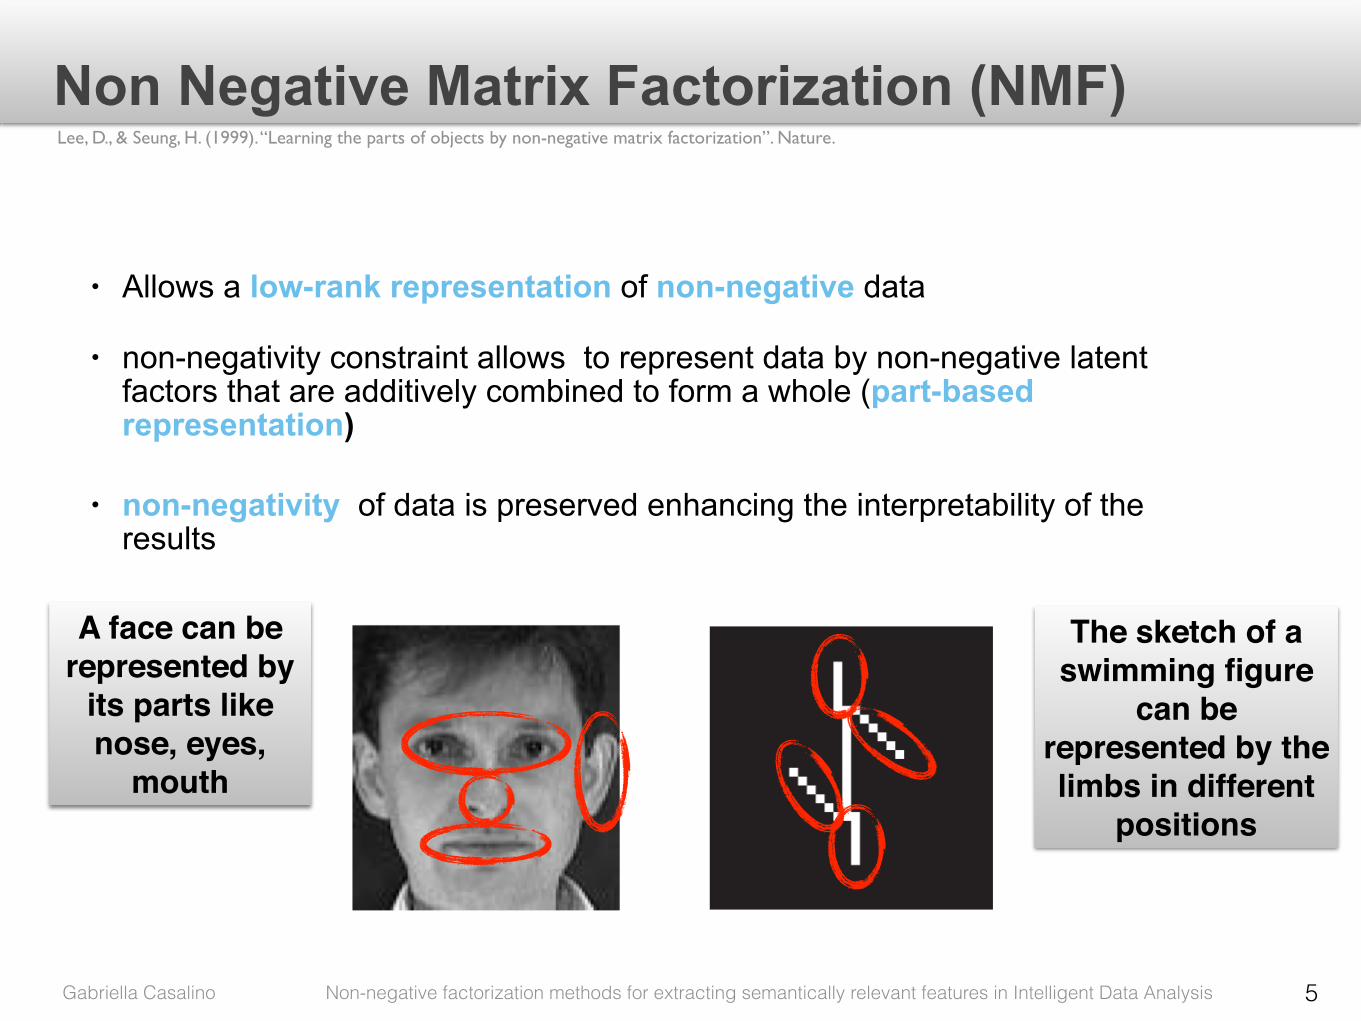
• Allows a low-rank representation of non-negative data
• non-negativity constraint allows to represent data by non-negative latent factors that are additively combined to form a whole (part-based representation)
• non-negativity of data is preserved enhancing the interpretability of the results
5
Non Negative Matrix Factorization (NMF)Lee, D., & Seung, H. (1999). “Learning the parts of objects by non-negative matrix factorization”. Nature.

Gabriella Casalino Non-negative factorization methods for extracting semantically relevant features in Intelligent Data Analysis
• Allows a low-rank representation of non-negative data
• non-negativity constraint allows to represent data by non-negative latent factors that are additively combined to form a whole (part-based representation)
• non-negativity of data is preserved enhancing the interpretability of the results
5
Non Negative Matrix Factorization (NMF)
A face can be represented by
its parts like nose, eyes,
mouth
Lee, D., & Seung, H. (1999). “Learning the parts of objects by non-negative matrix factorization”. Nature.
Gabriella Casalino Non-negative factorization methods for extracting semantically relevant features in Intelligent Data Analysis
• Allows a low-rank representation of non-negative data
• non-negativity constraint allows to represent data by non-negative latent factors that are additively combined to form a whole (part-based representation)
• non-negativity of data is preserved enhancing the interpretability of the results
5
Non Negative Matrix Factorization (NMF)
The sketch of a swimming figure
can be represented by the limbs in different
positions
A face can be represented by
its parts like nose, eyes,
mouth
Lee, D., & Seung, H. (1999). “Learning the parts of objects by non-negative matrix factorization”. Nature.

Gabriella Casalino Non-negative factorization methods for extracting semantically relevant features in Intelligent Data Analysis
• Given an initial set of data expressed by a n×m matrix X • each column is an n-dimensional non-negative vector of the original database
(m vectors) • NMF consists in approximating X with the product of two reduced rank matrices: W
and H • r is the rank of the subspace that better explains data
6
The mathematical problem
X ≈ WH
n×r basis matrix
r×m encoding variable matrix
Non-Negative Factorization

Gabriella Casalino Non-negative factorization methods for extracting semantically relevant features in Intelligent Data Analysis 7
Text Mining
Lee, D., & Seung, H. (1999). Learning the parts of objects by non-negative matrix factorization. Nature.
W
H X

Gabriella Casalino Non-negative factorization methods for extracting semantically relevant features in Intelligent Data Analysis 7
Text Mining
Lee, D., & Seung, H. (1999). Learning the parts of objects by non-negative matrix factorization. Nature.
W
H X

Gabriella Casalino Non-negative factorization methods for extracting semantically relevant features in Intelligent Data Analysis 7
Text Mining
Lee, D., & Seung, H. (1999). Learning the parts of objects by non-negative matrix factorization. Nature.
W
H X

Gabriella Casalino Non-negative factorization methods for extracting semantically relevant features in Intelligent Data Analysis 7
Text Mining
Lee, D., & Seung, H. (1999). Learning the parts of objects by non-negative matrix factorization. Nature.
W
H XNMF discovers
semantic features of text-
documents
Weight each feature in
reconstructing the documents

Gabriella Casalino Non-negative factorization methods for extracting semantically relevant features in Intelligent Data Analysis
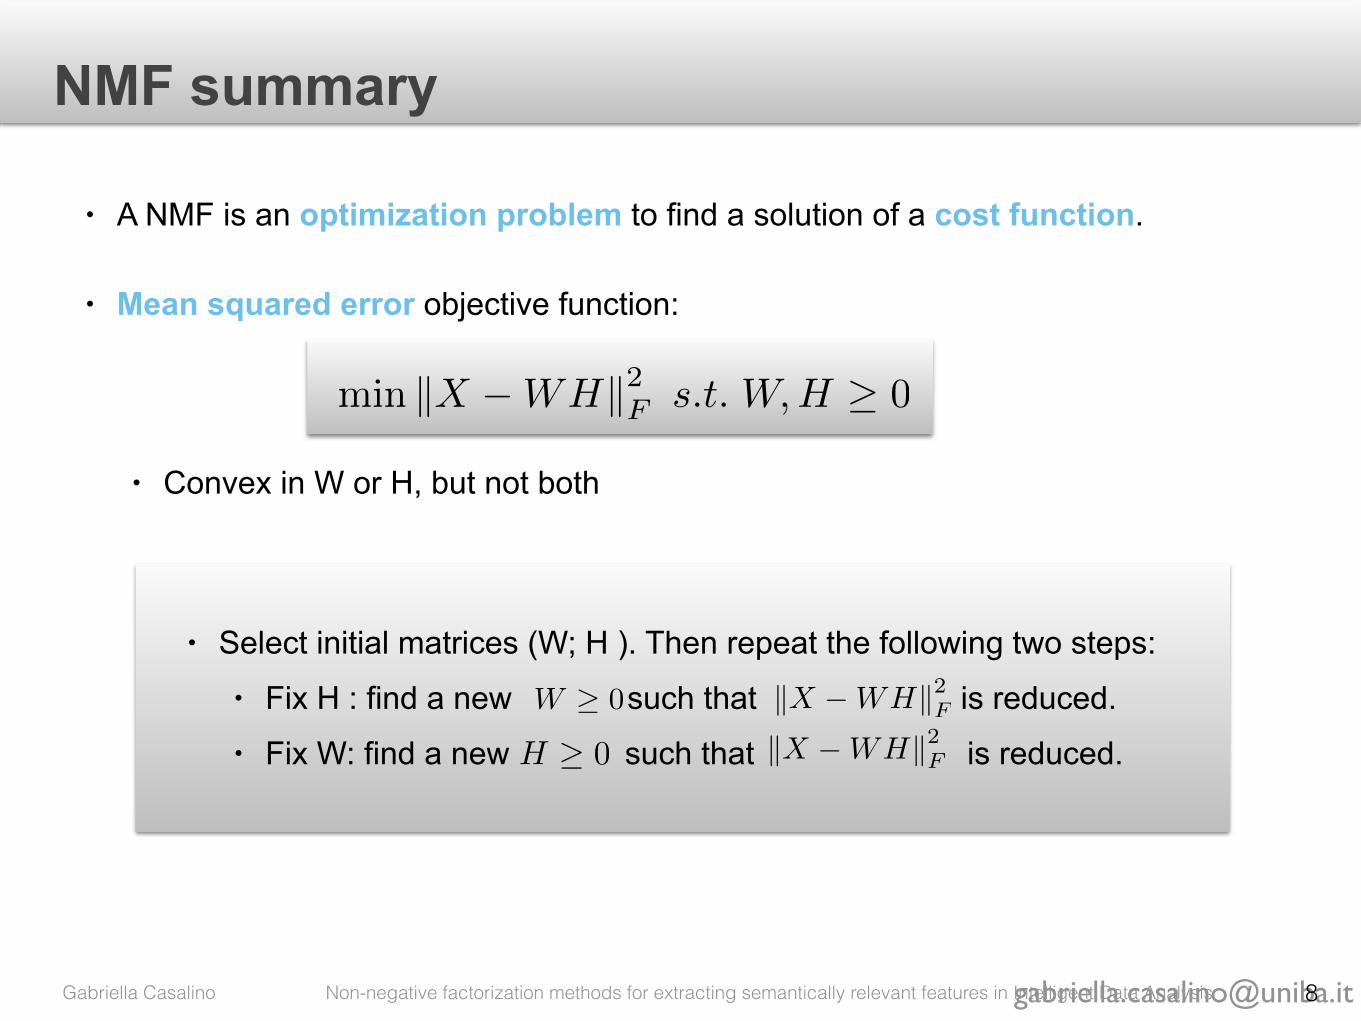
• A NMF is an optimization problem to find a solution of a cost function.
• Mean squared error objective function:
• Convex in W or H, but not both
NMF summary
min kX �WHk2F s.t. W,H � 0
• Select initial matrices (W; H ). Then repeat the following two steps: • Fix H : find a new such that is reduced. • Fix W: find a new such that is reduced. H � 0
W � 0 kX �WHk2FkX �WHk2F

Gabriella Casalino Non-negative factorization methods for extracting semantically relevant features in Intelligent Data Analysis
• A NMF is an optimization problem to find a solution of a cost function.
• Mean squared error objective function:
• Convex in W or H, but not both
NMF summary
min kX �WHk2F s.t. W,H � 0
• Select initial matrices (W; H ). Then repeat the following two steps: • Fix H : find a new such that is reduced. • Fix W: find a new such that is reduced. H � 0
W � 0 kX �WHk2FkX �WHk2F

Gabriella Casalino Non-negative factorization methods for extracting semantically relevant features in Intelligent Data Analysis
• Different algorithms to compute NMF:
• Constrained algorithms: Sparsity, Orthogonality, Semi-supervised,…
• Different algorithms to initialize NMF:
• simple schemes, complex schemes, evolutionary schemes
9
NMF summary
How to inject knowledge in the process?

Subtractive clustering for seeding non-negative matrix factorizations
G. Casalino, N. Del Buono, C. Mencar (2014) Subtractive clustering for seeding non-negative matrix factorizations,
Information Sciences
G. Casalino, N. Del Buono, C. Mencar (2011) Subtractive Initialization of Nonnegative Matrix Factorizations for
Document Clustering, In Fuzzy Logic and Applications (WILF 2011)

Gabriella Casalino Non-negative factorization methods for extracting semantically relevant features in Intelligent Data Analysis
Main idea: • Use the cluster prototypes of SC as initial basis matrix • Use the fuzzy cluster membership values of SC as coefficients in the initial
encoding matrix
11
Subtractive clustering (SC) initialization algorithm
W0
H0
Literature: • K-means initialization
• Y. Xue, C. S. Tong, Y. Chen, and W.S. Chen. Clustering-based initialization for non-negative matrix factorization.
• FCM initialization • Z. Zheng, J. Yangb, and Y. Zhuc. Initialization enhancer for non-
negative matrix factorization.
Need to choose the number of the clusters
SC is able to suggest the suitable number of clusters

Gabriella Casalino Non-negative factorization methods for extracting semantically relevant features in Intelligent Data Analysis
• basis vectors isolate a subset of words denoting a particular concept or topic;
• coefficients in H indicate the importance of each concept for approximating the data;
• documents are combination of specific basis vectors, and they can be grouped as belonging to specific topics with the highest weight.
• basis vectors represent cluster centers and are directly interpretable from human expert
12
NMF for document clusteringW. Xu, X. Liu, and Y. Gong. Document clustering based on non-negative matrix factorization. F. Shahnaz, M. W. Berry, V. P. Pauca, and R. J. Plemmons. Document clustering using nonnegative matrix factorization.

Gabriella Casalino Non-negative factorization methods for extracting semantically relevant features in Intelligent Data Analysis 13
Subtractive Clustering

Gabriella Casalino Non-negative factorization methods for extracting semantically relevant features in Intelligent Data Analysis 13
Subtractive Clustering
1. Each document is a potential cluster center

Gabriella Casalino Non-negative factorization methods for extracting semantically relevant features in Intelligent Data Analysis
2. Compute the potential of each document
13
Subtractive Clustering
1. Each document is a potential cluster center

Gabriella Casalino Non-negative factorization methods for extracting semantically relevant features in Intelligent Data Analysis
2. Compute the potential of each document
13
Subtractive Clustering
a. it measures the likelihood that each document define the actual cluster center,
b. it is based on the surrounding neighboring documents defined by the radius ra
c. high potential values correspond to documents with many neighborhoods.
1. Each document is a potential cluster center

Gabriella Casalino Non-negative factorization methods for extracting semantically relevant features in Intelligent Data Analysis
2. Compute the potential of each document
13
Subtractive Clustering
3. The document with the highest potential is selected as the first cluster center
4. The potential of the documents in the neighborhood defined by the radius rb is reduced
5. Repeat step 3. and 4. until a stopping criteria is not satisfied
6. Return the number k of clusters, the cluster centroids and their potential values
1. Each document is a potential cluster center

Gabriella Casalino Non-negative factorization methods for extracting semantically relevant features in Intelligent Data Analysis 14
Subtractive clustering initialization of NMF
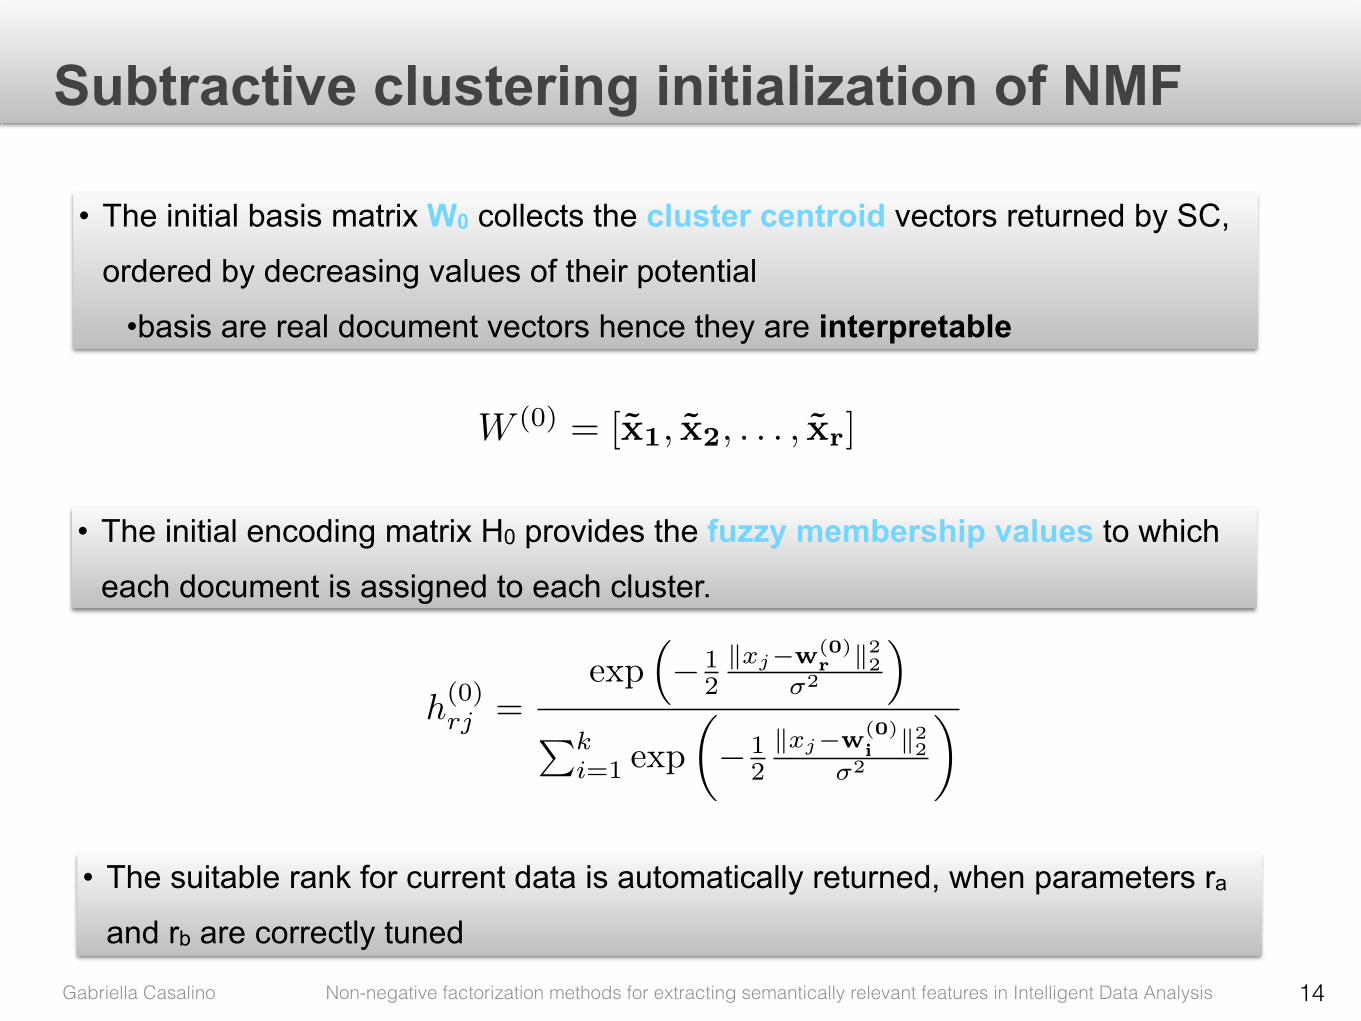
• The initial basis matrix W0 collects the cluster centroid vectors returned by SC,ordered by decreasing values of their potential
•basis are real document vectors hence they are interpretable
W (0) = [x̃1, x̃2, . . . , x̃r]

Gabriella Casalino Non-negative factorization methods for extracting semantically relevant features in Intelligent Data Analysis 14
Subtractive clustering initialization of NMF
• The initial basis matrix W0 collects the cluster centroid vectors returned by SC,ordered by decreasing values of their potential
•basis are real document vectors hence they are interpretable
W (0) = [x̃1, x̃2, . . . , x̃r]
h(0)rj
=
exp
⇣� 1
2kxj�w(0)
r k22
�
2
⌘
Pk
i=1 exp
✓� 1
2kxj�w(0)
i k22
�
2
◆
• The initial encoding matrix H0 provides the fuzzy membership values to which
each document is assigned to each cluster.
Gabriella Casalino Non-negative factorization methods for extracting semantically relevant features in Intelligent Data Analysis
• The suitable rank for current data is automatically returned, when parameters ra
and rb are correctly tuned
14
Subtractive clustering initialization of NMF
• The initial basis matrix W0 collects the cluster centroid vectors returned by SC,ordered by decreasing values of their potential
•basis are real document vectors hence they are interpretable
W (0) = [x̃1, x̃2, . . . , x̃r]
h(0)rj
=
exp
⇣� 1
2kxj�w(0)
r k22
�
2
⌘
Pk
i=1 exp
✓� 1
2kxj�w(0)
i k22
�
2
◆
• The initial encoding matrix H0 provides the fuzzy membership values to which
each document is assigned to each cluster.

Gabriella Casalino Non-negative factorization methods for extracting semantically relevant features in Intelligent Data Analysis15
Numerical experiments
Different Dataset
CSTR
WebKB4
Reuters8
Reuters10
Newsletter
Initialization algorithms
Random
K-Means
FCM
NNSVD
Subtractive
NMF algorithms
NMFLS
ALS
NMFSC
ONMF
Clusters
Term-document matrix
W0,H0,k
W,H
Cluster evaluation

Gabriella Casalino Non-negative factorization methods for extracting semantically relevant features in Intelligent Data Analysis 16
Evaluation measures
NMF algorithms
Initialization algorithms (a) Rank factor k = 9
E↵. of init. NMFLS ALS ONMF NMFSCInitial. Time Err. Err. iter Err. iter Err. iter Err. iterSC 0.0020 96.38 86.53 92 83.04 52 86.71 373 84.33 294FCM 3.3035 95.36 83.13 311 83.11 103 83.63 499 84.47 500NNSVD 0.1201 91.95 83.69 152 83.10 52 84.17 499 84.53 349Rand - 1.6569e7 82.94 427 83.02 195 83.57 317 84.46 500k-means 10.1670 85.61 84.94 15 83.18 166 86.33 333 85.82 53
(b) Rank factor k = 10
E↵. of init. NMFLS ALS ONMF NMFSCInitial. Time Err. Err. iter Err. iter Err. iter Err. iterSC 0.0016 94.48 85.53 94 82.04 142 85.73 322 83.52 304FCM 3.6644 95.36 81.97 500 82.25 186 82.66 494 83.63 500NNSVD 0.1371 92.08 82.74 205 82.05 66 83.26 499 83.66 279Rand - 1.9581e7 81.95 433 82.12 189 82.57 499 83.66 486k-means 9.9055 84.88 83.96 79 82.12 212 85.12 216 84.88 139
(c) Rank factor k = 11
E↵. of init. NMFLS ALS ONMF NMFSCInitial. Time Err. Err. iter Err. iter Err. iter Err. iterSC 0.0027 92.72 84.62 94 81.10 140 84.82 324 82.78 500FCM 4.0298 95.36 80.98 500 80.99 95 81.69 499 82.77 500NNSVD 0.1471 92.52 81.83 211 81.04 500 82.39 310 82.83 500Rand - 2.3196e7 81.16 500 81.11 102 81.63 499 82.90 419k-means 7.6596 84.03 83.01 17 81.18 153 84.12 271 84.10 51
Table 4.7: Performance of the NMF algorithms initialized with di↵erent strategiesapplied to Reuters10 for di↵erent rank factor k.
(a) Rank factor k = 10
E↵. of init. NMFLS ALS ONMF NMFSCInitial. Time Err. Err. iter Err. iter Err. iter Err. iterSC 0.1988 1437.30 1310.25 176 1288.84 43 1310.47 381 1301.51 500FCM 52.1340 1358.41 1289.35 500 1289.22 78 1292.43 499 1302.25 500NNSVD 0.6578 1329.05 1291.99 335 1289.27 95 1292.28 499 1302.54 500Rand - 4.7344e8 1289.27 500 1289.14 183 1290.72 327 1303.32 500k-means 1687.948 1312.55 1306.05 26 1290.86 323 1315.80 499 1311.59 100
(b) Rank factor k = 11
E↵. of init. NMFLS ALS ONMF NMFSCInitial. Time Err. Err. iter Err. iter Err. iter Err. iterSC 0.1393 1426.05 1304.92 174 1283.76 137 1305.15 356 1297.55 500FCM 57.7798 1358.41 1285.17 500 1283.94 268 1285.37 499 1298.48 500NNSVD 0.6718 1330.34 1286.52 310 1284.25 140 1288.61 499 1298.11 500Rand - 5.6985e8 1285.05 500 1283.91 102 1290.28 413 1297.25 500k-means 2281.688 1307.42 1300.67 42 1284.83 206 1308.70 499 1307.46 79
Table 4.8: Performance of the NMF algorithms initialized with di↵erent strategiesapplied WebKB4 dataset for di↵erent rank factor k.
47
Performance of the NMF algorithms initialized with different strategies applied to Reuters10 dataset for k=10

Gabriella Casalino Non-negative factorization methods for extracting semantically relevant features in Intelligent Data Analysis 16
Evaluation measures
NMF algorithms
Initialization algorithms Computational time
Initial error ( )kX �W0H0k2F{ (a) Rank factor k = 9
E↵. of init. NMFLS ALS ONMF NMFSCInitial. Time Err. Err. iter Err. iter Err. iter Err. iterSC 0.0020 96.38 86.53 92 83.04 52 86.71 373 84.33 294FCM 3.3035 95.36 83.13 311 83.11 103 83.63 499 84.47 500NNSVD 0.1201 91.95 83.69 152 83.10 52 84.17 499 84.53 349Rand - 1.6569e7 82.94 427 83.02 195 83.57 317 84.46 500k-means 10.1670 85.61 84.94 15 83.18 166 86.33 333 85.82 53
(b) Rank factor k = 10
E↵. of init. NMFLS ALS ONMF NMFSCInitial. Time Err. Err. iter Err. iter Err. iter Err. iterSC 0.0016 94.48 85.53 94 82.04 142 85.73 322 83.52 304FCM 3.6644 95.36 81.97 500 82.25 186 82.66 494 83.63 500NNSVD 0.1371 92.08 82.74 205 82.05 66 83.26 499 83.66 279Rand - 1.9581e7 81.95 433 82.12 189 82.57 499 83.66 486k-means 9.9055 84.88 83.96 79 82.12 212 85.12 216 84.88 139
(c) Rank factor k = 11
E↵. of init. NMFLS ALS ONMF NMFSCInitial. Time Err. Err. iter Err. iter Err. iter Err. iterSC 0.0027 92.72 84.62 94 81.10 140 84.82 324 82.78 500FCM 4.0298 95.36 80.98 500 80.99 95 81.69 499 82.77 500NNSVD 0.1471 92.52 81.83 211 81.04 500 82.39 310 82.83 500Rand - 2.3196e7 81.16 500 81.11 102 81.63 499 82.90 419k-means 7.6596 84.03 83.01 17 81.18 153 84.12 271 84.10 51
Table 4.7: Performance of the NMF algorithms initialized with di↵erent strategiesapplied to Reuters10 for di↵erent rank factor k.
(a) Rank factor k = 10
E↵. of init. NMFLS ALS ONMF NMFSCInitial. Time Err. Err. iter Err. iter Err. iter Err. iterSC 0.1988 1437.30 1310.25 176 1288.84 43 1310.47 381 1301.51 500FCM 52.1340 1358.41 1289.35 500 1289.22 78 1292.43 499 1302.25 500NNSVD 0.6578 1329.05 1291.99 335 1289.27 95 1292.28 499 1302.54 500Rand - 4.7344e8 1289.27 500 1289.14 183 1290.72 327 1303.32 500k-means 1687.948 1312.55 1306.05 26 1290.86 323 1315.80 499 1311.59 100
(b) Rank factor k = 11
E↵. of init. NMFLS ALS ONMF NMFSCInitial. Time Err. Err. iter Err. iter Err. iter Err. iterSC 0.1393 1426.05 1304.92 174 1283.76 137 1305.15 356 1297.55 500FCM 57.7798 1358.41 1285.17 500 1283.94 268 1285.37 499 1298.48 500NNSVD 0.6718 1330.34 1286.52 310 1284.25 140 1288.61 499 1298.11 500Rand - 5.6985e8 1285.05 500 1283.91 102 1290.28 413 1297.25 500k-means 2281.688 1307.42 1300.67 42 1284.83 206 1308.70 499 1307.46 79
Table 4.8: Performance of the NMF algorithms initialized with di↵erent strategiesapplied WebKB4 dataset for di↵erent rank factor k.
47
Performance of the NMF algorithms initialized with different strategies applied to Reuters10 dataset for k=10

Gabriella Casalino Non-negative factorization methods for extracting semantically relevant features in Intelligent Data Analysis 16
Evaluation measures
NMF algorithms
Initialization algorithms
# of iterates
Final error ( )kX �WHk2F{Computational time
Initial error ( )kX �W0H0k2F{ (a) Rank factor k = 9
E↵. of init. NMFLS ALS ONMF NMFSCInitial. Time Err. Err. iter Err. iter Err. iter Err. iterSC 0.0020 96.38 86.53 92 83.04 52 86.71 373 84.33 294FCM 3.3035 95.36 83.13 311 83.11 103 83.63 499 84.47 500NNSVD 0.1201 91.95 83.69 152 83.10 52 84.17 499 84.53 349Rand - 1.6569e7 82.94 427 83.02 195 83.57 317 84.46 500k-means 10.1670 85.61 84.94 15 83.18 166 86.33 333 85.82 53
(b) Rank factor k = 10
E↵. of init. NMFLS ALS ONMF NMFSCInitial. Time Err. Err. iter Err. iter Err. iter Err. iterSC 0.0016 94.48 85.53 94 82.04 142 85.73 322 83.52 304FCM 3.6644 95.36 81.97 500 82.25 186 82.66 494 83.63 500NNSVD 0.1371 92.08 82.74 205 82.05 66 83.26 499 83.66 279Rand - 1.9581e7 81.95 433 82.12 189 82.57 499 83.66 486k-means 9.9055 84.88 83.96 79 82.12 212 85.12 216 84.88 139
(c) Rank factor k = 11
E↵. of init. NMFLS ALS ONMF NMFSCInitial. Time Err. Err. iter Err. iter Err. iter Err. iterSC 0.0027 92.72 84.62 94 81.10 140 84.82 324 82.78 500FCM 4.0298 95.36 80.98 500 80.99 95 81.69 499 82.77 500NNSVD 0.1471 92.52 81.83 211 81.04 500 82.39 310 82.83 500Rand - 2.3196e7 81.16 500 81.11 102 81.63 499 82.90 419k-means 7.6596 84.03 83.01 17 81.18 153 84.12 271 84.10 51
Table 4.7: Performance of the NMF algorithms initialized with di↵erent strategiesapplied to Reuters10 for di↵erent rank factor k.
(a) Rank factor k = 10
E↵. of init. NMFLS ALS ONMF NMFSCInitial. Time Err. Err. iter Err. iter Err. iter Err. iterSC 0.1988 1437.30 1310.25 176 1288.84 43 1310.47 381 1301.51 500FCM 52.1340 1358.41 1289.35 500 1289.22 78 1292.43 499 1302.25 500NNSVD 0.6578 1329.05 1291.99 335 1289.27 95 1292.28 499 1302.54 500Rand - 4.7344e8 1289.27 500 1289.14 183 1290.72 327 1303.32 500k-means 1687.948 1312.55 1306.05 26 1290.86 323 1315.80 499 1311.59 100
(b) Rank factor k = 11
E↵. of init. NMFLS ALS ONMF NMFSCInitial. Time Err. Err. iter Err. iter Err. iter Err. iterSC 0.1393 1426.05 1304.92 174 1283.76 137 1305.15 356 1297.55 500FCM 57.7798 1358.41 1285.17 500 1283.94 268 1285.37 499 1298.48 500NNSVD 0.6718 1330.34 1286.52 310 1284.25 140 1288.61 499 1298.11 500Rand - 5.6985e8 1285.05 500 1283.91 102 1290.28 413 1297.25 500k-means 2281.688 1307.42 1300.67 42 1284.83 206 1308.70 499 1307.46 79
Table 4.8: Performance of the NMF algorithms initialized with di↵erent strategiesapplied WebKB4 dataset for di↵erent rank factor k.
47
Performance of the NMF algorithms initialized with different strategies applied to Reuters10 dataset for k=10
Gabriella Casalino Non-negative factorization methods for extracting semantically relevant features in Intelligent Data Analysis 17
Effects of the rank on the cluster granularity
• In literature the factor rank is chosen equal to the number of original document classes.
• This class structure might be different from the unknown cluster structure underlying
the data • lead to poor results with incorrect extracted features

Gabriella Casalino Non-negative factorization methods for extracting semantically relevant features in Intelligent Data Analysis
The granularity suggested by the SC method enables the extraction of interpretable
semantic features
17
Effects of the rank on the cluster granularity
• In literature the factor rank is chosen equal to the number of original document classes.
• This class structure might be different from the unknown cluster structure underlying
the data • lead to poor results with incorrect extracted features

Gabriella Casalino Non-negative factorization methods for extracting semantically relevant features in Intelligent Data Analysis 18
Example: CSTR datasetThe four a priori classes in the CSTR dataset were:
NLP, Robotics/Vision, Systems and Theory
Table 13, instead, reports the feature extracted at the end of the NMF process performed with rank r = 11. Particularly, thelast row of the table reports the semantic concepts which have been associated to the extracted features.
As it can be observed, these semantic concepts slightly differ from the a priori classes, but they appear to be more specificand reflect the presence of some geometric properties underlying the data.
These results assess the effectiveness of the proposed initialization method. A point of originality in using SC initializationscheme lies in its capability of suggesting the most suitable rank value r for a given dataset. In fact, as discussed in subSection4.1, the parameters ra and rb allow to set the radius of the hyper-sphere clusters according with the locality property of thedata documents in the Euclidean space. This means that documents which were closed in the original space remain closed inthe subspace obtained at the end of the NMF learning process. As it has been shown in the example, the granularity of theproblem suggested by the SC method permits to provide more interpretable semantic features than using the number ofknown classes as factor rank. The increased interpretability reflects the concepts enclosed in the most representative docu-ments selected by the SC scheme to be the basis vector in W(0).
6. Conclusive remarks
In this paper we faced the problem of initializing different NMF algorithms with several schemes, including random,clustering (both crisp and fuzzy) and singular-value decomposition. In particular, we focused on the use of the subtractiveclustering (SC) schema because, differently from other schemes, it does not require the specification of the number of clus-ters (and the corresponding rank used in factorization) but other hyper-parameters that may be more significant in problemswhere the number of clusters cannot be known a priori.
Table 12Example of semantic feature extracted with NMFSC algorithm and SC initializiation when CSTR dataset is considered. Rank value set to r = 4.
W1 W2 W3 W4
memori set task objectshare select manipul recognitprogram class robot imagparallel polynomi control traincach hierarchi plan viewperform prove visual learncoher complet method systemapplic string freedom imageridata bound space representmultiprocessor collaps real supervis
Table 13Example of semantic feature extracted using NMFSC algorithm and SC initializiation when CSTR dataset is considered. Rank factor r = 11.
W1 W2 W3 W4 W5
lock heterogen coher train databasesyncrhron loop cach recognit itemsetbarrier load memori object minescalab balanc share learn algorithmmultiprogram processor hardware view rulemutual netwotk protocol image clusterreader schedul softwar system associwriter compil perform supervis frquentschedul parallel multiprocessor unlabel transactexclus commun dsm geometr discoveriparallel programming heterogeneous networks operative systems object recognition datamining
W6 W7 W8 W9 W10 W11
visual select hard parallel object probabilistfixat set nontrivi program imag logpredict polynomi rice transform featur spacerespons hierarchi theorem data kei automataneural reduct prove control method turemodel function bound local recognit errorfilter string count compil cluster finittask complet properti model system classcortic collaps nondetermin optim invari machinscene equival circuit arrai base nondeterministneural networks for visual. complexity theory computability theory algorithms image recognition finite state automata
G. Casalino et al. / Information Sciences 257 (2014) 369–387 385
reflect geometric properties underlying the data that are captured by the clusters

Part-based data analysis with Masked Nonnegative Matrix Factorization
G. Casalino, N. Del Buono, C. Mencar (2014) Part-Based Data Analysis with Masked Non-negative Matrix
Factorization, 440-454. In Computational Science and Its Applications – ICCSA 2014
G.Casalino, N.Del Buono, C. Mencar, Naik G.R. (ed.), Non Negative Matrix Factorisations for Intelligent Data
Analysis, in Non-Negative Matrix Factorisation Techniques: Advances in Theory and Applications, Springer, in press.

Gabriella Casalino Non-negative factorization methods for extracting semantically relevant features in Intelligent Data Analysis 20
Motivations
1. The non-negativity characterization of NMF makes it a useful tool for Intelligent Data Analysis (IDA)
• NMF capable of representing data as an additive combination of common factors

Gabriella Casalino Non-negative factorization methods for extracting semantically relevant features in Intelligent Data Analysis
2. The non-negativity constraints imposed by NMF often are not enough to produce factors that represent useful knowledge.
• Usually these columns are very dense;
• different configurations of W and H lead to the same approximation of the data, it could be difficult to associate a physical meaning to these factors.
20
Motivations
1. The non-negativity characterization of NMF makes it a useful tool for Intelligent Data Analysis (IDA)
• NMF capable of representing data as an additive combination of common factors
Gabriella Casalino Non-negative factorization methods for extracting semantically relevant features in Intelligent Data Analysis 21
What is a part?To overcome the limits of classical NMF and to inject a-priori knowledge in the factorization process we introduce the concept of part:
a small selection of features that presents a local linear relationship in a subset of data

Gabriella Casalino Non-negative factorization methods for extracting semantically relevant features in Intelligent Data Analysis
y
21
What is a part?To overcome the limits of classical NMF and to inject a-priori knowledge in the factorization process we introduce the concept of part:
Data in this subset can be represented by the part [x y 0]
a small selection of features that presents a local linear relationship in a subset of data

Gabriella Casalino Non-negative factorization methods for extracting semantically relevant features in Intelligent Data Analysis
y
21
What is a part?To overcome the limits of classical NMF and to inject a-priori knowledge in the factorization process we introduce the concept of part:
Data in this subset can be represented by the part [x 0 z]
Data in this subset can be represented by the part [x y 0]
Objectives:
• query the data• represent data in the subspace described by the user-specified parts
a small selection of features that presents a local linear relationship in a subset of data

Gabriella Casalino Non-negative factorization methods for extracting semantically relevant features in Intelligent Data Analysis 22
Mask matrix
Figure 5.1: Example of query matrix P .
used to identify the parts that the analyst would like to extract from data. This
is accomplished by defining P as a set of k column vectors, where each element
in a column is 1 if the corresponding feature has to be selected, 0 if it has not
be considered. Figure 5.1 shows an example of query matrix P . Features one
and four have been selected in part one. It means that the analyst is looking for
linear relationships between these two features in data. Similarly features two,
three and five have been selected in part two, and features one, five and six in
part three.
To incorporate the additional constraint described above, the NMF minimiza-
tion problem (2.7) has been extended to automatically impose the structure of
the mask P to the basis matrix W :
minW�0,H�0
1
2kX � (P �W )Hk2F +
1
2����P � W̃
���2
F, (5.1)
where w̃ij = exp (�wij) and P 2 {0, 1}n⇥k and � � 0 is a regularization parame-
ter.
The objective function in (5.1) is composed by two terms: the first one rep-
resents a weighted modification of the classical NMF problem where the mask
matrix P is used to fix the structure the basis matrix W has to possess. The
second term is a penalty term used to enhance the elements wij corresponding
to elements pij = 1. For this purpose the exponential function has been chosen:
when the value of an entry wij of W is small it is increased by the penalty term,
when it is high the penalty tends to zero. The choice of the exponential func-
58
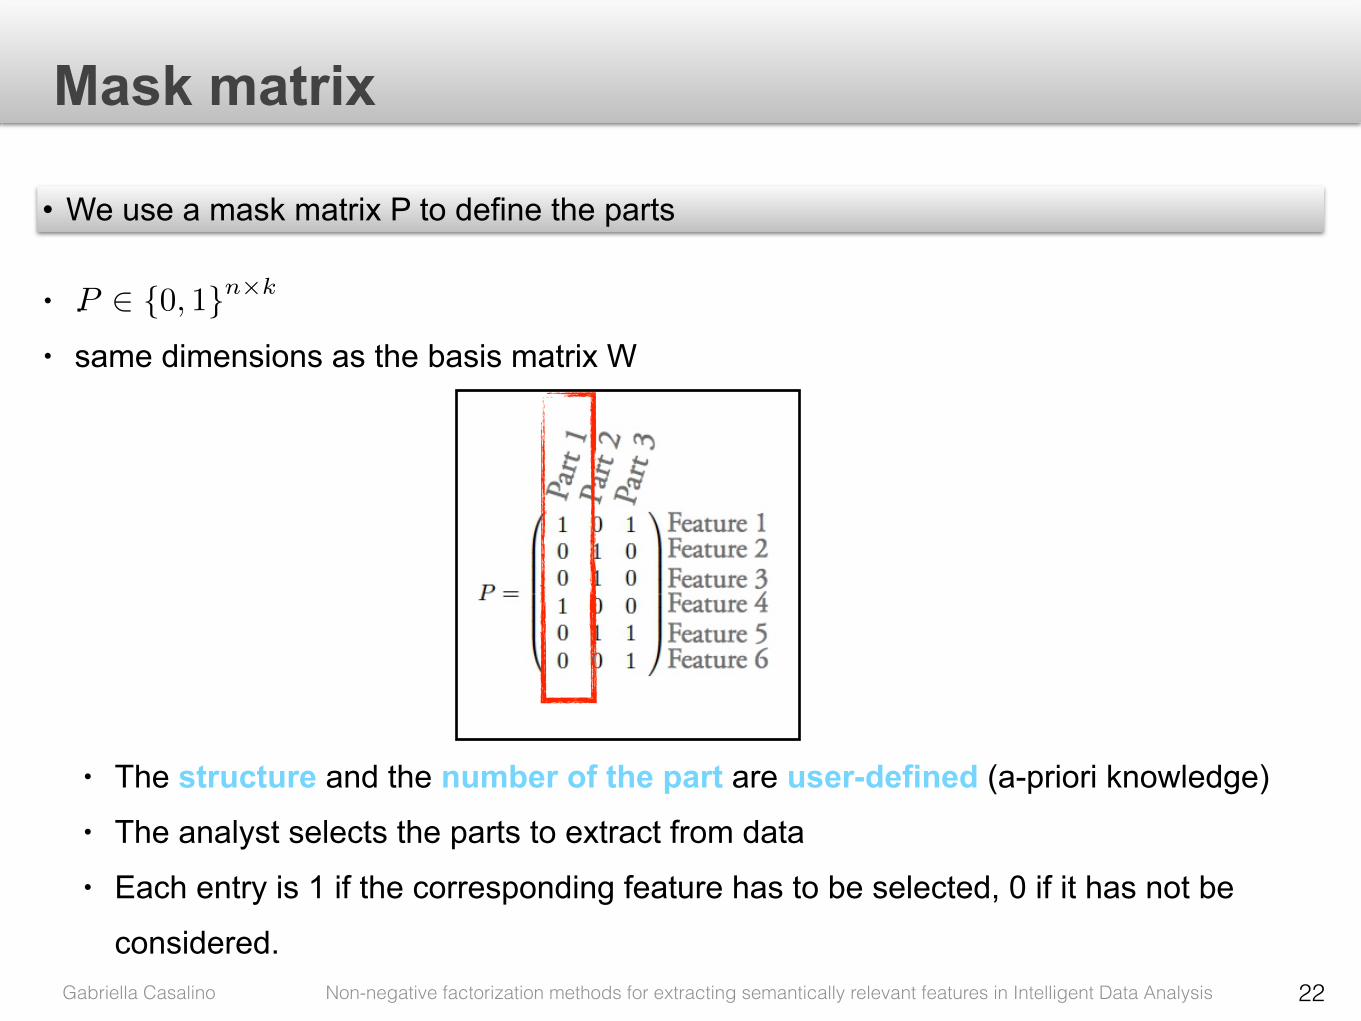
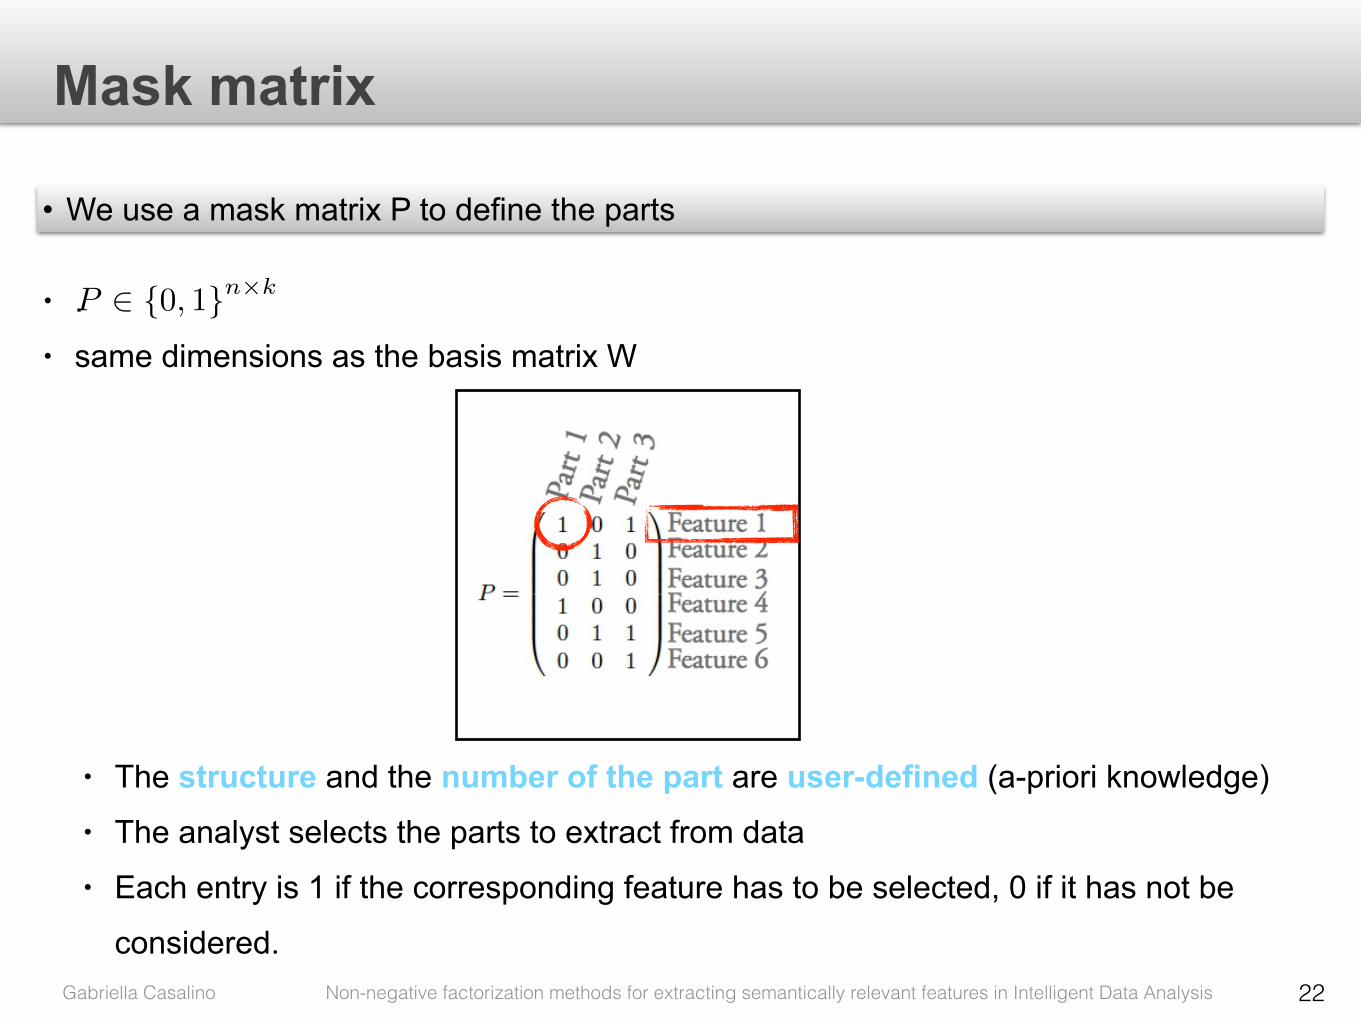
• We use a mask matrix P to define the parts
P 2 {0, 1}n⇥k• . • same dimensions as the basis matrix W

Gabriella Casalino Non-negative factorization methods for extracting semantically relevant features in Intelligent Data Analysis 22
Mask matrix
Figure 5.1: Example of query matrix P .
used to identify the parts that the analyst would like to extract from data. This
is accomplished by defining P as a set of k column vectors, where each element
in a column is 1 if the corresponding feature has to be selected, 0 if it has not
be considered. Figure 5.1 shows an example of query matrix P . Features one
and four have been selected in part one. It means that the analyst is looking for
linear relationships between these two features in data. Similarly features two,
three and five have been selected in part two, and features one, five and six in
part three.
To incorporate the additional constraint described above, the NMF minimiza-
tion problem (2.7) has been extended to automatically impose the structure of
the mask P to the basis matrix W :
minW�0,H�0
1
2kX � (P �W )Hk2F +
1
2����P � W̃
���2
F, (5.1)
where w̃ij = exp (�wij) and P 2 {0, 1}n⇥k and � � 0 is a regularization parame-
ter.
The objective function in (5.1) is composed by two terms: the first one rep-
resents a weighted modification of the classical NMF problem where the mask
matrix P is used to fix the structure the basis matrix W has to possess. The
second term is a penalty term used to enhance the elements wij corresponding
to elements pij = 1. For this purpose the exponential function has been chosen:
when the value of an entry wij of W is small it is increased by the penalty term,
when it is high the penalty tends to zero. The choice of the exponential func-
58
• We use a mask matrix P to define the parts
• The structure and the number of the part are user-defined (a-priori knowledge) • The analyst selects the parts to extract from data • Each entry is 1 if the corresponding feature has to be selected, 0 if it has not be
considered.
P 2 {0, 1}n⇥k• . • same dimensions as the basis matrix W

Gabriella Casalino Non-negative factorization methods for extracting semantically relevant features in Intelligent Data Analysis 23
Objective function
minW�0,H�0
1
2kX � (P �W )Hk2F +
1
2����P � W̃
���2
F,
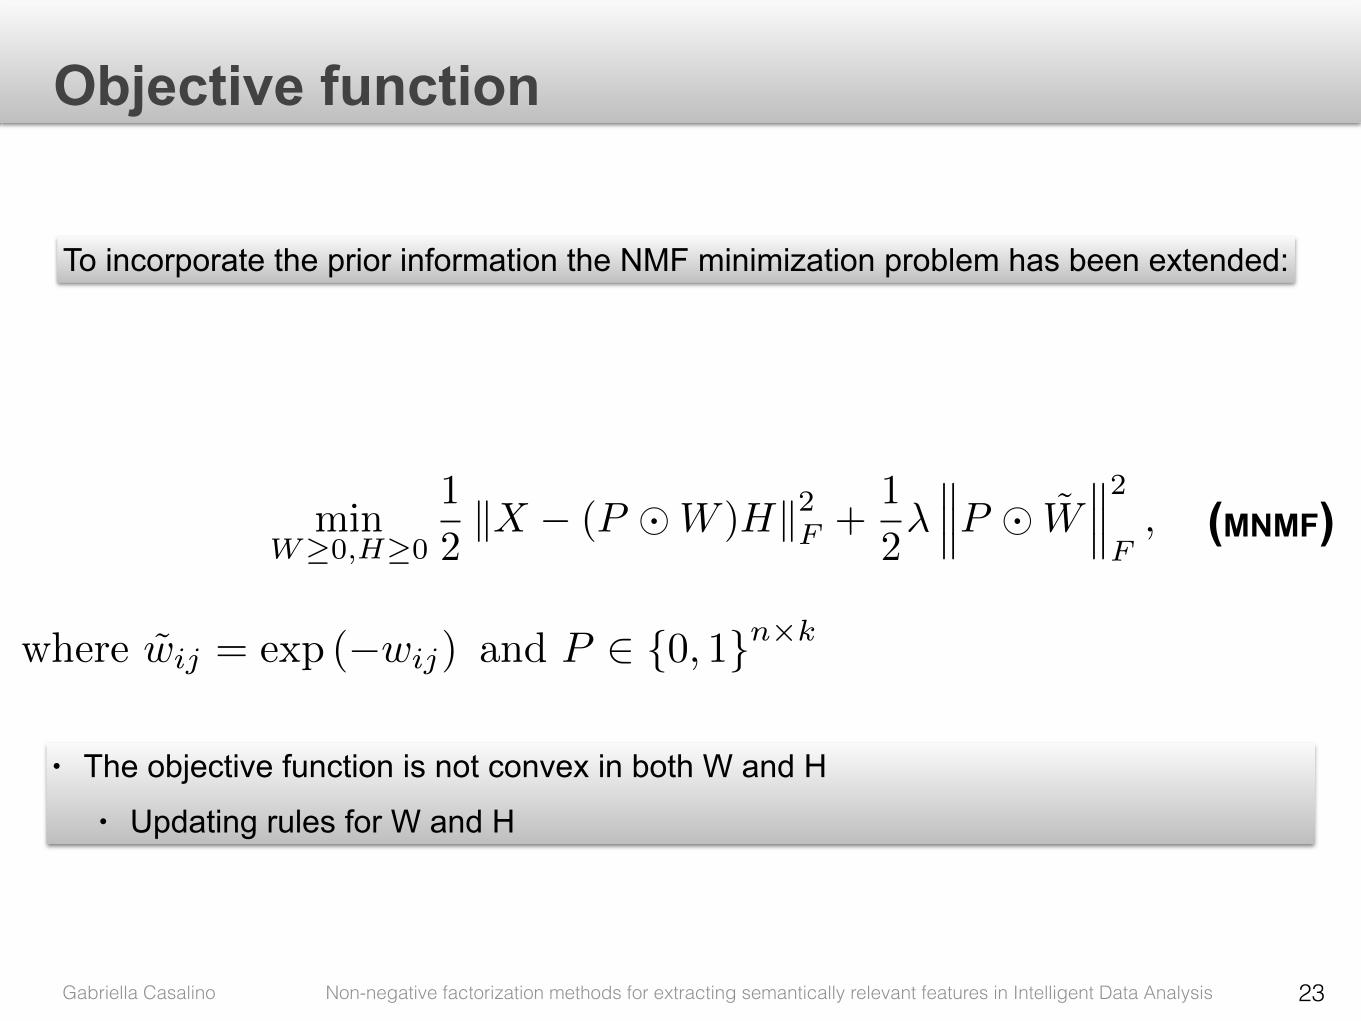
where w̃ij = exp (�wij) and P 2 {0, 1}n⇥k
(MNMF)
To incorporate the prior information the NMF minimization problem has been extended:

Gabriella Casalino Non-negative factorization methods for extracting semantically relevant features in Intelligent Data Analysis 23
Objective function
minW�0,H�0
1
2kX � (P �W )Hk2F +
1
2����P � W̃
���2
F,
where w̃ij = exp (�wij) and P 2 {0, 1}n⇥k
(MNMF)
To incorporate the prior information the NMF minimization problem has been extended:
• The objective function is not convex in both W and H • Updating rules for W and H

Gabriella Casalino Non-negative factorization methods for extracting semantically relevant features in Intelligent Data Analysis 24
Query the data
P =
0
BBBBBB@
1 0 0 01 1 0 00 1 1 00 0 0 10 0 1 00 0 0 1
1
CCCCCCA
Figure 5.3: Graphical illustration of the synthetic dataset X.
whilst a value ↵ = 2 for (2, 3) and (4, 6). Finally, the dataset, has been generated,
in blocks of 50 samples, each block being defined as a combination of the random
bases c. Let denote ch, with h = 1, . . . , 4, the random bases corresponding re-
spectively to the combinations (1, 2), (2, 3), (3, 5), (4, 6), the synthetic dataset is
constructed as follows: c1
, c2
, c3
, c4
, c1
+c2
, c1
+c3
, c2
+c3
, c3
+c4
, c1
+c2
+c3
.
Figure 5.3 shows a graphical representation of the data matrix. It should be
observed that the boxes represent fifty sequential data generated with the same
linear combination.
Optimal Mask
In the optimal case, Query-based MNMF is used to query data matrix with the
mask Popt that imposes on the factors matrix W the same structure occurring in
the dataset (Figure 5.4). Figure 5.5 shows basis matrix W and encoding matrix
H returned after applying MNMF to the data matrix. As it can be observed,
the factor W possesses the same structure of Popt. This means that parts that
are looked for, are actually in data. This result is confirmed by the conformity
values of the columns of W and P , ConfP�w
i
,popti
�,that are 0.8959, 0.9498,
0.8969, 0.9491, for i = 1 . . . 4. Empirical tests suggest that values of conformity
lower than a threshold tC = 0.80 denote bases with structures that do not allow
a good reconstruction of the data. In this case values are close to the maximum
conformity value 1.
68

Gabriella Casalino Non-negative factorization methods for extracting semantically relevant features in Intelligent Data Analysis 24
Query the data
P =
0
BBBBB@
1 0 0 0
1 1 0 0
0 1 1 0
0 0 0 1
0 0 1 0
0 0 0 1
1
CCCCCA
Figure 5.4: Optimal mask matrix P containing all the parts in data.
Figure 5.5: Basis matrix W and encoding matrix H obtained applying MNMFto synthetic data with optimal query mask P .
From the encoding matrix H, it could be pointed out that MNMF is able to
recognize samples in dataset that were constructed using parts in P . In fact each
block of samples has been reconstructed using the parts that correspond to the
random bases that have been used to generate original samples.
Representativity of the mask mask Popt is the maximum value 1 for tR = 107.
This means that all samples in dataset have been reconstructed with parts in P
with high precision.
However this is the best scenario. In the following paragraphs the behavior of
QMNMF is shown when the analyst is looking for parts that partially cover the
structure in data, or, in the worst scenario, are not able to describe data.
69
P =
0
BBBBBB@
1 0 0 01 1 0 00 1 1 00 0 0 10 0 1 00 0 0 1
1
CCCCCCA
Figure 5.3: Graphical illustration of the synthetic dataset X.
whilst a value ↵ = 2 for (2, 3) and (4, 6). Finally, the dataset, has been generated,
in blocks of 50 samples, each block being defined as a combination of the random
bases c. Let denote ch, with h = 1, . . . , 4, the random bases corresponding re-
spectively to the combinations (1, 2), (2, 3), (3, 5), (4, 6), the synthetic dataset is
constructed as follows: c1
, c2
, c3
, c4
, c1
+c2
, c1
+c3
, c2
+c3
, c3
+c4
, c1
+c2
+c3
.
Figure 5.3 shows a graphical representation of the data matrix. It should be
observed that the boxes represent fifty sequential data generated with the same
linear combination.
Optimal Mask
In the optimal case, Query-based MNMF is used to query data matrix with the
mask Popt that imposes on the factors matrix W the same structure occurring in
the dataset (Figure 5.4). Figure 5.5 shows basis matrix W and encoding matrix
H returned after applying MNMF to the data matrix. As it can be observed,
the factor W possesses the same structure of Popt. This means that parts that
are looked for, are actually in data. This result is confirmed by the conformity
values of the columns of W and P , ConfP�w
i
,popti
�,that are 0.8959, 0.9498,
0.8969, 0.9491, for i = 1 . . . 4. Empirical tests suggest that values of conformity
lower than a threshold tC = 0.80 denote bases with structures that do not allow
a good reconstruction of the data. In this case values are close to the maximum
conformity value 1.
68

Gabriella Casalino Non-negative factorization methods for extracting semantically relevant features in Intelligent Data Analysis 24
Query the data
P =
0
BBBBB@
1 0 0 0
1 1 0 0
0 1 1 0
0 0 0 1
0 0 1 0
0 0 0 1
1
CCCCCA
Figure 5.4: Optimal mask matrix P containing all the parts in data.
Figure 5.5: Basis matrix W and encoding matrix H obtained applying MNMFto synthetic data with optimal query mask P .
From the encoding matrix H, it could be pointed out that MNMF is able to
recognize samples in dataset that were constructed using parts in P . In fact each
block of samples has been reconstructed using the parts that correspond to the
random bases that have been used to generate original samples.
Representativity of the mask mask Popt is the maximum value 1 for tR = 107.
This means that all samples in dataset have been reconstructed with parts in P
with high precision.
However this is the best scenario. In the following paragraphs the behavior of
QMNMF is shown when the analyst is looking for parts that partially cover the
structure in data, or, in the worst scenario, are not able to describe data.
69
Need of a criterion for determining when data are well represented by the parts in the mask
P =
0
BBBBBB@
1 0 0 01 1 0 00 1 1 00 0 0 10 0 1 00 0 0 1
1
CCCCCCA
Figure 5.3: Graphical illustration of the synthetic dataset X.
whilst a value ↵ = 2 for (2, 3) and (4, 6). Finally, the dataset, has been generated,
in blocks of 50 samples, each block being defined as a combination of the random
bases c. Let denote ch, with h = 1, . . . , 4, the random bases corresponding re-
spectively to the combinations (1, 2), (2, 3), (3, 5), (4, 6), the synthetic dataset is
constructed as follows: c1
, c2
, c3
, c4
, c1
+c2
, c1
+c3
, c2
+c3
, c3
+c4
, c1
+c2
+c3
.
Figure 5.3 shows a graphical representation of the data matrix. It should be
observed that the boxes represent fifty sequential data generated with the same
linear combination.
Optimal Mask
In the optimal case, Query-based MNMF is used to query data matrix with the
mask Popt that imposes on the factors matrix W the same structure occurring in
the dataset (Figure 5.4). Figure 5.5 shows basis matrix W and encoding matrix
H returned after applying MNMF to the data matrix. As it can be observed,
the factor W possesses the same structure of Popt. This means that parts that
are looked for, are actually in data. This result is confirmed by the conformity
values of the columns of W and P , ConfP�w
i
,popti
�,that are 0.8959, 0.9498,
0.8969, 0.9491, for i = 1 . . . 4. Empirical tests suggest that values of conformity
lower than a threshold tC = 0.80 denote bases with structures that do not allow
a good reconstruction of the data. In this case values are close to the maximum
conformity value 1.
68

Gabriella Casalino Non-negative factorization methods for extracting semantically relevant features in Intelligent Data Analysis
• Representativeness
25
Evaluation measures
Figure 5.2: Example of the representativeness measure Reps of each sample in adataset.
Figure 5.2. In the example the samples in [151, 200] have representativeness
values equal to zero, because the parts in the mask matrix P are not able to
describe them1.
Using a thereshold tR on the values of representativeness, it is possible to
select the set Gt of well represented samples:
Gt = {xi
2 X/Reps(xi
,W,hi
) � tR} . (5.17)
A global measure of representativeness for the factorization results is than given
by:
Rep (X,W,H) =|Gt|m
, (5.18)
where |G| is the cardinality of the set Gt and m is the number of samples.
Rep (X,W,H) has values in the interval [0, 1]. The lowest value 0 means that
parts in W are not representative for the dataset X at the precision level tR. On
the contrary 1 means that parts in W are completely adeguate to describe data in
X. Values in the interval indicate the percentage of samples well represented. The
mask matrix P is not directly used in the representativeness measure described
in (5.18), but it is implicitly involved, as it determines the structure of the parts
1A deep investigation on the MNMF results is given in the section 5.2.
62
• It estimates the effectiveness of the mask matrix P in representing the structure of data. • Reps (xi
,W,hi
) = 1kxi�Whik2
F
Pkj=1 hji
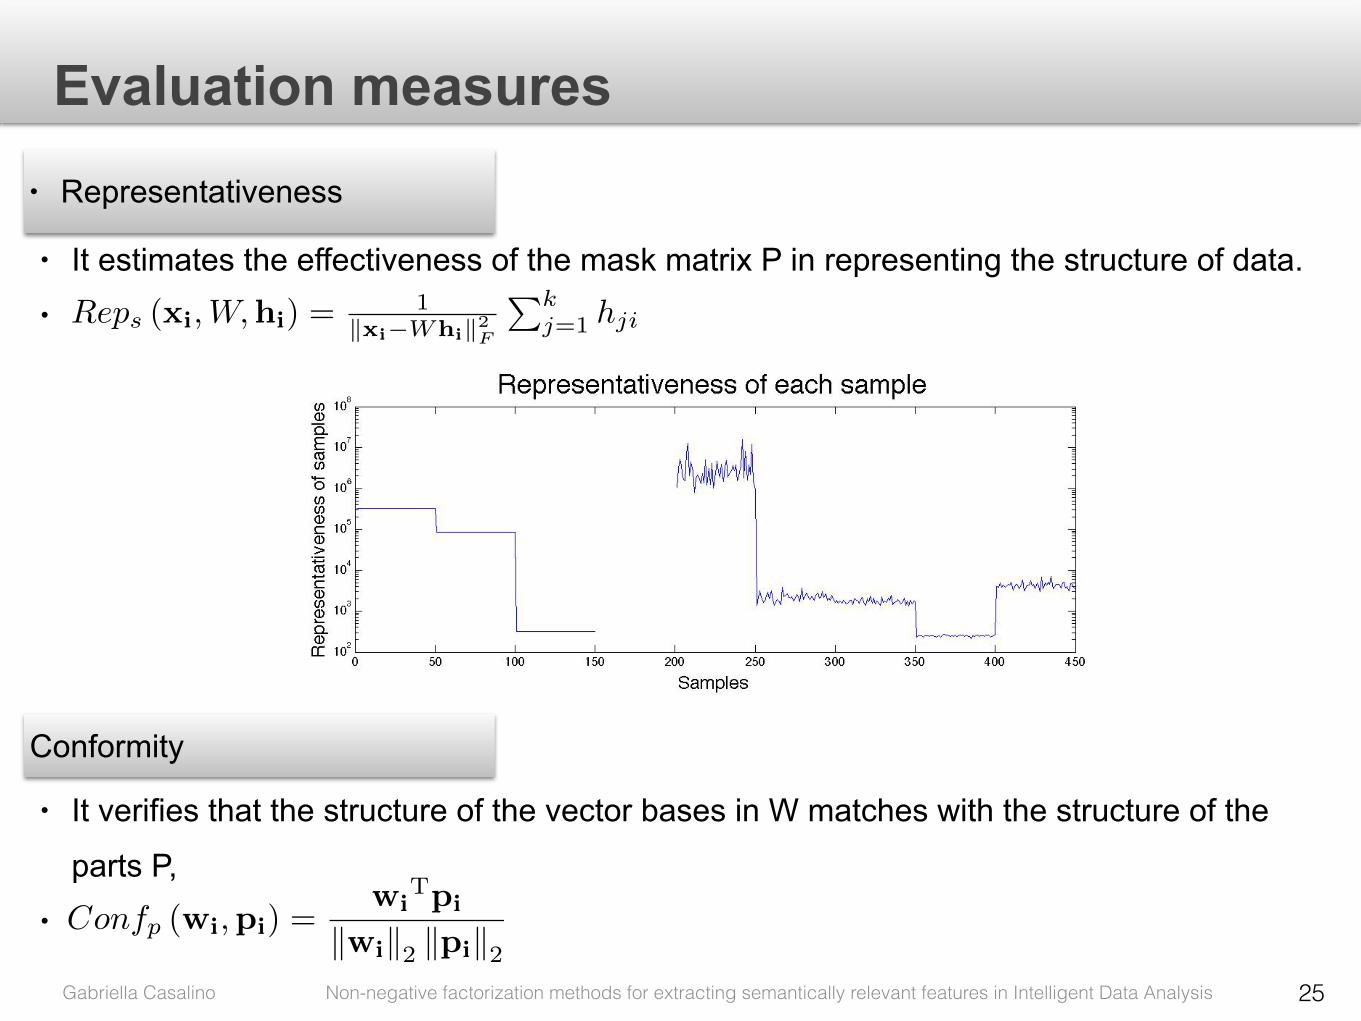
Conformity
• It verifies that the structure of the vector bases in W matches with the structure of the
parts P, • Confp (wi,pi) =
wiTpi
kwik2 kpik2

Gabriella Casalino Non-negative factorization methods for extracting semantically relevant features in Intelligent Data Analysis 26
Query based MNMF algorithmIris data: 150 samples, four dimensional vectors (sepal length, sepal width, petal length, petal length), three classes (Iris-Setosa, Iris-Veriscolor, Iris-Virginica)

Gabriella Casalino Non-negative factorization methods for extracting semantically relevant features in Intelligent Data Analysis
1. The analyst is querying Iris dataset for verifying the existence of relationships between sepal and petal lengths and sepal and petal widths of Iris Dataset
26
Query based MNMF algorithmIris data: 150 samples, four dimensional vectors (sepal length, sepal width, petal length, petal length), three classes (Iris-Setosa, Iris-Veriscolor, Iris-Virginica)
Part 1 Part 2
Sepal length ✔
Sepal width ✔
Petal length ✔
Petal width ✔
P =
0
BB@
1 00 11 00 1
1
CCA
2. MNMF is executed on Iris with P, W and H are returned and normalized.

Gabriella Casalino Non-negative factorization methods for extracting semantically relevant features in Intelligent Data Analysis
1. The analyst is querying Iris dataset for verifying the existence of relationships between sepal and petal lengths and sepal and petal widths of Iris Dataset
26
Query based MNMF algorithm
W3 =
0
BB@
0.85 00 0.96
0.53 00 0.29
1
CCA
3. The asis matrix W preserves the structure in P. This is confirmed by the conformity values.
Conf ((w3)1, (p3)1) = 0.97
Conf ((w3)2, (p3)2) = 0.88
Iris data: 150 samples, four dimensional vectors (sepal length, sepal width, petal length, petal length), three classes (Iris-Setosa, Iris-Veriscolor, Iris-Virginica)
Part 1 Part 2
Sepal length ✔
Sepal width ✔
Petal length ✔
Petal width ✔
P =
0
BB@
1 00 11 00 1
1
CCA
2. MNMF is executed on Iris with P, W and H are returned and normalized.
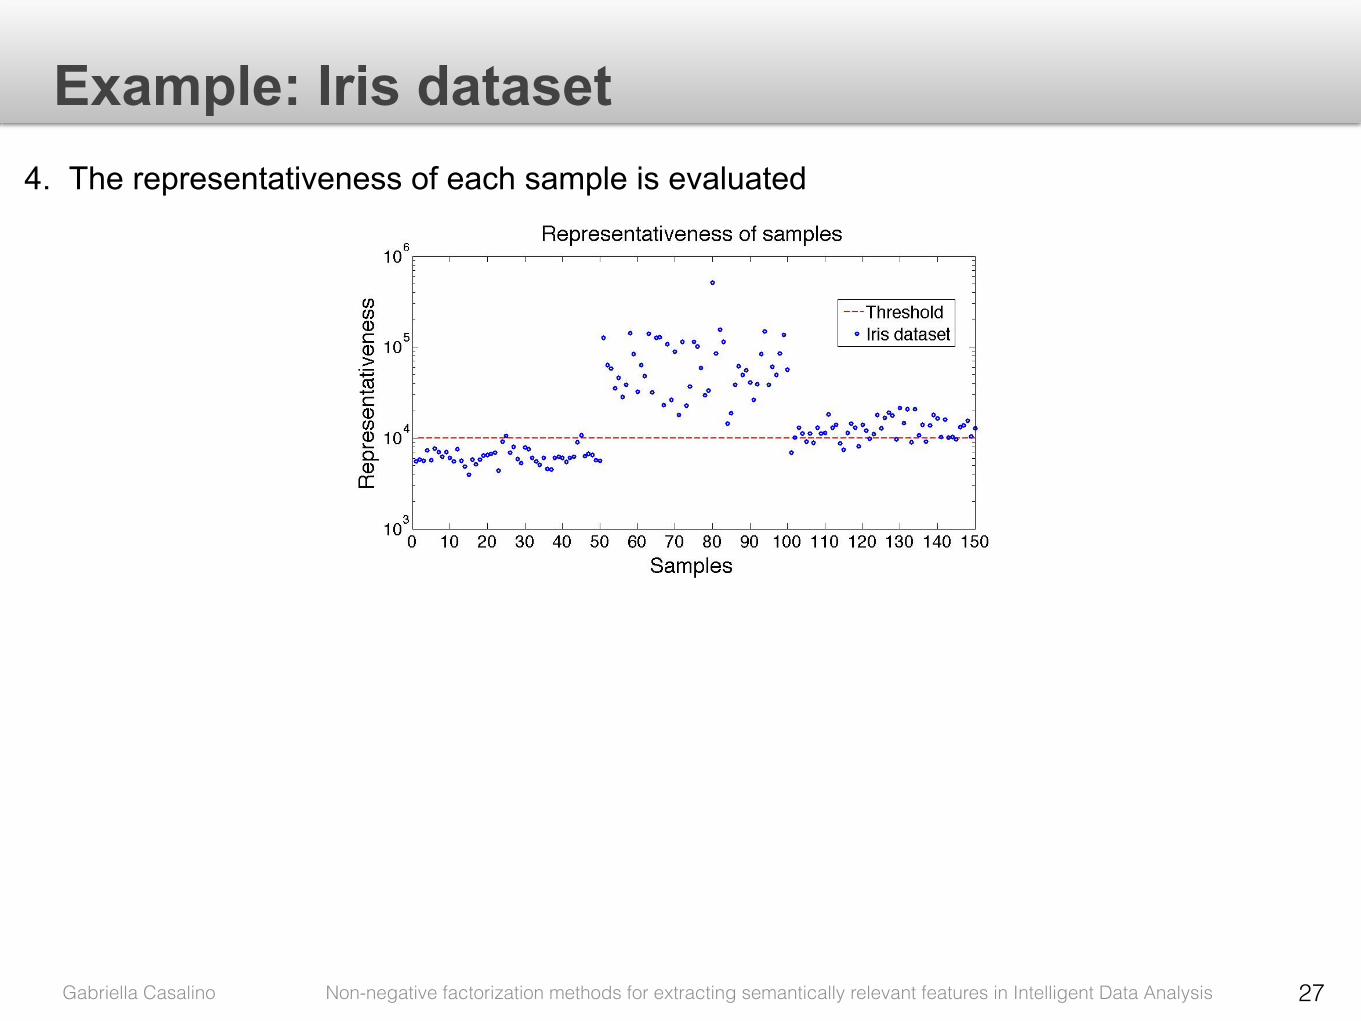
Gabriella Casalino Non-negative factorization methods for extracting semantically relevant features in Intelligent Data Analysis
4. The representativeness of each sample is evaluated
27
Example: Iris dataset

Gabriella Casalino Non-negative factorization methods for extracting semantically relevant features in Intelligent Data Analysis
4. The representativeness of each sample is evaluated
27
Example: Iris dataset
a. The three classes are well separated (Setosa [1,50], Versicolor [51,100], Virginica [101,150]
b. The two parts contribute with different values to reconstruct data
c. Using a threshold , the algorithm selects samples belonging to classes Versicolor and Virginica
d. A more selective threshold returns only the samples belonging to the class Versicolor
e. The analyst provides the threshold value exploiting his specific knowledge of the problem under consideration to intelligently analyze data
tR = 104

Gabriella Casalino Non-negative factorization methods for extracting semantically relevant features in Intelligent Data Analysis
4. The representativeness of each sample is evaluated
27
Example: Iris dataset
5. MNMF is evaluated on the selected subset of data

Gabriella Casalino Non-negative factorization methods for extracting semantically relevant features in Intelligent Data Analysis
4. The representativeness of each sample is evaluated
27
Example: Iris dataset
5. MNMF is evaluated on the selected subset of data
6. The reconstruction error obtained on the subset of data is lower than that obtained with the whole dataset (0.0023 and 0.0176)
7. Raising the threshold the reconstruction error decreases (6.51 x 10⁻⁴)

Gabriella Casalino Non-negative factorization methods for extracting semantically relevant features in Intelligent Data Analysis 28
Data visualization
When the rank of the factorization is two or three we can visualize the data

Gabriella Casalino Non-negative factorization methods for extracting semantically relevant features in Intelligent Data Analysis 28
Data visualization
When the rank of the factorization is two or three we can visualize the data
• The parts are the axes of the new space.
• They have has a semantic meaning according to features that have been selected
in them
• Coefficients in encoding matrix H specify coordinates of samples in the new
subspace

Priors for Nonnegative Matrix Underapproximation of Hyperspectral Images
G. Casalino, N. Gillis, Sequential Dimensionality Reduction for Extracting Localized Features, in submission

Gabriella Casalino Non-negative factorization methods for extracting semantically relevant features in Intelligent Data Analysis 30
Hyperspectral ImageA hyperspectral image (HSI) is a three dimensional data cube providing the electromagnetic reflectance of a scene at varying wavelengths measured by hyperspectral remote sensors
Objective: Identifcation of the materials in the image.Figure 6.1: Example of Hyperspectral Image.
2012]. Due to its part-based representation and non-negativity constraint, NMF
is a suitable tool to analyze hyperspectal images. It is used to identify spectral
signatures of constitutive materials, and classify pixels according to materials
they contain (end-members).
More precisely, given an hyperspectral datacube represented by a two dimen-
sional matrix M 2 Rn⇥m+
, NMF approximates it with the product of two factor
matrices U 2 Rn⇥k+
and V 2 Rk⇥m+
such that the spectral signature of each pixel
(rows of matrix M) is approximated by the additive linear combination of the
spectral signatures of the constitutive materials (rows of matrix V ), weighted by
coe�cients uij representing the the abundance of the j-th endmember at the i-th
pixel. For each pixel i, we have:
mi
⇡kX
j=1
uijvj
, (6.1)
where mi
are the rows of the data matrix M and vj
are the rows of the matrix
V 1.
Figure 6.2 shows NMF approximation of the Hyperspectral datacube of Ur-
1Note that when NMF is used to approximate the rows of the data matrix, row vectors vj
are the bases of the new subspace, and U is the coe�cient matrix.
85

Gabriella Casalino Non-negative factorization methods for extracting semantically relevant features in Intelligent Data Analysis 31
Hyperspectral data matrixLet construct a matrix M such that each column represents an image at a given wavelength and each row is the spectral signature of a pixel.
M(i; j) is the reflectance of pixel i at wavelength j.

Gabriella Casalino Non-negative factorization methods for extracting semantically relevant features in Intelligent Data Analysis 32
NMF of Hyperspectral imagesThe spectral signature of each pixel results from the additive combination of the spectral
signatures of its constitutive elements
Figure 6.2: Example of non-negative matrix factorization of a hyperspectral im-age.
ban dataset1. The abundances of endmembers (columns of U) represent images
in which only pixels belonging to the actual material are visible. The spectral
signatures of constitutive materials are represented by row in V . In the example
of Figure 6.2, mainly six constitutive materials are present: road, grass, dirt, two
kind of roof tops and trees.
6.1.3 Non Negative Matrix Underapproximation
Experimental observations have shown that NMF is not able to correctly separate
the end-members, due to the non-uniqueness of its solutions.
More recently, Gillis and Glineur [2010] have proposed a new algorithm to
1Available at http://www.agc.army.mil/hypercube/
86

Gabriella Casalino Non-negative factorization methods for extracting semantically relevant features in Intelligent Data Analysis
It is possible to find one factor at a time, solving at the first step:
33
Nonnegative Matrix UnderapproximationN. Gillis and F. Glineur, "Using Underapproximations for Sparse Nonnegative Matrix Factorization", Pattern Recognition 43 (4), pp. 1676-1687, 2010. N. Gillis and R.J. Plemmons, "Dimensionality Reduction, Classification, and Spectral Mixture Analysis using Nonnegative Underapproximation", Optical Engineering 50, 027001, February 2011.
such that (NMU)
We will obtain the residual and after k steps
• The solution is unique • The solution can be computed sequentially, factorization rank does not
need to be chosen a priori; • Solutions are sparser than NMF leading to better decomposition into parts

Gabriella Casalino Non-negative factorization methods for extracting semantically relevant features in Intelligent Data Analysis 34
Sparsity constraint (SNMU)
Key idea: • each material is present in a relatively small number of pixel, • each pixel contains a small number of constitutive materials.
N. Gillis and R.J. Plemmons, "Sparse Nonnegative Matrix Underapproximation and its Application for Hyperspectral Image Analysis", Linear Algebra and its Applications 438 (10), pp. 3991-4007, 2013.
Abundance matrix U
materials
pixels
• constraint column vectors of U to possess only few non-zero elements.

Gabriella Casalino Non-negative factorization methods for extracting semantically relevant features in Intelligent Data Analysis 34
Sparsity constraint (SNMU)
Key idea: • each material is present in a relatively small number of pixel, • each pixel contains a small number of constitutive materials.
N. Gillis and R.J. Plemmons, "Sparse Nonnegative Matrix Underapproximation and its Application for Hyperspectral Image Analysis", Linear Algebra and its Applications 438 (10), pp. 3991-4007, 2013.
Abundance matrix U
materials
pixels
Sparse NMU leads to better decompositions than standard NMU
• constraint column vectors of U to possess only few non-zero elements.

Gabriella Casalino Non-negative factorization methods for extracting semantically relevant features in Intelligent Data Analysis 35
Spatial information (LNMU)
Key idea: in each hyperspectral image, neighbor pixels are likely to contain the same materials.
N. Gillis, R.J. Plemmons and Q. Zhang, "Priors in Sparse Recursive Decompositions of Hyperspectral Images", in Algorithms and Technologies for Multispectral, Hyperspectral, and Ultraspectral Imagery XVIII, edited by Sylvia S. Shen, Paul E. Lewis, Proceedings of SPIE Vol. 8390 (2012).
Neighbor matrix that indicates for each pixel xi its neighbors such that each pair (i,j) of neighboring pixels is represented by a row in which N(k, i) = 1 and N(k, j)=-1
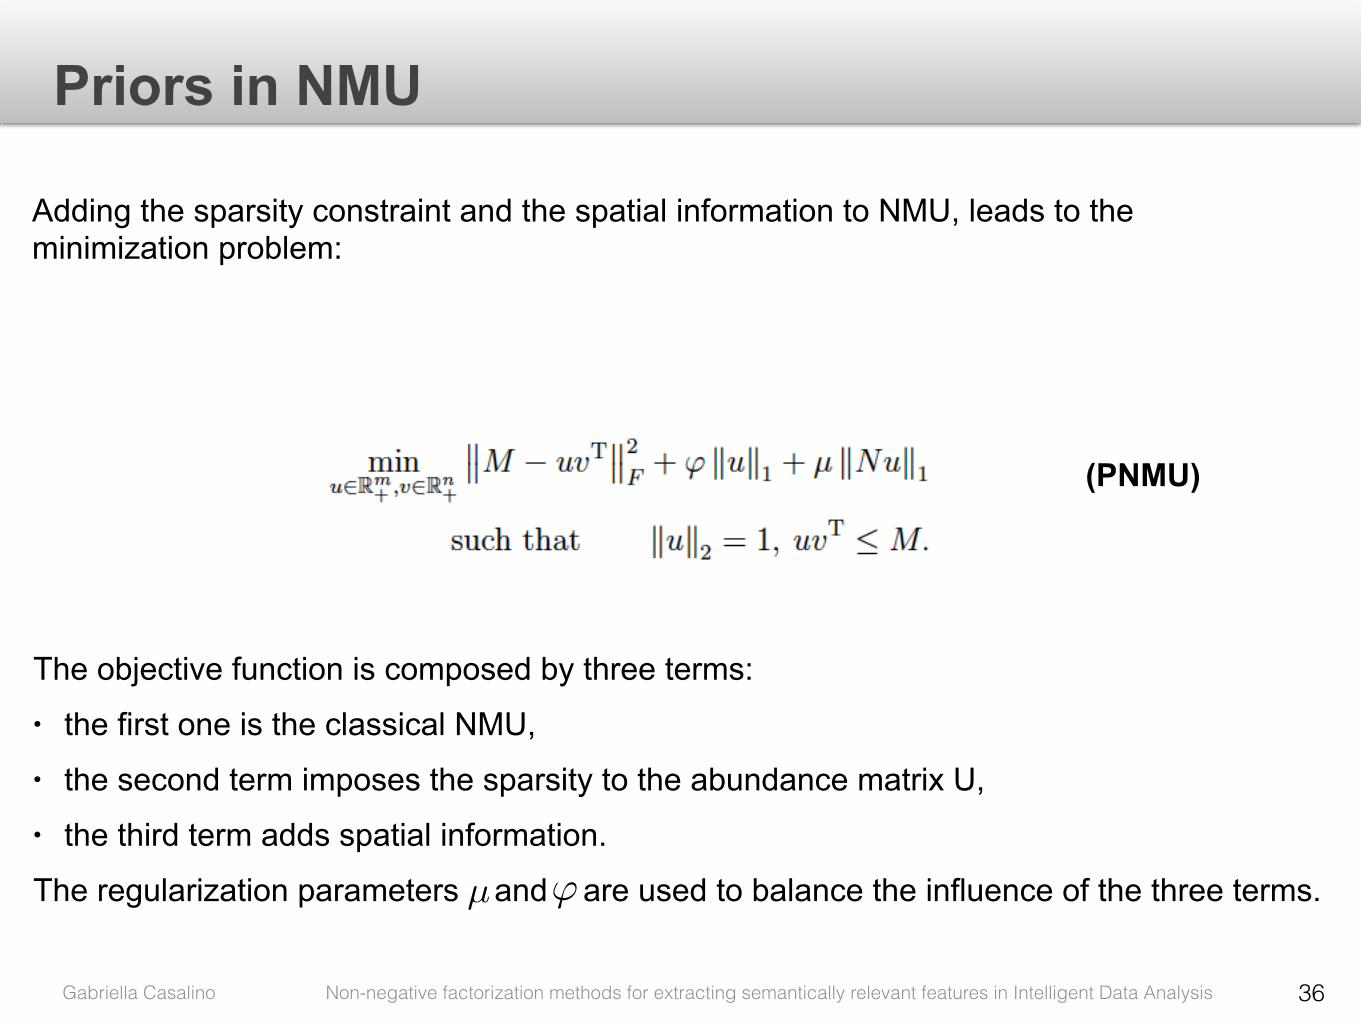
Gabriella Casalino Non-negative factorization methods for extracting semantically relevant features in Intelligent Data Analysis 36
Priors in NMU
Adding the sparsity constraint and the spatial information to NMU, leads to the minimization problem:
The objective function is composed by three terms: • the first one is the classical NMU, • the second term imposes the sparsity to the abundance matrix U, • the third term adds spatial information.
The regularization parameters and are used to balance the influence of the three terms.
(PNMU)
µ '

Gabriella Casalino Non-negative factorization methods for extracting semantically relevant features in Intelligent Data Analysis 36
Priors in NMU
standard NMU
Adding the sparsity constraint and the spatial information to NMU, leads to the minimization problem:
The objective function is composed by three terms: • the first one is the classical NMU, • the second term imposes the sparsity to the abundance matrix U, • the third term adds spatial information.
The regularization parameters and are used to balance the influence of the three terms.
(PNMU)
µ '

Gabriella Casalino Non-negative factorization methods for extracting semantically relevant features in Intelligent Data Analysis 36
Priors in NMU
sparsity constraintstandard NMU
Adding the sparsity constraint and the spatial information to NMU, leads to the minimization problem:
The objective function is composed by three terms: • the first one is the classical NMU, • the second term imposes the sparsity to the abundance matrix U, • the third term adds spatial information.
The regularization parameters and are used to balance the influence of the three terms.
(PNMU)
µ '
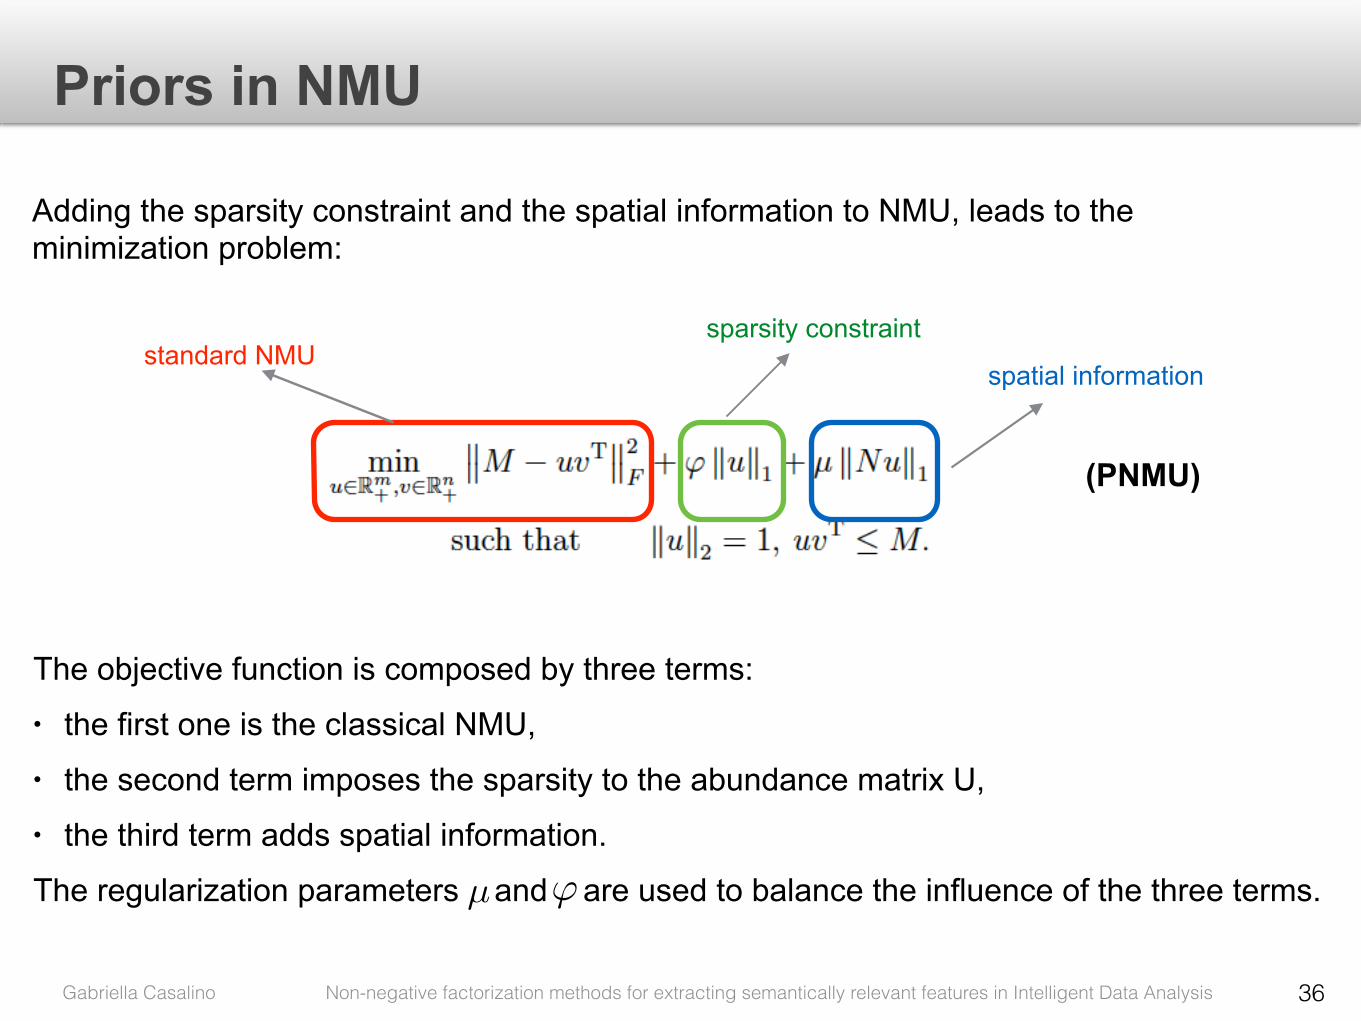
Gabriella Casalino Non-negative factorization methods for extracting semantically relevant features in Intelligent Data Analysis 36
Priors in NMU
spatial information
sparsity constraintstandard NMU
Adding the sparsity constraint and the spatial information to NMU, leads to the minimization problem:
The objective function is composed by three terms: • the first one is the classical NMU, • the second term imposes the sparsity to the abundance matrix U, • the third term adds spatial information.
The regularization parameters and are used to balance the influence of the three terms.
(PNMU)
µ '

Gabriella Casalino Non-negative factorization methods for extracting semantically relevant features in Intelligent Data Analysis 37
Experimental settings
Dataset Image dimensions
Number of wavelengths Rank
Cuprite 250 x 191 188 k=21 [0,1] step 0.1 [0,0.5] step 0.05
Hubble 128 x 128 100 k=8 [0,1] step 0.1 [0,1] step 0.1
Urban 307 x 307 210 k=6 [0,1] step 0.1 [0,1] step 0.1
San Diego Airport 400 x 400 158 k=8 [0.2,0.3] step 0.01 [0,1] step 0.1
Four datasets differing for the total number of pixels and materials are used to test the effectiveness of PNMU in correctly detecting materials in images.
Differently from classical NMU that is completely unsupervised, PNMU requires human supervision for tuning its parameters
'k
'k µk
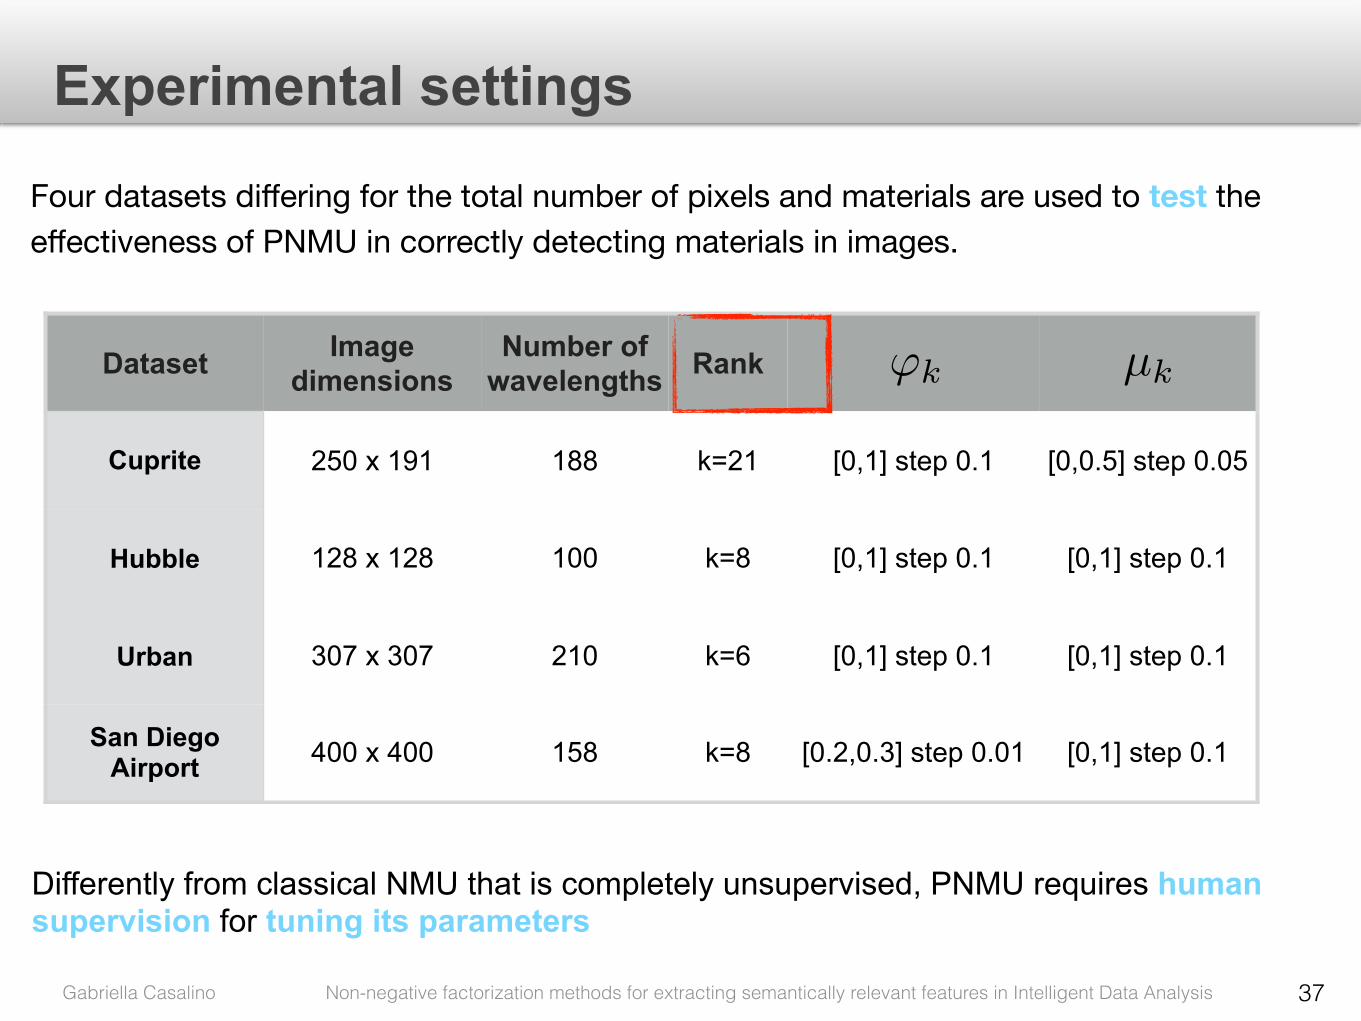

Gabriella Casalino Non-negative factorization methods for extracting semantically relevant features in Intelligent Data Analysis 38
Sensitivity of PNMU to its parameters andµ '
Figure 6.7: Basis elements of PNMU for Hubble telescope with µk = 0.6 and'k = 0.6.
has been used to show the e↵ectiveness of the method, in detect materials and
classify image pixels according to the materials they belong to, when it is used in
real contexts.
The experiments have been runned with the following set of parameters:
maxiter = 500, iter = 10, 'k 2 [0, 1], µk 2 [0, 0.5], with a step of 0.05 and
a rank k = 21.
The locality parameter µ is strongly dependent by the complexity of the scene
that is depicted in the images. In fact it enhances the membership values of the
neighborhood of a given pixel, to the material to which the pixel belongs. The
more the images are detailed, the stronger is the influence of the local information
on the factorization results. For this reason the experiments have been runned
with a maximum value of µk = 0.5, higher values give not significative results,
and with a small step. Figure 6.9 shows basis elements obtained with PNMU
with parameters µk that regulates the local information equals to the maximum
value 0.5. It could be observed that the results are poor, and the basis images
are blurry and sparse (even if sparsity has not been imposed to the algorithm).
Similarly, high values of sparsity lead to poor results. Figure 6.10 shows basis
elements obtained with PNMU with parameters 'k, that regulates the sparsity
of the bases, equals to the maximum value 1. The method does not converge,
some bases have few non-zero pixels belonging to the actual material, and the
97
(a) Basis elements of PNMU for Hubble telescope when only the sparsity cos-traint is added to NMU (µk = 0 and 'k = 1).
(b) Basis elements of PNMU for Hubble telescope when only the local infor-mation is added to NMU (µk = 1 and 'k = 0).
Figure 6.6: Comparison of bases obtained with PNMU varying the locality andsparsity constraints.
96

Gabriella Casalino Non-negative factorization methods for extracting semantically relevant features in Intelligent Data Analysis 39
Qualitative comparison: NMU
(a) Basis elements of NMU for Cuprite dataset (PNMU with parameters µk = 0 and'k = 0).
(b) Basis elements of NMU with sparsity constraint for Cuprite dataset (PNMU withparameters µk = 0 and 'k = 0.2).
Figure 6.12: Comparison of bases obtained with NMU and NMU with sparsity.
102

Gabriella Casalino Non-negative factorization methods for extracting semantically relevant features in Intelligent Data Analysis 40
Qualitative comparison: SNMU(a) Basis elements of NMU for Cuprite dataset (PNMU with parameters µk = 0 and'k = 0).
(b) Basis elements of NMU with sparsity constraint for Cuprite dataset (PNMU withparameters µk = 0 and 'k = 0.2).
Figure 6.12: Comparison of bases obtained with NMU and NMU with sparsity.
102

Gabriella Casalino Non-negative factorization methods for extracting semantically relevant features in Intelligent Data Analysis 41
Qualitative comparison: LNMU
(a) Basis elements of NMU with local information for Cuprite dataset (PNMU withparameters µk = 0.1 and 'k = 0).
.(b) Basis elements of PNMU for Cuprite dataset with parameters µk = 0.1 and 'k =0.2.
Figure 6.13: Comparison of bases obtained with NMU with local information andwith PNMU
103

Gabriella Casalino Non-negative factorization methods for extracting semantically relevant features in Intelligent Data Analysis 42
Qualitative comparison: PNMU(a) Basis elements of NMU with local information for Cuprite dataset (PNMU withparameters µk = 0.1 and 'k = 0).
.(b) Basis elements of PNMU for Cuprite dataset with parameters µk = 0.1 and 'k =0.2.
Figure 6.13: Comparison of bases obtained with NMU with local information andwith PNMU
103

Gabriella Casalino Non-negative factorization methods for extracting semantically relevant features in Intelligent Data Analysis 43
Conclusions and future work
The use of non-negative matrix factorization as intelligent data analysis tool, has been
studied and three different approaches have been proposed.

Gabriella Casalino Non-negative factorization methods for extracting semantically relevant features in Intelligent Data Analysis
1. SC as initialization mechanism for NMF is able to suggest a suitable rank k for detecting
interpretable concepts from documents, enhancing the interpretability of the results.
43
Conclusions and future work
The use of non-negative matrix factorization as intelligent data analysis tool, has been
studied and three different approaches have been proposed.
2. MNMF has been proposed to overcome the limitations of classical NMF and to introduce
knowledge in the factorization process, making it a useful tool for IDA. • Future work:
• Assess the performance of the query based MNMF approach on different real
dataset • Use of a genetic algorithm to optimize the mask matrix P

Gabriella Casalino Non-negative factorization methods for extracting semantically relevant features in Intelligent Data Analysis
3. A variant of standard NMU applied to hyperspectral images has been proposed
using prior information into the factorization process. • Sparsity and spatial information have been added. • PNMU correctly detects sparse and localized features • Future work:
• separate tuning of the parameters for different bases • quantitative comparison of the results
44
Conclusions and future work

Thanks!