
non-linear structural analysis of structures that include load-bearing ...
12
BULETINUL INSTITUTULUI POLITEHNIC DIN IAŞI Publicat de Universitatea Tehnică „Gheorghe Asachi” din Iaşi Tomul LXI (LXV), Fasc. 2, 2015 Secţia CONSTRUCŢII. ARHITECTURĂ NON-LINEAR STRUCTURAL ANALYSIS OF STRUCTURES THAT INCLUDE LOAD-BEARING WALLS BASED ON PERFORMANCE CRITERIA BY ONEA FLORIN ŢEPEŞ * and MARIAN ENE University Ovidius of Contanza Faculty of Civil Engineering Received: June 15, 2015 Accepted for publication: June 26, 2015 Abstract. Following the research in the field of static non-linear analysis done in recent years on the “Pushover” analysis method, some improvements and adjustments were made that give the designer more calculation methods than the traditional pushover analysis. The purpose of this study (non-linear static calculation) is to confirm that the design solution is a proper one and if this is the case, also suggest improvements or corrections of the design solution. By using the “pushover” analysis method we can estimate the ductile nature of a load-bearing structure, the method being one that takes into consideration the maximum displacement at the top of a structure which is acted upon by a seismic force at the base. The non-linear static analysis is not used to design the load-bearing structure, but actually to verify the design solutions given by elastic design methods, with the possibility to improve on this solution and thus assisting the designer to reach the performance requirements. Key words: non-linear; pushover; performance; design. * Corresponding author: e-mail: [email protected]
Transcript of non-linear structural analysis of structures that include load-bearing ...

BULETINUL INSTITUTULUI POLITEHNIC DIN IAŞI Publicat de
Universitatea Tehnică „Gheorghe Asachi” din Iaşi Tomul LXI (LXV), Fasc. 2, 2015
Secţia CONSTRUCŢII. ARHITECTURĂ
NON-LINEAR STRUCTURAL ANALYSIS OF STRUCTURES THAT INCLUDE LOAD-BEARING WALLS BASED ON
PERFORMANCE CRITERIA
BY
ONEA FLORIN ŢEPEŞ* and MARIAN ENE
University Ovidius of Contanza
Faculty of Civil Engineering
Received: June 15, 2015 Accepted for publication: June 26, 2015
Abstract. Following the research in the field of static non-linear analysis
done in recent years on the “Pushover” analysis method, some improvements and adjustments were made that give the designer more calculation methods than the traditional pushover analysis.
The purpose of this study (non-linear static calculation) is to confirm that the design solution is a proper one and if this is the case, also suggest improvements or corrections of the design solution.
By using the “pushover” analysis method we can estimate the ductile nature of a load-bearing structure, the method being one that takes into consideration the maximum displacement at the top of a structure which is acted upon by a seismic force at the base.
The non-linear static analysis is not used to design the load-bearing structure, but actually to verify the design solutions given by elastic design methods, with the possibility to improve on this solution and thus assisting the designer to reach the performance requirements.
Key words: non-linear; pushover; performance; design.
*Corresponding author: e-mail: [email protected]

86 Onea Florin Ţepeş and Marian Ene
1. Detailing the Non-Linear Static Analysis
The F-d (force-displacement, Fig.1) curve highlights the evolution of
the plasticizing mechanism of the structure, hence the degradation of it, on the basis that the lateral seismic force is increased, which simulates inertia forces, while the vertical loads remain at a constant value throughout (P100-1/2013).
a)
lateralforce
limiteddegradation
limitedsafety
lateraldisplacement
d
appearanceof plastic
joints
yd SLSd md ULSd
b)
F
Fig. 1 – The assimilation of the force-displacement diagram with the
diagram of an elastic-plastic system; a – ideal elasto-plastic; b – plastification structure evolution mechanism (dSLS – dispacement
service limit state; dULS – the ultimate limit state)
In its simplest form, the distribution of horizontal forces is considered
constant, while increasing proportionally after a certain initial configuration. Non-linear static analysis implies the following main steps: a) Assessing the load-bearing and deformation capacities of the
structural components. b) The assembling of the lateral force-top displacement curve. The horizontal loads shall be increased monotonously up until the point
in which the structure reaches the imposed displacement or the collapse of the structure occurs. The force-displacement curve will be drawn incrementally once the horizontal loads are monotonously applied.
In order to obtain an eloquent collapse mechanism, the imposed displacement needed to reach the performance level of the final stage is enhanced by 50% in such a way that the incremental stages obtained step by step will indicate the progression of the structural collapse.
c) Assimilating the MDOF (multiple degree of freedom) structure with a SDOF( single degree of freedom) system.
d) Evaluating the displacement requirements (P100-1/2013).
Bul. Inst. Polit. Iaşi, t. LXI (LXV), f. 2, 2015 87
For new buildings, with a load-bearing structure made up of reinforced concrete, elements designed according to the P100-1/2013 code, the inelastic displacement spectrum SD(T) can be approximated using this equation:
d* = SD(T*) = cSDe(T*),
where: c is the amplification factor of displacement; SDe(T*) – elastic response spectrum.
e) Controlling structural displacements.
1.1. Structural Modelling for the Inelastic Computation
The inelastic computation is done using SAP 2000 software, which uses different modelling for load-bearing walls than frame elements.
The wall modelling is achieved using surface elements which have the added advantage of highlighting the actual properties of concrete and steel, materials that behave different than the idealized behavior used in current calculation methods, and explicitly show in which areas of the wall the plastic deformations occur.
The wall layers have an independent behavior, but the elements have equal displacements in nodes. In SAP 2000, each layer of each elements has 4 monitored points. The stiffness matrix is obtained by integrating (Gauss integration method) the stiffness characteristics of these 4 points whilst considering the tangent modulus of elasticity of the monitored points.
The stiffness matrix of an element is obtained by summing the stiffness matrices of each individual layer (Postelnicu et al., 2012; Damian, 2011).
In the case of linear elements such as beams and columns, the plasticity modelling is achieved by introducing plastic hinges at the end of these elements. For reinforced concrete load-bearing columns, the modelling is not as simple as in the case of the beams, because the bearing capacity depends highly on the axial force, which in most cases varies during an earthquake. In this particular case the plastic hinges modelling is based on the plasticity theory.
2. Structure Design. Linear Analysis.
The analyzed structure has a basement, ground floor and 10 stories. It is placed in the city of Constanta, having an office building. The building has a length of 26.00 m and a width of 23.00 m, having a
2 dimensional regular shape both on the X and Z axes. In order to limit the overall size of the columns and beams, the load-
bearing structure is designed to include load-bearing walls which are independent or coupled. The height of a story is constant at 3.00m even in the basement. The ductility class for this building is H class (high ductility).
88 Onea Florin Ţepeş and Marian Ene
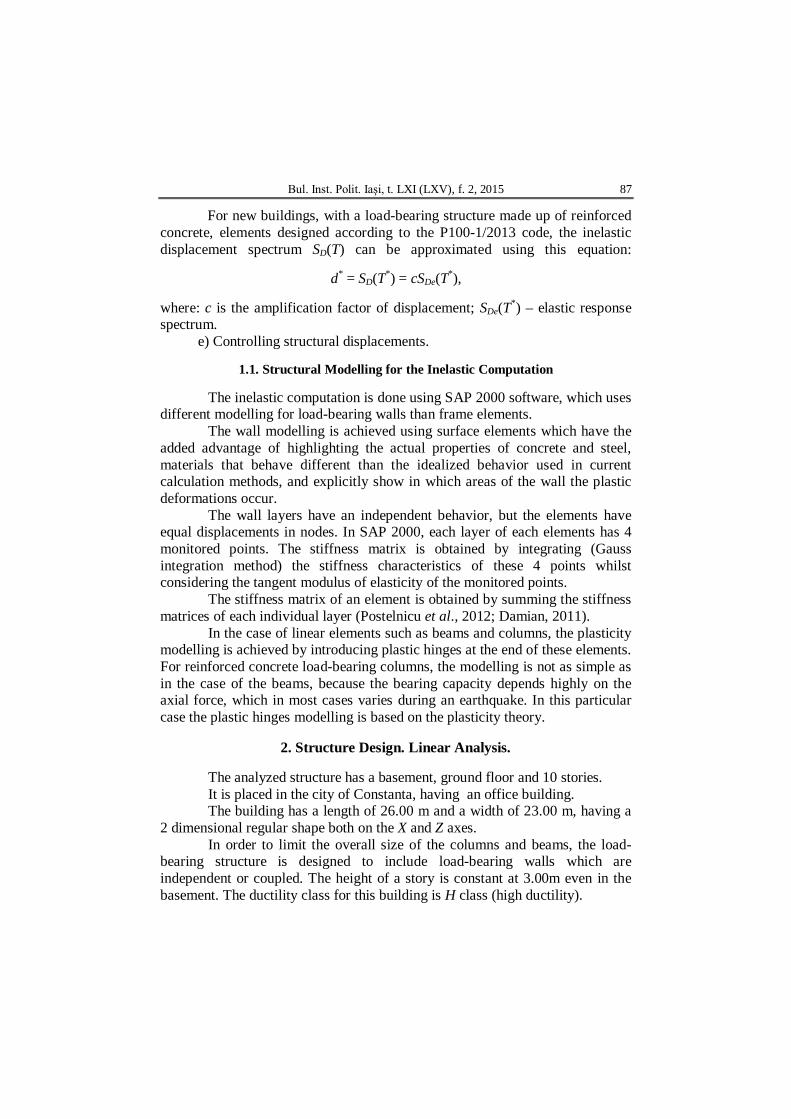
The materials used are as follows: Concrete C 30/37 Class; Steel S500C.
a b
Fig. 2 – The analyzed structure: a – Overvie; b – plan configuration of the structure (walls: P1-P8).
The design of the structure is done in the first stage.This contains the
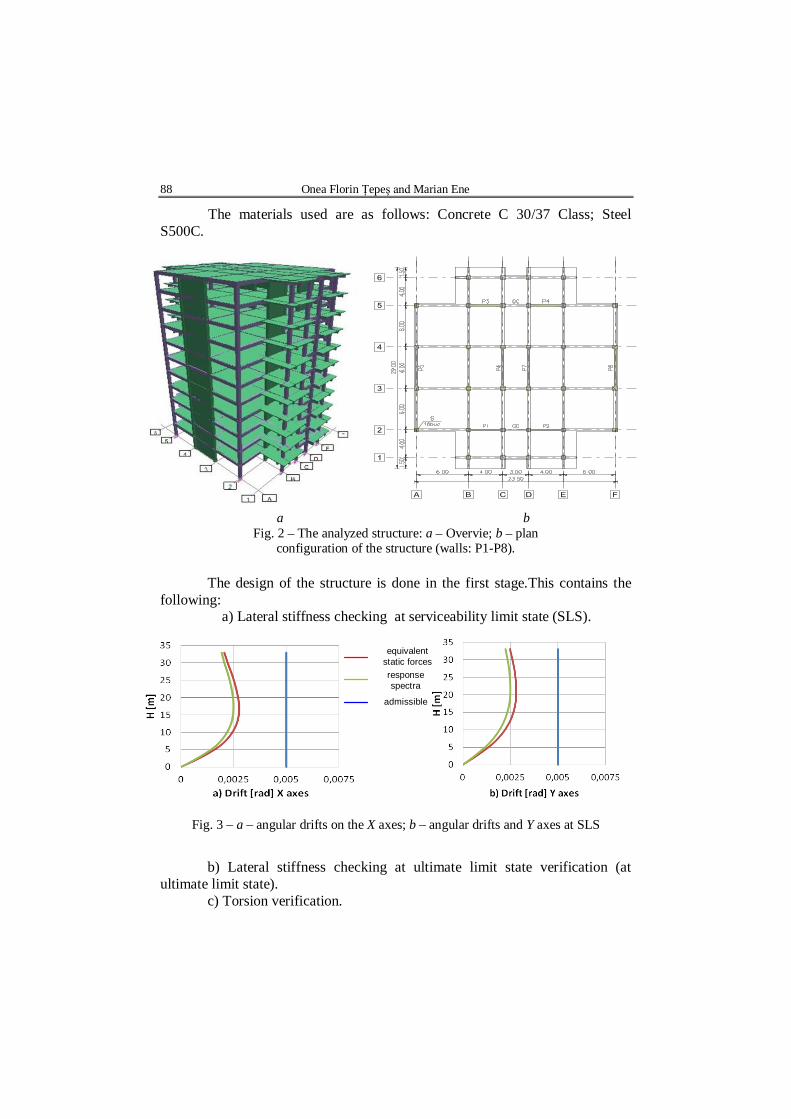
following: a) Lateral stiffness checking at serviceability limit state (SLS).
Fig. 3 – a – angular drifts on the X axes; b – angular drifts and Y axes at SLS
b) Lateral stiffness checking at ultimate limit state verification (at
ultimate limit state). c) Torsion verification.
equivalentstatic forcesresponsespectra
admissible
Bul. Inst. Polit. Iaşi, t. LXI (LXV), f. 2, 2015 89
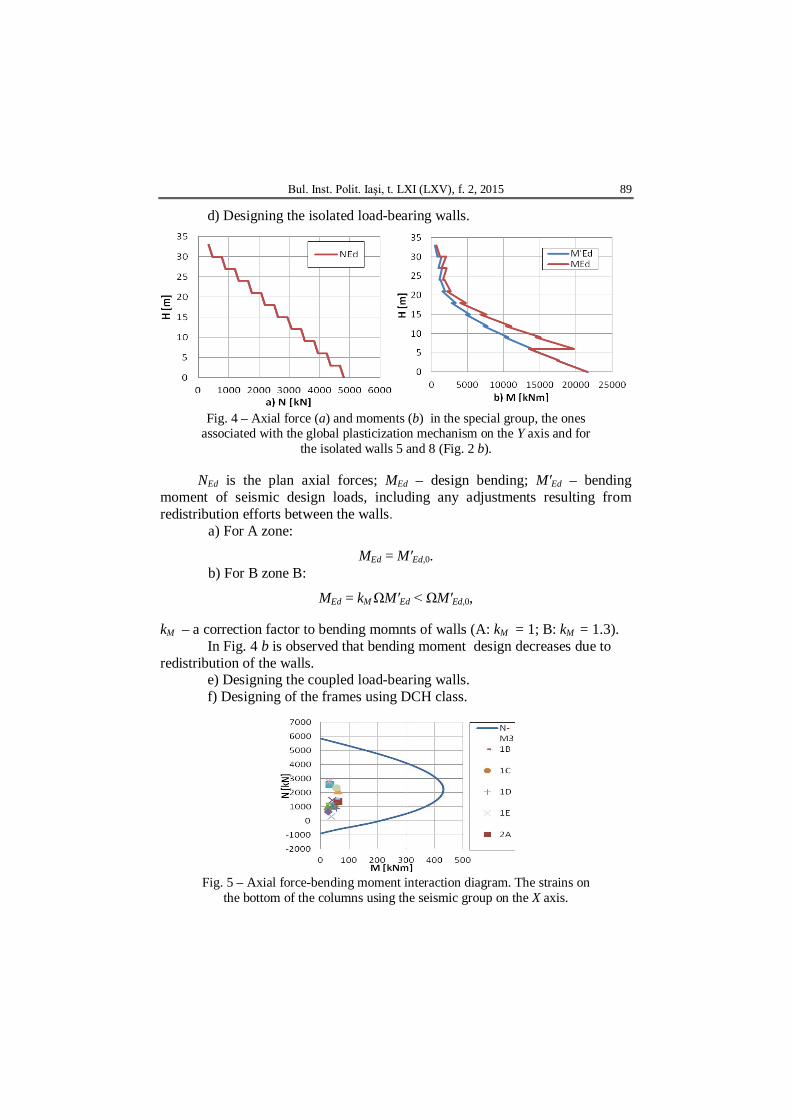
d) Designing the isolated load-bearing walls.
Fig. 4 – Axial force (a) and moments (b) in the special group, the ones associated with the global plasticization mechanism on the Y axis and for
the isolated walls 5 and 8 (Fig. 2 b).
NEd is the plan axial forces; MEd – design bending; M′Ed – bending moment of seismic design loads, including any adjustments resulting from redistribution efforts between the walls.
a) For A zone:
MEd = M′Ed,0. b) For B zone B:
MEd = kM ΩM′Ed < ΩM′Ed,0,
kM – a correction factor to bending momnts of walls (A: kM = 1; B: kM = 1.3). In Fig. 4 b is observed that bending moment design decreases due to
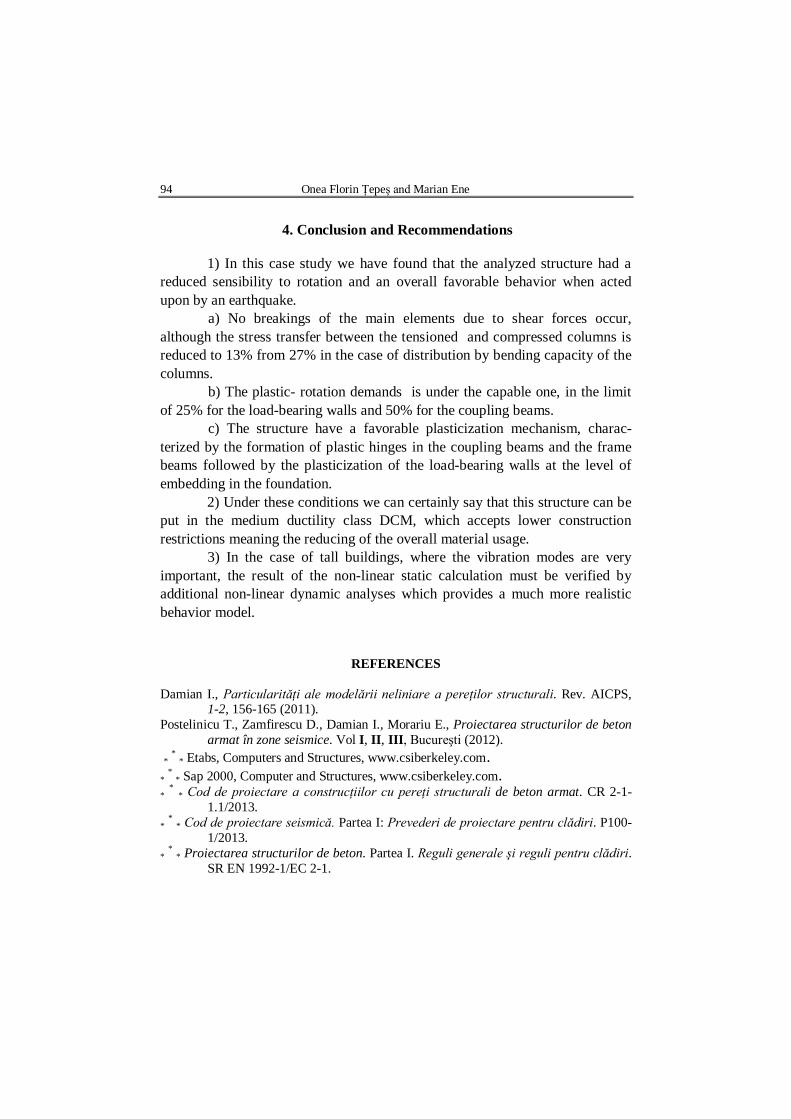
redistribution of the walls. e) Designing the coupled load-bearing walls. f) Designing of the frames using DCH class.
Fig. 5 – Axial force-bending moment interaction diagram. The strains on
the bottom of the columns using the seismic group on the X axis.

90 Onea Florin Ţepeş and Marian Ene
Interaction curves in Fig. 5 resulted in minimum percent.All the columns fit inside curve interaction.
3. Non-Linear Calculation of the Load-Bearing Structure. Evaluation of
the Strength and Deformability Properties of the Contained Elements The non-linear static calculation essentially implies the construction of
a force-lateral displacement curve on which we mark the seismic displacement requirement. Corresponding to the imposed displacement we obtain plastic rotations in the plastic hinges. The safety requirement is satisfied only if the plastic rotation capacity is higher than the requirement in each of the plastic hinge.
In Fig. 6 are shown the concrete properties used for design. Compressed Concrete (Table 1) is considered appropriate degree of
confined properties of transverse reinforcement exercised. This is determined based on the model given in SR EN 1992-1-1:
fcm = fck + 8 N/mm2 = 38 N/mm2.
Fig. 6 – Stress-strain diagram for concrete: 1 – fcm C30/37 walls
heart; fcm,c C30/37 bulbs; fcm,c C30/37 columns.
Table 1 Concrete Characteristics
Element Walls Beams columns Bulbs Heart α 0.63 0.2 0.2 0.63 ρsw 0.0057 – – 0.0040 fcm 38 38 38 38 fcm,c 42.5 – – 45.0 εc2,c 0.0033 0.002 0.002 0.0032 εcu2,c 0.0095 0.0035 0.0035 0.0126

Bul. Inst. Polit. Iaşi, t. LXI (LXV), f. 2, 2015 91
For the steel (Table 2, Fig. 7), the average hardness is determined with the following equation:
fym = 1.15fyk = 575 N/mm2,
fyk is the yield strength of reinforcement; fym – design yield strength of reinforcement.
Table 2 Steel Reinforcement Characteristics
Steel S500C fym 575 Es 200,000 εsy 0.0029 εs,u 0.075
Fig. 7 – Stress-strain diagram for the steel reinforcements.
3.1. The Construction of the Lateral Force-Top Displacement Curve
In Figs. 8 and 9 the force-displacement curves on the X and Y axes are represented, as well as the bilinear of these two, the displacement requirements and the order in which the plastic hinges occur.
These curves represent the relation between the shear force that is associated with the fundamental translation mode and displacement at the top of the structure. The value of the associated shear force is 8,300 kN on the X axis and 8,550 kN on the Y axis.

92 Onea Florin Ţepeş and Marian Ene
Fig. 8 – Force-displacement curve, bylined diagram and the top
displacement requirement on the X axis.
Fig. 9 – Force-displacement curve, bylined diagram and the top
displacement requirement on the Y axis.
3.2. Verifying the Structural Elements
In order to describe the structural response the next results are checked: a) Shear force assurance. b) Relative level displacements. In Fig. 10 the relative level displacements are shown for each level of
the structure on both X and Y axes, which are obtained by using the 2 methods. c) Deformation capacity in the post elastic field
The ratio between the rotational requirements and capacity represents a seismic safety measure.
d) The energy dissipation mechanism ( the plastic hinge table during the seismic action).
capacity curve
bilineardiagram
displacementrequirement
columns andbeams
coupling beamscoulpling walls

Bul. Inst. Polit. Iaşi, t. LXI (LXV), f. 2, 2015 93
Fig. 10 – Displacement requirement values associated with SLS obtained using an elastic calculation (the response spectrum method) and non-linear static calculation:
(a) X axis (b) Y axis. Compared admissible. A favorable plasticization mechanism is described by the forming of
plastic hinges in the coupling beams between the load-bearing walls and where the walls are embedded in the foundation. In this manner the structural elements are mobilized to dissipate the seismic force that acts upon the whole building producing limited displacement requirements which are uniformly distributed.
a b Fig. 11 – Plastic hinge table which resulted from the nonlinear analysis:
(a) 2nd axis elevation (b) 3rd axis elevation (design earthquake).
94 Onea Florin Ţepeş and Marian Ene
4. Conclusion and Recommendations
1) In this case study we have found that the analyzed structure had a
reduced sensibility to rotation and an overall favorable behavior when acted upon by an earthquake.
a) No breakings of the main elements due to shear forces occur, although the stress transfer between the tensioned and compressed columns is reduced to 13% from 27% in the case of distribution by bending capacity of the columns.
b) The plastic- rotation demands is under the capable one, in the limit of 25% for the load-bearing walls and 50% for the coupling beams.
c) The structure have a favorable plasticization mechanism, charac-terized by the formation of plastic hinges in the coupling beams and the frame beams followed by the plasticization of the load-bearing walls at the level of embedding in the foundation.
2) Under these conditions we can certainly say that this structure can be put in the medium ductility class DCM, which accepts lower construction restrictions meaning the reducing of the overall material usage.
3) In the case of tall buildings, where the vibration modes are very important, the result of the non-linear static calculation must be verified by additional non-linear dynamic analyses which provides a much more realistic behavior model.
REFERENCES Damian I., Particularităţi ale modelării neliniare a pereţilor structurali. Rev. AICPS,
1-2, 156-165 (2011). Postelinicu T., Zamfirescu D., Damian I., Morariu E., Proiectarea structurilor de beton
armat în zone seismice. Vol I, II, III, Bucureşti (2012). * * * Etabs, Computers and Structures, www.csiberkeley.com. * * * Sap 2000, Computer and Structures, www.csiberkeley.com. * * * Cod de proiectare a construcţiilor cu pereţi structurali de beton armat. CR 2-1-
1.1/2013. * * * Cod de proiectare seismică. Partea I: Prevederi de proiectare pentru clădiri. P100-
1/2013. * * * Proiectarea structurilor de beton. Partea I. Reguli generale şi reguli pentru clădiri.
SR EN 1992-1/EC 2-1.

Bul. Inst. Polit. Iaşi, t. LXI (LXV), f. 2, 2015 95
ANALIZA NELINIARĂ A STRUCTURILOR CU PEREŢI STRUCTURALI PE
BAZA CRITERIILOR DE PERFORMANŢĂ
(Rezumat) În urma cercetărilor efectuate în ultimii ani analiza statică neliniară denumită şi
analiza „Pushover” a fost îmbunătăţită şi ajustată oferind proiectanţilor mai multe metode de calcul nelinar faţă de limitările analizelor pushover tradiţionale.
Scopul studiului (calcul static neliniar) este de a confirma soluţia proiectată prin metoda curentă şi să sugereze, dacă este cazul, măsuri de corectare ale acesteia
Prin analiza de tip pushover se poate estima caracterul ductil al structurii de rezistenţă, fiind o metodă ce ia în calcul deplasarea maximă la vârf a structurii ce corespunde unei forţe laterale provenită din acţiunea seismică.
Analiza statică neliniară nu este folosită pentru a proiecta structura de rezistenţă ci pentru a verifica soluţiile alese prin metodele de proiectare elastică cu posibilitatea de a le îmbunătăţi caracteristicile astfel ajutându-le să se încadreze în cerinţele de performanţă impuse.