NON INVASIVE DIAGNOSIS OF CARDIAC …web2py.iiit.ac.in/research_centres/publications/download... ·...
84
NON INVASIVE DIAGNOSIS OF CARDIAC ARRHYTHMIA, CORONARY ARTERY DISEASE THROUGH FINGERTIP PHOTOPLETHYSMOGRAPHY Thesis submitted in partial fulfillment of the requirements for the degree of Master of Science in ELECTRONICS AND COMMUNICATIONS ENGINEERING by RESEARCH by NEERAJ SUDHIR PARADKAR 201232533 [email protected] International Institute of Information Technology Hyderabad - 500 032, INDIA JUNE 2017
Transcript of NON INVASIVE DIAGNOSIS OF CARDIAC …web2py.iiit.ac.in/research_centres/publications/download... ·...

NON INVASIVE DIAGNOSIS OF CARDIAC ARRHYTHMIA,CORONARY ARTERY DISEASE THROUGH FINGERTIP
PHOTOPLETHYSMOGRAPHY
Thesis submitted in partial fulfillmentof the requirements for the degree of
Master of Sciencein
ELECTRONICS AND COMMUNICATIONS ENGINEERING byRESEARCH
by
NEERAJ SUDHIR PARADKAR201232533
International Institute of Information TechnologyHyderabad - 500 032, INDIA
JUNE 2017

Copyright c© NEERAJ SUDHIR PARADKAR, 2017
All Rights Reserved


To My parents and friends

Acknowledgments
Foremost, I express my thanks and gratitude to my thesis advisor Dr. Shubhajit Roy Chowdhury forhis continuous advice he provided me throughout the course of my time here. Without his motivationand support, it would have not been possible for me to continue my work till the final stages. I wouldnot have submitted this thesis if not for his immense patience with me.
The time I spent here was made truly memorable by my friends Ajinkya, Lipika, Falak, Koustav,Harit, Prateek, Bhuvanan, Gopi, Mihir, Lokesh, Gaurav and the list goes on and on. Thank you all forbeing with me through everything and I will always cherish all the memories with you guys.
I can not thank my parents enough for providing me with unconditional love, trust and patience. Itwas a long journey and you made it possible. I express my infinite gratitude to them for bringing me tolife in this universe.
Finally I thank my institute for providing me with this opportunity to carry out research and shapingup my career.
v
Abstract
Healthy heart is a key for healthy life. Unfortunately in many cases the heart function deterioratesover a person’s lifetime, often with tragic consequences. A class of diseases involving heart functionalityis termed cardiovascular disease. Among a number of such cardiovascular diseases, cardiac arrhythmiaand coronary artery disease (CAD) are two of the most common and potentially life threatening diseasesand are the our work is focussed around them. A primary reason for a high casualty figures caused bythese diseases can be attributed to the fact that the diagnosis is not done on time. Often, the symptoms arenoticeable only at a stage where the person needs immediate medical attention. Accurate diagnosis canonly be done at specialized healthcare facilities by trained personnel. The diagnosis is also expensive.This limits its accessibility for major portion of population especially in rural areas. State of the artdiagnosis for coronary artery disease typically involves an invasive procedure. Though this procedure isconclusive, it is still painful and risky. Assessing these challenges, there is a need for a widely accessible,inexpensive and preferably non invasive alternative.
While looking for alternatives, electrocardiography or ECG has advantages of being accessible, non-invasive, and inexpensive. It is used for diagnosing cardiac arrhythmia, and as a screening test forcoronary artery disease. However this screening is inconclusive and other techniques are recommended.Another non invasive technique, phonocardiography or PCG suffers from complex design and sensitiveequipment. Which brings us to yet another well known technique, most commonly used for pulseoximetry, the photoplethysmography (PPG). Photoplethysmography can be defined as study of bloodvolume changes through light. It is non invasive, inexpensive and can easily be made portable thusmaking an ideal candidate for further investigation. PPG is also very suitable for use in wearable devicestechnology and such devices are used for ambulatory monitoring. Having all the desired characteristics,PPG is further investigated towards diagnosing cardiac diseases. As PPG as a technique already existsand is widely used, this work is aimed at developing techniques to analyse the PPG data towards possiblediagnosis of cardiac diseases.
Phtoplethysmography has its own challenges. It has high sensitivity and susceptibility to motion.This is particularly concerning for detecting arrhythmia and coronary artery disease alike as it wronglyaffects heart beat detection as well as degrades the natural characteristics of the signal. First contributionof this work is a technique to estimate heart rate in presence of motion induced artifcats using fuzzyentropy of the signal. Once accurate heart rate is estimated, the input signal is tested for possible
vi

vii
cardiac arrhythmias such as tachycardia, bradycardia, asystole, ventricular tachycardia and ventricularfibrillation.
The fuzzy entropy based method poses some implementation limitations as it is computationallyinefficient and requires initial user input. Another approach is developed to overcome these limitations.A quality index is assigned to each pulse. The artifact portion is removed using an appropriate threshold.The remaining clean portion of the signal is used for arrhythmia detection. This technique is faster andmore accurate than fuzzy entropy based technique and much more useful for arrhythmia detection.
Another important contribution of this work is to explore PPG for detecting coronary artery disease.This involves analysing the morphology of the PPG signal and its second derivative. Characteristicpoints are obtained from the PPG waveform and its second derivative. Temporal position of thesecharacteristic points is used as a distinguishing feature to classify between healthy subjects and CADpatients. This analysis is carried out using invasive arterial blood pressure (ABP) signal as well. Super-vised classification using support vector machine is employed for classifying healthy subjects and CADpatients. It is observed that higher classification accuracy was obtained using PPG signal compared toABP. Despite certain limitations, we present proof to suggest that PPG can be effective in detectingcertain cardiac arrhythmias and coronary artery disease.

Contents
Chapter Page
1 Introduction . . . . . . . . . . . . . . . . . . . . . . . . . . . . . . . . . . . . . . . . . . 11.1 Background . . . . . . . . . . . . . . . . . . . . . . . . . . . . . . . . . . . . . . . . 1
1.1.1 Arrhythmia . . . . . . . . . . . . . . . . . . . . . . . . . . . . . . . . . . . . 21.1.2 Pathophysiology of Arrhythmia . . . . . . . . . . . . . . . . . . . . . . . . . 31.1.3 Tachycardia . . . . . . . . . . . . . . . . . . . . . . . . . . . . . . . . . . . . 31.1.4 Bradycardia . . . . . . . . . . . . . . . . . . . . . . . . . . . . . . . . . . . . 31.1.5 Asystole . . . . . . . . . . . . . . . . . . . . . . . . . . . . . . . . . . . . . 31.1.6 Ventricular Fibrillation . . . . . . . . . . . . . . . . . . . . . . . . . . . . . . 41.1.7 Symptoms . . . . . . . . . . . . . . . . . . . . . . . . . . . . . . . . . . . . 41.1.8 Diagnosis . . . . . . . . . . . . . . . . . . . . . . . . . . . . . . . . . . . . . 4
1.1.8.1 Holter monitor . . . . . . . . . . . . . . . . . . . . . . . . . . . . . 41.1.8.2 Echocardiogram . . . . . . . . . . . . . . . . . . . . . . . . . . . . 41.1.8.3 Stress test . . . . . . . . . . . . . . . . . . . . . . . . . . . . . . . 4
1.1.9 Coronary Artery Disease . . . . . . . . . . . . . . . . . . . . . . . . . . . . . 41.1.10 Pathophysiology of CAD . . . . . . . . . . . . . . . . . . . . . . . . . . . . . 51.1.11 Diagnosis . . . . . . . . . . . . . . . . . . . . . . . . . . . . . . . . . . . . . 5
1.1.11.1 Coronary Angiography . . . . . . . . . . . . . . . . . . . . . . . . 51.1.11.2 Electrocardiography (ECG) . . . . . . . . . . . . . . . . . . . . . . 61.1.11.3 Stress Testing . . . . . . . . . . . . . . . . . . . . . . . . . . . . . 61.1.11.4 Cardiac Computed Tomography Angiography (CTCA) . . . . . . . 61.1.11.5 Echocardiography . . . . . . . . . . . . . . . . . . . . . . . . . . . 61.1.11.6 Intravascular ultrasound . . . . . . . . . . . . . . . . . . . . . . . . 6
1.2 Motivation . . . . . . . . . . . . . . . . . . . . . . . . . . . . . . . . . . . . . . . . . 61.3 Previous Work . . . . . . . . . . . . . . . . . . . . . . . . . . . . . . . . . . . . . . . 71.4 Scope and Contribution . . . . . . . . . . . . . . . . . . . . . . . . . . . . . . . . . . 91.5 Organization . . . . . . . . . . . . . . . . . . . . . . . . . . . . . . . . . . . . . . . . 10
2 Overview of Fingertip Photoplethysmography: Prospects and Challenges . . . . . . . . . . . 122.1 Photoplethysmography Fundamentals . . . . . . . . . . . . . . . . . . . . . . . . . . 122.2 Clinical Physiological Monitoring . . . . . . . . . . . . . . . . . . . . . . . . . . . . 13
2.2.1 Blood Oxygen Saturation . . . . . . . . . . . . . . . . . . . . . . . . . . . . 132.2.2 Blood Glucose, Haemoglobin . . . . . . . . . . . . . . . . . . . . . . . . . . 132.2.3 Heart Rate . . . . . . . . . . . . . . . . . . . . . . . . . . . . . . . . . . . . 142.2.4 Blood Pressure Measurement . . . . . . . . . . . . . . . . . . . . . . . . . . 142.2.5 Respiratory Rate . . . . . . . . . . . . . . . . . . . . . . . . . . . . . . . . . 14
viii
CONTENTS ix
2.3 Vascular Assessment . . . . . . . . . . . . . . . . . . . . . . . . . . . . . . . . . . . 142.3.1 Arterial Health . . . . . . . . . . . . . . . . . . . . . . . . . . . . . . . . . . 142.3.2 Endothelial Function . . . . . . . . . . . . . . . . . . . . . . . . . . . . . . . 152.3.3 Microvascular Blood Flow And Tissue Viability . . . . . . . . . . . . . . . . 15
2.4 Challenges . . . . . . . . . . . . . . . . . . . . . . . . . . . . . . . . . . . . . . . . . 162.4.1 Noise . . . . . . . . . . . . . . . . . . . . . . . . . . . . . . . . . . . . . . . 162.4.2 Amplitude Variations of PPG Signal . . . . . . . . . . . . . . . . . . . . . . . 162.4.3 Motion Induced Artifact . . . . . . . . . . . . . . . . . . . . . . . . . . . . . 16
3 Motion Artifacts Removal And Cardiac Arrhythmia Detection Using Fuzzy Entropy . . . . . 173.1 Related Work . . . . . . . . . . . . . . . . . . . . . . . . . . . . . . . . . . . . . . . 173.2 Fuzzy Entropy Based Motion Artifact Detection . . . . . . . . . . . . . . . . . . . . . 18
3.2.0.1 Peak Identification . . . . . . . . . . . . . . . . . . . . . . . . . . . 183.2.0.2 Entropy Calculation . . . . . . . . . . . . . . . . . . . . . . . . . . 183.2.0.3 Classification . . . . . . . . . . . . . . . . . . . . . . . . . . . . . 19
3.3 Entropy Measure Of Fuzziness . . . . . . . . . . . . . . . . . . . . . . . . . . . . . . 203.3.1 Modified Entropy Measure . . . . . . . . . . . . . . . . . . . . . . . . . . . . 21
3.4 Motion Artifact Detection . . . . . . . . . . . . . . . . . . . . . . . . . . . . . . . . . 213.4.1 Dataset . . . . . . . . . . . . . . . . . . . . . . . . . . . . . . . . . . . . . . 223.4.2 Discussion . . . . . . . . . . . . . . . . . . . . . . . . . . . . . . . . . . . . 22
3.5 Arrhythmia Detection . . . . . . . . . . . . . . . . . . . . . . . . . . . . . . . . . . . 243.5.1 Dataset . . . . . . . . . . . . . . . . . . . . . . . . . . . . . . . . . . . . . . 303.5.2 Arrhythmia Detection Using Pulse Rate (bpm) . . . . . . . . . . . . . . . . . 303.5.3 Discussion . . . . . . . . . . . . . . . . . . . . . . . . . . . . . . . . . . . . 30
3.6 Summary . . . . . . . . . . . . . . . . . . . . . . . . . . . . . . . . . . . . . . . . . 31
4 Pulse Quality Estimation Using PPG Morphology and Its Applications . . . . . . . . . . . . 334.1 Related Work . . . . . . . . . . . . . . . . . . . . . . . . . . . . . . . . . . . . . . . 334.2 Proposed Method . . . . . . . . . . . . . . . . . . . . . . . . . . . . . . . . . . . . . 34
4.2.1 Peak Identification . . . . . . . . . . . . . . . . . . . . . . . . . . . . . . . . 344.2.2 Spectral Residual Representation . . . . . . . . . . . . . . . . . . . . . . . . 344.2.3 Gaussian Fit . . . . . . . . . . . . . . . . . . . . . . . . . . . . . . . . . . . 35
4.2.3.1 Physiology of PPG signal . . . . . . . . . . . . . . . . . . . . . . . 354.2.3.2 PPG As Sum of Gaussian Functions . . . . . . . . . . . . . . . . . 37
4.2.4 Number of Peaks . . . . . . . . . . . . . . . . . . . . . . . . . . . . . . . . . 384.2.5 Feature Vector . . . . . . . . . . . . . . . . . . . . . . . . . . . . . . . . . . 384.2.6 Quality Estimation . . . . . . . . . . . . . . . . . . . . . . . . . . . . . . . . 38
4.3 Motion Artifact Detection . . . . . . . . . . . . . . . . . . . . . . . . . . . . . . . . . 384.3.1 Dataset . . . . . . . . . . . . . . . . . . . . . . . . . . . . . . . . . . . . . . 394.3.2 Discussion . . . . . . . . . . . . . . . . . . . . . . . . . . . . . . . . . . . . 39
4.4 Arrhythmia Detection . . . . . . . . . . . . . . . . . . . . . . . . . . . . . . . . . . . 414.4.1 Dataset . . . . . . . . . . . . . . . . . . . . . . . . . . . . . . . . . . . . . . 414.4.2 Discussion . . . . . . . . . . . . . . . . . . . . . . . . . . . . . . . . . . . . 42
4.5 Summary . . . . . . . . . . . . . . . . . . . . . . . . . . . . . . . . . . . . . . . . . 43

x CONTENTS
5 Detection of Coronary Artery Disease Using Signal Morphology . . . . . . . . . . . . . . . 455.1 Arterial Blood Pressure (ABP) . . . . . . . . . . . . . . . . . . . . . . . . . . . . . . 455.2 Arterial Ageing . . . . . . . . . . . . . . . . . . . . . . . . . . . . . . . . . . . . . . 465.3 Morphological Analysis Using Second Derivative . . . . . . . . . . . . . . . . . . . . 475.4 Proposed Method . . . . . . . . . . . . . . . . . . . . . . . . . . . . . . . . . . . . . 485.5 Representative Pulse Extraction . . . . . . . . . . . . . . . . . . . . . . . . . . . . . 48
5.5.1 Preprocessing and Pulse Segmentation . . . . . . . . . . . . . . . . . . . . . 485.5.2 Fundamentals of SVD . . . . . . . . . . . . . . . . . . . . . . . . . . . . . . 485.5.3 Estimation of Dominant Periodic Component and Representative Pulse . . . . 49
5.6 Morphological Analysis of Representative Pulse . . . . . . . . . . . . . . . . . . . . . 505.7 Morphological Analysis of Second Derivative of Representative Pulse . . . . . . . . . 50
5.7.1 Wavelet Transform . . . . . . . . . . . . . . . . . . . . . . . . . . . . . . . . 515.7.2 Selection of Wavelet Function . . . . . . . . . . . . . . . . . . . . . . . . . . 525.7.3 Wavelet Transform of PPG waveform . . . . . . . . . . . . . . . . . . . . . . 525.7.4 Local Extrema Detection . . . . . . . . . . . . . . . . . . . . . . . . . . . . . 52
5.8 CAD Detection . . . . . . . . . . . . . . . . . . . . . . . . . . . . . . . . . . . . . . 535.8.1 Datasets Used . . . . . . . . . . . . . . . . . . . . . . . . . . . . . . . . . . . 535.8.2 Morphology of Patient and Healthy Subject Data . . . . . . . . . . . . . . . . 545.8.3 Features . . . . . . . . . . . . . . . . . . . . . . . . . . . . . . . . . . . . . 545.8.4 Classification . . . . . . . . . . . . . . . . . . . . . . . . . . . . . . . . . . . 55
5.9 Results . . . . . . . . . . . . . . . . . . . . . . . . . . . . . . . . . . . . . . . . . . . 575.9.1 Discussion . . . . . . . . . . . . . . . . . . . . . . . . . . . . . . . . . . . . 57
5.10 Summary . . . . . . . . . . . . . . . . . . . . . . . . . . . . . . . . . . . . . . . . . 58
6 Conclusions And Future Work . . . . . . . . . . . . . . . . . . . . . . . . . . . . . . . . . 596.1 Thesis Summary . . . . . . . . . . . . . . . . . . . . . . . . . . . . . . . . . . . . . 596.2 Future Work . . . . . . . . . . . . . . . . . . . . . . . . . . . . . . . . . . . . . . . . 61
Bibliography . . . . . . . . . . . . . . . . . . . . . . . . . . . . . . . . . . . . . . . . . . . . 63

List of Figures
Figure Page
1.1 Heart activity of under normal rhythm (left) and under arterial fibrillation (right) . . . . 21.2 Typical ECG waveform (top) and corresponding PPG waveform (bottom) . . . . . . . 8
2.1 Typical PPG mechanism . . . . . . . . . . . . . . . . . . . . . . . . . . . . . . . . . 132.2 PPG challenges . . . . . . . . . . . . . . . . . . . . . . . . . . . . . . . . . . . . . . 15
3.1 Membership function obtained from input PPG signal . . . . . . . . . . . . . . . . . 183.2 PPG signal corrupted by motion artifact . . . . . . . . . . . . . . . . . . . . . . . . . 233.3 Entropy value of the corrupted signal in Figure 3.2 . . . . . . . . . . . . . . . . . . . 233.4 Corrupted PPG signal and its Entropy. Constant values of input signal lead to zero
entropy values. . . . . . . . . . . . . . . . . . . . . . . . . . . . . . . . . . . . . . . 253.5 Corrupted PPG signal and its Entropy. Artifact peaks lead to very small entropy values
and as seen previously, constant values lead to zero entropy. . . . . . . . . . . . . . . . 263.6 Asystole alarm detection using Fuzzy Entropy. Pulse rate less than 30bpm indicates
presence of asystole event. . . . . . . . . . . . . . . . . . . . . . . . . . . . . . . . . 273.7 Tachycardia alarm detection using Fuzzy Entropy. Pulse rate more than 100bpm indi-
cates presence of tachycardia. . . . . . . . . . . . . . . . . . . . . . . . . . . . . . . 283.8 Bradycardia alarm detection using Fuzzy Entropy. Pulse rate less than 0bpm indicates
presence of bradycardia. . . . . . . . . . . . . . . . . . . . . . . . . . . . . . . . . . 29
4.1 PPG signal corrupted by motion artifact . . . . . . . . . . . . . . . . . . . . . . . . . 364.2 Spectral Residual of the corrupted signal in Figure. 4.1 . . . . . . . . . . . . . . . . . 364.3 Gaussian Fitting for PPG signal . . . . . . . . . . . . . . . . . . . . . . . . . . . . . 374.4 Final classification of signal in Figure 4.1 . . . . . . . . . . . . . . . . . . . . . . . . 39
5.1 Typical ABP waveform . . . . . . . . . . . . . . . . . . . . . . . . . . . . . . . . . . 465.2 Characteristic points of APG . . . . . . . . . . . . . . . . . . . . . . . . . . . . . . . 475.3 Typical representative pulse . . . . . . . . . . . . . . . . . . . . . . . . . . . . . . . 495.4 Gaussian Fitting for representative pulse . . . . . . . . . . . . . . . . . . . . . . . . . 505.5 Second derivative (acceleration waveform) of representative pulse in Figure 5.3. . . . 515.6 Mexican Hat wavelet . . . . . . . . . . . . . . . . . . . . . . . . . . . . . . . . . . . 515.7 Characteristic points of Figure 5.5 . . . . . . . . . . . . . . . . . . . . . . . . . . . . 525.8 Morphology of ABP and PPG for CAD patients from MIMIC-II dataset . . . . . . . . 545.9 Morphology of ABP and PPG for healthy subjects from MIMIC-II dataset . . . . . . 555.10 Legend for morphological analysis of ABP and PPG . . . . . . . . . . . . . . . . . . 55
xi

List of Tables
Table Page
3.1 Algorithm Performance based on Capnobase and CSL Benchmark database . . . . . . 223.2 Algorithm performance comparison on Capnobase Dataset . . . . . . . . . . . . . . . 233.3 Algorithm performance comparison on CSL Dataset . . . . . . . . . . . . . . . . . . 243.4 Results for Physionet Challenge dataset . . . . . . . . . . . . . . . . . . . . . . . . . 31
4.1 Feature wise degradation in Pulse Quality Index . . . . . . . . . . . . . . . . . . . . 404.2 Algorithm Performance based on Capnobase and CSL Benchmark database . . . . . . 404.3 Algorithm performance comparison on Capnobase Dataset . . . . . . . . . . . . . . . 404.4 Algorithm performance comparison on CSL Dataset . . . . . . . . . . . . . . . . . . 414.5 Results for PhysioNet Challenge dataset . . . . . . . . . . . . . . . . . . . . . . . . . 424.6 Improved PPV . . . . . . . . . . . . . . . . . . . . . . . . . . . . . . . . . . . . . . 434.7 Comparison of overall TPR and TNR . . . . . . . . . . . . . . . . . . . . . . . . . . 43
5.1 Dataset Statistics . . . . . . . . . . . . . . . . . . . . . . . . . . . . . . . . . . . . . 545.2 Results using MIMIC-II dataset for PPG data . . . . . . . . . . . . . . . . . . . . . . 565.3 Results using MIMIC-II dataset for ABP data . . . . . . . . . . . . . . . . . . . . . . 57
xii

Chapter 1
Introduction
1.1 Background
Cardiovascular diseases or CVDs are diseases concerning heart or blood vessels. These diseasesinclude coronary artery disease, stroke, heart failure, hypertension, cardiac arrhythmia among others.CVDs are a leading cause of casualties around the world. According to World Health Organizationreport of 2012, nearly 31% of all global deaths were caused by CVD [1]. The numbers are on the risein developing countries. High blood pressure, tobacco and alcohol consumption, diabetes, obesity arefew of the risk factors associated with CVD casualties. Most of the CVDs can be prevented by life-stylechanges.
Among the CVDs, cardiac arrhythmia is most common with millions of people suffering from it. It isa disease where normal rhythm of the heart is disturbed. In most unfortunate circumstances arrhythmiacan lead to sudden cardiac arrest. Arrhythmias are responsible for up to 80% of sudden cardiac arrestcases which leads to around 12% of all deaths in a year [2]. Just like arrhythmia, coronary artery disease(CAD) is the other most significant CVD. The coronary artery supplies blood to heart muscles. Whenthe inner lining of this artery becomes hard due to calcium deposits, the blood supply to the heart isoccluded. This is known as coronary artery disease. It shares the risk factors with other CVDs. CADwas responsible for claiming around 8.14 million lives globally in 2013 which accounts for 16% of alldeaths that year [3]. Together, cardiac arrhythmia and CAD are responsible for about 28% of all globaldeaths every year.
Different symptoms are encountered for different CVDs. Although pain or discomfort in the centerof the chest, arms, left shoulder, elbows, jaw, back are common symptoms, often they are absent anda warning about the underlying CVD comes in the form of stroke. It is this absence of noticeablesymptoms and general lack of integrated primary health care programmes for diagnose and treatment ofpeople with risk factors results in at least three quarters of the world’s deaths from CVDs occur in lowand middle-income countries.
1

Figure 1.1: Heart activity of under normal rhythm (left) and under arterial fibrillation (right)
1.1.1 Arrhythmia
Cardiac arrhythmia is a group of conditions in which the heart beat is either irregular, too slow ortoo fast. Arrhythmias are classified under code 427 in ICD-9 (International Classification of Diseases)and I47 to I49 in ICD-10 codes [4]. Although most arrhythmias are not serious, they may increase riskof heart failure or stroke. Millions of people around the world suffer from cardiac arrhythmia. Suddencardiac arrest causes about 50% of all casualties due to CVDs and ventricular arrhythmias constituteto about 80% of all deaths caused by sudden cardiac arrest. Most arrhythmias do not show markedsymptoms which makes it harder to detect them. A typical heart activity of a normal subject and aarterial fibrillation patient is shown in Figure 1.1. Abnormal electrical activity causes arrhythmic heartbeats.
The rhythm of the heart is normally generated and regulated by pacemaker cells within the sinoatrial(SA) node, which is located within the wall of the right atrium. SA nodal pacemaker activity normallygoverns the rhythm of the atria and ventricles. Normal rhythm is very regular, with minimal cyclicalfluctuation. Furthermore, atrial contraction is always followed by ventricular contraction in the normalheart. When this rhythm becomes irregular or the frequency of the atrial and ventricular beats aredifferent, this is called an arrhythmia.
The normal rhythm of the heart, so-called normal sinus rhythm, can be disturbed through failure ofautomaticity, such as sick sinus syndrome, or through over activity, such as inappropriate sinus tachy-cardia. Ectopic foci prematurely exciting the myocardium on a single or continuous basis results inpremature atrial contractions (PACs) and premature ventricular contractions (PVCs). In general, theseriousness of cardiac arrhythmias depends on the presence or absence of structural heart disease.
2

1.1.2 Pathophysiology of Arrhythmia
Regardless of the specific arrhythmia, the pathogenesis of the arrhythmias falls into one of threebasic mechanisms:
1. Suppressed or enhanced automaticity
Automaticity is a natural property of all myocytes. Ischemia, scarring, electrolyte disturbances,medications, advancing age, and other factors may suppress or enhance automaticity in variousareas. Suppression of automaticity of the sinoatrial (SA) node can result in sinus node dysfunc-tion and in sick sinus syndrome (SSS), which is still the most common indication for permanentpacemaker implantation.
2. Triggered activity
Triggered activity occurs when early after-depolarizations and delayed after-depolarizations initi-ate spontaneous multiple depolarizations, precipitating ventricular arrhythmias. Examples includetorsades de pointes and ventricular arrhythmias caused by digitalis toxicity.
3. Re-entry
Probably the most common mechanism of arrhythmogenesis results from re-entry. Requisites forre-entry include bidirectional conduction and unidirectional block. Micro level re-entry occurswith VT from conduction around the scar of myocardial infarction (MI), and macro level re-entryoccurs via conduction through (Wolff-Parkinson-White [WPW] syndrome) concealed accessorypathways.
1.1.3 Tachycardia
Tachycardia is a group of arrhythmias where heart beats more than 100 times a minute. Tachycardiacan be futher classified depending on the origin of heartbeats. Sinus tachycardia originates from thesino-artial node. Ventricular tachycardia originates from the ventricle. Although sinus tachycardia maynot be life-threatening in all cases, proper diagnose is necessary. Because of very high beat rate, the heartis unable to supply adequate blood and oxygen to rest of the body which can have severe consequences.
1.1.4 Bradycardia
Bradycardia results from heart beating at a very slow rate of typically less than 60 beats a minute.
1.1.5 Asystole
Asystole is a state where the heart shows no electrical activity and thus, there is blood supply fromthe heart. This may lead to cardiac arrest. If the interval between missed beats is very long, it may causesevere oxygen starvation to much of the body including brain.
3

1.1.6 Ventricular Fibrillation
Ventricular fibrillation is characterized by disorganized electrical activity of the heart originatingfrom the ventricles. This may cause heart to beat at a very high rate and may also lead to cardiac arrest.
1.1.7 Symptoms
Patients may describe an arrhythmia as a palpitation or fluttering sensation in the chest. For sometypes of arrhythmias, a skipped beat might be sensed because the subsequent beat produces a more force-ful contraction and a thumping sensation in the chest. A racing heart is another description. Dependingon the severity of the arrhythmia, patients may experience dyspnea (shortness of breath), syncope (faint-ing), fatigue, heart failure symptoms, chest pain or cardiac arrest.
1.1.8 Diagnosis
Most standard tool for clinical diagnosis of arrhythmia is via electrocardiogram (ECG) recording.Electrical activity at various parts of the body is examined using electrodes. The timing characteristicsof the atrial and ventricular waves are studied for their shape, timing and regularity. Apart from thisprimary test, other tests can also be suggested.
1.1.8.1 Holter monitor
It is a portable device to record ECG signal which can be used to record the cardiac activity over aperiod of 24 to 48 hours.
1.1.8.2 Echocardiogram
This test involves examination of heart size, structure and motion through sound waves. This is alsoa non-invasive test and provides valuable information.
1.1.8.3 Stress test
This test provides an option that may provoke arrhythmia and make it easier for diagnosis and treat-ment. This test is especially suitable for the patients whose suspected arrhythmia is exercise-related.
1.1.9 Coronary Artery Disease
Coronary Artery Disease or CAD is one of the most common heart diseases and is responsiblefor claiming thousands of lives every year. An estimated 42% of the deaths due to CVDs globallywere caused by CAD. CAD too can lead to heart failure and number of people suffering from CAD isincreasing year by year including here in India. Typically, coronary artery disease occurs when part of
4

the smooth, elastic lining inside a coronary artery (the arteries that supply blood to the heart muscle)develops atherosclerosis. Limitation of blood flow to the heart muscles may cause the heart muscles tobe damaged and in turn increases the risk of heart attack. CAD is classified under code 414.01 in ICD-9and I25.10 in ICD-10 codes [4].
1.1.10 Pathophysiology of CAD
During the past decade, our understanding of the pathophysiology of coronary artery disease (CAD)has undergone a remarkable evolution. As patients with CAD generally present with either chronic oracute manifestations, this discussion will consider in turn these distinct modes of presentation [5].
When the arterial endothelium encounters certain bacterial products or risk factors as diverse asdyslipidemia, vasoconstrictor hormones inculpated in hypertension, the products of glycoxidation as-sociated with hyperglycemia, or proinflammatory cytokines derived from excess adipose tissue, thesecells augment the expression of adhesion molecules that promote the sticking of blood leukocytes to theinner surface of the arterial wall. Transmigration of the adherent leukocytes depends in large part onthe expression of chemoattractant cytokines regulated by signals associated with traditional and emerg-ing risk factors for atherosclerosis. Once resident in the arterial tunica intima, the blood leukocytesmainly mononuclear phagocytes and T lymphocytes communicate with endothelial and smooth mus-cle cells (SMCs), the endogenous cells of the arterial wall. Major messages exchanged among the celltypes involved in atherogenesis depend on mediators of inflammation and immunity, including smallmolecules that include lipid mediators such as prostanoids and other derivatives of arachidonic acid,e.g. the leukotrienes. Other autacoids, such as histamine, classically regulate vascular tone and increasevascular permeability.
1.1.11 Diagnosis
The initial diagnostic approach for CAD encompasses a detailed patient history including compilinga comprehensive list of CAD risk factors, a thorough physical examination to include an assessment ofall peripheral pulses which, when abnormal, may signal the presence of underlying peripheral arterialdisease.
The current diagnostic methods include electrocardiogram (ECG), stress test, Echocardiography,MRI, Intra-vascular Ultrasound and invasive techniques such as Coronary Angiography.
1.1.11.1 Coronary Angiography
Cardiac catheterization remains the gold standard for determining the presence of obstructive CAD.A cardiac catheterization yields a 2-dimensional rendering of the coronary artery circulation. To assistin circumventing the limitations of a 2-dimensional depiction of 3-dimensional anatomy, multiple views
5

from varying angles are obtained with the extent of CAD severity typically ascribed to the angulationwith the greatest stenosis severity within the particular coronary arterial segment.
1.1.11.2 Electrocardiography (ECG)
A resting 12-lead electrocardiogram should be obtained on all patients with suspected CAD. Impor-tantly, a normal electrocardiogram does not exclude coronary artery disease. Fragmented QRS (fQRS)on a 12-lead electrocardiogram (ECG) is associated with myocardial scar in CAD patients [6].
1.1.11.3 Stress Testing
Stress testing is another method for determining the presence of flow-limiting, functionally signifi-cant coronary artery disease. All stress testing techniques include electrocardiography and blood pres-sure monitoring.
1.1.11.4 Cardiac Computed Tomography Angiography (CTCA)
A non-invasive imaging assessment of coronary atherosclerosis is now possible in the form of cardiaccomputed tomography angiography. CT angiography is a viable option to quantify coronary arterycalcium [7] and it can be used as a diagnostic modality for detection of CAD [8].
1.1.11.5 Echocardiography
The echocardiogram is in many ways an ideal test when assessing a patient with known CAD. It ispainless, carries no known risk, and the results are available within approximately 30 minutes. A highsensitivity figure to detect CAD patients can be obtained using dobutamine stress echocardiography [9].
1.1.11.6 Intravascular ultrasound
This technique overcomes the limitation of coronary angiography which provides only 2D silhouetteof the lumen by providing assessment of lumen area, plaque size, distribution, and composition. It alsosafer than angiography. However it has been reported to have lower accuracy, sensitivity and specificityfigure of about 50-70
1.2 Motivation
The various diagnostic techniques discussed in the previous section have two primary limitations.First regarding the accuracy and reproducibility and other being availability and practicality. To elabo-rate the first limitation, we can can look at few statistics related to these techniques. ECG based bedsidecardiac monitoring systems are quite common in hospitals. These systems continuously monitor the
6

cardiac activity and raise alarms whenever an abnormal activity is recorded. In most cases, these sys-tems are responsible of producing far too many false alarms. False alarms as high as 86% have beenreported and around 6% to 40% of such alarms are found to be true but clinically insignificant [10]. Alsoa very small percentage of all alarms flagged by monitoring systems, about 2% to 9% are found to besignificant [11]. Also the nature of such arrhythmic events is uncertain. For patients with suspected ar-rhythmia, a wearable ECG devices are not very comfortable and suitable alternative is desirable. Movingon to CAD, the non-invasive screening of CAD by stress test was found to provide a varying sensitivityof about 14% to 88% for detection of CAD [12]. Another significant non-invasive technique is CTCA.Although this technique has a very good sensitivity figure, it has been reported to produce far too manyfalse alarms which is not desirable [13]. These false screenings mean that patients have to undergofurther rounds of testing or procedures which carry a certain risk and are not economical. Coronarycaricaturization remains the gold standard for diagnosing CAD. However it is an invasive procedureconducted by highly skilled cardiologists. It is an expensive procedure available at specific specialityhealthcare centres. Few new techniques which are suitable for early detection have been proposed [14].However these techniques also are performed in controlled clinical setting by trained professionals.This factor of availability and practicality applies for almost all the diagnostic techniques. Consider-ing how critical cardiac monitoring is and how difficult its implementation can be, it is imperative todedicate efforts and resources to improve the existing techniques or develop new ones. Some desirabletraits for a new systems would be accessibility, low-cost of use, non-invasive. Such a system should besuitable for domestic use which will enable the masses to use it. Non-invasive nature will help reduceinfection related hazards. Given these requirements, one technique which naturally comes to mind isPhtoplethysmography or PPG. PPG is study of blood circulation in our body. It is non invasive, does notrequire expensive equipment, is highly suitable to be developed as a wearable device. Portable oxime-ters which measure the blood oxygen saturation which use PPG are a quite common. These devices canbe improved to process more information provided by PPG.
1.3 Previous Work
PPG based systems have been common in clinical settings for many years now. Pulse oximetryis the most widely used application of PPG. It is also most suitable for real time estimation of bloodparameters non-invasively. Although blood parameter estimation is the most used application, PPG hasbeen investigated for other much wider applications including cardiac and respiratory monitoring asdiscussed in detail in Chapter 2.
Electrocardiogram (ECG) measures the electrical activity of heart and has long been the techniqueof choice to evaluate cardiac activity. Detection of arrhythmia and tachycardia using ECG has beendiscussed in literature [15–18]. The PPG waveform has a pulsatile nature bearing direct correspondenceto the heart rate. This has been established in a number of studies by correlating it to the ECG waveform[19–21]. This high degree of correlation can be used to replace ECG by PPG for heart rate variability
7

0 100 200 300 400
Sample Number
Am
pli
tude
ECG
PPG
P
SP
DP
R
Q S
T
Figure 1.2: Typical ECG waveform (top) and corresponding PPG waveform (bottom)
analysis [20, 22–25] as well as overall cardiac activity [26]. The heart rate estimate obtained from PPGcan be further analysed to detect possible presence of arrhythmia. PPG has been proved to be effectivefor such diagnosis [27, 28].
Important parameters of the cardiovascular system are cardiac output (CO) and systematic vascularresistance (SVR). Abnormal values of these parameters are associated with a number of critical cardiacconditions [29, 30]. Thermodilution technique, an invasive procedure which requires insertion of pul-monary artery catheter is the current gold standard for CO measurement [31]. Non-invasive estimationof these parameters using PPG has been discussed in [32].
Morphological analysis or pulse contour analysis and second derivative of PPG have yielded valuableinformation about arterial health [33]. A number of features are associated with PPG waveform such assystolic amplitude, pulse interval, artery augmentation, stiffness and reflection indices.
Analysis presented [34] compares ratio of pulse interval to systolic amplitude of subjects before andafter exercise. It concludes that this ratio could provide new piece of information towards understand-ing a subject’s cardiovascular system properties. Augmentation index is defined as the ratio of heightof late systolic peak to early systolic peak of the pulse [35]. The same definition is used in literaturesometimes to define reflection index as well. An alternate definition of reflection index is presentedin [36]. The stiffness index is a ratio of a person’s height to the time delay between systolic and di-astolic peaks of the pulse [37]. These parameters are crucial indicators of arterial health of a subjectand assessment of CVD risk [38]. These parameters present a quantitative measure towards detectinglikelihood of subject developing diseases like arteriosclerosis, atherosclerosis [35, 39–41]. Increasedarterial stiffness and vascular ageing are significant factors increasing risk of CAD. These three indices,namely arterial stiffness index (SI), augmentation index (AI) or reflection index (RI) can be obtainedfrom the morphology of PPG waveform and its second derivative [37, 42, 43]. The parameters obtained
8

from PPG can be analysed to assess the risk of CAD as well [44]. Detailed analysis of invasive and noninvasive parameters from CAD patients is carried out in [45]. Pulse morphology variability analysis ofPPG towards assessing coronary atherosclerosis has been proved to be more effective than pulse intervalvariability [46].
Morphological analysis of PPG is useful in predicting other critical conditions as well. Morphologyof PPG envelope can provide a non invasive approach for detecting hypovolemia [47]. Another pulsemorphology approach to detect hypovolemia for real-time ambulatory monitoring is presented in [48].
First derivative of PPG waveform provides more features such as4T , crest time. 4T is essentiallythe time between systolic and diastolic peaks and is closely related to the time taken by the pressurewave to reach periphery starting from heart and back. Crest time is the time delay between the foot ofthe waveform and its peak. Crest time has been found to be a useful feature in CVD classification [38].
The second derivative of PPG provides more features which provide deeper understanding of cardio-vascular system and CVD classification. These features are vivid indicators of arterial ageing which ishighly correlated to CVD risk [35, 49, 50]. A detailed analysis of second derivative morphology and itsapplication in detection of CAD is presented in Chapter 5. A typical ECG waveform and correspondingPPG waveform are shown in Figure 1.2. Points P to T represent the characteristic points of ECG. SPis the systolic peaks of the PPG waveform while DP is the diastolic peak. The time duration betweenadjacent systolic peaks have high correlation with that between adjacent Q peaks of ECG.
1.4 Scope and Contribution
This thesis aims at studying the utility of PPG towards monitoring and detecting two significant car-diac ailments. This would lead to a non-invasive, inexpensive, easy-to-use, wearable-friendly systemsuitable for clinical as well as home monitoring and diagnosis. This work focuses on the qualitativeanalysis of PPG and its application for cardiac monitoring. Use of PPG based bedside oximeters isquite a common practice in many modern hospitals. Portable oximeters are also used for ambulatory orpersonal use. As such systems are already in place, PPG data acquisition has become easier. Howeverthere is still lot of scope for research to analyse this data towards clinically relevant diagnosis. Con-sidering this fact, the focus of this work is towards developing new algorithms to extract the inherentfeatures and utilise them towards diagnosis so that later on these algorithms can then be integrated withPPG recording systems. Highly reliable and widely used open source PPG datasets such as PhysionetMIMIC-II are used for the evaluation of the algorithms.
This thesis also involves reviewing the PPG technique for its applications in cardiac monitoring,identifying the challenges faced, enhancing existing techniques and developing new ones to overcomethe challenges and identifying their limitations. First major challenge involved with using PPG signalis the motion induced artifacts and other noises which will be discussed in detail in next chapter. Theydegrade the PPG signal and it is essential to remove them. The first contribution of this work is an algo-rithm to identify the artifact induced section of the PPG signal. We use the concept of fuzzy entropy for
9

a signal to calculate the measure of fuzziness of the PPG signal. We modify the membership functionfor entropy calculation and propose a modified fuzzy entropy based technique to detect motion artifacts.This step helps in omitting the noisy and corrupt sections of the PPG signal which can lead to incorrectdiagnosis. This technique is then extended and used for pulse segmentation. The noise-free sectionof the PPG signal is used to estimate instantaneous heart rate. This heart rate is then used to detectpresence of cardiac arrhythmia. Owing to few limitations of the fuzzy entropy based technique, anotherapproach is developed for artifact detection and pulse segmentation. This new approach uses Gaussiancurve fitting along with few other time and frequency domain features to assign a pulse quality indexfor each probable pulse. Higher the index, higher is the quality and information content of the signal.Depending on application, different thresholds can be set to select signal having highest index values.This approach also helps in removing artifacts and proved to be more accurate for pulse segmentationand arrhythmia detection than the previous method. The final task is to develop an algorithm for de-tecting coronary artery disease from the PPG signal. Morphological analysis of PPG and arterial bloodpressure waveforms is carried out to identify salient features. Supervised classification based techniqueis presented to classify healthy subjects and CAD patients using their PPG waveform. A comparison ismade between non-invasive PPG and invasive ABP waveforms towards CAD detection using the sametechnique. To summarise, major contributions of the thesis are as follows:
1. Development of two algorithms for artifacts removal and pulse segmentation.
2. Development of an algorithm for detecting cardiac arrhythmias like tachycardia, bradycardia,asystole, ventricular tachycardia, arterial fibrillation using the technique developed in previousstep.
3. Development of an algorithm for detecting coronary artery disease through morphological analy-sis of PPG signal.
1.5 Organization
This present chapter identified and introduced the reader about two of the most life threateningcardiac diseases namely cardiac arrhythmia and coronary artery disease. We also briefly discussedtheir physiological background and the difficulty in diagnosing them especially at an early stage. Thelimitations of conventional diagnostic techniques formed the backbone of our motivation for this work.Next sections discussed the background and contributions of the thesis. It signifies the importance ofnon invasive detection and diagnostics and justifies the research involved in it.
We present an overview of photoplethysmography with its prospects and challenges in Chapter 2. Itdescribes the history of PPG and advancements carried out over the years. It provides a brief overviewof its applications and also challenges involved.
Once acquainted with the cardiac diseases and PPG technique, we shift our attention to diagnosingthem. First step in this direction is to overcome the biggest challenge of PPG, the motion induced
10

artifacts. Chapter 3 introduces techniques used to segment artifacts and also introduces a new oneusing the concept of fuzzy entropy and its application towards artifact detection. The same technique isextended to detect cardiac arrhythmias such as tachycardia, bradycardia and asystole events.
A technique to estimate quality of PPG signal is developed which can also help in removing artifactsand improve pulse segmentation. Chapter 4 presents a technique in which we analysis each pulse indi-vidually and assign a quality index to it. This forms another approach to detect cardiac arrhythmia. Thiswork overcomes the shortcomings of fuzzy entropy technique and arrhythmia detection is extended toinclude ventricular tachycardia as well as arterial fibrillation.
In Chapter 5 we analyse PPG pulse of healthy and CAD patients and its second derivative to uncoverdeterministic features to be used for disease detection. We introduce new time domain features anduse SVM classifier to distinguish between a healthy individual and a patient. We also correlate thefindings with an invasive signal, arterial blood pressure to compare invasive and non invasive aspects ofdetection.
The final Chapter 6 concludes and summarizes the thesis and also includes the future prospects ofPPG and non invasive disease detection.
11

Chapter 2
Overview of Fingertip Photoplethysmography: Prospects and Challenges
In the previous chapter, the requirement of developing new techniques for cardiac monitoring wasestablished. PPG is one of the solutions. This chapter includes discussion about PPG, its fundamentals,applications and challenges involved in them.
2.1 Photoplethysmography Fundamentals
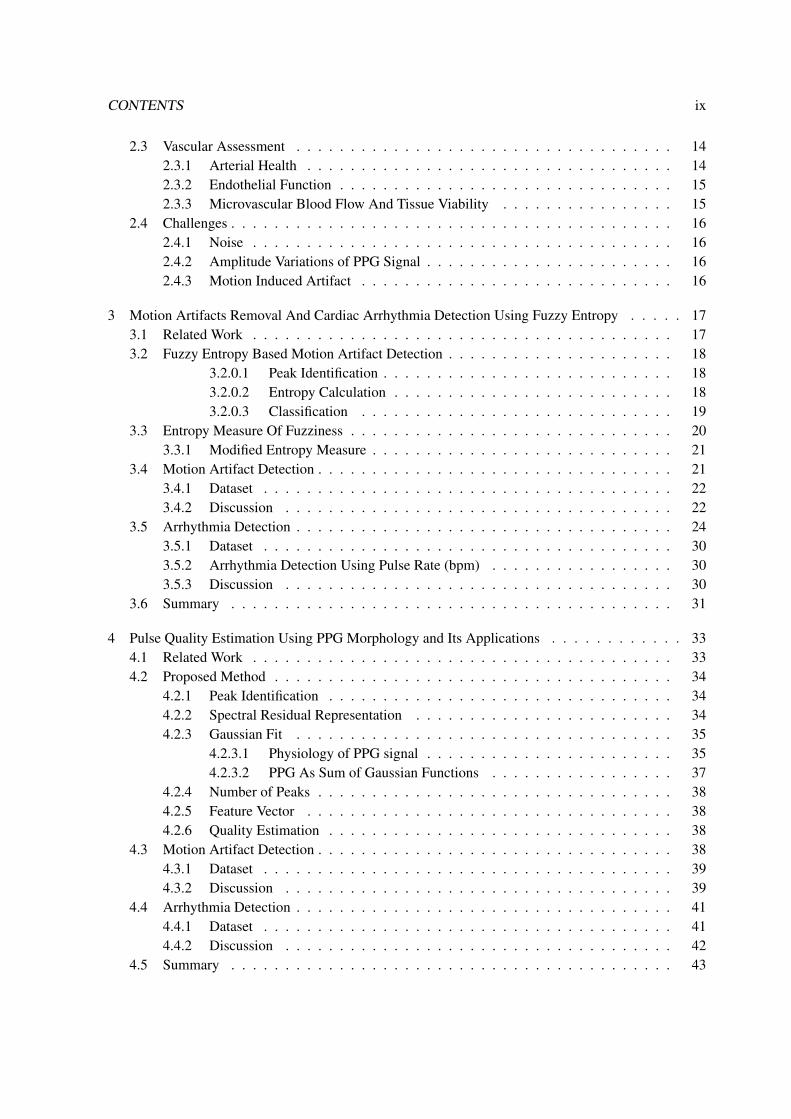
Photoplethysmography (PPG) is a technique to monitor the dynamics of blood flow in the body.Light radiation having wavelength in red or near infra-red region is passed through a certain portion ofthe body viz. fingertip, toe tip, earlobe etc as shown in 2.1. A part of this incident radiation is reflectedback from the surface of the skin itself; a certain portion of the transmitted radiation is then absorbed byvarious components of the blood viz. water, oxy- and de-oxyhaemoglobin along with a number of otherproteins and glucose etc. wherein each such component absorbs radiation specific to its own chemicalproperties. Other components such as skin, bone, tissue bed etc. also absorb radiation. Remainingportion of the radiation is transmitted to the other end is sensed through a photo detector. This techniqueis referred to as transmission PPG. Another variation of this technique is where the radiation reflectedfrom the surface of the fingertip or earlobe is sensed by the photo-sensor and it is referred to as reflectionPPG.
Absorption due to blood can be attributed to two main components namely venous blood and pul-satile arterial blood. The absorption of the radiation by the skin, bone, muscle, venous blood and tissuebed can be modelled as a constant with respect to time, however that attributed to the pulsatile arterialblood is a function of the systolic and diastolic cycles of the heart and in turn gives the PPG signal itscharacteristic form. Typically the light radiation is emitted through a light emitting diode (LED) andthe photo-sensor is often a photo-diode, which in essence converts the varying absorption pattern of theblood into an electrical quantity.
PPG has been traditionally used in pulse oximetry, however researchers have been able to uncoverits potential in wide range of applications [51, 52]. The following sections discuss these applicationsbriefly.
12
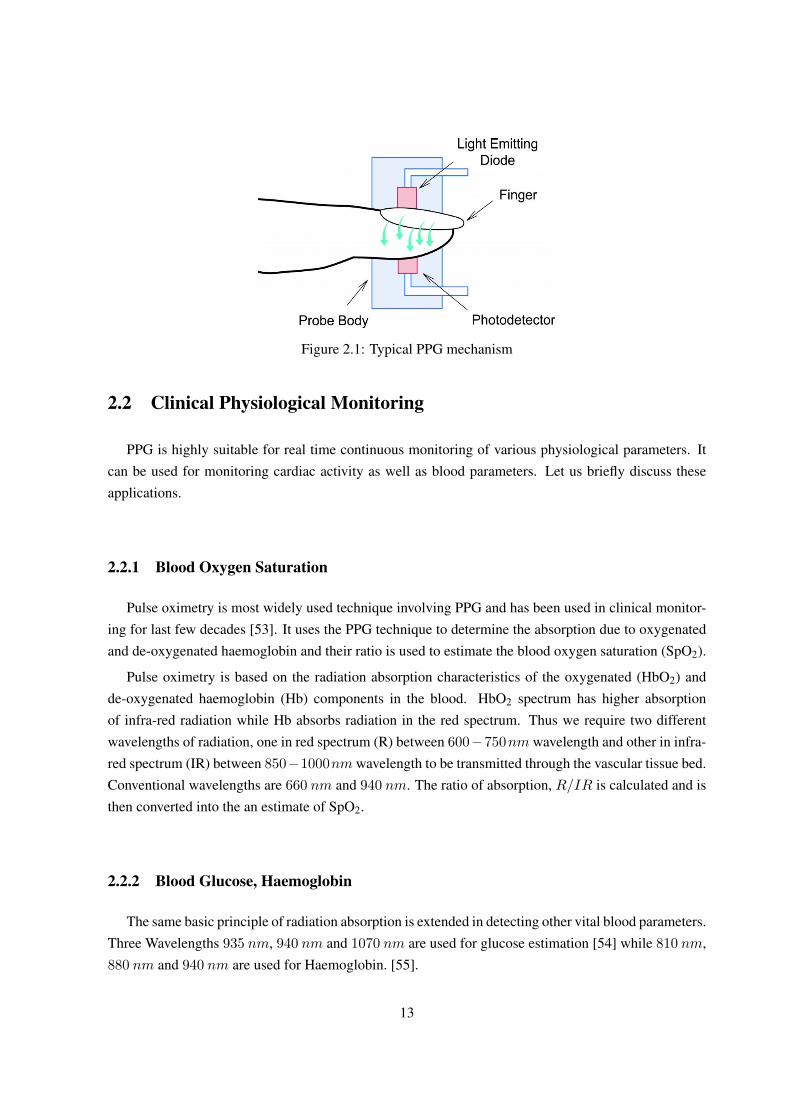
Figure 2.1: Typical PPG mechanism
2.2 Clinical Physiological Monitoring
PPG is highly suitable for real time continuous monitoring of various physiological parameters. Itcan be used for monitoring cardiac activity as well as blood parameters. Let us briefly discuss theseapplications.
2.2.1 Blood Oxygen Saturation
Pulse oximetry is most widely used technique involving PPG and has been used in clinical monitor-ing for last few decades [53]. It uses the PPG technique to determine the absorption due to oxygenatedand de-oxygenated haemoglobin and their ratio is used to estimate the blood oxygen saturation (SpO2).
Pulse oximetry is based on the radiation absorption characteristics of the oxygenated (HbO2) andde-oxygenated haemoglobin (Hb) components in the blood. HbO2 spectrum has higher absorptionof infra-red radiation while Hb absorbs radiation in the red spectrum. Thus we require two differentwavelengths of radiation, one in red spectrum (R) between 600−750nm wavelength and other in infra-red spectrum (IR) between 850−1000nm wavelength to be transmitted through the vascular tissue bed.Conventional wavelengths are 660 nm and 940 nm. The ratio of absorption, R/IR is calculated and isthen converted into the an estimate of SpO2.
2.2.2 Blood Glucose, Haemoglobin
The same basic principle of radiation absorption is extended in detecting other vital blood parameters.Three Wavelengths 935 nm, 940 nm and 1070 nm are used for glucose estimation [54] while 810 nm,880 nm and 940 nm are used for Haemoglobin. [55].
13

2.2.3 Heart Rate
Instantaneous heart rate is an important clinical physiological parameter monitored in hospital oreven ambulatory setting. A number of studies have been incorporated to establish a correlation betweenPPG and ECG in this context. These studies have been successful in establishing a strong correlationbetween the two [20].
2.2.4 Blood Pressure Measurement
Arterial blood pressure measurement is also a very important parameter which requires continuousmonitoring in autonomic function studies and also in vascular disease studies. Correlation betweenblood pressure and pulse transit time obtained from PPG has been established [56]. Major research hasbeen carried out to estimate non invasive cuff less continuous blood pressure monitoring using PPG [57].
2.2.5 Respiratory Rate
Respiratory rate or breathing interval is used in clinical care including critical and neonatal care, sleepstudy assessment and anaesthetics. Respiration causes variations in peripheral circulation and alters thelow frequency characteristics of the PPG waveform. Number of techniques have been developed toestimate respiratory rate from PPG [58–60]. PPG based systems have been designed to diagnose sleepapnea.
2.3 Vascular Assessment
In previous sections we discussed various techniques to obtain various blood parameters as wellas other vital physiological parameters using PPG. The utility of PPG however extends beyond vitalparameter estimation. It can also be studied to gather more information about peripheral circulationsystem and assess likelihood of cardiac diseases.
2.3.1 Arterial Health
Arteriosclerosis and atherosclerosis are cardiac diseases resulting from occluded arteries. They areassociated with higher risk of coronary artery disease and stroke. PPG analysis provides modality fordetecting these diseases [40]. Artificial Neural Network based classifier has been used to diagnose lowerlimb arterial disease detection [61]. Diagnose of carotid artery disease using PPG has been investigatedin [62].
14

3.1095 3.11 3.1105 3.111 3.1115 3.112 3.1125
x 105
400
450
500
550
600
(a) Noise 1.15 1.151 1.152 1.153 1.154 1.155 1.156 1.157
x 105
200
300
400
500
600
700
800
900
(b) Amplitude variation
4000 4500 5000 5500 6000 6500
−4
−2
0
2
4
6
8
(c) Motion artifacts
Figure 2.2: PPG challenges
2.3.2 Endothelial Function
Endothelial dysfunction is considered to be an early indicator of atherosclerosis and correlates withmajor risk factors for cardiovascular disease [52]. Endothelial function is assessed by measuring thechange in brachial artery diameter before and after several minutes of blood flow occlusion to the arm.Commonly, the diameter measurement is carried out using ultrasound imaging. Although the techniqueis non-invasive, it is operator dependent and expensive thus limiting its usefulness for routine clinicalassessments. PPG can offer a much less expensive alternative. Shape analysis of the PPG waveform canbe used to obtain pulse damping. Investigation into this diagnosis has been carried out in case of type IIdiabetes mellitus patients [37].
2.3.3 Microvascular Blood Flow And Tissue Viability
Measurement of the tissue perfusion is important for the clinical assessments of viability and healing.Perfusion of oxygen-carrying blood is vital for the preservation of tissue. Studies have reported excellentresults and with PPG performing better than duplex ultrasound measurements [63].
15

2.4 Challenges
PPG waveform depends on a number of factors related to the subject itself and surrounding physicalconditions. Its characteristics are a function of subject’s skin properties such as skin structure, temper-ature, finger thickness, colour and also the blood flow rate, oxygen saturation etc [33]. It also variesaccording to the activity of the subject. These variations along with other additive artifacts degrade thePPG signal. This is particularly challenging to use this signal for critical parameter monitoring or anal-ysis using PPG morphology. The most significant challenges involved in PPG based systems are shownin Figure 2.2.
2.4.1 Noise
The noise present in the PPG signal could be due to the instrumentation amplifiers, the recordingsystem picking up ambient electromagnetic signals as shown in Figure 2.2a. Moreover, high frequencynoise caused by mains power sources interference is induced onto the PPG recording probe or cable.This noise introduces a sinusoidal component into the recording.
2.4.2 Amplitude Variations of PPG Signal
The absorption of radiation is a function of skin and finger structure. Thus the signal amplitudevaries between person to person. Even in case of one individual, the amplitude may vary over time asshown in Figure 2.2b. Such a sudden amplitude variation makes it difficult to analyse the PPG signal.
2.4.3 Motion Induced Artifact
Motion induced artifacts are the most significant disturbances affecting the PPG signal. It can becaused by a number of reasons. This artifact is may be caused by poor contact to the fingertip photosensor. Variations in temperature and bias in the instrumentation amplifiers can sometimes cause base-line drift as well. However the waveform is affected the most when the subject is involved in an activitysuch as moving his arms. Such motion causes tremendous variations in the waveform and corrupts thewaveform to an extent that retrieving the original PPG waveform becomes almost impossible as seen inFigure 2.2c.
We conclude the overview of PPG and its challenges here. From next chapter onwards, we willdiscuss how to overcome these challenges and utilise the information provided by the PPG waveform todetect cardiac diseases.
16

Chapter 3
Motion Artifacts Removal And Cardiac Arrhythmia Detection Using
Fuzzy Entropy
One of the major challenges encountered while using PPG is the effect of motion induced artifactsas discussed in previous chapter. Motion artifact segmentation has always attracted a lot of attentionand various techniques have been developed which identify the corrupt portions of PPG signal. Oneof the applications of PPG being heart rate variability (HRV) analysis, accurate pulse rate estimation ishighly desired. There are a number of ways to approach the problem of removing motion artifacts. Pos-sible solution can be worked out in time domain as well as frequency domain. Wavelet transform alsopresents an interesting alternative where information from both domains can be utilised. In this chapter,we present a time domain technique which not only identifies artifacts but also provides highly accu-rate pulse rate estimation. This is highly desirable for detecting cardiac diseases such as arrhythmias.We extend this work and use the estimated pulse rate for detecting arrhythmias such as tachycardia,bradycardia and asystole events.
3.1 Related Work
We have already discussed in Chapter 2 how PPG signals are degraded by motion induced artifacts.One simple approach would be to use the motion information in identifying which area of the signalwill be most affected. One way to implement it is to install a motion sensor, typically an accelerometerin the PPG device which would monitor motion of the subject. The accelerometer lets us gain priorinformation about the movement of the subject which can be utilized to segment out the artifact asdiscussed in [64, 65]. Though such techniques can perform more accurately, not all PPG devices areequipped with accelerometers which limits their usefulness in real life and calls for a generic technique.Techniques discussed in [66–68] do not require any prior information about movement of the subject.Time frequency domain methods also have been applied to the corrupted PPG data [69].
17
0 0.5 1 1.5 2 2.5 3 3.5 4 4.5 5−2
−1
0
1
2
3
4
5
Time (Sec)
Am
plitu
de
PPG dataMembership functionEstimated peaks
Figure 3.1: Membership function obtained from input PPG signal
3.2 Fuzzy Entropy Based Motion Artifact Detection
The proposed technique is based on a notion of fuzzy entropy of a given signal. This whole idea offuzzy entropy is discussed later on in this chapter, in Section 3.3. Before moving to that, let us first gothrough the overall methodology.
The artifact segmentation and pulse rate estimation is done in three steps; (a) identify all the possiblepeaks in the signal and make a rough estimate of the pulse rate. (b) calculate the entropy for the entiresignal. (c) compare the entropy of all the peaks obtained from steps (a) and then classify them as validpulse or artifact.
3.2.0.1 Peak Identification
First all the peaks present in the input PPG signal are identified in order to make a rough estimateof the pulse rate. The maximum pulse rate is restricted to 160 beats per minute. Once all the peaks areobtained in this fashion, a rough estimate of the pulse rate is made and an appropriate window of theoriginal signal is selected around a peak to be used for the entropy calculation as shown in Figure 3.1.
3.2.0.2 Entropy Calculation
Once peaks are identified and then an appropriate window around it is selected, the entropy of theentire duration of the signal is calculated. The selected window around a peak is used as the membershipfunction. The input signal is divided into windows of same length as the membership function and eachwindow is normalized before calculating the entropy for that window.
18

3.2.0.3 Classification
The peaks obtained from first step would contain both true systolic peaks and those arising frommotion induced artifact, if present. The entropy value for all the peaks are considered and then a decisionis made to classify the peaks as true pulses or artifacts. Two thresholds are set in order to distinguishbetween true pulses and artifacts.
Algorithm 3.1 Peaks identification1: loop2: if d
dn(PPG(n)) = 0 && d2
dn2 (PPG(n)) then3: peak−dist = PPG(n)− peaks(i)4: if peak−dist ≥ minThreshold then5: peaks(i)← PPG(n)6: n+ +7: end if8: end if9: end loop
Algorithm 3.2 Entropy calculation
1: mem−f = PPG(x1 : x2)2: win = (x2 − x1 − 1)/23: loop4: for i = n− win : n+ win do5: h = (Aλn,k(x(n)))2 · 4PPG(i)6: end for7: H(n) =
∑h2
8: end loop
Algorithm 3.3 Classification1: Thlow = Γ1
2: Thhigh = Γ2
3: loop4: p← peaks(i)5: if H(p) ≥ Γ1 &H(p) ≤ Γ2 then6: true−peak ← peaks(i)7: else8: art← peaks(i)9: end if
10: i+ +11: end loop
19

3.3 Entropy Measure Of Fuzziness
The concept of the entropy measure of fuzziness was introduced by de Luca and Termini in [70]. Thefuzzy entropy is applied to ECG signals in [16, 71]. An entropy measure of fuzziness H is a mappingfrom the set of all fuzzy subsets of a base set X into the non negative real, i.e.
H : Fz(X)→ [O,∞). (3.1)
Let us Consider a uniformly sampled discrete signal with period T in the time interval from 0 to t.The value of the nth sample of this signal is denoted as x(n).
To construct a fuzzy signal from the crisp signal, let us consider a symmetric window consisting of2k + 1 original samples for each sampling point n, i.e. we will consider the following set of samples:
x(n− k), x(n− k + 1), · · ·x(n) · · ·x(n+ k − 1), x(n+ k). (3.2)
Next, this window of 2k + 1 samples is sorted starting from the minimal value, i.e. Xmin(n) =
x(1)(n) and ending with the maximal value i.e. Xmax(n) = X(2k+1)(n). So, the following relations aretrue:
x(1)(n) ≤ x(2)(n) · · · ≤ x(2k+1)(n). (3.3)
Therefore the median of the set would be
x(M)(n) = x(k+1)(n). (3.4)
The membership function for each point n is constructed in the following way. First let us assumethat An,k(xmin(n, k)) = 0, An,k(xmax(n, k)) = 0 and An,k(xM (n, k)) = 1 and then an upper semicontinuous step-wise membership function is built according to the formula:
An,k(x) =
rk x ≤ xM (n)
2k+1−rk x > xM (n)
(3.5)
where r is the number of x(i) < x.
A parametrized version of our membership function can be created to discriminate between certainlevels of membership, i.e.
Aλn,k(x) = An,k(x) · I(An,k(x)− λ), (3.6)
where I(An,k(x)− λ)stands for Heaviside pseudo function,
I(x) =
1 x ≥ 0
0 otherwise(3.7)
20

Using the above given formulas, the entropy measure of nth sample is calculated in the form of thesum of respective rectangles:
H(Aλn,k,λ) = F (2k∑i=1
h(Aλn,k(x(i)(n)) · 4x(i)(n)). (3.8)
where4x(i)(n) = x(i+1)(n)− x(i)(n). (3.9)
3.3.1 Modified Entropy Measure
The above technique works very well when the input PPG signal is free of any motion artifacts.However the technique suffers from certain shortcomings. The shape of the membership function isfixed whereas the characteristic shape of the PPG signal is unique to an individual and is difficult to bemodelled. As a result, the entropy values resulting from one PPG signal are considerably different fromone individual to other. As a consequence, it is difficult to select a threshold which would distinguish atrue pulse and an artifact for a general case.
This limitation is addressed by selecting a part of original PPG signal itself as a membership functioninstead of a fixed triangular one. We calculate mean of the peak-to-peak distance of the peaks obtainedin first step and using that information, select a membership function representing a complete systolicinterval. The interval is selected from a region of the original PPG signal where the deviation of the peak-to-peak value compared to the mean distance is minimum and has a length of 2k+ 1. This membershipfunction has to be selected by the user. For every sample of the input PPG data, a window of lengthsame as that of the membership function i.e. 2k + 1 is then considered to calculate the entropy with ksamples on each side of the point in consideration. The value of λ is is set to 0.
The entropy measure is now calculated as
H(Aλn,k,λ) = F (
2k∑i=1
h(Aλn,k(x(n)) · 4xi(n)). (3.10)
where Aλn,k(x(n)) is the membership function obtained from the signal itself i.e.
Aλn,k(x(n)) = ppg(n1 : n2) (3.11)
and4xi(n) = xi+1(n)− xi(n). (3.12)
3.4 Motion Artifact Detection
The first step used to identify all potential systolic peaks and possible motion artifact induced peaksperformed highly accurately. The number of peaks missed by the algorithm is very small although
21

DatasetAnnotedpulses
Correctpulses
Incorrectpulses
Undetectedpulses
Se (%) PPV (%)
Capnobase 27770 27725 191 45 99.32 99.84CSL 15867 15683 186 186 98.84 98.83
Table 3.1: Algorithm Performance based on Capnobase and CSL Benchmark database
improvements can be made to make it more robust in order to identify all possible peaks. The functionh is defined as h(n) = n2 and similarly, F is defined as F (n) = n2. The length of the membershipfunction 2k + 1 varies from signal to signal as it represents the length of one full systolic cycle.
3.4.1 Dataset
The algorithm was calibrated and tested using the Capnobase database [72] and the CSL Benchmarkdataset [66]. Capnobase consists of 42 recordings which include 23 recordings free from any sort ofartifact and remaining 19 contain artifacts. CSL dataset consists of 2 recording and both contain artifacts.
3.4.2 Discussion
The entropy values for the artifact free recordings strongly exhibit a regular pattern with very fewcorrections shown by 2 recordings. The recordings containing artifact manifest a similar uniform patternfor regions containing true systolic peaks; however the entropy values are significantly different for thepeaks corresponding to artifacts. The entropy values close to 1 indicate a high degree of similaritybetween the signal window being considered and the membership function. It also follows that valuesdiffering significantly from 1 suggest that the signal window has low degree of similarity with themembership function. Very high entropy values arise due to a very large gradient of the input PPGsignal at the concerned point. The gradient of a healthy PPG data follows a specific pattern, very highgradient values thus can be attributed to artifact induced corruption in data. The classification is carriedout using two thresholds; a lower bound (Γ1) to eliminate data samples bearing very low degree ofsimilarity and a higher bound (Γ2) to remove data samples with very high gradient. Γ1 is assigned valueof 0.3 ·mean(entropy peaks) and Γ2 is assigned 1.5 ·mean(entropy peaks).
The performance of the algorithm for identifying true pulses is observed using the positive predictivevalue (PPV) and sensitivity (Se) parameters defined as follows:
Sensitivity =tp
tp+ fn(3.13)
Positive Predictive V alue =tp
tp+ fp(3.14)
The calculated PPV and Se figures for the algorithm are for Capnobase and CSL database areas discussed in Table 4.2. The performance of the algorithm was predictably better when applied on
22
46 48 50 52 54 56 58 60 62
−10
−5
0
5
10
Time (Sec)
Am
plitu
de
PPG dataArtifactEstimated peaks
Figure 3.2: PPG signal corrupted by motion artifact
46 48 50 52 54 56 58 60 620
0.5
1
1.5
2
2.5
3
3.5
Time (Sec)
Am
plitu
de
PPG dataArtifactUpper thresholdMeanLower thresholdTrue positiveFalse positiveDetected artifacts
Figure 3.3: Entropy value of the corrupted signal in Figure 3.2
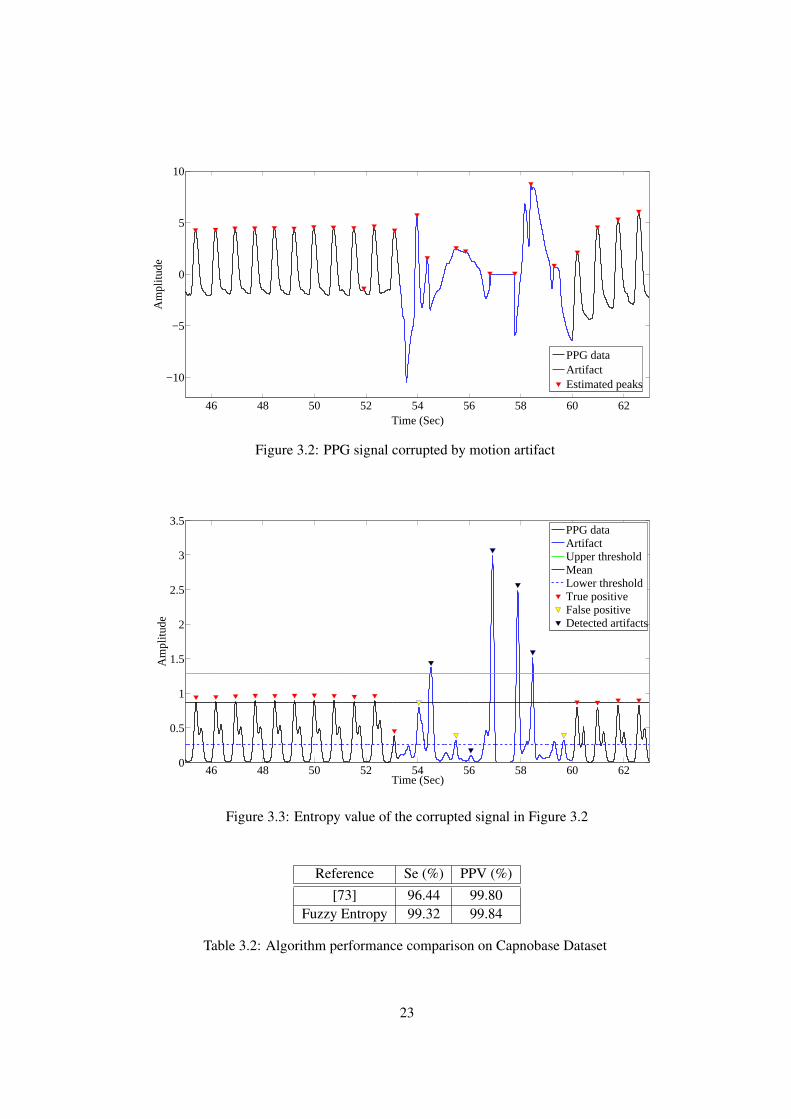
Reference Se (%) PPV (%)[73] 96.44 99.80
Fuzzy Entropy 99.32 99.84
Table 3.2: Algorithm performance comparison on Capnobase Dataset
23

Reference Se (%) PPV (%)[66] 99.27 99.35[67] 99.83 96.68[73] 96.21 99.22
Fuzzy Entropy 98.84 98.83
Table 3.3: Algorithm performance comparison on CSL Dataset
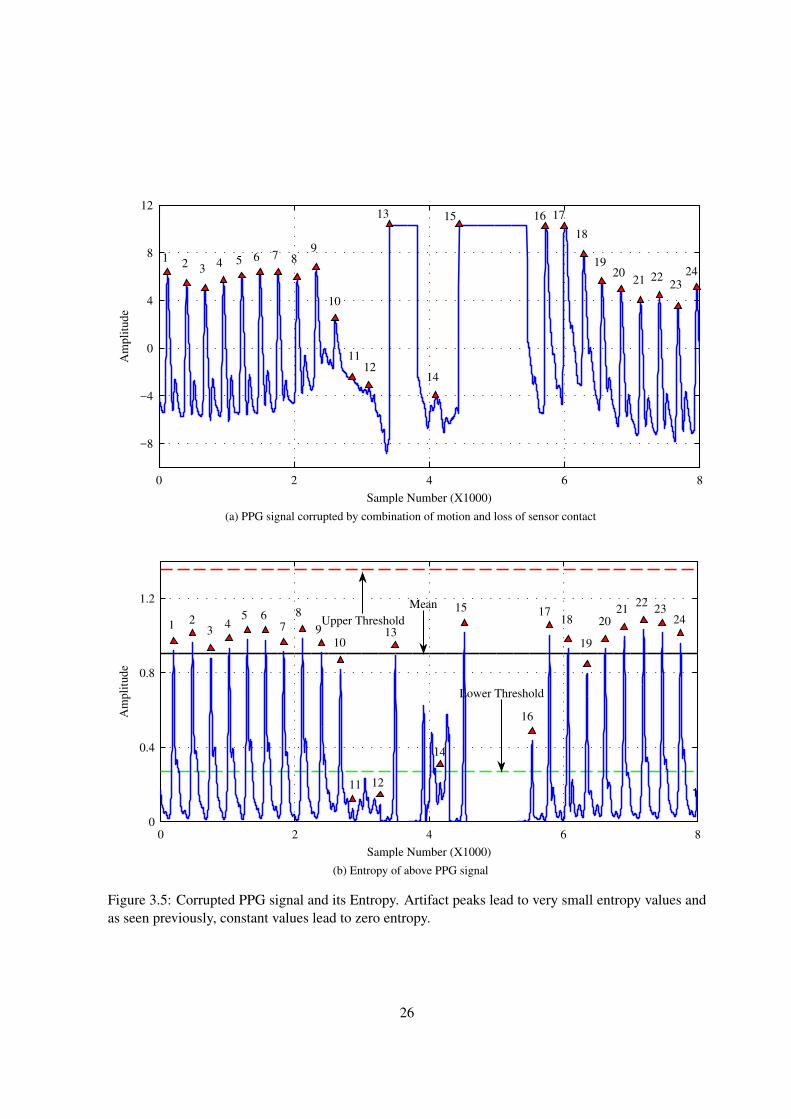
PPG data void of any artifacts. The performance of the algorithm on Capnobase and CSL datasetsare compared with few previous works in Tables 3.2 and Table 3.3 respectively. For Capnobase data,our technique performed better than the signal quality based technique used in [73]. For CSL data,the fuzzy entropy based method performed better than the technique in [67]. However the algorithmpresented in [66] performed better than fuzzy entropy technique. PPG signal corrupted by artifact andthe corresponding entropy values for the same signal as shown in Figure 3.2 and Figure 3.3 respectively.Additional examples of PPG signal corrupted form motion as well as sensor movement are shown inFigure 3.4 and 3.5. Zero entropy values are produced as a result of constant PPG signal values. In Figure3.4 although pulse peak number 12 will be classified as a valid peak, additional logic can be added toremove peaks adjacent to zero entropy values. Similarly we can remove peaks 13 and 14 from Figure3.5 while peaks 11,12 and 14 are removed by the algorithm based on their entropy values.
3.5 Arrhythmia Detection
At this point we have identified motion artifact from the given PPG signal and have made a goodestimate of heart beats. Our focus now is on detecting underlying heart conditions which result fromirregular heart beats. We have discussed physiology of arrhythmia in chapter 1. Arrhythmia is broadclass of diseases such as asystole, bradycardia, tachycardia, ventricular tachycardia, and ventricularflutter/fibrillation etc. They can be diagnosed and monitored using long term heart beat recording in theform of ECG or PPG. An ECG bsed approach is discussed in [74] while a PPG based approach waspresented in [75]. In this work, we use PPG as a mode of heart beat recording. This analysis is carriedout to detect tachycardia, bradycardia and asystole.
Following definitions are used for detecting arrhythmias.
• Asystole: No heart beat for 2 seconds or heart rate less than 30 beats per minute.
• Tachycardia: 5 or more beats with heart rate greater than 100 beats per minute.
• Bradycardia: 5 or more beats with heart rate less than 60 beats per minute.
24

0 1 2 3 4 5
−8
−4
0
4
8
1 2 3 4 5 6
78 9
10
11 12
13 14 15 16 17
Sample Number (X1000)
Am
pli
tud
e
(a) PPG signal corrupted by loss of sensor contact
0 1 2 3 4 50
0.5
1
1.5
2
2.5
3
1 2 3 4 5 67
89
10
11
12
13 14 15 16 17
Sample Number (X1000)
Am
pli
tude
Upper Threshold Lower Threshold
Mean
(b) Entropy of above signal
Figure 3.4: Corrupted PPG signal and its Entropy. Constant values of input signal lead to zero entropyvalues.
25
0 2 4 6 8
−8
−4
0
4
8
12
Sample Number (X1000)
Am
pli
tud
e
12 3
4 5 6 7 89
10
1112
13
14
15 16 17
18
1920
21 2223
24
(a) PPG signal corrupted by combination of motion and loss of sensor contact
0 2 4 6 80
0.4
0.8
1.2
1 23
45 6
7
8
910
11 12
13
14
15
16
1718
19
2021
2223
24
1
Sample Number (X1000)
Am
pli
tude
Upper Threshold
Lower Threshold
Mean
(b) Entropy of above PPG signal
Figure 3.5: Corrupted PPG signal and its Entropy. Artifact peaks lead to very small entropy values andas seen previously, constant values lead to zero entropy.
26
36 42 48
0
3
6
Time (seconds)
Am
pli
tude
(a) Input PPG signal containing Asystole event
36 42 4820
30
40
50
60
70
Time (seconds)
Beats
Per
Min
ute
(b) Estimated pulse rate
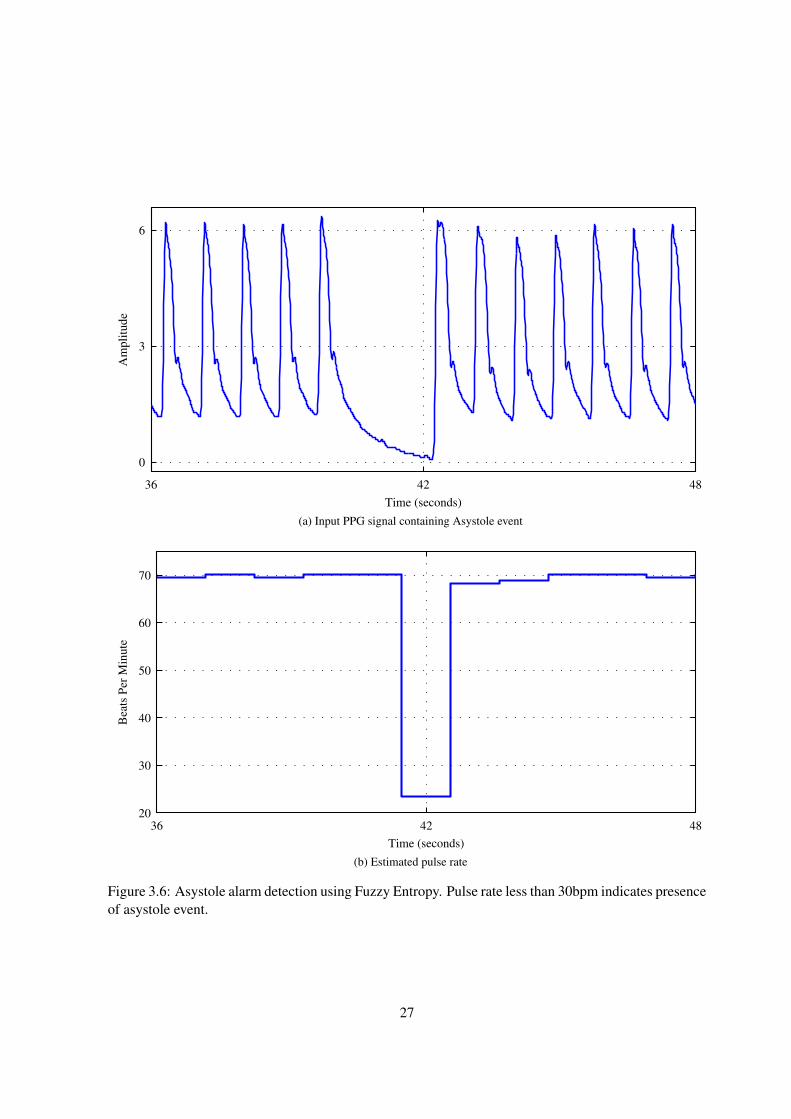
Figure 3.6: Asystole alarm detection using Fuzzy Entropy. Pulse rate less than 30bpm indicates presenceof asystole event.
27

15 20 25
0
6
12
Time (seconds)
Am
pli
tude
(a) Input PPG signal with tachycardia
15 20 25
138
139
140
141
142
143
144
145
Time (seconds)
Beats
Per
Min
ute
(b) Estimated pulse rate
Figure 3.7: Tachycardia alarm detection using Fuzzy Entropy. Pulse rate more than 100bpm indicatespresence of tachycardia.
28

15 20 25
10
80
Time (seconds)
Am
pli
tude
(a) Input PPG signal with bradycardia
15 20 2553
54
55
56
Time (seconds)
Beats
Per
Min
ute
(b) Estimated pulse rate
Figure 3.8: Bradycardia alarm detection using Fuzzy Entropy. Pulse rate less than 0bpm indicatespresence of bradycardia.
29

3.5.1 Dataset
We use the dataset from 2015 Physionet challenge. This challenge was aimed at development ofalgorithms to reduce the incidence of false alarms in the Intensive Care Unit (ICU). The challenge wasfocused only on life threatening arrhythmias. The data was recorded from three of the largest intensivecare monitor manufacturers’ bedside units recorded in four hospitals in the USA and Europe. The alarmsare generated by a bedside recording device which uses ECG signals for processing. Each record in thedataset contains 2 channels of ECG along with one or more pulsatile waveforms like PPG and/or ABP.We use the PPG signal alone to detect possible arrhythmia.
We focus on 3 alarms from the dataset namely, tachycardia, bradycadia and asystole. We select 57recordings in all, bradycardia having 10 true alarms and 10 false alarms. Asystole event has 8 truealarms, 10 false alarms and tachycardia has 10 true alarms 9 false alarms. The recordings are chosen atrandom and only criteria being the PPG signal is continuous and not overly contaminated by artifacts.The signals are digitised at 250 Hz. For our analysis, we down-sample the PPG signal by 2.
3.5.2 Arrhythmia Detection Using Pulse Rate (bpm)
Pulse rate estimate in beats per minute is calculated using non-artifact beats. Then using the abovedefinitions, we analyse possibility of arrhythmia from the PPG signal. For detecting tachycardia, wesimply calculate instantaneous pulse rate and check for beats per minute higher than 100. Similarlyfor bradycardia, pulse rate less than 60 is examined. For asystole events, pulse rate less than 30 ischecked as shown in Figure 3.6. A PPG recording from one of the subjects having tachycardia and itscorresponding pulse rate are shown in Figure 3.7. Similarly Figure 3.8 shows a case of bradycardia.The thresholds for removing artifact are obtained from the Capnobase dataset. Those are then used inthe analysis of Physionet challenge dataset.
3.5.3 Discussion
We compare our results with few of the best papers accepted as contributions in this challenge. Theseworks analyse ECG as well as PPG and/or ABP waveforms in order to determine whether the alarm istrue or false. We only focus on the PPG waveform to estimate the pulse rate and then classify the alarmas true or false. Highest score was achieved in the challenge by the authors of [76]. Their work estimatespresence of QRS complex from all 3 types of waveforms independently and then uses the most reliablewaveform to examine arrhythmia. Another highly successful method is presented in [77]. This workuses a signal quality index for the PPG and ABP signals and only those waveforms who have highquality are used for further processing. Machine learning based approaches are discussed in [78–80].Techniques in [78,80] use support vector machine based classifier while random forest classifier is usedin [79]. The organizers of the challenge had defined a score to compare various algorithms. This scorewas defined in equation 3.15. The score is designed in such a way as to inflict a heavy penalty for every
30

ReferenceType of arrhythmia
Asystole Tachycardia BradycardiaTPR TNR Score TPR TNR Score TPR TNR Score
[76] 100 97 97.42 97 100 87.80 100 72 83.51[77] 92 78 76.42 96 60 80.00 96 66 73.53[78] 56 94 74.33 100 100 100.00 100 57 74.23[79] 85 88 79.60 99 89 96.38 96 79 83.05[80] 100 86 NA 100 89 NA 100 93 NA
Fuzzy Entropy 87.5 80 68 90 77.7 69.5 80 90 70.8
Table 3.4: Results for Physionet Challenge dataset
false negative. This way one can ensure that the false positives are not reduced at a cost of increasingfalse negatives. The comparison results are shown in Table 3.4.
Score =tp+ tn
tp+ tn+ fp+ 5 ∗ fn(3.15)
The entropy based pulse segmentation technique was fairly successful in identifying the arrhythmiccases and also reduce the false alarm rate to an extent. All the other algorithms in the comparison utiliseECG, PPG and if available, the ABP waveforms to determine the possibility of arrhythmia. Manywaveforms contained high degree of artifacts and signal quality was often not very good. These resultsshow that PPG waveform can be used to improve the accuracy of arrhythmia detection.
3.6 Summary
In this chapter, we established a time domain, entropy based technique to detect motion artifact,estimate pulse rate and subsequently detect suspected tachycardia, bradycardia or an asystole eventof the subject. We used the labelled Capnobase dataset to determine the higher and lower thresholdsfor artifact removal. We test the efficacy of the algorithm towards pulse segmentation on the samedataset. The thresholds used in this analysis are then used in detecting cardiac arrhythmia. Physionetchallenge 2015 dataset is used for this evaluation. The entropy measure for the input data samples isa good classification feature for discriminating true pulses from artifact. This approach does not useany morphological features of the PPG waveform such as pulse width, location of systolic and diastolicpeaks etc. Instead, the fuzzy entropy provides a degree of similarity between membership function andcurrent pulse which is being analysed. This approach has been developed specifically towards providingaccurate pulse rate estimate which is then used for detecting life threatening arrhythmia. We have shownthat the approach is effective in such a detection.
However, there are a few shortcomings of the technique. The accuracy of the whole proceduredepends on the choice of membership function and selection of correct membership function is essentialfor a good performance of the algorithm and further improving this selection criteria would enhance the
31

performance. As consequence, this technique requires user input as information about the membershipfunction has to be provided by the user. The calculation of fuzzy entropy is computationally expensive.These limitations restricts its use for analysing large datasets. As we mentioned the fact that we donot use any morphological information here, a different approach is necessary to diagnose other cardiacdiseases such as CAD.
32

Chapter 4
Pulse Quality Estimation Using PPG Morphology and Its Applications
We have already discussed the importance of obtaining a clean PPG signal for its various applica-tions. So far we have presented a fuzzy entropy based approach to identify the corrupt part of the signal,obtain pulse rate and its application towards arrhythmia detection. Although the approach was suitablefor the application to an extent, its high computation time and necessity of user input for every signallimit its usefulness in real life scenarios. We also mentioned that fuzzy entropy does not directly use anymorphological features. This morphological information is crucial in obtaining an artifact free signalas well as detecting cardiac diseases like CAD, which limits the use of fuzzy entropy. CAD or othersuch cardiac disease detection requires beat-by-beat analysis of pulse morphology of PPG signal. Inthis Chapter, we introduce a technique to estimate the quality of PPG signal using pulse morphologyand its applications for artifact removal and arrhythmia detection. Primary focus is on reducing thecomputation time and removing the necessity of user input. We create a multi-parameter feature vectorfor each pulse and assign a quality index to it.
4.1 Related Work
Many approaches have been proposed in literature to reduce or remove the effects of artifacts. A PPGsignal quality estimation approach is presented in [73] which proposes a quality index to every pulse ofthe PPG signal. Similar work is carried out in [81] which involves training a neural network for qualityestimation. Time and frequency domain characteristics of the PPG have been studied in [82]. Pulsemorphology analysis is carried out in [83]. Independent Component Analysis (ICA) based approach ispresented in [84] which differentiated the clean PPG signals form the artifact induced signal using twosignals obtained from the oximeter. This chapter presents an approach for artifact segmentation usingmorphological features of PPG signal.
33

4.2 Proposed Method
Pulse Quality Estimation is done in five steps; (a) identify all the possible peaks in the signal (b)calculate the spectral residual for the entire data (c) perform Gaussian fit for every pulse (d) construct afeature vector for every pulse using the parameters obtained in (b) and (c) and (e) assign pulse qualityindex for each pulse.
4.2.1 Peak Identification
First all the systolic peaks present in the input PPG signal are identified and the signal is dividedinto individual pulses. An appropriate window size is used to estimate the systolic peaks and the corre-sponding troughs are used to mark the beginning and end of a complete pulse. For a given PPG signalconsisting of N heart beats, the segmented pulses are labelled as pi(n), i ∈ 1, 2, · · ·N .
The amplitude of a pulse, yi is defined as the difference between the value at systolic peak and thevalue at the pulse base.
4.2.2 Spectral Residual Representation
The concept of spectral residual of a signal is introduced in [85] and is primarily used for creating asaliency map of an image which is essentially a two-dimensional signal [86]. The technique is slightlymodified for application in case of a one-dimensional signal such as a PPG data. The hypothesis behindthe concept of spectral residual is that an image can be treated as a signal rich in low frequency variationsmixed with objects which are region of high frequency change and be imagined as the informationcontent of the image. We extend the analogy to an artifact corrupted data which can be considered asa regular and consistent PPG pulses or low frequency content mixed with artifact or high frequency orhigh information content. As the residual highlights the high information content regions of an image,in case of an artifact corrupted data, the spectral residual shall highlight the areas of high signal variationwhich are essentially artifacts.
Let us consider a given PPG data, x(n). The calculation of spectral residual for x(n) involves aseries of steps. First we convert the given signal in frequency domain using Fourier Transform.
A(f) = R[F{x(n)}] (4.1)
P (f) = I[F{x(n)}] (4.2)
where F is the Fourier Transform. R and I denote the real and imaginary components of the FourierTransform. P (f) hence is the phase spectrum of the given signal and is unaltered. The magnitude,A(f)
is converted into logarithmic scale.
L(f) = log{A(f)} (4.3)
34

The log spectrum is averaged using a moving average filter, Hn(f) with window size m. A modifi-cation is made in the estimating the residual here. Instead of removing this averaged component of thelog spectrum from the original log spectrum, the residual is estimated directly from the averaged logspectrum.
Res(f) = Hm(f) · L(f) (4.4)
Res(f) denotes the spectral residual. This modification is necessary as the variation in PPG signalcharacteristics caused by artifacts is not as significant as the variation in pixel intensities caused byobjects. Once the residual is obtained, it is converted back in time domain by Inverse Fourier Transform.
res(n) = F−1[exp{Res(f) + P (f)}]2 (4.5)
Algorithm 4.1 Spectral Residual Calculation1: m := 1012: PPGnew(n) = hm(n)⊗ PPG(n)3: A(f) = R[F {PPGnew(n)}]4: P (f) = I[F {PPGnew(n)}]5: L(f) = log[A(f)]6: Res(f) = Hm(f) · L(f)7: res(n) = F−1[exp {Res(f) + P (f)}]28: loop9: resi = max(r(pulse base(i) : pulse end(i)))
10: i+ +11: end loop
F−1denotes Inverse Fourier Transform. The time domain residual is a discrete signal correspondingto every point of the input PPG data. Feature selection and classification requires a single value fora PPG pulse. Thus the maximum value of residual over the length of a PPG pulse is assigned to theresidual feature resi for that particular pulse. The spectral residual obtained for a PPG signal is shownin Figure 4.2.
4.2.3 Gaussian Fit
PPG waveform forms a smooth curve which can thus be represented using gaussian curves. Moreinformation about PPG physiology is needed to decide how many gaussian curves to be used.
4.2.3.1 Physiology of PPG signal
The complete PPG cycle is composed of two significant phases, the anacrotic phase and the catacroticphase [33]. The anacrotic phase is the rising edge of the PPG whereas the catacrotic phase is the
35
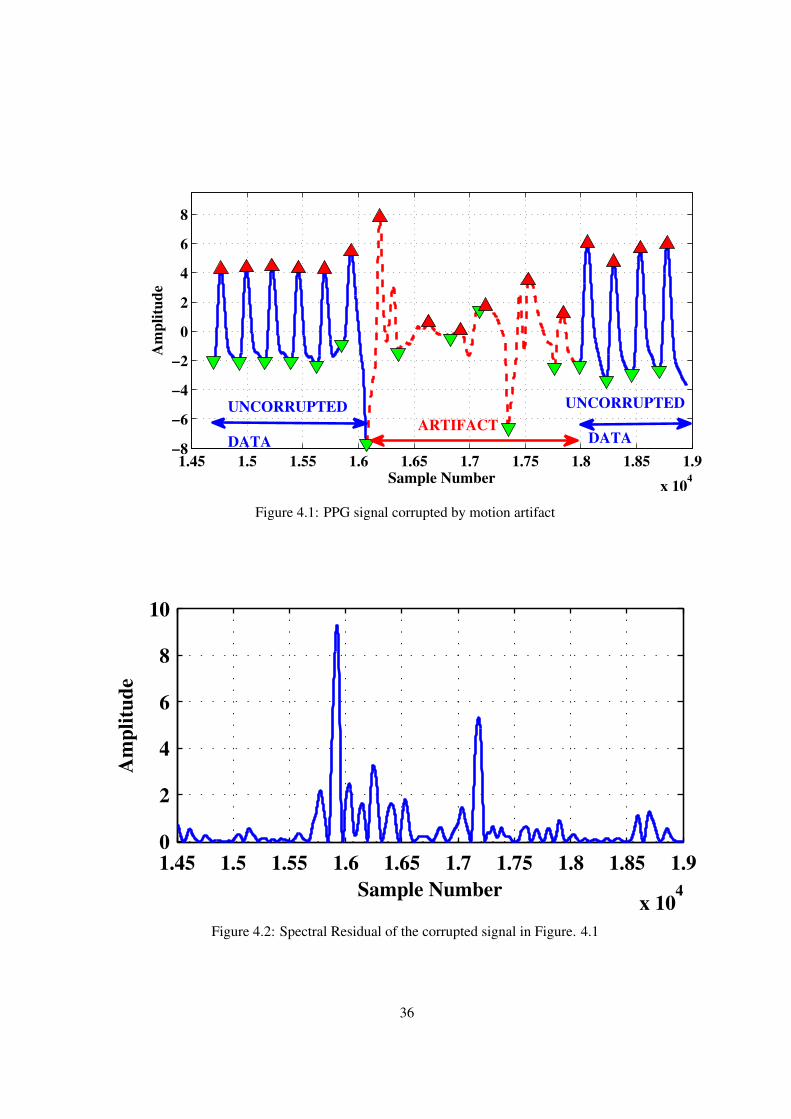
1.45 1.5 1.55 1.6 1.65 1.7 1.75 1.8 1.85 1.9
x 104
−8
−6
−4
−2
0
2
4
6
8
Sample Number
Am
pli
tud
e
ARTIFACT
UNCORRUPTED
DATA
UNCORRUPTED
DATA
Figure 4.1: PPG signal corrupted by motion artifact
1.45 1.5 1.55 1.6 1.65 1.7 1.75 1.8 1.85 1.9
x 104
0
2
4
6
8
10
Sample Number
Am
pli
tud
e
Figure 4.2: Spectral Residual of the corrupted signal in Figure. 4.1
36

1050 1100 1150 1200 1250 1300 1350 1400
0
2
4
6
8
10
12
Sample Number
Am
pli
tud
e
PPG Data
Gaussian Fit
Systolic Phase Gaussian
Diastolic Phase Gaussian
Figure 4.3: Gaussian Fitting for PPG signal
falling edge. The anacrotic phase primarily corresponds to the systolic portion of the cardiac cycle andcatacrotic phase corresponds to the diastolic portion.
The systolic phase corresponds to the forward pressure wave from the heart to the periphery whereasthe diastolic phase corresponds to the reflected pressure wave from the periphery. The systolic phasemarks the central and primary peak of the PPG pulse which is followed by a secondary diastolic peak.The two phases are separated by the dicrotic notch. Using the knowledge of physiology of the PPGcycle, we express the PPG cycle as a combination of two Gaussian functions representing the twophases. Each PPG pulse in a given data is expressed as a sum of the Gaussian functions.
4.2.3.2 PPG As Sum of Gaussian Functions
The PPG pulse can be imagined as a combination of the two phases and can be expressed as anaddition of two functions representing the two phases. A Gaussian function is characterized by itsmean, standard deviation and amplitude. The mean of the systolic phase component is placed aroundthe systolic peak and that of the diastolic phase component is placed around the diastolic peak. Theparameters of these Gaussian functions are optimized to minimize the error of approximation.
Each pulse pi(n) is expressed as
pi(n) = pi(n) + ei(n) (4.6)
where pi(n) is the approximated Gaussian fit for the original pulse, pi(n) and ei(n) is the remainingerror. The error function ei(n) is observed to be insignificant and is neglected.
pi(n) = Si(n) +Di(n) (4.7)
where Si(n) and Di(n) represent the Gaussian functions for systolic and diastolic phases respec-tively. Expanding the Gaussian functions, we have
37
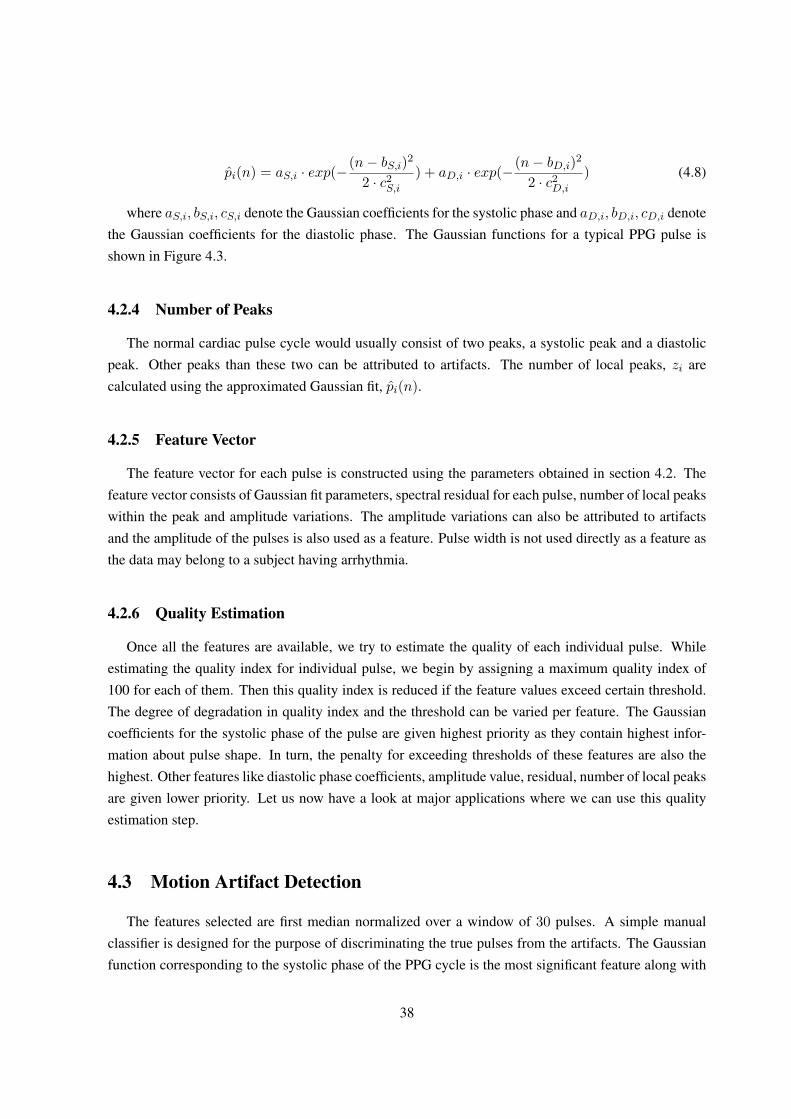
pi(n) = aS,i · exp(−(n− bS,i)2
2 · c2S,i) + aD,i · exp(−
(n− bD,i)2
2 · c2D,i) (4.8)
where aS,i, bS,i, cS,i denote the Gaussian coefficients for the systolic phase and aD,i, bD,i, cD,i denotethe Gaussian coefficients for the diastolic phase. The Gaussian functions for a typical PPG pulse isshown in Figure 4.3.
4.2.4 Number of Peaks
The normal cardiac pulse cycle would usually consist of two peaks, a systolic peak and a diastolicpeak. Other peaks than these two can be attributed to artifacts. The number of local peaks, zi arecalculated using the approximated Gaussian fit, pi(n).
4.2.5 Feature Vector
The feature vector for each pulse is constructed using the parameters obtained in section 4.2. Thefeature vector consists of Gaussian fit parameters, spectral residual for each pulse, number of local peakswithin the peak and amplitude variations. The amplitude variations can also be attributed to artifactsand the amplitude of the pulses is also used as a feature. Pulse width is not used directly as a feature asthe data may belong to a subject having arrhythmia.
4.2.6 Quality Estimation
Once all the features are available, we try to estimate the quality of each individual pulse. Whileestimating the quality index for individual pulse, we begin by assigning a maximum quality index of100 for each of them. Then this quality index is reduced if the feature values exceed certain threshold.The degree of degradation in quality index and the threshold can be varied per feature. The Gaussiancoefficients for the systolic phase of the pulse are given highest priority as they contain highest infor-mation about pulse shape. In turn, the penalty for exceeding thresholds of these features are also thehighest. Other features like diastolic phase coefficients, amplitude value, residual, number of local peaksare given lower priority. Let us now have a look at major applications where we can use this qualityestimation step.
4.3 Motion Artifact Detection
The features selected are first median normalized over a window of 30 pulses. A simple manualclassifier is designed for the purpose of discriminating the true pulses from the artifacts. The Gaussianfunction corresponding to the systolic phase of the PPG cycle is the most significant feature along with
38

1.45 1.5 1.55 1.6 1.65 1.7 1.75 1.8 1.85 1.9
x 104
−8
−6
−4
−2
0
2
4
6
8
10
100 100 100 100 80
0
0
00
0
0
0
100
100100 100
Sample Number
Am
pli
tud
e
TRUE
POSITIVE
FALSE
NEGATIVE
TRUE
NEGATIVE
TRUE
POSITIVE
Figure 4.4: Final classification of signal in Figure 4.1
the amplitude variations. Each pulse is assigned the quality index according to the value of the featuresand the final decision is made.
4.3.1 Dataset
The algorithm performance is tested using the same Capnobase [87] and the CSL [88] datasets usedin previous chapter. Capnobase consists of 42 recordings which include 23 artifact free recordings andremaining 19 contain artifacts. CSL dataset consists of 2 recording and both contain artifacts.
4.3.2 Discussion
The first step used to identify all potential systolic peaks and possible motion artifact induced peaksperformed highly accurately. The number of peaks missed by the algorithm is very small althoughimprovements can be made to make it more robust in order to identify all possible peaks. The techniqueuses shape based features of the input pulses. Features such as pulse width are not used directly, insteadmore importance is given to the shape of the pulse. As the PPG data contains a significant baselinecorrections occurring primarily due to breathing, pulse offset also is not considered suitable as a feature.The final feature vector for each pulse is constructed as
feature(i) = [aS,i, bS,i, cS,i, aD,i, bD,i, cD,i, ri, zi, yi] (4.9)
where i is the pulse number.
39

Feature Threshold Range PQI Degradation
aS,i, bS,i > 1.5x or < 0.5x 30%
yi > 3x or < 0.3x 30%
cS,i > 3x or < 0.3x 30%
ri > 10x 30%
aD,i, bD,i, cD,i > 3x or < 0.3x 20%
zi > 3 10%
Table 4.1: Feature wise degradation in Pulse Quality Index
DatasetAnnotedpulses
Correctpulses
Incorrectpulses
Undetectedpulses
Se (%) PPV (%)
Capnobase 27770 27458 79 323 98.84 99.71
CSL 15867 14262 5 1393 91.1 99.96
Table 4.2: Algorithm Performance based on Capnobase and CSL Benchmark database
Each pulse is assigned the quality index depending on the value of the features. Appropriate thresh-olds are set for each feature to distinguish between normal and abnormal features. Any feature valuesclose to 100% is ideal. Feature wise scoring pattern is discussed in Table 4.1. This type of scoringensures easier separation of true pulses from artifacts. Pulses having PQI less than 60% are consideredas artifacts. The thresholds are set to for a conservative algorithm and can be suitably changed as perthe application.
The performance metrics used for evaluation are positive predictive value (PPV) and sensitivity (Se)which are defined as follows:
Sensitivity =tp
tp+ fn, PPV =
tp
tp+ fp(4.10)
The calculated PPV and Se figures for the algorithm are for Capnobase and CSL database are asdiscussed in Table 4.2. A typical artifact corrupted PPG signal is shown in Figure 4.1. The spectralresidual for the same portion of the signal is shown in Figure 4.2 and Figure 4.4 displays the finalclassification. The numbers on top of the pulses in Figure 4.4 correspond to the PQI assigned to those
Reference Se (%) PPV (%)[73] 96.44 99.80
Fuzzy Entropy 99.32 99.84PQI 98.84 99.71
Table 4.3: Algorithm performance comparison on Capnobase Dataset
40

Reference Se (%) PPV (%)[66] 99.27 99.35[67] 99.83 96.68[73] 96.21 99.22
Fuzzy Entropy 98.84 98.83PQI 91.10 99.96
Table 4.4: Algorithm performance comparison on CSL Dataset
pulses. Pulses with PQI 100% are most ideal pulses. It can be added that the quality of the signaldecreases as PQI decreases. The performance metrics of the proposed work are compared with othercontributions mentioned in previous chapter along with fuzzy entropy based technique in Table 4.3 andTable 4.4. We conclude that fuzzy entropy based technique performs best on Capnobase data eventhough PQI based technique also performs fairly well. The threshold can be changed from 50% to asuitable value as per application. This technique also provides higher computational efficiency overfuzzy entropy based method in previous chapter which is highly desired to process large data.
4.4 Arrhythmia Detection
We have already discussed this section in previous chapter where we calculate the fuzzy entropyof the PPG waveform to estimate the pulse rate and possible arrhythmia. Here, once we discard theartifacts, the remaining waveform is used for pulse rate estimation.
4.4.1 Dataset
We use the same Physionet challenge dataset as previous chapter. Entire dataset is used for eval-uation as the simulation time for this technique is significantly shorter. In all, the data contains 628PPG recordings which are used in this work. Definitions for tachycardia, bradycardia and asystole arealready defined in previous chapter. Same definitions are used here as well. Data belonging to two moretypes of arrhythmia is used for this work, namely Ventricular Tachycardia and Ventricular Fibrillation.Definitions used for all these types are as follows:
1. Tachycardia (TA): Heart rate of more than 100 for 5 consecutive pulses.
2. Bradycardia (BA): Heart rate of less than 60 for 5 consecutive pulses.
3. Asystole (AS): No heartbeat for 2 seconds or heart rate less than 30.
4. Ventricular Tachycardia (VTA): Mean heart rate of more than 100 for 5 consecutive pulses.
5. Ventricular Fibrillation (VFB): Heart rate of more than 200.
41
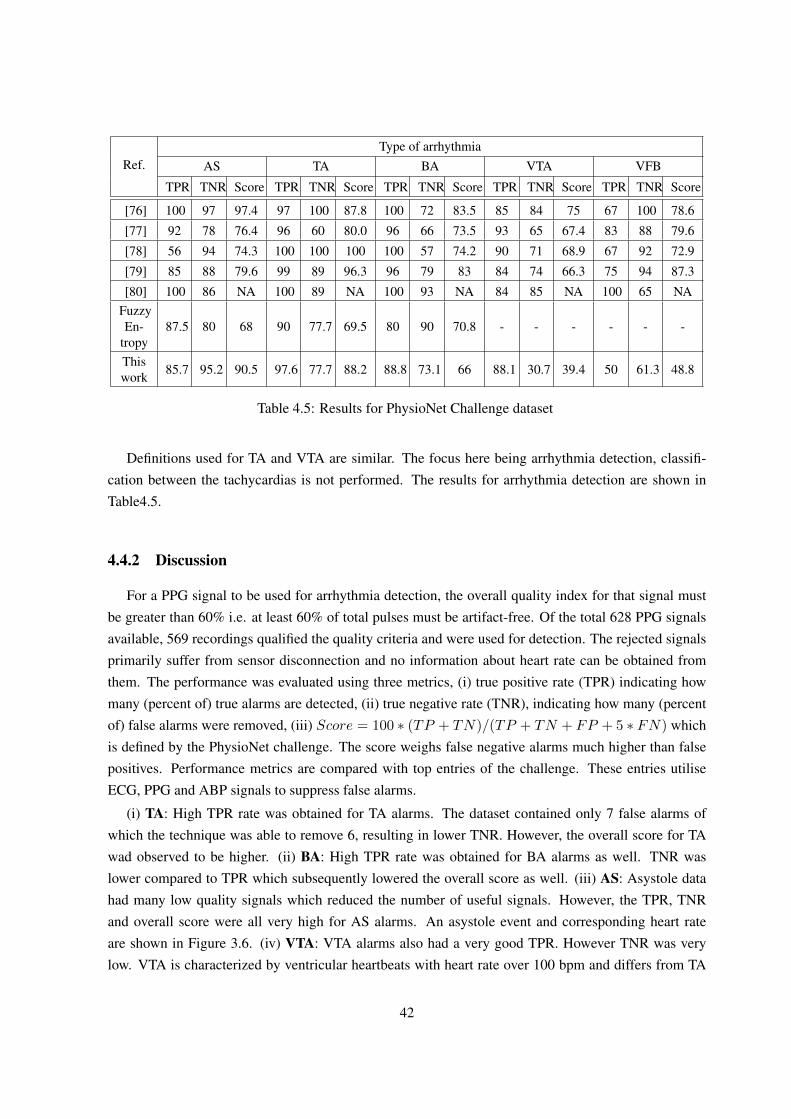
Ref.Type of arrhythmia
AS TA BA VTA VFB
TPR TNR Score TPR TNR Score TPR TNR Score TPR TNR Score TPR TNR Score
[76] 100 97 97.4 97 100 87.8 100 72 83.5 85 84 75 67 100 78.6
[77] 92 78 76.4 96 60 80.0 96 66 73.5 93 65 67.4 83 88 79.6
[78] 56 94 74.3 100 100 100 100 57 74.2 90 71 68.9 67 92 72.9
[79] 85 88 79.6 99 89 96.3 96 79 83 84 74 66.3 75 94 87.3
[80] 100 86 NA 100 89 NA 100 93 NA 84 85 NA 100 65 NAFuzzyEn-
tropy87.5 80 68 90 77.7 69.5 80 90 70.8 - - - - - -
Thiswork 85.7 95.2 90.5 97.6 77.7 88.2 88.8 73.1 66 88.1 30.7 39.4 50 61.3 48.8
Table 4.5: Results for PhysioNet Challenge dataset
Definitions used for TA and VTA are similar. The focus here being arrhythmia detection, classifi-cation between the tachycardias is not performed. The results for arrhythmia detection are shown inTable4.5.
4.4.2 Discussion
For a PPG signal to be used for arrhythmia detection, the overall quality index for that signal mustbe greater than 60% i.e. at least 60% of total pulses must be artifact-free. Of the total 628 PPG signalsavailable, 569 recordings qualified the quality criteria and were used for detection. The rejected signalsprimarily suffer from sensor disconnection and no information about heart rate can be obtained fromthem. The performance was evaluated using three metrics, (i) true positive rate (TPR) indicating howmany (percent of) true alarms are detected, (ii) true negative rate (TNR), indicating how many (percentof) false alarms were removed, (iii) Score = 100 ∗ (TP + TN)/(TP + TN + FP + 5 ∗ FN) whichis defined by the PhysioNet challenge. The score weighs false negative alarms much higher than falsepositives. Performance metrics are compared with top entries of the challenge. These entries utiliseECG, PPG and ABP signals to suppress false alarms.
(i) TA: High TPR rate was obtained for TA alarms. The dataset contained only 7 false alarms ofwhich the technique was able to remove 6, resulting in lower TNR. However, the overall score for TAwad observed to be higher. (ii) BA: High TPR rate was obtained for BA alarms as well. TNR waslower compared to TPR which subsequently lowered the overall score as well. (iii) AS: Asystole datahad many low quality signals which reduced the number of useful signals. However, the TPR, TNRand overall score were all very high for AS alarms. An asystole event and corresponding heart rateare shown in Figure 3.6. (iv) VTA: VTA alarms also had a very good TPR. However TNR was verylow. VTA is characterized by ventricular heartbeats with heart rate over 100 bpm and differs from TA
42

Reference TP alarms FP alarms PPVECG benchmark 292 458 39
PQI 185 (out of 199) 171 (out of 370) 52
Table 4.6: Improved PPV
Reference Overall TPR Overall TNR[76] 93 88[77] 94 71[78] 93 77[79] 93 80[80] 95 84PQI 93 54
Table 4.7: Comparison of overall TPR and TNR
alarms. These ventricular heartbeats can be identified effectively through ECG and not PPG. As a result,the method could identify the true alarms effectively however it incorrectly classified many signals withhigh pulse rate as VTA alarm. (v) VFB: The data contained only 6 true VFB alarms of which only 4were useful. The technique could identify 2 of the 4 correctly. TNR was little better, however like VTAalarms, VFB alarms also better processed through ECG.
In comparison with fuzzy entropy based technique The overall score for asystole and tachycardia isclearly better. Even though the score has reduced little bit for bradycardia, the true positive rate is stillhigher. This indicates a better overall performance. Also, the performance is based on a much largerdataset than fuzzy entropy.
To summarise, TPR of above 85% was achieved for 4 types of arrhythmias and TNR above 70%was achieved for 3 types. Out of total 199 true alarms, 185 were detected achieving TPR of 93% andout of 370 false alarms, 199 were rejected with overall TNR of 53.78%. The PPV figure for the givendataset has been improved compared to the original ECG benchmark without compromising on overallsensitivity as shown in Tables 4.6 and 4.7 respectively. VTA alarms contribute most in lowering theoverall TNR as TNR of 82.42% is achieved for remaining 4 arrhythmias. The performance of thistechnique was comparable with other top entries submitted to the challenge except in cases of VTA andVFB where ECG processing has clear advantage. Overall, the technique has been able to address theissue of very high false alarm rate usually produced by bedside monitoring units in hospitals.
4.5 Summary
We introduced a technique to obtain beat-by-beat quality estimation of PPG pulse. This is a first stepof morphological analysis of PPG which we will continue in next chapter as well. The technique worksin three steps, starting with pulse segmentation, followed by feature extraction for every beat. The last
43

step is actual quality estimation where we assign a PQI to every segmented beat. Higher the PQI, higherthe pulse quality. The user has an option to set a threshold to filter out corrupt portion of the signaldepending upon the application.
We use the knowledge of PPG physiology to express a pulse as a combination of systolic and diastolicphases. Each phase is then expressed as a Gaussian curve and the linear combination of them providesus a close estimate of the original pulse. We also introduced a new feature, spectral residual of a signal,typically used in image processing to segment sudden changes in PPG signal which can be attributed toan artifact. We use more shape-based features such as the Gaussian fit coefficients, systolic peak height,number of peaks per interval along with residual of the pulse to create the feature vector.
This approach has significant advantages over fuzzy entropy specifically towards analysing multiplefeatures of every heart beat which makes it suitable cardiac disease detection. User defined thresholdhere provides higher flexibility than that in case of fuzzy entropy and it provides better artifact seg-mentation. As the features, except for the residual, are calculated for every heart beat individually, theinfluence of artifact over its neighbouring beats is minimal compared to fuzzy entropy. Additionally,unlike fuzzy entropy which requires a user input for each signal, this one does not require any userinputs other than sampling rate of the input signal. This is a major advantage as it enables analysis oflarge datasets such as the PhysioNet Challenge. This approach also performed better than fuzzy entropybased approach in cardiac arrhythmia detection both in terms of computational cost and accuracy. Asa concluding remark, this work presents a proof that PPG offers a competent alternative to the conven-tional ECG based cardiac arrhythmia detection. However, more analysis is necessary to classify thedetected arrhythmias which ECG continues to be the gold standard.
44

Chapter 5
Detection of Coronary Artery Disease Using Signal Morphology
Having established a technique to obtain clean PPG signal, we now focus on using PPG morphologyto detect CAD. We present an approach of non-invasively detecting coronary artery disease using PPGand acceleration PPG (APG) waveform analysis. To compare non invasive technique with an invasivesignal, Arterial blood pressure (ABP) data has been used. The technique involves time domain analysisof PPG waveforms and its second derivative (APG) followed by feature extraction and classification.Invasive and non-invasive data has been used for classification separately and the performance for bothhas been compared. Supervised classification using support vector machine has been used to classifyCAD patients. Patient and healthy subject data recorded form ICU is obtained from MIMIC-II dataset.The performance of the proposed non-invasive approach was compared to and found to be superior thanthe invasive approach. Let us discuss the technique in greater detail.
5.1 Arterial Blood Pressure (ABP)
First part of the analysis is to introduce ourselves to arterial blood pressure (ABP). Non Invasive ABPcan be recorded using sphygmomanometer. It is a highly direct method to measure systolic and diastolicblood pressure and considered a gold standard. Invasive ABP is commonly measured at the radial arteryusing a catheter. The mean arterial pressure measured from the radial artery can be approximated tomean aortic pressure and hence the mean arterial pressure is used for clinical purposes [89]. ABPwaveform is also used to obtain the radial augmentation index which is strongly correlated to carotidaugmentation index which in turn is a measure of cardiovascular disease risk [90, 91]. Arterial stiffnessindex, reflection index obtained using invasive ABP are also a measure of cardiovascular health risks[45].
The morphology of pressure waveform measured at different sites of the arterial network exhibits sig-nificant differences depending upon properties of vascular bed. The radial ABP waveform has a higherand steeper systolic peak than the aortic waveform. It also differs from the aortic waveform in termsof prominent dicrotic wave and dicrotic notch appearing later [89]. The effect of peripheral reflectionon the pressure waveform is an indicator of the arterial health of an individual. In healthy individuals
45

0 20 40 60 80 100
−20
−15
−10
Sample Number
Am
pli
tude
(×10
3)
Figure 5.1: Typical ABP waveform
with compliant arteries, the peripherally reflected wave arrives during the diastolic phase and causes arise in diastolic pressure giving rise to the dicrotic peak. However, as in the case of individuals withless compliant arteries, the reflected wave arrives during systolic phase itself augmenting late systolicpressure. This early reflection produces a secondary systolic peak or the tidal wave which is at timeshigher in amplitude than the primary percussion wave [92]. A typical ABP waveform is shown in Figure5.1.
5.2 Arterial Ageing
Endothelial dysfunction is now recognized as an established cause of cardiovascular disease. Theinitial manifestation of endothelial dysfunction is an increase in arterial stiffness, which is due to an im-balance in the vasodilator-vasoconstrictor substances released from the endothelium. Increased arterialstiffness results in atherosclerosis and hypertension [93]. As arterial stiffness increases, transmission ve-locity of both forward and reflected waves increases and the reflected wave arrives earlier in the centralaorta and augments pressure in late systole. Therefore, augmentation of the central aortic pressure waveis a manifestation of early wave reflection and is the boost up of pressure from the first systolic shoul-der to the systolic pressure peak. Increased arterial stiffness, determined invasively, has been shownto predict a higher risk of coronary atherosclerosis [94]. But these non-invasive methods are not yetstandardized [95]. Previous studies used augmented pressure - AP (the difference between the secondand the first systolic peak) and augmentation index (AP expressed as a percentage of the pulse pressure)to detect coronary atherosclerosis [44].
46

0 20 40 60 80 100
−1
0
1
0
0.5
1
Sample Number
Am
pli
tude
c
d
e
f
a
b
SystolicPeak
DiastolicPeak
DicroticNotch
PPG
SecondDerivative
Figure 5.2: Characteristic points of APG
5.3 Morphological Analysis Using Second Derivative
As the PPG waveform is an indicator of the blood volume, its second derivative is an indicatorof acceleration of the blood flow in the fingertip. A number of terminologies have been assigned tothis acceleration waveform such as, Acceleration Plethysmogram (APG), Second Derivative of Photo-plethysmogram (SDPTG) or Second Derivative of Digital Volume Pulse (SDDVP) etc. The terminologyfollowed here will be APG. Morphological analysis of the second derivative have yielded valuable in-formation about arterial health [33]. Parameters such as arterial stiffness index (SI), augmentation index(AI) or reflection index (RI) have been derived from the PPG waveform and its second derivative [42,43].These parameters are crucial indicators of arterial health of a subject and assessment of CVD risk [38].These parameters present a quantitative measure towards detecting likelihood of subject developing dis-eases like arteriosclerosis, atherosclerosis [35, 39, 40]. Increased arterial stiffness and vascular ageingare significant factors increasing risk of CAD. The parameters obtained from PPG can be analysed to
47

assess the risk of CAD as well [44]. Detailed analysis of invasive and non invasive parameters fromCAD patients is carried out in [45]. Our aim in this work is to conduct a morphological analysis of ABP,PPG and their second derivatives towards detecting possible of CAD. Second derivative based analysisis carried out first.
5.4 Proposed Method
Previous sections discussed various PPG and ABP based indices used to estimate arteriosclerosis,atherosclerosis, CVD. CAD is caused by atherosclerosis of coronary artery. Coronary artery also be-comes stiffer and more rigid as a result. Using this information, we first locate the characteristic points ofinterest on the PPG waveform and its second derivative. Next step will be to analyse these characteristicpoints and develop distinguishing features. Final step will be classification.
5.5 Representative Pulse Extraction
PPG signal characteristics tend to vary with time. Even a single recording few minutes long canhave varying properties. This may lead to varying results of morphological analysis over time. Thus asa first step, a single PPG pulse is extracted which will serve as a representative for the entire recording.Singular Value Decomposition (SVD) is used for this purpose. All steps involved in extracting therepresentative pulse are discussed in following sections.
5.5.1 Preprocessing and Pulse Segmentation
Raw ABP data usually contains noise and other disturbances such as baseline variations primarilydue to respiration. Moving average filter of narrow window is employed to reduce the noise whereas awider window is used to obtain the baseline of the signal which is then removed from the given signal.
The PPG signal is then divided into individual pulses. The data used in the analysis is sampled at125Hz. An appropriate window size is used to estimate local peaks and the corresponding troughs areused to mark the beginning and end of a complete pulse. For a given PPG signal consisting of N heartbeats, the segmented pulses are labelled as PPGi(n), i ∈ 1, 2, · · ·N .
5.5.2 Fundamentals of SVD
For a given m× n matrix A, the SVD is obtained as
A = U · Σ · V T (5.1)
where U ∈ Rm×m, V ∈ Rn×n, UT · U = I, V T · V = I , Σm,n = [diag{σ1, · · ·σp : 0] wherep = min(m,n), σ1 ≥ · · · ≥ σp ≥ 0, and σ1, · · · , σp are the singular values. Also, U, V are left
48

0 20 40 60 80
0
0.5
1
Sample Number
No
rmal
ized
Am
pli
tud
e
Figure 5.3: Typical representative pulse
singular and right singular vector matrices respectively. If q of the p singular values are predominant,prime information of A will be contained in
A =
q∑i=1
ui · σi · vTi (5.2)
where ui, vi are the columns of U, V respectively.
5.5.3 Estimation of Dominant Periodic Component and Representative Pulse
Using the theory of SVD, the PPG waveform is now processed using the signal characterizationcarried out in [96]. The matrixA is constructed using waveform corresponding to 10 PPG pulses havingsimilar pulse width and similar pulse onset to systolic peak distance. Pulse width may not be exactlysame for those 10 pulse, thus, first n samples of each pulse are selected; where n is the minimum pulsewidth for those 10 pulses. Let us represent ith pulse with width ki as ppgi = {xi(1), xi(2), · · ·xi(ki)}.The matrix A is given by
A =
x1(1) x1(2) · · · x1(n)
x2(1) x2(2) · · · x2(n)...
... · · ·...
x10(1) x10(2) · · · x10(n)
(5.3)
where i ∈ 1, · · · , 10 and n = min(ki).
Following the method proposed in [96], the most dominant periodic pattern within A is given by
AP = u1 · σ1 · vT1 (5.4)
49

0 20 40 60 80
0
0.5
1
Sample Number
Norm
aliz
ed A
mpli
tude
RP
SP
DP
GF
mD
mS
Figure 5.4: Gaussian Fitting for representative pulse
where ui, vi are the columns of U, V respectively. The middle row of AP is used as the represen-tative pulse for the entire waveform. This single pulse represents the entire signal and is then used forfurther analysis. A typical representative pulse is shown in Figure 5.3.
5.6 Morphological Analysis of Representative Pulse
As mentioned in section 5.2, presence of CAD can affect the systolic and diastolic phases of thePPG or ABP waveform. Thus it is worthwhile to study the the positions of systolic and diastolic peaks.Although systolic peaks are easy to locate, diastolic peaks are not very pronounced and are difficult toestimate. To solve this problem, Gaussian fit discussed in previous chapter is used here as well. Theprimary aim to use this approach is to locate the diastolic peak.
A Gaussian curve is characterised by its mean, standard deviation and amplitude. The mean of thesystolic phase component is placed around the systolic peak which is estimated using local peak detec-tion in the pulse segmentation step. Position of the diastolic phase component is constrained betweenposition of systolic peak and end of PPG cycle. The position of mean for the diastolic component andits amplitude form the location of diastolic peak. This process is shown in Figure 5.4.
5.7 Morphological Analysis of Second Derivative of Representative Pulse
Morphological analysis using second derivative involves analysing characteristic points of the secondderivative thus, these points are extracted from the acceleration waveform. However the accelerationwaveform is extremely noisy as seen from Figure 5.5. To obtain the characteristic points from sucha noisy signal, we first have to remove the noise, for which we employ wavelet transform which isdiscussed in the next section.
50

0 20 40 60 80−2
0
2.5
Sample Number
Am
pli
tud
e
Figure 5.5: Second derivative (acceleration waveform) of representative pulse in Figure 5.3.
−5 0 5−0.5
0
0.5
1
Time
Amplitude
Figure 5.6: Mexican Hat wavelet
5.7.1 Wavelet Transform
Wavelet transform is a widely used technique to represent the signal in time-scale domain and is auseful tool in identifying certain features of the signal which are otherwise not very obvious in time orfrequency domains. For a given signal f(t), and wavelet ψ(t) the CWT coefficients are defined as
C(a, b; f(t), ψ(t)) =
∞
−∞
f(t) · 1√a· ψ∗( t− b
a) · dt (5.5)
where ψ∗(t) is the complex conjugate of ψ(t) and a, b are the scaling and shifting parameters respec-tively. There are a number of choices for selection of the wavelet analysis function, ψ(t) each suitablefor specific purpose. CWT also allows us to design custom analysis function.
51

0 20 40 60 80−2.5
0
2.5
Sample Number
Am
pli
tud
e
f
a
b
c
d
e
Figure 5.7: Characteristic points of Figure 5.5
5.7.2 Selection of Wavelet Function
The acceleration waveform contains 5 significant points. Thus the wavelet to be selected should bereal valued, smooth and capable of detecting of local subtle changes in the waveform. The derivative ofGaussian (DOG) wavelet family is a viable choice for the application. The Mexican hat (Mexh) waveletis derived from the second derivative of the Gaussian probability density function and is a special caseof the DOG wavelet family. The Mexican hat wavelet as shown in Figure 5.6 has all the propertiesrequired for the analysis and is perfectly suited for the purpose.
5.7.3 Wavelet Transform of PPG waveform
The second derivative of the periodic component is analysed using the Mexh wavelet for five scales.The first three scales coefficients contain the higher frequency noise which is less prominent in subse-quent scales. Fourth scale onwards, the scales are relatively free of high frequency noise and containthe necessary information. The coefficients obtained at the fifth scale are used for further analysis.
5.7.4 Local Extrema Detection
Once we obtain wavelet domain representation of the acceleration waveform, all we need to dois to the local minima and maxima. Points a, c, e form local maxima while points b, d, f form localminima. This is achieved through elementary maxima and minima finding algorithm. The fifth scalerepresentation and characteristic points of the signal from Figure 5.5 can be seen in Figure 5.7.
52

5.8 CAD Detection
Once the characteristic points have been extracted, the focus is now shifted to studying these points inorder to look for distinguishing features which are subsequently used for classification between healthysubjects and CAD patients.
5.8.1 Datasets Used
Obtaining invasive and non-invasive data from CAD patients and healthy persons which will serveas the control group is a challenging task. This data has to be obtained from patients in controlledconditions. Though the non-invasive data can be recorded using a small hand held device, obtaininginvasive data is a more involved and complicated procedure. It involves insertion of a catheter insidesubject’s artery and can only be performed by trained professionals. These invasive recordings are ameans of patient monitoring carried out in Intensive Care Units where access is limited only to medicalpersonnel. These practical limitations compel us to use an open source dataset. However, the highlyselective nature of our task means an extremely scarce availability of an open source dataset. MIMICdataset provides most suitable data for this analysis.
1. Using MIMIC-II dataset
The second study is carried out using the MIMIC-II (v2.6) Database. The patients’ ICD9 codeswere studied and those diagnosed positive for Coronary Atherosclerosis were selected for analy-sis. However only a small portion of the original MIMIC-II Database has been released for openuse. This limits the number of patients diagnosed positive for Coronary Atherosclerosis whosedata can be used for analysis. The open source database contains usable PPG and ABP data of 20patients each and simultaneous PPG and ABP recordings of 8 patients.
2. The MIMIC-II Waveform Database Matched Subset
The MIMIC-II datset is used to obtain data of patients having CAD as well as healthy individ-uals. Although the original MIMIC-II Database [97] contains waveform recordings and clinicalinformation of over 30, 000 patients, not all waveform data has been linked to the correspond-ing clinical data. In fact, of all the patient data available, only 4, 897 waveform records have beenmatched to their corresponding 2, 809 patients. Other factors restricting the number of cases is thefact that a fraction of patients have CAD and the required waveforms of PPG and ABP are presentonly for a small fraction of those patients. Data for analysis of healthy subjects is also taken fromthe same database. Patients not suffering from any heart related ailments are considered ’healthy’.
53

DatasetNumber
ofsubjects
MinimumAge
MaximumAge
MeanAge
CAD PatientsABP 34 41 90 72PPG 35 46 96 75
HealthyABP 24 20 80 57PPG 20 19 77 44
Table 5.1: Dataset Statistics
5.8.2 Morphology of Patient and Healthy Subject Data
Once the characteristic points of the ABP and PPG waveforms are obtained, the distribution of thesepoints for the entire dataset is analysed. We normalize the temporal position of the characteristic pointswith respect to corresponding pulse width which provides us the results shown in Figure 5.8.
0 10 20 30 40 50 60 70 80−8
−6
−4
−2
0
2
4
6
Sample Number
Am
pli
tud
e
(a) Characteristic points of ABP Normalized with respect topulse width for MIMIC-II
0 10 20 30 40 50 60 70 80 90
−2
−1
0
1
2
Sample Number
Am
pli
tud
e
(b) Characteristic points of PPG Normalized with respect topulse width for MIMIC-II
Figure 5.8: Morphology of ABP and PPG for CAD patients from MIMIC-II dataset
This analysis is carried out for both healthy subject data and CAD patient data. The characteristicpoints obtained are shown in Figure 5.9.
5.8.3 Features
Information related to systolic and diastolic phases of the PPG cycle are used as distinguishingfeatures.
(i) Close inspection of characteristic points from Figure 5.8 and Figure 5.9 suggests that these pointsare closely grouped together for healthy subjects. The distribution is uneven and wide in case of CAD
54

0 10 20 30 40 50 60 70 80−10
−8
−6
−4
−2
0
2
4
6
8
Sample Number
Am
pli
tud
e
(a) Characteristic points of ABP Normalized with respect topulse width for MIMIC-II
0 10 20 30 40 50 60 70 80−3
−2
−1
0
1
2
3
Sample Number
Am
pli
tud
e
(b) Characteristic points of PPG Normalized with respect topulse width for MIMIC-II
Figure 5.9: Morphology of ABP and PPG for healthy subjects from MIMIC-II dataset
a
d
b c
e f
Figure 5.10: Legend for morphological analysis of ABP and PPG
patients. This implies that although amplitude of the characteristic points typically is used in morpho-logical analysis [35], the temporal positions of b, c, d, e points are as relevant as their amplitude value. Itcan also be observed that healthy subjects have well defined c, d points, these points are absent in manyCAD patients. Temporal position of b, e provide information about the systolic and diastolic phases andthus form one set of features.
(ii) Second piece of information is provided by the Gaussian fit process. mS,i,mD,i are used assecond set of features.
The feature vector formed is,
featureV ector = [bx, ex,mS ,mD] (5.6)
5.8.4 Classification
The detection of CAD is formulated as a binary classification problem where PPG based features ofan individual will be provided to a classifier and the classifier will classify as a healthy case or CAD.
55
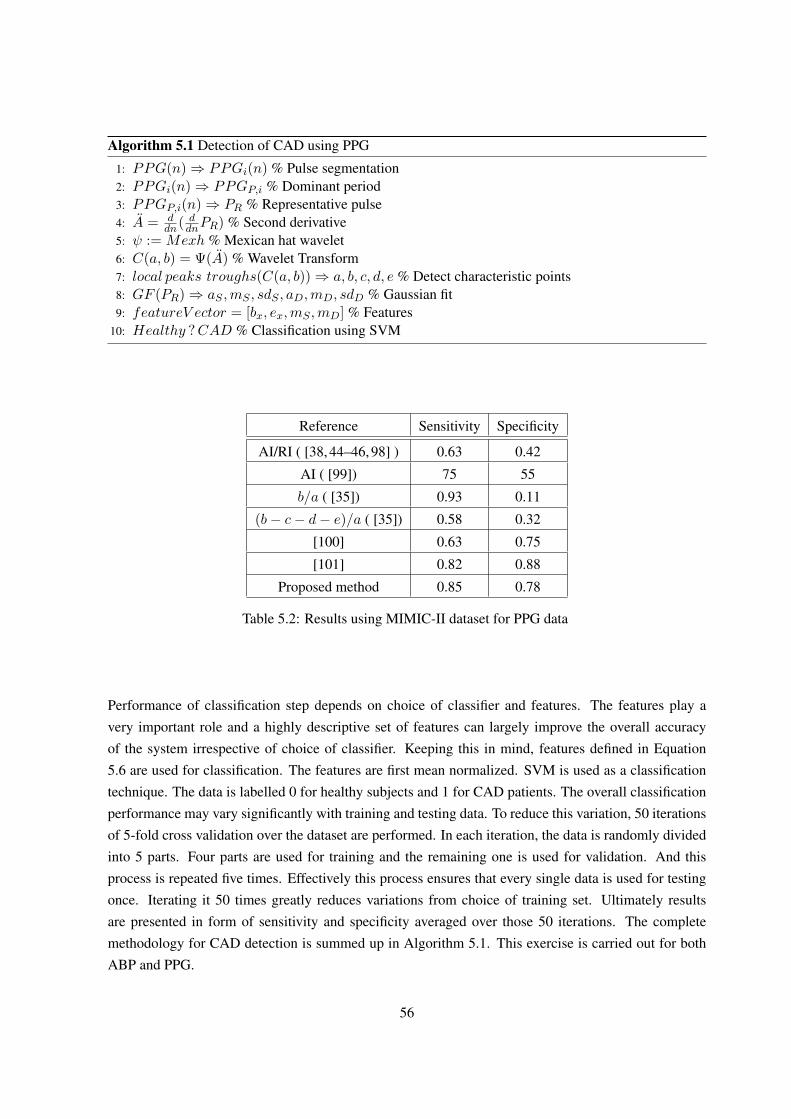
Algorithm 5.1 Detection of CAD using PPG
1: PPG(n)⇒ PPGi(n) % Pulse segmentation2: PPGi(n)⇒ PPGP,i % Dominant period3: PPGP,i(n)⇒ PR % Representative pulse4: A = d
dn( ddnPR) % Second derivative
5: ψ := Mexh % Mexican hat wavelet6: C(a, b) = Ψ(A) % Wavelet Transform7: local peaks troughs(C(a, b))⇒ a, b, c, d, e % Detect characteristic points8: GF (PR)⇒ aS ,mS , sdS , aD,mD, sdD % Gaussian fit9: featureV ector = [bx, ex,mS ,mD] % Features
10: Healthy ?CAD % Classification using SVM
Reference Sensitivity Specificity
AI/RI ( [38, 44–46, 98] ) 0.63 0.42
AI ( [99]) 75 55
b/a ( [35]) 0.93 0.11
(b− c− d− e)/a ( [35]) 0.58 0.32
[100] 0.63 0.75
[101] 0.82 0.88
Proposed method 0.85 0.78
Table 5.2: Results using MIMIC-II dataset for PPG data
Performance of classification step depends on choice of classifier and features. The features play avery important role and a highly descriptive set of features can largely improve the overall accuracyof the system irrespective of choice of classifier. Keeping this in mind, features defined in Equation5.6 are used for classification. The features are first mean normalized. SVM is used as a classificationtechnique. The data is labelled 0 for healthy subjects and 1 for CAD patients. The overall classificationperformance may vary significantly with training and testing data. To reduce this variation, 50 iterationsof 5-fold cross validation over the dataset are performed. In each iteration, the data is randomly dividedinto 5 parts. Four parts are used for training and the remaining one is used for validation. And thisprocess is repeated five times. Effectively this process ensures that every single data is used for testingonce. Iterating it 50 times greatly reduces variations from choice of training set. Ultimately resultsare presented in form of sensitivity and specificity averaged over those 50 iterations. The completemethodology for CAD detection is summed up in Algorithm 5.1. This exercise is carried out for bothABP and PPG.
56

Reference Sensitivity Specificity
AI/RI ( [38, 44–46, 98] ) 0.78 0.41
AI ( [99]) 50 36
b/a ( [35]) 0.55 0.45
(b− c− d− e)/a ( [35]) 0.6 0.42
Proposed method 0.76 0.63
Table 5.3: Results using MIMIC-II dataset for ABP data
5.9 Results
For each iteration of 5-fold cross validation process, we record classification performance usingquantifiers discussed below.
• True Positive (TP): Data belongs to CAD patient and classified as CAD patient.
• False Positive (FP): Data belongs to healthy subject and classified as CAD patient.
• True Negative (TN): Data belongs to healthy subject and classified as healthy subject.
• False Negative (FN): Data belongs to CAD patient and classified as healthy subject.
Based on values of these parameters, sensitivity and specificity are calculated. The results for PPG andABP are summed up in Table 5.2 and Table 5.3 respectively.
5.9.1 Discussion
Detecting CAD through non-invasive technique has attracted some recent attention but there has notbeen any proven technique which exists today. Recent work towards CAD detection through PPG hasbeen presented in [101]. The authors of this study have also used the MIMIC dataset along with anin-house dataset obtained from patients admitted to a hospital. The technique uses time and frequencydomain features followed by SVM classification. Another work based on morphological features ofPPG waveforms is presented in [100]. Performance comparison for all techniques using MIMIC datasetis summarised in Table 5.2. The present technique outperformed the one in [100], achieving highersensitivity as well as specificity values. Higher sensitivity value is achieved compared to [101] as well,however the specificity value is lower. Overall performance was much higher than augmentation orreflection index (AI/RI) based approach provides very low sensitivity and specificity figures for thecurrent data. The performance is better than even the identifiers mentioned in [35]. This further provesthat the temporal features are as important as the amplitude features.
Proposed method performs better for invasive ABP data as well compared to other conventionaltechniques. However the results show that PPG signals achieve higher classification accuracy than ABPsignals.
57

5.10 Summary
In this chapter, we focussed on studying pulse morphology of non-invasive (PPG) waveform as wellas invasive (ABP) waveform. Our aim for this study was to uncover information about a person’s car-diac health from these signals. This information will then be used for estimating possibility of coronaryartery disease. We analyse morphology of these waveforms and their second time derivatives to gaininformation about cardiac cycle. Highest quality pulses obtained by technique discussed in previouschapter are selected for analysis followed by SVD based periodic component extraction to obtain arepresentative pulse. Then a wavelet transform based approach is used to find the characteristic pointsfrom the waveform. Mexican hat wavelet is used for this purpose. These characteristic points are thenstudied further for their potential use towards detecting CAD. We observed that the temporal position ofthese points is an excellent indicator of cardiac health and can serve as a distinguishing factor betweenhealthy and CAD patients. Using our observations, we present distinguishing features and formulatea binary classification problem to detect CAD. Supervised learning approach using support vector ma-chines (SVM) is used classification. Real life data obtained from intensive care units belonging to CADpatients and subjects not diagnosed with any major cardiac disease are used for training and testing thedetection technique. Fifty iterations of 5-fold cross validation of SVM performance shows that non in-vasive PPG waveform was able to perform much better classification than invasive ABP over the dataset.These results also suggest that PPG can be used as a screening technique for CAD diagnosis.
58

Chapter 6
Conclusions And Future Work
6.1 Thesis Summary
Cardiovascular diseases are a leading cause of casualties throughout the world. Cardiac arrhythmiaand coronary artery disease are two of the most common cardiac diseases. The existing diagnostictechniques carry numerous limitations and thus there is a need to develop an alternative. Among thepossible approaches, PPG is the most suitable technique providing merits of simple, inexpensive design,non-invasive nature. It is widely used in oximetry in healthcare facilities. Thus, emphasis of this workis on developing algorithms for diagnosing the cardiac diseases using the PPG data.
PPG signal brings few challenges with it such as noise, amplitude variations and most significantlymotion artifacts. These artifacts introduce additional peaks in the signal which can lead to false arrhyth-mia detection. Morphological analysis of PPG is also more difficult in presence of artifact. As our firstassignment, an entropy based technique is established to detect motion artifact and estimate accuratepulse rate of the subject. Input PPG waveform is first segmented into pulses based on peaks and val-leys. Second step is obtaining fuzzy entropy. Fuzzy entropy is an estimation of similarity between asegmented pulse and user defined membership function. Local peaks where the degree of similarityis maximum are our candidate heart beats. Entropy values of all peaks are compared and a suitablehigher and lower thresholds are applied to separates true heart beats from artifact induced peaks. In thenext step, the true heart beats are used to estimate the pulse rate. PPG signal is now ready to be testedfor 3 types of cardiac arrhythmias, namely tachycardia, bradycardia or asystole events depending uponinstantaneous heart beat rate (bpm). Performance of this technique is evaluated on Physionet Challenge2015 training dataset. The results suggest that PPG is a competent alternative to conventional ECGbased detection of cardiac arrhythmia. There are however few limitations to the range of applications ofthis technique. The selection of correct membership function is essential for a good performance of thealgorithm and user input is required for this step. Further, entropy, being a measure of similarity, doesnot provide information about peculiar morphological and time domain features. This greatly restrictsits application in qualitative analysis of PPG for cardiac diagnosis. Computational time also becomessignificant for processing large number of data samples.
59

The limitations of fuzzy entropy technique have to be overcome before moving to coronary arterydiseases detection. The improved technique is required to estimate accurate pulse rate in presence ofmotion artifacts and it should have two important aspects; inclusion of pulse shape information andhigher computational speed. A new approach is developed to estimate beat-by-beat quality of the PPGsignal using various shape based features. The two phases of heart beat cycle, systolic and diastolicare expressed as a sum of two Gaussian signals. The Gaussian coefficients form one set of features.An image processing technique, which extracts salient parts of an image is introduced to identify theportion affected by motion artifact. This forms the second feature. Other features include systolic peakheight and number of local peaks. All these features are assigned thresholds. Each pulse is assigneda pulse quality index (PQI) of 100. This PQI decreases if the features exceed the thresholds. PQI ofabove 60 is considered as a valid pulse. Arrhythmia detection performance is again evaluated over anextended dataset including ventricular tachycardia and ventricular fibrillation. The results indicate animproved overall accuracy over the fuzzy entropy method and comparable performance with other ECGbased approaches.
Next contribution of this work focuses on detecting coronary artery disease (CAD). CAD alters themorphological characteristics of PPG. The morphology of these waveforms is best analysed with respectto their systolic and diastolic phases and second derivatives. The second derivative provides additionalcharacteristics points which are named simply as a, b, c, d, e as compared to the systolic and diastolicpeaks obtained directly from the waveform. A representative pulse is first extracted from the signalwhich is then used for analysis and developing features. Singular Value Decomposition (SVD) is usedfor this purpose. Gaussian fitting used previously, is used to obtain the systolic and diastolic components.Wavelet transform and local peak detection to identify the characteristic points from second derivativeof representative pulse. Temporal position of systolic peak, diastolic peak and points b, e are used asfeatures. MIMIC-II dataset contains waveforms obtained from CAD patients and healthy subjects andis used here for performance evaluation. We use supervised classification using support vector machineto differentiate healthy and CAD patients. The entire procedure is repeated on invasive arterial bloodpressure (ABP) data obtained from same MIMIC-II dataset for comparison. Fifty iterations 5-fold crossvalidation of data suggested that the PPG waveform classification performed much better than ABPwaveform classification. This is an important step towards making PPG an early screening techniquefor diagnosing complicated cardiac diseases.
As a conclusion, PPG proves to be a viable technique to detect certain potentially life threateningcardiac diseases. New techniques are presented to detect cardiac arrhythmia and coronary artery disease.PPG has shown lot of promise for further research and an ability to serve as a non-invasive, inexpensivetool for ambulatory as well home cardiac monitoring.
60

6.2 Future Work
In our work so far, we attempted to study PPG and explore its applications beyond the commonlyused pulse oximetry and focus on cardiac diagnosis. We presented various technique for motion artifactsegmentation, pulse quality estimation, detection of cardiac arrhythmia and CAD. Although we haveachieved fairly good results, we believe that performance of most techniques and systems can be im-proved and we can expand our research further. Our approach was able to detect tachycardia, howeverfurther classification of tachycardia according to its origin is not possible. A deeper analysis of ECG andPPG correlation is required for that classification. Similarly, PPG and ABP correlation can be analysedfurther to estimate the severity of CAD not just its presence. To make our detection techniques morepractical, the algorithms can be modified so that they can be integrated with a typical pulse oximeter.Such a device will be highly suitable for ambulatory as well as home monitoring.
Biggest challenge faced by diagnostics systems is reliability. Another leading factors which limit thereliability of such systems is non-availability of data from patients and healthy subjects. Gathering moredata from patients is essential for improving the signal processing techniques by way of incorporatingbetter, supervised learning methodologies. PPG morphology can also be studied further to investigateother cardiac diseases and develop wearable systems for long time monitoring and early screening forthose diseases. PPG can be combined with other non-invasive techniques like phonocardiography forenhanced reliability and a true non-invasive system.
61

Related Publications
The related publications included in the thesis are as follows-Journal publications
• Neeraj Sudhir Paradkar and Shubhajit Roy Chowdhury. Fuzzy entropy based detection of tachy-cardia and estimation of pulse rate through fingertip photoplethysmography. Journal of Medicaland Bioengineering, 4(1):19-23, February 2015.
Conference publications
• Neeraj Paradkar and Shubhajit Roy Chowdhury. Fuzzy entropy based motion artifact detectionand pulse rate estimation for fingertip photoplethysmography. In Engineering in Medicine andBiology Society (EMBC), August 2014, 36th Annual International Conference of the IEEE, pages58-61.
• Paradkar, Neeraj, and Shubhajit Roy Chowdhury. ”Primary study for detection of arterial bloodpressure waveform components.” 2015, 37th Annual International Conference of the IEEE Engi-neering in Medicine and Biology Society (EMBC). IEEE, August 2015, pages 1959-1962.
• Neeraj Paradkar and Shubhajit Roy Chowdhury. Cardiac Arrhythmia Detection using Photo-plethysmography. Accepted for publication at the 39th Annual International Conference of theIEEE Engineering in Medicine and Biology Society (EMBC), July 2017.
• Neeraj Paradkar and Shubhajit Roy Chowdhury. Coronary Artery Disease Detection using Pho-toplethysmography. Accepted for publication at the 39th Annual International Conference of theIEEE Engineering in Medicine and Biology Society (EMBC) July 2017.
62

Bibliography
[1] W. H. Organization et al., “Cardiovascular diseases (cvds): Fact sheet no. 317. 2011,” 2011.
[2] R. Mehra, “Global public health problem of sudden cardiac death,” Journal of electrocardiology,vol. 40, no. 6, pp. S118–S122, 2007.
[3] M. Naghavi, H. Wang, R. Lozano, A. Davis, X. Liang, M. Zhou, S. E. Vollset, A. A. Ozgoren,S. Abdalla, F. Abd-Allah et al., “Global, regional, and national age-sex specific all-cause andcause-specific mortality for 240 causes of death, 1990-2013: a systematic analysis for the globalburden of disease study 2013,” Lancet, vol. 385, no. 9963, pp. 117–171, 2015.
[4] W. H. Organization, “International statistical classification of diseases and related health prob-lems,” 2009.
[5] P. Libby and P. Theroux, “Pathophysiology of coronary artery disease,” Circulation, vol. 111,no. 25, pp. 3481–3488, 2005.
[6] M. K. Das, C. Saha, H. El Masry, J. Peng, G. Dandamudi, J. Mahenthiran, P. McHenry, and D. P.Zipes, “Fragmented qrs on a 12-lead ecg: a predictor of mortality and cardiac events in patientswith coronary artery disease,” Heart Rhythm, vol. 4, no. 11, pp. 1385–1392, 2007.
[7] A. S. Agatston, W. R. Janowitz, F. J. Hildner, N. R. Zusmer, M. Viamonte, and R. Detrano,“Quantification of coronary artery calcium using ultrafast computed tomography,” Journal of theAmerican College of Cardiology, vol. 15, no. 4, pp. 827–832, 1990.
[8] M. J. Budoff, D. Georgiou, A. Brody, A. S. Agatston, J. Kennedy, C. Wolfkiel, W. Stanford,P. Shields, R. J. Lewis, W. R. Janowitz et al., “Ultrafast computed tomography as a diagnosticmodality in the detection of coronary artery disease a multicenter study,” Circulation, vol. 93,no. 5, pp. 898–904, 1996.
[9] P. A. Marcovitz and W. F. Armstrong, “Accuracy of dobutamine stress echocardiography in de-tecting coronary artery disease,” The American journal of cardiology, vol. 69, no. 16, pp. 1269–1273, 1992.
63

[10] S. T. Lawless, “Crying wolf: false alarms in a pediatric intensive care unit.” Critical caremedicine, vol. 22, no. 6, pp. 981–985, 1994.
[11] C. L. Tsien and J. C. Fackler, “Poor prognosis for existing monitors in the intensive care unit,”Critical care medicine, vol. 25, no. 4, pp. 614–619, 1997.
[12] R. DETRANO and V. FROELICHER, “A logical approach to screening for coronary artery dis-ease,” Annals of internal medicine, vol. 106, no. 6, pp. 846–852, 1987.
[13] W. B. Meijboom, M. F. Meijs, J. D. Schuijf, M. J. Cramer, N. R. Mollet, C. A. van Mieghem,K. Nieman, J. M. van Werkhoven, G. Pundziute, A. C. Weustink et al., “Diagnostic accuracy of64-slice computed tomography coronary angiography: a prospective, multicenter, multivendorstudy,” Journal of the American College of Cardiology, vol. 52, no. 25, pp. 2135–2144, 2008.
[14] S. Silber and P. Mathes, “New concepts for early diagnosis of coronary artery disease,” in Car-diovascular Prevention and Rehabilitation. Springer, 2007, pp. 52–64.
[15] M. B. Simson, “Use of signals in the terminal qrs complex to identify patients with ventriculartachycardia after myocardial infarction.” Circulation, vol. 64, no. 2, pp. 235–242, 1981.
[16] S. R. Chowdhury, “Field programmable gate array based fuzzy neural signal processing systemfor differential diagnosis of QRS complex tachycardia and tachyarrhythmia in noisy ECG sig-nals,” Journal of medical systems, vol. 36, no. 2, pp. 765–775, 2012.
[17] P. Denes, P. Santarelli, R. Hauser, and E. Uretz, “Quantitative analysis of the high-frequencycomponents of the terminal portion of the body surface qrs in normal subjects and in patientswith ventricular tachycardia.” Circulation, vol. 67, no. 5, pp. 1129–1138, 1983.
[18] M. Owis, A. H. Abou-Zied, A.-B. M. Youssef, Y. M. Kadah et al., “Study of features basedon nonlinear dynamical modeling in ecg arrhythmia detection and classification,” BiomedicalEngineering, IEEE Transactions on, vol. 49, no. 7, pp. 733–736, 2002.
[19] P. Shi, S. Hu, and Y. Zhu, “A preliminary attempt to understand compatibility of photoplethysmo-graphic pulse rate variability with electrocardiogramic heart rate variability,” Journal of Medicaland Biological Engineering, vol. 28, no. 4, pp. 173–180, 2008.
[20] M. Bolanos, H. Nazeran, and E. Haltiwanger, “Comparison of heart rate variability signal fea-tures derived from electrocardiography and photoplethysmography in healthy individuals,” inEngineering in Medicine and Biology Society, 2006. 28th Annual International Conference of theIEEE, pp. 4289–4294.
[21] T. Ma and Y. Zhang, “A correlation study on the variabilities in pulse transit time, blood pressure,and heart rate recorded simultaneously from healthy subjects,” in Engineering in Medicine andBiology Society, 2005. 27th Annual International Conference of the. IEEE, pp. 996–999.
64
[22] S. Lu, H. Zhao, K. Ju, K. Shin, M. Lee, K. Shelley, and K. H. Chon, “Can photoplethysmographyvariability serve as an alternative approach to obtain heart rate variability information?” Journalof clinical monitoring and computing, vol. 22, no. 1, pp. 23–29, 2008.
[23] N. Selvaraj, A. Jaryal, J. Santhosh, K. K. Deepak, and S. Anand, “Assessment of heart ratevariability derived from finger-tip photoplethysmography as compared to electrocardiography,”Journal of medical engineering & technology, vol. 32, no. 6, pp. 479–484, 2008.
[24] P. Shi, S. Hu, and Y. Zhu, “A preliminary attempt to understand compatibility of photoplethysmo-graphic pulse rate variability with electrocardiogramic heart rate variability,” Journal of Medicaland Biological Engineering, vol. 28, no. 4, pp. 173–180, 2008.
[25] M. Elgendi, M. Jonkman, and F. DeBoer, “Heart rate variability and the acceleration plethysmo-gram signals measured at rest,” in Biomedical Engineering Systems and Technologies. Springer,2011, pp. 266–277.
[26] L. Wang, E. Pickwell-MacPherson, Y. Liang, and Y. T. Zhang, “Noninvasive cardiac output es-timation using a novel photoplethysmogram index,” in Engineering in Medicine and BiologySociety, 2009. EMBC 2009. Annual International Conference of the IEEE. IEEE, 2009, pp.1746–1749.
[27] T. Suzuki, K.-I. Kameyama, and T. Tamura, “Development of the irregular pulse detection methodin daily life using wearable photoplethysmographic sensor,” in Engineering in Medicine andBiology Society, 2009. EMBC 2009. Annual International Conference of the IEEE. IEEE, 2009,pp. 6080–6083.
[28] D. Reisfeld and S. Kogan, “Detection of cardiac arrhythmias using a photoplethysmograph,”Sep. 14 2010, uS Patent 7,794,406.
[29] K. C. Ehlers, K. C. Mylrea, C. K. Waterson, and J. M. Calkins, “Cardiac output measurements. areview of current techniques and research,” Annals of biomedical engineering, vol. 14, no. 3, pp.219–239, 1986.
[30] M. F. L. Ramirez, R. T. Tibayan, C. E. Marinas, M. E. Yamamoto, and E. V. S. Caguioa, “Prog-nostic value of hemodynamic findings from impedance cardiography in hypertensive stroke,”American journal of hypertension, vol. 18, no. 2, pp. 65–72, 2005.
[31] L. Mathews, K. R. Singh et al., “Cardiac output monitoring,” Annals of cardiac anaesthesia,vol. 11, no. 1, p. 56, 2008.
[32] Q. Y. Lee, S. J. Redmond, G. Chan, P. M. Middleton, and E. Steel, “Estimation of cardiac outputand systemic vascular resistance using a multivariate regression model with features selected fromthe finger photoplethysmogram and routine cardiovascular measurements,” Biomed Eng Online,vol. 12, p. 19, 2013.
65

[33] M. Elgendi, “On the analysis of fingertip photoplethysmogram signals,” Current cardiology re-views, vol. 8, no. 1, p. 14, 2012.
[34] C. Poon, X. Teng, Y. Wong, C. Zhang, and Y. Zhang, “Changes in the photoplethysmogram wave-form after exercise,” in Computer Architectures for Machine Perception, 2003 IEEE InternationalWorkshop on. IEEE, 2004, pp. 115–118.
[35] K. Takazawa, N. Tanaka, M. Fujita, O. Matsuoka, T. Saiki, M. Aikawa, S. Tamura, andC. Ibukiyama, “Assessment of vasoactive agents and vascular aging by the second derivativeof photoplethysmogram waveform,” Hypertension, vol. 32, no. 2, pp. 365–370, 1998.
[36] U. Rubins, A. Grabovskis, J. Grube, and I. Kukulis, “Photoplethysmography analysis of arteryproperties in patients with cardiovascular diseases,” in 14th Nordic-Baltic Conference on Biomed-ical Engineering and Medical Physics. Springer, 2008, pp. 319–322.
[37] S. Millasseau, R. Kelly, J. Ritter, and P. Chowienczyk, “Determination of age-related increasesin large artery stiffness by digital pulse contour analysis,” Clinical science, vol. 103, no. 4, pp.371–377, 2002.
[38] S. R. Alty, N. Angarita-Jaimes, S. C. Millasseau, and P. J. Chowienczyk, “Predicting arterialstiffness from the digital volume pulse waveform,” Biomedical Engineering, IEEE Transactionson, vol. 54, no. 12, pp. 2268–2275, 2007.
[39] Y. K. Qawqzeh, M. I. Reaz, and M. A. M. Ali, The Assessment of Atherosclerosis in ErectileDysfunction Subjects Using Photoplethysmography. INTECH Open Access Publisher, 2012.
[40] L. A. Bortolotto, J. Blacher, T. Kondo, K. Takazawa, and M. E. Safar, “Assessment of vascularaging and atherosclerosis in hypertensive subjects: second derivative of photoplethysmogramversus pulse wave velocity,” American journal of hypertension, vol. 13, no. 2, pp. 165–171, 2000.
[41] H. Takada, K. Washino, J. S. Harrell, and H. Iwata, “Acceleration plethysmography to evaluateaging effect in cardiovascular system. using new criteria of four wave patterns.” Medical progressthrough technology, vol. 21, no. 4, pp. 205–210, 1995.
[42] M. Huotari, A. Vehkaoja, K. Maatta, and J. Kostamovaara, “Photoplethysmography and its de-tailed pulse waveform analysis for arterial stiffness,” Journal of Structural Mechanics, vol. 44,no. 4, pp. 345–362, 2011.
[43] D. Korpas, J. Halek, and L. Dolezal, “Parameters describing the pulse wave.” Physiological re-search, vol. 58, no. 4, p. 473, 2009.
[44] T. Weber, J. Auer, M. F. O’Rourke, E. Kvas, E. Lassnig, R. Berent, and B. Eber, “Arterial stiffness,wave reflections, and the risk of coronary artery disease,” Circulation, vol. 109, no. 2, pp. 184–189, 2004.
66

[45] M. Jyotsna, A. Mahesh, M. Aditya, P. R. mohan, and M. U. R. Naidu, “Comparison of invasivevs noninvasive pulse wave indices in detection of significant coronary artery disease: Can weuse noninvasive pulse wave indices as screening test,” Clinical Medicine Insights: Cardiology,vol. 2, pp. 153–160, 05 2008. [Online]. Available: www.la-press.com/comparison-of-invasive-vs-noninvasive-pulse-wave-indices-in-detection–article-a765
[46] L. Xu, M. Q.-H. Meng, X. Qi, and K. Wang, “Morphology variability analysis of wrist pulsewaveform for assessment of arteriosclerosis status,” Journal of medical systems, vol. 34, no. 3,pp. 331–339, 2010.
[47] S. P. Linder and S. Wendelken, “Using the morphology of the photoplethysmogram envelopeto automatically detect hypovolemia,” in Computer-Based Medical Systems, 2006. CBMS 2006.19th IEEE International Symposium on. IEEE, 2006, pp. 371–371.
[48] P. Cox, C. Madsen, K. L. Ryan, V. A. Convertino, and E. Jovanov, “Investigation of photoplethys-mogram morphology for the detection of hypovolemic states,” in Engineering in Medicine andBiology Society, 2008. EMBS 2008. 30th Annual International Conference of the IEEE. IEEE,2008, pp. 5486–5489.
[49] T. Otsuka, T. Kawada, M. Katsumata, and C. Ibuki, “Utility of second derivative of the fingerphotoplethysmogram for the estimation of the risk of coronary heart disease in the general popu-lation,” Circulation Journal, vol. 70, no. 3, pp. 304–310, 2006.
[50] N. Nousou, S. Urase, Y. Maniwa, K. Fujimura, and Y. Fukui, “Classification of accelerationplethysmogram using self-organizing map,” in Intelligent Signal Processing and Communica-tions, 2006. ISPACS’06. International Symposium on. IEEE, 2006, pp. 681–684.
[51] K. H. Shelley, “Photoplethysmography: beyond the calculation of arterial oxygen saturation andheart rate,” Anesthesia & Analgesia, vol. 105, no. 6, pp. S31–S36, 2007.
[52] J. Allen, “Photoplethysmography and its application in clinical physiological measurement,”Physiological measurement, vol. 28, no. 3, p. R1, 2007.
[53] P. A. Kyriacou, “Pulse oximetry in the oesophagus,” Physiological measurement, vol. 27, no. 1,p. R1, 2005.
[54] B. K. S. C. R. Swathi Ramasahayam, K. Sri Haindavi, “Non invasive estimation of blood glucoseusing near infra-red spectroscopy and double regression analysis,” in 7th IEEE InternationalConference on Sensing Technology, Wellington, New Zealand, ecember 3-5, 2013.
[55] C. Sharma, A. B. SachinKumar, and S. R. Chowdhury, “Field programmable gate array basedembedded system for non-invasive estimation of hemoglobin in blood using photoplethysmogra-phy,” Int. J. Smart Sens. And Intel. Sys, vol. 6, pp. 1268–1282, 2013.
67

[56] T. Ma and Y. Zhang, “A correlation study on the variabilities in pulse transit time, blood pressure,and heart rate recorded simultaneously from healthy subjects,” in Engineering in Medicine andBiology Society, 2005. IEEE-EMBS 2005. 27th Annual International Conference of the. IEEE,2005, pp. 996–999.
[57] F. S. Cattivelli and H. Garudadri, “Noninvasive cuffless estimation of blood pressure from pulsearrival time and heart rate with adaptive calibration,” in Wearable and Implantable Body SensorNetworks, 2009. BSN 2009. Sixth International Workshop on. IEEE, 2009, pp. 114–119.
[58] K. V. Madhav, M. R. Ram, E. H. Krishna, N. R. Komalla, and K. A. Reddy, “Robust extraction ofrespiratory activity from ppg signals using modified mspca,” Instrumentation and Measurement,IEEE Transactions on, vol. 62, no. 5, pp. 1094–1106, 2013.
[59] S. Fleming, L. Tarassenko, M. Thompson, and D. Mant, “Non-invasive measurement of respi-ratory rate in children using the photoplethysmogram,” in Engineering in Medicine and BiologySociety, 2008. EMBS 2008. 30th Annual International Conference of the IEEE. IEEE, 2008, pp.1886–1889.
[60] W. Karlen, C. J. Brouse, E. Cooke, J. M. Ansermino, G. Dumont et al., “Respiratory rate estima-tion using respiratory sinus arrhythmia from photoplethysmography,” in Engineering in Medicineand Biology Society, EMBC, 2011 Annual International Conference of the IEEE. IEEE, 2011,pp. 1201–1204.
[61] J. Allen and A. Murray, “Development of a neural network screening aid for diagnosing lowerlimb peripheral vascular disease from photoelectric plethysmography pulse waveforms,” Physio-logical Measurement, vol. 14, no. 1, p. 13, 1993.
[62] R. W. Barnes, J. M. Clayton, G. E. Bone, E. E. Slaymaker, and J. Reinertson, “Supraorbital pho-toplethysmography. simple, accurate screening for carotid occlusive disease,” Journal of SurgicalResearch, vol. 22, no. 4, pp. 319–327, 1977.
[63] B. C. Stack Jr, N. D. Futran, B. Zang, and J. E. Scharf, “Initial experience with personal digitalassistant-based reflectance photoplethysmograph for free tissue transfer monitoring,” Annals ofplastic surgery, vol. 51, no. 2, pp. 136–140, 2003.
[64] P. Gibbs and H. H. Asada, “Reducing motion artifact in wearable bio-sensors using mems ac-celerometers for active noise cancellation,” in American Control Conference, 2005. Proceedingsof the. IEEE, pp. 1581–1586.
[65] H. H. Asada, H.-H. Jiang, and P. Gibbs, “Active noise cancellation using mems accelerometersfor motion-tolerant wearable bio-sensors,” in Engineering in Medicine and Biology Society, 2004.IEMBS’04. 26th Annual International Conference of the IEEE, vol. 1. IEEE, 2004, pp. 2157–2160.
68

[66] M. Aboy, J. McNames, T. Thong, D. Tsunami, M. S. Ellenby, and B. Goldstein,“An automatic beat detection algorithm for pressure signals.” IEEE transactions onbio-medical engineering, vol. 52, no. 10, pp. 1662–70, Oct. 2005. [Online]. Available:http://www.ncbi.nlm.nih.gov/pubmed/19163234
[67] W. Karlen, J. Ansermino, G. Dumont et al., “Adaptive pulse segmentation and artifact detectionin photoplethysmography for mobile applications.” in Annual International Conference of theIEEE Engineering in Medicine and Biology Society., 2012, pp. 3131–3134.
[68] R. Yousefi, M. Nourani, and I. Panahi, “Adaptive cancellation of motion artifact inwearable biosensors.” Conference proceedings : Annual International Conference of theIEEE Engineering in Medicine and Biology Society. IEEE Engineering in Medicine andBiology Society. Conference, vol. 2012, pp. 2004–8, Jan. 2012. [Online]. Available:http://www.ncbi.nlm.nih.gov/pubmed/23366311
[69] R. Couceiro, P. Carvalho, R. P. Paiva, J. Henriques, and J. Muehlsteff, “Detectionof motion artifacts in photoplethysmographic signals based on time and period domainanalysis.” Conference proceedings : ... Annual International Conference of the IEEEEngineering in Medicine and Biology Society. IEEE Engineering in Medicine andBiology Society. Conference, vol. 2012, pp. 2603–6, Jan. 2012. [Online]. Available:http://www.ncbi.nlm.nih.gov/pubmed/23366458
[70] A. De Luca and S. Termini, “On the convergence of entropy measures of a fuzzy set,” Kybernetes,vol. 6, no. 3, pp. 219–227, 1977.
[71] E. Czogala and J. Leski, “Application of entropy and energy measures of fuzziness to processingof ECG signal,” Fuzzy sets and systems, vol. 97, no. 1, pp. 9–18, 1998.
[72] W. Karlen, M. Turner, E. Cooke, G. Dumont, and J. M. Ansermino, “Capnobase: Signal databaseand tools to collect, share and annotate respiratory signals,” in Annual Meeting of the Society forTechnology in Anesthesia (STA), West Palm Beach, 2010.
[73] W. Karlen, K. Kobayashi, J. Ansermino, and G. Dumont, “Photoplethysmogram signal qual-ity estimation using repeated gaussian filters and cross-correlation,” Physiological measurement,vol. 33, no. 10, p. 1617, 2012.
[74] H. J. Wellens, “Ventricular tachycardia: diagnosis of broad qrs complex tachycardia,” Heart,vol. 86, no. 5, pp. 579–585, 2001.
[75] J. Pollard, “Cardiac arrhythmias and pulse variability,” Anaesthesia, vol. 25, no. 1, pp. 63–72,1970.
69

[76] F. Plesinger, P. Klimes, J. Halamek, and P. Jurak, “False alarms in intensive care unit moni-tors: Detection of life-threatening arrhythmias using elementary algebra, descriptive statisticsand fuzzy logic,” in 2015 Computing in Cardiology Conference (CinC). IEEE, 2015, pp. 281–284.
[77] S. Fallet, S. Yazdani, and J.-M. Vesin, “A multimodal approach to reduce false arrhythmia alarmsin the intensive care unit,” in 2015 Computing in Cardiology Conference (CinC). IEEE, 2015,pp. 277–280.
[78] C. H. Antink and S. Leonhardt, “Reducing false arrhythmia alarms using robust interval estima-tion and machine learning,” in 2015 Computing in Cardiology Conference (CinC). IEEE, 2015,pp. 285–288.
[79] L. M. Eerik, J. Vanschoren, M. J. Rooijakkers, R. Vullings, R. M. Aarts et al., “Decreasing thefalse alarm rate of arrhythmias in intensive care using a machine learning approach,” in 2015Computing in Cardiology Conference (CinC). IEEE, 2015, pp. 293–296.
[80] V. Kalidas and L. S. Tamil, “Enhancing accuracy of arrhythmia classification by combining log-ical and machine learning techniques,” in 2015 Computing in Cardiology Conference (CinC).IEEE, 2015, pp. 733–736.
[81] Q. Li and G. Clifford, “Dynamic time warping and machine learning for signal quality assessmentof pulsatile signals,” Physiological measurement, vol. 33, no. 9, p. 1491, 2012.
[82] R. Couceiro et.al, “Detection of motion artifacts in photoplethysmographic signals based on timeand period domain analysis,” in Engineering in Medicine and Biology Society (EMBC), 2012Annual International Conference of the IEEE, pp. 2603–2606.
[83] J. A. Sukor, S. Redmond, and N. Lovell, “Signal quality measures for pulse oximetry throughwaveform morphology analysis,” Physiological measurement, vol. 32, no. 3, p. 369, 2011.
[84] R. Krishnan, B. Natarajan, and S. Warren, “Motion artifact reduction in photopleythysmographyusing magnitude-based frequency domain independent component analysis,” in Computer Com-munications and Networks, 2008. ICCCN’08. Proceedings of 17th International Conference on.IEEE, 2008, pp. 1–5.
[85] X. Hou and L. Zhang, “Saliency detection: A spectral residual approach,” in Computer Visionand Pattern Recognition, 2007. CVPR’07. IEEE Conference on. IEEE, 2007, pp. 1–8.
[86] K. S. Deepak, A. Chakravarty, J. Sivaswamy et al., “Visual saliency based bright lesion detectionand discrimination in retinal images,” in 2013 IEEE 10th International Symposium on BiomedicalImaging. IEEE, 2013, pp. 1436–1439.
70

[87] W. Karlen, M. Turner, E. Cooke, G. Dumont, and J. M. Ansermino, “Capnobase: Signal databaseand tools to collect, share and annotate respiratory signals,” in Annual Meeting of the Society forTechnology in Anesthesia (STA), West Palm Beach, 2010.
[88] M. Aboy et.al, “An automatic beat detection algorithm for pressure signals,” Biomedical Engi-neering, IEEE Transactions on, vol. 52, no. 10, pp. 1662–1670, 2005.
[89] J. A. Pittman, J. S. Ping, and J. B. Mark, “Arterial and central venous pressure monitoring,”International anesthesiology clinics, vol. 42, no. 1, pp. 13–30, 2004.
[90] J. Sugawara, H. Komine, K. Hayashi, S. Maeda, and M. Matsuda, “Relationship between aug-mentation index obtained from carotid and radial artery pressure waveforms,” Journal of hyper-tension, vol. 25, no. 2, pp. 375–381, 2007.
[91] J.-Z. Wang, Y.-L. Zhang, F.-S. Hu, Z.-J. He, X.-J. Yang, Z.-C. Ma, and Y.-N. Sun, “A new tono-metric device for radial augmentation index and subendocardial viability ratio: Potential use inhealth screening,” The Journal of Clinical Hypertension, vol. 16, no. 10, pp. 707–712, 2014.
[92] N. Ranganathan, V. Sivaciyan, and F. Saksena, “Arterial pulse,” in The Art and Science of Car-diac Physical Examination, ser. Contemporary Cardiology, N. Ranganathan, V. Sivaciyan, andF. Saksena, Eds. Humana Press, 2007, pp. 15–48.
[93] M. F. O’Rourke and G. Mancia, “Arterial stiffness,” Journal of hypertension, vol. 17, no. 1, pp.1–4, 1999.
[94] B. A. Kingwell, T. K. Waddell, T. L. Medley, J. D. Cameron, and A. M. Dart, “Large arterystiffness predicts ischemic threshold in patients with coronary artery disease,” Journal of theAmerican College of Cardiology, vol. 40, no. 4, pp. 773–779, 2002.
[95] J. T. Kuvin, A. R. Patel, K. A. Sliney, N. G. Pandian, J. Sheffy, R. P. Schnall, R. H. Karas, andJ. E. Udelson, “Assessment of peripheral vascular endothelial function with finger arterial pulsewave amplitude,” American heart journal, vol. 146, no. 1, pp. 168–174, 2003.
[96] P. P. Kanjilal, S. Palit, and G. Saha, “Fetal ecg extraction from single-channel maternal ecg usingsingular value decomposition,” Biomedical Engineering, IEEE Transactions on, vol. 44, no. 1,pp. 51–59, 1997.
[97] M. Saeed, M. Villarroel, A. T. Reisner, G. Clifford, L.-W. Lehman, G. Moody, T. Heldt, T. H.Kyaw, B. Moody, and R. G. Mark, “Multiparameter intelligent monitoring in intensive care ii(mimic-ii): a public-access intensive care unit database,” Critical care medicine, vol. 39, no. 5,p. 952, 2011.
[98] U. Rubins, “Finger and ear photoplethysmogram waveform analysis by fitting with gaussians,”Medical & biological engineering & computing, vol. 46, no. 12, pp. 1271–1276, 2008.
71

[99] H.-T. Wu, C.-H. Lee, A.-B. Liu, W.-S. Chung, C.-J. Tang, C.-K. Sun, and H.-K. Yip, “Arterialstiffness using radial arterial waveforms measured at the wrist as an indicator of diabetic controlin the elderly,” IEEE Transactions on Biomedical engineering, vol. 58, no. 2, pp. 243–252, 2011.
[100] G. Angius, D. Barcellona, E. Cauli, L. Meloni, and L. Raffo, “Myocardial infarction and an-tiphospholipid syndrome: a first study on finger ppg waveforms effects,” in 2012 Computing inCardiology. IEEE, 2012, pp. 517–520.
[101] R. Banerjee, R. Vempada, K. Mandana, A. D. Choudhury, and A. Pal, “Identifying coronaryartery disease from photoplethysmogram,” in Proceedings of the 2016 ACM International JointConference on Pervasive and Ubiquitous Computing: Adjunct. ACM, 2016, pp. 1084–1088.
72