Non-Invasive Detection of Respiration and Heart Rate with ... · Gender F F M M F F F F F M F...
11
sensors Article Non-Invasive Detection of Respiration and Heart Rate with a Vehicle Seat Sensor Grace Wusk * and Hampton Gabler ID Department of Biomedical Engineering and Mechanics, Virginia Tech, 325 Stanger Street, Blacksburg, VA 24061, USA; [email protected] * Correspondence: [email protected] Received: 20 March 2018; Accepted: 5 May 2018; Published: 8 May 2018 Abstract: This study demonstrates the feasibility of using a seat sensor designed for occupant classification from a production passenger vehicle to measure an occupant’s respiration rate (RR) and heart rate (HR) in a laboratory setting. Relaying occupant vital signs after a crash could improve emergency response by adding a direct measure of the occupant state to an Advanced Automatic Collision Notification (AACN) system. Data was collected from eleven participants with body weights ranging from 42 to 91 kg using a Ford Mustang passenger seat and seat sensor. Using a ballistocardiography (BCG) approach, the data was processed by time domain filtering and frequency domain analysis using the fast Fourier transform to yield RR and HR in a 1-min sliding window. Resting rates over the 30-min data collection and continuous RR and HR signals were compared to laboratory physiological instruments using the Bland-Altman approach. Differences between the seat sensor and reference sensor were within 5 breaths per minute for resting RR and within 15 beats per minute for resting HR. The time series comparisons for RR and HR were promising with the frequency analysis technique outperforming the peak detection technique. However, future work is necessary for more accurate and reliable real-time monitoring of RR and HR outside the laboratory setting. Keywords: advanced automatic collision notifications; seat sensor; respiration rate; heart rate; ballistocardiography 1. Introduction Advanced Automatic Collision Notification (AACN) systems have great potential for reducing mortality risk in car crashes. AACN systems however, rely exclusively on vehicle-based measures of crash severity from which occupant crash response can only be estimated [1–4]. Non-invasive physiological monitoring of an occupant could prove extremely valuable in improving occupant safety for post-crash emergency response. Relaying vital signs of the occupants after a crash to the first responders, prior to arrival at the crash scene, could help prepare the appropriate response for transport as well as medical triage. Injury predictions could also better prepare emergency room doctors for treatment of incoming crash victims. The purpose of this study was to assess the feasibility of seat sensors in production passenger vehicles to not only classify an occupant according to weight, but to also monitor occupant respiration rate (RR) and heart rate (HR). We arrived at the proposed physiological monitoring technique after assessing a number of requirements. First, the system must be low cost for any practical application. Second, the sensor must be non-invasive and require no additional calibration or effort from the occupant. Ideally, as Weiser explains, a ubiquitous system should disappear into the background and be indistinguishable and fundamentally integrated into everyday life [5]. Third, the sensor must be able to physiologically Sensors 2018, 18, 1463; doi:10.3390/s18051463 www.mdpi.com/journal/sensors
Transcript of Non-Invasive Detection of Respiration and Heart Rate with ... · Gender F F M M F F F F F M F...

sensors
Article
Non-Invasive Detection of Respiration and HeartRate with a Vehicle Seat Sensor
Grace Wusk * and Hampton Gabler ID
Department of Biomedical Engineering and Mechanics, Virginia Tech, 325 Stanger Street, Blacksburg, VA 24061,USA; [email protected]* Correspondence: [email protected]
Received: 20 March 2018; Accepted: 5 May 2018; Published: 8 May 2018�����������������
Abstract: This study demonstrates the feasibility of using a seat sensor designed for occupantclassification from a production passenger vehicle to measure an occupant’s respiration rate (RR) andheart rate (HR) in a laboratory setting. Relaying occupant vital signs after a crash could improveemergency response by adding a direct measure of the occupant state to an Advanced AutomaticCollision Notification (AACN) system. Data was collected from eleven participants with bodyweights ranging from 42 to 91 kg using a Ford Mustang passenger seat and seat sensor. Using aballistocardiography (BCG) approach, the data was processed by time domain filtering and frequencydomain analysis using the fast Fourier transform to yield RR and HR in a 1-min sliding window.Resting rates over the 30-min data collection and continuous RR and HR signals were comparedto laboratory physiological instruments using the Bland-Altman approach. Differences betweenthe seat sensor and reference sensor were within 5 breaths per minute for resting RR and within15 beats per minute for resting HR. The time series comparisons for RR and HR were promisingwith the frequency analysis technique outperforming the peak detection technique. However, futurework is necessary for more accurate and reliable real-time monitoring of RR and HR outside thelaboratory setting.
Keywords: advanced automatic collision notifications; seat sensor; respiration rate; heartrate; ballistocardiography
1. Introduction
Advanced Automatic Collision Notification (AACN) systems have great potential for reducingmortality risk in car crashes. AACN systems however, rely exclusively on vehicle-based measuresof crash severity from which occupant crash response can only be estimated [1–4]. Non-invasivephysiological monitoring of an occupant could prove extremely valuable in improving occupantsafety for post-crash emergency response. Relaying vital signs of the occupants after a crash to thefirst responders, prior to arrival at the crash scene, could help prepare the appropriate response fortransport as well as medical triage. Injury predictions could also better prepare emergency roomdoctors for treatment of incoming crash victims. The purpose of this study was to assess the feasibilityof seat sensors in production passenger vehicles to not only classify an occupant according to weight,but to also monitor occupant respiration rate (RR) and heart rate (HR).
We arrived at the proposed physiological monitoring technique after assessing a number ofrequirements. First, the system must be low cost for any practical application. Second, the sensormust be non-invasive and require no additional calibration or effort from the occupant. Ideally, asWeiser explains, a ubiquitous system should disappear into the background and be indistinguishableand fundamentally integrated into everyday life [5]. Third, the sensor must be able to physiologically
Sensors 2018, 18, 1463; doi:10.3390/s18051463 www.mdpi.com/journal/sensors

Sensors 2018, 18, 1463 2 of 11
monitor individuals with various weights and resting rates. Finally, the sensor must work in both lightand dark, day and night, as long as the vehicle is in use.
There are a variety of off-body sensing techniques that can be used to detect RR and HR. A paststudy integrated three sensing systems into driver and passenger car seats to detect vital signs in astationary and moving vehicle. The measurement techniques included capacitive electrocardiogram(ECG) monitoring, mechanical movement analysis, and inductive impedance monitoring, none ofwhich require electroconductive contact to the human body [6]. For the capacitive ECG and inductiveimpedance monitoring, electrodes and coils were integrated into the backrests of car seats. The lasttechnique used a quasi-piezoelectric force transducer to measure small body movements through theseat. The mechanical aspects of heart activity through blood movement can be measured througha technique referred to as ballistocardiography (BCG) [7,8]. This technique can also be applied tolarger body movements such as breathing. Approaches using electromechanical film sensors andaccelerometers have been tested for displacement and acceleration derived BCG, respectively, inmoving systems such as a wheelchair [9]. Separating motion vibrations from the small cardiacmovements is a challenge. However, adaptive cancellation of vibrations may help improve BCGsignals [10]. For electromechanical films, sensitivity of the pressure sensors may also depend on thestatic load and the distribution of weight while sitting [11]. For example, weight may shift between thefeet, arms, back, and behind while sitting, which would affect the BCG signal. Wearable BCG systemshave also been explored and may benefit from a multi-sensor system to separate useful informationfrom the noise of normal ambulation [12]. Using various pressure sensors to detect slight fluctuationsin body movements, from breathing or pulsing, is also common in sleep tracking technologies [13,14].Other sensors on the market, such as the Plessey Electric Potential Integrated Circuit (EPIC) sensor,have been tested in contact and non-contact modes to measure bio-electric signals and movement fromdisruptions in electric fields. These integrated sensors have been used to monitor respiration and heartrates and may be suitable for automotive applications [15]. Low-power radar sensors have also beenproposed for contactless heart and lung monitoring [16]. Finally, extraction of occupant vital signs maybe performed through video image processing [17,18]. However, the image processing techniques, aswell as the other non-contact sensing methods discussed, would require the installation of additionalhardware into a vehicle.
In contrast, the proposed technique utilizes seat sensors that automakers have manufacturedand integrated for years into vehicles with advanced airbags. Advanced passenger airbag systemsrequire automakers to install occupant-sensing systems, such as seat sensors, to classify occupants [19].These occupant classification systems may take the form of pressure-sensing mats or bladders underthe seat cushions or as weight strain gauges integrated into the seat tracks. Using a BCG approach,we hypothesize that a vehicle seat sensor can detect RR and HR, offering a non-invasive approach tomonitor occupants after a crash and to better predict injury severity. The proposed solution meetsour criteria for a ubiquitous physiological monitoring technique to inform post-crash response andcomplement AACN vehicle-based information, while leveraging existing technology.
2. Materials and Methods
The seat sensor used in this study was retrieved from a Ford Mustang front passenger seat andconnected to a cDAQ-9172 data acquisition system (National Instruments, Austin, TX, USA). Thesensor consists of a fluid filled bladder connected to a solid-state pressure transducer. Benchmarkrespiration and pulse measurements were collected with the Neulog Respiration Monitor Belt LoggerSensor and the Neulog Heart Rate and Pulse Logger Sensor (Neulog, Rochester, NY, USA). All of thedata were sampled at 10 Hz. A Nyquist frequency of 10 Hz would be sufficient for a maximum signalfrequency of 5 Hz, or 300 beats per minute. The seat and seat sensor used in the study are shown inFigure 1. The protocol was approved by the Virginia Tech Institutional Review Board (IRB) #17-018.Data samples were collected from eleven participants, three male and eight females. All participantswere over the age of 18. Self-reported body weights ranged from 42 to 91 kg as shown in Table 1.

Sensors 2018, 18, 1463 3 of 11
Each participant sat on the seat for 30 min while seat sensor data and reference data were collected.During data collection, the seat sensor was placed under the foam cushion of the seat, as it would bein a vehicle.
Sensors 2018, 18, x FOR PEER REVIEW 3 of 11
Table 1. Participants.
P1 P2 P3 P4 P5 P6 P7 P8 P9 P10 P11 Gender F F M M F F F F F M F
Weight (kg) 64 54 82 82 68 55 79 91 42 76 68
Figure 1. Ford Mustang front passenger seat and seat sensor.
2.1. Respiration Rate (RR)
To extract the RR, the raw voltage output signal from the seat sensor was first filtered using a fourth-order Butterworth band-pass filter with cutoff frequencies of 0.16 Hz and 0.66 Hz. The cutoff frequencies were derived from physiological bounds of respiration rate, with normal resting RR for an adult ranging from 10 to 40 breaths per minute (brpm). We targeted no more than a 10% difference between the seat sensor RR and the Neulog RR, using the upper range of RR. This defines a target difference of 4-brpm for RR.
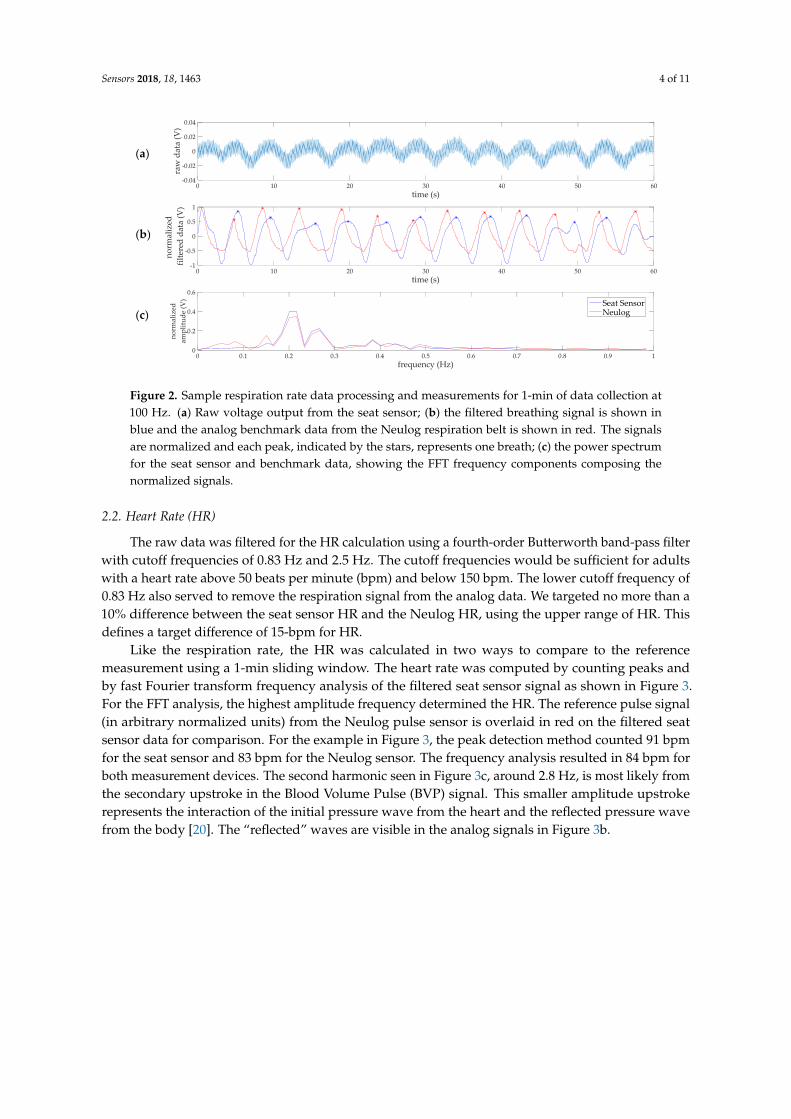
Next, two methods were explored to calculate the brpm over time using the filtered respiration data. The data was processed within a 1-min sliding window for the 30 min of data collection per participant. The first technique was to count the peaks in the analog signal and convert to brpm. Peak detection was performed in MATLAB. Only peaks with a peak prominence of at least 90% of the average peak prominence for the 1-min windowed signal were included in the count. This thresholding strategy helped objectively ignore small fluctuations in the filtered signals. The second technique was to quantify the frequency content of the pressure signal using the fast Fourier transform (FFT) and compute RR based on the highest amplitude frequency from the respiration filtered data. Example data sampled at 100 Hz is shown in Figure 2 to illustrate the steps involved in data processing. The reference respiration signal (in arbitrary normalized units) from the Neulog respiration belt is overlaid in red on the filtered seat sensor data for comparison. For the example data in Figure 2 using the peak detection technique, the RR is 11 brpm and 12 brpm for the seat sensor and Neulog sensor, respectively. Using frequency analysis, the rate is 13 brpm for both measurement devices.
Figure 1. Ford Mustang front passenger seat and seat sensor.
Table 1. Participants.
P1 P2 P3 P4 P5 P6 P7 P8 P9 P10 P11
Gender F F M M F F F F F M FWeight (kg) 64 54 82 82 68 55 79 91 42 76 68
2.1. Respiration Rate (RR)
To extract the RR, the raw voltage output signal from the seat sensor was first filtered using afourth-order Butterworth band-pass filter with cutoff frequencies of 0.16 Hz and 0.66 Hz. The cutofffrequencies were derived from physiological bounds of respiration rate, with normal resting RR for anadult ranging from 10 to 40 breaths per minute (brpm). We targeted no more than a 10% differencebetween the seat sensor RR and the Neulog RR, using the upper range of RR. This defines a targetdifference of 4-brpm for RR.
Next, two methods were explored to calculate the brpm over time using the filtered respirationdata. The data was processed within a 1-min sliding window for the 30 min of data collection perparticipant. The first technique was to count the peaks in the analog signal and convert to brpm. Peakdetection was performed in MATLAB. Only peaks with a peak prominence of at least 90% of theaverage peak prominence for the 1-min windowed signal were included in the count. This thresholdingstrategy helped objectively ignore small fluctuations in the filtered signals. The second technique wasto quantify the frequency content of the pressure signal using the fast Fourier transform (FFT) andcompute RR based on the highest amplitude frequency from the respiration filtered data. Exampledata sampled at 100 Hz is shown in Figure 2 to illustrate the steps involved in data processing. Thereference respiration signal (in arbitrary normalized units) from the Neulog respiration belt is overlaidin red on the filtered seat sensor data for comparison. For the example data in Figure 2 using the peakdetection technique, the RR is 11 brpm and 12 brpm for the seat sensor and Neulog sensor, respectively.Using frequency analysis, the rate is 13 brpm for both measurement devices.
Sensors 2018, 18, 1463 4 of 11Sensors 2018, 18, x FOR PEER REVIEW 4 of 11
Figure 2. Sample respiration rate data processing and measurements for 1‐min of data collection at
100 Hz. (a) Raw voltage output from the seat sensor; (b) the filtered breathing signal is shown in blue
and the analog benchmark data from the Neulog respiration belt is shown in red. The signals are
normalized and each peak, indicated by the stars, represents one breath; (c) the power spectrum for the
seat sensor and benchmark data, showing the FFT frequency components composing the normalized
signals.
2.2. Heart Rate (HR)
The raw data was filtered for the HR calculation using a fourth‐order Butterworth band‐pass
filter with cutoff frequencies of 0.83 Hz and 2.5 Hz. The cutoff frequencies would be sufficient for
adults with a heart rate above 50 beats per minute (bpm) and below 150 bpm. The lower cutoff
frequency of 0.83 Hz also served to remove the respiration signal from the analog data. We targeted
no more than a 10% difference between the seat sensor HR and the Neulog HR, using the upper range
of HR. This defines a target difference of 15‐bpm for HR.
Like the respiration rate, the HR was calculated in two ways to compare to the reference
measurement using a 1‐min sliding window. The heart rate was computed by counting peaks and by
fast Fourier transform frequency analysis of the filtered seat sensor signal as shown in Figure 3. For
the FFT analysis, the highest amplitude frequency determined the HR. The reference pulse signal (in
arbitrary normalized units) from the Neulog pulse sensor is overlaid in red on the filtered seat sensor
data for comparison. For the example in Figure 3, the peak detection method counted 91 bpm for the
seat sensor and 83 bpm for the Neulog sensor. The frequency analysis resulted in 84 bpm for both
measurement devices. The second harmonic seen in Figure 3c, around 2.8 Hz, is most likely from the
secondary upstroke in the Blood Volume Pulse (BVP) signal. This smaller amplitude upstroke
represents the interaction of the initial pressure wave from the heart and the reflected pressure wave
from the body [20]. The “reflected” waves are visible in the analog signals in Figure 3b.
Data was collected for 30 min for each of the eleven participants. Each second, the previous 60 s
of analog data, such as the raw data shown in Figure 2a and Figure 3a, was processed using the peak
detection and FFT frequency analysis techniques to yield a RR and a HR for that time point. Data
points for every second provided high temporal resolution and the 1‐min sliding window provided
sufficient time for the FFT frequency analysis. The respiration and heart rate time courses from the
seat sensor were compared to the reference measurements. For this study, reference RR was
calculated from the Neulog analog signal using the corresponding technique (peak detection or
frequency analysis) whereas reference HR was directly output from the Neulog device in bpm. The
Neulog device was not able to output the RR in brpm. The participants sat and relaxed during the 30
min of data collection, therefore, the mean RR and HR over the 30 min were considered the
participants’ resting rates. Bland‐Altman plots were used to compare the resting RR and resting HR
0 10 20 30 40 50 60
time (s)
‐0.04
‐0.02
0
0.02
0.04
raw data (V)
0 10 20 30 40 50 60
time (s)
‐1
‐0.5
0
0.5
1
norm
alized
filtered data (V)
0 0.1 0.2 0.3 0.4 0.5 0.6 0.7 0.8 0.9 1
frequency (Hz)
0
0.2
0.4
0.6
norm
alized
amplitude (V)
Seat SensorNeulog
(a)
(b)
(c)
Figure 2. Sample respiration rate data processing and measurements for 1-min of data collection at100 Hz. (a) Raw voltage output from the seat sensor; (b) the filtered breathing signal is shown inblue and the analog benchmark data from the Neulog respiration belt is shown in red. The signalsare normalized and each peak, indicated by the stars, represents one breath; (c) the power spectrumfor the seat sensor and benchmark data, showing the FFT frequency components composing thenormalized signals.
2.2. Heart Rate (HR)
The raw data was filtered for the HR calculation using a fourth-order Butterworth band-pass filterwith cutoff frequencies of 0.83 Hz and 2.5 Hz. The cutoff frequencies would be sufficient for adultswith a heart rate above 50 beats per minute (bpm) and below 150 bpm. The lower cutoff frequency of0.83 Hz also served to remove the respiration signal from the analog data. We targeted no more than a10% difference between the seat sensor HR and the Neulog HR, using the upper range of HR. Thisdefines a target difference of 15-bpm for HR.
Like the respiration rate, the HR was calculated in two ways to compare to the referencemeasurement using a 1-min sliding window. The heart rate was computed by counting peaks andby fast Fourier transform frequency analysis of the filtered seat sensor signal as shown in Figure 3.For the FFT analysis, the highest amplitude frequency determined the HR. The reference pulse signal(in arbitrary normalized units) from the Neulog pulse sensor is overlaid in red on the filtered seatsensor data for comparison. For the example in Figure 3, the peak detection method counted 91 bpmfor the seat sensor and 83 bpm for the Neulog sensor. The frequency analysis resulted in 84 bpm forboth measurement devices. The second harmonic seen in Figure 3c, around 2.8 Hz, is most likely fromthe secondary upstroke in the Blood Volume Pulse (BVP) signal. This smaller amplitude upstrokerepresents the interaction of the initial pressure wave from the heart and the reflected pressure wavefrom the body [20]. The “reflected” waves are visible in the analog signals in Figure 3b.

Sensors 2018, 18, 1463 5 of 11
Sensors 2018, 18, x FOR PEER REVIEW 5 of 11
from the two measurement devices. Bland‐Altman plots show the relationship between inter‐device
recording differences and are a common method of measurement comparison for continuous
variables [21,22]. As shown in a past study comparing Jawbone and Fitbit fitness tracking devices,
the Bland‐Altman plots typically show the differences between devices over mean values [23]. Simple
linear regression models were run in R, regressing the seat sensor resting rates on the reference
Neulog resting rates, to calculate RMSE and R2 values.
Figure 3. Sample heart rate data processing and measurements for 1‐min of data collection at 100 Hz.
(a) Raw voltage output from the seat sensor; (b) the filtered pulse signal is shown in blue and the
analog benchmark data from the Neulog pulse monitor is shown in red. The signals are normalized
and each peak, indicated by the stars, represents one breath; (c) the power spectrum for the seat sensor
and benchmark data, showing the FFT frequency components composing the normalized signals.
The RR and HR measures from the two devices were also compared at each individual time
point to evaluate the seat sensor performance at a higher resolution of time. To assess the reliability
of the measurements over the range of occupant weights and resting RR and HR, the data was
visualized with Bland‐Altman style plots. Ideally, the differences between seat sensor readings and
the reference readings are not only minimal, but also independent of body weight and resting rate.
The measurement differences (Neulog values subtracted from seat sensor values) were plotted
against participant weight and resting rates. Using the pooled differences from all participants and
time points, the mean and standard deviation (SD) of the differences were calculated for both
methods, peak detection (Peaks) and frequency analysis (FFT), for RR and HR. Levels of agreement
were calculated for the differences using a 95% confidence interval (CI). In comparison to the models
using resting rates, simple linear regression models were also created using the RR and HR time
series data to calculate RMSE and R2 values.
3. Results
Figure 4 shows example RR and HR time courses from the frequency analysis data processing
technique. While the RR and HR calculated from the seat sensor fluctuate more than the reference
rates, they generally agree with the expected values. In Figure 4, there is a decrease in RR around
1000 s, which the seat sensor is able to detect.
The boxplots in Figure 5 summarize the data across all eleven participants, showing larger
spread in the seat sensor results but comparable means over the 30 min. Only results from the
frequency analysis are shown. The mean RR and HR over the 30 min were considered the
participants’ resting rates. The resting rates for the eleven participants are listed in Table 2 and
correspond with the boxplots in Figure 5. The differences between the seat sensor and Neulog for
resting RR were below our 4‐brpm target for 10 of the 11 participants as shown in Table 2. For resting
0 10 20 30 40 50 60
time (s)
‐0.04
‐0.02
0
0.02
0.04
raw data (V)
0 10 20 30 40 50 60
time (s)
‐0.5
0
0.5
1
norm
alized
filtered data (V)
0 0.5 1 1.5 2 2.5 3 3.5 4 4.5 5
frequency (Hz)
0
0.05
0.1
0.15
norm
alized
amplitude (V)
Seat SensorNeulog
(a)
(b)
(c)
Figure 3. Sample heart rate data processing and measurements for 1-min of data collection at 100 Hz.(a) Raw voltage output from the seat sensor; (b) the filtered pulse signal is shown in blue and theanalog benchmark data from the Neulog pulse monitor is shown in red. The signals are normalizedand each peak, indicated by the stars, represents one breath; (c) the power spectrum for the seat sensorand benchmark data, showing the FFT frequency components composing the normalized signals.
Data was collected for 30 min for each of the eleven participants. Each second, the previous60 s of analog data, such as the raw data shown in Figures 2a and 3a, was processed using the peakdetection and FFT frequency analysis techniques to yield a RR and a HR for that time point. Datapoints for every second provided high temporal resolution and the 1-min sliding window providedsufficient time for the FFT frequency analysis. The respiration and heart rate time courses from the seatsensor were compared to the reference measurements. For this study, reference RR was calculated fromthe Neulog analog signal using the corresponding technique (peak detection or frequency analysis)whereas reference HR was directly output from the Neulog device in bpm. The Neulog device was notable to output the RR in brpm. The participants sat and relaxed during the 30 min of data collection,therefore, the mean RR and HR over the 30 min were considered the participants’ resting rates.Bland-Altman plots were used to compare the resting RR and resting HR from the two measurementdevices. Bland-Altman plots show the relationship between inter-device recording differences and area common method of measurement comparison for continuous variables [21,22]. As shown in a paststudy comparing Jawbone and Fitbit fitness tracking devices, the Bland-Altman plots typically showthe differences between devices over mean values [23]. Simple linear regression models were run in R,regressing the seat sensor resting rates on the reference Neulog resting rates, to calculate RMSE andR2 values.
The RR and HR measures from the two devices were also compared at each individual time pointto evaluate the seat sensor performance at a higher resolution of time. To assess the reliability of themeasurements over the range of occupant weights and resting RR and HR, the data was visualizedwith Bland-Altman style plots. Ideally, the differences between seat sensor readings and the referencereadings are not only minimal, but also independent of body weight and resting rate. The measurementdifferences (Neulog values subtracted from seat sensor values) were plotted against participant weightand resting rates. Using the pooled differences from all participants and time points, the mean andstandard deviation (SD) of the differences were calculated for both methods, peak detection (Peaks)and frequency analysis (FFT), for RR and HR. Levels of agreement were calculated for the differencesusing a 95% confidence interval (CI). In comparison to the models using resting rates, simple linearregression models were also created using the RR and HR time series data to calculate RMSE andR2 values.

Sensors 2018, 18, 1463 6 of 11
3. Results
Figure 4 shows example RR and HR time courses from the frequency analysis data processingtechnique. While the RR and HR calculated from the seat sensor fluctuate more than the referencerates, they generally agree with the expected values. In Figure 4, there is a decrease in RR around1000 s, which the seat sensor is able to detect.
Sensors 2018, 18, x FOR PEER REVIEW 6 of 11
HR, the differences for all the participants were less than our 15‐bpm target as shown in Table 2. The
Bland‐Altman plots for resting RR and resting HR are shown in Figure 6. The plots show descending
trends in the resting RR and HR differences which were tested by fitting lines to the data. The slope
of the fitted line for RR was −0.57 (p = 0.0111) with R2 = 0.53. For HR the slope was −1.16 (p = 0.0039)
with R2 = 0.62. These significant slopes indicate a systematic error, with positive differences for lower
average values and negative differences for higher average values as shown in Figure 6. Regressing
the resting RR from the seat sensor FFT on the resting RR from the Neulog resulted in a RMSE of 1.6
and a R2 of 0.72. Regressing the resting HR from the seat sensor FFT on the resting HR from the
Neulog resulted in a RMSE of 8.4 and a R2 of 0.21.
(a) (b)
Figure 4. Example data from Participant 2 (P2). The respiration (a) and heart (b) rate time courses
from the seat sensor using the frequency analysis (FFT) technique.
(a) (b)
Figure 5. Boxplots of respiration (a) and heart (b) rates derived from the frequency analysis technique
for all eleven participants over 30‐min data collection.
Table 2. Resting RR and HR Derived from Seat and Neulog Sensors for Eleven Participants
P1 P2 P3 P4 P5 P6 P7 P8 P9 P10 P11
RR
Seat (brpm) 17 17 15 18 16 13 18 18 14 15 17
Neulog (brpm) 22 18 15 18 16 12 20 18 15 14 20
Difference (brpm) −5 −1 0 0 0 1 −2 0 −1 1 −3
HR
Seat (bpm) 71 73 67 65 67 69 71 72 76 75 70
Neulog (bpm) 76 64 58 71 57 66 76 86 79 71 77
Difference (bpm) −5 9 9 −6 10 3 −5 −14 −3 4 −7
Figure 4. Example data from Participant 2 (P2). The respiration (a) and heart (b) rate time courses fromthe seat sensor using the frequency analysis (FFT) technique.
The boxplots in Figure 5 summarize the data across all eleven participants, showing larger spreadin the seat sensor results but comparable means over the 30 min. Only results from the frequencyanalysis are shown. The mean RR and HR over the 30 min were considered the participants’ restingrates. The resting rates for the eleven participants are listed in Table 2 and correspond with the boxplotsin Figure 5. The differences between the seat sensor and Neulog for resting RR were below our 4-brpmtarget for 10 of the 11 participants as shown in Table 2. For resting HR, the differences for all theparticipants were less than our 15-bpm target as shown in Table 2. The Bland-Altman plots for restingRR and resting HR are shown in Figure 6. The plots show descending trends in the resting RR and HRdifferences which were tested by fitting lines to the data. The slope of the fitted line for RR was −0.57(p = 0.0111) with R2 = 0.53. For HR the slope was −1.16 (p = 0.0039) with R2 = 0.62. These significantslopes indicate a systematic error, with positive differences for lower average values and negativedifferences for higher average values as shown in Figure 6. Regressing the resting RR from the seatsensor FFT on the resting RR from the Neulog resulted in a RMSE of 1.6 and a R2 of 0.72. Regressingthe resting HR from the seat sensor FFT on the resting HR from the Neulog resulted in a RMSE of 8.4and a R2 of 0.21.
Sensors 2018, 18, x FOR PEER REVIEW 6 of 11
HR, the differences for all the participants were less than our 15‐bpm target as shown in Table 2. The
Bland‐Altman plots for resting RR and resting HR are shown in Figure 6. The plots show descending
trends in the resting RR and HR differences which were tested by fitting lines to the data. The slope
of the fitted line for RR was −0.57 (p = 0.0111) with R2 = 0.53. For HR the slope was −1.16 (p = 0.0039)
with R2 = 0.62. These significant slopes indicate a systematic error, with positive differences for lower
average values and negative differences for higher average values as shown in Figure 6. Regressing
the resting RR from the seat sensor FFT on the resting RR from the Neulog resulted in a RMSE of 1.6
and a R2 of 0.72. Regressing the resting HR from the seat sensor FFT on the resting HR from the
Neulog resulted in a RMSE of 8.4 and a R2 of 0.21.
(a) (b)
Figure 4. Example data from Participant 2 (P2). The respiration (a) and heart (b) rate time courses
from the seat sensor using the frequency analysis (FFT) technique.
(a) (b)
Figure 5. Boxplots of respiration (a) and heart (b) rates derived from the frequency analysis technique
for all eleven participants over 30‐min data collection.
Table 2. Resting RR and HR Derived from Seat and Neulog Sensors for Eleven Participants
P1 P2 P3 P4 P5 P6 P7 P8 P9 P10 P11
RR
Seat (brpm) 17 17 15 18 16 13 18 18 14 15 17
Neulog (brpm) 22 18 15 18 16 12 20 18 15 14 20
Difference (brpm) −5 −1 0 0 0 1 −2 0 −1 1 −3
HR
Seat (bpm) 71 73 67 65 67 69 71 72 76 75 70
Neulog (bpm) 76 64 58 71 57 66 76 86 79 71 77
Difference (bpm) −5 9 9 −6 10 3 −5 −14 −3 4 −7
Figure 5. Boxplots of respiration (a) and heart (b) rates derived from the frequency analysis techniquefor all eleven participants over 30-min data collection.

Sensors 2018, 18, 1463 7 of 11
Table 2. Resting RR and HR Derived from Seat and Neulog Sensors for Eleven Participants
P1 P2 P3 P4 P5 P6 P7 P8 P9 P10 P11
RRSeat (brpm) 17 17 15 18 16 13 18 18 14 15 17
Neulog (brpm) 22 18 15 18 16 12 20 18 15 14 20Difference (brpm) −5 −1 0 0 0 1 −2 0 −1 1 −3
HRSeat (bpm) 71 73 67 65 67 69 71 72 76 75 70
Neulog (bpm) 76 64 58 71 57 66 76 86 79 71 77Difference (bpm) −5 9 9 −6 10 3 −5 −14 −3 4 −7Sensors 2018, 18, x FOR PEER REVIEW 7 of 11
(a) (b)
Figure 6. Bland‐Altman plots for resting RR (a) and resting HR (b). Difference between seat sensor
and Neulog over the average of the two measures. Solid black line shows mean differences and
dashed blue lines show 1.96 standard deviation bounds.
The Bland‐Altman style plots in Figure 7 show the differences between the measurement devices
across participant weight and resting rates for all time points, pooled from all participants. Each
participant trial consisted of 1741 data points, RR and HR calculated every second from time 1 min
to 30 min. The size and color of the points represent the number of data points in a single location to
illustrate the high density of points around the 0‐difference line. The differences are relatively
consistent across body weight and resting rates for RR and HR. Summary statistics for the differences
between the measurement devices and the simple linear regression models for all data points are
provided in Table 3. As shown in Table 3, the frequency analysis technique resulted in lower
difference means, or bias, but higher difference standard deviations. Interpreting the confidence
interval, we expect the difference in respiration rate between the seat sensor and the Neulog
(reference) sensor to be between −7.5 brpm and 5.7 brpm for 95% of future FFT measurements. These
values exceed our target value of a 4‐brpm difference between seat sensor RR and Neulog RR,
however the results are improved by averaging measurements over time. The bias, or difference
mean, for RR with the seat sensor was less than one brpm over the entire 30‐min period. For heart
rate, 1.96 standard deviations on either side of the mean results in a difference range of −39 bpm and
38 bpm, which is greater than our 15‐bpm target. Averaging measurements over time improves
results as the overall bias of the seat sensor for HR with FFT was less than one beat per minute for
the 30‐min data collection.
The Root Mean Square Error (RMSE) values indicate the absolute fit of the linear model, with
the stipulation that the model slope may not be exactly one. The benefit of RMSE is that the values
are in the appropriate units. In this case, 2.8 brpm and 9.9 bpm of variation in the model may be
acceptable. The small R2 values express the variability of the seat sensor RR and HR when computed
every second using a 1‐min sliding window. While we see a high density of data points on the
0‐difference line in the plots in Figure 7, there are a number of outliers, especially for the heart rate
data. However, when deciding whether the seat sensor RR and HR values are sufficiently close and
therefore suitable predictors of the Neulog values, it is important to remember than R2 is a relative
measure of fit.
Table 3. Summary Statistics for the Peak Detection and Frequency Analysis Techniques for RR and
HR using all Time Points across all Participants.
Signal Units Analysis
Method
Difference
Mean
Difference
SD
Difference 95%
CI RMSE R2
RR brpm Peaks −2.5 2.9 (−8.3; 3.3) 2.5 0.16
FFT −0.91 3.3 (−7.5; 5.7) 2.8 0.22
HR bpm Peaks −23 13 (−48; 2.9) 9.9 0.0019
FFT −0.50 19 (−39; 38) 9.9 0.0043
Figure 6. Bland-Altman plots for resting RR (a) and resting HR (b). Difference between seat sensor andNeulog over the average of the two measures. Solid black line shows mean differences and dashedblue lines show 1.96 standard deviation bounds.
The Bland-Altman style plots in Figure 7 show the differences between the measurement devicesacross participant weight and resting rates for all time points, pooled from all participants. Eachparticipant trial consisted of 1741 data points, RR and HR calculated every second from time 1 minto 30 min. The size and color of the points represent the number of data points in a single locationto illustrate the high density of points around the 0-difference line. The differences are relativelyconsistent across body weight and resting rates for RR and HR. Summary statistics for the differencesbetween the measurement devices and the simple linear regression models for all data points areprovided in Table 3. As shown in Table 3, the frequency analysis technique resulted in lower differencemeans, or bias, but higher difference standard deviations. Interpreting the confidence interval, weexpect the difference in respiration rate between the seat sensor and the Neulog (reference) sensor tobe between −7.5 brpm and 5.7 brpm for 95% of future FFT measurements. These values exceed ourtarget value of a 4-brpm difference between seat sensor RR and Neulog RR, however the results areimproved by averaging measurements over time. The bias, or difference mean, for RR with the seatsensor was less than one brpm over the entire 30-min period. For heart rate, 1.96 standard deviationson either side of the mean results in a difference range of −39 bpm and 38 bpm, which is greater thanour 15-bpm target. Averaging measurements over time improves results as the overall bias of the seatsensor for HR with FFT was less than one beat per minute for the 30-min data collection.

Sensors 2018, 18, 1463 8 of 11
Sensors 2018, 18, x FOR PEER REVIEW 7 of 11
The Bland-Altman style plots in Figure 7 show the differences between the measurement devices across participant weight and resting rates for all time points, pooled from all participants. Each participant trial consisted of 1741 data points, RR and HR calculated every second from time 1 min to 30 min. The size and color of the points represent the number of data points in a single location to illustrate the high density of points around the 0-difference line. The differences are relatively consistent across body weight and resting rates for RR and HR. Summary statistics for the differences between the measurement devices and the simple linear regression models for all data points are provided in Table 3. As shown in Table 3, the frequency analysis technique resulted in lower difference means, or bias, but higher difference standard deviations. Interpreting the confidence interval, we expect the difference in respiration rate between the seat sensor and the Neulog (reference) sensor to be between −7.5 brpm and 5.7 brpm for 95% of future FFT measurements. These values exceed our target value of a 4-brpm difference between seat sensor RR and Neulog RR, however the results are improved by averaging measurements over time. The bias, or difference mean, for RR with the seat sensor was less than one brpm over the entire 30-minute period. For heart rate, 1.96 standard deviations on either side of the mean results in a difference range of −39 bpm and 38 bpm, which is greater than our 15-bpm target. Averaging measurements over time improves results as the overall bias of the seat sensor for HR with FFT was less than one beat per minute for the 30-minute data collection.
(a) (b)
(c) (d)
Figure 7. Bland-Altman plots to show reliability over weight (a) and (b) and over resting rates derived from the mean values over 30 min (c) and (d). Each data point represents the difference between the RR or HR calculated from the seat sensor compared to the Neulog for every time point and every participant. The size and color represent the density of overlapping points.
The Root Mean Square Error (RMSE) values indicate the absolute fit of the linear model, with the stipulation that the model slope may not be exactly one. The benefit of RMSE is that the values are in the appropriate units. In this case, 2.8 brpm and 9.9 bpm of variation in the model may be acceptable. The small R2 values express the variability of the seat sensor RR and HR when computed every second using a 1-minute sliding window. While we see a high density of data points on the 0-difference line in the plots in Figure 7, there are a number of outliers, especially for the heart rate data. However, when deciding whether the seat sensor RR and HR values are sufficiently close and
Figure 7. Bland-Altman plots to show reliability over weight (a) and (b) and over resting rates derivedfrom the mean values over 30 min (c) and (d). Each data point represents the difference between theRR or HR calculated from the seat sensor compared to the Neulog for every time point and everyparticipant. The size and color represent the density of overlapping points.
Table 3. Summary Statistics for the Peak Detection and Frequency Analysis Techniques for RR and HRusing all Time Points across all Participants.
Signal Units Analysis Method Difference Mean Difference SD Difference 95% CI RMSE R2
RR brpm Peaks −2.5 2.9 (−8.3; 3.3) 2.5 0.16FFT −0.91 3.3 (−7.5; 5.7) 2.8 0.22
HR bpm Peaks −23 13 (−48; 2.9) 9.9 0.0019FFT −0.50 19 (−39; 38) 9.9 0.0043
The Root Mean Square Error (RMSE) values indicate the absolute fit of the linear model, with thestipulation that the model slope may not be exactly one. The benefit of RMSE is that the values are inthe appropriate units. In this case, 2.8 brpm and 9.9 bpm of variation in the model may be acceptable.The small R2 values express the variability of the seat sensor RR and HR when computed every secondusing a 1-min sliding window. While we see a high density of data points on the 0-difference linein the plots in Figure 7, there are a number of outliers, especially for the heart rate data. However,when deciding whether the seat sensor RR and HR values are sufficiently close and therefore suitablepredictors of the Neulog values, it is important to remember than R2 is a relative measure of fit.
4. Discussion
Extracting RR and HR from an occupant classification system presents a challenge due to theattenuation of the signals traveling from the lungs and heart to the seat sensor. In addition, differencesin respiration and heart rate signal level, including frequency and amplitude, make the detection taskdifficult. The results of this study show the feasibility of using a production vehicle passenger seat

Sensors 2018, 18, 1463 9 of 11
sensor to measure physiological responses such as RR and HR for a variety of occupant weights andresting rates. The resting, or average, RR and HR values were comparable between the seat sensor andNeulog devices. Additional analysis was conducted to compare individual time points throughout the30-min data collection. The primary analysis used to assess continuous differences between the Neulogand seat sensor devices was the Bland-Altman approach. Linear regression and correlation statisticswere also reported, although they have been criticized for use in measurement comparison studies [22].As expected, the RMSE values were higher and R2 values were lower for the model with all the datapoints compared to the model with resting rates derived from 30 min of data. This suggests thataveraging the data over longer periods improves agreement with the reference values. Future work isneeded to improve temporal resolution of RR and HR detection for continuous, real-time applications.
In the future, enhancing the peak detection algorithms could improve the calculation of RRand HR from total analog peaks. Empirical testing of different prominence threshold values couldimprove peak detection. In this study, the data collection consisted of normal, resting state, sustainedbreathing, with minor exceptions as shown in Figure 4a, with a visible decrease in RR, perhaps becauseof drowsiness. While averaging values of RR and HR over a 30-min data collection is reasonable fora normal, resting state, an occupant’s physiology may change drastically in minutes. Our first goalwas to confirm that we could capture steady state response. Our follow-on goal will be to measuretransient response by assessing RR and HR every second using a 1-min period of data. Additionalwork is required to evaluate the accuracy of detecting transient responses. The size of the slidingwindow, currently 1 min, would be an interesting variable to test in future experimentation. The FFTfrequency analysis would benefit from a larger time window at the cost of delayed results.
Detecting more drastic and transient changes in the respiration and heart rate in a running vehiclewould be necessary for future applications of real-time monitoring during driving. Non-invasivemeasurement of occupant RR and HR could be useful for future work on psychophysiologicalclassification of driver’s state [24]. Complementary to vehicle-based assessment which uses vehicledata such as steering and speed variability to assess the driver; physiological monitoring couldprovide a direct measure of the driver state. Combining basic physiological measurements could helpautomatically detect driver physical impairment such as fatigue. However, this application wouldrequire seat weight sensors in the driver seats while the current U.S. regulatory requirement is forpassenger seats only. The ability to predict a driver’s state would be extremely beneficial in the designof future driver assistance systems and active safety technologies.
A major limitation of this study was the removal of the test seat and seat sensor from a vehicle.As shown in a previous study, an engaged engine and/or driving may lead to a low signal to noiseratio in a BCG signal from a seat sensor [6]. While movements and vibrations during driving couldaffect the detection of RR and HR, the goal of this study was to show feasibility and test the sensitivityof an occupant classification system from a production vehicle. Additionally, when consideringpost-crash response, a moving vehicle may not be a concern to an occupant-sensing system as thevehicle may be stopped. Another limitation was that testing did not include out-of-position occupants.The assumption is that the occupants are fully seated during sensing, which may imply seat beltuse and exclude cases such as rollover crashes in which the vehicle remains upside down post-crash.Depending on the injury and possible blood loss, tachycardia or bradycardia may be observed in anoccupant post-crash [25]. Abnormally high or low HR could approach the bounds of the current modelwith cutoffs at 50 bpm and 150 bpm. Likewise, RR is variable depending on injury. The current modelis designed to capture RR from 10 to 40 brpm. We also assumed the performance of the occupantclassification system would not be affected by a crash. The study could benefit from a larger and evenmore diverse dataset of human participants. Ideally, the seat sensor would be able to detect RR andHR in both a 5th percentile female, which would be around 50 kg, and a 95th percentile male, whichwould be around 125 kg, in the United States [26]. The participant pool used in this study covers thelower end of body weight requirements, but data from a participant heavier than 91 kg is lacking inthis study. Finally, while the Federal Motor Vehicle Safety Standard (FMVSS) Number 208 mandates

Sensors 2018, 18, 1463 10 of 11
that modern vehicles have an occupant classification system for advanced passenger airbag systems,every manufacturer’s technique and technology may be different [19]. To expand this study, it wouldbe valuable to test seat sensors from various vehicle makes and models.
5. Conclusions
This study provides promising results for using a seat sensor from a production passenger vehicleto measure occupant respiration and heart rate. Two calculations of RR and HR, peak detectionand frequency analysis, were compared to reference measurements. Differences between the seatsensor and Neulog sensor for resting RR and HR were mostly within our 4-brpm and 15-bpm targets,respectively. Ideally, the system would also be able to assess RR and HR over time. Comparing the seatsensor to the reference sensor for all time points, the frequency analysis technique resulted in a smallermean difference, or bias, than the peak detection technique. This data provides initial validation of thenon-invasive seat sensor in a laboratory setting. Future testing in a running vehicle is necessary forapplications of occupant monitoring. Non-obtrusive, direct measures of the occupant using hardwarealready installed in all modern vehicles could have a large impact on occupant vehicle safety, in termsof both post-crash emergency response and crash avoidance technologies.
Author Contributions: Conceptualization, G.W. and H.G.; Methodology, G.W. and H.G.; Software, G.W.;Validation, G.W.; Formal Analysis, G.W.; Investigation, G.W. and H.G.; Resources, G.W. and H.G.; Data Curation,G.W.; Writing-Original Draft Preparation, G.W.; Writing-Review & Editing, G.W. and H.G.; Visualization, G.W.;Supervision, H.G.; Project Administration, G.W. and H.G.; Funding Acquisition, H.G.
Acknowledgments: The authors wish to acknowledge the Virginia Tech Department of Biomedical Engineeringand Mechanics for providing a Graduate Research Assistantship to the lead author to support this research effort.The authors also wish to acknowledge the Virginia Tech Open Access Subvention Fund for providing support forthe article processing charges.
Conflicts of Interest: The authors declare no conflict of interest.
References
1. Kusano, K.; Gabler, H.C. Comparison and validation of injury risk classifiers for advanced automated crashnotification systems. Traffic Inj. Prev. 2014, 15, 126–133. [CrossRef] [PubMed]
2. Kusano, K.D.; Gabler, H.C. Automated crash notification: Evaluation of in-vehicle principal direction offorce estimations. Transp. Res. C Emerg. Technol. 2013, 32, 116–128. [CrossRef]
3. Kononen, D.W.; Flannagan, C.A.C.; Wang, S.C. Identification and validation of a logistic regression modelfor predicting serious injuries associated with motor vehicle crashes. Accid. Anal. Prev. 2011, 43, 112–122.[CrossRef] [PubMed]
4. Bahouth, G.; Digges, K.; Schulman, C. Influence of injury risk thresholds on the performance of an algorithmto predict crashes with serious injuries. Ann. Adv. Automot. Med. 2012, 56, 223–230. [PubMed]
5. Weiser, M. The Computer for the 21st Century. Sci. Am. 1991, 265, 94–104. [CrossRef]6. Walter, M.; Eilebrecht, B.; Wartzek, T.; Leonhardt, S. The smart car seat: Personalized monitoring of vital
signs in automotive applications. Pers. Ubiquitous Comput. 2011, 15, 707–715. [CrossRef]7. Kim, C.-S.; Ober, S.L.; Mcmurtry, M.S.; Finegan, B.A.; Inan, O.T.; Mukkamala, R.; Hahn, J.-O.
Ballistocardiogram: Mechanism and potential for unobtrusive cardiovascular health monitoring. Sci. Rep.2016, 6, 31297. [CrossRef] [PubMed]
8. Inan, O.T.; Migeotte, P.-F.; Park, K.-S.; Etemadi, M.; Tavakolian, K.; Casanella, R.; Zanetti, J.; Tank, J.;Funtova, I.; Prisk, G.K.; et al. Ballistocardiography and seismocardiography: A review of recent advances.IEEE J. Biomed. Health Inform. 2014, 19, 1414–1427. [CrossRef] [PubMed]
9. Pinheiro, E.; Postolache, O.; Girão, P. Study on ballistocardiogram acquisition in a moving wheelchair withembedded sensors. Metrol. Meas. Syst. 2012, 19, 739–750. [CrossRef]
10. Inan, O.T.; Etemadi, M.; Widrow, B.; Kovacs, G.T.A. Adaptive cancellation of floor vibrations in standingballistocardiogram measurements using a seismic sensor as a noise reference. IEEE Trans. Biomed. Eng. 2010,57, 722–727. [CrossRef] [PubMed]
Sensors 2018, 18, 1463 11 of 11
11. Junnila, S.; Akhbardeh, A.; Värri, A. An electromechanical film sensor based wireless ballistocardiographicchair: Implementation and performance. J Signal Process. Syst. 2009, 57, 305–320. [CrossRef]
12. Barleanu, A.; Hagan, M.; Geman, O.; Chiuchisan, I. Wearable ballistocardiography system for heartbeatdetection. In Proceedings of the 2016 International Conference and Exposition on Electrical and PowerEngineering (EPE), Iasi, Romania, 20–22 October 2016; pp. 294–298. [CrossRef]
13. Mack, D.C.; Patrie, J.T.; Suratt, P.M.; Felder, R.A.; Alwan, M. Development and preliminary validation ofheart rate and breathing rate detection using a passive, ballistocardiography-based sleep monitoring system.IEEE Trans. Inform. Technol. Biomed. 2009, 13, 111–120. [CrossRef] [PubMed]
14. David, H.; Marjorie, S. Monitoring pulse and respiration with a non-invasive hydraulic bed sensor.In Proceedings of the 2010 Annual International Conference of the IEEE Engineering in Medicine andBiology, Buenos Aires, Argentina, 31 August–4 September 2010; pp. 2119–2123.
15. Magno, M.; Spagnol, C.; Benini, L.; Popovici, E. A low power wireless node for contact and contactless heartmonitoring. Microelectron. J. 2014, 45, 1656–1664. [CrossRef]
16. Neri, B.; Saponara, S. Advances in technologies, architectures, and applications of highly-integratedlow-power radars. IEEE Aerosp. Electron. Syst. Mag. 2012, 27, 25–36. [CrossRef]
17. Sarkar, A.; Abbott, A.L.; Doerzaph, Z. Assessment of psychophysiological characteristics using heart ratefrom naturalistic face video data. In Proceedings of the IEEE International Joint Conference on Biometrics,Clearwater, FL, USA, 29 September–2 October 2014; pp. 1–6. [CrossRef]
18. Wu, H.-Y.; Rubinstein, M.; Shih, E.; Guttag, J.; Durand, F.; Freeman, W. Eulerian video magnification forrevealing subtle changes in the world. ACM Trans. Graph. 2012, 31, 1–8. [CrossRef]
19. Occupant Crash Protection; Federal Motor Vehicle Safety Standards. Federal Register. 2000.Available online: https://www.federalregister.gov/documents/2000/05/12/00-11577/federal-motor-vehicle-safety-standards-occupant-crash-protection (accessed on 7 May 2018).
20. Peper, E.; Harvey, R.; Lin, I.-M.; Tylova, H.; Moss, D. Is there more to blood volume pulse than heart ratevariability, respiratory sinus arrhythmia, and cardiorespiratory synchrony? Biofeedback 2007, 35, 54–61.
21. Altman, D.G.; Bland, J.M. Measurement in medicine: The analysis of method comparison studies. Statistician1983, 32, 307–317. [CrossRef]
22. Zaki, R.; Bulgiba, A.; Ismail, R.; Ismail, N.A. Statistical methods used to test for agreement of medicalinstruments measuring continuous variables in method comparison studies: A systematic review. PLoS ONE2012, 7, e37908. [CrossRef] [PubMed]
23. Shah, Y.; Dunn, J.; Huebner, E.; Landry, S. Wearables data integration: Data-driven modeling to adjust fordifferences in Jawbone and Fitbit estimations of steps, calories, and resting heart-rate. Comput. Ind. 2017, 86,72–81. [CrossRef]
24. Schmidt, E.; Decke, R.; Rasshofer, R. Correlation between subjective driver state measures andpsychophysiological and vehicular data in simulated driving. In Proceedings of the IEEE Intelligent VehiclesSymposium, Gothenburg, Sweden, 19–22 June 2016; pp. 1380–1385. [CrossRef]
25. Victorino, G.P.; Battistella, F.D.; Wisner, D.H. Does tachycardia correlate with hypotension after trauma?J. Am. Coll. Surg. 2003, 196, 679–684. [CrossRef]
26. Center for Health Statistics N. Anthropometric Reference Data for Children and Adults: United States. 2011.Available online: https://www.cdc.gov/nchs/data/series/sr_03/sr03_039.pdf (accessed on 7 May 2018).
© 2018 by the authors. Licensee MDPI, Basel, Switzerland. This article is an open accessarticle distributed under the terms and conditions of the Creative Commons Attribution(CC BY) license (http://creativecommons.org/licenses/by/4.0/).