Automated Iris Recognition Technology & Iris Biometric System

Graduate Theses, Dissertations, and Problem Reports
2005
Non-ideal iris recognition Non-ideal iris recognition
Vivekanand Dorairaj West Virginia University
Follow this and additional works at: https://researchrepository.wvu.edu/etd
Recommended Citation Recommended Citation Dorairaj, Vivekanand, "Non-ideal iris recognition" (2005). Graduate Theses, Dissertations, and Problem Reports. 1660. https://researchrepository.wvu.edu/etd/1660
This Thesis is protected by copyright and/or related rights. It has been brought to you by the The Research Repository @ WVU with permission from the rights-holder(s). You are free to use this Thesis in any way that is permitted by the copyright and related rights legislation that applies to your use. For other uses you must obtain permission from the rights-holder(s) directly, unless additional rights are indicated by a Creative Commons license in the record and/ or on the work itself. This Thesis has been accepted for inclusion in WVU Graduate Theses, Dissertations, and Problem Reports collection by an authorized administrator of The Research Repository @ WVU. For more information, please contact [email protected].
Non-Ideal Iris Recognition
Vivekanand Dorairaj
A Thesis submitted to the
College of Engineering and Mineral Resources
at West Virginia University
in partial fulfillment of the requirements
for the degree of
Master of Science
in
Electrical Engineering
Natalia A. Schmid, D.Sc., Chair
Lawrence A. Hornak, Ph.D.
Bojan Cukic, Ph.D.
Arun A. Ross, Ph.D.
Lane Department of Computer Science
and Electrical Engineering
Morgantown, West Virginia
December 2005
Keywords: Iris recognition, independent component analysis, principal component
analysis, image encoding, performance evaluation, biometrics
c© Copyright 2005 by Vivekanand Dorairaj
All Rights Reserved


ABSTRACT
Non-Ideal Iris Recognition
Vivekanand Dorairaj
Of the many biometrics that exist, iris recognition is finding more attention than
any other due to its potential for improved accuracy, permanence, and acceptance.
Current iris recognition systems operate on frontal view images of good quality. Due
to the small area of the iris, user co-operation is required. In this work, a new system
capable of processing iris images which are not necessarily in frontal view is described.
This overcomes one of the major hurdles with current iris recognition systems and
enhances user convenience and accuracy. The proposed system is designed to op-
erate in two steps: (i) preprocessing and estimation of the gaze direction and (ii)
processing and encoding of the rotated iris image. Two objective functions are used
to estimate the gaze direction. Later, the off-angle iris image undergoes geometric
transformations involving the estimated angle and is further processed as if it were
a frontal view image. Two methods: (i) PCA and (ii) ICA are used for encoding.
Three different datasets are used to quantify performance of the proposed non-ideal
recognition system.
iii


To my family.
v


Acknowledgements
This thesis is a result of work that was done in the past two years, starting in the
second semester of my Master’s program. I received help from many quarters in order
to successfully complete this task and I would like to thank all those who had helped
me with this thesis work from the beginning.
Firstly, I take pleasure in expressing my heartfelt gratitude to my adviser Dr.
Natalia Schmid. She has been highly inspiring, soft spoken yet strict friend who was
always there when I needed her help. She has been extremely patient with me and
has guided this work. I do not know how well this work would have gone if not for
her help and encouragement. It has been a great previlege to be her student.
I would like to thank all the committee members, namely Dr. Larry Hornak,
Dr. Bojan Cukic and Dr. Arun Ross for their continued support throughout my
study. I am indebted to all the three for their constant encouragement and wise
suggestions which helped carve not only my thesis but my approach towards quality
research. I have learnt a lot from my committee members, sometimes even without
their knowledge.
I extend my special gratitude to all my family members, Appa, Amma, Prakash,
Sangeetha, Arun, and Ram for standing by me during this journey that I undertook,
for all their love and care. Without their unwitting support, this thesis wouldn’t have
been possible.
Special thanks to all my friends and colleagues at work, especially Nathan, Jinyu,
Xiaohan and Nick. It has been a great experience to share knowledge and work as a
team with all of you.
I would like to take this opportunity to thank Prof. John Daugman for his valuable
vii

suggestions which added greatly to my understanding of iris recognition.
Last but not the least, I would like to thank the CITeR and the Biometric Fusion
Center for sponsoring this project.
viii

Contents
v
Acknowledgements vii
1 Introduction 1
1.1 Biometrics . . . . . . . . . . . . . . . . . . . . . . . . . . . . . . . . . 1
1.1.1 Physiological Biometric . . . . . . . . . . . . . . . . . . . . . . 2
1.1.2 Behavioral Biometric . . . . . . . . . . . . . . . . . . . . . . . 2
1.1.3 Templates . . . . . . . . . . . . . . . . . . . . . . . . . . . . . 3
1.1.4 Modes of Operation . . . . . . . . . . . . . . . . . . . . . . . . 3
1.1.5 Iris Recognition . . . . . . . . . . . . . . . . . . . . . . . . . . 4
2 Literature Review 6
2.1 Localization . . . . . . . . . . . . . . . . . . . . . . . . . . . . . . . . 8
2.2 Normalization . . . . . . . . . . . . . . . . . . . . . . . . . . . . . . . 8
2.3 Encoding . . . . . . . . . . . . . . . . . . . . . . . . . . . . . . . . . 9
2.4 Matching . . . . . . . . . . . . . . . . . . . . . . . . . . . . . . . . . 10
3 Non-Ideality in Iris Recognition 11
3.1 Estimation of Projective Transformation Matrix . . . . . . . . . . . . 13
3.2 Ellipse Fitting for Angle Estimation . . . . . . . . . . . . . . . . . . . 15
4 Proposed Encoding Techniques 17
4.1 Encoding Using PCA . . . . . . . . . . . . . . . . . . . . . . . . . . . 17
ix

4.2 Following up with ICA . . . . . . . . . . . . . . . . . . . . . . . . . . 22
5 Results 25
5.1 Performance of Estimation techniques . . . . . . . . . . . . . . . . . . 25
5.2 Results for Encoding of Frontal View Images . . . . . . . . . . . . . . 30
5.2.1 Compensation for Rotation . . . . . . . . . . . . . . . . . . . 30
5.2.2 Occlusion, Masking and Performance . . . . . . . . . . . . . . 32
5.3 Performance of the Non-ideal Recognition system . . . . . . . . . . . 35
5.4 Other Studies on Encoding . . . . . . . . . . . . . . . . . . . . . . . . 38
5.4.1 How many Eigenvectors? . . . . . . . . . . . . . . . . . . . . . 40
5.4.2 Eigen irises and Independent irises . . . . . . . . . . . . . . . 40
5.4.3 Effect of Varying the Number of Essential Components . . . . 42
5.4.4 Identification case with top N matches . . . . . . . . . . . . . 43
5.4.5 Relative Composition of Training and Testing Sets . . . . . . 44
5.4.6 Effect of Varying the Resolution . . . . . . . . . . . . . . . . . 45
5.4.7 Other Databases and Distance Measures . . . . . . . . . . . . 47
5.5 Effect of Specular Reflection on Performance . . . . . . . . . . . . . . 47
6 Summary and Future Work 49
6.1 Summary . . . . . . . . . . . . . . . . . . . . . . . . . . . . . . . . . 49
6.2 Future Work . . . . . . . . . . . . . . . . . . . . . . . . . . . . . . . . 50
Bibliography 51
x

List of Figures
1.1 Currently used biometric technologies . . . . . . . . . . . . . . . . . . 2
1.2 Anatomy of the iris (from http://www.lab.anhb.uwa.edu.au/vsci/IRISCB.htm) 5
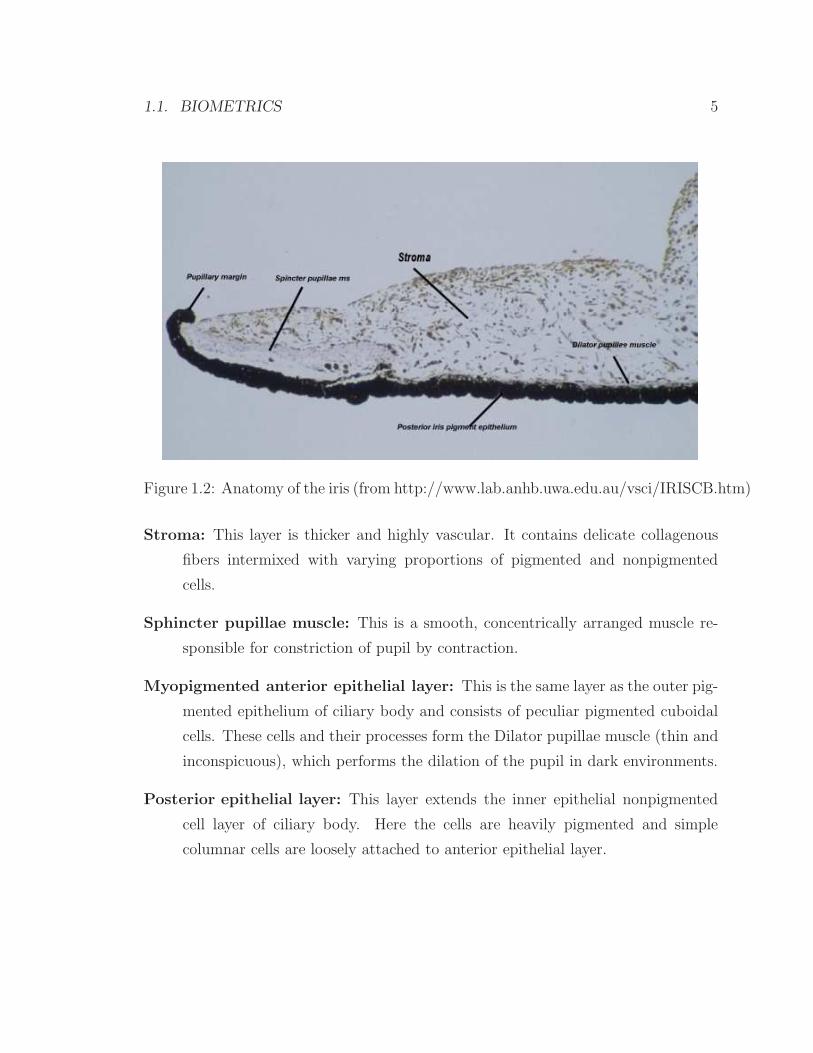
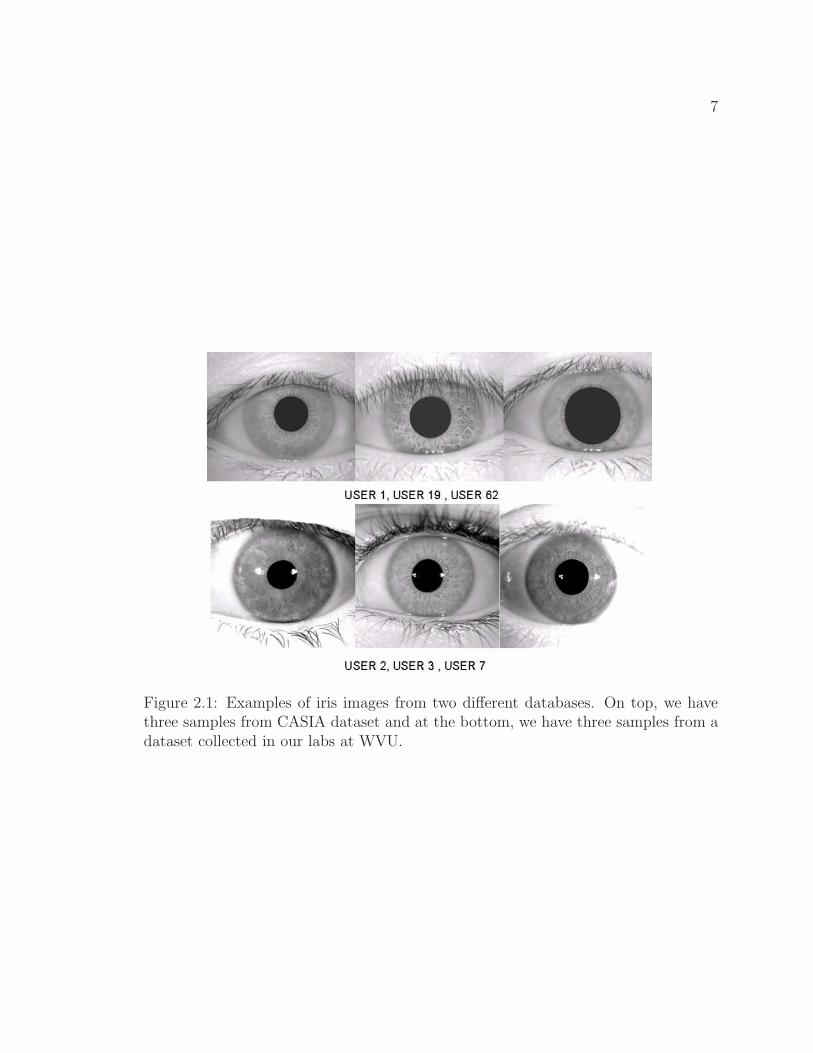
2.1 Examples of iris images from two different databases. On top, we have
three samples from CASIA dataset and at the bottom, we have three
samples from a dataset collected in our labs at WVU. . . . . . . . . . 7
2.2 Schematic of the modified Daugman’s algorithm . . . . . . . . . . . . 8
3.1 Examples of non-ideal iris images . . . . . . . . . . . . . . . . . . . . 12
3.2 A generic Non-Ideal Iris based Recognition System . . . . . . . . . . 13
3.3 A Schematic of a Non-Ideal Iris based Recognition System which deals
with off-axis images . . . . . . . . . . . . . . . . . . . . . . . . . . . . 14
4.1 Block-diagram of the system implementing PCA/ICA encoding tech-
niques for iris. . . . . . . . . . . . . . . . . . . . . . . . . . . . . . . . 18
4.2 Schematic of testing scenario 1 . . . . . . . . . . . . . . . . . . . . . . 19
4.3 Schematic of testing scenario 2 . . . . . . . . . . . . . . . . . . . . . . 21
5.1 Estimating Off-Angle Using Projective Transform with one axis of ro-
tation using Hamming Distance as criterion . . . . . . . . . . . . . . 26
5.2 Estimating Off-Angle Using Projective Transform with one axis of ro-
tation using Integro-differential operator . . . . . . . . . . . . . . . . 27
5.3 Estimating Off-Angle Using Projective Transform with two axes of
rotation . . . . . . . . . . . . . . . . . . . . . . . . . . . . . . . . . . 28
xi

5.4 Estimating ellipse parameters using the elliptical integro-differential
operator . . . . . . . . . . . . . . . . . . . . . . . . . . . . . . . . . . 29
5.5 Performance in different scenarios . . . . . . . . . . . . . . . . . . . . 32
5.6 Effect of rotation on matchscores, (a).Histogram before compensation,
(b).Histograms after compensation . . . . . . . . . . . . . . . . . . . 33
5.7 PCA/ICA results for various simulations, (a).ROC curves for PCA,
(b).ROC curves for ICA . . . . . . . . . . . . . . . . . . . . . . . . . 33
5.8 Some examples of masked images . . . . . . . . . . . . . . . . . . . . 35
5.9 Some examples of Independent irises . . . . . . . . . . . . . . . . . . 36
5.10 Some examples of Eigen irises . . . . . . . . . . . . . . . . . . . . . . 36
5.11 Effect of applying a unified mask to reduce interference from eyelids . 36
5.12 Percentage variance contributed by each eigen vector to the total vari-
ance as a function of (a) Varying resolution of training image with con-
stant number of training templates (b) Varying number of templates
for constant resolution . . . . . . . . . . . . . . . . . . . . . . . . . . 37
5.13 Three samples of a single user from an off-axis dataset collected in our
labs at WVU . . . . . . . . . . . . . . . . . . . . . . . . . . . . . . . 37
5.14 Performance of algorithms when using initial estimates for angles. (a).
Train on 0 degree images and tested on others, and (b). Train on 15
degree images and tested on others . . . . . . . . . . . . . . . . . . . 38
5.15 Performance of algorithms after compensating using the optimization
technique (integro-differential operator). (a). Train on 0 degree images
and tested on others (b). Train on 15 degree images and tested on
others, and (c). Train on 30 degree images and tested on others . . . 39
5.16 Plot of image after projection into different trained subspaces . . . . 41
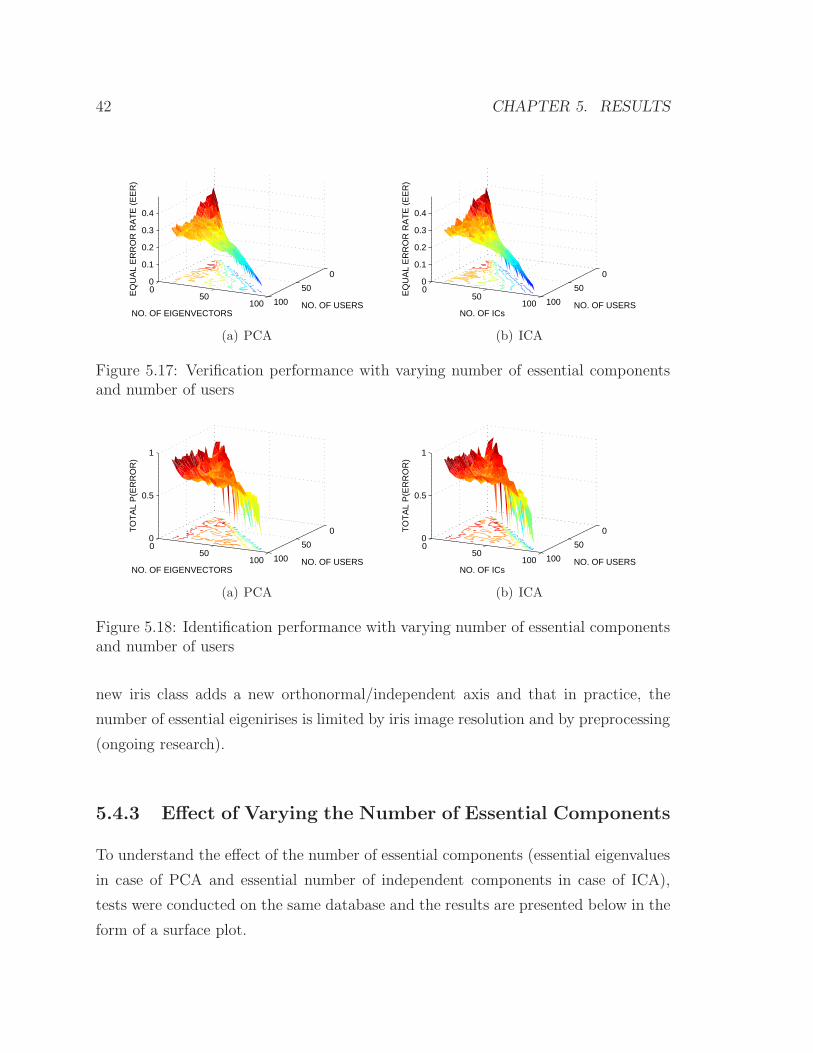
5.17 Verification performance with varying number of essential components
and number of users . . . . . . . . . . . . . . . . . . . . . . . . . . . 42
5.18 Identification performance with varying number of essential compo-
nents and number of users . . . . . . . . . . . . . . . . . . . . . . . . 42
xii

5.19 (a). Recognition performance with top N matches. M- with masking
for occlusions, NM-without masking for occlusions. (b).Performance of
proposed techniques as the number of training images in identification
case. There is clearly an improvement in performance when using more
training templates. . . . . . . . . . . . . . . . . . . . . . . . . . . . . 43
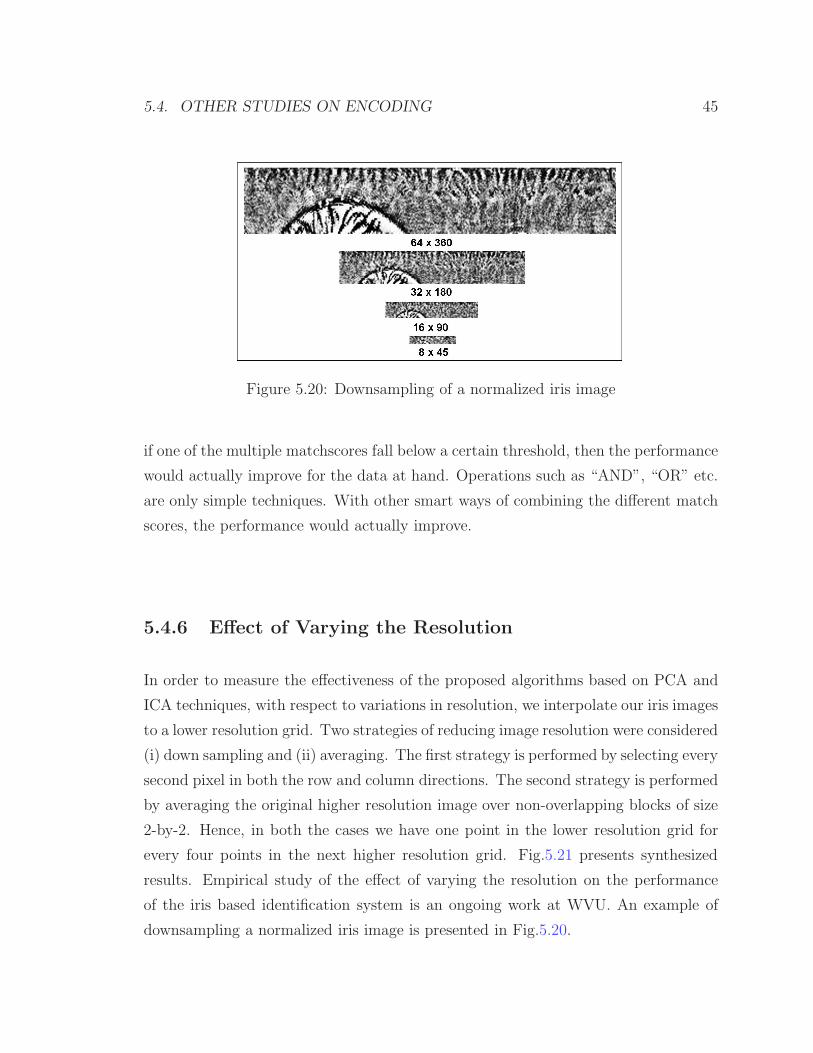
5.20 Downsampling of a normalized iris image . . . . . . . . . . . . . . . . 45
5.21 PCA/ICA results for various simulations on resolution . . . . . . . . 46
5.22 Verification performance for WVU dataset with 22 iris classes and six
images per user . . . . . . . . . . . . . . . . . . . . . . . . . . . . . . 47
5.23 Effect of presence of specular reflection on performance of algorithms 48
xiii

Chapter 1
Introduction
Authentication can be formally defined as the process of determining whether or not
a given person is indeed who he/she claims to be. We need authentication in an
environment where only the right person has access to a given resource. In order to
determine the identity, the knowledge of some undisclosed password or the possession
of some documents or cards is commonly used. But passwords can be guessed or
retrieved, documents forged and cards stolen. Hence, we need a reliable way to
differentiate between individuals as well as identify them based on information unique
to each person. One such highly unique feature which provides a reliable way of
determining who an individual is rather than what the individual knows or has, is
the biometric trait of a person.
1.1 Biometrics
Biometrics are automated methods of verifying or identifying an individual based on
physiological or behavioral characteristics of that person. Currently, there are a num-
ber of biometrics which can be used in three modes, (1) verification, (2) identification,
and (3) screening. Biometrics are classified into two types based on the type of input:
(1) physiological, and (2) behavioral.
1
2 CHAPTER 1. INTRODUCTION
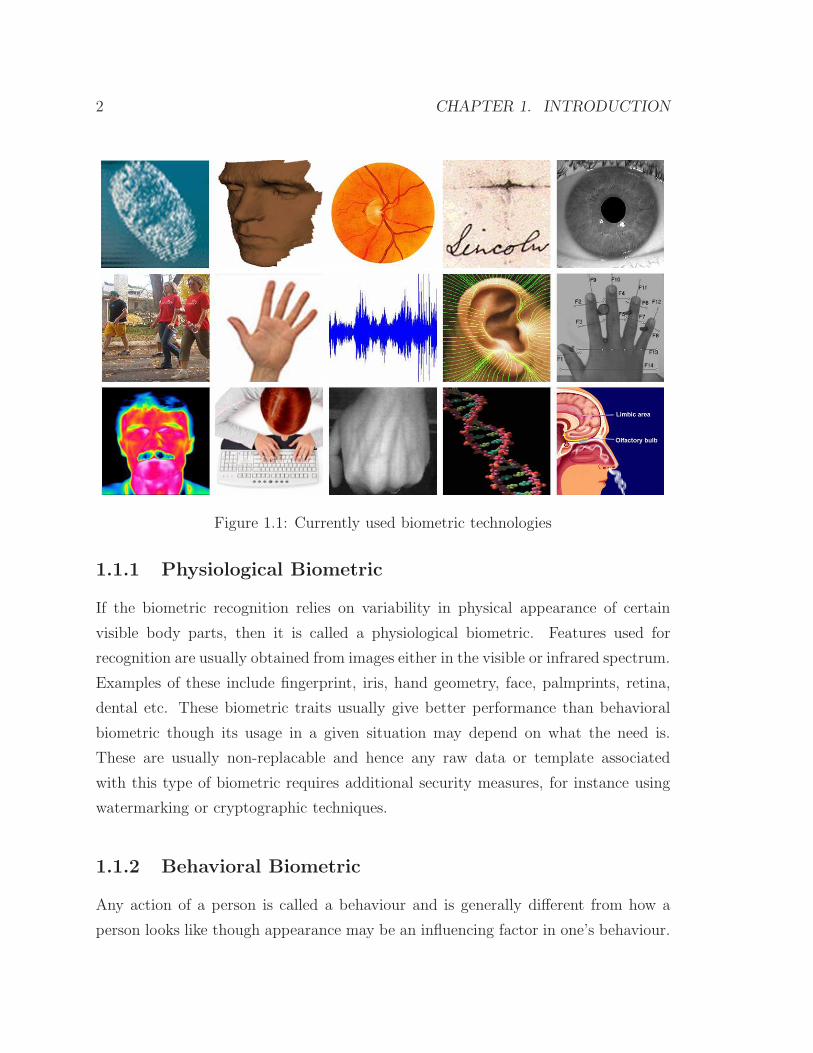
Figure 1.1: Currently used biometric technologies
1.1.1 Physiological Biometric
If the biometric recognition relies on variability in physical appearance of certain
visible body parts, then it is called a physiological biometric. Features used for
recognition are usually obtained from images either in the visible or infrared spectrum.
Examples of these include fingerprint, iris, hand geometry, face, palmprints, retina,
dental etc. These biometric traits usually give better performance than behavioral
biometric though its usage in a given situation may depend on what the need is.
These are usually non-replacable and hence any raw data or template associated
with this type of biometric requires additional security measures, for instance using
watermarking or cryptographic techniques.
1.1.2 Behavioral Biometric
Any action of a person is called a behaviour and is generally different from how a
person looks like though appearance may be an influencing factor in one’s behaviour.
1.1. BIOMETRICS 3
Certain kinds of behaviour such as signature, gait, etc. are considered unique among
individuals. Hence, these traits are used for biometric recognition. Currently, the
performance of such recognition systems are poor than physiological biometric but
their importance cannot be ignored for certain applications. For instance, monitoring
a large group of persons at a distance for “unusual” behaviour is a typical application
for gait recognition. This may not be possible for other forms of biometrics like face
(can be easily altered), fingerprints, ear, and iris recognition (no input of biometric)
etc. They can also aid in multimodal biometric systems.
1.1.3 Templates
Templates form the heart of any biometric system. A template is a set of features
often in the form of a vector, which is extracted from the original input to the biomet-
ric system. Some examples of templates are cepstrum coefficients from voice data,
fingerprint minutiae, eigen coefficients for face, etc. There are several advantages of
extracting such features from a given biometric. It generally reduces storage space
though this may not be possible in certain cases. For example, the use of overcom-
plete representations such as steerable pyramids. Templates usually make the original
raw data better suited for classification. Templates in turn form the input for the
classification step. In general, features extracted using sophisticated techniques may
require only simple classifiers.
1.1.4 Modes of Operation
There are three main modes in which a recognition task is performed. They are:
Verification: Given an input of some kind (may be password or a biometric), the
task is to verify whether or not a person is really whom he/she claims to be.
This is a one-to-one match and the final output is a binary decision.
Identification: Given an input which is thought to be unique for individuals, the
task is to identify the person to whom the given input belongs to provided that
4 CHAPTER 1. INTRODUCTION
another copy of the input is available in the database. This is a one-to-many
match with either one or more closest matches as the output.
Screening: Screening is defined as testing objects or persons in order to identify
those with particular characteristics. In this case, the task is to say whether or
not the given input belongs to one of the individuals present in a watch list.
Here the number of comparisons is greater than that of the verification case but
fewer than the identification case.
1.1.5 Iris Recognition
A highly complex phenomenon due to the combined effects of texture, pigmentation,
fibrous tissue, and blood vessels within the iris stroma make up an individual’s epi-
genetic constitution. Iris pattern, unlike biometrics such as fingerprints or face, does
not contain predefined sets of features. For example, a face has two eyes, one nose,
a mouth and two ears with a fixed “relative order”. Fingerprint consists of ridges
and valleys with a limited set of minutiae patterns (such as ridge ending, ridge bi-
furcation etc.) positioned randomly (with varying numbers) for different individuals.
Iris on the other hand does not have such restrictions. It combines numerous local
pattern variations (varying in scale and position) along with global features to give a
highly unique pattern. Recognition systems based on such patterns have been proven
to have greater accuracy than many of the existing biometrics [1]. They were also
observed to be stable over a considerable period of a person’s lifetime.
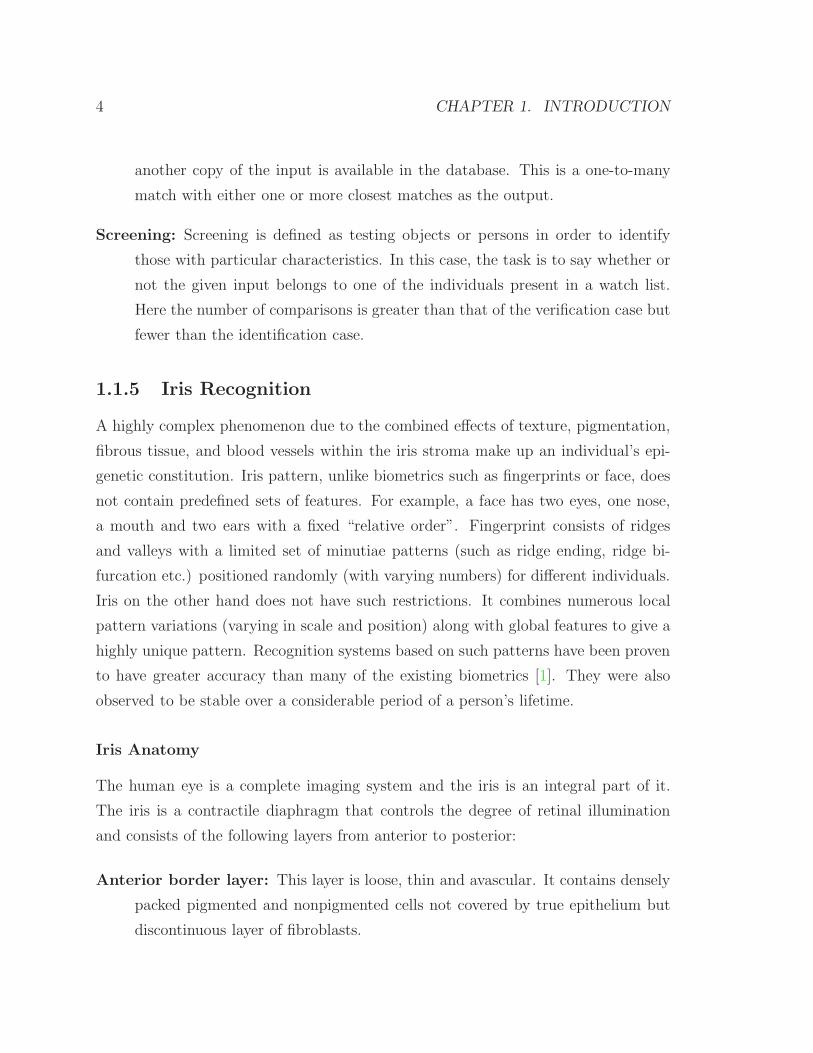
Iris Anatomy
The human eye is a complete imaging system and the iris is an integral part of it.
The iris is a contractile diaphragm that controls the degree of retinal illumination
and consists of the following layers from anterior to posterior:
Anterior border layer: This layer is loose, thin and avascular. It contains densely
packed pigmented and nonpigmented cells not covered by true epithelium but
discontinuous layer of fibroblasts.
1.1. BIOMETRICS 5
Figure 1.2: Anatomy of the iris (from http://www.lab.anhb.uwa.edu.au/vsci/IRISCB.htm)
Stroma: This layer is thicker and highly vascular. It contains delicate collagenous
fibers intermixed with varying proportions of pigmented and nonpigmented
cells.
Sphincter pupillae muscle: This is a smooth, concentrically arranged muscle re-
sponsible for constriction of pupil by contraction.
Myopigmented anterior epithelial layer: This is the same layer as the outer pig-
mented epithelium of ciliary body and consists of peculiar pigmented cuboidal
cells. These cells and their processes form the Dilator pupillae muscle (thin and
inconspicuous), which performs the dilation of the pupil in dark environments.
Posterior epithelial layer: This layer extends the inner epithelial nonpigmented
cell layer of ciliary body. Here the cells are heavily pigmented and simple
columnar cells are loosely attached to anterior epithelial layer.
Chapter 2
Literature Review
The first iris recognition system was invented by John Daugman [2, 3, 4, 5] as an
application to his findings and theory on two dimensional visual cortical filters. The
systems described in most of the iris recognition literature captures and further pro-
cesses either single or multiple copies of infra-red or visible light frontal view images
of high resolution with no strong blur or occlusions in order to guarantee good per-
formance. Most of the systems are patented. There are no details provided on how
to select certain parameters for implementing Daugman’s system. The literature
contains a large number of publications that try to explain the different parts of J.
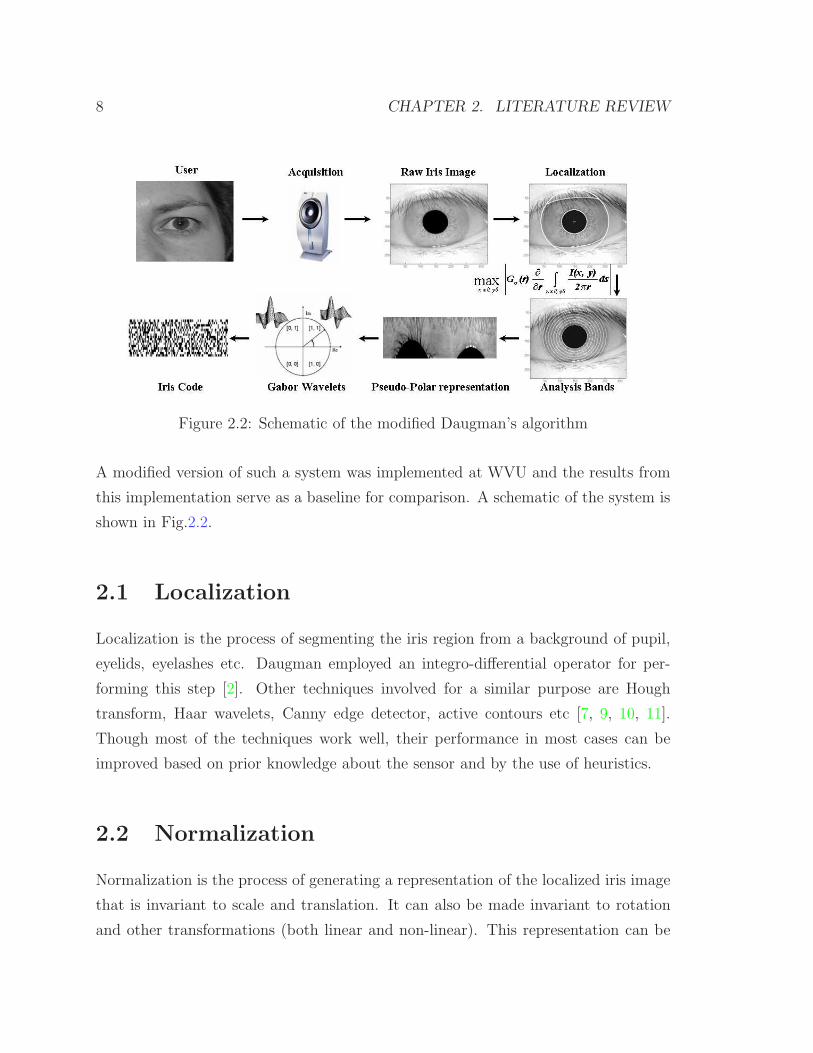
Daugman’s system [2, 6, 7, 8]. The following general steps are involved:
1. Localization of region of interest: During this step, the pupil, sclera, and
eyelids are segmented.
2. Normalization: Transforms a localized iris region from Cartesian coordinates
to doubly dimensionless polar coordinates.
3. Encoding: Uses 2D Gabor wavelets to encode image content that is then
quantized to two levels based on phase information of the output. The result
of encoding step is presented as a binary template called “Iris Code”.
4. Matching: Matching is performed using the Hamming distance.
6
7
Figure 2.1: Examples of iris images from two different databases. On top, we havethree samples from CASIA dataset and at the bottom, we have three samples from adataset collected in our labs at WVU.
8 CHAPTER 2. LITERATURE REVIEW
Figure 2.2: Schematic of the modified Daugman’s algorithm
A modified version of such a system was implemented at WVU and the results from
this implementation serve as a baseline for comparison. A schematic of the system is
shown in Fig.2.2.
2.1 Localization
Localization is the process of segmenting the iris region from a background of pupil,
eyelids, eyelashes etc. Daugman employed an integro-differential operator for per-
forming this step [2]. Other techniques involved for a similar purpose are Hough
transform, Haar wavelets, Canny edge detector, active contours etc [7, 9, 10, 11].
Though most of the techniques work well, their performance in most cases can be
improved based on prior knowledge about the sensor and by the use of heuristics.
2.2 Normalization
Normalization is the process of generating a representation of the localized iris image
that is invariant to scale and translation. It can also be made invariant to rotation
and other transformations (both linear and non-linear). This representation can be

2.3. ENCODING 9
achieved by a transformation of the localized image with different techniques. Daug-
man [2] employs a doubly dimensionless polar representation by the use of a rubber
sheet model. Wildes [7], uses a minimization technique based on least squares to ob-
tain image registration. Boles [12, 13] relies on the maximum possible outer radius for
a given pupil radius to perform normalization. Both Wildes and Boles’ technique do
not compensate for pupil dilation. Also, Boles’ method does not carry out a detection
procedure for the outer boundary. Though Wildes’ technique does not compensate
for pupil dilation, it minimizes loss of information content due to sampling, similar
to Daugman’s system.
2.3 Encoding
Encoding is employed after two important preprocessing steps, namely localization
and normalization of the iris region in an image. Daugman derived a general un-
certainty principle for 2D filters and proved that the family of 2D Gabor functions
achieves the lower bound on joint 2D resolution [14, 15]. This led to the representation
of images using such 2D Gabor elementary functions. Gabor basis functions are not
orthogonal, but their coefficients can be calculated easily as described in [2], and can
be extended to a wavelet like expansion. This could also be viewed as a demodulation
technique which lowers the complexity of the image or as an entropy reducing mecha-
nism to obtain a compact yet efficient representation. Daugman performs recognition
based on the failure of test of statistical independence after localization, normaliza-
tion, and encoding of the iris pattern of the human eye. This is performed not on the
original Gabor coefficients, but on the phase quantized output coefficients. Rotation
due to head tilt is compensated during matching stage by rotation of the obtained
iris template.
Encoding techniques developed by Wildes [7] and Boles [12, 13] use Gaussian
pyramids and zero-crossings of wavelets, respectively. There have been a number of
techniques for iris recognition in the recent years [16, 17, 18, 19, 20, 21, 22, 23, 24, 25,
26, 27, 28]. It is beyond the scope of this work to explain in detail the methodologies
presented in these works. The reader is strongly encouraged to refer to at least a
10 CHAPTER 2. LITERATURE REVIEW
few of these works to have a better understanding of iris recognition techniques in
the literature. There have been ICA based iris recognition techniques in the past.
The work presented here is different from both these previous works. Like other
previous techniques, the ICA techniques proposed in [29, 30, 31] also encode local
information, whereas this work tries to perform global encoding by considering the
entire (segmented) iris image as one signal.
In [29], randomly selected local 2D patches (square) are used for training. In
[30, 31], randomly selected local 2D patches (rectangular) are averaged in the radial
direction to obtain 1D signals which are used for training 1D ICA basis functions.
From the trained basis, both the above mentioned methods encode the testing images
and perform matching. Both these techniques cannot compensate for rotations (in-
plane and out-of-plane) though they compensate for occlusion. In contrast the method
proposed in this work does not require random sampling but rather considers each
image as a data point in a high dimensional space.
2.4 Matching
Daugman uses Hamming distance between two given templates as the decision cri-
terion. Wildes uses normalized correlation coefficient as the criterion whereas Boles
uses a predefined dissimilarity measure at different scales to give a final score. The
matching criterion varies according to the feature set. Hamming distance remains the
easiest and fastest to calculate across a huge number of templates.
Chapter 3
Non-Ideality in Iris Recognition
The term non-ideal iris recognition refers to an iris recognition system which can
effectively deal with iris images of degraded quality due to:
1. User’s disability and/or non-compliant behaviour,
2. Low cost acquisition device.
Current iris recognitions systems that have been previously described require good
quality frontal view images. This is one reason why iris recognition systems have a
high Failure To Acquire (FTA) rates as well as less user convenience. Though there
are some systems that avoid the need for users to present their iris very close to the
acquisition device, the user still needs to co-operate and present his/her iris to the
device such that the system is able to acquire a good frontal view image. This is
achieved by assuming users’ compliance and the use of good quality sensors. When
these conditions are not met, it results in images which contain one or more distortions
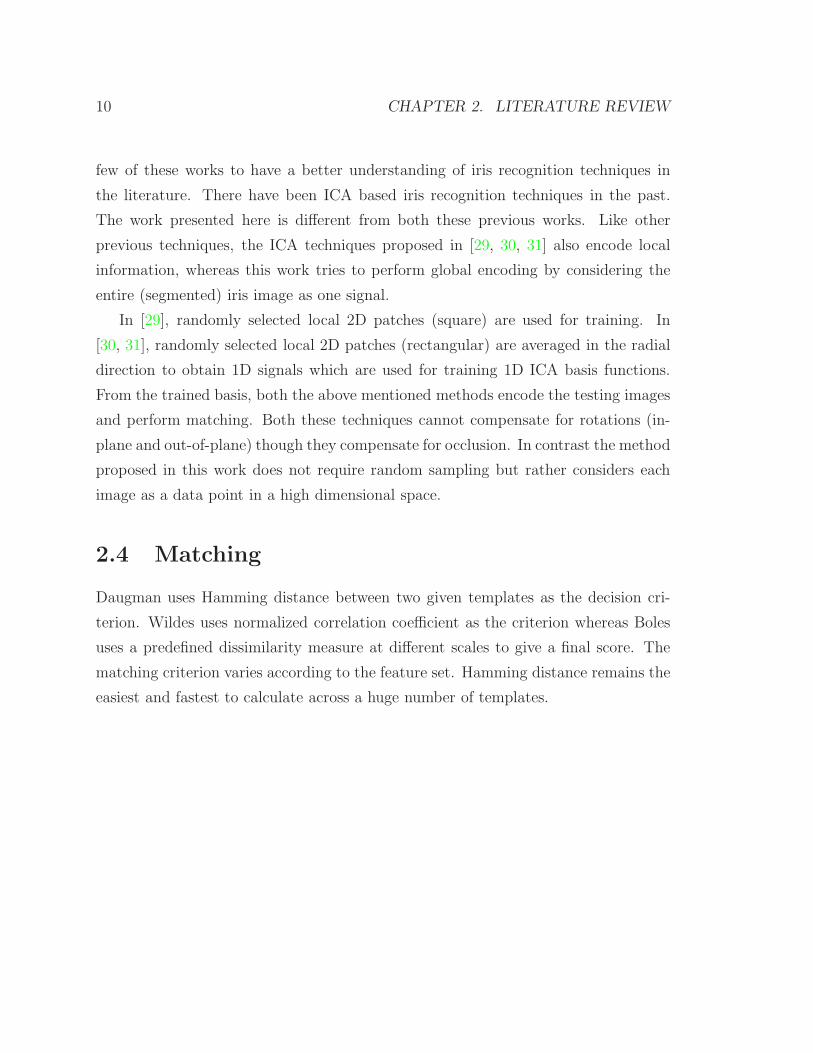
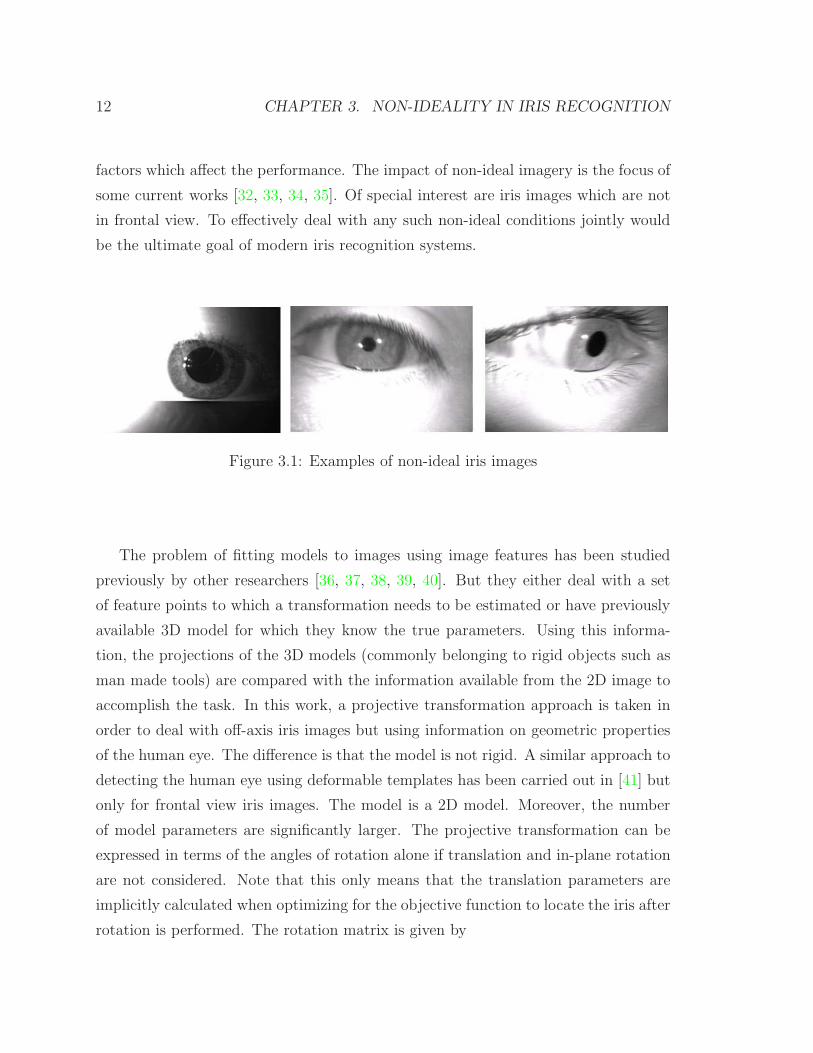
affecting the performance of the system. In Fig.3.1, some iris images of low quality
are shown. These images have (a) bad lighting, (b) distortion due to blurring, (c) out-
of-plane rotation, respectively. When encountering such inputs, the performance of
traditional systems which require good quality input suffers. Hence, there is a need to
develop algorithms that can identify individuals based on iris images, irrespective of
minor variations in image quality if not major degradation. But there are no publicly
available iris image databases which could serve to provide data for studying all such
11
12 CHAPTER 3. NON-IDEALITY IN IRIS RECOGNITION
factors which affect the performance. The impact of non-ideal imagery is the focus of
some current works [32, 33, 34, 35]. Of special interest are iris images which are not
in frontal view. To effectively deal with any such non-ideal conditions jointly would
be the ultimate goal of modern iris recognition systems.
Figure 3.1: Examples of non-ideal iris images
The problem of fitting models to images using image features has been studied
previously by other researchers [36, 37, 38, 39, 40]. But they either deal with a set
of feature points to which a transformation needs to be estimated or have previously
available 3D model for which they know the true parameters. Using this informa-
tion, the projections of the 3D models (commonly belonging to rigid objects such as
man made tools) are compared with the information available from the 2D image to
accomplish the task. In this work, a projective transformation approach is taken in
order to deal with off-axis iris images but using information on geometric properties
of the human eye. The difference is that the model is not rigid. A similar approach to
detecting the human eye using deformable templates has been carried out in [41] but
only for frontal view iris images. The model is a 2D model. Moreover, the number
of model parameters are significantly larger. The projective transformation can be
expressed in terms of the angles of rotation alone if translation and in-plane rotation
are not considered. Note that this only means that the translation parameters are
implicitly calculated when optimizing for the objective function to locate the iris after
rotation is performed. The rotation matrix is given by
3.1. ESTIMATION OF PROJECTIVE TRANSFORMATION MATRIX 13
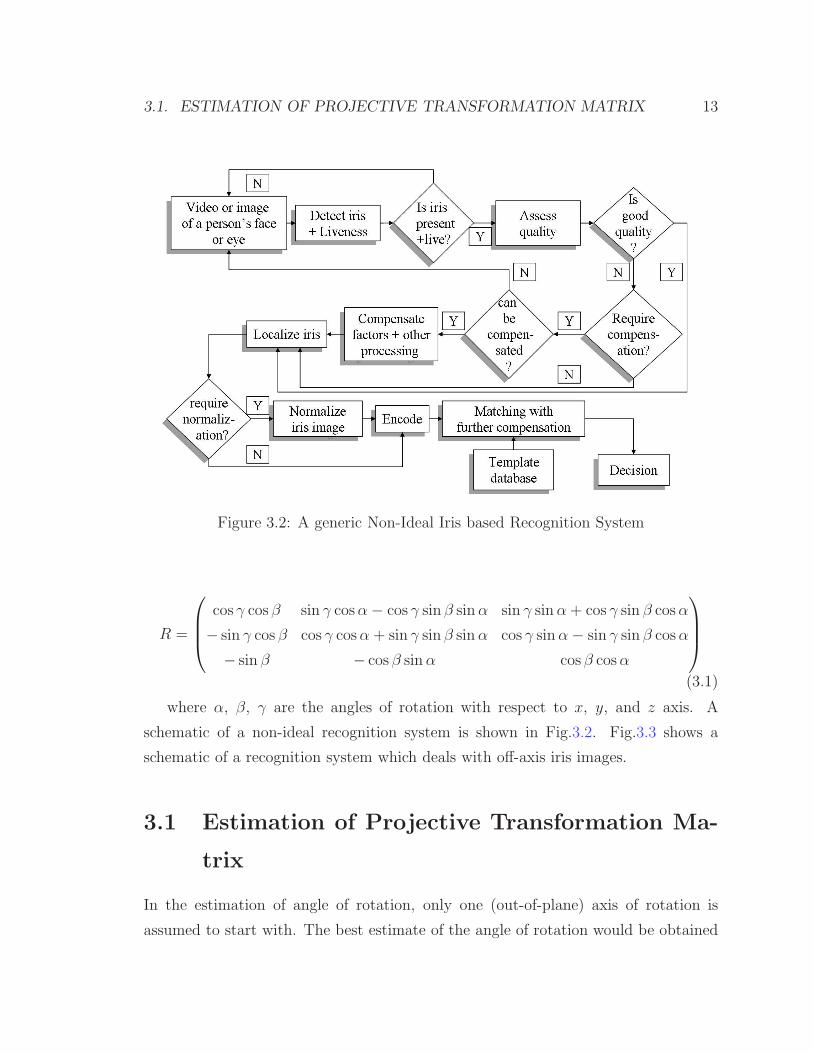
Figure 3.2: A generic Non-Ideal Iris based Recognition System
R =
cos γ cosβ sin γ cosα− cos γ sin β sinα sin γ sinα+ cos γ sin β cosα
− sin γ cos β cos γ cosα + sin γ sin β sinα cos γ sinα− sin γ sin β cosα
− sin β − cosβ sinα cosβ cosα
(3.1)
where α, β, γ are the angles of rotation with respect to x, y, and z axis. A
schematic of a non-ideal recognition system is shown in Fig.3.2. Fig.3.3 shows a
schematic of a recognition system which deals with off-axis iris images.
3.1 Estimation of Projective Transformation Ma-
trix
In the estimation of angle of rotation, only one (out-of-plane) axis of rotation is
assumed to start with. The best estimate of the angle of rotation would be obtained
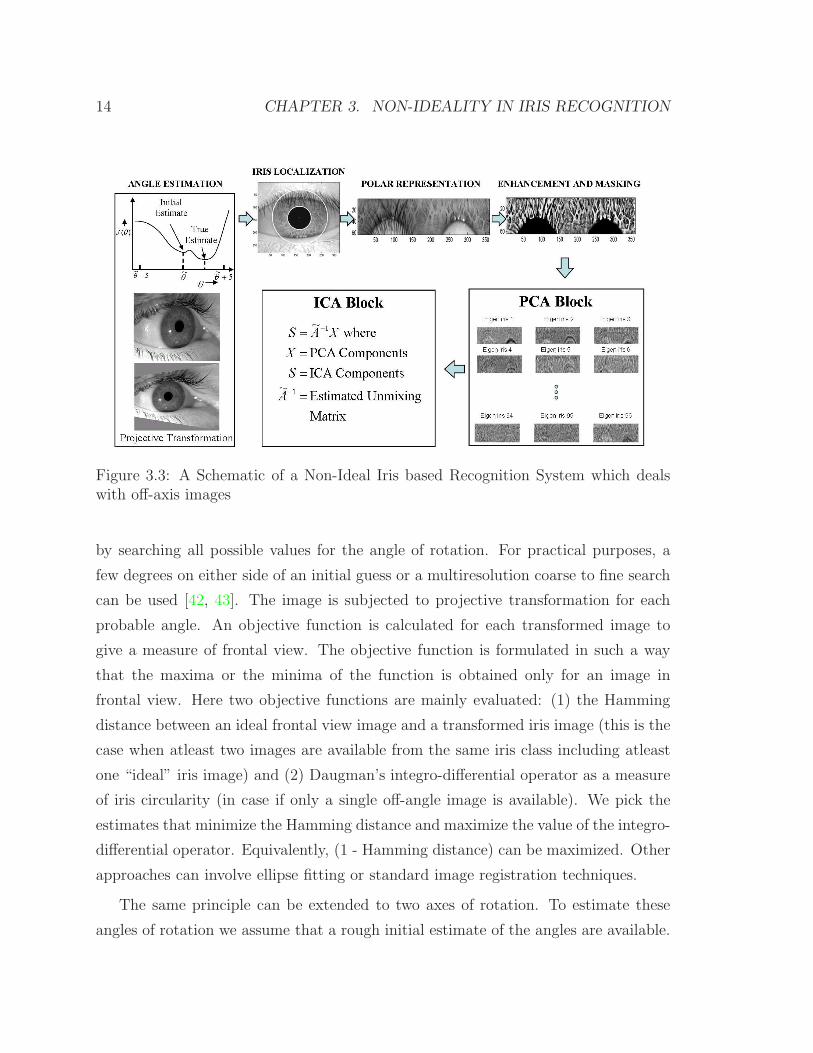
14 CHAPTER 3. NON-IDEALITY IN IRIS RECOGNITION
Figure 3.3: A Schematic of a Non-Ideal Iris based Recognition System which dealswith off-axis images
by searching all possible values for the angle of rotation. For practical purposes, a
few degrees on either side of an initial guess or a multiresolution coarse to fine search
can be used [42, 43]. The image is subjected to projective transformation for each
probable angle. An objective function is calculated for each transformed image to
give a measure of frontal view. The objective function is formulated in such a way
that the maxima or the minima of the function is obtained only for an image in
frontal view. Here two objective functions are mainly evaluated: (1) the Hamming
distance between an ideal frontal view image and a transformed iris image (this is the
case when atleast two images are available from the same iris class including atleast
one “ideal” iris image) and (2) Daugman’s integro-differential operator as a measure
of iris circularity (in case if only a single off-angle image is available). We pick the
estimates that minimize the Hamming distance and maximize the value of the integro-
differential operator. Equivalently, (1 - Hamming distance) can be maximized. Other
approaches can involve ellipse fitting or standard image registration techniques.
The same principle can be extended to two axes of rotation. To estimate these
angles of rotation we assume that a rough initial estimate of the angles are available.

3.2. ELLIPSE FITTING FOR ANGLE ESTIMATION 15
To be more specific, let ψ1 and ψ2 be two rotational angles J(ψ1, ψ2) be an objective
function that has to be optimized. For each pair of (ψ1, ψ2) in the range ψ1 ∈
[ψ1,min, ψ1,max] and ψ2 ∈ [ψ2,min, ψ2,max], (i) the off-angle iris image is rotated by using
the projective transformation and (ii) the objective function J(ψ1, ψ2) is calculated
as in eq.3.2.
arg max(ψ1,ψ2)
J(ψ1, ψ2) (3.2)
Once the angles are estimated using the projective transformation, the off-angle image
is rotated by the estimated angles to give frontal view image. After this step, any iris
recognition algorithm that operates on frontal view iris image can be applied.
Hamming distance requires (1). additional image, and (2). additional processing
for both images. Additional processing for the identification case will increase rapidly
as compared to the processing required for the circular integro-differential operator.
But the use of Hamming distance is optimal in terms of recognition performance.
It jointly estimates and gives out a final score in terms of Hamming distance (joint
estimation and recognition). If we are using other techniques for encoding, the integro-
differential operator would be more efficient than Hamming distance, though it is only
a sub-optimal solution.
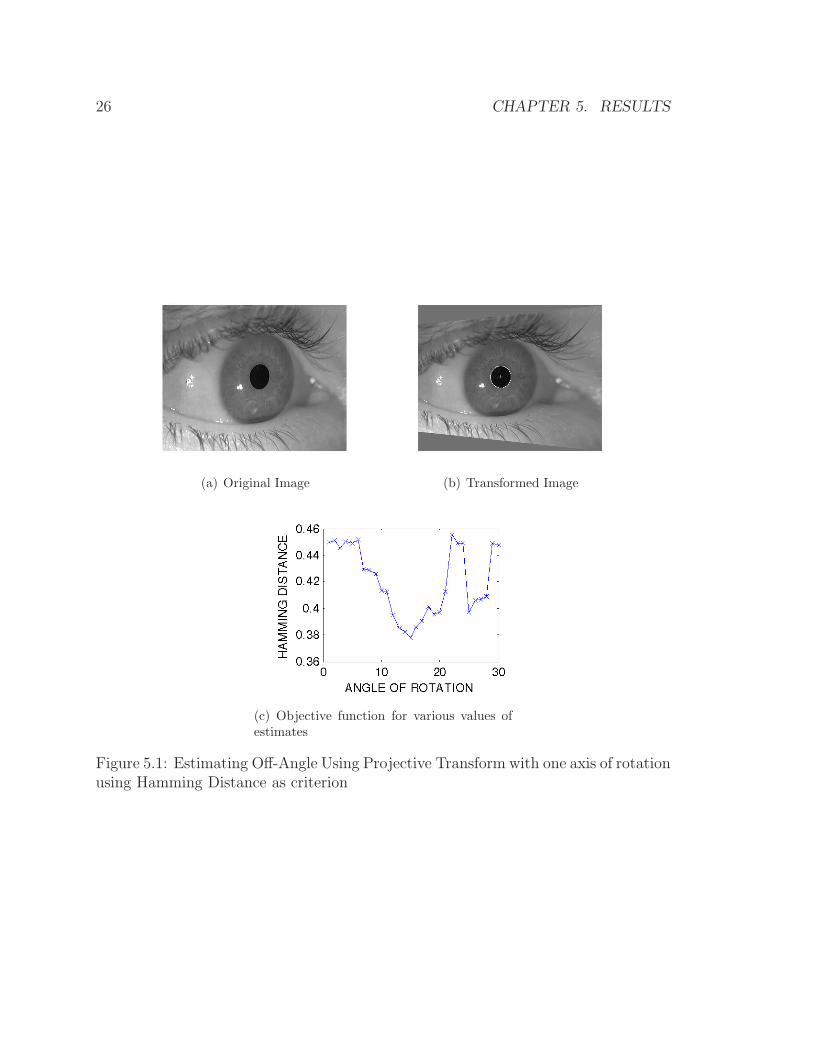
3.2 Ellipse Fitting for Angle Estimation
Another method for performing this operation is ellipse fitting. This method involves
fitting an ellipse to the pupil of the iris. The lengths of the major and minor axes,
combined with the angle that the minor axis makes with the horizontal line, gives
an estimate of the head tilt for a single image. This does not need any additional
image for its operation and is based on the same principle as the integro-differential
operator. Though it estimates an angle, the angles can be estimated only upto a sign
value, that is, though the estimate of the angle of rotation is known, the direction
is not known, which would involve some additional processing, say with an operator
which can give a measure of circularity (circular integro-differential operator) of the
pupil after transformation in both positive and negative directions. This information

16 CHAPTER 3. NON-IDEALITY IN IRIS RECOGNITION
can be used to obtain a frontal view image.
Care needs to be taken when we directly normalize the inner and outer boundary
by fitting ellipses. This is because of the nature of the transformation (projective) the
image undergoes, which in most cases would require non-linear sampling as against the
usual linear sampling during normalization and should be wisely carried out according
to the conditions at hand. Once transformed into frontal view, linear sampling should
give reasonably good results.
There are numerous techniques to perform ellipse fitting. One efficient method
for fitting ellipse to a close-up iris image is presented in [44]. A generalization of
Daugman’s integro-differential operator to an ellipse would lead to finding the maxima
of the function
max(a,x0,y0,e,φ)
∣∣∣∣Gσ(a) ∗∂
∂a
∮
a,x0,y0,e,φ
I(x, y)
pds
∣∣∣∣ (3.3)
where ∗ denotes convolution, Gσ(a) is a smoothing function such as a Gaussian of scale
σ, a is the semi-major axis of the ellipse, (x0, y0) the centre of the ellipse, e being the
eccentricity and φ is the angle of the minor axis of the ellipse. Here, p is the perimeter
of the ellipse. In the continuous space, various approximations including Gauss-
Krummer series, Ramanujan’s approximations, etc.[45] exist though not required for
discrete implementation. Projective transformation can be applied after estimating
both the angles of rotation and the sign of direction (that is, positive or negative).
If projective transformation needs to be eliminated, the doubly dimensionless polar
coordinate system must be sampled non-linearly if the iris is assumed to be a planar
object.

Chapter 4
Proposed Encoding Techniques
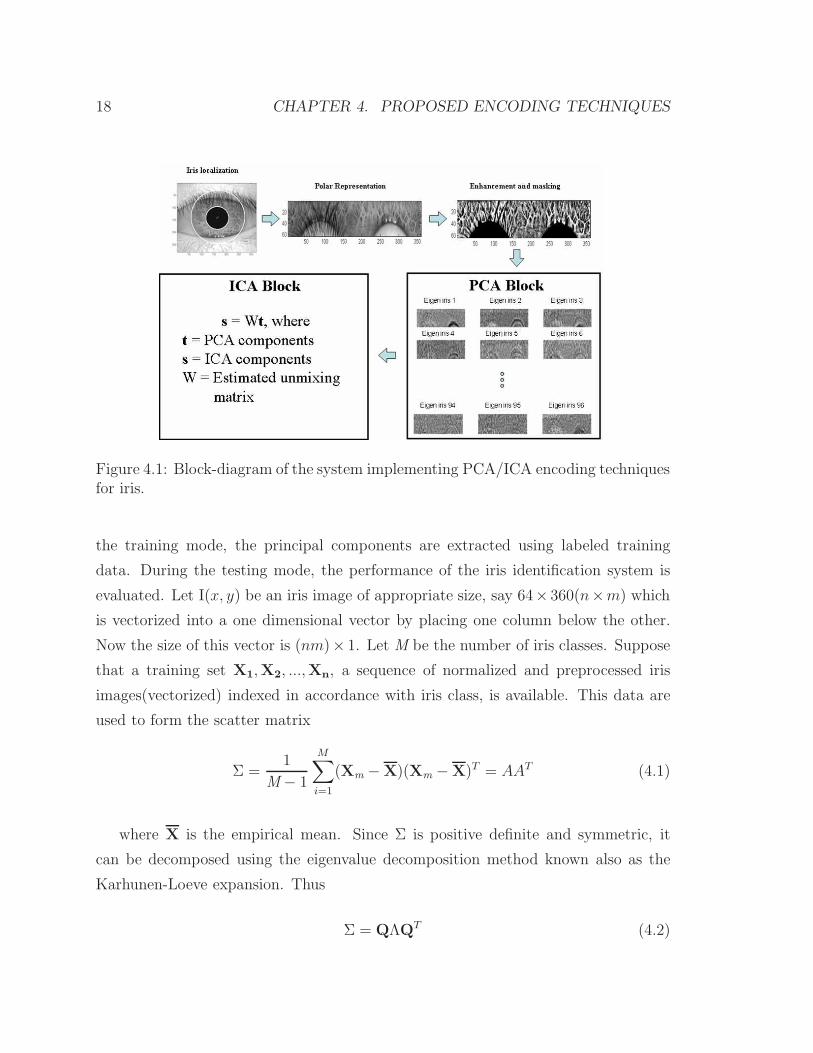
The general block-diagram of the system is shown in Fig.4.1. Below is a brief descrip-
tion of the two encoding blocks.
4.1 Encoding Using PCA
The idea of using PCA for biometric applications was motivated by the work of
Sirovich and Kirby[46] for efficient representation of face images. It was shown that
a large number of face images could be reasonably well approximated by storing
a few weights each corresponding to a standard set of trained bases, for each face
image. Later, Turk and Pentland[47] went on to use the variations in the weights to
identify faces. The idea is the same, except that we use iris images. Though the task
seems simple, there are other factors that need to be considered. The distortions and
transformations undergone by an iris image are significantly different from that of a
face image. There are no well known set of features across all iris images which seem to
remain fixed. To start with, an approach as described in [47, 48] is presented. Later,
modifications are made to accommodate various distortions. The main idea is to find
a set of vectors that contribute to significant variation across training images. In this
section, we briefly characterize the PCA method adopted to perform iris encoding
(for details on PCA see [47, 48] as well as the appendix). A typical PCA algorithm
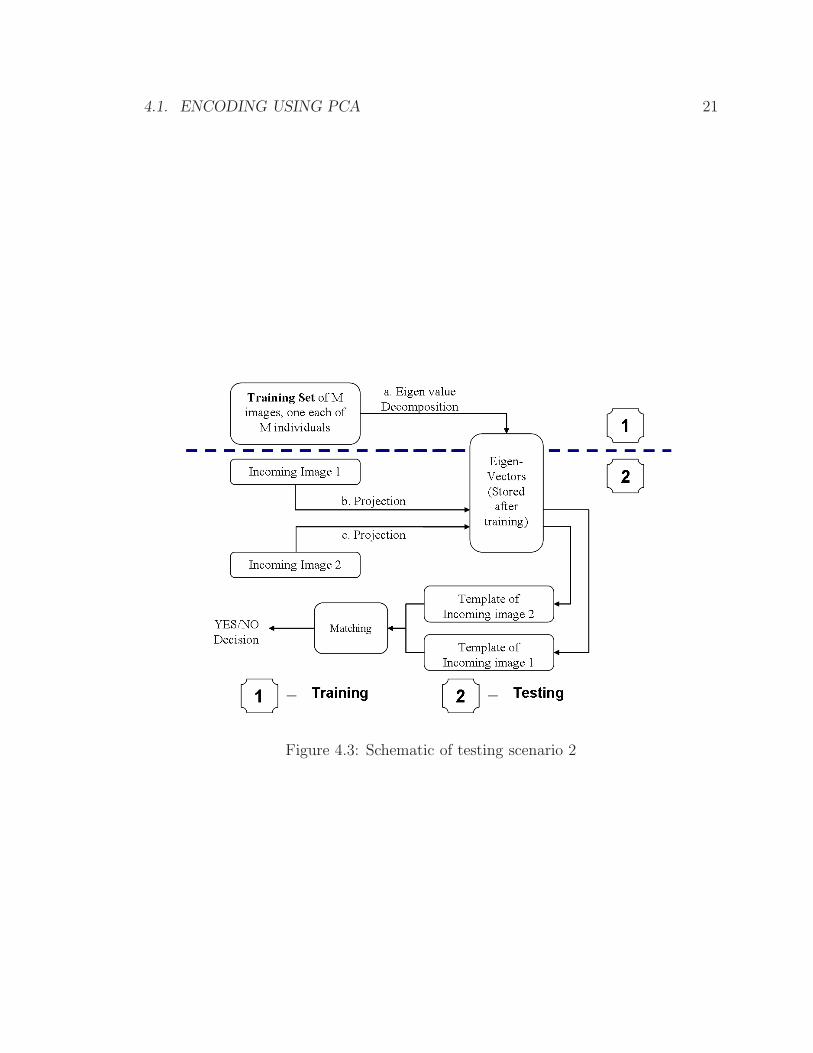
operates in two modes: training and testing as shown in Fig.4.2 and Fig.4.3. During
17
18 CHAPTER 4. PROPOSED ENCODING TECHNIQUES
Figure 4.1: Block-diagram of the system implementing PCA/ICA encoding techniquesfor iris.
the training mode, the principal components are extracted using labeled training
data. During the testing mode, the performance of the iris identification system is
evaluated. Let I(x, y) be an iris image of appropriate size, say 64× 360(n×m) which
is vectorized into a one dimensional vector by placing one column below the other.
Now the size of this vector is (nm)× 1. Let M be the number of iris classes. Suppose
that a training set X1,X2, ...,Xn, a sequence of normalized and preprocessed iris
images(vectorized) indexed in accordance with iris class, is available. This data are
used to form the scatter matrix
Σ =1
M − 1
M∑
i=1
(Xm− X)(X
m− X)T = AAT (4.1)
where X is the empirical mean. Since Σ is positive definite and symmetric, it
can be decomposed using the eigenvalue decomposition method known also as the
Karhunen-Loeve expansion. Thus
Σ = QΛQT (4.2)

4.1. ENCODING USING PCA 19
Figure 4.2: Schematic of testing scenario 1
where Λ is the diagonal matrix of the eigenvalues of arranged in decreasing order and
Q is the orthogonal matrix whose columns form the eigenvectors of Σ (the columns
can be chosen to be orthogonal). Geometrically, the eigenvectors are the basis vectors
of the transformed coordinate system. In practice, the smallest eigenvalues of Σ are
disregarded, and new matrix Q with vector columns corresponding to the essential
eigenvalues is formed. Thus the new transformed space has smaller dimension than
the original space (data compression concept). For iris images, as will be demon-
strated later, the compression is poor.
The above mentioned procedure in practise is however made difficult due to the
dimensionality of the covariance matrix Σ which would be of size (nm)×(nm). Diago-
nalizing such as huge matrix and finding its nm eigenvalues and eigenvectors by itself

20 CHAPTER 4. PROPOSED ENCODING TECHNIQUES
is now rendered difficult. In order to overcome this hurdle, properties of eigenvalues
and eigenvectors were efficiently used in [47] to make the solution computationally
feasible. The number of meaningful eigenvalues would only be M − 1 though the
dimensionality of the space is nm.Hence in this case, we can solve a M × M matrix
for eigenvalues and eigenvectors instead of a (nm)× (nm) matrix from which we can
determine M − 1 meaningful eigenvectors of the huge covariance matrix. Let vi be
the eigenvectors of ATA. Then,
ATAvi = µivi (4.3)
Pre-multiplying both sides by A, we get
AAT (Avi) = µi(Avi) (4.4)
Hence, Avi are the eigenvectors of AAT . This makes calculation of meaningful eigen-
vectors easy. The eigenvectors of ATA are calculated and are pre-multiplied with A
to get the eigenvectors of AAT .
To test the algorithm, each vector in the testing set is further projected onto the
axes of the new transformed space, and the coefficients of projections are collected
in the vector of features, W. To measure the distance between two projected iris
images, we involve two distances: (i) Euclidean and (ii) Hamming. To involve the
second measure, we quantize the values of individual coefficients in the vector W
to ”1” or ”0” if the feature value is greater than zero and less than or equal to
zero, respectively. In order to take rotation into consideration, one of two segmented
and enhanced iris images is rotated systematically on either direction (up to a few
degrees) and templates are extracted for each rotated version of the image. Let
W1 = QTY1and W2 = QTY2 be two PCA coefficient vectors corresponding to two
distinct normalized and preprocessed iris images Y1 and Y2 from the testing set.
Then to compensate for rotation the following minimization step is performed
minθ∈[−θmax,θmax]
d(QTY1, QTY2(θ)) (4.5)
4.1. ENCODING USING PCA 21
Figure 4.3: Schematic of testing scenario 2

22 CHAPTER 4. PROPOSED ENCODING TECHNIQUES
where d(.) denotes the Euclidean or Hamming distance between two projected iris
images and Q is the matrix composed of eigenvectors corresponding to only essential
eigenvalues. Note that for normalized images the rotation operation reduces to the
cyclic shift operation of the second image with respect to the first image.
4.2 Following up with ICA
ICA is a subspace analysis technique. It aims to find a set of independent sources that
capture the underlying randomness of the observed signals. ICA has been applied to
iris analysis in [29, 30, 31]. In those works, randomly selected patches of a small size
from iris images form a training set. This training set is then processed using PCA to
reduce its dimensionality and decorrelate components, before applying ICA locally.
In theory, whitening before ICA is not a necessary step. Though, whitening aids esti-
mation of independent components. The training templates available after applying
PCA form the input to the ICA block. An unmixing matrix, which represents the
ICA basis vectors, is estimated from these PCA input templates by minimizing the
mutual information (a measure of dependence) between transformed components in
ICA space. Previous ICA algorithms [29, 30, 31] do not take rotation (image align-
ment) into account. While this step seems unnecessary in [29, 30, 31], compensation
for a rotation uncertainty is a critical step for our non-ideal iris application. In this
work, we use ICA as a follow up encoding method in anticipation that it will pick
individual fine features present in iris images and thus will improve the performance
of PCA method. Unlike previous ICA algorithms used for iris recognition, we do
not divide iris images into patches during the training step but rather use the entire
iris image to estimate the unmixing matrix and further to extract ICA components.
Denote by X1, X2, ..., Xn a sequence of preprocessed, normalized, and whitened iris
images indexed by their class. During the training mode we assume that each class
is represented by a single iris image. It can be easily generalized to a multi-image
case. ICA is a blind source-separation method. It assumes that observed data can
be represented as a linear combination of a number of independent signals. The un-
knowns are the mixing coefficients and the independent input signals. Let X be a

4.2. FOLLOWING UP WITH ICA 23
matrix with vector columns given by X1, X2, ..., Xn and S be a matrix composed
of unknown independent input signals arranged in columns. Then ICA assumes the
following forward model
X = AS (4.6)
where A is the unknown mixing matrix. As argued in [49], the results of linear mixing
of non-Gaussian signals are more Gaussian than the input signals. Then to estimate
the mixing matrix A and one of the components of S , one has to define a measure
of non-gaussianity. One of the theoretically sound criteria is the maximization of the
negentropy given by
J = HGaus(A−1X) − H(A−1X) (4.7)
where HGaus is the entropy of the data under the assumption that data are Gaussian
distributed and under the constraint of the same covariance matrix for the distribu-
tions in HGaus and in H (see [49] for more detailed explanation). Once the mixing
matrix and one of the input signals are estimated, the remaining input signals can be
obtained by invoking the Gram-Schmidt orthogonalization procedure. To deal with
empirical case, (2) is approximated by expressions involving empirical moments. To
test the performance of ICA method, we use testing data that are different from the
training set. Similar to the case with PCA encoding, we apply two distance measures
to perform matching (i) Euclidean and (ii) Hamming distances. This is done for the
purpose of performance comparison. To overcome the effect of rotation during testing,
we project each rotated version of the two images into PCA space and then into ICA
space and obtain the minimum score between the templates of the different rotated
versions. Let W1 = SQTY1and W2 = SQTY2 be two vectors of ICA coefficients
corresponding to two distinct normalized, preprocessed iris images Y1 and Y2 from
the testing set. The following minimization procedure is applied to compensate for
rotation
minθ∈[−θmax,θmax]
d(SQTY1,SQTY2(θ)) (4.8)

24 CHAPTER 4. PROPOSED ENCODING TECHNIQUES
where d(.) denotes the Euclidean or Hamming distance between two projected iris
images and Q is the matrix of essential eigenvectors introduced in Sec. 2.2. For the
results presented here, the FastICA package was used [50].
Chapter 5
Results
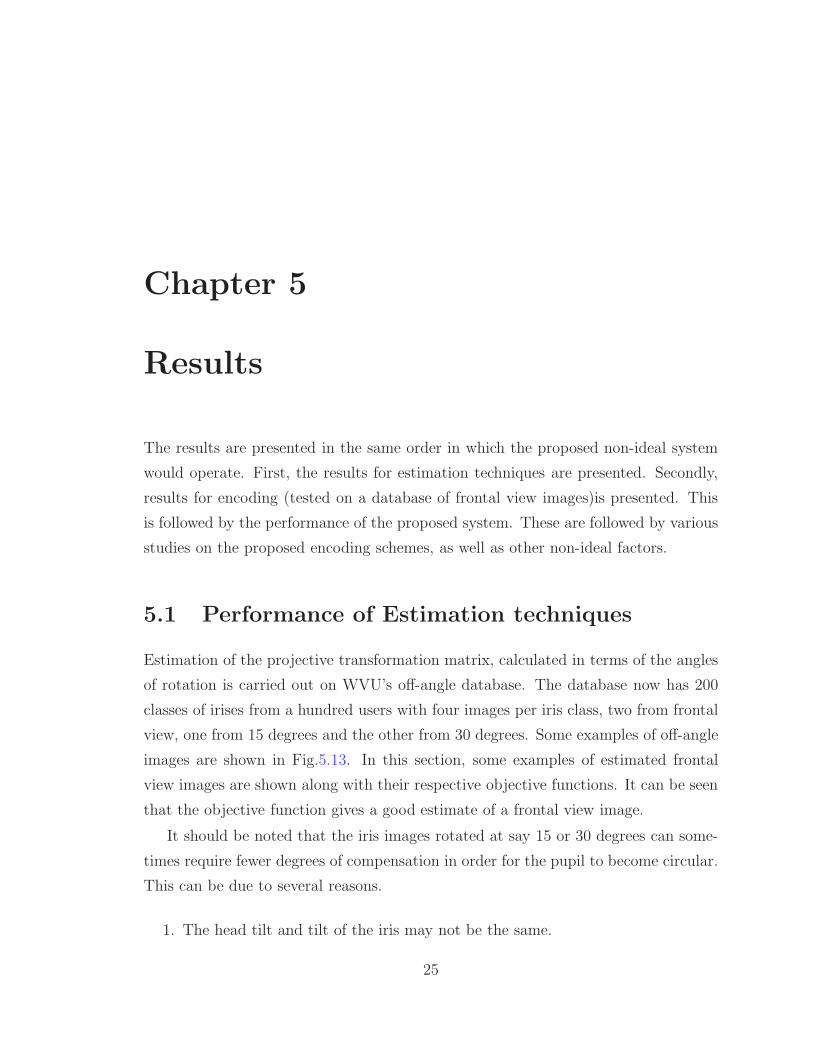
The results are presented in the same order in which the proposed non-ideal system
would operate. First, the results for estimation techniques are presented. Secondly,
results for encoding (tested on a database of frontal view images)is presented. This
is followed by the performance of the proposed system. These are followed by various
studies on the proposed encoding schemes, as well as other non-ideal factors.
5.1 Performance of Estimation techniques
Estimation of the projective transformation matrix, calculated in terms of the angles
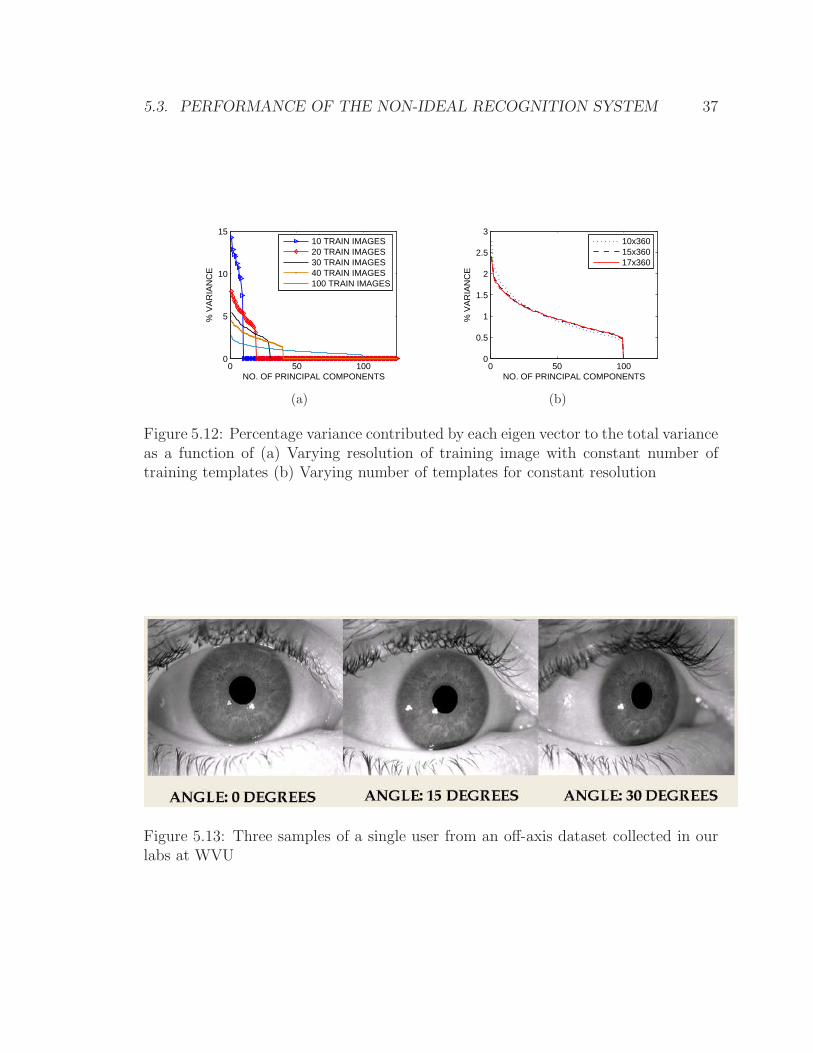
of rotation is carried out on WVU’s off-angle database. The database now has 200
classes of irises from a hundred users with four images per iris class, two from frontal
view, one from 15 degrees and the other from 30 degrees. Some examples of off-angle
images are shown in Fig.5.13. In this section, some examples of estimated frontal
view images are shown along with their respective objective functions. It can be seen
that the objective function gives a good estimate of a frontal view image.
It should be noted that the iris images rotated at say 15 or 30 degrees can some-
times require fewer degrees of compensation in order for the pupil to become circular.
This can be due to several reasons.
1. The head tilt and tilt of the iris may not be the same.
25
26 CHAPTER 5. RESULTS
(a) Original Image (b) Transformed Image
(c) Objective function for various values ofestimates
Figure 5.1: Estimating Off-Angle Using Projective Transform with one axis of rotationusing Hamming Distance as criterion

5.1. PERFORMANCE OF ESTIMATION TECHNIQUES 27
(a) Original Image (b) Transformed Image
(c) Objective function for various values ofestimates
Figure 5.2: Estimating Off-Angle Using Projective Transform with one axis of rotationusing Integro-differential operator

28 CHAPTER 5. RESULTS
Figure 5.3: Estimating Off-Angle Using Projective Transform with two axes of rota-tion
5.1. PERFORMANCE OF ESTIMATION TECHNIQUES 29
(a) Original image 1 (b) Ellipse fitted to original image 1
(c) Original image 2 (d) Ellipse fitted to original image 2
Figure 5.4: Estimating ellipse parameters using the elliptical integro-differential op-erator
30 CHAPTER 5. RESULTS
2. The effect due to aqueous humor and cornea which lies between the iris surface
and the image capture device.
3. Other distortions due to the capture device.
Even if these effects are compensated, information is either introduced or lost due to
interpolation or sampling during projective transformation even when greatest care is
taken. This may not pose a great problem from a recognition point of view if handled
carefully. Other challenges involve the determining whether the iris is tilted either in
the positive or negative direction. This information will help reduce computational
complexity as well as bad estimates. The entire image of the “eye” may not be always
available.
5.2 Results for Encoding of Frontal View Images
All the experiments in this section are performed on the CASIA dataset provided
by the Chinese Academy of Sciences [51]. The CASIA dataset contains iris images
of 108 iris classes with 7 images per iris. Some images in this dataset are strongly
occluded, blurred, and defocused. Sample images from CASIA datasets are shown in
Fig.2.1. Experiments were also conducted on a smaller collection of 22 iris classes at
our labs in WVU which are presented later. As a baseline curve, we use the receiver-
operating characteristic (ROC) for modified J. Daugman’s system [52]. The results of
the modified J. Daugman’s system implementation are shown in Fig.5.7 (black solid
line). In our experiments, global PCA method when applied to iris images, extracted
99 essential eigenvalues to give good performance. The value of 99-th eigenvalue is
significantly larger when compared with the value of the first eigenvalue. This resulted
in a poor compression. This also emphasizes the fact that individual iris is rich in
information.
5.2.1 Compensation for Rotation
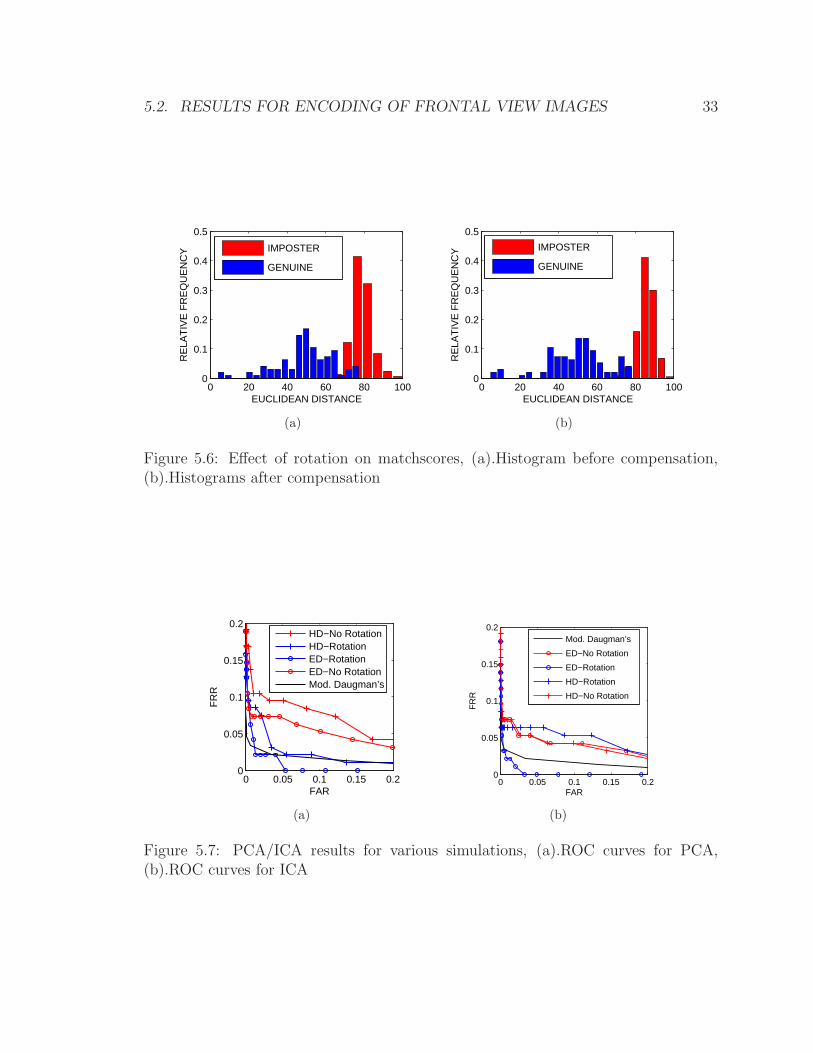
We first demonstrate the effect of rotation on the performance of PCA and global ICA
encoding methods. Fig.5.6 displays two sets of histogram distributions of genuine and

5.2. RESULTS FOR ENCODING OF FRONTAL VIEW IMAGES 31
imposter Euclidean distance scores obtained using the data from the CASIA dataset.
The left and the right panels in Fig.5.6 show the results for iris verification system
implementing PCA encoding technique without and with compensation for rotation,
respectively. Since iris images during processing are transformed to have a pseudo-
polar representation, the angle values used to optimize the performance are measured
in the number of pixels. Each image is normalized such that one pixel in the normal-
ized image corresponds to one degree in the original image. The range of angles used
during these experiments was set to [-10, 10]. Similar results were obtained for en-
coding with ICA technique. The ROC curves demonstrating the effect of rotation are
shown on the left and right panels in Fig.5.7 for PCA and ICA encoding techniques,
respectively. The results are displayed both for Euclidean (ED) and Hamming (HD)
distances. One can conclude that the compensation for head tilt (rotation) leads to
a substantial improvement of performance. Only for results involving both Hamming
distance and ICA, rotation operation is performed during the PCA step. The lowest
scoring PCA template is projected on ICA space. Two scenarios: The performance
of the system in Fig.4.1 is further evaluated using two different scenarios. In the first
scenario, we formed two sets of iris images, training and testing, from the CASIA
database. Each set consisted of one image from 100 different irises. The training set
was formed from the third image of first 100 irises, while the testing set was formed
from the second image of the same irises. In the second scenario, we used the training
only to extract eigenvectors and discarded all training set images. During testing,
PCA components (the first technique) or ICA components (the second technique) of
each image from the test data set were obtained and compared against PCA/ICA
components of the other images in the testing set. Thus, the second scenario can be
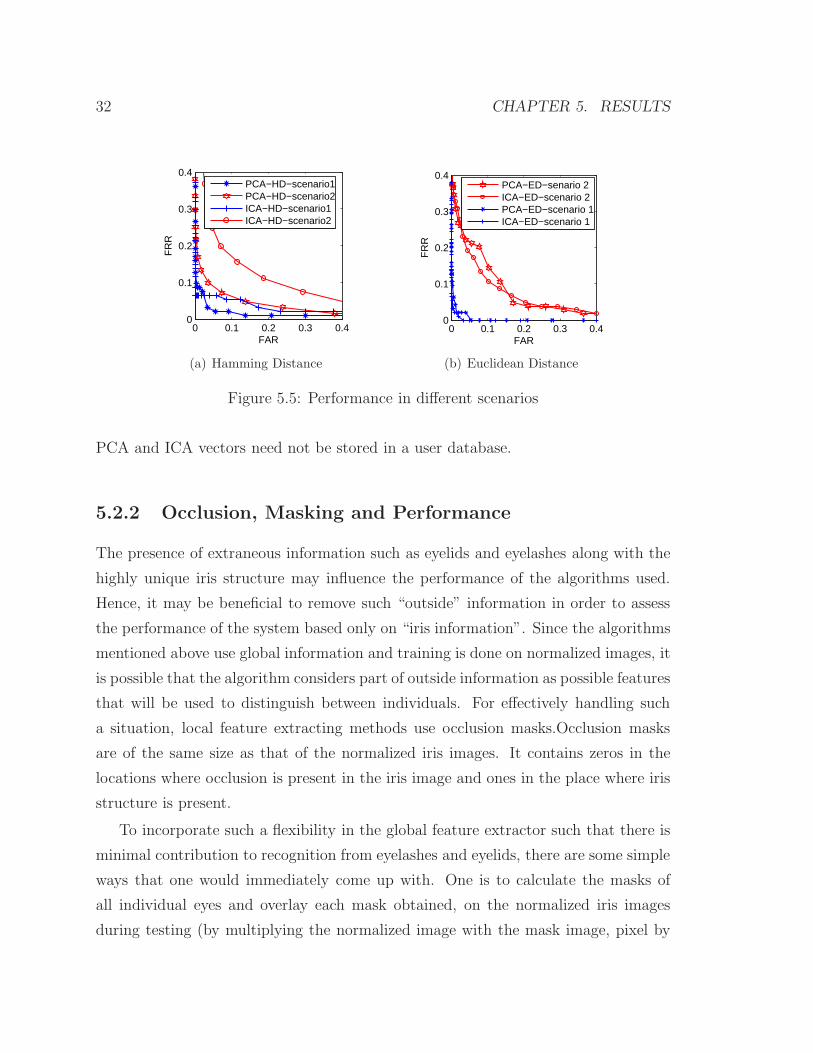
viewed as a “blind” testing. The ROC curves for both scenarios are shown in Fig.5.5 .
The left panel in Fig.5.5 demonstrates the results when Hamming distance is used as
the matching score distance. The right panel demonstrates similar results for the case
when Euclidean distance is applied to calculate the matching scores. As expected,
the results of testing under the “blind” scenario are slightly degraded (both for PCA
and ICA) compared to the results obtained under the first scenario.
The advantage of the “blind” scenario is in its flexibility. The coefficients forming
32 CHAPTER 5. RESULTS
0 0.1 0.2 0.3 0.40
0.1
0.2
0.3
0.4
FAR
FR
R
PCA−HD−scenario1PCA−HD−scenario2ICA−HD−scenario1ICA−HD−scenario2
(a) Hamming Distance
0 0.1 0.2 0.3 0.40
0.1
0.2
0.3
0.4
FAR
FR
R
PCA−ED−senario 2ICA−ED−scenario 2PCA−ED−scenario 1ICA−ED−scenario 1
(b) Euclidean Distance
Figure 5.5: Performance in different scenarios
PCA and ICA vectors need not be stored in a user database.
5.2.2 Occlusion, Masking and Performance
The presence of extraneous information such as eyelids and eyelashes along with the
highly unique iris structure may influence the performance of the algorithms used.
Hence, it may be beneficial to remove such “outside” information in order to assess
the performance of the system based only on “iris information”. Since the algorithms
mentioned above use global information and training is done on normalized images, it
is possible that the algorithm considers part of outside information as possible features
that will be used to distinguish between individuals. For effectively handling such
a situation, local feature extracting methods use occlusion masks.Occlusion masks
are of the same size as that of the normalized iris images. It contains zeros in the
locations where occlusion is present in the iris image and ones in the place where iris
structure is present.
To incorporate such a flexibility in the global feature extractor such that there is
minimal contribution to recognition from eyelashes and eyelids, there are some simple
ways that one would immediately come up with. One is to calculate the masks of
all individual eyes and overlay each mask obtained, on the normalized iris images
during testing (by multiplying the normalized image with the mask image, pixel by
5.2. RESULTS FOR ENCODING OF FRONTAL VIEW IMAGES 33
0 20 40 60 80 1000
0.1
0.2
0.3
0.4
0.5
EUCLIDEAN DISTANCE
RE
LAT
IVE
FR
EQ
UE
NC
Y IMPOSTER
GENUINE
(a)
0 20 40 60 80 1000
0.1
0.2
0.3
0.4
0.5
EUCLIDEAN DISTANCE
RE
LAT
IVE
FR
EQ
UE
NC
Y IMPOSTER
GENUINE
(b)
Figure 5.6: Effect of rotation on matchscores, (a).Histogram before compensation,(b).Histograms after compensation
0 0.05 0.1 0.15 0.20
0.05
0.1
0.15
0.2
FAR
FR
R
HD−No RotationHD−RotationED−RotationED−No RotationMod. Daugman’s
(a)
0 0.05 0.1 0.15 0.20
0.05
0.1
0.15
0.2
FAR
FR
R
Mod. Daugman’s
ED−No Rotation
ED−Rotation
HD−Rotation
HD−No Rotation
(b)
Figure 5.7: PCA/ICA results for various simulations, (a).ROC curves for PCA,(b).ROC curves for ICA

34 CHAPTER 5. RESULTS
pixel). Hence, in all pixel locations which initially consisted of gray scale values from
occlusions, it will now be some constant value (zero in this case). But this would
mean that different training images (as well as testing images) would have different
masked areas. There is again is a possibility that the boundary between the masked
area and the iris texture region could again be considered as a feature by the feature
selection algorithm as the boundary is of different shapes in different training images.
This would totally defeat the purpose of what the mask was meant to do in the first
place. A better way would be to have a common mask for all training images (if
not the testing images). By this we make the region covered by the common mask,
common across all the users and hence redundant. Since all these values are constant
(zero in this case), it would not affect the final matching score.
Since it is now decided that a common mask would be used, it can be constructed
in two ways. One is to perform an “AND” operation on all the individual masks. But
even if a single or couple of masks have extremely high occlusion, the final area of iris
texture under consideration for all the training and testing images will be very small.
To discard such images from training will be to train the system on a biased set of
users. Hence, to deal with such a situation and to strike a balance between including
too much occlusion and losing too much information, a standard mask that covers
probable iris regions is generated. This is not dependent on individual masks of any
of the iris images but based on the knowledge that many times during capture of an
iris image, there is some amount of occlusion from both upper and lower eyelid.
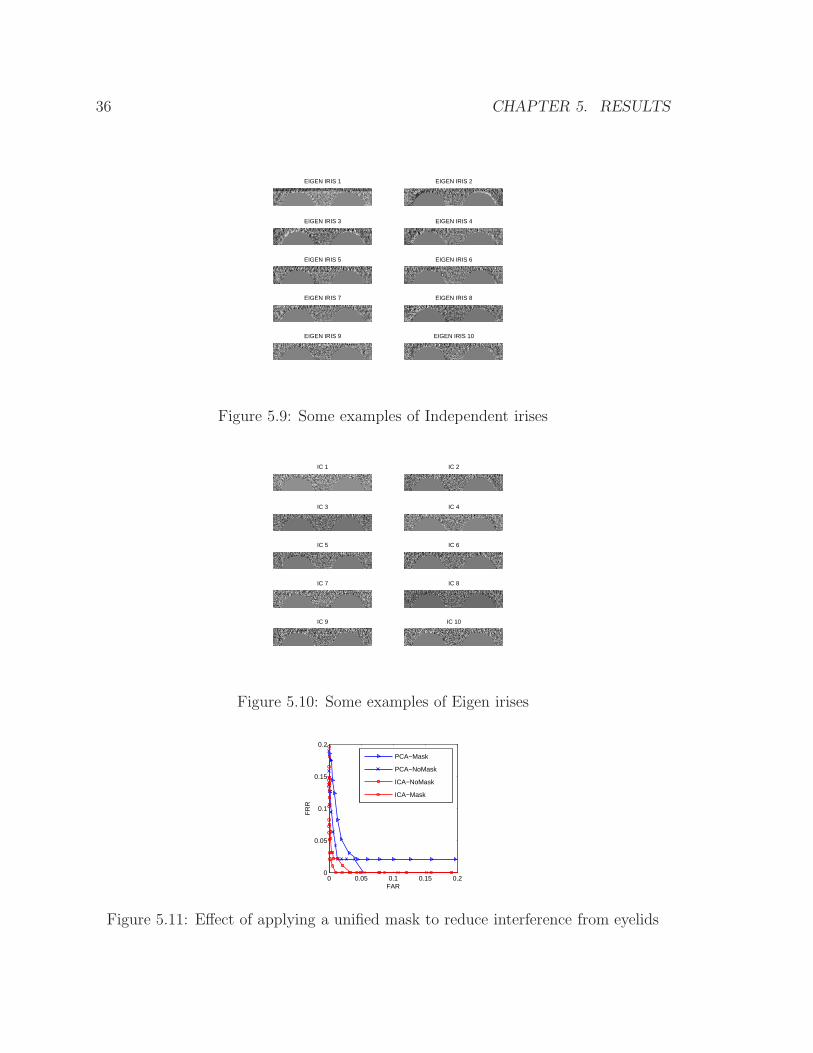
Now the experiments are performed with such as standard mask and the masked
images. The eigenvectors and ICs for the training set are shown in Fig.5.9 and
Fig.5.10. The performance of such a system is compared with the previous version
without mask in Fig.5.11 in terms of their respective ROCs. Here, we see that the
PCA algorithm has a degraded performance than before but ICA algorithm performed
after PCA improves significantly with standard masks applied. The improvement in
performance of ICA followed by PCA indicates that this particular kind of algorithm
captures fine features better than the more dominant structure information, while
PCA tries to capture structure information at a low frequency better than the finer
features.The reader is cautioned to be extremely cautious in selection of such standard

5.3. PERFORMANCE OF THE NON-IDEAL RECOGNITION SYSTEM 35
IRIS IMAGE 1 IRIS IMAGE 2
IRIS IMAGE 3 IRIS IMAGE 4
IRIS IMAGE 5 IRIS IMAGE 6
IRIS IMAGE 7 IRIS IMAGE 8
IRIS IMAGE 9 IRIS IMAGE 10
Figure 5.8: Some examples of masked images
mask, especially when specular reflections are a part of the acquisition device.
The masking procedure makes the results more robust. It also gives an idea of
the kind of features that contribute more to recognition.
5.3 Performance of the Non-ideal Recognition sys-
tem
For considering the effect of view on performance, testing is done on twenty seven iris
classes from the WVU’s off-angle iris image dataset. Distances based on global ICA
algorithm are calculated for three different sets of images. The three sets are
1. Two zero degree images per iris class.
2. One zero degree image and one fifteen degree image per iris class.
3. One zero degree image and one thirty degree image per iris class.
The results shown in Fig.5.14 were obtained by performing projective transforma-
tion at an angle estimated initially during collection of the images. Only one axis of
rotation is considered. The axis of rotation can be assumed to lie on either the left
36 CHAPTER 5. RESULTS
EIGEN IRIS 1 EIGEN IRIS 2
EIGEN IRIS 3 EIGEN IRIS 4
EIGEN IRIS 5 EIGEN IRIS 6
EIGEN IRIS 7 EIGEN IRIS 8
EIGEN IRIS 9 EIGEN IRIS 10
Figure 5.9: Some examples of Independent irises
IC 1 IC 2
IC 3 IC 4
IC 5 IC 6
IC 7 IC 8
IC 9 IC 10
Figure 5.10: Some examples of Eigen irises
0 0.05 0.1 0.15 0.20
0.05
0.1
0.15
0.2
FAR
FR
R
PCA−Mask
PCA−NoMask
ICA−NoMask
ICA−Mask
Figure 5.11: Effect of applying a unified mask to reduce interference from eyelids
5.3. PERFORMANCE OF THE NON-IDEAL RECOGNITION SYSTEM 37
0 50 1000
5
10
15
NO. OF PRINCIPAL COMPONENTS
% V
AR
IAN
CE
10 TRAIN IMAGES20 TRAIN IMAGES30 TRAIN IMAGES40 TRAIN IMAGES100 TRAIN IMAGES
(a)
0 50 1000
0.5
1
1.5
2
2.5
3
NO. OF PRINCIPAL COMPONENTS
% V
AR
IAN
CE
10x36015x36017x360
(b)
Figure 5.12: Percentage variance contributed by each eigen vector to the total varianceas a function of (a) Varying resolution of training image with constant number oftraining templates (b) Varying number of templates for constant resolution
Figure 5.13: Three samples of a single user from an off-axis dataset collected in ourlabs at WVU

38 CHAPTER 5. RESULTS
edge, right edge, or center of the image. The true axis of rotation is unknown. Here
it was assumed to be at the centre of the image.
The results presented in Fig.5.14 were performed on the above mentioned database
from WVU. It shows ROCs for different combinations of training and testing when
using the initial estimate as the true estimate.
0 0.05 0.1 0.15 0.2 0.25 0.3 0.35 0.40.6
0.65
0.7
0.75
0.8
0.85
0.9
0.95
1
FAR
GA
R
TRAIN 0 DEG − TEST 0 DEG
TRAIN 0 DEG − TEST 15 DEG
TRAIN 0 DEG − TEST 30 DEG
(a)
0 0.05 0.1 0.15 0.2 0.25 0.3 0.35 0.40.6
0.65
0.7
0.75
0.8
0.85
0.9
0.95
1
FAR
GA
R
TRAIN 15 DEG − TEST 0 DEG
TRAIN 15 DEG − TEST 30 DEG
(b)
Figure 5.14: Performance of algorithms when using initial estimates for angles. (a).Train on 0 degree images and tested on others, and (b). Train on 15 degree imagesand tested on others
The results presented in Fig.5.15 were performed on the above mentioned database
from WVU. It shows ROCs for different combinations of training and testing after
compensating for two axes of rotation using the optimization technique (integro-
differential operator) to obtain the true estimate. Clearly, the performance has im-
proved considerably over using just the initial estimate. However, the performance
degrades as the difference in rotation between iris images increases significantly. One
reason might be the interpolation stratergy adopted during projective transformation.
Here, bicubic interpolation was used leading to highly smooth frontal view image for
greater angles of rotation. This can be overcome with a better resampling technique.
5.4 Other Studies on Encoding
Apart from the above encoding results, a number of other experiments related to the
system design have been conducted. These are performed on frontal view images,

5.4. OTHER STUDIES ON ENCODING 39
0 0.05 0.1 0.15 0.2 0.25 0.3 0.35 0.40.6
0.65
0.7
0.75
0.8
0.85
0.9
0.95
1
FAR
GA
R
TRAIN 0 DEG − TEST 0 DEG
TRAIN 0 DEG − TEST 15 DEG
TRAIN 0 DEG − TEST 30 DEG
(a)
0 0.05 0.1 0.15 0.2 0.25 0.3 0.35 0.40.4
0.5
0.6
0.7
0.8
0.9
1
FAR
GA
R
TRAIN 15 DEG − TEST 0 DEG
TRAIN 15 DEG − TEST 30 DEG
(b)
0 0.05 0.1 0.15 0.2 0.25 0.3 0.35 0.40.6
0.65
0.7
0.75
0.8
0.85
0.9
0.95
1
FAR
GA
R
TRAIN 30 DEG − TEST 0 DEG
TRAIN 30 DEG − TEST 15 DEG
(c)
Figure 5.15: Performance of algorithms after compensating using the optimizationtechnique (integro-differential operator). (a). Train on 0 degree images and testedon others (b). Train on 15 degree images and tested on others, and (c). Train on 30degree images and tested on others
40 CHAPTER 5. RESULTS
predominantly using the CASIA dataset.
5.4.1 How many Eigenvectors?
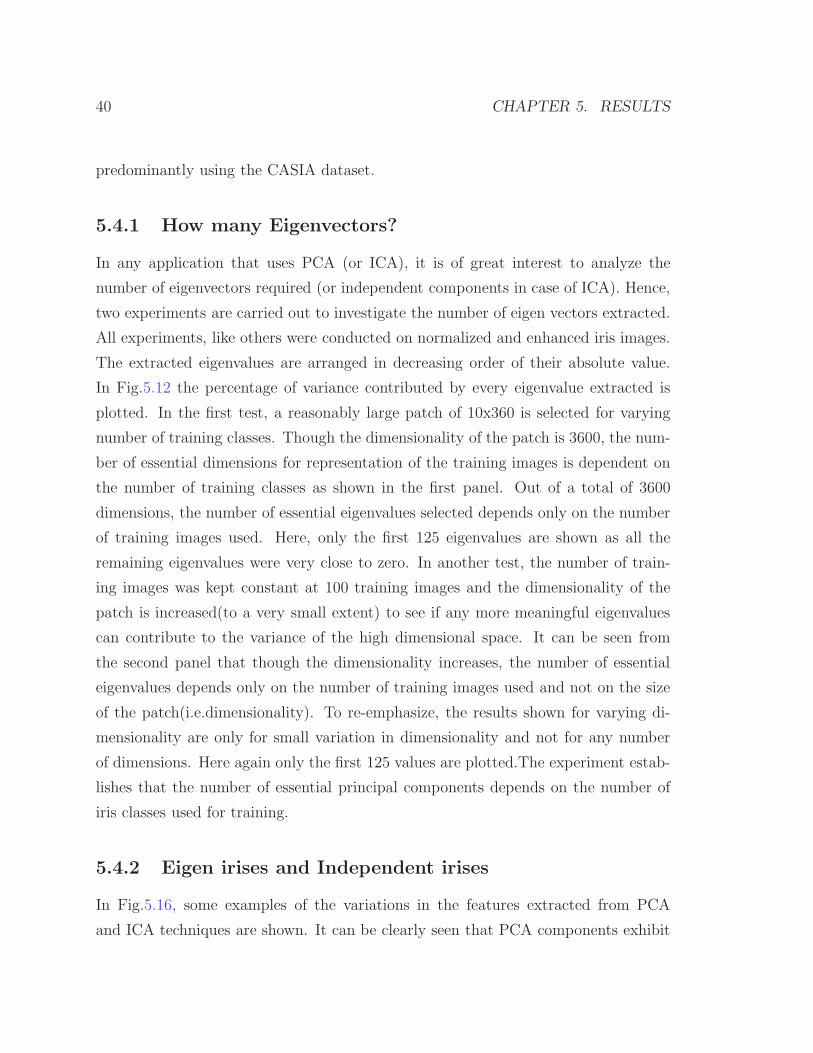
In any application that uses PCA (or ICA), it is of great interest to analyze the
number of eigenvectors required (or independent components in case of ICA). Hence,
two experiments are carried out to investigate the number of eigen vectors extracted.
All experiments, like others were conducted on normalized and enhanced iris images.
The extracted eigenvalues are arranged in decreasing order of their absolute value.
In Fig.5.12 the percentage of variance contributed by every eigenvalue extracted is
plotted. In the first test, a reasonably large patch of 10x360 is selected for varying
number of training classes. Though the dimensionality of the patch is 3600, the num-
ber of essential dimensions for representation of the training images is dependent on
the number of training classes as shown in the first panel. Out of a total of 3600
dimensions, the number of essential eigenvalues selected depends only on the number
of training images used. Here, only the first 125 eigenvalues are shown as all the
remaining eigenvalues were very close to zero. In another test, the number of train-
ing images was kept constant at 100 training images and the dimensionality of the
patch is increased(to a very small extent) to see if any more meaningful eigenvalues
can contribute to the variance of the high dimensional space. It can be seen from
the second panel that though the dimensionality increases, the number of essential
eigenvalues depends only on the number of training images used and not on the size
of the patch(i.e.dimensionality). To re-emphasize, the results shown for varying di-
mensionality are only for small variation in dimensionality and not for any number
of dimensions. Here again only the first 125 values are plotted.The experiment estab-
lishes that the number of essential principal components depends on the number of
iris classes used for training.
5.4.2 Eigen irises and Independent irises
In Fig.5.16, some examples of the variations in the features extracted from PCA
and ICA techniques are shown. It can be clearly seen that PCA components exhibit

5.4. OTHER STUDIES ON ENCODING 41
0 20 40 60 80 100−4000
−2000
0
2000
4000
6000
PRINCIPAL COMPONENTS
VA
LUE
OF
CO
EF
FIC
IEN
T Template 3Template 4
(a) PCA coefficients
0 20 40 60 80 100−2
0
2
4
6
8
10
INDEPENDENT COMPONENTS
VA
LUE
OF
CO
EF
FIC
IEN
T Template 1Template 3Template 4
(b) ICA coefficients
Figure 5.16: Plot of image after projection into different trained subspaces
variation across different locations. The weighting coefficients from PCA(i.e.template
values) give an idea about how close the incoming image resembles the trained basis
function. Most of the basis functions seem to play a significant role in the final
approximation to the input image in terms of the principal components. This is due
to the fact that each of these bases contribute to a significant proportion of the total
variance in comparison with the other selected bases. In sharp contrast, the projection
coefficients from ICA tend to have a peaking value at some locations and very small
values elsewhere. This suggests that the extracted independent components are highly
similar to the training images at a very few locations and different than most ICs.
Since the extracted components are independent and the training images similar to
very few basis functions, it suggests that iris images themselves are statistically very
different from each other(upto a few orders of statistics), thereby providing an implicit
explanation of why iris structure offers such a good performance for recognition when
we use statistics of lower orders. To say that each iris texture is totally different
from the other irises may not always mean that the basic texture pattern is different
(atleast not always). The underlying process in the generation of iris textures during
birth is still the same which is the reason iris patterns are classified as iris patterns
and can be distinguished from other texture patterns. Performance is a result of
difference in spatial location of patterns which do not change dramatically over a life
time.
As a result of the above experiments, one could propose that in continuum, each
42 CHAPTER 5. RESULTS
0
50
1000
50100
0
0.1
0.2
0.3
0.4
NO. OF USERSNO. OF EIGENVECTORS
EQ
UA
L E
RR
OR
RA
TE
(E
ER
)
(a) PCA
0
50
1000
50100
0
0.1
0.2
0.3
0.4
NO. OF USERSNO. OF ICs
EQ
UA
L E
RR
OR
RA
TE
(E
ER
)
(b) ICA
Figure 5.17: Verification performance with varying number of essential componentsand number of users
0
50
1000
50100
0
0.5
1
NO. OF USERSNO. OF EIGENVECTORS
TO
TA
L P
(ER
RO
R)
(a) PCA
0
50
1000
50100
0
0.5
1
NO. OF USERSNO. OF ICs
TO
TA
L P
(ER
RO
R)
(b) ICA
Figure 5.18: Identification performance with varying number of essential componentsand number of users
new iris class adds a new orthonormal/independent axis and that in practice, the
number of essential eigenirises is limited by iris image resolution and by preprocessing
(ongoing research).
5.4.3 Effect of Varying the Number of Essential Components
To understand the effect of the number of essential components (essential eigenvalues
in case of PCA and essential number of independent components in case of ICA),
tests were conducted on the same database and the results are presented below in the
form of a surface plot.

5.4. OTHER STUDIES ON ENCODING 43
0 2 4 6 8 100.88
0.9
0.92
0.94
0.96
0.98
1
NUMBER OF TOP MATCHES
RE
CO
GN
ITIO
N R
AT
E
PCA−M
ICA−M
PCA−NM
ICA−NM
(a)
1 2 3 4 50.88
0.9
0.92
0.94
0.96
0.98
1
NUMBER OF TRAIN IMAGES
RE
CO
GN
ITIO
N R
AT
E
PCA
ICA
(b)
Figure 5.19: (a). Recognition performance with top N matches. M- with maskingfor occlusions, NM-without masking for occlusions. (b).Performance of proposedtechniques as the number of training images in identification case. There is clearlyan improvement in performance when using more training templates.
Verification and Identification
In Fig.5.17, verification results are presented. In Fig.5.18, identification results are
presented. In the verification case, it can be seen that, for a given number of training
images, as the number of Eigenvectors increases, the performance improves. More-
over, as the number of training images increases, the performance at lower number
of Eigenvectors improves as well. But whenever (N-1) eigenvectors are used (where
N is the number of training images, which is also the number of iris classes in this
case) the performance reaches it best value. This emphasizes the importance of each
eigenvector, even as the number of iris classes used for training increases which is due
to the unique texture that each iris class possesses. It also reemphasizes the fact that
the number of essential eigenvectors for N training images (where N is reasonably
large, but not too large) is (N-1) as seen in the previous sections.
5.4.4 Identification case with top N matches
Identification performance can also be quantified based on “top N matches”. Here,
the probability of the true user’s template being selected atleast once in the top N
choices (that the system gives as output) is considered. For example, if there is a
huge database of users to be compared against in an identification scenario, then the
44 CHAPTER 5. RESULTS
system comes up with a smaller list of N possible matches. Even if one of the templates
from the possible matches correspond to the true user, we say that identification is
achieved. This kind of matching is more useful and reasonable where there is a
human inspector to make a final decision. The purpose is to reduce the workload of
the human inspector. Fig.5.19 shows the graph for N versus identification rate, where
N is the number of top matches selected. A total of 100 iris classes were considered.
5.4.5 Relative Composition of Training and Testing Sets
The relative composition of training and testing sets is one of importance to under-
stand the performance of the system under different conditions that may exist in real
world applications. Hence, the number of retained eigenvalues (here equal to the
number of eigenvectors) is varied at different levels for each predetermined number
of training images. It can be seen from Fig.5.19 that though the number of train-
ing images is lesser, as long as we retain enough number of eigenvectors we obtain
good performance. It is also necessary to see the effect of including test images from
imposters who are not enrolled in the system. In Fig.5.19, results corresponding to
variation in relative composition of training and testing sets is provided.
In order to see this effect, we initially train on one image, test on another image
from the same user. The number of training images per user is slowly increased while
the same testing images are retained to verify how such training affects performance.
Here, the overlap between genuine and imposter scores increases if we do not use the
information that we may have more than one template of a given user. If the criterion
that all templates present in the database for a given user should give a positive result
is used(i.e. “AND” operation), then the performance would worsen as the number
of templates used for training increases. This is because the incoming template faces
a tougher challenge of being accepted by all the templates in the database. In case
of identification results presented in Fig.5.19, even if one of the trained templates
produces the lowest score, the person is considered identified(i.e. “OR” operation).
It can be seen that as the number of training images increases, the performance also
improves for both PCA and ICA. Hence, in verification mode, if a user is accepted even
5.4. OTHER STUDIES ON ENCODING 45
Figure 5.20: Downsampling of a normalized iris image
if one of the multiple matchscores fall below a certain threshold, then the performance
would actually improve for the data at hand. Operations such as “AND”, “OR” etc.
are only simple techniques. With other smart ways of combining the different match
scores, the performance would actually improve.
5.4.6 Effect of Varying the Resolution
In order to measure the effectiveness of the proposed algorithms based on PCA and
ICA techniques, with respect to variations in resolution, we interpolate our iris images
to a lower resolution grid. Two strategies of reducing image resolution were considered
(i) down sampling and (ii) averaging. The first strategy is performed by selecting every
second pixel in both the row and column directions. The second strategy is performed
by averaging the original higher resolution image over non-overlapping blocks of size
2-by-2. Hence, in both the cases we have one point in the lower resolution grid for
every four points in the next higher resolution grid. Fig.5.21 presents synthesized
results. Empirical study of the effect of varying the resolution on the performance
of the iris based identification system is an ongoing work at WVU. An example of
downsampling a normalized iris image is presented in Fig.5.20.
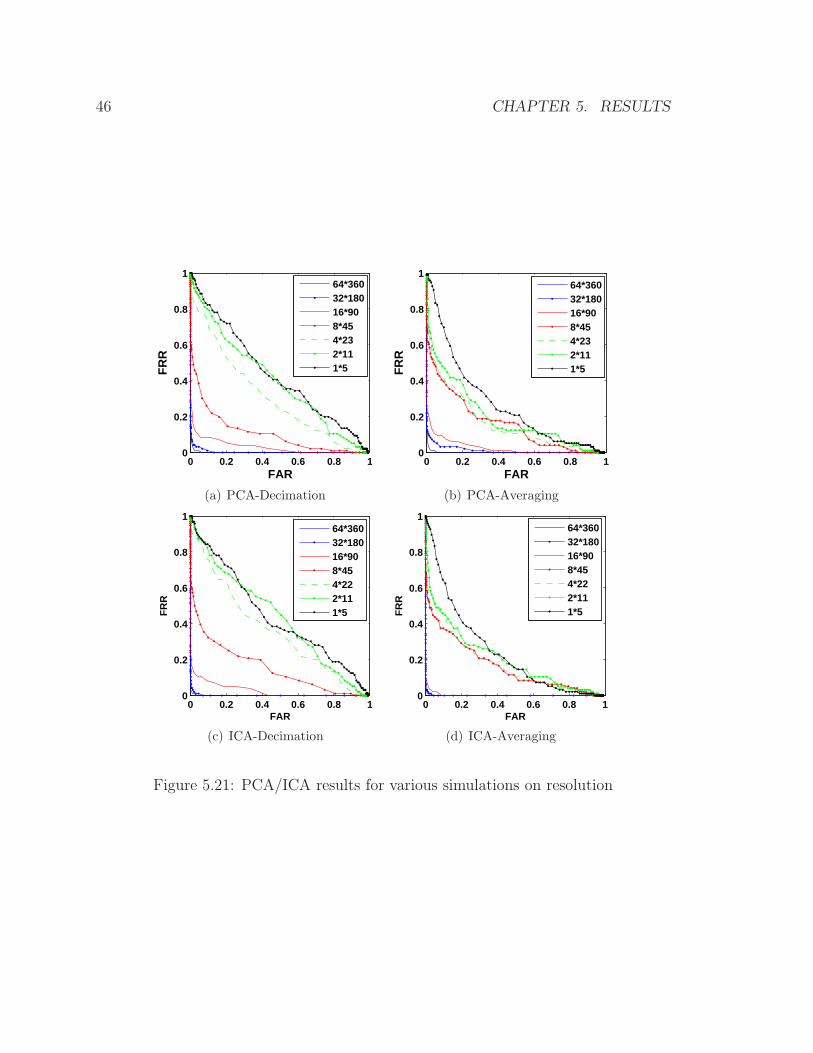
46 CHAPTER 5. RESULTS
0 0.2 0.4 0.6 0.8 10
0.2
0.4
0.6
0.8
1
FAR
FR
R
64*36032*18016*908*454*232*111*5
(a) PCA-Decimation
0 0.2 0.4 0.6 0.8 10
0.2
0.4
0.6
0.8
1
FAR
FR
R
64*36032*18016*908*454*232*111*5
(b) PCA-Averaging
0 0.2 0.4 0.6 0.8 10
0.2
0.4
0.6
0.8
1
FAR
FR
R
64*36032*18016*908*454*222*111*5
(c) ICA-Decimation
0 0.2 0.4 0.6 0.8 10
0.2
0.4
0.6
0.8
1
FAR
FR
R
64*36032*18016*908*454*222*111*5
(d) ICA-Averaging
Figure 5.21: PCA/ICA results for various simulations on resolution
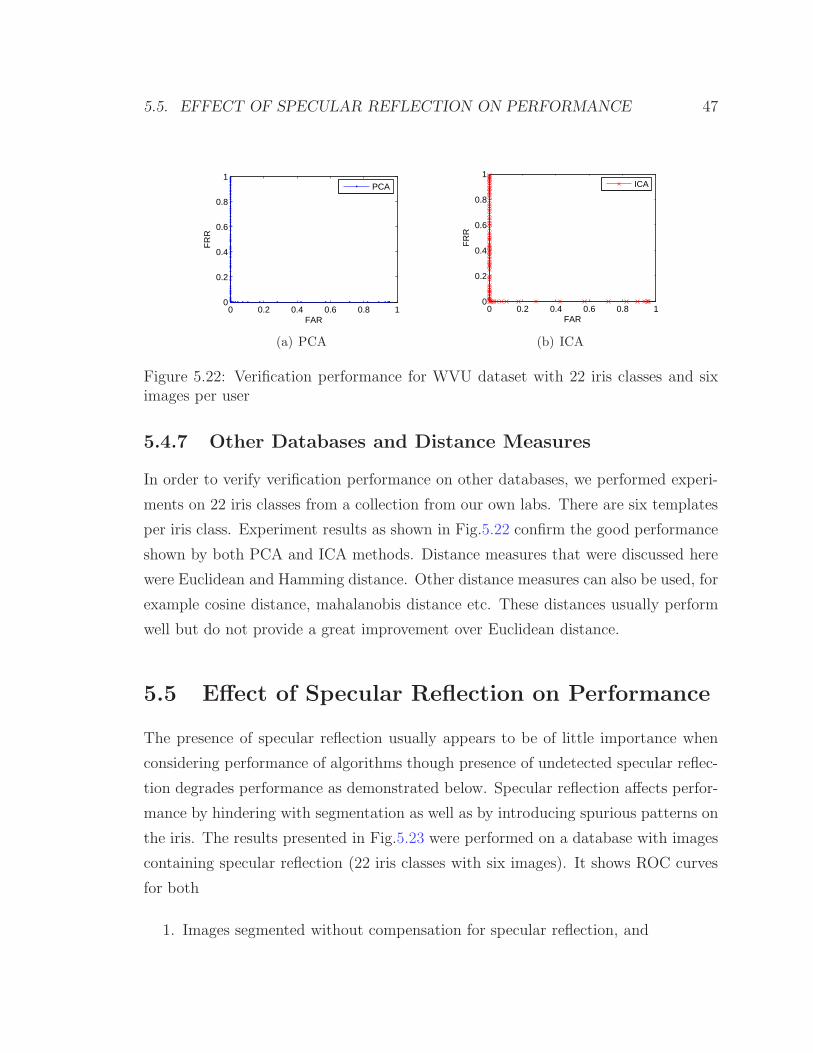
5.5. EFFECT OF SPECULAR REFLECTION ON PERFORMANCE 47
0 0.2 0.4 0.6 0.8 10
0.2
0.4
0.6
0.8
1
FAR
FR
R
PCA
(a) PCA
0 0.2 0.4 0.6 0.8 10
0.2
0.4
0.6
0.8
1
FAR
FR
R
ICA
(b) ICA
Figure 5.22: Verification performance for WVU dataset with 22 iris classes and siximages per user
5.4.7 Other Databases and Distance Measures
In order to verify verification performance on other databases, we performed experi-
ments on 22 iris classes from a collection from our own labs. There are six templates
per iris class. Experiment results as shown in Fig.5.22 confirm the good performance
shown by both PCA and ICA methods. Distance measures that were discussed here
were Euclidean and Hamming distance. Other distance measures can also be used, for
example cosine distance, mahalanobis distance etc. These distances usually perform
well but do not provide a great improvement over Euclidean distance.
5.5 Effect of Specular Reflection on Performance
The presence of specular reflection usually appears to be of little importance when
considering performance of algorithms though presence of undetected specular reflec-
tion degrades performance as demonstrated below. Specular reflection affects perfor-
mance by hindering with segmentation as well as by introducing spurious patterns on
the iris. The results presented in Fig.5.23 were performed on a database with images
containing specular reflection (22 iris classes with six images). It shows ROC curves
for both
1. Images segmented without compensation for specular reflection, and
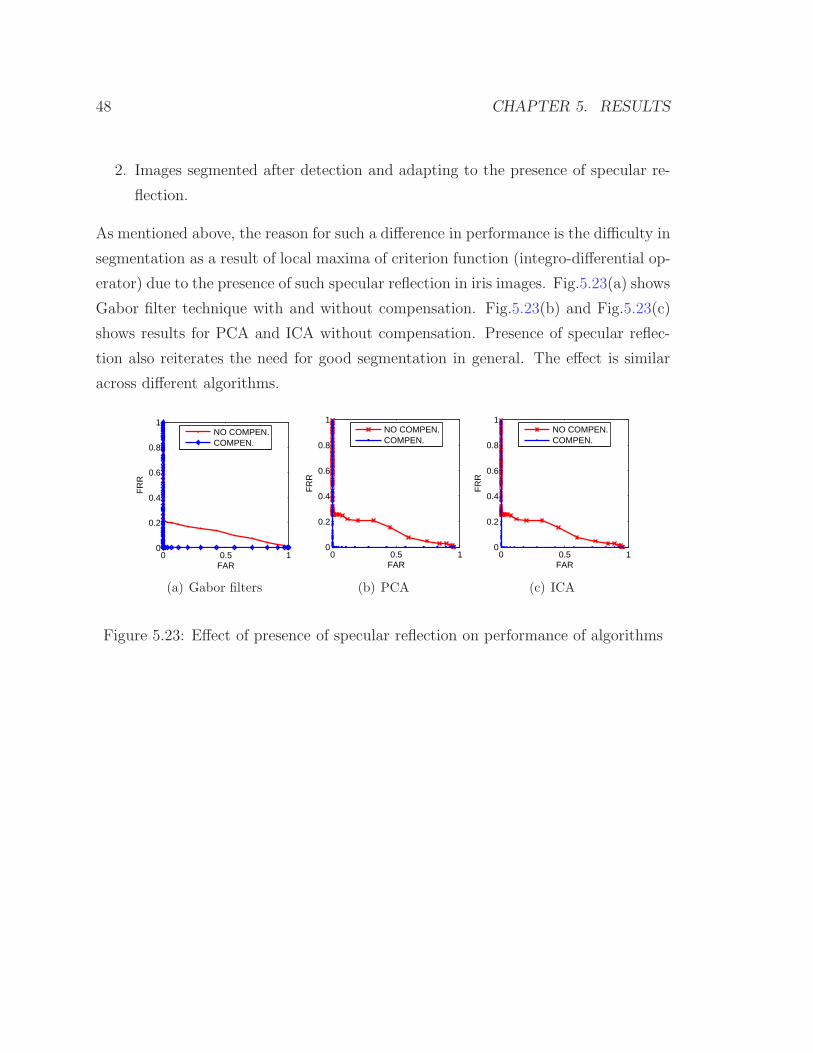
48 CHAPTER 5. RESULTS
2. Images segmented after detection and adapting to the presence of specular re-
flection.
As mentioned above, the reason for such a difference in performance is the difficulty in
segmentation as a result of local maxima of criterion function (integro-differential op-
erator) due to the presence of such specular reflection in iris images. Fig.5.23(a) shows
Gabor filter technique with and without compensation. Fig.5.23(b) and Fig.5.23(c)
shows results for PCA and ICA without compensation. Presence of specular reflec-
tion also reiterates the need for good segmentation in general. The effect is similar
across different algorithms.
0 0.5 10
0.2
0.4
0.6
0.8
1
FAR
FR
R
NO COMPEN.COMPEN.
(a) Gabor filters
0 0.5 10
0.2
0.4
0.6
0.8
1
FAR
FR
R
NO COMPEN.COMPEN.
(b) PCA
0 0.5 10
0.2
0.4
0.6
0.8
1
FAR
FR
R
NO COMPEN.COMPEN.
(c) ICA
Figure 5.23: Effect of presence of specular reflection on performance of algorithms
Chapter 6
Summary and Future Work
6.1 Summary
Non-ideal iris data was defined and a new framework for non-ideal iris recognition
has been proposed upon which future recognitions systems can be built. Using off-
angle iris data collected at WVU, it was shown that relative position of the acquisition
device with respect to an individual’s eye affects recognition performance significantly.
Hence, an improved system was proposed to deal with off-angle images. The system
operates in two stages. Firstly, the view of the individual is estimated using one of
circular integro-differential operator, hamming distance and ellipse fitting techniques.
Then the same image is transformed using projective geometry to bring the view of
the off-axis iris image to frontal view. These images are then encoded as though
they were frontal view images using global Principal Component Analysis and global
Independent Component Analysis. The proposed technique was tested using off-axis
data collected at WVU (after compensation) as well as other frontal view datasets
using encoding methods developed for frontal view iris images. Based on the results,
it can be concluded that the proposed system improves recognition performance of
off-axis iris data. It has also been shown that performance depends on various other
factors apart from off-angle.
49
50 CHAPTER 6. SUMMARY AND FUTURE WORK
6.2 Future Work
There are a lot of future directions for improving the system, especially its robustness.
The model parameters used for recovering pose can be expanded to include the iris-
sclera boundary and the eyelid boundary (which need to be estimated jointly with
the transformation matrix). The position and size of specular reflections offer a way
to estimate both the gaze of the individual w.r.t the camera as well as motion blur.
But parameters will be dependent on various relative positions which need to be
estimated. The number, positions and size of reflections will also play a role for
camera specific estimations. The effect of the cornea and aqueous humor needs to be
taken care of. Though a projective formulation has proved effective, the distortions
due to the aqueous humour and the lens tend to have a significant impact on the final
acquired image. This can be accounted for using modelling techniquesfor parameters
specific to the human iris. The schematic shown in Fig.3.2 represents a generic non-
ideal iris recognition system. As mentioned earlier, effort should be made to reduce
the number of blocks chosen out of this generic block diagram to build recognition
systems without loss of performance. For example, it is possible to develop a system
that would encode a given iris in such a way that most pre-processing steps such as
compensation and normalization are not required, i.e. the encoding should be more
invariant to variability in input. The quality assessment block needs to be developed
to provide a reliable output that will be an integral part of future systems. If the need
arises, compensation blocks can be developed to incorporate steps such as deblurring,
super-resolution, fusing other available data etc. Robust segmentation is an essential
step towards better recognition performance. Hence, segmentation algorithms need
to be given greater importance for non-ideal data.
Bibliography
[1] T. Mansfield, G. Kelly, D. Chandler, and J. Kane, “Biometric product
testing final report,” CESG/BWG Biometric Test Programme CESG con-
tractX92A/4009309, Centre for Mathematics and Scientific Computing, National
Physical Laboratory, Queens Road, March 2001.
[2] J. Daugman, “High confidence visual recognition of persons by a test of sta-
tistical independence,” IEEE Transactions on Pattern Analysis and Machine
Intelligence, vol. 15, no. 11, pp. 1148–1161, 1993.
[3] J. Daugman, “How iris recognition works,” in ICIP02, 2002, pp. I: 33–36.
[4] J. Daugman, “The importance of being random: statistical principles of iris
recognition,” PR, vol. 36, no. 2, pp. 279–291, February 2003.
[5] J. Daugman, “Statistical richness of visual phase information: Update on rec-
ognizing persons by iris patterns,” IJCV, vol. 45, no. 1, pp. 25–38, October
2001.
[6] Li Ma, T. Tan, Y. Wang, and D. Zhang, “Personal identification based on
iris texture analysis,” IEEE Transactions on Pattern Analysis and Machine
Intelligence, vol. 25, pp. 1519–1533, 2003.
[7] R.P. Wildes, “Iris recognition: An emerging biometric technology,” Proceedings
of the IEEE, vol. 85, September 1997.
51

52 BIBLIOGRAPHY
[8] L. Masek, “Recognition of human iris patterns for biometric
identification,” B.S. Thesis, The University of Western Australia,
http://www.csse.uwa.edu.au/pk/studentprojects/libor/, 2003.
[9] Junzhou Huang, Yunhong Wang, Tieniu Tan, and Jiali Cui, “A new iris seg-
mentation method for recognition.,” in ICPR (3), 2004, pp. 554–557.
[10] N. J. Ritter and J. R. Cooper, “Locating the iris: A first step to registration
and identification,” Proc. 9th IASTED International Conference on Signal and
Image Processing, pp. 507–512, August 2003.
[11] Jiali Cui, Yunhong Wang, Tieniu Tan, Li Ma, and Zhenan Sun, “A fast and
robust iris localization method based on texture segmentation,” in Proc. SPIE,
Anil K. Jain and Nalini K. Ratha, Eds., August 2004, vol. 5404 of Biometric
Technology for Human Identification, pp. 401–408.
[12] W.W. Boles, “A security system based on human iris identification using wavelet
transform,” First International Conference on Knowledge-Based Intelligent Elec-
tronic Systems, pp. 533–541, May 1997, Adelaide, Australia.
[13] W.W. Boles and B. Boashash, “A human identification technique using images
of the iris and wavelet transform,” TSP, vol. 46, no. 4, pp. 1185–1188, April
1998.
[14] J.G. Daugman, “Two-dimensional spectral analysis of cortical receptive field
profiles,” Vision Research, vol. 20, pp. 847–856, 1980.
[15] J.G. Daugman, “Uncertainty relation for resolution in space, spatial frequency
and orientation optimized by two-dimensional visual cortical filters,” J. Opt.
Soc. Am., vol. 2, no. 7, pp. 1160–1169, 1985.
[16] D.H. Kim and J.S. Ryoo, “Iris identification system and method of identifying
a person through iris recognition,” in US Patent, 1999.
[17] Y. Wang, T.N. Tan, and A.K. Jain, “Combining face and iris biometrics for
identity verification,” in AVBPA03, 2003, pp. 805–813.
BIBLIOGRAPHY 53
[18] C. Sanchez-Avila and R. Sanchez-Reillo, “Two different approaches for iris recog-
nition using gabor filters and multiscale zero-crossing representation,” PR, vol.
38, no. 2, pp. 231–240, February 2005.
[19] R. Sanchez-Reillo and C. Sanchez-Avila, “Iris recognition with low template
size,” in AVBPA01, 2001, p. 324.
[20] X. Ming, Z. Li, Z. Wang, and X. Zhu, “Multi-matching process based on wavelet
transform for iris recognition,” in WACV05, 2005, pp. I: 66–70.
[21] E. Krichen, M.A. Mellakh, S. Garcia-Salicetti, and B. Dorizzi, “Iris identification
using wavelet packets,” in ICPR04, 2004, pp. IV: 335–338.
[22] H. Sung, J. Lim, J.H. Park, and Y. Lee, “Iris recognition using collarette bound-
ary localization,” in ICPR04, 2004, pp. IV: 857–860.
[23] Z. Sun, Y. Wang, T.N. Tan, and J. Cui, “Robust direction estimation of gradient
vector field for iris recognition,” in ICPR04, 2004, pp. II: 783–786.
[24] J. de Mira and J. Mayer, “Identification of individuals through the morphological
processing of the iris,” in ICIP03, 2003, pp. I: 341–344.
[25] J. Jang, K. Kim, and Y. Lee, “Efficient algorithm of eye image check for robust
iris recognition system,” in CAIP03, 2003, pp. 301–308.
[26] B.V.K. Vijaya Kumar, C. Xie, and J. Thornton, “Iris verification using correla-
tion filters,” in AVBPA03, 2003, pp. 697–705.
[27] C.H. Park, J.J. Lee, S.K. Oh, Y.C. Song, D.H. Choi, and K.H. Park, “Iris feature
extraction and matching based on multiscale and directional image representa-
tion,” in ScaleSpace03, 2003, pp. 576–583.
[28] V. Vigneron, H. Maaref, and S. Lelandais, “Poor man vote with m-ary classifiers.
application to iris recognition,” in AVBPA03, 2003, pp. 647–657.
54 BIBLIOGRAPHY
[29] Ya-Ping Huang, Si-Wei Luo, and En-Yi Chen, “An efficient iris recognition
system,” in Proc. of the First International Conference on Machine Learning
and Cybernetics, Beijing, Nov. 2002.
[30] Kwanghyuk Bae, Seung-In Noh, and Jaihie Kim, “Iris feature extraction using
independent component analysis,” in 4th International Conference Audio-and
Video-Based Biometric Person Authentication, Guildford, UK, June 2003, pp.
838–844.
[31] Seung-In Noh, Kwanghuk Bae, Chulhan Lee, and Jaihie Kim, “Multiresolution
independent component analysis for iris identification,” in The 2002 Interna-
tional Technical Conference on Circuits/Systems, Computers and Communica-
tions, Phuket, Tailand, July 2002.
[32] E. Sung, X. Chen, J. Zhu, and J. Yang, “Towards non-cooperative iris recognition
systems,” in Proceedings of International Conference on Automation, Robotics,
and Computer Vision (ICARCV’2002), 2002, vol. 2, pp. 990 – 995.
[33] C.N. Chun and R. Chung, “Iris recognition for iris tilted in depth,” in CAIP03,
2003, pp. 530–539.
[34] Y. Du, B. Bonney, R. Ives, and D. M. Etter, “Analysis of partial iris recognition,”
in Proc. of the SPIE 2005 Symp. on Defense and Security, Orlando, FL., March
Conf. 5779.
[35] A.S. Abhyankar, L.A. Hornak, and S. C. Schuckers, “Biorthogonal wavelet-based
iris recognition,” in Proc. of the SPIE 2005 Symp. on Defense and Security,
Orlando, FL, March Conf. 5779.
[36] D.G. Lowe, “Three-dimensional object recognition from single two-dimensional
images,” Artif. Intell., vol. 31, no. 3, pp. 355–395, 1987.
[37] David G. Lowe, “Fitting parameterized three-dimensional models to images.,”
IEEE Trans. Pattern Anal. Mach. Intell., vol. 13, no. 5, pp. 441–450, 1991.

BIBLIOGRAPHY 55
[38] Masaru Ishii and Yoshio Mikami, “A 3-d sensor system for teaching robot paths
and environments,” Int. J. Rob. Res., vol. 6, no. 2, pp. 45–59, 1987.
[39] Araujo Helder, Rodrigo L. Carceroni, and Christopher M. Brown, “A fully
projective formulation to improve the accuracy of lowe’s pose estimation algo-
rithm,” Computer Vision and Image Understanding, vol. 70, no. 2, pp. 227–238,
May 1998.
[40] Andrew Blake and Alan Yuille, Eds., Active vision, MIT Press, Cambridge, MA,
USA, 1993.
[41] Alan L. Yuille, Peter W. Hallinan, and David S. Cohen, “Feature extraction
from faces using deformable templates,” Int. J. Comput. Vision, vol. 8, no. 2,
pp. 99–111, 1992.
[42] Peter J. Burt and Edward H. Adelson, “The Laplacian pyramid as a compact
image code,” pp. 671–679, 1987.
[43] Igor Guskov, Wim Sweldens, and Peter Schroder, “Multiresolution signal pro-
cessing for meshes,” in SIGGRAPH ’99: Proceedings of the 26th annual con-
ference on Computer graphics and interactive techniques, New York, NY, USA,
1999, pp. 325–334, ACM Press/Addison-Wesley Publishing Co.
[44] T. Camus and R.P. Wildes, “Reliable and fast eye finding in close-up images,”
in Proc. of the IEEE International Conference on Pattern Recognition, Quebec
City, Aug. 2002, pp. 389–394.
[45] G. Almkvist and B. Berndt, “Gauss, Landen, Ramanujan, the arithmetic ge-
ometric mean, ellipses, pi, and the ladies’ diary,” The American Mathematical
Monthly, vol. 95, pp. 585–608, 1988.
[46] L. Sirovich and M. Kirby, “Low-dimensional procedure for the characterization
of human faces,” Journal of Optical Soc. Am, vol. 4, pp. 519–524, 1987.

56 BIBLIOGRAPHY
[47] M.A. Turk and A.P. Pentland, “Face recognition using eigenfaces,” in Pro-
ceedings of the IEEE Conference on Computer Vision and Pattern Recognition,
Hawaii, June 1992, p. 58690.
[48] M. Turk and Alex Pentland, “Eigenfaces for recognition,” Journal of Cognitive
Neuroscience, vol. 3, no. 1, pp. 71–86, 1991.
[49] A. Hyvarinen, J. Karhunen, and E. Oja, Independent Component Analysis, John
Wiley and Sons, 2001.
[50] FastICA Matlab Package, Available online at
http://www.cis.hut.fi/projects/ica/fastica.
[51] CASIA Iris Image Database (ver. 1.0), http://www.sinobiometrics.com/casiairis.htm.
[52] Vivekanand Dorairaj, Yash N. Shah, and Natalia A. Schmid, “Exploring and de-
veloping processing techniques for iris recognition system,” in Biometric Consor-
tium Conference. 2004, http://www.wvu.edu/ bknc/2004 Abstracts/Biometric
Symposium Abstracts public2 htm.
[53] Bruce A. Draper, Kyungim Baek, Marian Stewart Bartlett, and J. Ross Bev-
eridge, “Recognizing faces with PCA and ICA,” in CVIU, June 2003, pp.
115–137.
[54] Juha Koikkalainen and Jyrki Lotjonen, “Image segmentation with the combina-
tion of the PCA and ICA based modes of shape variation,” ISBI, pp. 149–152,
2004.
[55] P.D. Imesch, I.H.L. Wallow, and D.M. Albert, “The color of the human eye:
A review of morphologic correlates and of some conditions that affect iridial
pigmentation,” Survey of Opthalmology, vol. 41, no. 2, pp. S117–S123, February
1997.
[56] John Forrester, A.D. Dick, P. McMenamin, and W. Lee, The Eye: Basic Sciences
in Practice,2nd ed., Saunders, October 2001.

BIBLIOGRAPHY 57
[57] M. Kirby and L. Sirovich, “Application of the karhunen-loeve procedure for the
characterization of human face,” IEEE, vol. 12, pp. 103–108, 1990.
[58] H. Le Borgne, A. Guerin-Dugue, and A. Antoniadis, “Representation of images
for classification with independent features,” PRL, vol. 25, no. 2, pp. 141–154,
January 2004.
[59] Aapo Hyvarinen, “Independent component analysis in the presence of gaussian
noise by maximizing joint likelihood,” Neurocomputing, vol. 22, pp. 49–67, 1998.
[60] Jean-Franois Cardoso, “Infomax and maximum likelihood for source separation,”
IEEE Letters on Signal Processing, vol. 4, no. 4, pp. 112–114, 1997.
[61] Antony J. Bell and Terrence J. Sejnowski, “An information maximisation ap-
proach to blind separation and blind deconvolution,” Neural Computation, vol.
7, no. 6, pp. 1129–1159, 1995.
[62] A.J. Bell and T.J. Sejnowski, “The ’independent components’ of natural scenes
are edge filters,” Vision Research, , no. 37, pp. 3327–3338, 1997.
[63] K. Sengupta, P. Burman, and R. Sharma, “A non-parametric approach for
independent component analysis using kernel density estimation,” in CVPR04,
2004, pp. II: 667–672.
[64] C. Fang and X. Ding, “Improvement of ica based probability density estimation
for pattern recognition,” in ICPR04, 2004, pp. III: 466–469.
[65] A.J. Ferreira and M.A.T. Figueiredo, “Class-adapted image compression using
independent component analysis,” in ICIP03, 2003, pp. I: 625–628.
[66] M. Bressan, D. Guillamet, and J. Vitria, “Using an ica representation of high
dimensional data for object recognition and classification,” in CVPR01, 2001,
pp. I:1004–1009.
[67] J. Fortuna, D. Schuurman, and D. Capson, “A comparison of pca and ica for
object recognition under varying illumination,” in ICPR02, 2002, pp. III: 11–15.

58 BIBLIOGRAPHY
[68] Aapo Hyvarinen, Patrik O. Hoyer, and Mika Inki, “Topographic ica as a model of
natural image statistics,” in BMVC ’00: Proceedings of the First IEEE Interna-
tional Workshop on Biologically Motivated Computer Vision. 2000, pp. 535–544,
Springer-Verlag.
[69] Shun Ichi Amari, Aapo Hyvarinen, Soo Young Lee, Te Won Lee, and
V. David Sanchez A., “Blind signal separation and independent component
analysis.,” Neurocomputing, vol. 49, no. 1-4, pp. 1–5, 2002.
[70] Jagath C. Rajapakse, “Adaptive blind signal and image processing: learning
algorithms and applications: A. cichocki, s. amari, wiley, new york, 2002, 586pp.,
isbn 0471 60791 6.,” Neurocomputing, vol. 49, no. 1-4, pp. 439–443, 2002.
[71] Erkki Oja and Juha Karhunen, “Nonlinear PCA: Algorithms and applications,”
Tech. Rep. A18, Helsinki University of Technology Laboratory of Computer and
Information Sciences, Rakentajanaukio 2 C, SF-02150 Espoo, Finland, Sept.
1993.
[72] Thomas M. Cover and Joy A. Thomas, Elements of Information Theory, John
Wiley & sons, 1991.
[73] S. Makeig, Anthony J. Bell, Tzyy-Ping Jung, and Terrence J. Sejnowski, “In-
dependent component analysis of electroencephalographic data,” Advances in
Neural Information Processing Systems, vol. 8, pp. 145–151, 1996.
[74] Nicolas Brunel and Jean-Pierre Nadal, “Mutual information, fisher information
and population coding,” Neural Computation, vol. 10, no. 7, pp. 1731–1757,
1998.