Non-farm Income Diversification in Rural Ghana: Patterns ... · PDF fileAfrican Development...
12
African Development Review, Vol. 24, No. 3, 2012, 233–244 Non-farm Income Diversification in Rural Ghana: Patterns and Determinants Bernardin Senadza ∗ Abstract : Evidence abounds in the rural livelihoods literature that rural households do not only receive a significant proportion of their incomes from non-farm sources, but also it is a significant source of employment for rural folks. This paper examines the pattern and determinants of non-farm income diversification in rural Ghana. Results show that off-farm income constituted 43 percent of rural household income in 2005/6. Female-headed households tend to have larger off-farm income shares compared to male-headed households. Non-farm income shares followed the same gender pattern albeit less pronounced. Unlike in Latin America and Asia, in rural Ghana, non-farm self-employment income is more important than non-farm wage-employment income. Regression results show that the gender composition of households, age, education, and access to credit, electricity and markets are important determinants of multiple non-farm activities and non-farm income. The findings call for strategies that can help rural households maximize the benefits from income diversification. 1. Introduction Rural households in developing countries have for a long time been perceived as farm households, and that they receive their income predominantly from agriculture. Evidence abounds, however, that rural households do not only receive a significant proportion of their incomes from non-farm sources, but also it is a significant source of employment for rural folks. For instance, Haggblade et al. (2005), reports that rural non-farm activities constitute a significant proportion of rural employment, and income from this source accounts for 30 to 45 percent of total rural household income across the developing world. Reardon et al. (1998), reviews a number of studies based on rural household surveys conducted between the mid 1970s and the late 1990s and finds that non-farm income as a share of total household income averaged 42 percent for Africa, 32 percent for Asia and 40 percent for Latin America. Non-farm income also constitutes primary employment for 44 percent and 25 percent of rural households in Asia and Latin America respectively (Reardon et al., 1998). Other studies such as Winters et al. (2006) find evidence that the share of non-farm income is rising over time. 1 Results of national level household surveys report multiple income sources for rural households in Ghana (Ghana Statistical Service, 2000 and 2008). These surveys also show that non-farm activities are important in rural Ghana as evidenced by their contribution to household incomes and employment, even though agriculture remains the dominant source of income and employment for the majority of rural households. Rural households in Ghana are not only the poorest segment of the population, but also have to contend with the variability of income from agriculture. Given the seasonality of agriculture, the erratic nature of rainfall patterns, the low level of irrigation usage, and near absence of credit and insurance markets, income from non-farm sources can be a good source of income and consumption smoothing for rural households. Yet, not much work has been done on rural non-farm income diversification in Ghana. The objective of this paper is therefore (1) to analyze the relative importance of non-farm income, and (2) to identify the determinants of non-farm income diversification in rural Ghana. Earlier work on Ghana, carried out by Canagarajah et al. (2001), and Newman and Canagarajah (2000), focused largely on the gender dimensions and poverty reducing impacts of non-farm income. Canagarajah et al. (2001), for instance, examined how the distribution of earnings in rural Ghana differed by income type and gender, using the Ghana Living Standards Survey (GLSS) datasets 1 and 3. The Newman and Canagarajah (2000) study found that non-farm income was important in reducing poverty rates much faster for female-headed households. While Canagarajah et al. (2001) examined the determinants of aggregate non-farm income, making no distinction between self-employment and wage-employment income, Newman and Canagarajah ∗ Department of Economics, University of Ghana. Tel. (office): +233(0)302501485; (cell): +233(0)244683199; e-mail: [email protected]; [email protected] C 2012 The Author. African Development Review C 2012 African Development Bank. Published by Blackwell Publishing Ltd, 9600 Garsington Road, Oxford OX4 2DQ, UK and 350 Main Street, Malden, MA 02148, USA. 233
-
Upload
truonghuong -
Category
Documents
-
view
220 -
download
2
Transcript of Non-farm Income Diversification in Rural Ghana: Patterns ... · PDF fileAfrican Development...

African Development Review, Vol. 24, No. 3, 2012, 233–244
Non-farm Income Diversification in Rural Ghana: Patternsand Determinants
Bernardin Senadza∗
Abstract: Evidence abounds in the rural livelihoods literature that rural households do not only receive a significantproportion of their incomes from non-farm sources, but also it is a significant source of employment for rural folks. This paperexamines the pattern and determinants of non-farm income diversification in rural Ghana. Results show that off-farm incomeconstituted 43 percent of rural household income in 2005/6. Female-headed households tend to have larger off-farm income sharescompared to male-headed households. Non-farm income shares followed the same gender pattern albeit less pronounced. Unlikein Latin America and Asia, in rural Ghana, non-farm self-employment income is more important than non-farm wage-employmentincome. Regression results show that the gender composition of households, age, education, and access to credit, electricity andmarkets are important determinants of multiple non-farm activities and non-farm income. The findings call for strategies that canhelp rural households maximize the benefits from income diversification.
1. Introduction
Rural households in developing countries have for a long time been perceived as farm households, and that they receive theirincome predominantly from agriculture. Evidence abounds, however, that rural households do not only receive a significantproportion of their incomes from non-farm sources, but also it is a significant source of employment for rural folks. For instance,Haggblade et al. (2005), reports that rural non-farm activities constitute a significant proportion of rural employment, and incomefrom this source accounts for 30 to 45 percent of total rural household income across the developing world. Reardon et al. (1998),reviews a number of studies based on rural household surveys conducted between the mid 1970s and the late 1990s and findsthat non-farm income as a share of total household income averaged 42 percent for Africa, 32 percent for Asia and 40 percent forLatin America. Non-farm income also constitutes primary employment for 44 percent and 25 percent of rural households in Asiaand Latin America respectively (Reardon et al., 1998). Other studies such as Winters et al. (2006) find evidence that the share ofnon-farm income is rising over time.1
Results of national level household surveys report multiple income sources for rural households in Ghana (Ghana StatisticalService, 2000 and 2008). These surveys also show that non-farm activities are important in rural Ghana as evidenced bytheir contribution to household incomes and employment, even though agriculture remains the dominant source of income andemployment for the majority of rural households. Rural households in Ghana are not only the poorest segment of the population,but also have to contend with the variability of income from agriculture. Given the seasonality of agriculture, the erratic natureof rainfall patterns, the low level of irrigation usage, and near absence of credit and insurance markets, income from non-farmsources can be a good source of income and consumption smoothing for rural households. Yet, not much work has been done onrural non-farm income diversification in Ghana. The objective of this paper is therefore (1) to analyze the relative importance ofnon-farm income, and (2) to identify the determinants of non-farm income diversification in rural Ghana.
Earlier work on Ghana, carried out by Canagarajah et al. (2001), and Newman and Canagarajah (2000), focused largely onthe gender dimensions and poverty reducing impacts of non-farm income. Canagarajah et al. (2001), for instance, examinedhow the distribution of earnings in rural Ghana differed by income type and gender, using the Ghana Living Standards Survey(GLSS) datasets 1 and 3. The Newman and Canagarajah (2000) study found that non-farm income was important in reducingpoverty rates much faster for female-headed households. While Canagarajah et al. (2001) examined the determinants of aggregatenon-farm income, making no distinction between self-employment and wage-employment income, Newman and Canagarajah
∗Department of Economics, University of Ghana. Tel. (office): +233(0)302501485; (cell): +233(0)244683199; e-mail: [email protected];[email protected]
C© 2012 The Author. African Development Review C© 2012 African Development Bank. Published by Blackwell Publishing Ltd,9600 Garsington Road, Oxford OX4 2DQ, UK and 350 Main Street, Malden, MA 02148, USA. 233

234 B. Senadza
(2000) analyzed the determinants of participation in non-farm income. Apart from using more recent data, this paper distinguishesbetween non-farm wage-employment income and non-farm self-employment income in ascertaining the determinants of non-farmincome. Unlike Newman and Canagarajah (2000) who used a bivariate probit approach, this paper models participation basedon the number of non-farm income sources using the Poisson regression technique, thereby teasing out the determinants ofparticipation in a multiplicity of non-farm activities.
The rest of the paper is organized as follows. The next section discusses measurement and definition issues in the non-farmincome diversification literature, and reviews the existing empirical literature. Section 3 discusses the data and conducts univariateanalyses by examining income shares, participation rates and the distribution of the number of income sources of rural households.In Section 4 we present the model and econometric estimation methods as well as the empirical results. Section 5 concludes withpolicy implications.
2. Definitional Issues and Review of Literature
2.1 Definitional Issues
The literature distinguishes between three variables as parameters of income diversification (Barrett et al., 2001). Householdsearn income from various activities using their productive assets, such as land and human capital, while unproductive assetslike household valuables and property, are sources of unearned income. Assets, activities and income are thus complementaryindicators of diversification (Barrett et al., 2001). While income is a measure of direct interest because of its clear interpretationas a welfare outcome, its main weakness lies in the difficulty of distinguishing between choice and chance in income draws(Barrett et al., 2001). Assets play the role of being a store of wealth as well as sources of income, but they can be very difficultto value accurately. This task is particularly arduous in rural Africa, where secondary asset markets are not well developed. Theproblem of asset fixity2 also leads to highly variable returns to assets (Barrett et al., 2001). Activities provide a link betweenassets and income flows and therefore help identify individuals’ explicit diversification choices (Barrett et al., 2001). However,they argue that activities are of no direct theoretical relevance in themselves, can be likewise difficult to value, and in addition donot necessarily capture income generated from non-productive assets. From the foregoing, therefore, none of the three variablesis unambiguously better than the others. Barrett et al. (2001) advocate for the use of multiple indicators as cross checks oninferences based on any single indicator. This paper uses income and activities as measures of diversification.
The three main income categories often cited in the literature are farm, off-farm, and non-farm income sources. While Ellis(1998) notes that these distinctions are not arbitrary, Barrett et al. (2001) contend that there is some inconsistency in the useof terminology in the diversification literature. These authors argue that the terms ‘off-farm’, ‘non-farm’ and ‘non-agricultural’have been used synonymously in many studies. According to Barrett et al. (2001) the best approach to obtaining unambiguousdefinitions is to follow standard national accounting sectoral classifications. They offer a ‘rule-of-thumb’ three-way classificationof earned income (i.e. income from productive assets) by sector (farm versus non-farm), function (wage-employment versus self-employment), and space (local versus migratory).3 The sectoral classification leads directly to a distinction between ‘agricultural’or ‘farm’ income and ‘non agricultural’ or ‘non-farm’ income (Barrett et al., 2001). Functionally, households may earn incomefrom wage-employment or as self-employed, either in farm or non-farm activities. Finally, the sectoral and functional classificationsmay have spatial dimensions to them.
2.2 Review of Literature
Several studies (including Reardon et al., 1992; Alderman and Paxson, 1992; Dercon, 2002) have examined strategies used byrural households to smooth income and consumption, one of which is engaging in multiple income generating activities. Having adiversified portfolio of income-generating activities (and hence a diversified set of income sources) is a way to minimize incomevariability and to ensure a minimum level of income (Alderman and Paxson, 1992).
Theoretically, a household’s participation in non-farm activities depends on ‘incentive’ and ‘capacity’ factors (Reardon et al.,2006). The incentive to diversify is engendered by either ‘push’ or ‘pull’ factors (Barrett et al., 2001; Reardon et al., 2006). Therealization of strategic complementarities between farm and non-farm activities as well as access to superior technologies, skillsor endowments tend to be the factors that pull households into diversifying into non-farm activities (Barrett et al., 2001; Reardonet al., 2006). On the other hand, diversification for push reasons is generally carried out as a risk reduction or risk managementstrategy (Barrett et al., 2001; Reardon et al., 2006).
C© 2012 The Author. African Development Review C© 2012 African Development Bank

Non-farm Income Diversification in Rural Ghana 235
Empirical studies have identified several factors determining households’ participation in and the income derived fromrural non-farm activities. These factors, broadly categorized into households’ asset endowments (human, physical, social andtheir respective quantity and quality), infrastructural assets and/or locational advantages (reflected in access to public goodsand services), agro-climate assets (annual rainfall, elevation), and relative prices and risk, have been employed by many studiesincluding Reardon et al. (1998), de Janvry and Sadoulet (1996, 2001), Escobal (2001), Abdulai and CroleRees (2001), Canagarajahet al. (2001), Newman and Canagarajah (2000). The evidence regarding the importance of these factors in determining householdparticipation in and income derived from non-farm activities is, however, mixed. The mixed results may be partly explained bythe extent of disaggregation of the non-farm component of household income. As Escobal (2001) notes, particular assets may beimportant for particular non-farm activities. For instance, education may be very important for skilled jobs in non-farm wage- orself-employment, but less important for unskilled activities.
Household agricultural assets often proxied by landholdings are considered as important in the income diversification literaturebecause they potentially affect both the incentives and the capacity to undertake non-farm activity (Reardon et al., 2006). Butits effect on non-farm income has been found to be mixed. Landholdings have been found to positively and significantly impactnon-farm diversification in some studies (Abdulai and CroleRees, 2001), but to be insignificant or even negatively correlatedwith non-farm income in others (Barrett et al., 2000; Escobal, 2001; de Janvry and Sadoulet, 2001; Woldenhanna and Oskam,2001).
The education of households also exerts an important influence on non-farm diversification. Education is a key source ofhuman capital and it creates opportunities for engaging in higher-return non-farm activities (Reardon et al., 2006; Yunez-Naudeand Taylor, 2001). Lack of education on the other hand can create barriers to entry into certain non-farm activities and influencethe pattern of income diversification. As noted by Barrett et al. (2001), these barriers manifest themselves in labor market dualismwherein the skilled and educated are either self-employed or are employed in jobs with relatively high salaries, while the unskilledand uneducated depend largely on more erratic, lower paying casual wage labor, especially in the farm sector. This pattern ofincome diversification has been confirmed for Uganda (Canagarajah et al., 2001), Ethiopia (Woldenhanna and Oskam, 2001),and Nigeria (Babatunde and Qaim, 2009). Abdulai and Delgado (1999) also confirm these findings for Ghana. They furtherdisaggregated the data by gender and found the effect of education on non-farm participation and earnings to be higher for womenthan for men. Other studies confirming the role of education in influencing the diversification patterns described above includeEscobal (2001) for Peru and Yunez-Nuade and Taylor (2001) for Mexico.
Location and access to infrastructure such as roads, markets, electricity and water are crucial determinants of rural non-farmincome, and this has been ascertained by studies such as Winters et al. (2002) and Canagarajah et al. (2001). Canagarajah et al.(2001) finds that households in the coastal and forest belts in Ghana have significantly higher non-farm incomes compared tohouseholds living in the savannah belt.
In summary, while the findings from some empirical studies have shown mixed results, non-farm income diversificationis generally influenced by household characteristics (age, gender, size, education), household assets (land, farm size, livestock,agricultural equipment) and locational and infrastructural advantages (access to markets, tarred roads, electricity, water, finance).
3. Patterns of Income Diversification
3.1 Data
Data is from the fifth round of the Ghana Living Standards Survey (GLSS 5) conducted in 2005/6. The Ghana Living StandardsSurvey is a nationally representative survey of households and individuals, designed along the lines of the World Bank’s LivingStandards Measurement Surveys (LSMS). The GLSS is conducted by the Ghana Statistical Service with technical assistancefrom the World Bank. The GLSS is a probability sample survey. The Ghana Statistical Service maintains a complete list ofenumeration areas (EAs), together with their respective population and number of households. This information was used as thesampling frame for the GLSS 5. A two-stage stratified random sampling design was used. The EAs were designated as primarysampling units (PSUs) while households within each EA constituted the secondary sampling units (SSUs). The EAs were firststratified into ten administrative regions and within each region the EAs were further subdivided according to rural and urbanareas of location. The EAs were also classified according to the three ecological zones (coastal, forest and savannah). A total of580 EAs were obtained made up of 8,700 households. The survey achieved a 99.85 percent response rate, giving a total of 8,687households. The data was collected from September 2005 to September 2006. Detailed information was collected on demographiccharacteristics of households and individuals, and all aspects of living conditions including health, education, housing, householdincome, consumption and expenditure, credit, assets and savings, prices and employment (Ghana Statistical Service, 2008). The
C© 2012 The Author. African Development Review C© 2012 African Development Bank

236 B. Senadza
Table 1: Income shares and activity participation rates by gender of household head
Income share (%) Participation rate (%)
Income source All Male-headed Female-headed All Male-headed Female-headed
Total farm 58.8 61.9 47.1 92.7 94.6 84.9On-farm 57.0 60.1 45.5 92.3 94.3 84.2Farm wage 1.8 1.8 1.6 3.1 3.2 2.5
Total non-farm 27.3 26.8 28.9 53.2 53.1 53.9Non-farm self-employment 19.5 18.3 24.0 46.0 45.5 48.2Non-farm wage employment 7.8 8.5 4.9 13.8 15.2 8.4
Remittance 7.8 4.8 19.7 47.7 42.8 67.2Other 6.1 6.5 4.3 69.3 72.7 55.6Total off-farm 43.0 39.9 54.5 98.7 98.6 99.1
Source: Computed from GLSS 5 data.
Table 2: Income shares and activity participation rates by geographical location
Income share (%) Participation rate (%)
Income source Coastal Forest Savannah Coastal Forest Savannah
Total Farm 49.10 61.00 61.00 84.7 92.3 96.9On-farm 45.5 58.6 60.8 83.4 92.0 96.8Farm wage 3.6 2.4 0.2 5.6 4.3 0.4
Total non-farm 33.1 27.2 24.6 55.1 54.6 50.7Non-farm self-employment 22.3 17.6 20.4 46.1 44.6 47.6Non-farm wage employment 10.8 9.6 4.2 18.1 17.8 7.1
Remittance 11.6 8.8 4.7 46.6 53.4 41.2Other 6.2 3.0 9.7 65.0 61.5 80.7Total off-farm 54.5 41.4 39.2 98.7 98.1 99.5
Source: Computed from GLSS 5 data.
GLSS 5 also gathered data on non-farm household enterprises, tourism, migrants and remittances. Out of the 8,687 households,5069 (58 percent) were rural households.
3.2 Income Shares and Participation Rates
One way to measure rural income diversification is to ascertain the relative shares of the different income sources in total householdincome. We have classified household income into six categories, namely, (1) on-farm income, (2) farm wage employment income,(3) non-farm self-employment income, (4) non-farm wage employment income, (5) remittance income, and (6) other income.The sum of the last five categories constitutes off-farm income. Non-farm income is made up of non-farm self-employment andnon-farm wage employment, that is, (3) plus (4).
Table 1 presents the mean share of the various income sources in total income. Unsurprisingly, on-farm income accounts forthe bulk of household income. Its share, however, is less than 50 per cent for female-headed households, coastal belt households,and households in the fourth and fifth expenditure quintiles. In aggregate terms, off-farm income and non-farm income accountedfor 43 percent and 27 percent of total rural household income respectively in 2005/6. Households headed by women have a largeroff-farm income share (55 percent) than male-headed households (40 percent). Non-farm income shares follow the same genderpattern albeit less pronounced. The shares of both off-farm and non-farm income decreases as one moves from the coastal (south)belt through the forest (middle) belt to the savannah (northern) belt (Table 2), while Table 3 reveals that off-farm and non-farmincome shares increase with household wealth status.4 What is striking, however, is the big difference in the non-farm incomeshares for the bottom 60 percent of households on the one hand and the top 40 percent of households on the other.
Unlike in Latin America and Asia, where non-farm wage income is relatively more important, in rural Ghana (as is the casein many sub-Saharan African countries) it is non-farm self-employment income that is more important. This may imply greateropportunities for self-employment than wage employment in rural Ghana. Non-farm self-employment income is more importantfor households headed by women (Table 1), households in the coastal and savannah belts (Table 2) and the wealthiest 40 percent
C© 2012 The Author. African Development Review C© 2012 African Development Bank

Non-farm Income Diversification in Rural Ghana 237
Table 3: Income shares and activity participation rates by expenditure quintile
Income share (%) Participation rate (%)
Income source Ql Q2 Q3 Q4 Q5 Ql Q2 Q3 Q4 Q5
Total farm 63.3 65.9 63.6 40.6 47.2 98.0 95.3 92.7 87.1 79.0On farm 62.6 64.2 60.8 38.6 44.7 97.5 95.2 92.4 86.5 78.4Farm wage 0.7 1.7 2.8 2.0 2.5 1.4 2.7 4.9 3.5 4.2
Total non-farm 17.9 23.1 25.1 46.9 38.1 43. 7 50.7 56.9 62.9 63.9Non-farm self-employment 14.4 15.5 18.7 34.7 21.5 38.7 43.7 51.4 54.0 48.4Non-farm wage employment 3.5 7.6 6.4 12.2 16.6 7.2 13.2 12.7 20.4 26.6
Remittance 7.4 6.9 6.8 8.3 12.5 45.2 45.9 49.3 47.5 56.1Other 11.4 4.2 4.4 4.3 2.2 74.6 72.4 68.9 64.4 54.4Total off-farm 37.4 35.9 39.1 61.5 55.3 98.6 99.2 98.7 98.1 98.7
Source: Computed from GLSS 5 data
of households (Table 3). Although relatively less important than self-employment income, non-farm wage employment incomeshares also exhibit some gender, geographical and wealth differentiated patterns; it is more important for male-headed, coastaland forest, and the wealthiest 40 percent households. Farm wage employment income is a minimal component of rural householdincome, and this may be read as an indication that many households do not deploy their labor supply to this income earningactivity. Remittances constitute a greater share of income for female-headed households than male-headed households (Table 1),and also for coastal and forest households compared to savannah households (Table 2) and the wealthiest 20 percent of households(Table 3).
Tables 1, 2 and 3 also present information on participation rates in the various income activities. It is quite evident from thetables that not all rural households in Ghana are farm households, as the participation rate in on-farm activities is not up to 100percent for any household classification. But as expected, on-farm activities command the highest participation rate of about93 percent.
Table 1 reveals that more than 50 percent of households participate in at least one non-farm income activity, the most importantbeing self-employment. Remittances and other income are also important income sources for rural households.5 Participation ratesare higher for male-headed households in non-farm wage employment, while the reverse is true for non-farm self-employment(Table 1). Geographically, participation in non-farm activities decreases as one moves from the coastal belt to the savannah belt,with participation in wage employment activities being particularly more important for coastal and forest households (Table 2).This geographical pattern of participation is not surprising given the relatively more developed nature of the coastal and forestbelts compared to the savannah belt. Households in the forest belt are the major beneficiaries of remittances. In terms of householdwealth status, some very general patterns can be discerned in household participation rates. Participation in on-farm activitiesdecreases with household wealth status, while participation in non-farm activities increases with wealth status (Table 3).
3.3 Number of Income Sources
Table 4 presents results of the distribution of the number of income sources among households. By our classification, themaximum number of income sources available to any household is six. Table 4 indicates that no household has the maximum.On-farm activities command the highest participation rate of about 93 percent, as Table 1 shows. The fact that in Table 4 just3 percent of households have only one income source (which is most likely to be on-farm) shows how diverse rural incomesources are. The number of income sources is centred on 2.72, with more than 95 percent of all households having at least twoand at most four income sources.
The distribution of income sources in terms of the various household classifications mirrors closely that of the aggregate,except for the fifth expenditure quintile where the proportion of households with only one income source is much higher at8 percent (Table 4). An inverted U-shaped pattern emerges in the distribution of the mean number of income sources for thewealth status classification, with the mean number increasing up to the third expenditure quintile and decreasing thereafter.
The distribution of income sources based on all six income categories blurs the gender, geographical and wealth-differentiatedpatterns in non-farm income diversification. In order to gain further insight into the pattern of non-farm income diversification,we restrict income sources to only non-farm.6 It is evident from Table 5 that households in the coastal and forest belts are morediversified compared to the savannah belt. The mean number of non-farm income sources increases with household wealth status,indicating that wealthier households are more diversified, confirming the results of previous work on sub-Saharan Africa that
C© 2012 The Author. African Development Review C© 2012 African Development Bank
238 B. Senadza
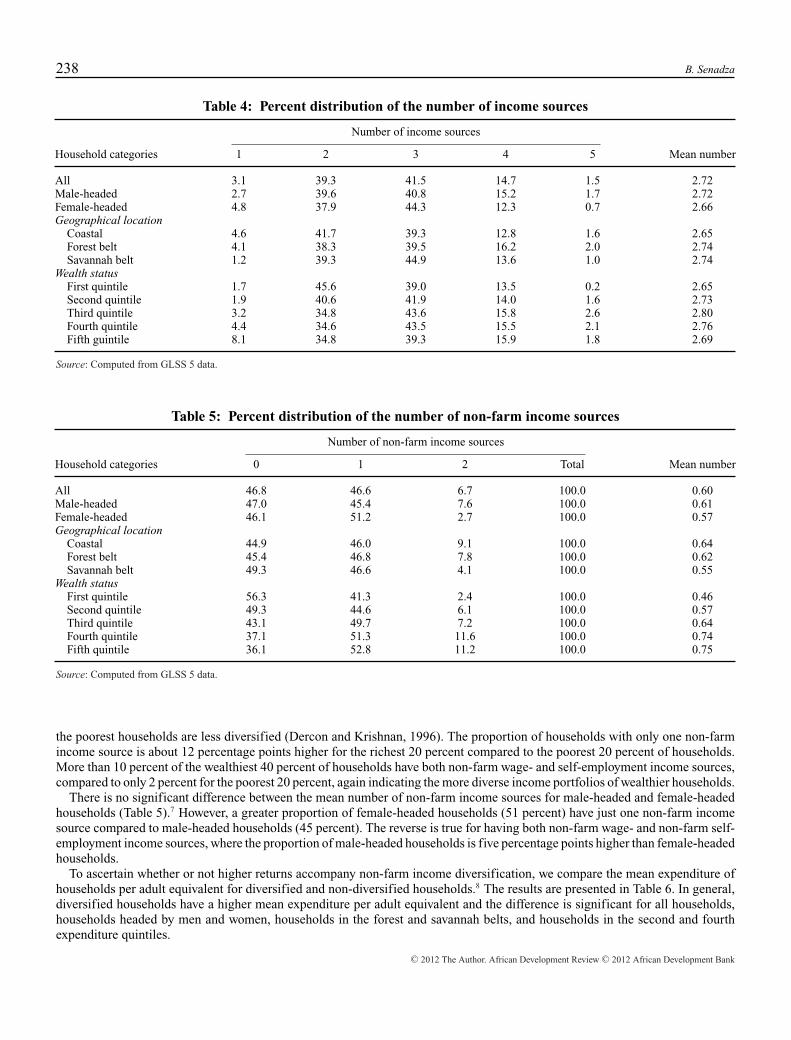
Table 4: Percent distribution of the number of income sources
Number of income sources
Household categories 1 2 3 4 5 Mean number
All 3.1 39.3 41.5 14.7 1.5 2.72Male-headed 2.7 39.6 40.8 15.2 1.7 2.72Female-headed 4.8 37.9 44.3 12.3 0.7 2.66Geographical location
Coastal 4.6 41.7 39.3 12.8 1.6 2.65Forest belt 4.1 38.3 39.5 16.2 2.0 2.74Savannah belt 1.2 39.3 44.9 13.6 1.0 2.74
Wealth statusFirst quintile 1.7 45.6 39.0 13.5 0.2 2.65Second quintile 1.9 40.6 41.9 14.0 1.6 2.73Third quintile 3.2 34.8 43.6 15.8 2.6 2.80Fourth quintile 4.4 34.6 43.5 15.5 2.1 2.76Fifth guintile 8.1 34.8 39.3 15.9 1.8 2.69
Source: Computed from GLSS 5 data.
Table 5: Percent distribution of the number of non-farm income sources
Number of non-farm income sources
Household categories 0 1 2 Total Mean number
All 46.8 46.6 6.7 100.0 0.60Male-headed 47.0 45.4 7.6 100.0 0.61Female-headed 46.1 51.2 2.7 100.0 0.57Geographical location
Coastal 44.9 46.0 9.1 100.0 0.64Forest belt 45.4 46.8 7.8 100.0 0.62Savannah belt 49.3 46.6 4.1 100.0 0.55
Wealth statusFirst quintile 56.3 41.3 2.4 100.0 0.46Second quintile 49.3 44.6 6.1 100.0 0.57Third quintile 43.1 49.7 7.2 100.0 0.64Fourth quintile 37.1 51.3 11.6 100.0 0.74Fifth quintile 36.1 52.8 11.2 100.0 0.75
Source: Computed from GLSS 5 data.
the poorest households are less diversified (Dercon and Krishnan, 1996). The proportion of households with only one non-farmincome source is about 12 percentage points higher for the richest 20 percent compared to the poorest 20 percent of households.More than 10 percent of the wealthiest 40 percent of households have both non-farm wage- and self-employment income sources,compared to only 2 percent for the poorest 20 percent, again indicating the more diverse income portfolios of wealthier households.
There is no significant difference between the mean number of non-farm income sources for male-headed and female-headedhouseholds (Table 5).7 However, a greater proportion of female-headed households (51 percent) have just one non-farm incomesource compared to male-headed households (45 percent). The reverse is true for having both non-farm wage- and non-farm self-employment income sources, where the proportion of male-headed households is five percentage points higher than female-headedhouseholds.
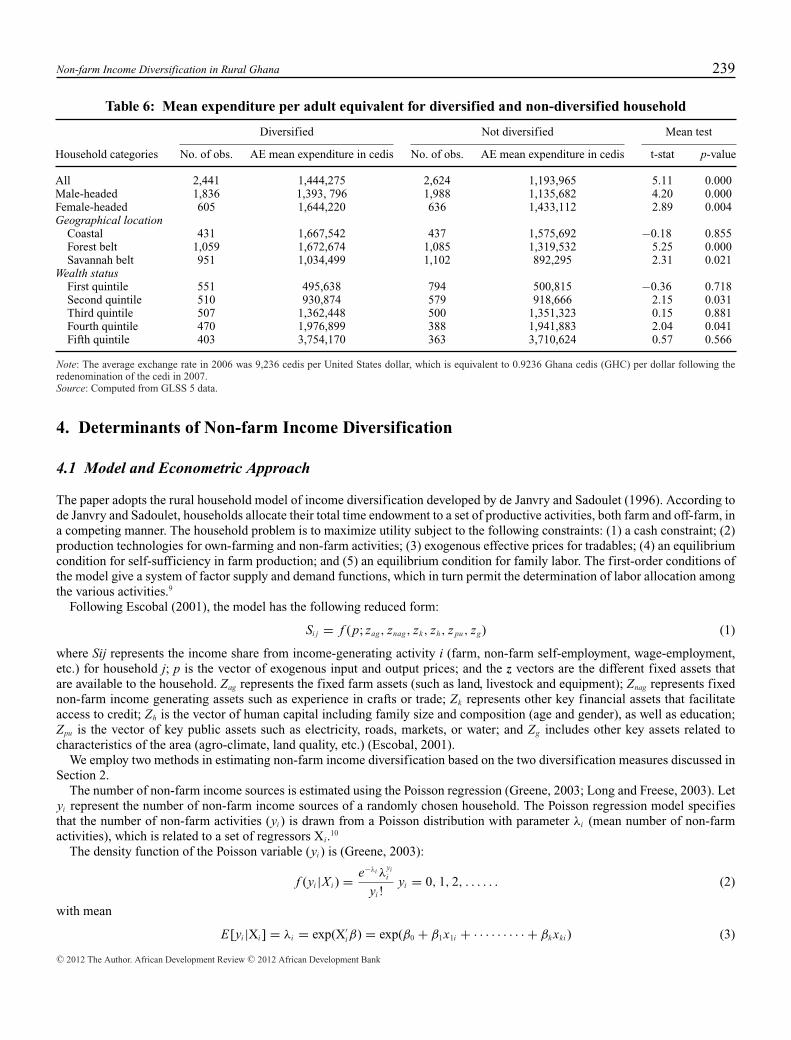
To ascertain whether or not higher returns accompany non-farm income diversification, we compare the mean expenditure ofhouseholds per adult equivalent for diversified and non-diversified households.8 The results are presented in Table 6. In general,diversified households have a higher mean expenditure per adult equivalent and the difference is significant for all households,households headed by men and women, households in the forest and savannah belts, and households in the second and fourthexpenditure quintiles.
C© 2012 The Author. African Development Review C© 2012 African Development Bank
Non-farm Income Diversification in Rural Ghana 239
Table 6: Mean expenditure per adult equivalent for diversified and non-diversified household
Diversified Not diversified Mean test
Household categories No. of obs. AE mean expenditure in cedis No. of obs. AE mean expenditure in cedis t-stat p-value
All 2,441 1,444,275 2,624 1,193,965 5.11 0.000Male-headed 1,836 1,393, 796 1,988 1,135,682 4.20 0.000Female-headed 605 1,644,220 636 1,433,112 2.89 0.004Geographical location
Coastal 431 1,667,542 437 1,575,692 −0.18 0.855Forest belt 1,059 1,672,674 1,085 1,319,532 5.25 0.000Savannah belt 951 1,034,499 1,102 892,295 2.31 0.021
Wealth statusFirst quintile 551 495,638 794 500,815 −0.36 0.718Second quintile 510 930,874 579 918,666 2.15 0.031Third quintile 507 1,362,448 500 1,351,323 0.15 0.881Fourth quintile 470 1,976,899 388 1,941,883 2.04 0.041Fifth quintile 403 3,754,170 363 3,710,624 0.57 0.566
Note: The average exchange rate in 2006 was 9,236 cedis per United States dollar, which is equivalent to 0.9236 Ghana cedis (GHC) per dollar following theredenomination of the cedi in 2007.Source: Computed from GLSS 5 data.
4. Determinants of Non-farm Income Diversification
4.1 Model and Econometric Approach
The paper adopts the rural household model of income diversification developed by de Janvry and Sadoulet (1996). According tode Janvry and Sadoulet, households allocate their total time endowment to a set of productive activities, both farm and off-farm, ina competing manner. The household problem is to maximize utility subject to the following constraints: (1) a cash constraint; (2)production technologies for own-farming and non-farm activities; (3) exogenous effective prices for tradables; (4) an equilibriumcondition for self-sufficiency in farm production; and (5) an equilibrium condition for family labor. The first-order conditions ofthe model give a system of factor supply and demand functions, which in turn permit the determination of labor allocation amongthe various activities.9
Following Escobal (2001), the model has the following reduced form:
Si j = f (p; zag, znag, zk, zh, z pu, zg) (1)
where Sij represents the income share from income-generating activity i (farm, non-farm self-employment, wage-employment,etc.) for household j; p is the vector of exogenous input and output prices; and the z vectors are the different fixed assets thatare available to the household. Zag represents the fixed farm assets (such as land, livestock and equipment); Znag represents fixednon-farm income generating assets such as experience in crafts or trade; Zk represents other key financial assets that facilitateaccess to credit; Zh is the vector of human capital including family size and composition (age and gender), as well as education;Zpu is the vector of key public assets such as electricity, roads, markets, or water; and Zg includes other key assets related tocharacteristics of the area (agro-climate, land quality, etc.) (Escobal, 2001).
We employ two methods in estimating non-farm income diversification based on the two diversification measures discussed inSection 2.
The number of non-farm income sources is estimated using the Poisson regression (Greene, 2003; Long and Freese, 2003). Letyi represent the number of non-farm income sources of a randomly chosen household. The Poisson regression model specifiesthat the number of non-farm activities (yi ) is drawn from a Poisson distribution with parameter λi (mean number of non-farmactivities), which is related to a set of regressors Xi.10
The density function of the Poisson variable (yi ) is (Greene, 2003):
f (yi |Xi ) = e−λi λyii
yi !yi = 0, 1, 2, . . . . . . (2)
with mean
E[yi |Xi ] = λi = exp(X′iβ) = exp(β0 + β1x1i + · · · · · · · · · + βk xki ) (3)
C© 2012 The Author. African Development Review C© 2012 African Development Bank
240 B. Senadza
The estimation form of the regression model for the Poisson variable is:
yi = exp(X′iβ) + εi = exp(β0 + β1x1i + · · · · · · · · · + βk xki ) + εi (4)
where the Xi is the set of independent variables determining household i’s participation in non-farm income activities, and theyinclude household characteristics such as size, education, gender and age; remittances; household agricultural assets such as landand livestock; geographical location; infrastructure assets such as electricity, markets, roads and access to credit.
Non-farm income (share) is estimated using the tobit (double censored) method. The tobit model hypothesizes the existence ofa latent (unobservable) variable, which is assumed to be a linear function of independent variables.
The tobit model is specified as follows:s∗
i = β ′ Zi + εi (5)
where s∗i is the unrestricted unobservable (latent) income share from activity i, and Z is a vector of explanatory variables (as
discussed above). The observed income share si is, however, restricted to fall in the [0, 1] interval, according to the following rule(Greene, 2003):
si = 0 if s∗i ≤ 0
si = s∗i if 0 < s∗
i < 1
si = 1 if s∗i ≥ 1
A household is therefore assumed not to derive income from non-farm source (meaning zero participation in non-farm activity)if its (observed) income share is censored from below at zero. If the income share lies between zero and one, the household onlyparticipates partially. Household income share is censored from above at one and the household is assumed to derive all its incomefrom non-farm activities (full participation).
4.2 Results and Discussion
The empirical results of non-farm income diversification in rural Ghana are presented in Table 7. The results indicate thathousehold characteristics are important determinants of non-farm income diversification.11 Table 7 shows that both the numberof non-farm income sources and the share of non-farm income in total income are positively related to the average years ofschooling of the household.12 On average, an additional year of schooling increases both the number of non-farm income sourcesand non-farm income share by 0.05. This result contradicts Canagarajah et al. (2001) who did not find education as significantusing GLSS 1 and 3 data.13 The effect of education is significant for non-farm wage employment income but not for the non-farmself-employment income. This finding emphasizes the importance of education in securing non-farm activities, especially wageemployment outside agriculture, and is consistent with the findings of Escobal (2001) for Peru, Yunez-Naude and Taylor (2001)for Mexico, Canagarajah et al. (2001) for Uganda, and Babatunde and Qaim (2009) for Nigeria. In terms of gender of thehousehold head, the results indicate no significant difference between male-headed and female-headed households in non-farmactivity participation, confirming the results in Table 5. Female-headed households earn more from non-farm sources comparedto their male counterparts, a confirmation of the findings of Canagarajah et al. (2001). When the non-farm income share isdisaggregated, however, male-headed households outperform female-headed households in non-farm wage employment incomewhile female-headed households maintain their dominance in self-employment income.
Instead of the traditional use of household size, the paper uses the number of adult males and adult females so as to ascertainthe gender effects of household size. The results show that both the number of adult males and females aged 15 years and above isimportant for multiple non-farm income activities. However, it is only the number of adult females that significantly affects all threecategories of non-farm income. Adult females seem to add an additional impetus to diversification, as non-farm self-employmenttends to be the domain of females. Adult males have a significant effect only on non-farm wage-employment income.
Receipt of remittances is negatively correlated with total non-farm income and non-farm self-employment income. This mayimply that remittances are either invested in agricultural activities or are largely used for consumption rather than invested innon-farm activities. There is no statistically significant difference between the three geographical locations in terms of the numberof non-farm activities, but relative to the savannah belt, households in the coastal belt earn more non-farm income. Those in thecoastal and forest belts also earn more wage-employment income compared to those in the savannah belt. These findings confirmthose of Canagarajah et al. (2001).
Among household agricultural assets, only farm size significantly affects the number of non-farm income activities. It doesnot affect non-farm income, however, and this is consistent with the findings of Escobal (2001), Abdulai and Delgado (1999), de
C© 2012 The Author. African Development Review C© 2012 African Development Bank

Non-farm Income Diversification in Rural Ghana 241
Table 7: Determinants of non-farm income diversification in rural Ghana
Number of non-farmincome activities
Total non-farmincome share
Non-farmself-employment
income share
Non-farm wageemploymentincome share
ZIP Tobit Tobit Tobit
Regressors Coeff. p -value Coeff. p -value Coeff. p -value Coeff. p -value
Age of household head −0.010 0.000 −0.007 0.000 −0.005 0.000 −0.010 0.000Gender of household head
(male = 1)0.013 0.812 −0.069 0.008 −0.164 0.000 0.374 0.000
Number of males 15 yrs &above
0.045 0.043 0.001 0.935 0.006 0.609 0.064 0.020
Number of females 15 yrs& above
0.164 0.000 0.079 0.000 0.090 0.000 0.085 0.001
Avg. Yrs of schooling ofhousehold
0.047 0.000 0.046 0.000 0.005 0.155 0.126 0.000
Received remittances −0.044 0.273 −0.080 0.000 −0.071 0.000 −0.037 0.437(yes = 1)
Household located incoastal belt
0.082 0.178 0.057 0.053 0.037 0.224 0.250 0.000
Household located inforest belt
0.045 0.369 −0.014 0.565 −0.010 0.674 0.177 0.003
Land owned (acres) −5.E − 04 0.609 −3.E − 04 0.567 −9.E − 06 0.984 −0.002 0.347Farm size (acres) 5.E − 04 0.022 2.E − 04 0.177 3.E − 04 0.114 4.E − 04 0.224Livestock owned (TLU) −0.001 0.493 −0.001 0.392 −3.E − 04 0.629 −0.012 0.085Value of farm equipment
(cedis)1.E − 04 0.232 −5.E − 05 0.141 −3.E − 05 0.327 −5.E − 04 0.101
Access to credit (yes = 1) 0.234 0.000 0.108 0.000 0.118 0.000 0.104 0.033Access to electricity 0.268 0.000 0.240 0.000 0.165 0.000 0.341 0.000
(yes = 1)Distance to market (km) −0.016 0.000 −0.008 0.000 −0.007 0.000 −0.009 0.003Distance to main road
(km)0.007 0.300 −0.001 0.835 4.E − 04 0.884 −0.004 0.618
Constant −0.760 0.000 0.085 0.058 0.069 0.128 −1.872 0.000No. of observations 5065 5065 5065 5065Log likelihood −4336.3 −3873.1 −3538.4 −1838.1LR chi2 (16) 303.0 779.3 346.1 760.4Prob ≥ chi2 0.0000 0.0000 0.0000 0.0000
Notes:a) TLU stands for tropical livestock units. Following Al-Hassan et al. (1997) and Ramakrishna and Demeke (2002), 1 cattle = 1 TLU; 1 draught = 1 TLU; 1 pig =0.25 TLU; 1 sheep = 0.2 TLU; 1 goat = 0.15 TLU; 1 rabbit = 0.005 TLU; 1 poultry = 0.005 TLU.b) The number of non-farm income sources was estimated using the zero-inflated Poisson (ZIP) because of excess zeros. The Vuong test for excess zeros posteda z-statistic of 3.74 (p < 0.000). There was no problem of over-dispersion.c) Total non-farm income share: uncensored obs. = 2271, left censored obs. = 2641, right censored obs. = 153; Non-farm self-employment income share:uncensored obs. = 1943, left censored obs. = 3039, right censored obs. = 83; Non-farm wage-employment income share: uncensored obs. = 590, left censoredobs. = 4429, right censored obs. = 46.d) p < 0.01, p < 0.05, p < 0.10 indicates significance at 1%, 5% and 10% respectively.
Janvry and Sadoulet (2001) and Woldenhanna and Oskam (2001). Access to credit and electricity is positively correlated with thenumber of non-farm income activities and the non-farm income share, consistent with what Escobal (2001) found for rural Peru.Distance to the nearest market is significant for both the number of activities and the non-farm income shares, also confirmingthe findings of Newman and Canagarajah (2000) and Canagarajah et al. (2001) for Ghana and Escobal (2001) for Peru.
5. Conclusion
Given that poverty reduction is central to government economic policy, this paper sought to investigate the extent to which ruralhouseholds in Ghana depend on non-farm sources for their livelihood and what factors determine their participation and theincomes derived from non-farm sources. The findings indicate that both off-farm and non-farm incomes constitute a significantproportion of rural household incomes in Ghana. Female-headed households tend to have larger off-farm income shares compared
C© 2012 The Author. African Development Review C© 2012 African Development Bank

242 B. Senadza
to male-headed households. Non-farm income shares followed the same gender pattern albeit less pronounced. Unlike in LatinAmerica and Asia, in rural Ghana, non-farm self-employment income is more important than non-farm wage-employmentincome. Non-farm self-employment income is more important for female-headed households, coastal and savannah households,and the wealthiest 40 percent of households. Although relatively less important, non-farm wage employment income shares alsoexhibit some gender, geographical and wealth differentiated patterns. Regression results indicate that the gender compositionof households, age, education, and access to credit, electricity and markets are important determinants of multiple non-farmactivities as well as non-farm income. While we are not advocating for a substitution of agricultural activities for non-agriculturalactivities, the findings call for policy options that can help rural households maximize the benefits from rural non-farm activitiesfor poverty reduction and growth in rural Ghana.
Notes
1. Lay et al. (2009), however, find that contrary to common beliefs, rural households in Burkina Faso are not increasinglydiversifying their income portfolios.
2. Asset fixity in simple terms refers to the inability of inputs (labor, materials, capital, land) to adjust to equilibrium levelsimplied by current prices.
3. The sectoral classification of activities is in line with the sectoral categorizations in national accounting systems, that is,primary (agriculture), secondary (manufacturing, mining, and other extractive activities), and tertiary (services).
4. This increase, however, is not monotonic. The fourth expenditure quintile has higher off-farm and non-farm shares comparedto the fifth quintile.
5. Remittance and other income are not income-earning activities. They are, however, sources of income. The participationfigures therefore measure the proportion of households receiving remittances and income from other sources.
6. In this case, household non-farm income sources take the values 0, 1 and 2.
7. A test of the difference between the two means posted a t-statistic of 1.47 and a p-value of 0.141.
8. We define a diversified household as one with at least one non-farm income source, i.e. non-farm wage-employment incomeor non-farm self-employment income or both. A non-diversified household does not earn income from any of these twosources.
9. See de Janvry and Sadoulet (1996) for a detailed discussion.
10. Thus the Poisson regression model incorporates observed heterogeneity into the Poisson distribution function.
11. As indicated earlier, a total of 5,069 rural households were surveyed. Four observations were single-person unemployedhouseholds. These were dropped from the data leaving 5,065 observations for analysis.
12. The number of non-farm income sources is estimated using the zero-inflated Poisson (ZIP) because of the presence of excesszeros.
13. While we measure education by the average number of years of schooling of the household, Canagarajah et al. (2001) dummiededucation.
References
Abdulai, A. and A. CroleRees (2001), ‘Determinants of Income Diversification amongst Rural Households in Southern Mali’,Food Policy, Vol. 26, No. 4, pp. 437–52.
Abdulai, A. and C.L. Delgado (1999), ‘Determinants of Nonfarm Earnings of Farm-Based Husbands and Wives in NorthernGhana’, American Journal of Agricultural Economics, Vol. 81, No. 1, pp. 117–30.
Alderman, H. and C.H. Paxson (1992), ‘Do the Poor Insure? A Synthesis of the Literature on Risk and Consumption in DevelopingCountries’, Policy Research Working Papers, WPS 1008, World Bank, October.
C© 2012 The Author. African Development Review C© 2012 African Development Bank

Non-farm Income Diversification in Rural Ghana 243
Al-Hassan, R., J.A. Famiyeh and A. de Jager (1997), ‘Farm Household Strategies for Food Security in Northern Ghana: AComparative Analysis of High and Low Population Farming Systems’, in W.K. Asenso-Okyere, G. Benneh and W. Tims (eds.),Sustainable Food Security in West Africa, Kluwer Academic, Boston, MA.
Babatunde, R.O. and R. Qaim (2009), ‘Patterns of Income Diversification in Rural Nigeria: Determinants and Impacts’, QuarterlyJournal of International Agriculture, Vol. 48, No. 4, pp. 305–20.
Barrett, C.B., T. Reardon and P. Webb (2001), ‘Nonfarm Income Diversification and Household Livelihood Strategies in RuralAfrica: Concepts, Dynamics, and Policy Implication’, Food Policy, Vol. 26, No. 4, pp. 315–31.
Canagarajah, S., C. Newman and R. Bhattamishra (2001), ‘Non-farm Income, Gender, and Inequality: Evidence from RuralGhana and Uganda’, Food Policy, Vol. 26, No. 4, pp. 405–20.
de Janvry, A. and E. Sadoulet (1996), ‘Household Modeling for the Design of Poverty Alleviation Strategies’, Working Paper787, Department of Agricultural and Resource Economics, University of California, Berkeley.
de Janvry, A. and E. Sadoulet (2001), ‘Income Strategies among Rural Households in Mexico: The Role of Off-farm Activities’,World Development, Vol. 29, No. 3, pp. 467–80.
Dercon, S. (2002), ‘Income Risk, Coping Strategies, and Safety Nets’, World Bank Research Observer, Vol. 17, No. 2, pp. 141–66.
Dercon, S. and P. Krishnan (1996), ‘Income Portfolios in Rural Ethiopia and Tanzania: Choices and Constraints’, Journal ofDevelopment Studies, Vol. 32, No. 6, pp. 850–75.
Ellis, F. (1998), ‘Household Strategies and Rural Livelihood Diversification’, Journal of Development Studies, Vol. 35, No. 1,pp. 1–38.
Escobal, J. (2001), ‘The Determinants of Nonfarm Income Diversification in Rural Peru’, World Development, Vol. 29, No. 3,pp. 497–508.
Ghana Statistical Service (2000), ‘Ghana Living Standards Survey, Report of Fourth Round (GLSS4)’, Ghana Statistical Service,Accra.
Ghana Statistical Service (2008) ‘Ghana Living Standards Survey, Report of Fifth Round (GLSS5)’, Ghana Statistical Service,Accra.
Greene, W.H. (2003), Econometric Analysis (5th edn), Prentice Hall, New York.
Haggblade, S., P. Hazell and T. Reardon (2005), ‘The Rural Nonfarm Economy: Pathway out of Poverty or Pathway in?’ Availableat: http://www.ifpri.org/events/seminars/2005/smallfarms/sfproc/S04_haggblade.pdf
Lay, J., U. Narloch and T.O. Mahmoud (2009), ‘Shocks, Structural Change, and the Patterns of Income Diversification in BurkinaFaso’, African Development Review, Vol. 21, pp. 36–58.
Long, J.S. and J. Freese (2003), Regression Models for Categorical Dependent Variables Using STATA, 2nd edn, STATA Press,College Station, TX.
Newman, C. and S. Canagarajah (2000), ‘Non-farm Employment, Poverty, and Gender Linkages: Evidence from Ghana andUganda’, Policy Research Working Paper, 2367, World Bank, August.
Ramakrishna, G. and A. Demeke (2002), ‘An Empirical Analysis of Food Security in Ethiopia: The Case of North Wello’, AfricanDevelopment, Vol. 27, No. 1 and 2, pp. 127–43.
Reardon, T., C. Delgado and P. Matlon (1992), ‘Determinants and Effects of Income Diversification amongst Farm Householdsin Burkina Faso’, Journal of Development Studies, Vol. 28, No. 2, pp. 264–96.
Reardon, T., K. Stamoulis, A. Balisacan, M.E. Cruz, J. Berdegue and B. Banks (1998), ‘Rural Nonfarm Income in DevelopingCountries’, in The State of Food and Agriculture 1998, Food and Agricultural Organization of the United Nations, Rome.
Reardon, T., J. Berdegue, C.B. Barrett and K. Stamoulis (2006), ‘Household Income Diversification into Rural Nonfarm Activities’,in S. Haggblade, P. Hazell and T. Reardon (eds.), Transforming the Rural Nonfarm Economy, The Johns Hopkins University Press,Baltimore, MD.
Winters, P., B. Davis and L. Corral (2002), ‘Assets, Activities, and Income Generation in Rural Mexico: Factoring in Social andPublic Capital’, Agricultural Economics, Vol. 27, No. 2, pp. 139–56.
C© 2012 The Author. African Development Review C© 2012 African Development Bank

244 B. Senadza
Winters, P., G. Carletto, B. Davis, K. Stamoulis and A. Zezza (2006), Rural Income-Generating Activities in Developing Countries,The RIGA Research Project, FAO, Rome.
Woldenhanna, T. and A. Oskam (2001), ‘Income Diversification and Entry Barriers: Evidence from the Tigray Region of NorthernEthiopia’, Food Policy, Vol. 26, No. 4, pp. 351–65.
Yunez-Nuade, A. and J.E. Taylor (2001), ‘The Determinants of Non-farm Activities and Incomes of Rural Households in Mexico,with Emphasis on Education’, World Development, Vol. 29, No. 3, pp. 561–72.
C© 2012 The Author. African Development Review C© 2012 African Development Bank