NON-AGRICULTURAL COOPERATIVES IN THE UNITED …ageconsearch.umn.edu/bitstream/23134/1/aer388.pdf ·...
42
Agricultural Economics Report No. 388 April 1998 NON-AGRICULTURAL COOPERATIVES IN THE UNITED STATES: ROLES, DIFFICULTIES, AND PROSPECTS SANJIB BHUYAN F. LARRY LEISTRITZ DAVID W. COBIA Department of Agricultural Economics ! Agricultural Experiment Station North Dakota State University ! Fargo, ND 58105-5636
Transcript of NON-AGRICULTURAL COOPERATIVES IN THE UNITED …ageconsearch.umn.edu/bitstream/23134/1/aer388.pdf ·...

Agricultural Economics Report No. 388 April 1998
NON-AGRICULTURAL COOPERATIVESIN THE UNITED STATES:
ROLES, DIFFICULTIES, AND PROSPECTS
SANJIB BHUYANF. LARRY LEISTRITZ
DAVID W. COBIA
Department of Agricultural Economics !! Agricultural Experiment StationNorth Dakota State University !! Fargo, ND 58105-5636

ACKNOWLEDGMENTS
The research reported in this document was funded in part by a cooperative agreement, FMHA-94-97, between Cooperative Services, Rural Economics and Community Development, U.S. Department ofAgriculture and the North Dakota Agricultural Experiment Station. Randy Torgerson, DeputyAdministrator, RBS Cooperative Services, served as liaison and David Cobia and F. Larry Leistritz as co-principal investigators. This report also contributes to NDSU Experiment Station Project 1394, titled“Strategies for Rural Cooperative Development.”
Data collection and partial analysis of this study was completed while Dr. Bhuyan was a ResearchAssistant at North Dakota State University. Further preparation of this report was conducted after Dr.Bhuyan became an Assistant Professor at the New Jersey Agricultural Experiment Station, thuscontributing to NJAES Project 02263.
The authors extend our thanks to Carol Jensen for assistance in manuscript preparation and to ourcolleagues who reviewed the manuscript. We also thank Frayne Olson and Brooks Wilson for theirassistance at various stages of the study.
We would be happy to provide a single copy of this publication free of charge. You canaddress your inquiry to: Carol Jensen, Department of Agricultural Economics, North DakotaState University, P.O. Box 5636, Fargo, ND, 58105-5636, Ph. 701-231-7441, Fax 701-231-7400,e-mail [email protected] . This publication is also available electronically at this website: http://agecon.lib.umn.edu/ndsu.html
NOTICE:
The analyses and views reported in this paper are those of the author. They are notnecessarily endorsed by the Department of Agricultural Economics or by North Dakota StateUniversity.
North Dakota State University is committed to the policy that all persons shall have equalaccess to its programs, and employment without regard to race, color, creed, religion, nationalorigin, sex, age, marital status, disability, public assistance status, veteran status, or sexualorientation.
Information on other titles in this series may be obtained from: Department ofAgricultural Economics, North Dakota State University, P.O. Box 5636, Fargo, ND 58105. Telephone: 701-231-7441, Fax: 701-231-7400, or e-mail: [email protected].
Copyright © 1998 by Sanjib Bhuyan, F. Larry Leistritz, and David W. Cobia. All rightsreserved. Readers may make verbatim copies of this document for non-commercial purposes byany means, provided that this copyright notice appears on all such copies.

TABLE OF CONTENTS
Page
ABSTRACT . . . . . . . . . . . . . . . . . . . . . . . . . . . . . . . . . . . . . . . . . . . . . . . . . . . . . . . . . . . . . . iii
HIGHLIGHTS . . . . . . . . . . . . . . . . . . . . . . . . . . . . . . . . . . . . . . . . . . . . . . . . . . . . . . . . . . . . iv
INTRODUCTION . . . . . . . . . . . . . . . . . . . . . . . . . . . . . . . . . . . . . . . . . . . . . . . . . . . . . . . . . . 1
ANALYTICAL FRAMEWORK . . . . . . . . . . . . . . . . . . . . . . . . . . . . . . . . . . . . . . . . . . . . . . . . 2
RESULTS AND DISCUSSION . . . . . . . . . . . . . . . . . . . . . . . . . . . . . . . . . . . . . . . . . . . . . . . . 3Type of Non-agricultural Cooperatives . . . . . . . . . . . . . . . . . . . . . . . . . . . . . . . . . . . . . . 3Geographic Distribution of the Sample . . . . . . . . . . . . . . . . . . . . . . . . . . . . . . . . . . . . . . 3Membership Type and Policy . . . . . . . . . . . . . . . . . . . . . . . . . . . . . . . . . . . . . . . . . . . . . 4Size Distribution and Length of Time in Business . . . . . . . . . . . . . . . . . . . . . . . . . . . . . . 5Type of Management . . . . . . . . . . . . . . . . . . . . . . . . . . . . . . . . . . . . . . . . . . . . . . . . . . . 6Business as a Cooperative . . . . . . . . . . . . . . . . . . . . . . . . . . . . . . . . . . . . . . . . . . . . . . . 8Reasons for Opening and Operating the Business as a Cooperative . . . . . . . . . . . . . . . . 10Difficulties Faced by Non-agricultural Cooperatives during Formation . . . . . . . . . . . . . 12Current Difficulties of the Non-agricultural Cooperatives . . . . . . . . . . . . . . . . . . . . . . . 14Strengths and Weaknesses of Non-agricultural Cooperatives . . . . . . . . . . . . . . . . . . . . 16Contributions of the Non-agricultural Cooperatives . . . . . . . . . . . . . . . . . . . . . . . . . . . 16Services for Success . . . . . . . . . . . . . . . . . . . . . . . . . . . . . . . . . . . . . . . . . . . . . . . . . . . 18
SUMMARY AND CONCLUSIONS . . . . . . . . . . . . . . . . . . . . . . . . . . . . . . . . . . . . . . . . . . . . 19
REFERENCES . . . . . . . . . . . . . . . . . . . . . . . . . . . . . . . . . . . . . . . . . . . . . . . . . . . . . . . . . . . . 24
APPENDIX A . . . . . . . . . . . . . . . . . . . . . . . . . . . . . . . . . . . . . . . . . . . . . . . . . . . . . . . . . . . . . 25Cooperative Survey . . . . . . . . . . . . . . . . . . . . . . . . . . . . . . . . . . . . . . . . . . . . . . . . . . . 26
APPENDIX B - . . . . . . . . . . . . . . . . . . . . . . . . . . . . . . . . . . . . . . . . . . . . . . . . . . . . . . . . . . . 35Appendix Table B.1 . . . . . . . . . . . . . . . . . . . . . . . . . . . . . . . . . . . . . . . . . . . . . . . . . . 36

ii
LIST OF TABLES
Table Page
1 Sample Distribution by Industry of Non-agricultural Cooperatives,1997 Survey Respondents . . . . . . . . . . . . . . . . . . . . . . . . . . . . . . . . . . . . . . . . . . . . . . . 3
2 Membership Type of Non-agricultural Cooperative Survey Respondents by Industry, 1997 . . . . . . . . . . . . . . . . . . . . . . . . . . . . . . . . . . . . . . . . . . . . . . . . . . . . . . 4
3 Size Distribution of Non-agricultural Cooperative Survey Respondentsby Industry, 1997 . . . . . . . . . . . . . . . . . . . . . . . . . . . . . . . . . . . . . . . . . . . . . . . . . . . . . . 5
4 Length of Time in Business for Non-agricultural Cooperative SurveyRespondents by Industry, 1997 . . . . . . . . . . . . . . . . . . . . . . . . . . . . . . . . . . . . . . . . . . 6
5 Type of Management Employed by Non-agricultural CooperativeSurvey Respondents by Industry, 1997 . . . . . . . . . . . . . . . . . . . . . . . . . . . . . . . . . . . . . . 7
6 Degrees of Success of Non-agricultural Cooperative Survey Respondentsby Industry, 1997 . . . . . . . . . . . . . . . . . . . . . . . . . . . . . . . . . . . . . . . . . . . . . . . . . . . . . . 7
7 Ranked Major Sources of Information During Formation of Non-agricultural Cooperative Survey Respondents by Industry, 1997 . . . . . . . . . . . . . . . . . . . . . . . . . . . . 8
8 Major Sources of Debt Capital for Non-agricultural Cooperative SurveyRespondents by Industry, 1997 . . . . . . . . . . . . . . . . . . . . . . . . . . . . . . . . . . . . . . . . . . 10
9 Ranked Importance of Factors in the Formation of Non-agricultural Cooperative Survey Respondents, 1997 . . . . . . . . . . . . . . . . . . . . . . . . . . . . . . . . . . . . 11
10 Ranked Importance of Difficulties Faced by Non-agricultural Cooperative SurveyRespondents by Industry, 1997 . . . . . . . . . . . . . . . . . . . . . . . . . . . . . . . . . . . . . . . . . . 13
11 Ranked Importance of Current or Existing Problems of Non-agricultural Cooperative Survey Respondents by Industry, 1997 . . . . . . . . . . . . . . . . . . . . . . . . . . . 15
12 Ranked Strengths and Weaknesses of Non-agricultural CooperativeSurvey Respondents by Industry, 1997 . . . . . . . . . . . . . . . . . . . . . . . . . . . . . . . . . . . . . 17
13 Ranked Importance of Contributions as Reported by Non-agriculturalCooperative Survey Respondents by Industry, 1997 . . . . . . . . . . . . . . . . . . . . . . . . . . . 18
14 Ranked Importance of Selected Services for Continued Success ofNon-agricultural Cooperative Survey Respondents by Industry, 1997 . . . . . . . . . . . . . . 19
iii
ABSTRACT
A wide variety of cooperatives outside the agricultural sector have been playing animportant role in the nation's rural and urban areas by providing housing for the elderly and poor,affordable health care, child care, and education. These firms may constitute both businessmodels that reduce the cost of operating a business and effective community development modelsthat forge cooperation among local government and communities. However, limited informationis available about how these non-agricultural cooperatives operate, how they were formed, orwhat are their problems or difficulties as non-traditional cooperatives. This study of 162randomly selected non-agricultural cooperatives across the United States attempts to answerthese questions and finds that even this small sample of non-agricultural cooperatives played animportant role in various sectors of the nation’s economy (e.g., retail), serving slightly less thanhalf a million members in 1996. Most of these non-agricultural cooperatives had been in businessfor over 30 years, showing their tenacity in today's highly competitive world. Most of thesecooperatives were professionally managed. While raising equity was the most difficult problemduring their formation stage, competition in their major market (trade) area was the most difficultcurrent problem. The problem of balancing the interests of cooperative members was a majorproblem for these non-agricultural cooperatives. According to these non-agriculturalcooperatives, training and education of the cooperative board of directors, management, andemployees is an important factor for cooperative success.
Key Words: non-agricultural cooperatives, formation, operation, factors affecting success

iv
HIGHLIGHTS
Cooperatives are an integral part of the U.S. economy, in both agricultural and non-agricultural sectors. The objectives of this study were to examine the operating characteristics ofnon-agricultural cooperatives, analyze their difficulties during formation and current operation,assess their strengths and weaknesses as cooperative business organizations, and finally toexamine their role as business entities in the economy. The primary tool of the study was anationwide survey of non-agricultural cooperatives conducted in early 1997. Usable surveysfrom 162 cooperatives (35% of the sample) made up the data base for the study. The respondentsrepresented 40 states; the states with the largest numbers of respondents were Wisconsin andMississippi.
When asked whether they could have opened their business had it not been organized as acooperative, the respondents were about equally divided between “yes” and “no.” This study alsounderscores the importance of member training and education, because during the formation stageof most of these non-agricultural cooperatives, their core members were their most importantsource of information. Members also played an important role in capitalizing these non-agricultural cooperatives; almost 70% raised their start-up debt capital from their members,rather than borrowing from commercial banks or other financial institutions.
Most of the non-agricultural cooperative respondents agreed that they opened theirbusiness as a cooperative to pool the resources of their individual members, reflecting a longstanding reason for forming cooperatives. Another important reason for forming cooperatives,according to the respondents, was to provide necessary goods and services at a reduced cost. Thus, market failure combined with members' desire and ability to pool their resources through acooperative form of business have resulted in the formation of most the non-agriculturalcooperatives in this study.
Although some of these non-agricultural cooperatives had business entities, governmentagencies, or non-profit organizations as their members, the predominant type of membershipamong these cooperatives was individual memberships. Among the respondents, only 35 (22%)had more than one type of members. Another important characteristic of these cooperatives wasthat over 90% of them had an open membership policy. The degree of success of thesecooperatives was statistically independent of their open- or closed-membership policy.
Most of the respondents in this study (over 73% ) were either consumer (retail)cooperatives (e.g., food stores, clothing stores whose members are individuals) or servicecooperatives (e.g., child care, residential care, rental services). The rest were almost equallydivided among wholesale trade, finance, insurance and real estate (FIRE), and a miscellaneoussector (Misc.) containing some manufacturing and transportation cooperatives.
In the sample of 150 cooperatives, serving 322,908 members in 1996, the service sectorcooperatives had the highest average number of members, followed by the retail sector

v
cooperatives in a distant second place. The amount of business to non-members among theserespondents was substantial, slightly over 24% of respondents’ 1996 revenue. The retail sectorcooperatives had the highest level of non-member business with an average of 35.6% of revenue,followed closely by wholesale cooperatives (31.5%).
The economic contribution made by the non-agricultural cooperatives included in thisstudy was substantial. Total revenues for 128 respondents were almost one billion dollars in1996. The payroll of 117 responding cooperatives was almost $166 million in 1996. However,most of the non-agricultural cooperatives taking part in this survey (over 62%) were smallbusinesses with revenues of less than $5 million a year. Only three respondents reported revenuesover $50 million in 1996. Regardless of their size, a majority (almost 61%) of the non-agricultural cooperatives were managed by professional managers.
The non-agricultural cooperative respondents faced various difficulties during theirformation stages as well as during current operations. Raising equity was the most difficultproblem faced by these cooperatives during formation. The second most difficult problem wasraising debt capital. Among other important problems faced by these cooperative respondentsduring the formation stage was developing suitable marketing and business plans and obtaininginformation on legal issues related to cooperatives.
Although on average the cooperatives represented in this study had been in business forover 30 years, they still face difficulties in operating their business. These non-agriculturalcooperative respondents most frequently reported problems with maintaining their marketing plan,identifying and selecting a board of directors (in principle, such members must come from thecooperative membership only), maintaining and managing cash flow, and identifying cooperativeleaders. While some of these problems, such as maintaining or managing cash flow, are commonto all kinds of business, cooperatives have some special problems, such as identifying andselecting a board of directors. Training and education for cooperative board members,management, and employees were considered as the most important and necessary services forsuccess of cooperatives by the respondents in this study.
The non-agricultural cooperatives also identified several aspects of their businesses astheir strengths. Most respondents identified customer relations, work force quality, beingprovider of a unique product or service, trust among members, low member turnover, board-management relations, and management quality as major strengths. These non-agriculturalcooperatives had also clearly identified their role as cooperatives, e.g., they were able to reducemembers’ cost of doing business, or they were filling an important void by providing unavailablegoods and services, or they were able to help members remain independent, among others. Among the weaknesses identified by the non-agricultural cooperative respondents, their inabilityto recruit board members, marketing their product or service, and availability of long-term debtcapital topped the list.
* Bhuyan is Assistant Professor, Department of Agricultural Economics & Marketing, Rutgers University, NJ; Leistritz is Professor and Cobia is retired Professor, Department of Agricultural Economics, North Dakota State University, Fargo.
NON-AGRICULTURAL COOPERATIVES IN THE UNITED STATES: ROLES, DIFFICULTIES, AND PROSPECTS
SANJIB BHUYAN, F. LARRY LEISTRITZ, and DAVID W. COBIA *
INTRODUCTION
This study examines a number of attributes of non-agricultural cooperatives, includingtheir operating characteristics, difficulties encountered during formation and current operation,their perceived strengths and weaknesses as business organizations, and their role in their areaeconomy. Cooperatives are user-owner and user-controlled businesses that return net income (orbenefit) to users or patrons based on their patronage, whereas other business firms return netincome to investors on the basis of investment. Cooperative activities range from supplying seedand fertilizer to selling multimillion dollars worth of recreational equipment per year. Among thetop agricultural cooperatives, Farmland Industries or Land O’ Lakes are household names. So arethe Associated Press and True Value stores, but the latter two are non-agricultural cooperatives.
For many people, and particularly for rural residents, the term cooperative evokes imagesof the local cooperative grain elevators and farm supply outlets which have been developed toserve the needs of their farmer members. However, in a recent study of how people are usingcooperative action to rebuild communities and revitalize the economy, Nadeau and Thompson(1996) show that the same cooperative principles of member-ownership and control for memberbenefit can be applied to building successful businesses that aim at reducing the cost of doingbusiness for their members, providing housing for the elderly and poor, or providing affordablehealth care, among others. For example, the cooperative approach is gaining more attention inthe health care sector, where cost-effective models or methods for delivering services arebecoming increasingly necessary (e.g., Minneapolis, Minn., based HealthPartners Inc. and GroupHealth Cooperative (GHC) of Madison, Wis., are two of the many cooperative health careproviders in the United States today).
Small businesses are the backbone of the U.S. economy, as they employ a majority of thenation’s labor force. In an increasingly competitive world economy, more and more smallbusinesses are finding that doing business, whether buying or selling, through cooperatives is anold, but effective, solution to a new set of problems. For instance, in the fast food and hardwareretailing sectors, purchasing cooperatives have been formed by independent franchisees to delivermaterials, equipment, employee training, and even insurance at a reduced cost. The Food ServicePurchasing Cooperative based in Louisville, Ky., is a purchasing co-op for several thousandKentucky Fried Chicken franchisees, and TruServ is the purchasing co-op of thousands ofindependent True Value and Coast to Coast hardware retailers. Another example is IndependentPharmacists' Cooperative based in Madison, Wis., which is a buying agent for independent

2
member pharmacies aiming at reducing drug purchasing cost of its members, who ideally passtheir savings to their customers. Nadeau and Thompson (1996) have described how thecooperative principle and approach has been used by people to revitalize the economy and rebuildcommunities across the nation.
A listing of examples of non-agricultural cooperatives in various sectors of the economy,and in both rural and urban settings, could become very lengthy. However, the examplesmentioned give a glimpse of the potential of the cooperative approach to providing goods andservices needed either by consumers or businesses in rural areas. In many rural areas, basic retailitems such as those provided by clothing, grocery, and drug stores, and social services, such ashealth care, day care, and housing for the elderly, disabled, and poor, are becoming increasinglydifficult to provide (Leistritz et al. 1987, Ayres et al. 1992, Leistritz and Hamm 1994). In light ofthese growing challenges, it may be appropriate for those concerned with rural economicdevelopment to examine the potential of the cooperative model to meet the needs of consumers,businesses, or local governments (Bhuyan 1996).
The literature on cooperatives is dominated by articles and reports dealing withagricultural cooperatives -- their characteristics, operation, structure, performance, problems, andprospects (Cobia 1989). On the other hand, relatively little has been written concerning non-agricultural cooperatives. The present study attempts to diminish this gap in the literature byproviding information about the operation characteristics, successes and difficulties, strengths andweaknesses of non-agricultural cooperatives across the United States. The authors hope that thisinformation will be useful to potential cooperative entrepreneurs by helping them identify potentialproblems. The study findings also may enhance understanding of the role of non-agriculturalcooperatives in the economy.
ANALYTICAL FRAMEWORK
A mail questionnaire survey of non-agricultural cooperatives was the primary source ofdata. Survey questions were designed based on cooperative theory and practices. During thedesign process, several cooperative practitioners and developers in North Dakota and Minnesotawere consulted, and some of these individuals also assisted in pre-testing the questionnaire. Thepre-test was conducted in the Minneapolis--St. Paul area, with representatives of several non-agricultural cooperatives from the Twin Cities area participating.
The mailing list for the survey was developed using a national business directory called theAmerican Yellow Pages. The 1996 edition of this data base was used, and the ‘name’ categorywas searched for the terms ‘cooperative(s)’, ‘coop,’ and ‘co-op.’ The listings thus identified werethen screened to eliminate government offices (e.g., Minnesota Cooperative Extension Service),branch offices, and duplicate listings. Through this process, a list of more than 3,000 businesseswas developed.
3
Once the list had been compiled, a stratified random sampling technique was used toobtain a representative sample of firms in various sectors of the economy (e.g., retail, wholesale,service). A sample of 1,000 non-agricultural cooperatives was selected, and questionnaires weremailed to these firms in February 1997. (For a copy of the questionnaire, see Appendix A.)
Of the 1,000 surveys that were mailed, 178 were returned blank with comments indicatingthat the addressee organization was not a cooperative. In addition, 366 surveys were returnedunopened by the post office, with notations such as ‘Address Unknown.’ Of the 456 remainingquestionnaires, 162 completed responses were received by the end of April 1997 (after tworeminder notes). Thus, the effective response rate (after eliminating discarded surveys) was34.8%. The 162 completed surveys constitute the data base for this study.
RESULTS AND DISCUSSION
Type of Non-agricultural Cooperatives
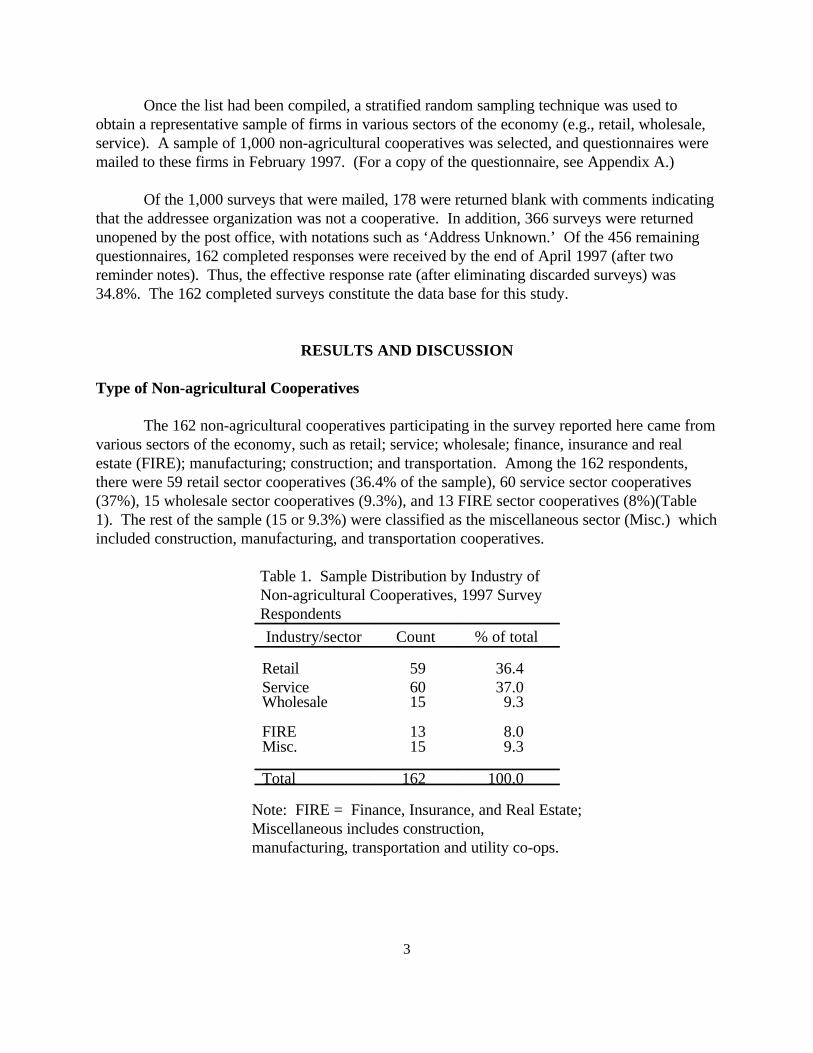
The 162 non-agricultural cooperatives participating in the survey reported here came fromvarious sectors of the economy, such as retail; service; wholesale; finance, insurance and realestate (FIRE); manufacturing; construction; and transportation. Among the 162 respondents,there were 59 retail sector cooperatives (36.4% of the sample), 60 service sector cooperatives(37%), 15 wholesale sector cooperatives (9.3%), and 13 FIRE sector cooperatives (8%)(Table1). The rest of the sample (15 or 9.3%) were classified as the miscellaneous sector (Misc.) whichincluded construction, manufacturing, and transportation cooperatives.
Table 1. Sample Distribution by Industry of Non-agricultural Cooperatives, 1997 Survey Respondents
Industry/sector Count % of total
Retail 59 36.4Service 60 37.0Wholesale 15 9.3
FIRE 13 8.0Misc. 15 9.3
Total 162 100.0
Note: FIRE = Finance, Insurance, and Real Estate; Miscellaneous includes construction, manufacturing, transportation and utility co-ops.

4
Geographic Distribution of the Sample
In terms of their geographic distribution, these 162 non-agricultural cooperativesrepresented 40 states, from Alabama to Wisconsin, and as far as Hawaii. The geographicdistribution of the non-agricultural cooperative respondents is presented in Appendix Table B.1. Wisconsin was the state with the largest number of respondents, accounting for over 14% of thesample (or 23 respondents), followed by Mississippi (20 or 12.3% of the sample), and Minnesota(11 or 6.8%), while California and Maryland tied for the fourth place with 8 respondents (4.9%)in each.
Membership Type and Policy
Regarding the membership type of the sampled cooperatives, 55% reported individuals as their major type of members, 18% reported business entities as their members, 9% reportedgovernment/public agencies as their members, and finally 19% had non-profit organizations asmembers (Table 2). Among different types of cooperatives, most retail and service sectorcooperatives had individuals as members. Among the responding cooperatives, only about 22%had more than one type of members. Many of the cooperatives with more than one type ofmember were in the retail category (16 out of 35). The total number of members in these 150responding cooperatives was 322,908, of which 26% (or 85,216) were members of retailcooperatives, 9% (29,917) were members of service cooperatives, 49% (156,953) were membersof wholesale cooperatives, 14% (45,529) were members of FIRE cooperatives, and 1% (4,429)were members of miscellaneous cooperatives.
Table 2. Membership Type of Non-agricultural Cooperative Survey Respondents by Industry,1997
Type ofMembership
Industry/sector
TotalRetail Service Wholesale FIREa Misc.
Individual 38(66.7)
28(54.9)
4(26.7)
8(61.5)
4(28.6)
82(54.7)
Businessentities
10(17.5)
2(3.9)
5(33.3)
3(23.1)
7(50.0)
27(18.0)
Govt./publicagencies
1(1.8)
10(19.6)
1(6.7)
0 1(7.1)
13(8.7)
Non-profit organizations
8(14.0)
11(21.6)
5(33.3)
2(15.4)
2(14.3)
28(18.7)
Total 57 51 15 13 14 150
Note: Numbers in brackets are column percentages; Source: Survey Question # 2.aFIRE -- finance, insurance, and real estate.
5
Although many cooperative leaders argue that cooperative principles encourage an openmember policy, many cooperatives do not accept new members (i.e., they are closedcooperatives). Royer and Bhuyan (1994) have shown that for successful vertical integration byfarmer cooperatives, the output of the downstream operations has to be restricted, and one wayof accomplishing that goal is to restrict membership. Perhaps not surprisingly, many agriculturalprocessing cooperatives in the United States are closed to new members. In this study, a questionon the policy on accepting new members revealed that 90% of the respondents were open to newmembers. None of the closed cooperatives were in the retail sector. A chi-square test showedthat there was no statistically significant relationship between the cooperatives’ degree of success(as subjectively evaluated by the respondents) and their membership policy. In a related questionregarding patronage by non-members, 62% of respondents reported non-member business, while38% had no non-member business in 1996. Most retail (consumer) cooperatives (88%) reportednon-member business.
Size Distribution and Length of Time in Business
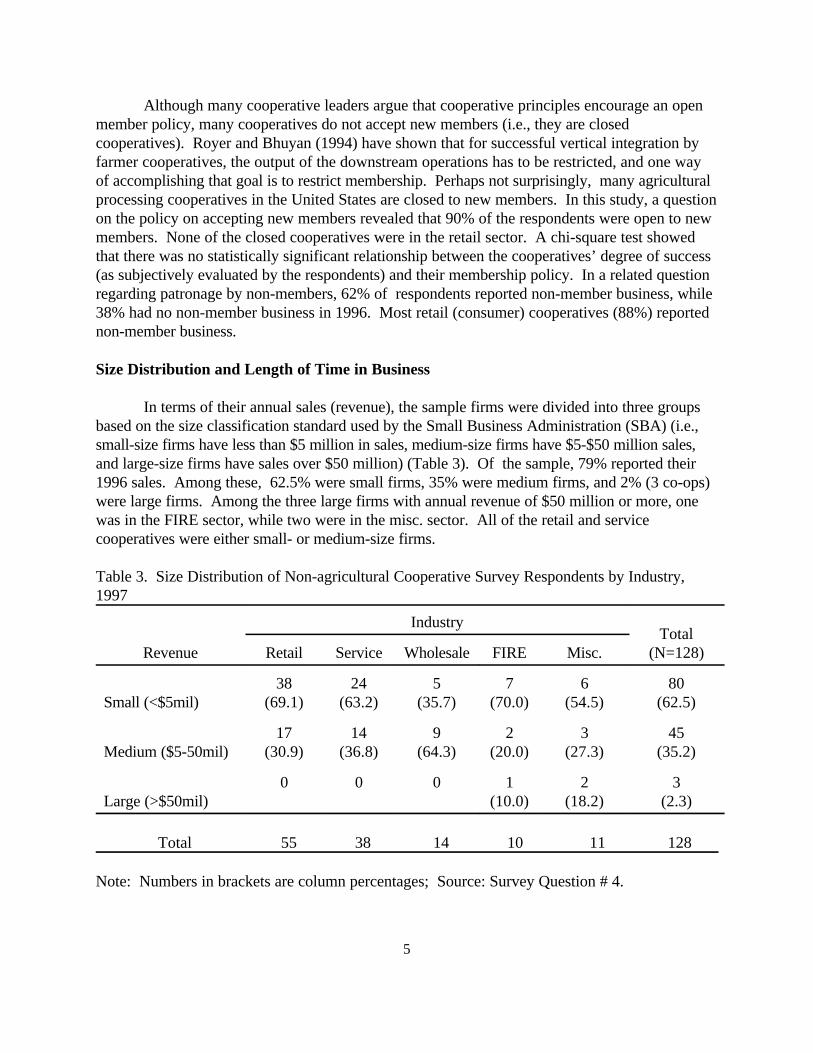
In terms of their annual sales (revenue), the sample firms were divided into three groupsbased on the size classification standard used by the Small Business Administration (SBA) (i.e.,small-size firms have less than $5 million in sales, medium-size firms have $5-$50 million sales,and large-size firms have sales over $50 million) (Table 3). Of the sample, 79% reported their1996 sales. Among these, 62.5% were small firms, 35% were medium firms, and 2% (3 co-ops)were large firms. Among the three large firms with annual revenue of $50 million or more, onewas in the FIRE sector, while two were in the misc. sector. All of the retail and servicecooperatives were either small- or medium-size firms.
Table 3. Size Distribution of Non-agricultural Cooperative Survey Respondents by Industry,1997
Revenue
IndustryTotal
(N=128)Retail Service Wholesale FIRE Misc.
Small (<$5mil)38
(69.1)24
(63.2)5
(35.7)7
(70.0)6
(54.5)80
(62.5)
Medium ($5-50mil)17
(30.9)14
(36.8)9
(64.3)2
(20.0)3
(27.3)45
(35.2)
Large (>$50mil)0 0 0 1
(10.0)2
(18.2)3
(2.3)
Total 55 38 14 10 11 128
Note: Numbers in brackets are column percentages; Source: Survey Question # 4.

6
Most of the firms in the sample had been in business for 20 years or longer (Table 4). Only 10.5% of the respondents had been in business for 10 years or less. The youngestcooperative among the respondents was established in 1995, while the oldest one was establishedin 1882. Most of the older non-agricultural cooperatives were in the retail and service sector. For the entire sample, these respondents had been in business an average of almost 33 years. The fact that almost 90% of these cooperatives had been in the business for 10 years or longershows the stability of these cooperatives in today’s competitive world. (Another explanation forthe high percentage of respondents with 10 years or more operating history may be that the initialsample frame under-represented the newer start-up firms.)
Table 4. Length of Time in Business for Non-agricultural Cooperative Survey Respondents by Industry, 1997
Years in
business
Industry
TotalRetail Service Wholesale FIRE Misc.
0-106
(10.2)6
(10.0)1
(6.7)4
(30.8)0
17
11-2013
(22.0)16
(26.7)3
(20.0)2
(15.4)5
(33.3)
39
21-3020
(33.9)10
(16.7)4
(26.7)1
(7.7)4
(26.7) 39
>3020
(33.9)28
(46.7)7
(46.7)6
(46.2)6
(40.0)
6
Total 59 60 15 13 15 162
Note: Numbers in brackets are column percentages; Source: Survey Question # 1.
Type of Management
Most of the non-agricultural businesses in the sample (61%) were managed byprofessional managers (Table 5), while the rest were member-managed. While less than one-thirdof the retail cooperatives were member managed, the service sector cooperatives were equallydivided between member-managed firms and professionally managed firms.
In a related question, nearly all (96%) considered their cooperative business either a majorsuccess (82%) or a minor success (13.5%), while only 2.6% considered their cooperative businessa failure (Table 6). A chi-square test of significance revealed that there was a statisticallysignificant relationship (at the 5% level) between type of management and the degree of successexperienced by these non-agricultural cooperatives (i.e., professionally managed firms were moresuccessful).

7
Table 5. Type of Management Employed by Non-agricultural Cooperative Survey Respondentsby Industry, 1997
Type ofmanagement
Industry
TotalRetail Service Wholesale FIRE Misc.
Member17
(29.8)27
(50.9)3
(21.4)8
(61.5)4
(28.6)59
(39.1)
Professional(full time)
39(68.4)
23(43.4)
11(78.6)
4(30.8)
9(64.3)
86(57.0)
Professional(part time)
1(1.8)
3(5.7)
0 1(7.7)
1(7.1)
6(4.0)
Total 57 53 14 13 14 151
Note: Numbers in brackets are column percentages; Source: Survey Question # 6.
Table 6. Degrees of Success of Non-agricultural Cooperative Survey Respondents by Industry,1997
Degree of success
Industry
TotalRetail Service Wholesale FIRE Misc.
Major success44
(78.6)50
(86.2)10
(71.4)11
(84.6)13
(86.7)128
(82.1)
Minor success10
(17.9)5
(8.6)3
(21.4)2
(15.4)1
(6.7)21
(13.5)
Too early to tell1
(1.8)2
(3.4)0 0 0 3
Failure1
(1.8)1
(1.7)1
(7.1)0 1
(6.7)4
Total 56 58 14 13 15 156
Note: Numbers in brackets are column percentages; Source: Survey Question # 8.
8
Business as a Cooperative
Respondents were almost equally divided when asked whether they could have openedtheir business had it not been organized as a cooperative. Among those who responded to thisquestion, 44 % reported No, while almost 38% reported Yes, and the rest (18%) either did notrespond or did not know.
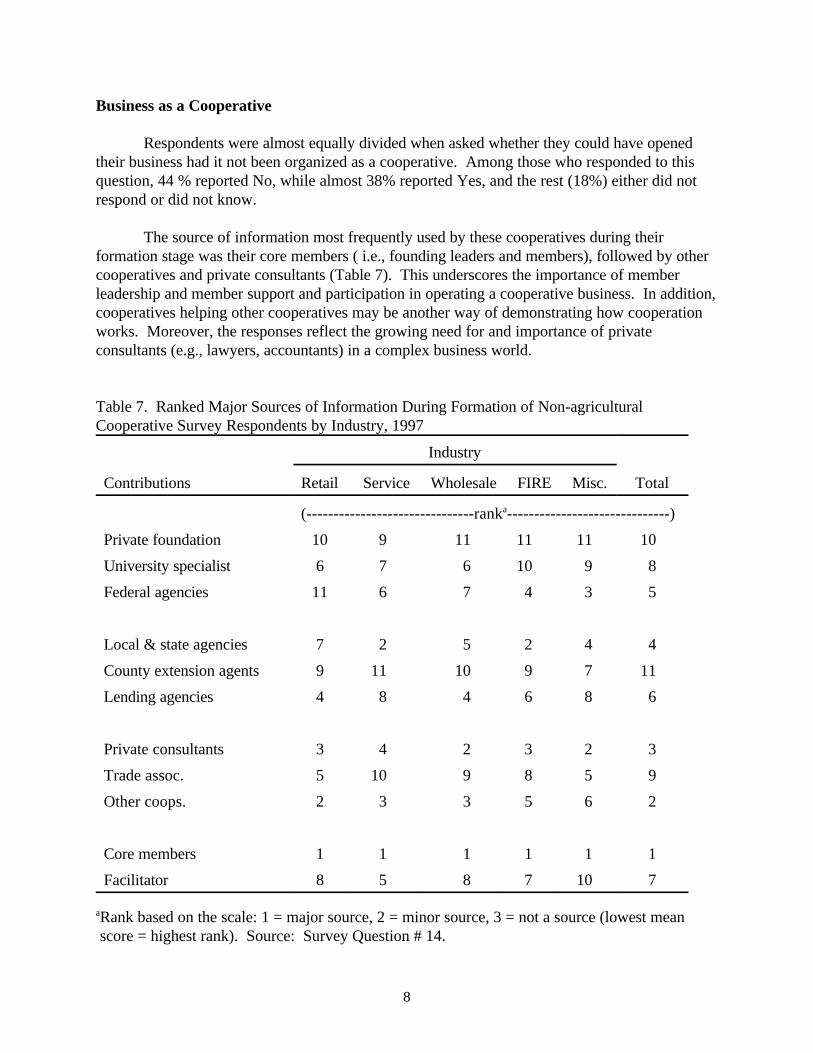
The source of information most frequently used by these cooperatives during theirformation stage was their core members ( i.e., founding leaders and members), followed by othercooperatives and private consultants (Table 7). This underscores the importance of memberleadership and member support and participation in operating a cooperative business. In addition,cooperatives helping other cooperatives may be another way of demonstrating how cooperationworks. Moreover, the responses reflect the growing need for and importance of privateconsultants (e.g., lawyers, accountants) in a complex business world.
Table 7. Ranked Major Sources of Information During Formation of Non-agriculturalCooperative Survey Respondents by Industry, 1997
Industry
Contributions Retail Service Wholesale FIRE Misc. Total
(-------------------------------ranka------------------------------)
Private foundation 10 9 11 11 11 10
University specialist 6 7 6 10 9 8
Federal agencies 11 6 7 4 3 5
Local & state agencies 7 2 5 2 4 4
County extension agents 9 11 10 9 7 11
Lending agencies 4 8 4 6 8 6
Private consultants 3 4 2 3 2 3
Trade assoc. 5 10 9 8 5 9
Other coops. 2 3 3 5 6 2
Core members 1 1 1 1 1 1
Facilitator 8 5 8 7 10 7 aRank based on the scale: 1 = major source, 2 = minor source, 3 = not a source (lowest mean score = highest rank). Source: Survey Question # 14.

9
The information sources that received low rankings included county extension agents(ranked 11th), private foundations (10th), trade associations (9th), and university specialists (8th). The low ranking received by county extension agents as information sources during formation ofthese non-agricultural cooperatives is not particularly surprising. Although the state agriculturalextension services have traditionally played a major role in development of agriculturalcooperatives, it is only in the last few years that some extension services have begun to expandtheir activities to include assistance to non-agricultural businesses. Similarly, university specialistsreceived relatively low rankings. While many universities have been attempting to expand theirrole in business assistance and related economic development activities (Leistritz and Hamm1994), most of this emphasis has occurred within the past 10 years, whereas only about 10percent of the responding co-ops were formed during this period. Similarly, although over 45%of the respondents were members of one or more trade associations, such as the NationalCooperative Business Organization, such trade associations played a minor role as the informationsource for the existing non-agricultural cooperatives. Given these findings, these organizations,which traditionally have been paying more attention to agricultural cooperatives or large non-agricultural cooperatives, may consider expanding their scope to include non-agriculturalcooperatives of all sizes.
Although conducting a formal feasibility study is generally considered very important forsuccess of any business venture, this survey of non-agricultural cooperatives revealed that morethan 45% of the respondents did not conduct any formal feasibility study. While only 12% ofthese respondents confirmed conducting such studies, almost 41% of them did not know whethersuch studies were conducted when these cooperatives were formed (most firms had been inbusiness for over 20 years). Among those cooperatives that did conduct the feasibility study as apart of their formation or establishment process, most were either in the retail sector or in theservice sector. A chi-square test of significance revealed that there was no statistically significantrelationship between the degree of success and whether a feasibility study was conducted by thesecooperatives. (However, the reader should note that (a) 41 percent of respondents did not knowwhether a feasibility study had been conducted and (b) the sample consisted of firms that were stilloperating -- other firms with ill-conceived business plans may have failed.)
In terms of their future plans, 45% of the respondents reported future plans to increasetheir product or service line, while 55% had no plans to change their product or service line. Regarding the existing competition in their major market or trade area, a majority of therespondents reported over 30 competitors on average in their market area, while 22% reported nocompetition at all. The most numerous competitors were faced by the wholesale sectorcooperatives – on average, they had 85 competitors in their market area. About 52% of theresponding cooperatives reported competition from other cooperatives in their market area.
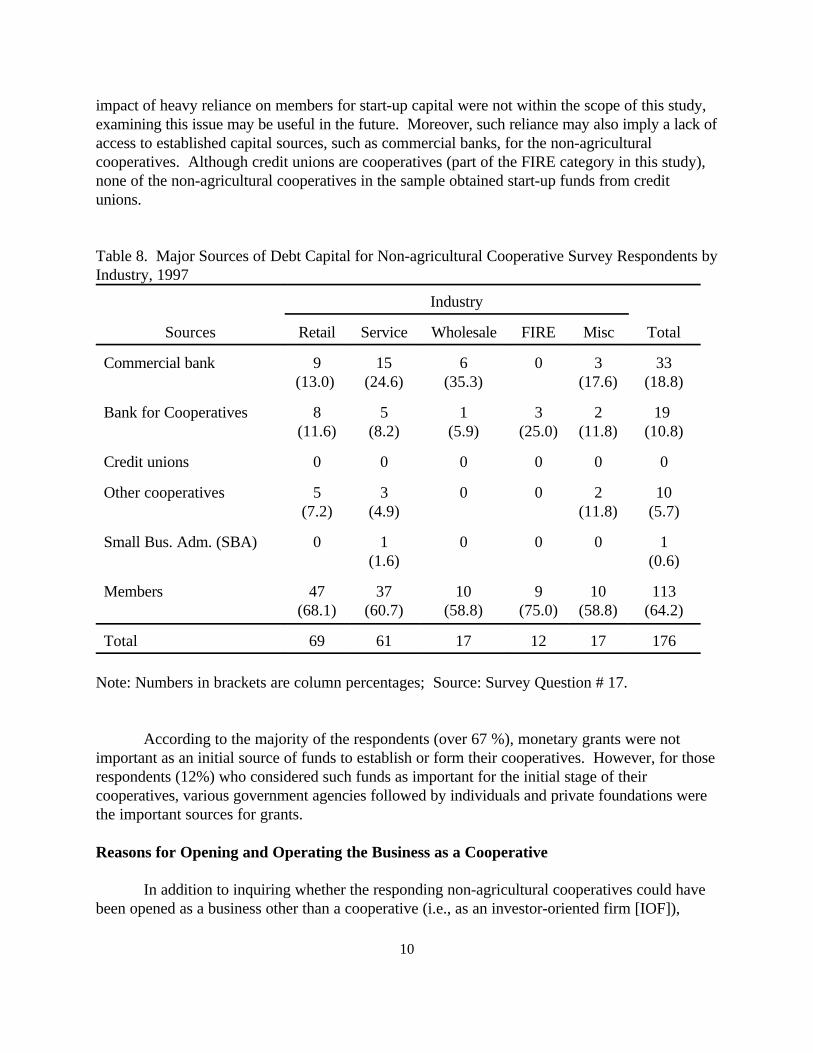
Regarding their start-up capital, almost 70% of the respondents identified their membersas a major source of start-up debt capital (Table 8). Commercial banks ranked second as a sourcefor start-up debt capital (for over 25%). Among minor sources, almost 12% of the respondentsused the Banks for Cooperatives as a source for debt capital. Although the reasons for and the
10
impact of heavy reliance on members for start-up capital were not within the scope of this study,examining this issue may be useful in the future. Moreover, such reliance may also imply a lack ofaccess to established capital sources, such as commercial banks, for the non-agriculturalcooperatives. Although credit unions are cooperatives (part of the FIRE category in this study), none of the non-agricultural cooperatives in the sample obtained start-up funds from creditunions.
Table 8. Major Sources of Debt Capital for Non-agricultural Cooperative Survey Respondents byIndustry, 1997
Sources
Industry
TotalRetail Service Wholesale FIRE Misc
Commercial bank 9(13.0)
15(24.6)
6(35.3)
0 3(17.6)
33(18.8)
Bank for Cooperatives 8(11.6)
5(8.2)
1(5.9)
3(25.0)
2(11.8)
19 (10.8)
Credit unions 0 0 0 0 0 0
Other cooperatives 5(7.2)
3(4.9)
0 0 2(11.8)
10(5.7)
Small Bus. Adm. (SBA) 0 1(1.6)
0 0 0 1(0.6)
Members 47(68.1)
37(60.7)
10(58.8)
9(75.0)
10(58.8)
113(64.2)
Total 69 61 17 12 17 176
Note: Numbers in brackets are column percentages; Source: Survey Question # 17.
According to the majority of the respondents (over 67 %), monetary grants were notimportant as an initial source of funds to establish or form their cooperatives. However, for those respondents (12%) who considered such funds as important for the initial stage of theircooperatives, various government agencies followed by individuals and private foundations werethe important sources for grants.
Reasons for Opening and Operating the Business as a Cooperative
In addition to inquiring whether the responding non-agricultural cooperatives could havebeen opened as a business other than a cooperative (i.e., as an investor-oriented firm [IOF]),

11
respondents also were asked to identify their reasons for opening the business as a cooperative. The reason for forming the cooperative that received the highest ranking overall was that it“allowed members to pool their resources.” The second most important reason for forming thesecooperatives was “prices of goods and services were too high,” followed by “goods and serviceswere not available” (ranked 3rd), or “goods and services were of not desired quality” (ranked 4th). Clearly the last three reasons are an indication of market failure, either due to market power ordue to the inability or lack of willingness of IOFs to provide necessary goods and services. Cooperative literature posits similar reasoning for formation and operation of agriculturalcooperatives (Schrader, 1989). Table 9 also reveals that these non-agricultural cooperativeswere not formed primarily to provide employment (ranked last), because it was easier to obtainfinancing, or to take advantage of technology. The latter may surprise many cooperativeeducators and practitioners, because there is a common perception among these groups that thecooperative approach (to pool individual resources) is necessary to take advantage of moderntechnology with large sunk costs.
Table 9. Ranked Importance of Factors in the Formation of Non-agricultural CooperativeSurvey Respondents by Industry, 1997
Industry
Reasons Retail Service Wholesale FIRE Misc. Total
(---------------------------ranka----------------------)
Goods and services lacked quality* 3 5 4 8 9 4Prices too high 4 2 3 2 3 2Unavailable* 2 7 2 3 1 3
New technology 11 10 12 13 10 11Provide employment 12 13 11 12 13 13Economic development* 8 12 9 4 4 9
Networking among members* 7 3 7 11 6 6Cooperative tradition* 6 6 5 9 7 7Pool resources 1 1 1 1 2 1
Reduced tax burden 10 8 7 5 8 8Easier financing* 13 11 10 6 11 12Prefer co-ops* 5 4 6 7 5 5
Vendors prefer co-ops 9 9 13 10 12 10
a Rank based on mean score for the scale: 1 = strongly agree, 2 = moderately agree, 3 = neutral, 4 = moderately disagree, 5 = strongly disagree. Source: Survey Question #12.
*Significant difference among groups based on Chi Square test with 10% level of significance and 4 degrees of freedom.
12
The reasons for forming cooperatives varied among different types of non-agriculturalcooperatives in the sample. While the principal reason for forming cooperatives for most typeswas “to allow members to pool their resources,” the second most important reason for both retailand wholesale cooperatives was “goods and services were not available.” The number two reasonfor both service sector cooperatives and FIRE sector cooperatives was “prices of goods andservices were too high.” While such market-related problems were ranked higher as reasons forforming cooperatives in the retail, service and wholesale sectors, one of the important reasons forforming such cooperatives in the FIRE sector (includes credit unions) and misc. sector (includes afew manufacturing and utility cooperatives) was to “foster economic development” (ranked 4th inboth sectors). This shows the social responsibility aspects of cooperatives which is a commonlyacknowledged attribute of cooperative businesses.
A series of chi-square tests were conducted to examine which reasons for formingcooperatives were common across different types (industrial sector) of non-agriculturalcooperatives. Based on test results, the following reasons for forming the cooperative werecommon in the sample: (i) prices of goods and services were too high, (ii) to take advantage ofnew technology, (iii) to provide employment, (iv) to allow members to pool their resources, (v) cooperatives have reduced tax burden, and (vi) vendors prefer dealing with co-op. Surprisingamong these common reasons for establishing cooperatives across the sample is that two of thesecommon reasons (i.e., #ii and iii) were ranked among the lowest overall as the reasons for formingcooperatives (Table 9).
Difficulties Faced by Non-agricultural Cooperatives during Formation
Starting a new business, whether the business will be a cooperative or not, is not easy. Incase of a cooperative, perhaps this task is more complicated because of their unique features suchas their methods of allocating net income, handling equity, and selecting board members. Findingout the problems faced by the non-agricultural cooperatives in the sample may be an effective wayto prepare cooperative entrepreneurs for potential problems they may face when they try to forma cooperative. The survey results show that raising equity was the most important problemoverall during the formation stage of these non-agricultural cooperatives (Table 10). These non-agricultural cooperatives also had problems raising debt-capital (ranked 2nd overall) anddeveloping a marketing plan (ranked 3rd overall). These are clearly serious roadblocks for anykind of business trying to establish itself and succeed. However, a sound marketing plan will, orat least should, make solving the capital problems easier. The insistence of bankers and marketdevelopers on a sound marketing plan reflects its importance. It was noted that, while therespondents knew what kind of product or service they wanted to provide (ranked as the least oftheir problems), they had more difficulty developing marketing (ranked 3rd) and business plans(ranked 5th). This is a common problem among entrepreneurs and underscores the need forbusiness oriented training and education for members.

13
Table 10. Ranked Importance of Difficulties Faced by Non-agricultural SurveyRespondents During Formation Stage by Industry, 1997
Industry
Difficulties Retail Service Wholesale FIRE Misc. Total
(------------------------ranka-----------------------------)
Finding members 15 14 6 6 13 14Finding mem. leaders* 11 11 11 4 9 11Acquire org. funds 3 4 10 13 11 6
Develop plan 5 6 5 9 5 5Develop mktg. plan* 6 3 4 5 6 3Raising equity* 2 1 1 1 2 1
Raising debt* 1 2 2 7 4 2Decidingproducts/services*
14 15 14 8 15 15
Finding mgr. 7 10 3 10 11 8
Finding consultants 12 13 12 14 8 13Finding location* 9 8 15 11 14 12Gov. agencies support 4 12 9 1 3 7
Assoc. support* 10 9 13 15 7 9Coop. knowledge* 13 7 8 12 10 10Coop. legal issues* 8 5 7 3 1 4
aRank based on mean score for the scale: 1 = very difficult, 2 = moderately difficult, 3 = not difficult. Source: Survey Question #20.
*Significant differences among groups based on Chi Square test with 10% level of significance.
Another important problem identified by the respondents was that they had problemsobtaining information on legal issues related to cooperatives. This problem is quite commonamong new entrepreneurs and may be more acute among cooperative entrepreneurs because ofunique challenges of forming cooperatives. In addition, information concerning the legal aspectsof forming cooperatives is not readily available even among attorneys (Cobia 1989). Further,from discussion with various cooperative entrepreneurs, it was observed that at the beginning,such entrepreneurs try to obtain information related to legal issues from free sources, such as therelevant department personnel in their state university. However, for various reasons, thesesources are not always equipped with resources to answer questions related to legal issues. Because initially most cooperative entrepreneurs are not able to (or not willing to) hire private

14
consultants, their success as entrepreneurs might be enhanced if the basic information related tolegal issues was easily available. Some other potential problems that a cooperative organizer mayface include finding members, member leaders, a good location, or qualified consultants, amongothers. Such problems did not pose a major difficulty to the non-agricultural cooperatives in thesample (Table 10).
A series of chi-square tests were conducted to examine which problems were commonacross different types (industries) of non-agricultural cooperatives during their formation stage(Table 10). Based on test results, the following problems were common in the non-agriculturalcooperatives: (i) finding member leaders, (ii) developing a marketing plan, (iii) raising equity, (iv)raising debt capital, (v) deciding what products/services to offer, (vi) finding a good location, (vii)support from trade associations, (viii) knowledge about cooperatives, and (ix) knowledge aboutlegal issues related to cooperatives. Four of the nine common problems above were ranked as thetop four difficulties faced by cooperative entrepreneurs during formation stage of theircooperatives (Table 10). For success of any cooperative development effort, due attention shouldbe paid to such common problems.
Current Difficulties of the Non-agricultural Cooperatives
Once a business is established, whether it is a cooperative or not, the task is to manage itin such a way that it becomes successful. In the survey, an attempt was made to identify theproblems currently faced by the non-agricultural cooperatives in the sample (Table 11). Competition in their major market or trade area was the most difficult factor of business for therespondents, followed closely by the difficulty associated with balancing the sometimes conflictinginterests of cooperative members. While the first difficulty is generally common to all businesses,the second is very specific to cooperatives. For example, in today’s competitive market, mostcooperatives face the often conflicting choices of running the cooperative like an IOF to maximizereturns, or be more member service oriented (Cobia and Dunn 1998). These two often conflictingchoices make operating today’s cooperative business more difficult.
Among other problems currently faced by the non-agricultural cooperatives, the followingproblems were highly ranked, and indicate changing political and market environments:
! support from government agencies – for instance, budget cuts at both federal and statelevels are affecting the ability of government agencies to provide business grants orloans (e.g., Rural Business and Cooperative Development Services of the UnitedStates Department of Agriculture [RBCDS/USDA], or the Small BusinessAdministration [SBA]);
! maintaining marketing plan – a common problem for all kinds of businesses; ! identifying and selecting board of directors – a common problem faced by
cooperatives, according to many cooperative practitioners today;! maintaining cash flow – again, a common problem faced by all types of businesses;
and identifying cooperative leaders – for success of any cooperative, there is a need forleaders with business knowledge and foresight as well as a cooperative-orientedapproach toward business.

15
As persistence of some of these problems may result in poor performance of the cooperatives,finding solutions to these problems should be given a high priority.
Table 11. Ranked Importance of Current or Existing Problems of Non-agriculturalCooperative Survey Respondents by Industry, 1997
Industry
Current/existing difficulties
Retail Service Wholesale FIRE Misc. Total
(------------------------ranka---------------------------)
Maintaining mktg. plan 10 8 4 6 9 9Maintaining equity 4 5 2 8 5 4Maintaining debt 7 9 9 9 10 10
Maintaining supplies* 11 6 10 13 13 11Maintaining cash flow* 15 14 14 14 14 14Maintaining mem. loyalty 5 3 11 10 6 6
Attracting & keeping mgrs. 8 10 5 7 7 8Identifying coop. leaders 13 13 8 11 8 13Selecting directors* 9 7 7 3 11 7
Gov. agencies support 3 11 6 4 12 5Trade assoc. support 2 4 12 2 1 3Crime* 12 12 13 12 4 12
Competition 1 1 1 1 3 1Balancing member interests 4 2 3 5 2 2
a Based on mean score for the scale: 1 = very difficult, 2 = moderately difficult, 3 = not difficult. Source: Survey Question #21.*Significant differences among groups based on Chi Square test with 10% level of significance and 4 degrees of freedom.
As before, a series of chi-square tests were conducted to examine which current problemswere common across different types of non-agricultural cooperatives. Based on test results, allpotential current problems listed in Table 11 except the following few were common among thenon-agricultural cooperatives in the sample: reliable source of supplies and services, maintainingcash flow, identifying and selecting board of directors, and crime in the neighborhood. Thus,regardless of their types, these non-agricultural cooperatives commonly faced problems such asmaintaining a consistent customer base, maintaining equity and debt, maintaining member loyalty,and attracting and keeping managers, among others. Some of these problems are also common toIOFs.

16
Strengths and Weaknesses of Non-agricultural Cooperatives
Non-agricultural cooperatives participating in the survey were asked to identify theirstrengths and weaknesses as a cooperative business entity. Respondents were asked to identifywhether certain aspects of the cooperative business, such as operation or members were astrength or weakness in a scale of 1 through 5, where 1 implies “major strength,” and 5 impliesmajor weakness.” Results show that a cooperative’s role as the producer or provider of anessential product or service was its most important strength, while the issue of compensation ofthe cooperative board of directors was its major weakness (Table 12). These non-agriculturalcooperatives also identified the following aspects as major strengths: customer relations, workforce quality, cooperative as the producer or provider of unique product or service, trust amongmembers, member retention, management-board relations, and management quality. Among theattributes receiving the lowest ratings were recruiting board members, marketing, availability oflong-term debt, identification and management of risk, equity redemption, planning for the future,and member education or training.
The relationship between the strength and weakness aspects of these non-agriculturalcooperatives and the types of cooperatives in the sample, and their degrees of success wasexamined. A chi-square analysis of the relationship between the types of cooperatives and theirstrength and weakness aspects revealed that most strength and weakness aspects of thesecooperatives (23 out of the 25) were independent of their types; only the “managing cash flow” and the “recruiting board members” aspects were dependent on the types of cooperatives. Theproblems of managing cash flow were most often reported as a major concern by respondents inthe FIRE and wholesale sectors. Recruiting board members was regarded as a moderate problemby firms in the misc. and FIRE sectors, but was rated quite low by respondents in other sectors.This implies that other than these two, the strength and weakness characteristics were common toall types of cooperatives in the sample.
A statistically significant relationship exists between the degrees of success among theindustry groups and the following strength and weakness aspects of these non-agriculturalcooperatives: producer of a unique product or service, quality of management, customerrelations, balancing member interests, trust among members, member retention, and tenure of theboard of directors. Conversely, the degrees of success of these non-agricultural cooperativeswere independent of the remaining 18 strength and weakness factors.
Contributions of the Non-agricultural Cooperatives
In corporate America, names such as Farmland, Sunkist, or Ocean Spray in the foodsector, and True Value, ACE Hardware, or the Associated Press in the non-food sector aresynonymous with success (and quality). These businesses are excellent examples of the role andcontributions of cooperative businesses to the U.S. economy. These organizations are examples ofcooperation among entrepreneurs, working together collaboratively for mutual benefit. Therespondents in this study were asked to agree or disagree with seven selected potentialcontributions of their cooperatives. Most of these selected contributions dealt with cooperativegoals (e.g., “reduce members’ cost of doing business”) or the roles played by cooperatives in

17
Table 12. Ranked Strengths and Weaknesses of Non-agricultural Cooperatives as Reported by Survey Respondents by Industry, 1997
IndustryAttributes Retail Service Wholesale FIRE Misc. Total
(----------------------ranka------------------------)
Regarding Operations: Provider of unique prod./service 2 4 7 18 5 4Provider of essential prod./service 4 1 1 8 3 1Controlling operating cost 11 9 14 7 7 10
Management quality 8 11 2 2 2 8Work force quality 5 2 4 6 1 3Location 10 14 11 9 18 12
Marketing 17 21 19 25 25 23Planning 18 15 16 19 22 19Risk mgmt. 23 20 18 11 15 21
Customer relations 1 3 8 10 9 2Managing cash flow* 9 13 3 1 11 9
Regarding Capitalization: Availability of long-term debt 22 24 12 24 8 22
Maintain equity 16 19 10 14 12 15Equity redemption 19 22 23 17 19 20
Regarding members: Member educ. 20 10 24 21 20 18Non-member business 14 18 20 22 23 17Balancing member interests 13 12 15 20 21 13
Communication with members 12 6 10 12 17 11Trust among members 3 5 5 3 13 5Members retention 6 7 13 4 6 6
Regarding the Co-op Board: Recruiting members* 24 23 22 15 14 24Relations with mgmt. 7 8 6 5 4 7Business experience 21 16 17 16 10 16
Tenure 15 17 21 13 16 14Compensation 25 25 25 23 24 25aBased on mean score for the scale: 1 = major strength, 2 = minor strength, 3 = neutral, 4 = Minor weakness, 5 = major weakness. Source: Survey Question #10.*Significant difference based on Chi Square test with 10% level of significance and 4 degrees of freedom.

18
many communities (e.g., “agents for economic development”). Results, presented in Table 13, reveal that most respondents in this study agreed that cooperatives reduce members’ cost of doingbusiness (ranked 1st), provide unavailable goods and services (2nd), and help members remainindependent (3rd). Not surprisingly, survey respondents’ selection of these contributions bycooperatives correspond closely to some of the rationales behind forming cooperatives (Table 9). Among other potential contributions listed in Table 13, most respondents neither agreed nordisagreed with the notion that cooperatives were employment providers (ranked 7th). Amongdifferent types of cooperatives in the sample, retail cooperatives ranked their contribution ofproviding unavailable goods and services as the most important of all (ranked 1st), while service,wholesale, FIRE, and misc. types of cooperatives considered cooperatives’ ability to reducemembers’ cost of doing business as the most important contribution of cooperatives.
Table 13. Ranked Importance of Contributions by Cooperatives as Reported by Non-agricultural Survey Respondents by Industry, 1997
Industry
Contributions Retail Service Wholesale FIRE Misc. Total
(-------------------------ranka----------------------------)
Reduce costs 2 1 1 1 1 1Provide unavailable goods/service 1 3 3 6 3 2Provide employment 7 6 4 7 5 7
Enhance community image 3 5 6 3 6 4Help members remain independent 4 2 2 2 2 3Promote democracy 5 4 5 4 4 5
Agents for econ. develop. 6 7 7 5 7 6
a Rank based on mean score for the scale: 1 = strongly agree, 2 = moderately agree, 3 = neutral, 4 = moderately disagree, 5 = strongly disagree. Source: Survey Question #13.
Services for Success
From the information presented earlier, it is clear that cooperative entrepreneurs face avariety of hurdles that may considerably hinder cooperative development and success. One of thestrategies for tackling problems faced by cooperatives (or cooperative entrepreneurs) is todevelop programs and services which cater to the needs of these cooperatives at various stages ofdevelopment, such as establishment and management of cooperatives. Respondents were askedto identify the importance of a few selected services that cooperatives may need to succeed (Table14).
19
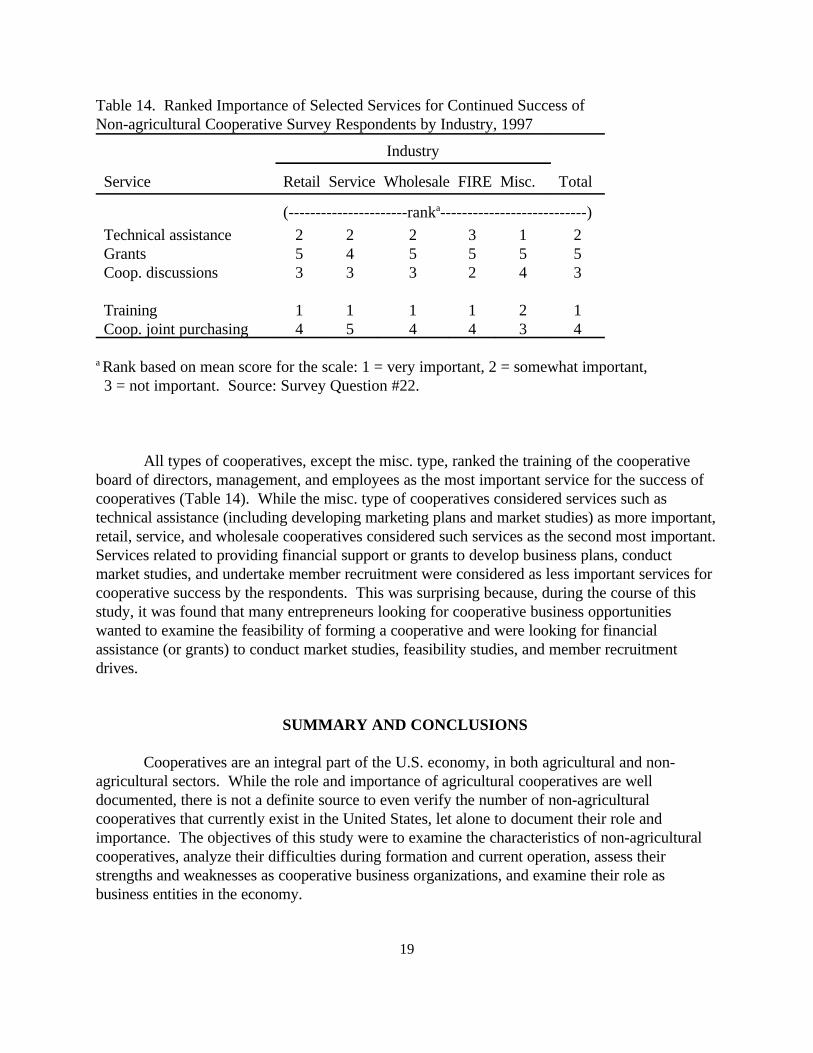
Table 14. Ranked Importance of Selected Services for Continued Success of Non-agricultural Cooperative Survey Respondents by Industry, 1997
Industry
Service Retail Service Wholesale FIRE Misc. Total
(----------------------ranka---------------------------)
Technical assistance 2 2 2 3 1 2Grants 5 4 5 5 5 5Coop. discussions 3 3 3 2 4 3
Training 1 1 1 1 2 1Coop. joint purchasing 4 5 4 4 3 4
a Rank based on mean score for the scale: 1 = very important, 2 = somewhat important, 3 = not important. Source: Survey Question #22.
All types of cooperatives, except the misc. type, ranked the training of the cooperativeboard of directors, management, and employees as the most important service for the success ofcooperatives (Table 14). While the misc. type of cooperatives considered services such astechnical assistance (including developing marketing plans and market studies) as more important,retail, service, and wholesale cooperatives considered such services as the second most important. Services related to providing financial support or grants to develop business plans, conductmarket studies, and undertake member recruitment were considered as less important services forcooperative success by the respondents. This was surprising because, during the course of thisstudy, it was found that many entrepreneurs looking for cooperative business opportunitieswanted to examine the feasibility of forming a cooperative and were looking for financialassistance (or grants) to conduct market studies, feasibility studies, and member recruitmentdrives.
SUMMARY AND CONCLUSIONS
Cooperatives are an integral part of the U.S. economy, in both agricultural and non-agricultural sectors. While the role and importance of agricultural cooperatives are welldocumented, there is not a definite source to even verify the number of non-agriculturalcooperatives that currently exist in the United States, let alone to document their role andimportance. The objectives of this study were to examine the characteristics of non-agriculturalcooperatives, analyze their difficulties during formation and current operation, assess theirstrengths and weaknesses as cooperative business organizations, and examine their role asbusiness entities in the economy.
20
The primary tool of the study was a survey conducted in early 1997 among non-agricultural cooperatives in the United States. A stratified sample was drawn from a data base ofnon-agricultural cooperatives created for this study from a national business directory (i.e.,American Business Yellow Pages). Usable surveys from 162 cooperatives (35% of the sample)made up the data base for the study. The respondents represented 40 states. The states with thelargest numbers of respondents were Wisconsin and Mississippi.
When asked whether they could have opened their business had it not been organized as acooperative, the respondents were about equally divided between yes and no. This study alsounderscores the importance of member training and education, because during the formation stageof most of these non-agricultural cooperatives, their core members were their most importantsource of information. Members also played an important role in capitalizing these non-agricultural cooperatives; almost 70% raised their start-up debt capital from their members,rather than borrowing from sources such as commercial banks. It was also found that monetarygrants were not important as an initial source of funds to start their cooperative business.
Most of the non-agricultural cooperative respondents agreed that they opened theirbusiness as a cooperative to pool the resources of their individual members, reflecting a longstanding reason for forming cooperatives. Another important reason for forming cooperatives,according to the respondents, was to provide necessary goods and services at a reduced cost,because prices of goods and services were too high prior to the cooperative’s entry. Thus,market failure combined with members' desire and ability to pool their resources through acooperative form of business resulted in the formation of most of the non-agriculturalcooperatives in this study.
Although some of these non-agricultural cooperatives had business entities, governmentagencies, or non-profit organizations as their members, the predominant type of membershipamong these cooperatives was individual memberships. Among the respondents, only 35 (22%)had more than one type of members. Another important characteristic of these cooperatives wasthat over 90% of them had an open membership policy, unlike many ‘new generation’ agriculturalcooperatives. It was also found that the degree of success of these cooperatives was independentof their open- or closed- membership policy.
Most of the respondents in this study (over 73% ) were either consumer cooperatives (e.g., food stores, clothing stores) or service cooperatives (e.g., child care, residential care, rentalservices), which may reflect the proportionate national distribution of such businesses in theeconomy. The rest were almost equally divided among the following sectors: wholesale trade,finance, insurance and real estate sector, and a miscellaneous sector containing somemanufacturing and transportation cooperatives.
In the sample of 150 cooperatives, serving 322,908 members in 1996, the service sectorcooperatives had the highest number of members, followed by the retail sector cooperatives in adistant second place. The amount of business to non-members among these respondents was

21
substantial, slightly over 24% of the 1996 revenue for the respondents. The retail sectorcooperatives had the highest amount of non-member business, averaging at 35.6% of revenue,followed closely by wholesale cooperatives (31.5%). It may be useful to study how thesecooperatives manage patronage refunds considering such a high volume of non-member business.
In terms of their business volume, 128 respondents had almost one billion dollars inrevenue in 1996. Retail sector cooperatives earned the most (32.2% or over $315 million), whilethe service sector cooperatives were second in revenue in 1996 (28.3% or almost $277 billion). The payroll of 117 responding cooperatives was almost $166 million in 1996; the service sectorcooperatives had the largest payroll, over $51 million. The non-agricultural cooperatives from 40states included in this study show the substantial economic contribution made by suchcooperatives in the United States.
The non-agricultural cooperatives also faced stiff competition in their trade or marketarea. For instance, the average number of competitors for these non-agricultural cooperatives intheir market area was 33, and the most numerous competitors were faced by the wholesalecooperatives with an average of 85 competitors. In terms of their length of time in business, theaverage cooperative had been operating successfully since 1964 (or for about 33 years), the oldestsince 1882 and the youngest since 1995. This kind of longevity in today's world of businessshows the business acumen of their leaders and management. Among the different types ofcooperatives, wholesale cooperatives were in business the longest time (44 years on average).
Most of the non-agricultural cooperatives taking part in this survey (over 62%) were smallbusinesses earning less than $5 million a year. Only three respondents reported revenues over $50million in 1996. Regardless of their size, a majority (almost 61%) of the non-agriculturalcooperatives were managed by professional managers.
The non-agricultural cooperative respondents faced various difficulties during theirformation stage as well as during their current operations. It was found that raising equity wasthe most difficult problem faced by these cooperatives during their formation stage. Notsurprisingly, according to these respondents, the second most difficult problem they faced duringthe formation stage was raising debt capital, which becomes more difficult if an organization hasproblems raising equity. In this regard, agricultural cooperatives may have less problem becausetraditional financial institutions are familiar with agricultural cooperatives. Moreover, there arespecialized financial institutions (e.g., CoBank) that finance agricultural cooperatives only. Inorder to facilitate development of non-agricultural cooperatives, cooperative entrepreneurs shouldhave an easier access to financial resources as well as technical expertise. For those cooperativeentrepreneurs who considered monetary grants as an important ingredient in establishing theircooperative, they mostly obtained their grants from various government agencies. Consideringbudget cuts at both federal and state levels, cooperation among cooperatives, which is currentlylacking according to the findings, may facilitate the cooperative development process further. Forexample, existing and successful cooperatives could provide technical assistance to cooperative
22
entrepreneurs or could refer them to qualified attorneys and to consultants able to conduct marketand feasibility studies or develop business plans.
Among other important problems faced by these non-agricultural cooperative respondentsduring their formation stage was developing suitable marketing and business plans and obtaininginformation on legal issues related to cooperatives. Providing such information at the leastpossible cost (or free of cost) to entrepreneurs interested in opening a cooperative form ofbusiness may reduce their burden substantially. Various state land-grant universities incoordination with relevant government agencies may be able to meet such needs.
Although on average the cooperatives represented in this study had been in business forover 30 years, they still face operating difficulties. These non-agricultural cooperativerespondents had problems maintaining their marketing plan, identifying and selecting a board ofdirectors (in principle, such members must come from the cooperative membership only),maintaining and managing cash flow, and identifying cooperative leaders. While some of theseproblems, such as maintaining or managing cash flow, are common to all kinds of business,cooperatives have some special problems, such as identifying and selecting a board of directors. A common dilemma faced by today’s cooperatives is how to form a board of directors that iscapable of running a business in today’s competitive world without compromising cooperativeprinciples, policies, or laws governing the cooperative organization. This is where training andeducation for cooperative board members, management, and employees become very important. Perhaps not surprisingly, such training and education were considered as the most important andnecessary services for success of cooperatives by the respondents in this study.
The non-agricultural cooperatives also identified several aspects of their businesses astheir strengths. Most respondents identified customer relations, work force quality, beingprovider of a unique product or service, trust among members, low member turn over, board-management relations, and management quality as major strengths. These non-agriculturalcooperatives had also clearly identified their role as cooperatives, (e.g., they were able to reducemembers’ cost of doing business, or they were filling an important void by providing unavailablegoods and services, or they were able to help members remain independent, among others). Among the weaknesses identified by the non-agricultural cooperative respondents, their ability torecruit board members, marketing their product or service, and availability of long-term debttopped the list. As mentioned before, while some of these weaknesses are specific tocooperatives, others are common to all types of businesses.
It is apparent that these non-agricultural cooperatives possessed some important factors oringredients necessary for success in business as their strengths (e.g., good management quality).For most of the respondents, these factors were their strength. Moreover, these respondents wereable to clearly identify their goals and their contributions as cooperatives. However for theirsuccess, like any other business, these cooperatives will have to continually adjust to the dynamicbusiness environment, exploiting their strengths and minimizing their weaknesses. To be able toachieve such a balance, non-agricultural cooperatives will need cooperative leaders with
23
foresight, who understand the business world as well as the cooperative culture, who will be ableto strike a balance between the interest of the members as well as that of the board of directorsand/or management, and who will be able to build on the strengths of the cooperativeorganization. Not surprisingly, finding such leaders was identified as one of the major problemsby the non-agricultural cooperatives in this study. Perhaps the old adage 'where there is a will,there is a way,' sums up the tasks ahead for these non-agricultural cooperatives. As for thepotential cooperative entrepreneurs, they should try to find ways to overcome and/or avoiddifficulties faced by these non-agricultural cooperatives during their formation and current stagesof operation.
Finally, this study has shown that non-agricultural cooperatives have been successfullycatering to the needs of both rural and urban areas, providing necessary goods and servicesranging from daily groceries to hospital care, along with much needed employment. Although notmuch was known about these silent players in the U.S. economy, this study has shown thepotential of the cooperative approach and difficulties and prospects associated with it in thebusiness world.
This study has also showed that for their continued success, these cooperatives willrequire external facilitation and assistance to overcome their organizational and managementproblems. This is where various public institutions, such as government agencies and land-grantinstitutions, which have been paying more attention to the agricultural sector and agriculturalcooperatives, can make substantial contributions toward non-agricultural cooperativedevelopment efforts. Such public institutions may be able to allocate some of their resources tomeet the needs of the non-agricultural cooperatives in the form of training, education, consultingservices, etc. and help these cooperatives overcome their difficulties at various stages of their lifecycles.

24
REFERENCES
Ayres, Janet, Larry Leistritz, and Kenneth Stone. 1992. “Rural Retail Business Survival:Implications for Community Developers.” Journal of the Community DevelopmentSociety 23 (2): 11-21.
Bhuyan, S. 1996. “Potential applications of Shared-services Cooperatives in North Dakota.” Ag.Econ. Misc. Report 178, Dept. of Agricultural Economics, North Dakota StateUniversity, Fargo, ND.
Cobia, David W., ed. 1989. Cooperatives in Agriculture. Englewood Cliffs, NJ: Prentice Hall.
Cobia, David W., and John Dunn. 1998. Cooperative Development in Rural Areas. Washington,DC: USDA, Cooperative Services (forthcoming).
Leistritz, F. Larry, Holly E. Bastow-Shoop, and Brenda L. Ekstrom. 1987. “How SmallBusinesses in North Dakota Towns Adjust to Regional Economic Decline.” Small Town17 (6): 4-13.
Leistritz, F. Larry, and Rita R. Hamm. 1994. Rural Economic Development, 1975-1993: AnAnnotated Bibliography. Westport, CT: Greenwood Press.
Nadeau, E. G., and D. J. Thompson. 1996. Cooperation Works! Rochester, MN: Lone Oak
Press, 1996.
Royer, J. S., and S. Bhuyan. 1994. “Market incentives for cooperative forward integration intoprocessing activities.” in R. W. Cotterill (ed.) Competitive Strategy Analysis forAgricultural Marketing Cooperatives. pp. 35-57. Boulder, CO: Westview Press.
Schrader, L.F. 1989. “Economic justification.” in D. W. Cobia (ed.) Cooperatives inAgriculture, pp. 121-136. Englewood Cliffs, NJ: Prentice Hall.

Appendix A
COOPERATIVE SURVEY

26
SURVEY ID - -
COOPERATIVE SURVEY
This survey is an attempt to identify solutions to problems and difficulties faced by yourcooperative and how such problems were overcome. Your participation is completelyvoluntary. Your responses are very important to us and will be handled with strict confidence.
If you have any question, please contact Professor David Cobia at (701) 231-7446 or Dr. SanjibBhuyan at (701) 231-9591. Thanks for completing this survey. Your cooperation is appreciated.
About the Cooperative. This set of questions pertains to your business operation.
1. In what year did the cooperative begin its operation?
2. What among the following best describe the cooperative’s membership? (Please record theapproximate number of membership by type)a. Individuals b. Business entities c. Government/public agencies d. Non-profit organizations e. Other (Please specify)
3. Are you accepting new members? Yes No
4. Approximate size of the cooperative in 1996.a Sales or revenue $ b. Payroll (wages and salaries) $
5. Percent of business/sales to non-members %
6. How is the cooperative managed? (Please check one)a. Member managed b. Professional management (full-time) c. Professional management (part-time) d. Other (Please specify)
7. Do you plan a major change in your product/service line in the next five years?Increase Decrease No Change

27
8. To what extent do you consider the co-op venture a success? (Please check one)a. A major success b. A minor success c. Not successful d. Too early to tell
9. Regarding your competition in your major market/trade area:a. about how many other companies compete with your cooperative? b. how many are cooperatives?
10. What are your cooperative’s strengths and weaknesses? (Please circle the appropriatevalue.)
Factors Majorstrength
Minorstrength
Neutral Minorweakness
Majorweakness
Regarding operations:-
Producer or provider of a uniqueproduct or service 1 2 3 4 5
Producer or provider of an essentialproduct or service
1 2 3 4 5
Managing/controlling operating cost 1 2 3 4 5
Management quality 1 2 3 4 5
Work force quality 1 2 3 4 5
Location 1 2 3 4 5
Marketing 1 2 3 4 5
Planning for the future 1 2 3 4 5
Identification and management of risk 1 2 3 4 5
Customer relations 1 2 3 4 5
Managing cash flow 1 2 3 4 5
Regarding capitalization:-
Availability of long-term debt 1 2 3 4 5
Maintaining equity 1 2 3 4 5
Equity redemption 1 2 3 4 5

28
Regarding members:-
Member education/training 1 2 3 4 5
Non-member business 1 2 3 4 5
Balancing interests of members 1 2 3 4 5
Communication between the co-opand its members
1 2 3 4 5
Trust among members 1 2 3 4 5
Member retention 1 2 3 4 5
Regarding the Co-op Board:-
Recruiting board members 1 2 3 4 5
Management-board relations 1 2 3 4 5
Business experience of the board 1 2 3 4 5
Tenure of the board 1 2 3 4 5
Compensation of the board 1 2 3 4 5
Reasons to Open the Business as a Cooperative. Why is this business operating as acooperative rather than another business form?
11. Could owners have opened this or similar business had it NOT been organized as a co-op?Yes No Don’t know
If YES, please explain why
12. How important were the following factors in the formation of your cooperative? (Pleasecircle the appropriate value.)
Cooperative was formed because.... Stronglyagree
Moderatelyagree
Neutral Moderatelydisagree
Stronglydisagree
Goods and services were not ofdesired quality
1 2 3 4 5
Prices of goods and services weretoo high
1 2 3 4 5
Goods and services were notavailable
1 2 3 4 5

Cooperative was formed because.... Stronglyagree
Moderatelyagree
Neutral Moderatelydisagree
Stronglydisagree
29
To take advantage of new technology 1 2 3 4 5
To provide employment 1 2 3 4 5
To foster economic development 1 2 3 4 5
To increase networking amongmembers
1 2 3 4 5
To continue the cooperative tradition 1 2 3 4 5
To allow members to pool their resources
1 2 3 4 5
Co-ops have reduced tax burden 1 2 3 4 5
Easier to obtain financing 1 2 3 4 5
Members prefer dealing with co-op 1 2 3 4 5
Vendors prefer dealing with co-op 1 2 3 4 5
Other (please specify)
1 2 3 4 5
13. Please rate the following contributions of your cooperative. (Please circle theappropriate value.)
This co-op contributed in followingways....
Stronglyagree
Moderatelyagree
Neutral Moderatelydisagree
Stronglydisagree
Reduce members’ cost of doingbusiness
1 2 3 4 5
Provide unavailable goods andservices
1 2 3 4 5
Provide employment 1 2 3 4 5
Enhance image of the community 1 2 3 4 5
Help members remain independent 1 2 3 4 5
Promote democracy 1 2 3 4 5
Agents for economic development 1 2 3 4 5
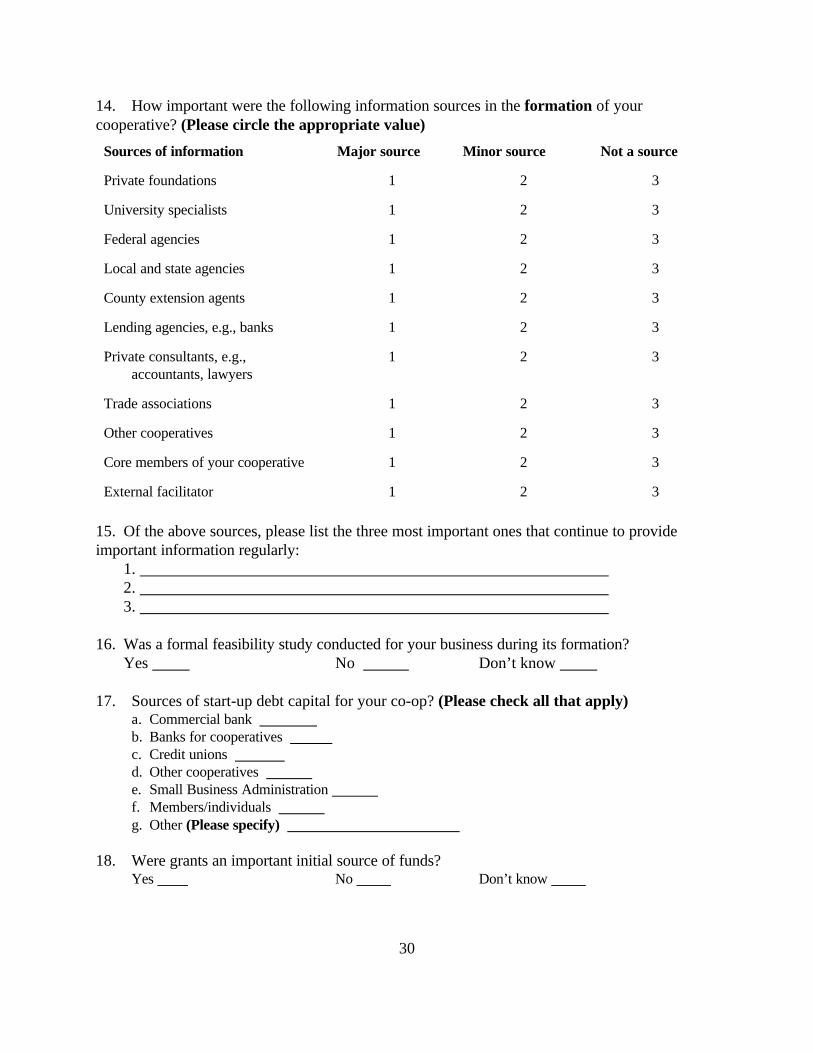
30
14. How important were the following information sources in the formation of yourcooperative? (Please circle the appropriate value)
Sources of information Major source Minor source Not a source
Private foundations 1 2 3
University specialists 1 2 3
Federal agencies 1 2 3
Local and state agencies 1 2 3
County extension agents 1 2 3
Lending agencies, e.g., banks 1 2 3
Private consultants, e.g.,accountants, lawyers
1 2 3
Trade associations 1 2 3
Other cooperatives 1 2 3
Core members of your cooperative 1 2 3
External facilitator 1 2 3
15. Of the above sources, please list the three most important ones that continue to provideimportant information regularly:
1. 2. 3.
16. Was a formal feasibility study conducted for your business during its formation?Yes No Don’t know
17. Sources of start-up debt capital for your co-op? (Please check all that apply)a. Commercial bank b. Banks for cooperatives c. Credit unions d. Other cooperatives e. Small Business Administration f. Members/individuals
g. Other (Please specify)
18. Were grants an important initial source of funds?Yes No Don’t know

31
19. If YES, sources of grant or donation. (Please check all that apply)a. Private foundations b. Government agencies c. Individuals d. Other cooperatives e. Others (please specify)
Problems faced by the cooperative.
20. How difficult were the following factors during formation of the cooperative? (Pleasecircle the appropriate value)
Factors Verydifficult
Moderatelydifficult
Notdifficult
Finding members 1 2 3
Finding member leaders 1 2 3
Acquiring funds for feasibility study,business plan, etc.
1 2 3
Developing business plan 1 2 3
Developing marketing plan 1 2 3
Raising equity 1 2 3
Raising debt capital 1 2 3
Deciding what products/services to offer 1 2 3
Finding professional manager 1 2 3
Finding qualified consultants, e.g.,accountants, attorneys, etc.
1 2 3
Finding good location 1 2 3
Support from government agencies 1 2 3
Support from trade associations 1 2 3
Knowledge about co-ops, e.g., what is aco-op, how it works, etc.
1 2 3
Knowledge about legal issues related toco-ops
1 2 3
Other (please specify)
1 2 3

32
21. What kind of difficulties/problems this cooperative is currently facing? (Please circle theappropriate value)
Factors Verydifficult
Moderatelydifficult
Notdifficult
Maintaining:consistent customer base 1 2 3
marketing plan 1 2 3
equity 1 2 3
debt 1 2 3
reliable source of supplies andservices
1 2 3
cash flow 1 2 3
member loyalty 1 2 3
Attracting and keeping managers 1 2 3
Identifying cooperative leaders 1 2 3
Identifying/selecting directors 1 2 3
Support from government agencies 1 2 3
Support from trade associations 1 2 3
Crime in the neighborhood 1 2 3
Competition in the major market/tradearea
1 2 3
Balancing the interests of members 1 2 3
Other (please specify)
1 2 3

33
22. How important are the following services for continued success of cooperatives? (Pleasecircle the appropriate value)
Services Veryimportant
Somewhatimportant
Notimportant
Technical assistance, such as developingbusiness plan, market study, etc.
1 2 3
Financial support or grants to conductbusiness plan, market study, memberrecruitment drive, etc.
1 2 3
Discussions among cooperatives regardingtheir problems and prospects
1 2 3
Training of board, management, andemployees
1 2 3
Cooperatives jointly purchasing goods andservices
1 2 3
Other (please specify)
1 2 3
23. Is your business a member of any state/national cooperative organization (e.g., NCBA)?Yes No Don’t know
If YES, please name three such principal organizations1. 2. 3.
24. Additional comments:
25. Respondent’s position/job title in the cooperative
26. Would you like to receive a copy of the summary of this survey?Yes No
Thank you for completing this survey. Please return it in the accompanying envelope.

Appendix B
APPENDIX TABLES

35
Appendix Table B.1. Geographic Distribution of Non-agricultural Cooperative Survey Respondents by Industry, 1997
State
Industry
State
Industry
TotalRetail Service Wholesale FIRE Misc. Retail Service Wholesale FIRE Misc.
Alabama 1 1(0.6%) Nevada 1 1(0.6%)
Alaska 1 1 2(1.2%) N.Hampshire
3 1 4(2.5%)
Arizona 2 2(1.2%) New Jersey 1 1 2(1.2%)
Arkansas 1 1(0.6%) New Mexico 1 3 4(2.5%)
California 3 3 1 1 8(4.9%) New York 1 1(0.6%)
Colorado 3 1 4(2.5%) No. Carolina 1 1 2(1.2%)
Georgia 1 2 3(1.9%) NorthDakota
1 1(0.6%)
Hawaii 1 1 2(1.2%) Ohio 2 2 4(2.5%)
Illinois 3 1 4(2.5%) Oklahoma 1 4 5(3.1%)
Iowa 2 2 1 1 6(3.7%) Oregon 1 3 1 5(3.1%)
Kansas 2 2(1.2%) Pennsylvania 2 2 1 1 6(3.7%)
Kentucky 1 1 1 1 4(2.5%) Rhode Island 1 1(0.6%)
Maryland 5 3 8(4.9%) So. Carolina 1 1(0.6%)
Mass. 1 1(0.6%) Tennesse 1 1 2(1.2%)
Michigan 1 1(0.6%) Texas 1 1(0.6)
Minnesota 5 3 1 1 1 11(6.8%) Utah 1 3 1 5(3.1%)
Mississippi 10 5 2 2 1 20(12.3%) Vermont 1 1(0.6%)
Missouri 1 1 1 3(1.9%) Washington 1 1(0.6%)
Montana 1 1(0.6%) WestVirginia
5 1 6(3.7%)
Nebraska 2 2(1.2%) Wisconsin 7 7 6 1 2 23(14.2%)
Total 59(36.4%)
60(37.0%)
15(9.3%)
13(8.0%)
15(9.3%)
162(100.0%)