Non – Tariff Barriers and Exports: An Impact Analysis from ... – Tariff Barriers and Exports: An...
47
Non – Tariff Barriers and Exports: An Impact Analysis from Africa – EU and Africa – USA Trade Relations By Olayinka Idowu Kareem E-mail: [email protected] [email protected] Mobile: +2348055677538 Keywords: NTBs, Exports, Economic Crisis, Trade Relations, Gravity Model June, 2012 1
Transcript of Non – Tariff Barriers and Exports: An Impact Analysis from ... – Tariff Barriers and Exports: An...
Non – Tariff Barriers and Exports: An Impact Analysis from Africa – EUand Africa – USA Trade Relations
By
Olayinka Idowu KareemE-mail: [email protected]
[email protected]: +2348055677538
Keywords: NTBs, Exports, Economic Crisis, Trade Relations, Gravity Model
June, 2012
1
I. Introduction
The aspiration of developing countries, especially those from Africa to attain economic
development through sustainable growth, employment generation, reduction in income
inequality and poverty is linked to their interaction and integration to the global economy.
Integration of poorer countries into global market offers the opportunity and potential for
rapid growth and reduction in poverty (Martinez and Poole, 2004). Recognition and
acknowledgment have been accorded to trade as a veritable channel through which countries
can interact economically. Generally, trade has been acknowledged by many theorists;
especially the orthodox ones, to have been beneficial and countries could gain from their
participation. These theorists based their propositions on the premise that there will be trade
flows among participating countries. However, in reality, this is often not the case as there are
various trade barriers to some key exports, especially those that developing countries and
particularly Africa, has comparative advantage. As a result of these trade policies, Africa in
particular, found it difficult to take full advantage of the opportunities embedded in global
trade. Among these trade policies that inhibit trade flows among countries are the non-tariff
barriers (NTBs). These non-tariff barriers could be used in different forms depending on the
wish of the trading country in line with the World Trade Organisation (WTO) requirements.
The incidences of non-tariff barriers are said to be on the increase in recent time (Martinez
and Poole, 2004; Carrere and De Melo, 2009; Kareem, 2010; World Bank, 2012, etc).
However, the frequency of the incidences of these barriers would greatly influence the flow
of goods and services to the country.
The classical trade theories advise countries to specialise in order to realise gains from trade.
Africa’s exports during the 1950s and 1960s performed relatively well in terms of the volume
and the number of products, while the issue of trade barriers, especially non-tariff barriers to
their exports in the markets of their trading partners did not arise. As a result, Africa’s
comparative strength lay in the production of crude products that in these times attracted
fewer restrictions in the developed nations’ markets (especially in the markets of the former
colonial powers). However, from the 1970s until 2000, most of the countries of Sub-Saharan
Africa (SSA) – except for the Republic of South Africa, which faced a politically motivated
trade embargo – experienced decades of stagnation. The tightening of internal agricultural
policies that subsidised farming in the United States and the expanding European Union
2

undermined Africa’s comparative advantage in agricultural products in these regions of the
world.
However, the major hindrances to market access of Africa’s exports are the trade policies in
the continent’s trading partners’ markets. Specifically, the issue of tariffs and non-tariff
barriers has been seen as germane to market access of Africa’s exports. Of this, trade policies
studies have shown that the magnitude of the impact of tariffs is very minimal due to the fact
that most of exports of Africa origin are being granted preferential tariff rates. The main
restriction to Africa’s exports access to develop and developing countries’ markets is the non-
tariff barriers. The WTO (2012) report gave credence and enunciated the significance of the
issue of non-tariff barriers in trade relations. Most of Africa’s exports do not meet the
required standards set by these countries for any product coming to their markets. This is
because Africa does not have sufficient technical wherewithal in terms of advanced
technology and sciences to produce products of quality standards that will meet international
product standard requirements. Also, the use of safeguard measures and rule of origin have
restricted the extent to which countries in Africa can utilize the preferences granted to them in
the developed economies. The incidences of these non – tariff measures in these trade
relations have consequences on exports, especially those that Africa has comparative
advantage and thereby have impact on the extent to which export sector contribute to overall
income growth in the rural areas, stimulate growth in other sectors of the economy through
the expansion of goods and services demanded from these sectors. Also, it has effects on the
magnitude of earnings and degree with which it could be used to reduce poverty, hunger, and
overall malnutrition levels in the continent.
Studies in the literature modeling the actual distortions to trade due to trade barriers have
focused more on the impact of tariff barriers on trade flows between developing and
developed countries, i.e. south–north trade with capital and consumer products flowing in one
direction and primary products in the other. More so, there are very few studies that have
examined the effects of non-tariff barriers on trade flows among these trade partners. Aside
this, there are scanty specific studies that determine the impact of non-tariff barriers on
Africa’s sectoral exports despite the importance of this issue. It is on this basis that this study
tends to close these gaps by determining the effects of non-tariff barriers in the European
Union’s (EU) and United States of America’s (USA) markets on Africa’s exports and to
3
determine the sector that is mostly affected. Thus, the objective of this study is to determine
the effects of the use of non-tariff barriers on Africa’s exports flow to the EU and USA.
The Motivation
Generally, many of the trade policies’ studies usually focus on the effects of trade restrictions
on developing countries’ exports. Some of these studies have their shortcomings in terms of
their coverage and methodology. Ianchovichina, Mattoo and Olarreaga (2001) assessed the
impact of unrestricted market access on sub-Saharan Africa’s exports using a simple partial
model that assumed perfect factor mobility between sectors. However, in reality there is no
perfect factor mobility and also the study did not consider all Africa’s exports. Yeats (1994)
examined the exact worth of trade preferences granted by Organization of Economic
Cooperation and Development (OECD) to sub-Sahara African countries without sufficiently
considering the effects of NTBs on Africa’s exports. The study of Amjadi, Reinke and Yeats
(1996) uses a cross sectional analysis to examine whether external barriers cause the
marginalization of sub-Saharan Africa in world trade with limited period coverage and
provided inadequate justification for the scientific inferences. Also, their study classifies
African countries in terms of the preferences granted, but the study’s classification is based
on exports structure of African countries. Another similar study is the one carried out by
Jabati (2003) where he examined market access issues in agricultural products for developing
countries of Africa. The study’s methodological and analytical basis was uncertain.
Hammouda et al. (2005) evaluated the unrestricted market access for least developed
countries in the world including sub-Saharan Africa. While the data used for simulation was
only for 2001, the study cautiously interpreted its results, apart from the observation that
post-2001 changes could create the need for an update. Ajakaiye and Oyejide (2005) carried
out a study on the ways of removing impediments to African exports. However, this study
only examined the supply side of market access. Ogunkola and Oyejide (2001) evaluate the
effects of changes in the EU’s import policies on Nigeria’s exports to EU’s markets. They
measure the effect of trade restrictions and preference treatment on Nigeria’s exports to the
EU markets. However, this study is only limited to Nigeria (Importer) and European Union
(Markets). Further, this study uses 1992 and 1996 data for the analysis, in which there is need
to increase the data points. The market share model that was used could only be applied to
analysis of a country’s performance in the import market of another country, which makes the
analysis to be restricted in coverage. Thus, the model could only distinguish between the two
main components of changes in imports over two periods.
4
Specifically, empirical studies on trade policies (see Mayer and Zignago, 2005; Sanguinetti,
Traistaru, and Martincus; 2004; Hammouda et al. 2005; etc) mostly estimated the extent to
which developing countries have gained from tariff preferences granted to the continent.
Studies modelling the actual distortions to trade due to non-tariff barriers have focused on
trade flows mostly between developed and developing (see Shepherd and Wilson, 2010; Dean
et al., 2009; Fugazza and Maur, 2006), while only very few of them concentrated on sub-
Saharan Africa, which excluded the North African countries. World Bank (2012) conducted a
study on de-fragmenting Africa through deepening of regional integration in goods and
services; it examines the issue of trade policies in intra-Africa trade, specifically among the
East African Community (EAC). The findings show that while tariff barriers have been
reducing within the sub-region, non-tariff barriers (NTBs) are critically inhibiting regional
trade. This study covers intra-Africa trade and did not look at Africa’s trade with its foreign
trade partners, which the present study is focusing. The report of the Pacific Economic
Cooperation Council (2000) on non-tariff measures (NTMs) in goods and services trade
shows that the effects of NTMs would be based on its definition. While, if it is narrowly
defined would not pose much problem, but broadly defined will continue to be a growing
problem to trade in the region. A survey was carried out to examine different definitions and
scope of NTMs. It discovered that important barriers are the ones that are more difficult to
define, such as product standards, conformance assessment procedure, SPS measures, custom
procedure, rules of origin, etc. However, the study did not examine the NTMs in terms of
their effects on exports.
Dean et al. (2009) estimated the price effects of NTBs for more than 60 countries cutting
across 47 consumer products in 2001. They used a cross-sectional data in different products
model to capture the imperfect substitutability between products. The model was estimated
using an instrumental variables approach in order to incorporate the endogeneity of NTBs.
However, this study was conducted for selected developing countries for a single year and the
classification of product was not base on the structure of each country’s export. The study
considers price effects rather than export effects that this study is considering. The study of
Fugazza and Maur (2006) focused on NTBs in a non-tariff World by providing a
quantification of the effects of liberalization of NTBs at the global level using data from
World Bank and UNCTAD. However, their study mainly focused on methodology questions
related to the treatment of NTBs in CGE model with a focus on the GTAP model. The study
5
did not examine the export effects of NTBs. Saqib and Taneja (2005) examined the effects of
ASEAN and Sri Lanka’s NTBs on India’s exports, and discovered that the incidences of
NTBs have been increasing. Thus, these NTBs have inhibited India’s exports to these trade
partners. Although, this study looked at the impact of NTBs on exports, but it does not covers
Africa, which my study examines; more so, the survey data collected was analysed using
qualitative descriptive analysis.
However, a perusal of the literature shows that scanty studies exit on non-tariff barriers as
instruments of trade policy, in which to the best of my knowledge little or none exist on the
export effects of non-tariff barriers in Africa, especially at the sectoral level using the
incidences of NTBs in the importing countries. It is against this background that this study
aims to fill the gaps in the literature by determining the export effects of incidences of NTBs
in the EU and USA on African countries.
II. Background
II.1 Africa’s Exports Performance
The performance of Africa’s exports has not been consistent over the past three
decades and this has been oscillating all through the period understudy. This was due to the
political and macroeconomic instability in most of the countries as well as the internationally
induced instability due to fluctuation in commodities prices and global economic crisis. Table
1 - 2 show Africa’s exports to the rest of the world in percentage share and growth terms
between 1980 and 2010. Africa’s share of world exports is relatively low. In 1980, African
countries exported about US$119 billion worth of commodities, representing about 6% of
world exports in that year. However, in 1990, the value of exports dropped to about US$107
billion, or down to 3% of the world exports, which means that Africa’s share of global export
dropped by half to the previous decade. The continent’s exports regained an upward trend in
1995; it recorded up to over US$112 billion but against a background of growing world trade
this represented just 2% of world exports. Africa’s exports value increased to US$231billion
in 2004 and later rose to US$397.4 billion in 2007, which is 2.5% and about 3.0%,
respectively, of the global exports. Surprisingly, in spite the recent global economic crisis,
Africa’s share global export rose to 3.3% in 2010, although, it was relatively small compare
to others. Thus, the share of Africa’s exports in world exports is not only very low but it
depicts an unstable trend.
6

With respect to the growth of Africa’s exports, the continent’s exports have only
grown haphazardly over time. It can be observed that Africa recorded negative growth in
1990 (-8.47%). In 2000, it recorded a positive growth of about 31% to the preceding years.
The continent recorded a negative growth rate of over 5% in 2001. However, periods after
2001 recorded positive growth rate of Africa’s exports, except for 2009 due to economic
crisis in the world, but by 2010 it grew more than 25%. Thus, these growth rates have been
oscillating over the years. This means that in absolute terms, Africa’s exports value have been
increasing at a decreasing rate.
7
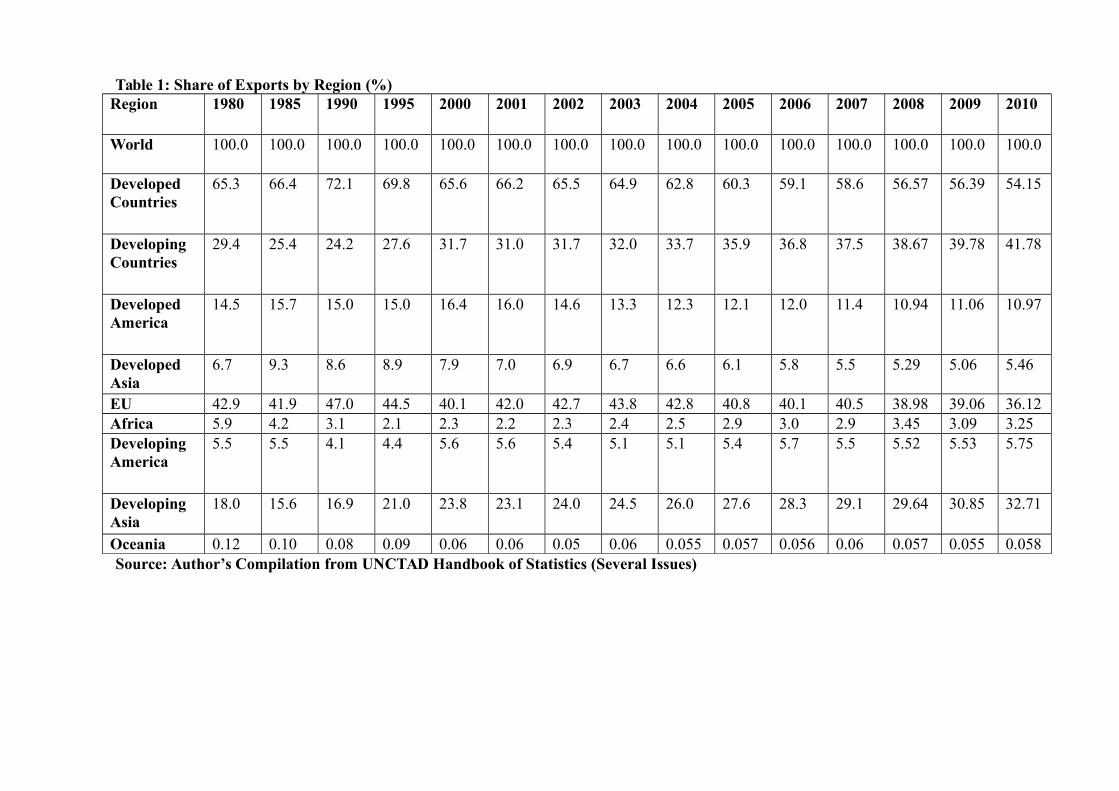
Table 1: Share of Exports by Region (%)Region 1980 1985 1990 1995 2000 2001 2002 2003 2004 2005 2006 2007 2008 2009 2010
World 100.0 100.0 100.0 100.0 100.0 100.0 100.0 100.0 100.0 100.0 100.0 100.0 100.0 100.0 100.0
Developed Countries
65.3 66.4 72.1 69.8 65.6 66.2 65.5 64.9 62.8 60.3 59.1 58.6 56.57 56.39 54.15
Developing Countries
29.4 25.4 24.2 27.6 31.7 31.0 31.7 32.0 33.7 35.9 36.8 37.5 38.67 39.78 41.78
Developed America
14.5 15.7 15.0 15.0 16.4 16.0 14.6 13.3 12.3 12.1 12.0 11.4 10.94 11.06 10.97
Developed Asia
6.7 9.3 8.6 8.9 7.9 7.0 6.9 6.7 6.6 6.1 5.8 5.5 5.29 5.06 5.46
EU 42.9 41.9 47.0 44.5 40.1 42.0 42.7 43.8 42.8 40.8 40.1 40.5 38.98 39.06 36.12Africa 5.9 4.2 3.1 2.1 2.3 2.2 2.3 2.4 2.5 2.9 3.0 2.9 3.45 3.09 3.25Developing America
5.5 5.5 4.1 4.4 5.6 5.6 5.4 5.1 5.1 5.4 5.7 5.5 5.52 5.53 5.75
Developing Asia
18.0 15.6 16.9 21.0 23.8 23.1 24.0 24.5 26.0 27.6 28.3 29.1 29.64 30.85 32.71
Oceania 0.12 0.10 0.08 0.09 0.06 0.06 0.05 0.06 0.055 0.057 0.056 0.06 0.057 0.055 0.058 Source: Author’s Compilation from UNCTAD Handbook of Statistics (Several Issues)
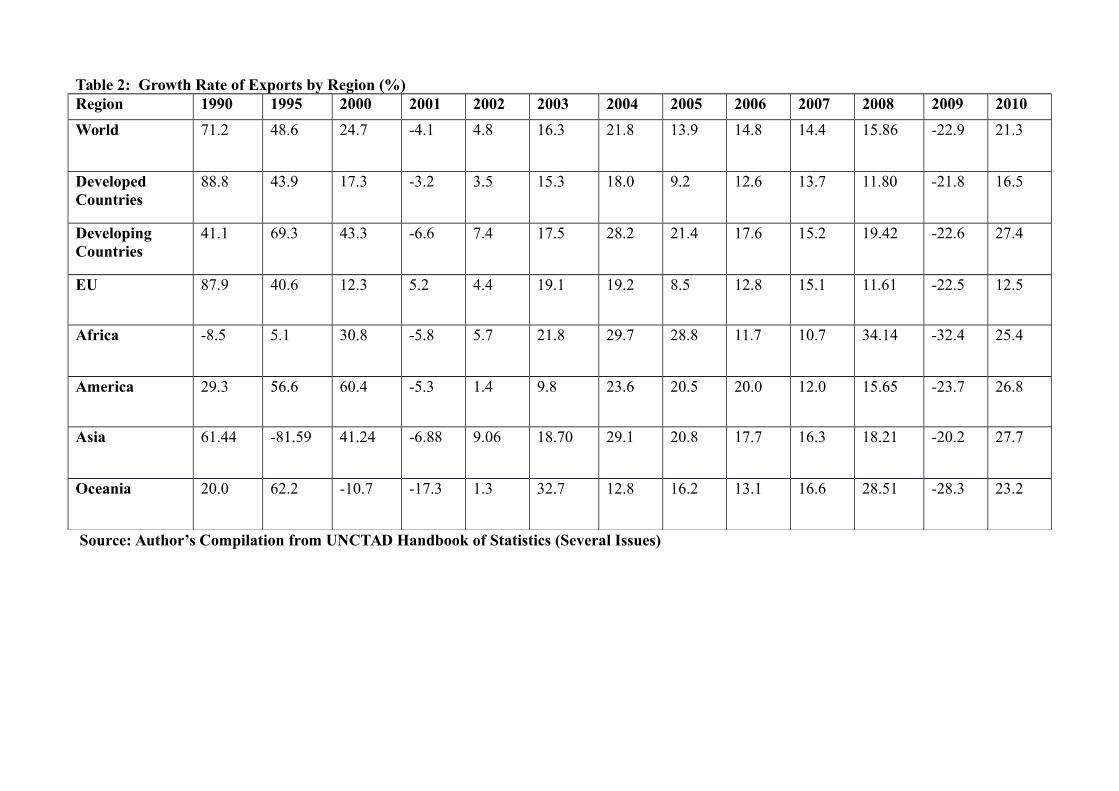
Table 2: Growth Rate of Exports by Region (%) Region 1990 1995 2000 2001 2002 2003 2004 2005 2006 2007 2008 2009 2010
World 71.2 48.6 24.7 -4.1 4.8 16.3 21.8 13.9 14.8 14.4 15.86 -22.9 21.3
Developed Countries
88.8 43.9 17.3 -3.2 3.5 15.3 18.0 9.2 12.6 13.7 11.80 -21.8 16.5
Developing Countries
41.1 69.3 43.3 -6.6 7.4 17.5 28.2 21.4 17.6 15.2 19.42 -22.6 27.4
EU 87.9 40.6 12.3 5.2 4.4 19.1 19.2 8.5 12.8 15.1 11.61 -22.5 12.5
Africa -8.5 5.1 30.8 -5.8 5.7 21.8 29.7 28.8 11.7 10.7 34.14 -32.4 25.4
America 29.3 56.6 60.4 -5.3 1.4 9.8 23.6 20.5 20.0 12.0 15.65 -23.7 26.8
Asia 61.44 -81.59 41.24 -6.88 9.06 18.70 29.1 20.8 17.7 16.3 18.21 -20.2 27.7
Oceania 20.0 62.2 -10.7 -17.3 1.3 32.7 12.8 16.2 13.1 16.6 28.51 -28.3 23.2
Source: Author’s Compilation from UNCTAD Handbook of Statistics (Several Issues)
II.2 Exports Trend among these Trade Partners
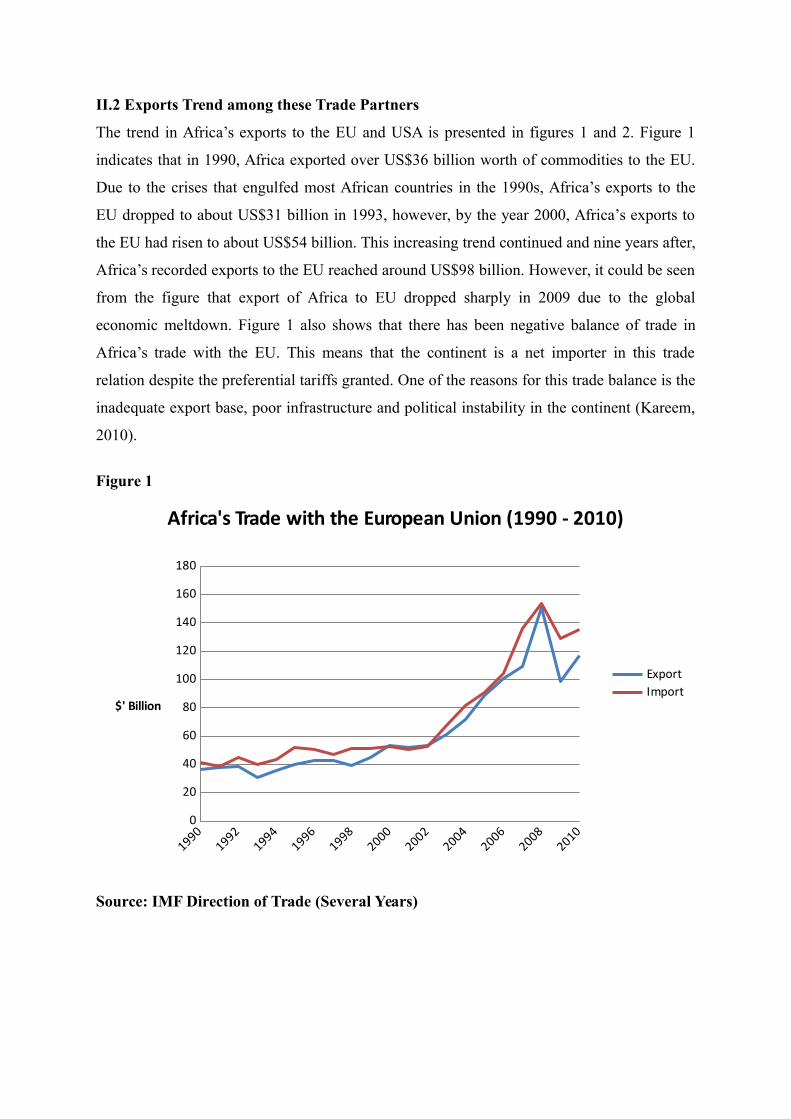
The trend in Africa’s exports to the EU and USA is presented in figures 1 and 2. Figure 1
indicates that in 1990, Africa exported over US$36 billion worth of commodities to the EU.
Due to the crises that engulfed most African countries in the 1990s, Africa’s exports to the
EU dropped to about US$31 billion in 1993, however, by the year 2000, Africa’s exports to
the EU had risen to about US$54 billion. This increasing trend continued and nine years after,
Africa’s recorded exports to the EU reached around US$98 billion. However, it could be seen
from the figure that export of Africa to EU dropped sharply in 2009 due to the global
economic meltdown. Figure 1 also shows that there has been negative balance of trade in
Africa’s trade with the EU. This means that the continent is a net importer in this trade
relation despite the preferential tariffs granted. One of the reasons for this trade balance is the
inadequate export base, poor infrastructure and political instability in the continent (Kareem,
2010).
Figure 1
0
20
40
60
80
100
120
140
160
180
Africa's Trade with the European Union (1990 - 2010)
ExportImport
$' Billion
Source: IMF Direction of Trade (Several Years)

Figure 2
0
20
40
60
80
100
120
Africa's Trade with the United States of America (1990 - 2010)
ExportImport
Axis Title
Source: IMF Direction of Trade (Several Years)
In terms of Africa’s trade with the United States of America (USA), figure 2 shows that the
total value of Africa’s exports to the USA was $14 billion, which later dropped to about $13
billion in 1993 due to political impasse in some countries. However, by 2000, Africa’s
exports to the USA have increased to about $23 billion due to relative political and
macroeconomic stability in many of the countries. Although, Africa’s exports to USA fell to
$18 billion in 2002, but picked up immediately in the following year (2003) to about $27
billion and which afterwards has been consistently increasing up to 2008 where it was $99
billion before it fell to $54 billion due to global economic meltdown. The continent recorded
positive trade balance in its trade with the USA all through the years, which means that Africa
is a net exporter of goods and services to the USA. The positive trade balance will not be too
far from the various preferential trade treatments granted to the continent, especially the
Africa Growth and Opportunity Act (AGOA).
II.3 Non – Tariff Barriers in the EU and USA
The non-tariff barriers are instruments of trade policy measures that are used to regulate the
flow of trade in trading countries. They are non – price trade policy instruments. A review of
NTBs in the European Union and United States of America is carried out in this section in
order to ascertain the incidences of these instruments in general and products specific levels.
United State of America (USA)
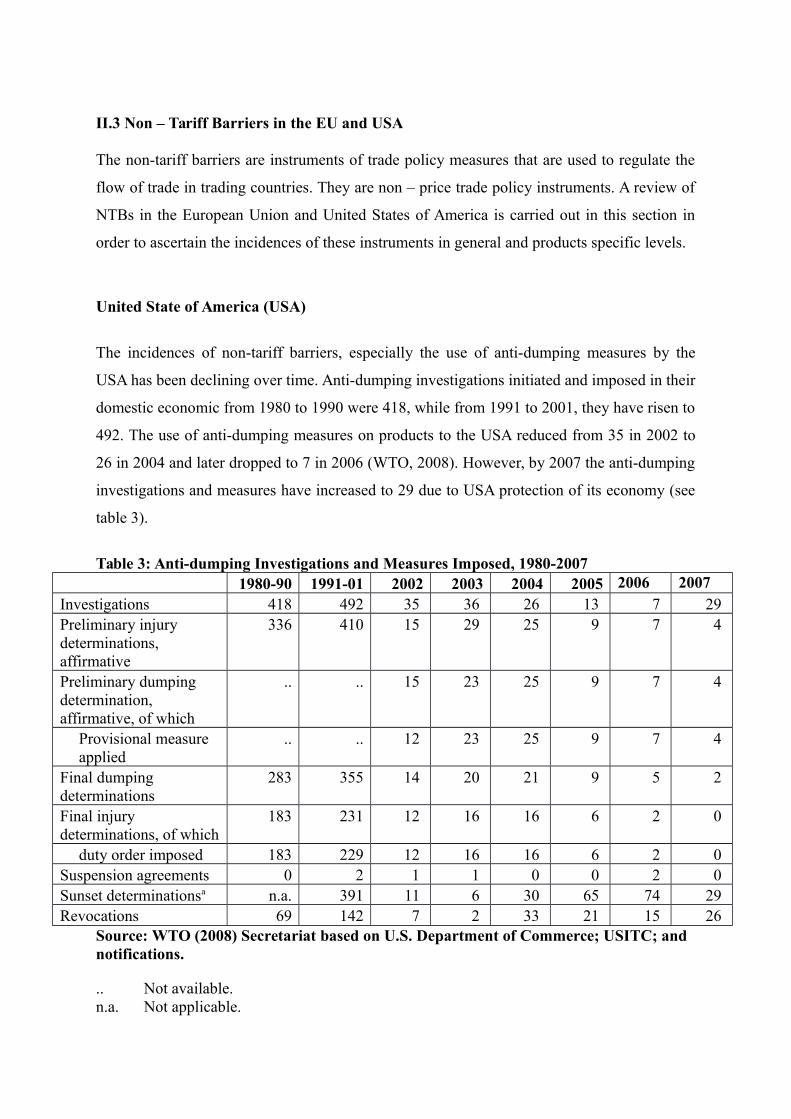
The incidences of non-tariff barriers, especially the use of anti-dumping measures by the
USA has been declining over time. Anti-dumping investigations initiated and imposed in their
domestic economic from 1980 to 1990 were 418, while from 1991 to 2001, they have risen to
492. The use of anti-dumping measures on products to the USA reduced from 35 in 2002 to
26 in 2004 and later dropped to 7 in 2006 (WTO, 2008). However, by 2007 the anti-dumping
investigations and measures have increased to 29 due to USA protection of its economy (see
table 3).
Table 3: Anti-dumping Investigations and Measures Imposed, 1980-20071980-90 1991-01 2002 2003 2004 2005 2006 2007
Investigations 418 492 35 36 26 13 7 29Preliminary injury determinations, affirmative
336 410 15 29 25 9 7 4
Preliminary dumping determination, affirmative, of which
.. .. 15 23 25 9 7 4
Provisional measure applied
.. .. 12 23 25 9 7 4
Final dumping determinations
283 355 14 20 21 9 5 2
Final injury determinations, of which
183 231 12 16 16 6 2 0
duty order imposed 183 229 12 16 16 6 2 0Suspension agreements 0 2 1 1 0 0 2 0Sunset determinationsa n.a. 391 11 6 30 65 74 29Revocations 69 142 7 2 33 21 15 26
Source: WTO (2008) Secretariat based on U.S. Department of Commerce; USITC; and notifications.
.. Not available.n.a. Not applicable.
a Number of AD orders continued or revoked as a result of sunset reviews.Note: Figures refer to the year in which the investigation was initiated.
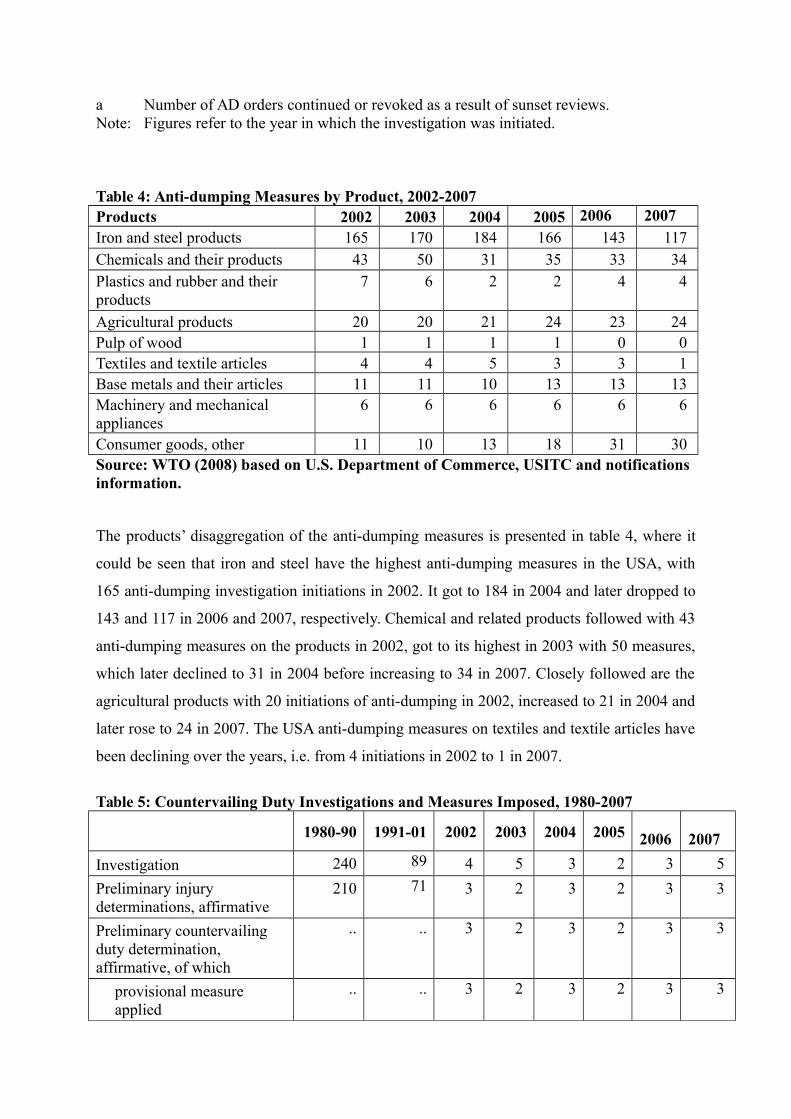
Table 4: Anti-dumping Measures by Product, 2002-2007Products 2002 2003 2004 2005 2006 2007Iron and steel products 165 170 184 166 143 117Chemicals and their products 43 50 31 35 33 34Plastics and rubber and their products
7 6 2 2 4 4
Agricultural products 20 20 21 24 23 24Pulp of wood 1 1 1 1 0 0Textiles and textile articles 4 4 5 3 3 1Base metals and their articles 11 11 10 13 13 13Machinery and mechanical appliances
6 6 6 6 6 6
Consumer goods, other 11 10 13 18 31 30Source: WTO (2008) based on U.S. Department of Commerce, USITC and notifications information.
The products’ disaggregation of the anti-dumping measures is presented in table 4, where it
could be seen that iron and steel have the highest anti-dumping measures in the USA, with
165 anti-dumping investigation initiations in 2002. It got to 184 in 2004 and later dropped to
143 and 117 in 2006 and 2007, respectively. Chemical and related products followed with 43
anti-dumping measures on the products in 2002, got to its highest in 2003 with 50 measures,
which later declined to 31 in 2004 before increasing to 34 in 2007. Closely followed are the
agricultural products with 20 initiations of anti-dumping in 2002, increased to 21 in 2004 and
later rose to 24 in 2007. The USA anti-dumping measures on textiles and textile articles have
been declining over the years, i.e. from 4 initiations in 2002 to 1 in 2007.
Table 5: Countervailing Duty Investigations and Measures Imposed, 1980-2007
1980-90 1991-01 2002 2003 2004 2005 2006 2007
Investigation 240 89 4 5 3 2 3 5
Preliminary injury determinations, affirmative
210 71 3 2 3 2 3 3
Preliminary countervailing duty determination, affirmative, of which
.. .. 3 2 3 2 3 3
provisional measure applied
.. .. 3 2 3 2 3 3

Final countervailing duty determinations
176 71 3 2 1 2 0 0
Final injury determinations, of which
.. .. 2 2 0 2 0 0
Duty order imposed 107 44 2 2 0 2 0 0
Revocations 83 93 0 0 2 4 11 7
Source: WTO (2008) based on U.S. Department of Commerce, USITC and notifications information.
.. Not available.Note: Figures refers to the year in which the investigation was initiated.
The USA imposition of countervailing measures has been declining over the years, which
could be seen in table 5. The number of countervailing duty investigations and measures that
were imposed on imported products to the USA during the period 1980 to 1990 was 240.
However, the period 1991 to 2001 witnessed 89 measures of countervailing. This
countervailing measure was just 4 in 2002, dropped to 3 in 2006 and later rose to 5 in 2007.
The European Union (EU)
From table 6, evaluating the incidences of non-tariff barrier measures used in the EU, shows
that between 1995 and 1999, 37 initiations of anti-dumping investigation was carried out in
order to protect their domestic economies. However, there was a reduction in the use of anti-
dumping investigation in 2001, which dropped to 27 and got to its lowest in 2003 with just 3
investigations. A sudden rise in the anti-dumping initiations to 24 in 2006 was witnessed due
to much influx of goods to the EU, which they did not desire for their domestic economies.
The definitive measures of the EU was 21 between 1995 and 1999, this figure rose to 40 in
2000 and dropped to its lowest in 2001 with 3 measures, but by 2006, it has risen to 11
definitive measures of the non-tariff barriers in the EU. The countervailing measures of the
EU have been at a moderate level over the years. Between the year 2000 and 2006, an
average of 2 measures were used to protect their domestic economies from the influx of
foreign goods. Further, the use of safeguard measures was at its minimum. The highest of the
safeguard initiation was in 2003 and 2005 with only 2 investigations.
Table 6: Contingency Measures Notified by the EU
Average 2000 2001 2002 2003 2004 2005
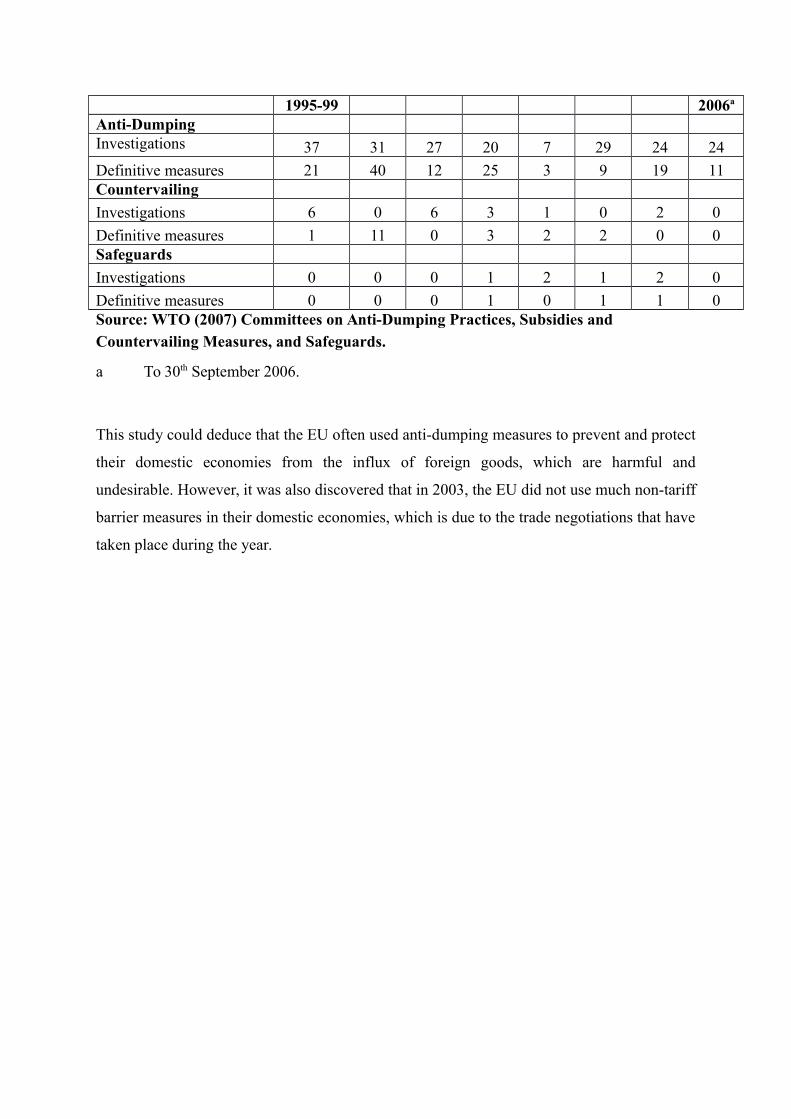
1995-99 2006a
Anti-DumpingInvestigations 37 31 27 20 7 29 24 24
Definitive measures 21 40 12 25 3 9 19 11Countervailing
Investigations 6 0 6 3 1 0 2 0
Definitive measures 1 11 0 3 2 2 0 0Safeguards
Investigations 0 0 0 1 2 1 2 0
Definitive measures 0 0 0 1 0 1 1 0Source: WTO (2007) Committees on Anti-Dumping Practices, Subsidies and Countervailing Measures, and Safeguards.
a To 30th September 2006.
This study could deduce that the EU often used anti-dumping measures to prevent and protect
their domestic economies from the influx of foreign goods, which are harmful and
undesirable. However, it was also discovered that in 2003, the EU did not use much non-tariff
barrier measures in their domestic economies, which is due to the trade negotiations that have
taken place during the year.
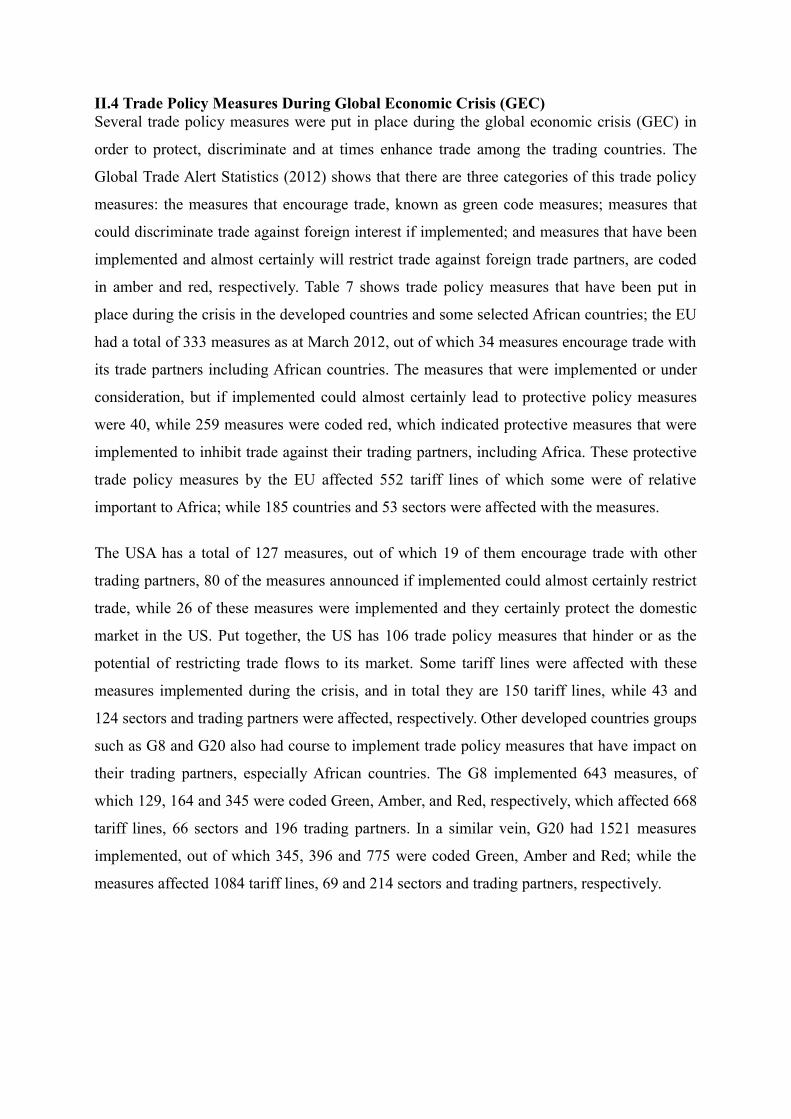
II.4 Trade Policy Measures During Global Economic Crisis (GEC)Several trade policy measures were put in place during the global economic crisis (GEC) in
order to protect, discriminate and at times enhance trade among the trading countries. The
Global Trade Alert Statistics (2012) shows that there are three categories of this trade policy
measures: the measures that encourage trade, known as green code measures; measures that
could discriminate trade against foreign interest if implemented; and measures that have been
implemented and almost certainly will restrict trade against foreign trade partners, are coded
in amber and red, respectively. Table 7 shows trade policy measures that have been put in
place during the crisis in the developed countries and some selected African countries; the EU
had a total of 333 measures as at March 2012, out of which 34 measures encourage trade with
its trade partners including African countries. The measures that were implemented or under
consideration, but if implemented could almost certainly lead to protective policy measures
were 40, while 259 measures were coded red, which indicated protective measures that were
implemented to inhibit trade against their trading partners, including Africa. These protective
trade policy measures by the EU affected 552 tariff lines of which some were of relative
important to Africa; while 185 countries and 53 sectors were affected with the measures.
The USA has a total of 127 measures, out of which 19 of them encourage trade with other
trading partners, 80 of the measures announced if implemented could almost certainly restrict
trade, while 26 of these measures were implemented and they certainly protect the domestic
market in the US. Put together, the US has 106 trade policy measures that hinder or as the
potential of restricting trade flows to its market. Some tariff lines were affected with these
measures implemented during the crisis, and in total they are 150 tariff lines, while 43 and
124 sectors and trading partners were affected, respectively. Other developed countries groups
such as G8 and G20 also had course to implement trade policy measures that have impact on
their trading partners, especially African countries. The G8 implemented 643 measures, of
which 129, 164 and 345 were coded Green, Amber, and Red, respectively, which affected 668
tariff lines, 66 sectors and 196 trading partners. In a similar vein, G20 had 1521 measures
implemented, out of which 345, 396 and 775 were coded Green, Amber and Red; while the
measures affected 1084 tariff lines, 69 and 214 sectors and trading partners, respectively.
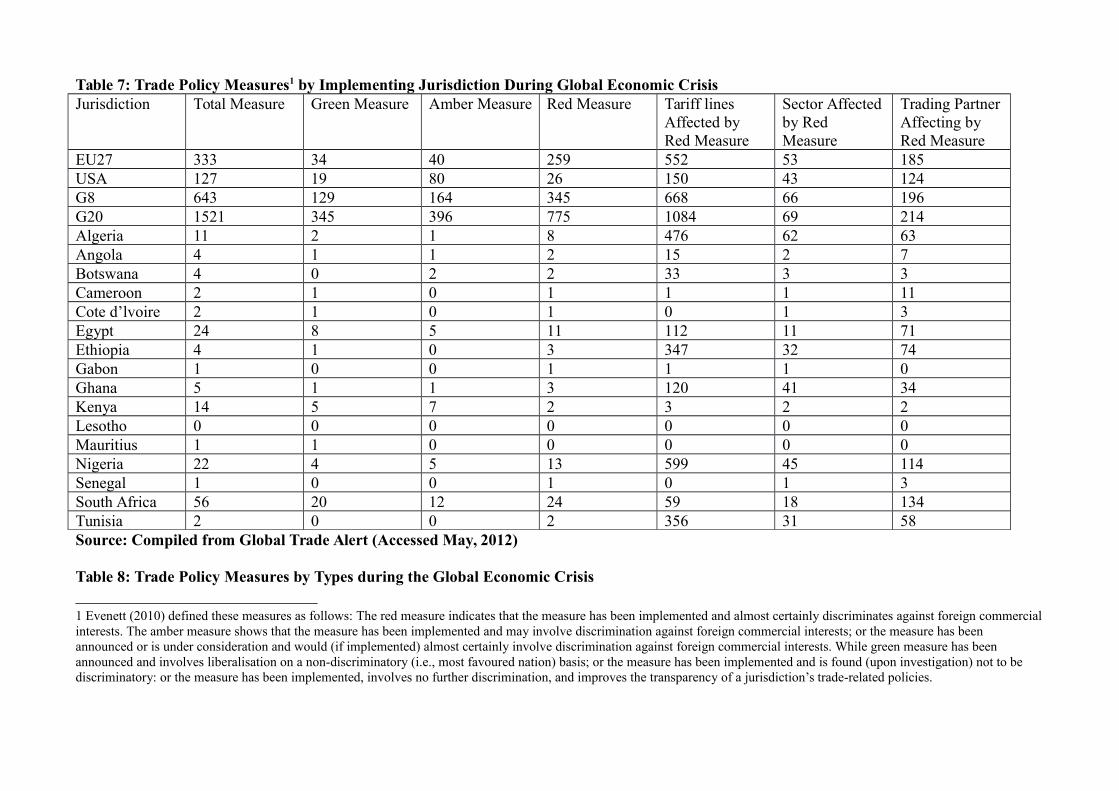
Table 7: Trade Policy Measures1 by Implementing Jurisdiction During Global Economic CrisisJurisdiction Total Measure Green Measure Amber Measure Red Measure Tariff lines
Affected by Red Measure
Sector Affectedby Red Measure
Trading PartnerAffecting by Red Measure
EU27 333 34 40 259 552 53 185USA 127 19 80 26 150 43 124G8 643 129 164 345 668 66 196G20 1521 345 396 775 1084 69 214Algeria 11 2 1 8 476 62 63Angola 4 1 1 2 15 2 7Botswana 4 0 2 2 33 3 3Cameroon 2 1 0 1 1 1 11Cote d’lvoire 2 1 0 1 0 1 3Egypt 24 8 5 11 112 11 71Ethiopia 4 1 0 3 347 32 74Gabon 1 0 0 1 1 1 0Ghana 5 1 1 3 120 41 34Kenya 14 5 7 2 3 2 2Lesotho 0 0 0 0 0 0 0Mauritius 1 1 0 0 0 0 0Nigeria 22 4 5 13 599 45 114Senegal 1 0 0 1 0 1 3South Africa 56 20 12 24 59 18 134Tunisia 2 0 0 2 356 31 58Source: Compiled from Global Trade Alert (Accessed May, 2012)
Table 8: Trade Policy Measures by Types during the Global Economic Crisis
1 Evenett (2010) defined these measures as follows: The red measure indicates that the measure has been implemented and almost certainly discriminates against foreign commercialinterests. The amber measure shows that the measure has been implemented and may involve discrimination against foreign commercial interests; or the measure has been announced or is under consideration and would (if implemented) almost certainly involve discrimination against foreign commercial interests. While green measure has been announced and involves liberalisation on a non-discriminatory (i.e., most favoured nation) basis; or the measure has been implemented and is found (upon investigation) not to be discriminatory: or the measure has been implemented, involves no further discrimination, and improves the transparency of a jurisdiction’s trade-related policies.
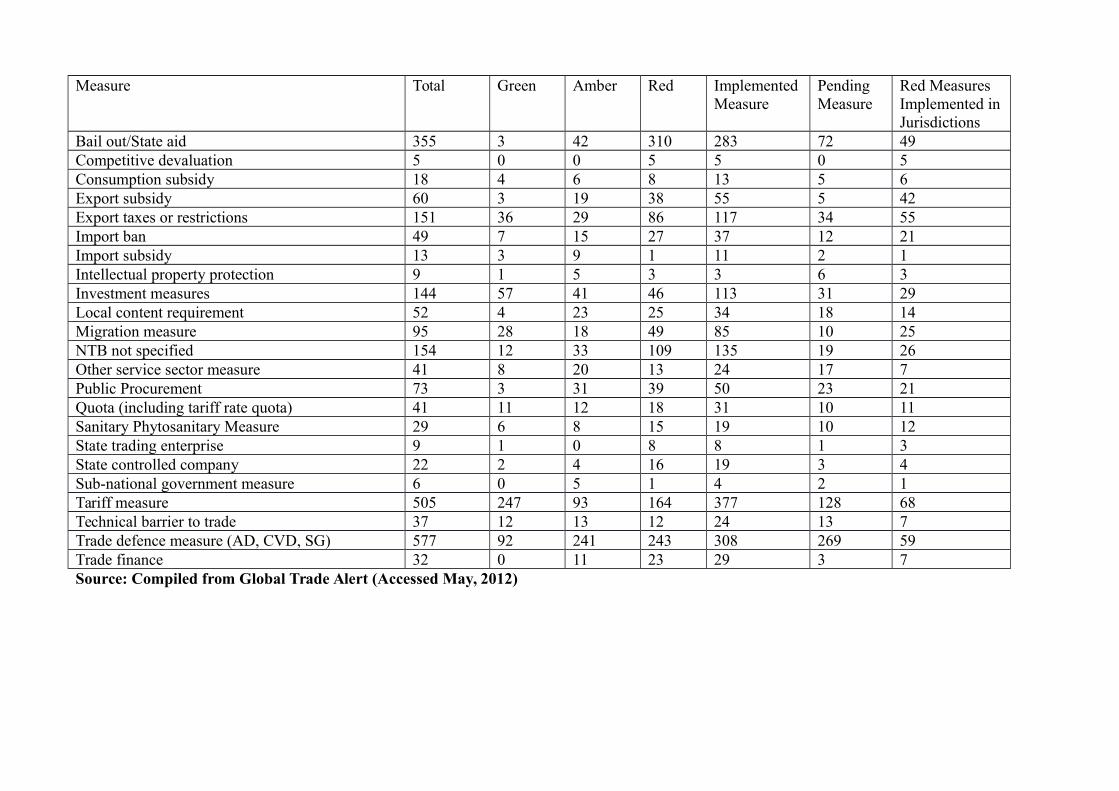
Measure Total Green Amber Red Implemented Measure
Pending Measure
Red Measures Implemented inJurisdictions
Bail out/State aid 355 3 42 310 283 72 49Competitive devaluation 5 0 0 5 5 0 5Consumption subsidy 18 4 6 8 13 5 6Export subsidy 60 3 19 38 55 5 42Export taxes or restrictions 151 36 29 86 117 34 55Import ban 49 7 15 27 37 12 21Import subsidy 13 3 9 1 11 2 1Intellectual property protection 9 1 5 3 3 6 3Investment measures 144 57 41 46 113 31 29Local content requirement 52 4 23 25 34 18 14Migration measure 95 28 18 49 85 10 25NTB not specified 154 12 33 109 135 19 26Other service sector measure 41 8 20 13 24 17 7Public Procurement 73 3 31 39 50 23 21Quota (including tariff rate quota) 41 11 12 18 31 10 11Sanitary Phytosanitary Measure 29 6 8 15 19 10 12State trading enterprise 9 1 0 8 8 1 3State controlled company 22 2 4 16 19 3 4Sub-national government measure 6 0 5 1 4 2 1Tariff measure 505 247 93 164 377 128 68Technical barrier to trade 37 12 13 12 24 13 7Trade defence measure (AD, CVD, SG) 577 92 241 243 308 269 59Trade finance 32 0 11 23 29 3 7Source: Compiled from Global Trade Alert (Accessed May, 2012)
Among the selected African countries, South Africa, Egypt, Nigeria Kenya and Angola had
the highest trade policy measures during the period. In terms of these measures that enhance
trade, South Africa, Egypt, Kenya and Nigeria had the most trade liberalizing policies with
20, 8, 5 and 4, respectively. However, South Africa, Nigeria, Egypt and Algeria had most
restrictive trade measures with 24, 13, 11 and 8, respectively. These measures affected 59
tariff lines, 18 sectors and 134 countries in South Africa; 599 tariff lines, 45 sectors and 114
countries in Nigeria; 112 tariff lines, 11 sectors and 71 countries in Egypt; while affecting 476
tariff lines, 62 sectors and 63 trading partners in Algeria.
Examining the trade policy instruments that were used by countries during the period, table 8
shows that trade defence measures such as anti-dumping, countervailing and safeguards were
the most used protective trade policy instruments with its incidence up to 577. This is closely
followed by the price-based protective measures (PPM), tariff measures, which are 503,
before the state aid or bailout which was 355 that were used mostly in the development
countries such as USA and the EU to boost demand and encourage productivity. Generally the
non –tariff instruments (NTI) accounted for more than 80% of the measures implemented
during the period (see table 8). In terms of the protective instruments used (red coded), the
bailout by the developed countries especially in the EU and USA were used to put their
foreign trading partners into disadvantage by not able to compete favourably with the bailout
(subsidized) sectors. Total number of bailouts implemented was 310, followed by the trade
defence measures with 243 incidences across the globe. It is interesting to note that import
subsidy was the least to use for protective trade instrument with only one case.
In terms of the implementation of these trade policy instruments, it was the use of PPM
(tariffs) that had the highest with 377, followed closely by the incidences of the use of trade
defence measures with 308 cases. The state aid or bailout given to domestic producers was
283 during the period under consideration. The least implemented measure was he Intellectual
Property Protection with just 3 cases. However, the incidence of trade defence measures had
the highest pending measures to be implemented, followed by 128 tariff measures and 72
bailouts to different sectors and product lines. The highest protective measures executed in the
implementing jurisdictions is the PPM (tariff measures) which is 68, then trade defence
measure 59, export taxes 58 and bailout 49. Put differently, it means that 68 countries had
implemented protective tariff measures, 59 countries put in place trade defence measures, and
55 countries used export taxes while 49 countries bailed out their ‘sick’ sectors.

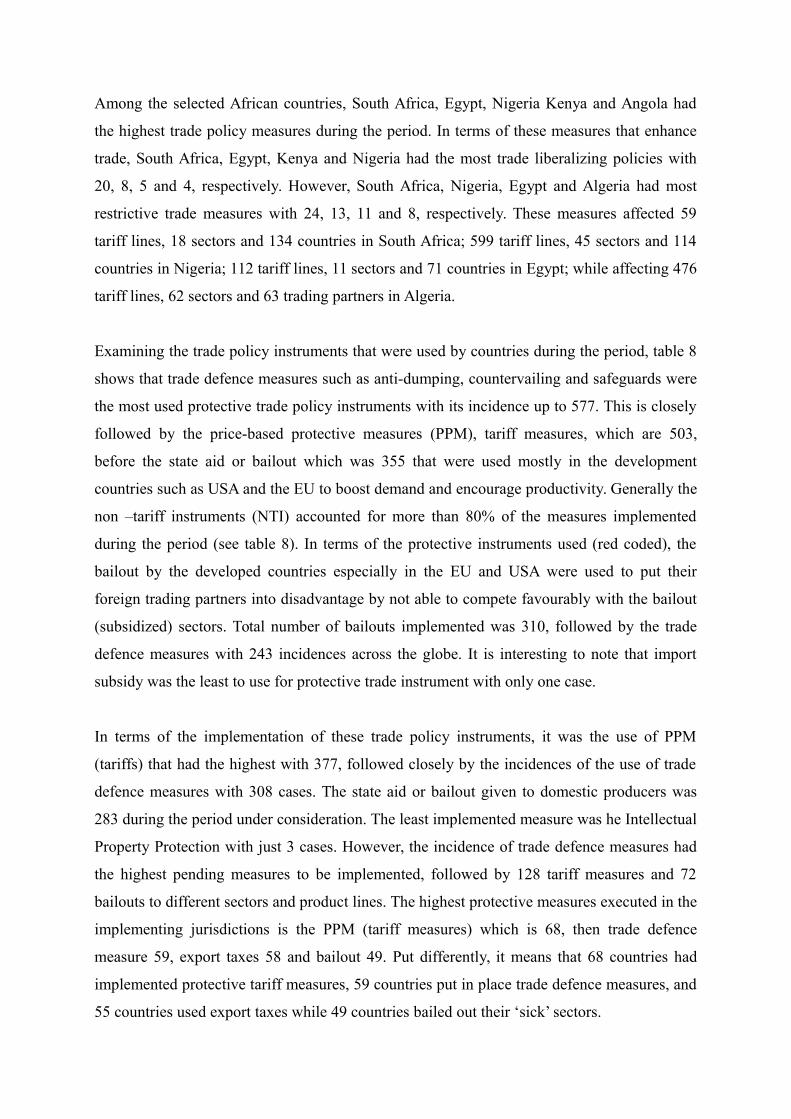
Table 9 presents sectors that were affected y the trade policy measures used during the crisis.
The selected sectors are based on the sectors of interest and important to Africa. The basic
chemical sector had the highest measures with 273, out of which about 210 were protective in
nature. Products of Agriculture, horticulture and marketing gardening recorded 22 measures
and over 76% of it was used to restrict trade flow. A total of 154 measures were used in Grain
mill products, starches and starch products, other food products; 71% of it was protective
trade measures, while 29% of the measures encourage trade. About 83% of the total measures
on Yarn and thread, woven and tufted textile fabric were restrictive, while 81% and 82% of
Rubber and plastic products and Glass and glass product, other non-metallic product n.e.c
were protective trade measures.
The most implemented measures came from Basic chemicals, then products of Agriculture,
horticulture and marketing gardening, before grains mill products, etc and rubber and plastic
products. Agriculture, forestry and fishing were the least implemented sector with just a
measure. Uranium and thorium ores had 11 while Agriculture, mining and manufacturing
services had 21 measures implemented. The Basic chemicals sector had the most measures
pending for implementation with 91 measures. Products of agriculture, etc recorded 57
measures pending for implementation, while 40 measures were pending for Grain mill
products etc. Agriculture, forestry and fishing had the lowest pending measures followed by
uranium and thorium ores, and tobacco products. Furthermore, 68 implementing Jurisdictions
have implemented protective measures in products of Agriculture, horticulture and marketing
gardening; 57 for grain mill products etc, 56 for both Glass and glass products, etc and live
animals and animal products; while 55 countries implanted protective measures in Basic
chemicals sector. No protective measure in Agriculture, forestry and fishing products.
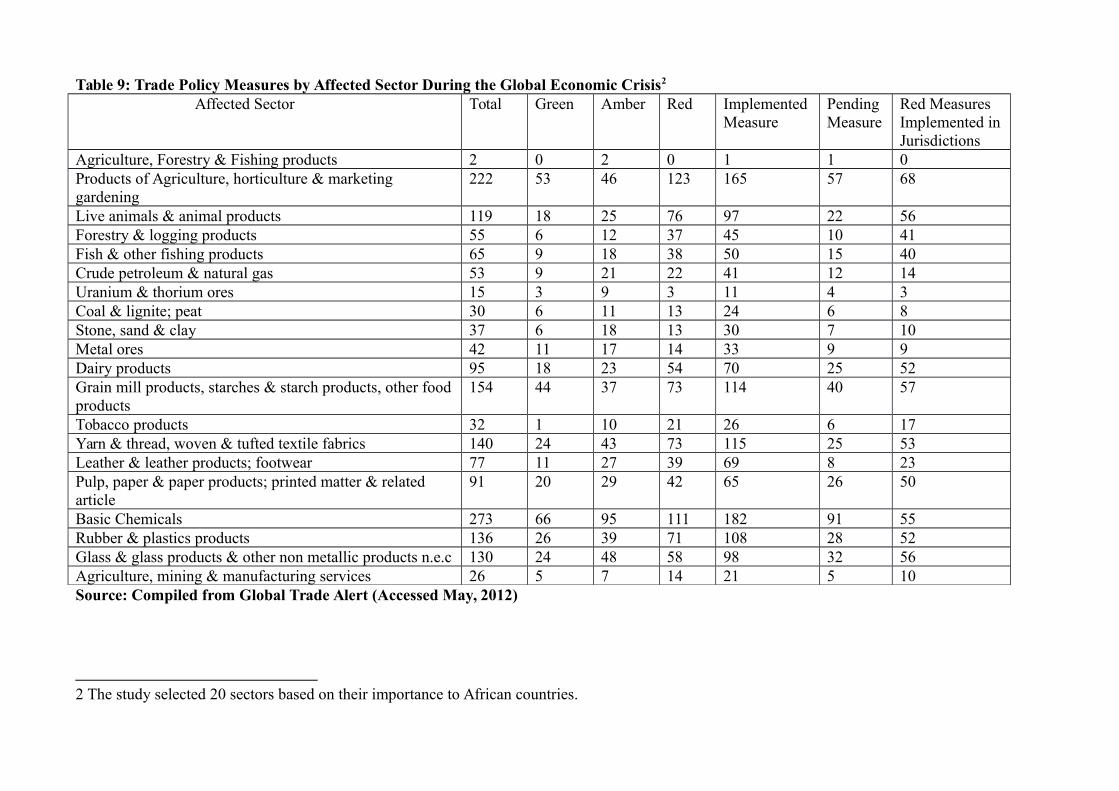
Table 9: Trade Policy Measures by Affected Sector During the Global Economic Crisis2 Affected Sector Total Green Amber Red Implemented
MeasurePending Measure
Red Measures Implemented inJurisdictions
Agriculture, Forestry & Fishing products 2 0 2 0 1 1 0Products of Agriculture, horticulture & marketing gardening
222 53 46 123 165 57 68
Live animals & animal products 119 18 25 76 97 22 56Forestry & logging products 55 6 12 37 45 10 41Fish & other fishing products 65 9 18 38 50 15 40Crude petroleum & natural gas 53 9 21 22 41 12 14Uranium & thorium ores 15 3 9 3 11 4 3Coal & lignite; peat 30 6 11 13 24 6 8Stone, sand & clay 37 6 18 13 30 7 10Metal ores 42 11 17 14 33 9 9Dairy products 95 18 23 54 70 25 52Grain mill products, starches & starch products, other foodproducts
154 44 37 73 114 40 57
Tobacco products 32 1 10 21 26 6 17Yarn & thread, woven & tufted textile fabrics 140 24 43 73 115 25 53Leather & leather products; footwear 77 11 27 39 69 8 23Pulp, paper & paper products; printed matter & related article
91 20 29 42 65 26 50
Basic Chemicals 273 66 95 111 182 91 55Rubber & plastics products 136 26 39 71 108 28 52Glass & glass products & other non metallic products n.e.c 130 24 48 58 98 32 56Agriculture, mining & manufacturing services 26 5 7 14 21 5 10Source: Compiled from Global Trade Alert (Accessed May, 2012)
2 The study selected 20 sectors based on their importance to African countries.

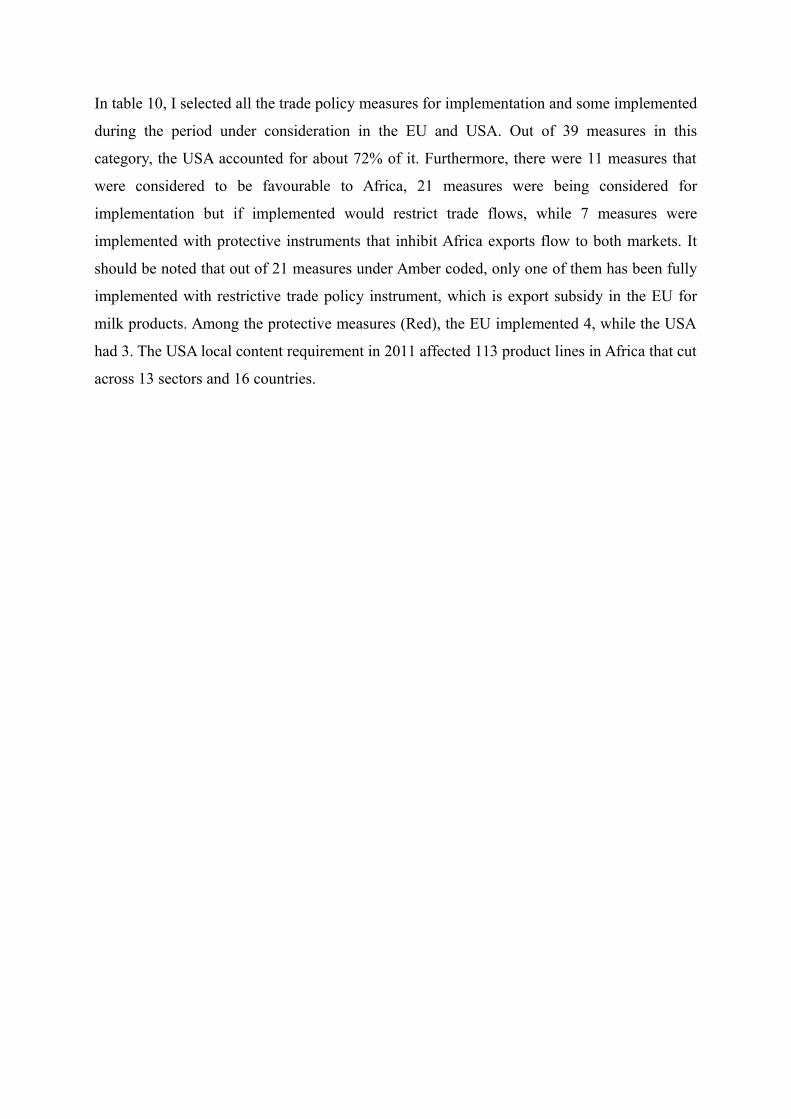
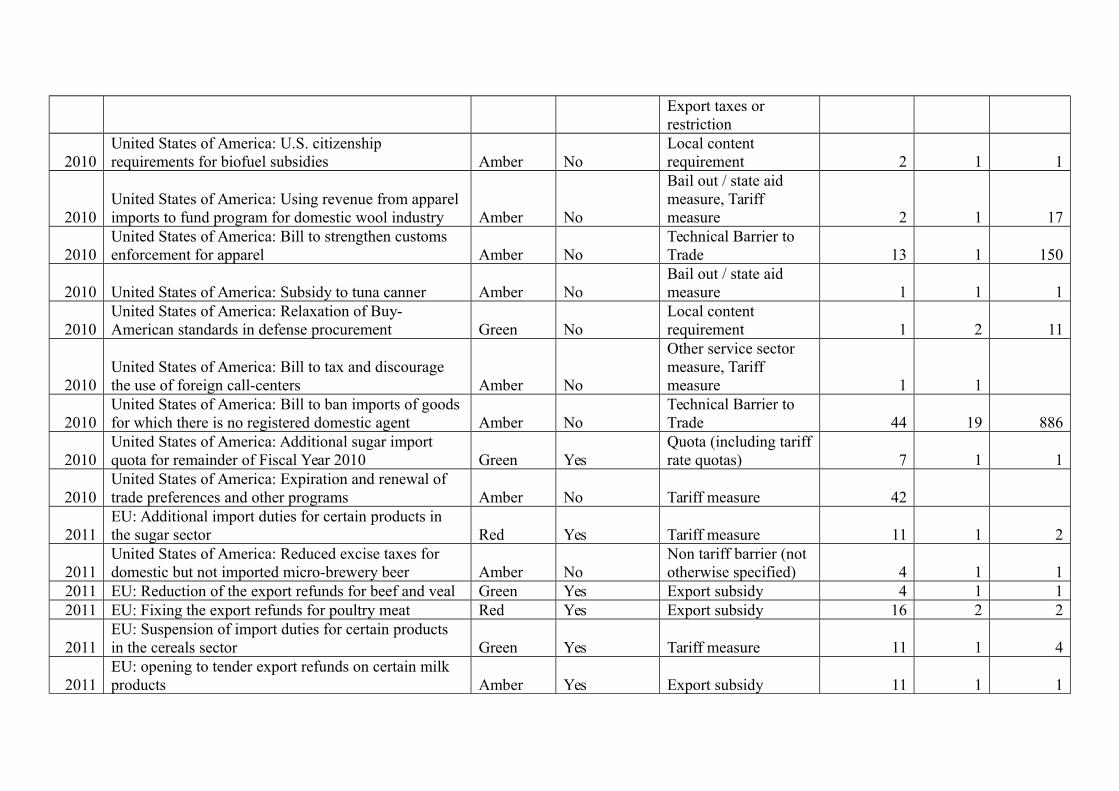
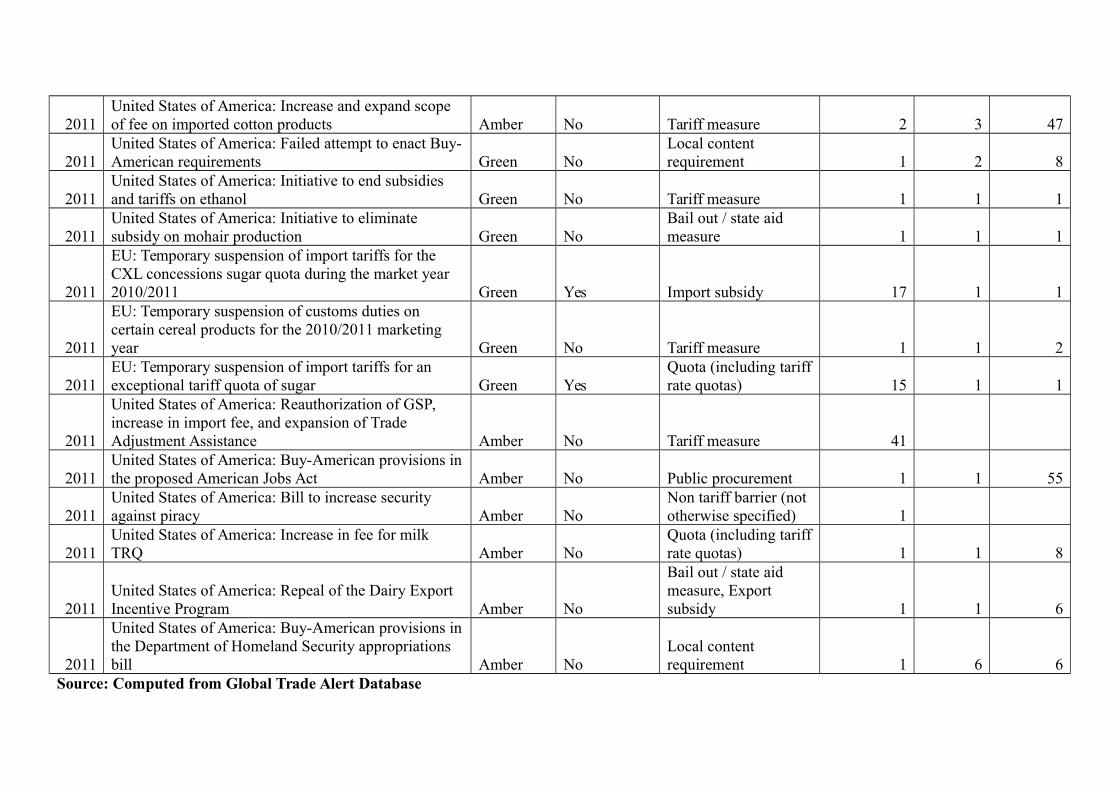
In table 10, I selected all the trade policy measures for implementation and some implemented
during the period under consideration in the EU and USA. Out of 39 measures in this
category, the USA accounted for about 72% of it. Furthermore, there were 11 measures that
were considered to be favourable to Africa, 21 measures were being considered for
implementation but if implemented would restrict trade flows, while 7 measures were
implemented with protective instruments that inhibit Africa exports flow to both markets. It
should be noted that out of 21 measures under Amber coded, only one of them has been fully
implemented with restrictive trade policy instrument, which is export subsidy in the EU for
milk products. Among the protective measures (Red), the EU implemented 4, while the USA
had 3. The USA local content requirement in 2011 affected 113 product lines in Africa that cut
across 13 sectors and 16 countries.
Table 10: Selected EU and USA Measures that have Direct Impact on Africa3
Year
Measure Title
GTA Evaluation
Implemented Measure Type
Number of Affected African Jurisdictions
Number of Affectedsectors
Number of Affected Products
2009 USA: Water Quality Improvement Act of 2009 Amber No Public procurement 3 3 30
2009United States of America: Dairy Export Incentive Program Red Yes Export subsidy 8 1 5
2009United States of America: Buy American provisions in stimulus package Red Yes
Local content requirement, Public procurement 16 13 113
2009United States of America: Buy American provisions in school construction bill. Amber No
Local content requirement, Public procurement 2 8 24
2009United States of America: Possible imposition of a fee on imported dairy products Amber No Tariff measure 1 1 6
2009United States of America: Support for General Motors and Chrysler. Red Yes
Bail out / state aid measure 1 1 2
2009United States of America: New food safety requirements Amber No
Sanitary and Phytosantiary Measure 20 16 125
2009EU: Measures to "stabilise" markets for certain dairy products Red Yes
Bail out / state aid measure, Export subsidy 17 3 10
2009EU: Reclassification of DMB mobile phones for tariff purposes. Green Yes Tariff measure 4 1 1
2009United States of America: Renewal of preferential trade programs Amber No Tariff measure 41 30
2010 EU: Additional out-of-quota sugar exports Red Yes Export subsidy, 13 1 1
3 The sectors and products considered are in 2-digit and 4-digit, respectively.
Export taxes or restriction
2010United States of America: U.S. citizenship requirements for biofuel subsidies Amber No
Local content requirement 2 1 1
2010United States of America: Using revenue from apparel imports to fund program for domestic wool industry Amber No
Bail out / state aid measure, Tariff measure 2 1 17
2010United States of America: Bill to strengthen customs enforcement for apparel Amber No
Technical Barrier to Trade 13 1 150
2010 United States of America: Subsidy to tuna canner Amber NoBail out / state aid measure 1 1 1
2010United States of America: Relaxation of Buy-American standards in defense procurement Green No
Local content requirement 1 2 11
2010United States of America: Bill to tax and discourage the use of foreign call-centers Amber No
Other service sector measure, Tariff measure 1 1
2010United States of America: Bill to ban imports of goods for which there is no registered domestic agent Amber No
Technical Barrier to Trade 44 19 886
2010United States of America: Additional sugar import quota for remainder of Fiscal Year 2010 Green Yes
Quota (including tariffrate quotas) 7 1 1
2010United States of America: Expiration and renewal of trade preferences and other programs Amber No Tariff measure 42
2011EU: Additional import duties for certain products in the sugar sector Red Yes Tariff measure 11 1 2
2011United States of America: Reduced excise taxes for domestic but not imported micro-brewery beer Amber No
Non tariff barrier (not otherwise specified) 4 1 1
2011 EU: Reduction of the export refunds for beef and veal Green Yes Export subsidy 4 1 12011 EU: Fixing the export refunds for poultry meat Red Yes Export subsidy 16 2 2
2011EU: Suspension of import duties for certain products in the cereals sector Green Yes Tariff measure 11 1 4
2011EU: opening to tender export refunds on certain milk products Amber Yes Export subsidy 11 1 1
2011United States of America: Increase and expand scope of fee on imported cotton products Amber No Tariff measure 2 3 47
2011United States of America: Failed attempt to enact Buy-American requirements Green No
Local content requirement 1 2 8
2011United States of America: Initiative to end subsidies and tariffs on ethanol Green No Tariff measure 1 1 1
2011United States of America: Initiative to eliminate subsidy on mohair production Green No
Bail out / state aid measure 1 1 1
2011
EU: Temporary suspension of import tariffs for the CXL concessions sugar quota during the market year 2010/2011 Green Yes Import subsidy 17 1 1
2011
EU: Temporary suspension of customs duties on certain cereal products for the 2010/2011 marketing year Green No Tariff measure 1 1 2
2011EU: Temporary suspension of import tariffs for an exceptional tariff quota of sugar Green Yes
Quota (including tariffrate quotas) 15 1 1
2011
United States of America: Reauthorization of GSP, increase in import fee, and expansion of Trade Adjustment Assistance Amber No Tariff measure 41
2011United States of America: Buy-American provisions inthe proposed American Jobs Act Amber No Public procurement 1 1 55
2011United States of America: Bill to increase security against piracy Amber No
Non tariff barrier (not otherwise specified) 1
2011United States of America: Increase in fee for milk TRQ Amber No
Quota (including tariffrate quotas) 1 1 8
2011United States of America: Repeal of the Dairy Export Incentive Program Amber No
Bail out / state aid measure, Export subsidy 1 1 6
2011
United States of America: Buy-American provisions inthe Department of Homeland Security appropriations bill Amber No
Local content requirement 1 6 6
Source: Computed from Global Trade Alert Database
In addition, the EU state aid and export subsidy affected 10 African products that cut across 3
sectors and 17 countries. Meanwhile, the relaxation of American standards in defence procurement
will enhance 11 African product lines, 2 sectors and a country if fully implemented. Also, the
temporary suspension of import tariffs for the CXI concessions sugar, which is import subsidy, will
enhance trade in 117 African countries in a single sector and product. However, if the USA fully
pass and implement the bill to ban imports of goods for which there is no registered domestic agent,
it will affect 886 product line, 19 sectors and 44 African countries. The renewal of the USA
preferential trade programmes that was proposed in 2009 will lead to market access in 44 African
countries across 30 sectors. The new requirements on food safety by the USA if implemented will
hinder the flow of 125 products in 18 sectors across 20 countries in Africa. Also if the bill to
strengthen customs enforcement for apparel is finally passed and implemented then it will certainly
hinder trade in 150 African products across a sector in 13 countries.
III. Review of the Literature Many studies have been carried out to show the extent to which trade restrictions or barriers retard,
inhibit, or have slow down the free flow of goods and services among countries. Dean et al. (2009)
estimate the price effects of NTBs using city level retail price data to directly estimate the average
impact of core NTBs on prices of 47 consumer products, grouped into four separate sectors, for
more than 60 countries in 2001. Both government reported data and private sector complaint data
were used to assess NTB incidences. A differentiated products model was used to capture imperfect
substitutability between products, which was estimated with an instrumental variables approach in
order to incorporate the endogeneity of NTBs. Their findings suggest that the core NTBs are still
highly restrictive in many countries and for many traded goods. Also, the results show that in some
sectors, the restrictiveness of NTBs is highly correlated with country income.
Fugazza and Maur (2006) examine the quantification of the effects of NTBs’ liberalization at the
global level using data from UNCTAD and the World Bank. There is significance increase in the
dataset used for the model in the study, which is larger than previous studies. They used a 27-sector
and 26-region aggregation based on the GTAP 6 database. Basically, the study evaluates the
questions relating methodology in the treatment of NTBs in CGE models with special interest on
the GTAP model. They found that serious modeling effects remain to be undertaken in order to
make CGE modeling a useful policy tool to analyse NTBs. Saqib and Taneja (2005) determine the
effects of NTBs in ASEAN and Sri Lanka on India’s exports. In order to accomplish the study
objective, it measures the incidence of non-tariff measures applicable to India exporters who face
NTBs through a survey of exporters. The outcome of the survey shows that the incidence of non-
tariff measures on India’s exports to ASEAN and Sri Lanka has increased. However, the incidence
is higher in Indonesia, Philippines, Malaysia and Thailand than in Singapore, Vietnam and Sri
Lanka. At the firm level, most of the barriers were related to the application of measures on
technical barriers to trade and sanitary and phytosanitary measures.
Haveman and Thursby (2000) examine the impact of tariff and NTBs to trade in agricultural
commodities at disaggregated level, with the exploitation of data that is available at UNCTAD
database for 1994 and 1998. They used data at the six-digit Harmonized Tariff System (HS) level
that allows for detailed consideration of sectors and barriers. The study covers 20 agricultural and
processed food sectors using a model based on the one developed by Haveman, Nair-Reichart and
Thursby (1999) that allowed division of the effects of tariffs and the NTBs used into three distinct
effects vis a vis, a reduction, compression and diversion effects. They found that NTBs reduction
effects are very large and are greater than tariffs reduction effects. The compression effects of NTBs
are mixed, but there appears to be more of a compressing effect when the importer is a developing
country. There is no evidence of tariff mitigating of NTBs (that is, the cross effects appears to be
zero).
Andriamananjara et al. (2004) measure the effects of non-tariff measures on price, trade and welfare
using the Computable General Equilibrium (CGE) model. The study constructed a database of
institutional information that identified alleged instances of NTMs for particular products and
countries based on WTO, U.S. Government, and EU sources, and compared with the UNCTAD
policy inventory. This database is then concorded to a GTAP-feasible multiregion, multisector
aggregation. The EIU city database provided the retail price, which was analysed using
econometric approach with consideration to the systematic deviations from purchasing-power parity
in order to determine the extent to which the presence of alleged NTMs is associated with higher
prices. The estimated price effects are then used to calibrate a CGE simulation in order to obtain
simulation estimates of trade and welfare effects of their removal, which can be disaggregated.
Removal of the categories of NTMs under consideration yields global gains on the order of $90
billion. These gains arise notably from liberalization by Japan and the EU by region, and from
liberalization of apparel and machinery/equipment by sector. Gawande and Li (2005) present a
theory-based empirical work on the determinants of bilateral non-tariff barriers, using the Grossman
– Helpman (GH) (1995) model to develop an econometric model. Their findings raised the same
puzzle as previous studies of the unilateral GH model did, that is, the weight given to welfare are
exceedingly high and do not appear to be consistent with the high welfare losses created by NTBs.
Furthermore, looking at the effect of market access restrictions and difficulties on developing
countries’ economies, Mayer and Zignago (2005) developed a method of assessment of market
access difficulties with an application to manufactured trade patterns between developing and
developed countries. This method also assess the effect of the regional trading arrangements and
they applied the micro-founded gravity-type model to estimate the effect of national borders on
revealed access to developed markets by developing countries. They concluded that though tariffs
still have in general an influence on trade patterns, they are not an important component of market
access difficulties faced by developing countries exporters in developed markets. Hammouda et al.
(2005) examine unrestricted market access for the least developed countries through the
simulations, based on the version 6.0 of the GTAP database. Their results of the expanded
unrestricted market for least developed countries in the QUAD markets indicate that unrestricted
access to QUAD markets for least developed countries would benefit all of these countries; African
countries would gain significantly less than Bangladesh and other South Asian countries; the
measure would also lead to a deterioration in the trade balance of Sub-Saharan African countries, as
local demand for imports would grow more than exports to the QUAD; also it will lead to a
reinforcement of agricultural specialization in this region to the detriment of industrial production;
and lastly the extension of unrestricted market access from African countries only to all LDCs does
not seem to alter the benefits Africa could draw from it.
Ogunkola and Oyejide (2001) analysed the performance of Nigeria’s exports in the EU between
1992 and 1996; and their analysis reveals that the share of Nigeria’s exports to the EU has remained
very low. The study used market share model and found that there has been increasing market share
of Nigeria’s exports to the EU. They concluded that external factors alone cannot fully explain the
performance of Nigeria’s exports in EU market, thus, domestic policies that are consistent with
international agreement are required. Hammouda et al. (2005) assessed empirically the impact of
eliminating all tariff and non-tariff barriers faced by all exports from Sub-Saharan African to the
developed economies of the QUAD, using a global CGE model in its analysis. They found that as a
result of unrestricted market access, African exports would increase by US$1.9billion, which are
mainly from agricultural exports towards Japan and the European Union. And that due to the
supply-side constraints, the growth in exports to the QUAD countries would be associated with a
decrease in exports to other markets.
Francois, Hoekman and Manchin (2005) argued that because of the concern that tariff reductions
will translate into worsening export performance for the least developed countries, trade preferences
have proven a stumbling block to developing countries support for multilateral liberalization. Thus,
their study examines the actual scope for preference erosion, including an econometric assessment
of the actual utilization and also the scope for erosion estimated by modeling full elimination
OECD tariffs and hence full MFN liberalization-based preference erosion. They discovered that
preferences are underutilized due to administrative burden that is estimated to be at least 4% on
average, which reduces the magnitude of erosion costs significantly. For those products where
preferences are used, the primary negative impact follows from erosion of EU preferences. This
suggests the erosion problem is primarily bilateral rather than a WTO – based concern.
Pelikan and Brockmeier (2008) empirically assessed the relationship between tariff aggregation and
market access in Canada and the EU. They use two approaches, in which the first involves a direct
and detail calculation of tariff line level of the summary protection indexes. They simulate the
effects of market access liberalization proposed in the WTO draft modality paper of February 2008.
The result shows that the direct tariff line approach and the hybrid tariff line CGE approach yield
similar results. These indicate that access to Canada’s agricultural sector is particular restricted for
milk imports from high – income countries. While in contrast, developing countries have particular
difficulty accessing the EU’s single market where high trade restrictions on beef, sugar and rice are
most relevant. However, in the study carried out by Rich, Perry and Kaitibie (2009) to evaluate the
effects of market access conditions on Ethiopian beef exports to the Middle Eastern markets.
However, the binding constraint is high domestic input costs rather than the costs of SPS
compliance. The sensitivity analyses reveal that while investments in feed efficiency and animal
productivity would enhance Ethiopia’s export competitiveness, the competitive nature of
international beef markets may still prevent market access.
Having perused through the literature, I discovered that there had been little specific study that
covers Africa on the issue of the trade policy, especially NTBs that actually hinder Africa’s exports
to the developed countries’ markets. Apart from this, most of the studies in the literature did not
cover non-tariff barriers, measures of trade policy, in their empirical analyses in order to determine
the impact of these measures on export of any region. Few studies that combine these measures in
their analyses constructed indices (like dummy variable) to captured non-tariff barriers instead of
the real incidence of its occurrence. While Milgram (2004) tries to determine the effects of supply
in conjunction with the market access conditions on EU’s clothing import, the study uses 1996 cross
sectional data for gravity model analysis for 22 developing countries. Further, related studies in the
literature are dated (Kee at al., 2006; which is the closest covers only five years from 2000 to 2004)
and need to be updated given a lot of changes that have occurred in the measures of trade policy
imposed by the developed countries. Also, in the literature, the estimation of the gravity model were
done through ordinary least square panel data estimation technique, however, no consideration was
given to the fact that there will be endogeneity and heteroscedascity problems in the model. In
addition, none of the studies tends to ascertain the reliability of the panel data so that the estimate
thereafter will not be spurious. More so, the panel data that were used in the literature often classify
countries based on their level of development (i.e. developing or developed), income group (i.e.
low, middle and high), region (i.e. SSA, Middle East and North Africa (MENA), etc) and trade
preference (i.e. based tariff preferential arrangement). Therefore, based on the aforementioned
identified gaps in the literature, this study contribution to the literature will be by covering Africa in
order to examining the effects of NTBs in the EU and USA on African countries’ exports. The study
will also combine tariffs with the number of the incidence of non-tariff barriers in the empirical
analysis. I have extended the data point to twenty years (1990 to 2009) to include different periods
of changes in trade policies in these markets. In order to mitigate the problems of endogeneity and
heteroscedascity that are associated with least panel data analysis, I have used the generalised
method of moment. The classification of countries in this study is based on export structure of the
selected countries rather than through the above.
IV. Methodology
Mayer and Zignago (2005) modeled market access in global and regional trade through a border-
effect methodology. The empirical work carried out for this study has modified their work by
including regional trade agreements, colonial affiliation and language. The theoretical framework
for this model is derived from the new trade theory above that made provision for economic of scale
and imperfect market. Bergstrand (1990) provides a description of the link between gravity equation
and bilateral trade patterns in a monopolistic competition framework of the new trade theory.
Tinbergan (1962), Poyhonen (1963) and Linnemann (1966) first applied gravity model to the
analysis of global trade flows. The name of the model was derived from its passing similarity to
Newtonian physics, which indicates that large economic entities such as countries or cities are said
to exert pulling power on people (Migration Model) or their goods (trade models) or capital (FDI
model). The simplest form of international trade gravity model assumes that the volume of trade
between any two trading partners is an increasing function of their national incomes and
populations, and a decreasing function of the distance between them. In the model it is common to
use the dummy variables to capture geographical effects (such as signalling whether the two
countries share a border, or if a country has access to the sea), cultural and historical similarities
(such as if two countries share a language or were linked by past colonial ties), regional integration
(such as belonging to a free trade agreement or sharing a common currency), as well as other
macroeconomic policy variables (such as biliateral exchange rate volatility). Anderson (1979),
Bergstrand (1985) and Helpman and Krugman (1985) have derived gravity equations from trade
models based on product differentiation and increasing returns to scale. Linnemann and
Verbruggen (1991) have explicitly studied the impact of tariffs on bilateral trade patterns using a
gravity model framework. However, it was Estevadeordal and Robertson (2002) that explicitly
studied the incorporation of preferential tariff rates in a gravity model.
IV.1 The Model
The model for this study is adopted from the empirical work of Mayer and Zignago (2005) that
modelled market access in global and regional trade through a border-effect methodology. The
modification that this study has done to the work of Mayer and Zignago (2005) is by including
regional trade agreements, colonial affiliation and language. The theoretical underpinning the
gravity type will occur in almost every trade model with full specialization, as shown by Evenett
and Keller (2003). The theoretical framework for this model is derived from the new trade theory
above that made provision for economics of scale and imperfect market. Bergstrand (1990) provides
a description of the link between gravity equation and bilateral trade patterns in a monopolistic
competition framework of the new trade theory.
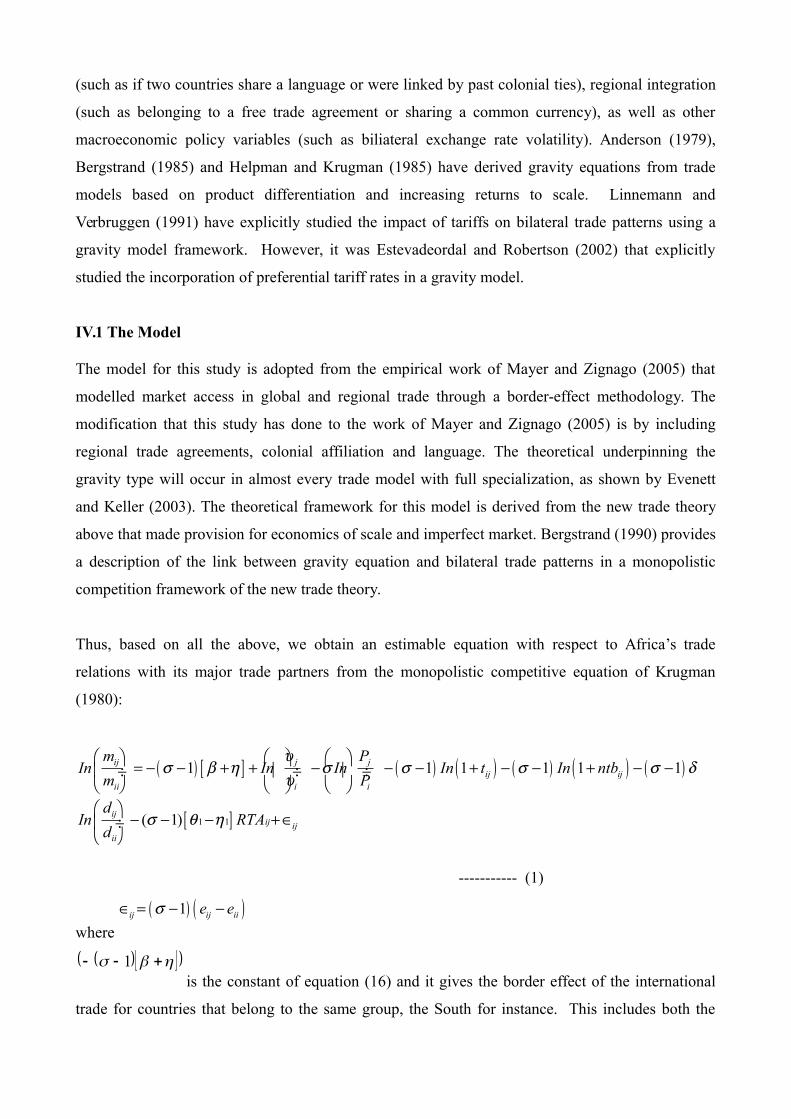
Thus, based on all the above, we obtain an estimable equation with respect to Africa’s trade
relations with its major trade partners from the monopolistic competitive equation of Krugman
(1980):
1 1
1 1 1 1 1 1
( 1)
ij j jij ij
ii i i
ijij ij
ii
m PIn In In In t In ntb
m P
dIn RTA
d
----------- (1)
where
1ij ij iie e
1is the constant of equation (16) and it gives the border effect of the international
trade for countries that belong to the same group, the South for instance. This includes both the
level of protection of the importing country (
) and the domestic bias of consumer (
). The
coefficient RTA measures the effects that the regional trade agreements have on African exports.
This study covered 25 African countries (comprising SSA and North Africa countries) that trade
with the EU and USA on products that spread across agricultural, industrial and petroleum sectors
from 1990 to 20094.
IV.2 Estimation Techniques
The generalized method of moment was used to estimate the panel data. These methods allow us to
estimate our regression equations for the whole of Africa. The reason for the use of panel data
technique in the gravity model is based on the several benefits of the technique as identified by
Hsiao (1985, 1986), Klevmarken (1989) and Solon (1989). It could be used to control for individual
heterogeneity, it provides more informative data, more variability, less collinearity among the
chosen variables, more degree of freedom and more efficiency. Also, panel data technique is a better
option when one intends to study the dynamics of adjustment and duration of economic states like
poverty and employment, and if these panels are long enough, they can shed light on the speed of
adjustments to economic policy changes. Panels are necessary for the estimation of inter-temporal
relations, life-cycle and intergenerational model and they can easily relate individual’s experiences
and behaviour at another point in time. They are better able to identify and measure effects that are
simply not detectable in cross-section or time-series data, such as in ordinary least square (OLS)
method.
The basic class of specification of these models is given as:
ittiitit XfY ,(2)
This leading case involves a linear conditional mean specification, so that we have:
ittiititit XY
(3)
4 See the appendix for the description of data and their sources as well as the classification of African countries into the sectors.
Where Yit stands for the dependent variable, Xit is a K – vector of regressors and it
are the error
terms for i = 1, 2, …, M cross-sectional units observed for dated periods t = 1, 2, …, T. The
represents the constant of the model, while the i
and t
represent the fixed and random effects,
respectively. Identification obviously requires that the
coefficients have restrictions placed upon
them. They may be divided into sets of common (cross-section and periods), cross-section specific,
and period specific regressor parameters.
Prior to estimating our model of African market access, we would expect an inverse relationship
between relative price and Africa’s exports, due to the problem of imported inflation that might
arise in the economies of Africa’s trading partners. Relative output is expected to have a direct
relationship with Africa’s exports, that is, as output increases; there will be more to export. Tariffs
and non-tariffs are expected to have inverse relationship with Africa’s exports. This means that as
more market conditions are imposed on Africa’s exports there will be restriction in the access of
Africa’s exports and if eventually the exports get into the trading partners market, it cannot compete
favourably with similar products.
This panel estimation technique will enable us to estimate panel equations using linear or non-linear
squares or instrumental variables (system of equations), with correction for the fixed or random
effects in both the cross-section and period dimensions and in addition, the generalized method of
moment (GMM) will be used to estimate the specification with various system weighting matrices.
It should be noted that apart from the above basis for panel data analysis, panel equations allow us
to specify equations in general form and also permits specification of non-linear coefficients mean
equations with additive effects. Panel equations do not automatically allow for
coefficients that
vary across-sections or period, but one may create interaction variables that permit such variation.
V. Research Findings
In presenting the empirical results of this study, it is important to note that the gravity model does
not estimate welfare effects (see Piermartini, 2006). The estimates of the panel-gravity models are
done through generalized method of moments (GMM). I have decided to estimate the random effect
due to the fact that the models for this study are gravity models that have dummy variables of which
fixed effect estimator will be inappropriate. According to Baltagi (2001) and Greene (2003), fixed
effect also known as least squares dummy variables (LSDV) suffers from a large loss of degree of
freedom, in which when it involves estimating (N – 1) extra parameters and too many dummy
variables, aggravates the problem of multicollinearity among the regressors. Also, the fixed effect
estimator cannot estimate the effect of any time-invariant variable like sex, race, language,
religious, colonial links, schooling etc because they will be wiped out by the Q transformation, the
deviations from means transformation. Thus, they concluded that any regression attempting to use
this estimator will fail. It is on this basis that in this study we have used the random effect estimator.
V.1 Industrial
The sectoral level results show that the industrial sector’s output in Africa is directly related to the
sector’s import in the EU and US. This means that importers in both markets will increase their
import of industrial products from Africa as the industrial output tends to rise. This result is
statistically significant for the two markets, which means that relative output of Africa’s industrial
sector is highly vital and relevant to the extent to which the sector’s import will be demanded. That
is, for every 100% decline in industrial output in Africa, there will be over 10% and about 19% fall
in supply response to the US and EU markets, respectively. Further, it could be seen from this result
that the EU supply response will be more depleted than the US, which means that in terms of supply
response of Africa’s industrial products, the EU will be more affected by the decline in the supply of
the products than the US. This could be seen from the magnitude of their relative outputs
coefficients. This result confirms the findings of Mayer and Zignago (2005).
The relative prices were inversely related to industrial imports in both markets, which indicates that
higher price of Africa’s industrial products/exports will be met with reduction in the sector’s import.
However, theoretically, we expect such relationship between price and demand for import of the
industrial sector. The result shows that for every 100% rise in Africa’s industrial sector’s exports
prices, there will be 0.004% and 0.0003% drop in the demand for the sector’s import in the US and
EU, respectively. Though, this result is statistically significant in the US, but not in the EU.
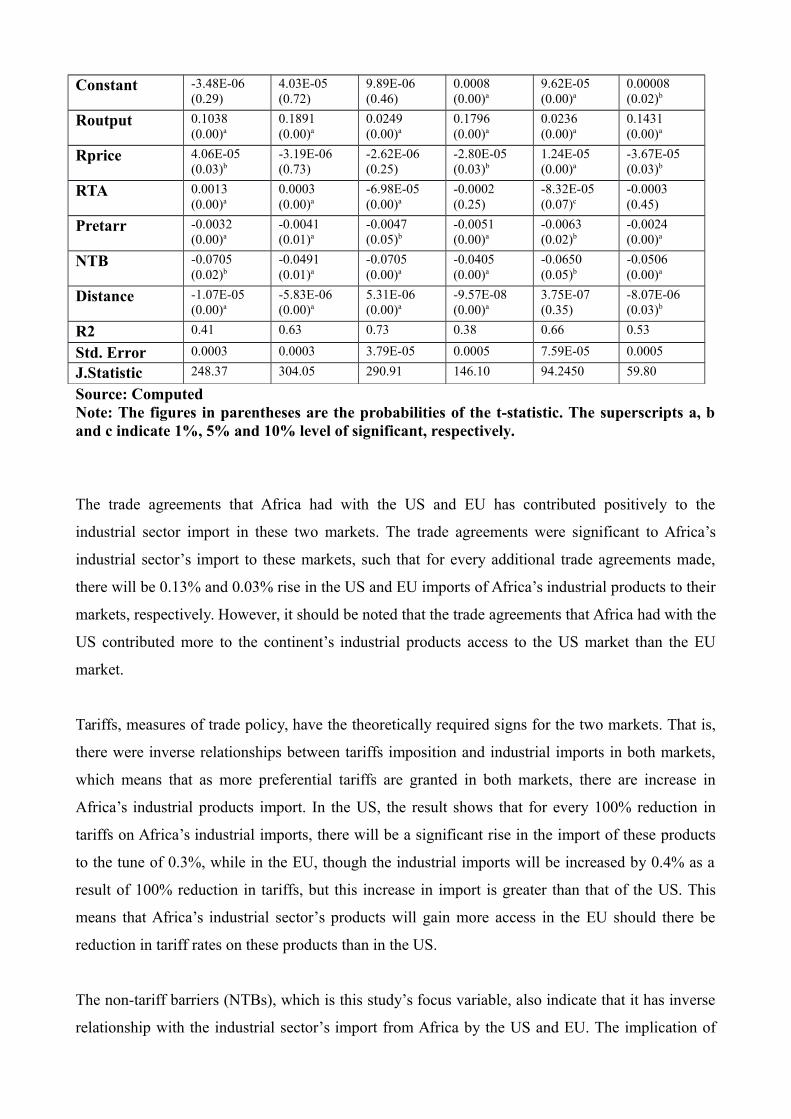
Table 11: Generalized Method Moment (GMM) Random Effect Result – Sectoral LevelVariable INDUSTRIAL AGRICULTURE PETROLEUM
USA EU USA EU USA EU
Constant -3.48E-06(0.29)
4.03E-05(0.72)
9.89E-06(0.46)
0.0008(0.00)a
9.62E-05(0.00)a
0.00008(0.02)b
Routput 0.1038(0.00)a
0.1891(0.00)a
0.0249(0.00)a
0.1796(0.00)a
0.0236(0.00)a
0.1431(0.00)a
Rprice 4.06E-05(0.03)b
-3.19E-06(0.73)
-2.62E-06(0.25)
-2.80E-05(0.03)b
1.24E-05(0.00)a
-3.67E-05(0.03)b
RTA 0.0013(0.00)a
0.0003(0.00)a
-6.98E-05(0.00)a
-0.0002(0.25)
-8.32E-05(0.07)c
-0.0003(0.45)
Pretarr -0.0032(0.00)a
-0.0041(0.01)a
-0.0047(0.05)b
-0.0051(0.00)a
-0.0063(0.02)b
-0.0024(0.00)a
NTB -0.0705(0.02)b
-0.0491(0.01)a
-0.0705(0.00)a
-0.0405(0.00)a
-0.0650(0.05)b
-0.0506(0.00)a
Distance -1.07E-05(0.00)a
-5.83E-06(0.00)a
5.31E-06(0.00)a
-9.57E-08(0.00)a
3.75E-07(0.35)
-8.07E-06(0.03)b
R2 0.41 0.63 0.73 0.38 0.66 0.53
Std. Error 0.0003 0.0003 3.79E-05 0.0005 7.59E-05 0.0005
J.Statistic 248.37 304.05 290.91 146.10 94.2450 59.80
Source: ComputedNote: The figures in parentheses are the probabilities of the t-statistic. The superscripts a, band c indicate 1%, 5% and 10% level of significant, respectively.
The trade agreements that Africa had with the US and EU has contributed positively to the
industrial sector import in these two markets. The trade agreements were significant to Africa’s
industrial sector’s import to these markets, such that for every additional trade agreements made,
there will be 0.13% and 0.03% rise in the US and EU imports of Africa’s industrial products to their
markets, respectively. However, it should be noted that the trade agreements that Africa had with the
US contributed more to the continent’s industrial products access to the US market than the EU
market.
Tariffs, measures of trade policy, have the theoretically required signs for the two markets. That is,
there were inverse relationships between tariffs imposition and industrial imports in both markets,
which means that as more preferential tariffs are granted in both markets, there are increase in
Africa’s industrial products import. In the US, the result shows that for every 100% reduction in
tariffs on Africa’s industrial imports, there will be a significant rise in the import of these products
to the tune of 0.3%, while in the EU, though the industrial imports will be increased by 0.4% as a
result of 100% reduction in tariffs, but this increase in import is greater than that of the US. This
means that Africa’s industrial sector’s products will gain more access in the EU should there be
reduction in tariff rates on these products than in the US.
The non-tariff barriers (NTBs), which is this study’s focus variable, also indicate that it has inverse
relationship with the industrial sector’s import from Africa by the US and EU. The implication of

this is that, any incidence of NTB on the Africa’s industrial sector’s imports in both markets will
serve as hindrances to Africa’s export of industrial products and at the same time, show the extent to
which these markets protect their domestic economies from foreign products invasion. Thus, for
every additional incidence of NTB, there will be 7% and about 5% reduction in the US and EU
imports of Africa’s industrial products, respectively. It should be noted that the magnitudes of the
reduction in the industrial sector’s imports in these markets due to the use of NTBs are far higher
than that of tariffs.
Distance has an inverse relationship with industrial products imports to the US and EU. That is, the
more the distance between Africa and these trading partners, the lower the imports of Africa’s
industrial products to these markets. This indicates that higher trade costs of which distance
measures inhibit the flow of Africa’s industrial products export to these markets. This result is
expected theoretically and it is statistically significant.
V.2 Agriculture
The result of the agricultural sector indicates that relative output has a positive relationship with
agricultural sector’s import in both the US and EU markets. This means that as the output of
agricultural products in Africa increases, there will be rise in the US and EU import of these
products, such that for every 100% increase in agricultural sector’s output, there will be about 2.5%
and 1.8% rise in the US and EU imports, respectively. The implication of this is that if African
could increase its productivity in the agricultural sector, there are markets for the output such that
there will be more market access for these products in these two markets. This result shows that
relative output is significantly related to Africa’s industrial imports in the US and EU.
In terms of the degree of association between relative price and import of agricultural products of
Africa in the US and EU, the result shows that there are inverse relationships, which means that
prices of agricultural products imports to these markets are indirectly related to their imports. That
is, if the prices are reduced, then agricultural products from Africa will gain more access to these
markets, such that if the prices are reduce by 100%, there will be 0.0002% and 0.003% rise in
agricultural products import in the US and EU, respectively. The relative price is statistically
significant in the EU models, while it is insignificant in the US model.
Africa’s trade agreements with the US and EU have not contributed to additional market access of
African’s agricultural products in the US and EU markets. In other words, the trade agreements that
Africa had with the US and EU did not impacted positive to Africa’s agricultural products access to

the markets of these trading partners. The implication of this is that there are some levels of non-
compliance with these agreements, which has made the agreements ineffectively implemented and
thereby could not facilitate enhanced market access to Africa’s export of agricultural products to the
US and EU.
The preferential tariff rates on agricultural products in the US and EU enhances agricultural
products access to the two markets. This indicates that tariff impositions could either act as
hindrance or enhancement to Africa’s agricultural products access to these markets depending on
the direction of the imposition. Given this, it means that an inverse relationship exists between
tariffs and agricultural products imports. This is in the sense that for every 100% rise in the
preferential tariffs, there will be 0.04% and 0.05% increase in the US and EU imports of
agricultural products, respectively. The result as presented indicates that Africa’s agricultural
products responded more to the reduction in tariffs through the preferential tariffs granted in the EU
than in the US. The implication of the result is that, preferential tariffs on agricultural products
enhances the products market access, however US market stands out to be more restrictive than the
EU.
The non-tariff barriers also present an inverse relationship with agricultural imports to the US and
EU. The result shows that agricultural products from Africa are very sensitive to the various
incidences of NTBs in the US and EU, such that if there are increases in the incidences of NTBs,
for example, countervailing, standards, SPS etc., agricultural products from Africa cannot stand the
test of these measures of NTBs and thereby the products will be restricted from gaining access to
these markets. The implication of this is that, African agricultural products standard and qualities
need to be enhanced in order to facilitate the products’ access to these markets. For instance, any
additional incidence of NTBs will lead to about 7% and 4% reduction in Africa’s agricultural
products imports from the US and EU, respectively. This means that NTBs are more trade
restrictive than tariffs in both markets.
Distance, a measure of trade cost, is inversely related to Africa’s agricultural import to the EU. This
means that the more the distance between Africa and the EU, the lower the amount of agricultural
imports from Africa that get to the EU. This degree of association is statistically significant.
However, in the trade relation between African and the US, distance is not a barrier to trade as it has
a direct relationship with the level of agricultural products imports to the US. That is, trade cost that
is incurred in the cause of exporting Africa’s agricultural product to the US does not inhibit the flow
of these products to their market.
V.3 Petroleum
Analysis of results under the petroleum sector indicate that relative output has the expected sign of a
positive relationship with the sector’s import in the US and EU. This suggest that as petroleum
output increases there will be more access of the output in the markets of both the US and EU, such
that for every 100% rise in petroleum output there will be over 2.3% and 14% increase in the US
and EU imports, respectively. This result shows that the EU imports more of African petroleum
products than the US and it confirms the a priori expectation of the study.
Relative price of petroleum products from Africa is inversely related to the EU import of the
products, which means that as the petroleum products prices rise in the EU market, there will be
drop in the consumption of petroleum products by the consumers. This result shows that the EU has
an alternative source of energy that is different from petroleum product with which they could
easily shift to if there is a rise in petroleum products prices. Thus, for every 100% rise in Africa’s
petroleum products prices, there will be 0.004% drop in the EU import of the products. However,
this could not be said of the US import of petroleum products because Africa’s petroleum prices
were directly related to the US import of the products. This means that the more the prices of the
products, the higher US import of petroleum products, such that for every 100% rise in the prices
there will be 0.001% increase in their import. The implication of this result is that the US has not
found an appropriate substitute to petroleum products.
The trade agreements that Africa had with the US and EU have nothing to do with Africa’s
petroleum products export to the markets, such that the agreements did not contribute to improve
market access of Africa’s petroleum products import to these markets and it is due to the influence
of Organisation of Petroleum Exporting Country on all its members. This could be seen from the
sign of the coefficient of trade agreements in both the US and EU model estimates. Though, the
coefficients are statistically insignificant for the two markets. The implication of this result is that
petroleum sector has been vital such that irrespective of the trade agreements between Africa and
her trading partners, the sector’s output will be needed by many markets all over the world.
Tariffs, measure of market access conditions, were inversely related to Africa’s petroleum products
import to the US and EU. This shows that an increase in the rate of preferential tariffs in these
markets will lead to a rise in the level of importation of Africa’s petroleum products. Put differently,
if the governments of the US and EU decided to raise revenue and protect their economies through
imposition of higher tariffs on petroleum products from Africa, it would lead to a reduction in
petroleum products import. Thus, for every 100% rise in preferential tariff rates, there will be 0.6%
and 0.2% increase in the US and EU imports of petroleum products. The effect of tariffs on
petroleum products is very minimal in the US compared to that of the EU.
The non-tariff barriers, another measure of market access condition have inverse relationship with
petroleum products imports in the US and EU. This means that whenever there is increase in the
incidence of NTBs in economies of these trading partners, there will be reduction in Africa’s
petroleum products imports due to the fact that most of these petroleum products might not be able
to pass the test of these incidences of NTBs. However, if at all the products pass the standard and
other tests; they will not be able to scale through the safeguard measures if used. Thus, for every
100% increase in the incidence of NTBs, there will be 6.5% and 5% decrease in the US and EU
imports of Africa’s petroleum products, respectively. From this result, it could be seen that the effect
of incidence(s) of NTBs on Africa’s petroleum products is more felt in the EU than in the US.
Distance, a measure of trade costs shows that it has positive relationship with Africa’s petroleum
products import to the US. That is, in Africa trade relation with the US, distance did not act as
hindrance or a barrier to the flow of Africa’s petroleum sector’s products to the US, though, it is
statistical insignificant. However, distance inhibit the free flow of Africa’s petroleum products to the
EU, such that for any additional trade cost incurred in the cause of exporting to the EU, there will
be a significant 0.0008% reduction in the EU import. The implication of this result is that trade cost
as measured by the distance must be considered before embarking on the export of petroleum
products to the EU markets, though the magnitude indicates that it is negligible. This also indicates
that, Africa’s petroleum products that will be exported to countries in the EU that are far from
Africa will be small compared to those countries that are close to the continent.
VI. Conclusion and Recommendation
This study has determined the effects of non-tariff barriers on Africa’s exports. The results of the
sectoral analyses show that the inadequate supply response (output) of the industrial product had
reduced the level of African exports to the EU and USA, while an increase in the price of African
industrial products will reduce the consumption of these products and therefore, the export of the
products will decline. The trade agreements between Africa and these trade partners had contributed
positively to the access of industrial products to these markets. Preferential tariffs granted to African
countries had enhanced the flow of African industrial products to these markets. While the
incidences of non-tariff barriers that were imposed by these trade partners tend to reduce African
industrial products access to these markets. The distance, which is a measure of trade cost, serves as
a barrier to the trade between Africa and the EU as well as the USA.
In terms of agricultural sector, the results show that the low supply response (output) of African
countries had led to the decline in market access of the products to the EU and USA. The high
prices of agricultural products due to high cost of production from the inefficient production
processes led to the decline in the consumption of these products. Most of the agreements on trade
between these trade partners were not fulfilled and this had made the agreements to have little
impact on African agricultural products’ access to the EU and USA. Preferential agricultural tariffs
granted to African countries tend to accelerate market access of these products to the EU and USA,
while the rise in the incidences of non-tariff barrier measures often decrease restrict agricultural
exports flow to these trade partners. Trade cost, measured by distance, did not restrict African
agricultural exports to the USA, but it did for the EU.
In the petroleum sector analysis, the increased supply response of petroleum products tends to
enhance or improve market access of the products in both markets. The increase in the prices of
petroleum products did not reduce the demand of these products in the USA; this is because of the
importance and necessity of the products to the consumers in this country. However, in the EU, any
rise in this products prices will reduce the consumption of the products and therefore, the export of
the products will fall. The results also indicate that trade agreements did not contribute to the flow
of petroleum products in these two markets. This means that the supply of these products go beyond
these agreements, but, are determined by the Organisation of Petroleum Exporting Countries
(OPEC). The reductions in tariffs through preferential tariffs are propelling factors that accelerate
the export of petroleum products to these markets. However, the incidences of non-tariff barrier
measures would restrict the flow of these products to the EU and USA. Trade costs as measured by
the distance between Africa and these trade partners, indicate that in the EU, distance is an
inhibiting factor. While in the USA, distance did not restrict export of African countries.
Thus, this study concludes that African exports have not been gaining access to both the EU and
USA markets not because of the tariffs imposed on these products, but as a result of the various
non-tariff barriers imposed. Also, these NTBs retarded Africa’s export supply such that the
continent cannot meet up with the demand for her exports at these trade partners’ markets. The trade
agreements could be used to propel Africa’s exports in all products except petroleum products, this
is because export of these products goes beyond trade agreements and it involved Organisation of
Petroleum Exporting Countries (OPEC) quota arrangements. However, descriptively, the study

concludes that products of relevance to African countries are confronted with higher NTBs in the
EU than USA even the period of global economic crisis. In addition, tariffs are not the main
hindrances to Africa’s access to the EU and USA since the continent enjoys preferential tariff rates,
rather, it is the non-tariff barrier measures used by these countries that inhibit the continent’s
exports.
ReferencesAnderson, J.E. (1979) “A Theoretical Foundation for the Gravity Equation”, American Economic
Review, Vol. 69.
Andrianmananjara, S., Dean, J.M., Feinberg, R., Ferrantino, M., Ludema, R. And M., Tsigas (2004)“The Effects of Non-Tariff Measures on Prices, Trade and Welfare: CGEImplementation of Policy-Based Price Comparisons “, USITC Economics WorkingPaper, No. 2004-04.A
Baltagi, B.H., (2001) “Econometric Analysis of Panel Data”, Second Edition, West Sussex, John
Wiley & Son.
Bergstrand, J.H (1985) “The Gravity Equation in International Trade: Some MicroeconomicFoundations and Empirical Evidence”, Review of Economic and Statistic, vol. 67,pp.34 -78.
Bergstrand, J.H. (1990) “The Heckscher – Ohlin – Samuelson Model, the Linder Hypothesis, andthe Determinants of Bilateral Intra – Industry Trade”, Economic Journal, December,vol.100, pp.1219 -1229.
Carrere, C., De Melo, J. and B., Tumurchudur (2009) “Disentangling Market Access Effects ofPreferential Trading Arrangements with an Application for ASEAN Members underan ASEAN – EU FTA”, The World Economy, 10.1111/j.1467 – 9701.
Dean, J.M, Feinberg, R., Signoret, J.E., Ferrantino, M. And R., Ludema (2009) “Estimating thePrice Effects of Non-Tariff Barriers”, Office of Economics Working Paper, U.S.International Trade Commission, No. 2006-06-A(r).
Estevadeordal, A. and R. Robertson (2002) “From Distant Partners to close Neighbours” The FTAAand the pattern of trade, Integration, Trade and Hemispheric issues Division, Inter-American Development Bank.
Evenett, S. and W. Keller (2003) “On Theories Explaining the Success of the Gravity Equation”Journal of Political Economy, vol. 110, No. 281-316.
Francois, J., Hoekman, B. and M., Manchin (2005) “Preference Erosion and Multilateral TradeLiberalization”, Institute for International Integration Studies Discussion Paper,No.87, August.
Fugazza, M. and J., Maur (2006) “Non-Tariff Barriers in a Non-Tariff World” ConferenceProceedings of the Ninth GTAP Annual Conference on Global Economic Analysis,Addis Ababa.

Gawande, K. and H., Li (2005) “Trade Barriers as Bargaining Outcomes”, The World Economy,vol. 29 (4), pp. 437-57.
Greene, W.H., (2003) “Econometric Analysis”, Third Edition, New Jersey, Prentice Hall.
Grossman, G. and E., Helpman (1995) “The Politics of Free – Trade Agreements”, AmericanEconomic Review, pp.667 – 90, September.
Hammouda, H.B., Karingi, S., and R., Perez, (2005), “Unrestricted Market Access for Sub-SaharanAfrican: Important Benefits with Little Cost to the QUAD”, UNECA ATPC Work inProgress, No. 11.
Haveman, J. And J.G., Thursby (2000) “The Impact of Tariff and Non-Tariff Barriers to Trade inAgricultural Commodities: A Disaggregated Approach”, Purdue CIBER WorkingPaper, Paper 143.
Haveman,J., Nair-Reichert, U. And J.G., Thursby (1999) “Trade Reduction, Diversion andCompression: Empirical Regularization in the Effects of Protective Measures”,Working Paper, Purdue University.
Helpman, E. and P. Krugman (1985) “Market Structure and Foreign Trade” Cambridge, MA: MITPress.
Hsiao, C. (1985) “Benefits and Limitations of Panel Data”, Econometric Review, Taylor andFrancis Journals, vol.4(1), pp 121-74.
Hsiao, C. (1986) “Reply”, Econometric Review, Taylor and Francis Journals, vol.4(1), pp 187-89.
Ianchovichina, E., Matoo, A. and M., Olarreaga (2001) “Unrestricted Market Access for sub-Saharan Africa: How Much is it Worth and Who Pays?” Journal of AfricanEconomies, vol.10, no.4, pp.410-32.
Jabati, M.C. (2003) “Market Access for Developing Countries of Africa: The Reality” AGSFOccasional Paper No.1, United Nations Food and Agriculture Organisation. Rome.
Kareem, O.I. (2010) “The Effects of Market Access Conditions on Africa’s Exports” AnUnpublished Thesis Submitted to the Faculty of The Social Sciences, University ofIbadan, Ibadan, Nigeria.
Kee, H.L., Nicita, A. and A., Olarreaga (2006) “Estimating Trade Restrictiveness Indices”, WorldBank Policy Research Working Paper 3840, February.
Klevmarken, N.A. (1989) “Introduction”, European Economic Review, Elsevier, vol.33(2-3),
pp523-29.
Krugman, P.R. (1980) “Scale Economies, Product Differentiation, and the Pattern of Trade”, American Economic Review, pp 950-59.
Linnemann, H. (1966) “An Econometric Study of International Trade Flows” Amsterdam, North-Holland.
Linnemann, H. and H. Verbruggen (1991) “GSTP Tariff Reduction and its effects on South-SouthTrade in Manufactures”, World Development, vol.19.
Mayer, T. and S. Zignago (2005) “Market Access in Global and Regional Trade”, CEP II WorkingPaper, No. 2005-02.
Martinez, G. M. and N., Poole (2004) “The development of private fresh produce safety standards:implications for developing Mediterranean exporting countries”, Food Policy, 29 (3).pp. 229-255.
Milgram, J. (2004) “Quantitative Restrictiveness on Clothing Imports: Impact and Determinants ofthe Common Trade Policy Towards Developing Countries”, Funacion Centro deEstudies Andaluces, Documento de Trabajo, Series Economia E2003/04.
Ogunkola, E.O., and T.A. Oyejide (2001), “Market Access for Nigeria’s Exports in the EuropeanUnion: An Assessment of the Impact of the Lome Convention and the UruguayRound,” Nigerian Journal of Economic and Social Studies, Vol. 43, No. 1.
Pacific Economic Cooperation Council (2000) “Non-Tariff Measures in Goods and Services”, Areport of the Pacific Economic Cooperation Council, 2000.
Pelikan, J. and M., Brockmeier (2008) “Tariff Aggregation and Market Access: An EmpiricalAssessment for Canada and the EU”, Canadian Journal of Agricultural Economics,vol. 56, pp.413 – 27.
Piermartini, R. (2006) “Trade Liberalization and Growth: Market Access Advantage”, DiscussionPaper Series in Economics and Econometrics, 0007, Economics Division, School ofSocial Sciences, University of Southamton.
Poyhonen, P. (1963) “A Tentative Model for the Volume of Trade Between Countries”,Weltwirtschaftliches Archive, vol.90, pp.93-100.
Rich, K.M., Perry, B.D. and S., Katibie (2009) “Commodity – Based Trade and Market Access forDeveloping Contry Livestock Products: The Case of Beef Exports from Ethiopia”,International Food and Agribusiness Management Review, Vol.12, issue 3.
Sanguinetti, P., Traistaru, I. and C. Martincus (2004) “The Impact of South-South Preferential TradeAgreements on Industrial Development: An Empirical Test”, A Paper Presented atthe 3rd Workshop of the Regional Integration Network (RIN), Punta del Este2004.
Saqib, M. and N., Taneja (2005) “Non-Tariff Barriers and India’s Exports: The Case of ASEAN andSRI LANKA”, ICRIER Working Paper, No.165.
Shepherd, B. And N. L., Wilson (2000) “ Product Standards and Developing Country AgriculturalExports: The Case of the European Union”, Working Paper, 2010.
Solon, G. (1989) “The Value of Panel Data in economic Research”, in Daniel K., Greg D., Graham K., and M.P., Singh (eds.), Panel Survey, pp 486-96, New York: Wiley,
Tinbergen, J, (1962) “Shaping the World Economy Suggestions for an International EconomicPolicy”, the Twentieth Century Fund.
World Bank (2012) “De-Fragmenting Africa: Deepening Regional Trade Integration in Goods andServices” Publisher, The World Bank, NW, Washington D.C.
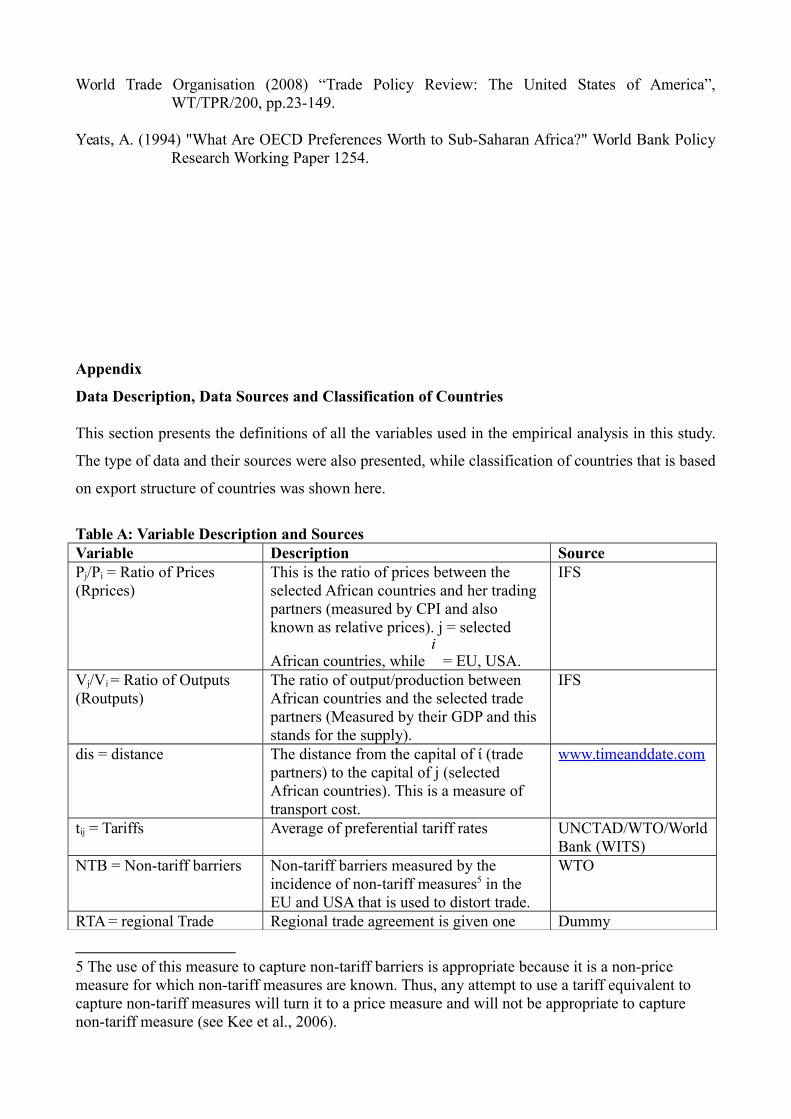
World Trade Organisation (2008) “Trade Policy Review: The United States of America”,WT/TPR/200, pp.23-149.
Yeats, A. (1994) "What Are OECD Preferences Worth to Sub-Saharan Africa?" World Bank PolicyResearch Working Paper 1254.
Appendix
Data Description, Data Sources and Classification of Countries
This section presents the definitions of all the variables used in the empirical analysis in this study.
The type of data and their sources were also presented, while classification of countries that is based
on export structure of countries was shown here.
Table A: Variable Description and SourcesVariable Description SourcePj/Pi = Ratio of Prices (Rprices)
This is the ratio of prices between the selected African countries and her trading partners (measured by CPI and also known as relative prices). j = selected
African countries, while i
= EU, USA.
IFS
Vj/Vi = Ratio of Outputs (Routputs)
The ratio of output/production between African countries and the selected trade partners (Measured by their GDP and this stands for the supply).
IFS
dis = distance The distance from the capital of ί (trade partners) to the capital of j (selected African countries). This is a measure of transport cost.
www.timeanddate.com
tij = Tariffs Average of preferential tariff rates UNCTAD/WTO/WorldBank (WITS)
NTB = Non-tariff barriers Non-tariff barriers measured by the incidence of non-tariff measures5 in the EU and USA that is used to distort trade.
WTO
RTA = regional Trade Regional trade agreement is given one Dummy
5 The use of this measure to capture non-tariff barriers is appropriate because it is a non-price measure for which non-tariff measures are known. Thus, any attempt to use a tariff equivalent to capture non-tariff measures will turn it to a price measure and will not be appropriate to capture non-tariff measure (see Kee et al., 2006).
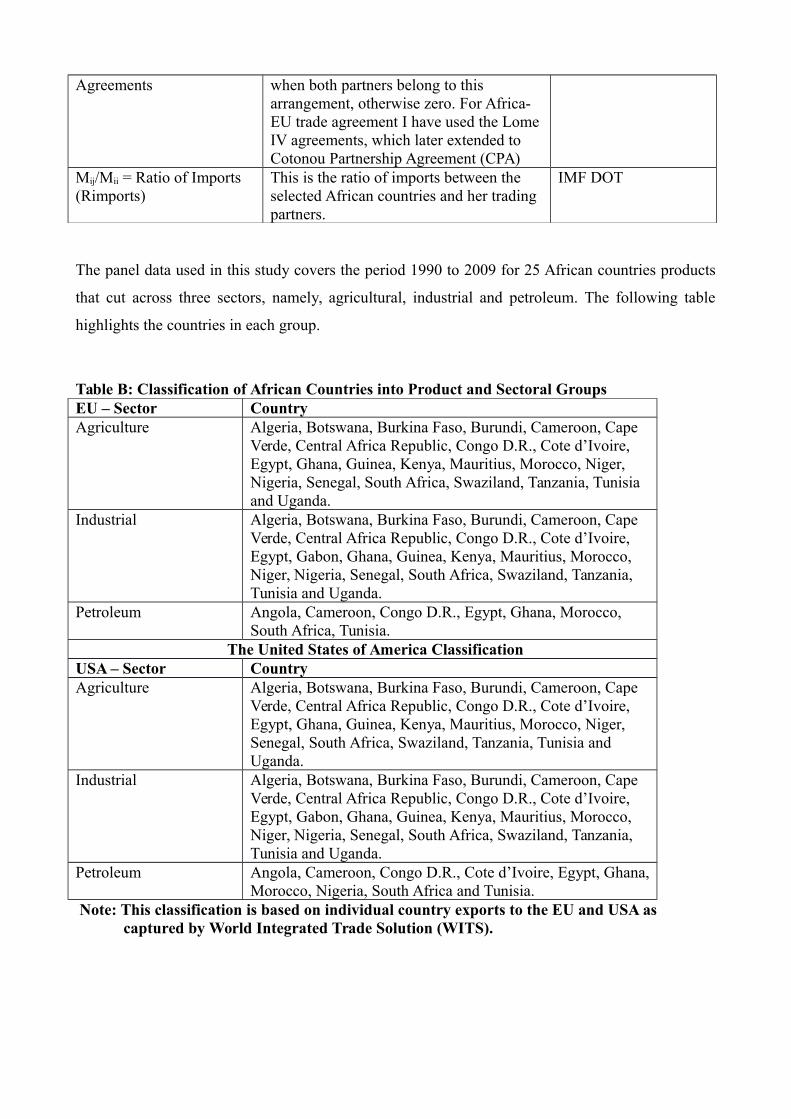
Agreements when both partners belong to this arrangement, otherwise zero. For Africa-EU trade agreement I have used the Lome IV agreements, which later extended to Cotonou Partnership Agreement (CPA)
Mij/Mii = Ratio of Imports (Rimports)
This is the ratio of imports between the selected African countries and her trading partners.
IMF DOT
The panel data used in this study covers the period 1990 to 2009 for 25 African countries products
that cut across three sectors, namely, agricultural, industrial and petroleum. The following table
highlights the countries in each group.
Table B: Classification of African Countries into Product and Sectoral GroupsEU – Sector CountryAgriculture Algeria, Botswana, Burkina Faso, Burundi, Cameroon, Cape
Verde, Central Africa Republic, Congo D.R., Cote d’Ivoire, Egypt, Ghana, Guinea, Kenya, Mauritius, Morocco, Niger, Nigeria, Senegal, South Africa, Swaziland, Tanzania, Tunisia and Uganda.
Industrial Algeria, Botswana, Burkina Faso, Burundi, Cameroon, Cape Verde, Central Africa Republic, Congo D.R., Cote d’Ivoire, Egypt, Gabon, Ghana, Guinea, Kenya, Mauritius, Morocco, Niger, Nigeria, Senegal, South Africa, Swaziland, Tanzania, Tunisia and Uganda.
Petroleum Angola, Cameroon, Congo D.R., Egypt, Ghana, Morocco, South Africa, Tunisia.
The United States of America ClassificationUSA – Sector CountryAgriculture Algeria, Botswana, Burkina Faso, Burundi, Cameroon, Cape
Verde, Central Africa Republic, Congo D.R., Cote d’Ivoire, Egypt, Ghana, Guinea, Kenya, Mauritius, Morocco, Niger, Senegal, South Africa, Swaziland, Tanzania, Tunisia and Uganda.
Industrial Algeria, Botswana, Burkina Faso, Burundi, Cameroon, Cape Verde, Central Africa Republic, Congo D.R., Cote d’Ivoire, Egypt, Gabon, Ghana, Guinea, Kenya, Mauritius, Morocco, Niger, Nigeria, Senegal, South Africa, Swaziland, Tanzania, Tunisia and Uganda.
Petroleum Angola, Cameroon, Congo D.R., Cote d’Ivoire, Egypt, Ghana,Morocco, Nigeria, South Africa and Tunisia.
Note: This classification is based on individual country exports to the EU and USA as captured by World Integrated Trade Solution (WITS).