
Nola du Toit Cathy Haggerty
23
Nola du Toit Cathy Haggerty Instability Overlooked: Evidence of the Importance of Household Roster Data Collection and Matching Over Time
-
Upload
kelly-meyer -
Category
Documents
-
view
49 -
download
2
description
Instability Overlooked: Evidence of the Importance of Household Roster Data Collection and Matching Over Time. Nola du Toit Cathy Haggerty. Background: Instability. Relationship Instability Divorce or dissolution of cohabiting union Children wellbeing ( Amato and Sobolewski 2001) - PowerPoint PPT Presentation
Transcript of Nola du Toit Cathy Haggerty
Nola du Toit
Cathy Haggerty
Instability Overlooked: Evidence of the Importance of Household Roster Data Collection and Matching Over Time
2
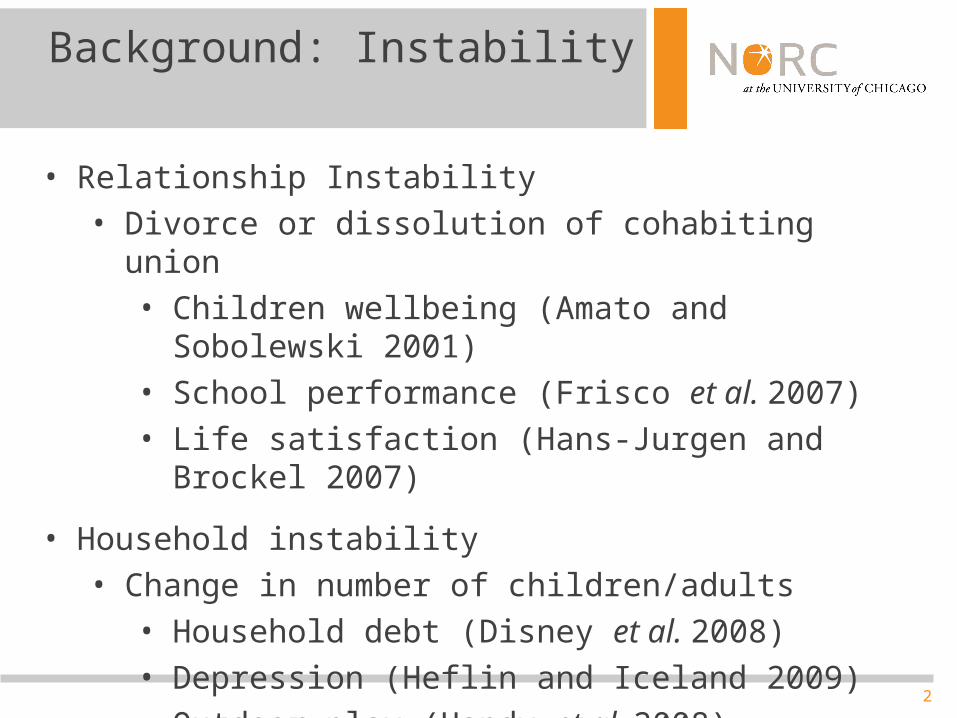
Background: Instability
• Relationship Instability • Divorce or dissolution of cohabiting union
• Children wellbeing (Amato and Sobolewski 2001) • School performance (Frisco et al. 2007)• Life satisfaction (Hans-Jurgen and Brockel 2007)
• Household instability• Change in number of children/adults
• Household debt (Disney et al. 2008)• Depression (Heflin and Iceland 2009)• Outdoor play (Handy et al. 2008)
3
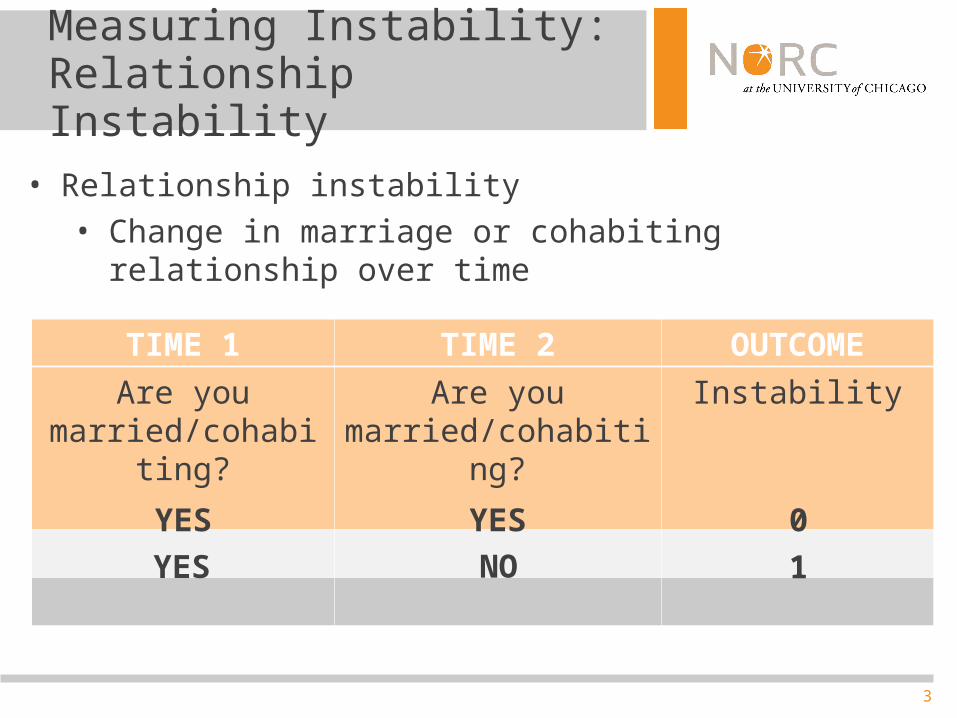
Measuring Instability: Relationship Instability
• Relationship instability • Change in marriage or cohabiting relationship over
time
TIME 1 TIME 2 OUTCOME
Are you married/cohabiting?
Are you married/cohabiting?
Instability
YES YES 0
YES NO 1
4
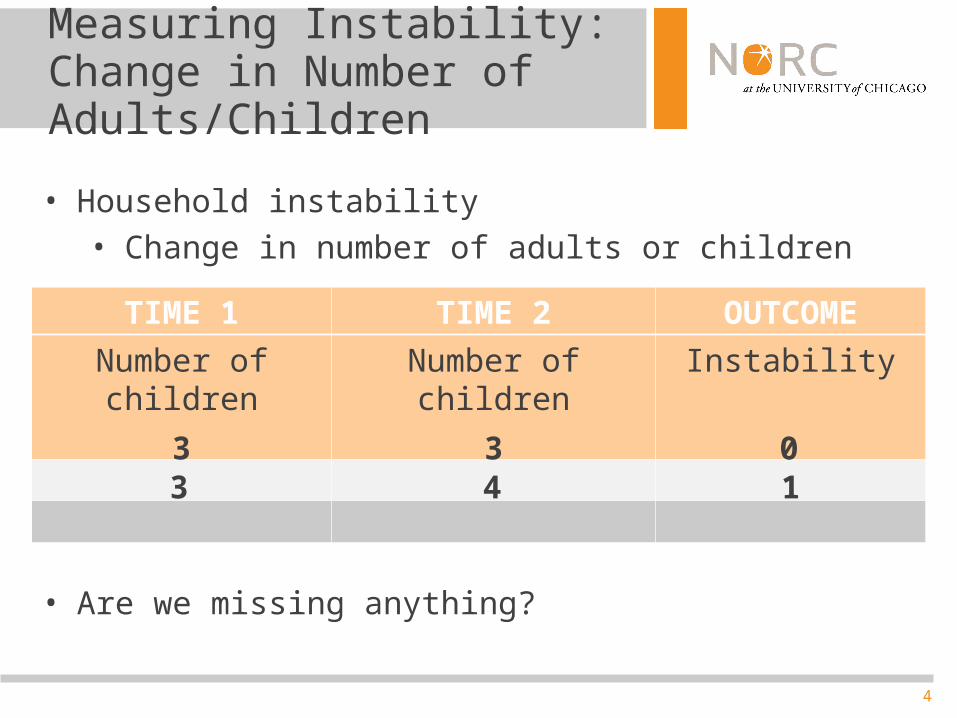
Measuring Instability: Change in Number of Adults/Children
• Household instability• Change in number of adults or children
• Are we missing anything?
TIME 1 TIME 2 OUTCOME
Number of children Number of children Instability
3 3 03 4 1
5
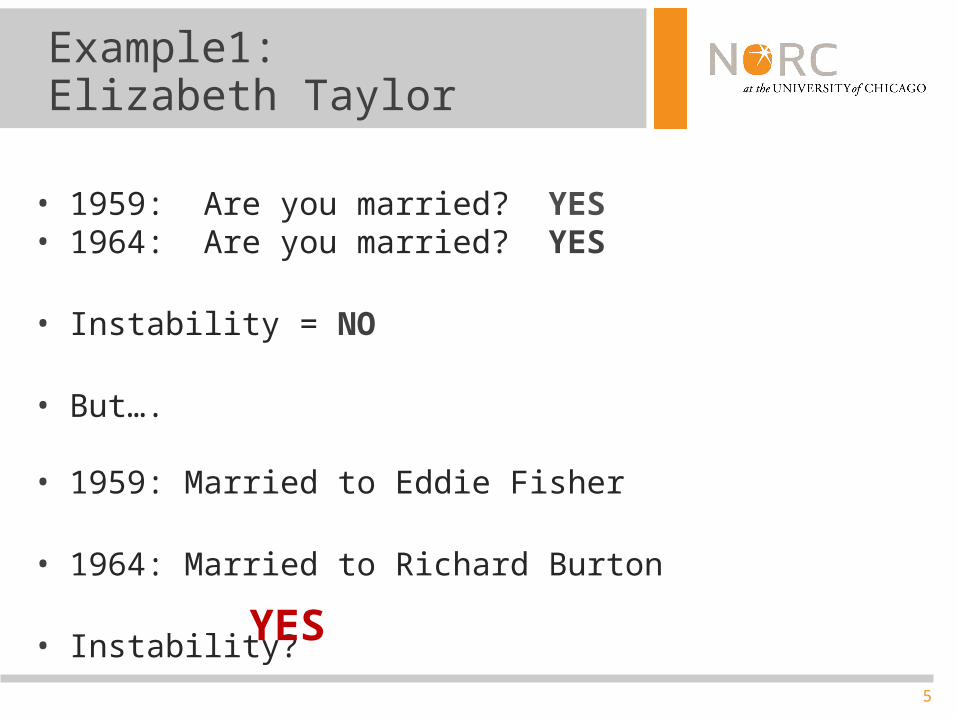
• 1959: Are you married? YES• 1964: Are you married? YES
• Instability = NO
• But….
• 1959: Married to Eddie Fisher
• 1964: Married to Richard Burton
• Instability?
Example1:Elizabeth Taylor
YES
6
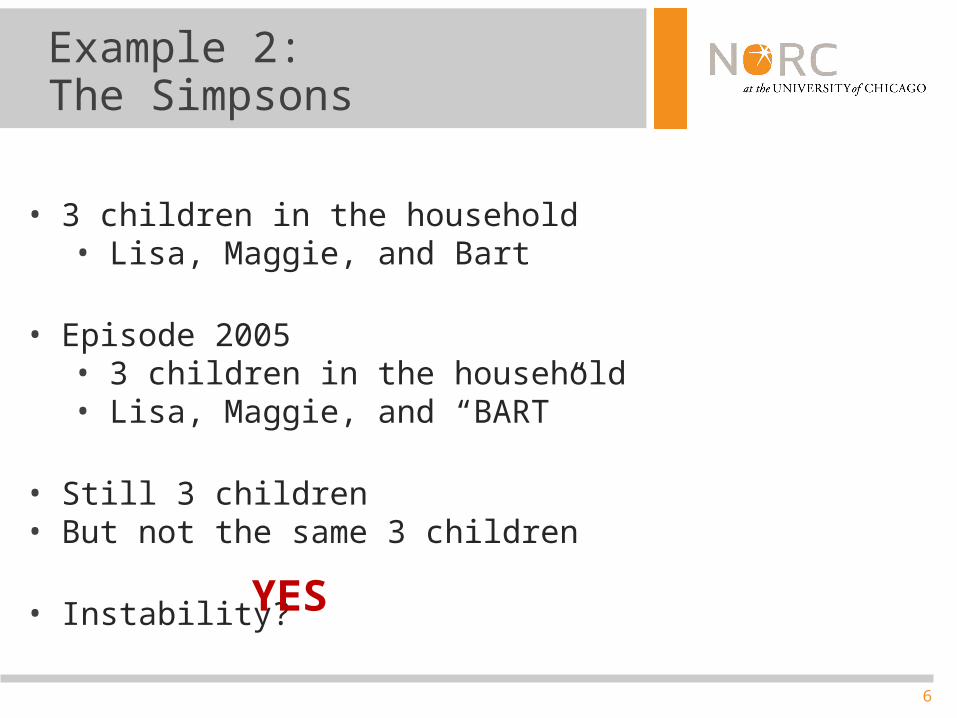
• 3 children in the household• Lisa, Maggie, and Bart
• Episode 2005• 3 children in the household• Lisa, Maggie, and “BART”
• Still 3 children• But not the same 3 children
• Instability?
Example 2: The Simpsons
YES
7
Research Questions
• Is there another way to measure instability?
• How much instability is overlooked by current measures?
• Does it matter?
8
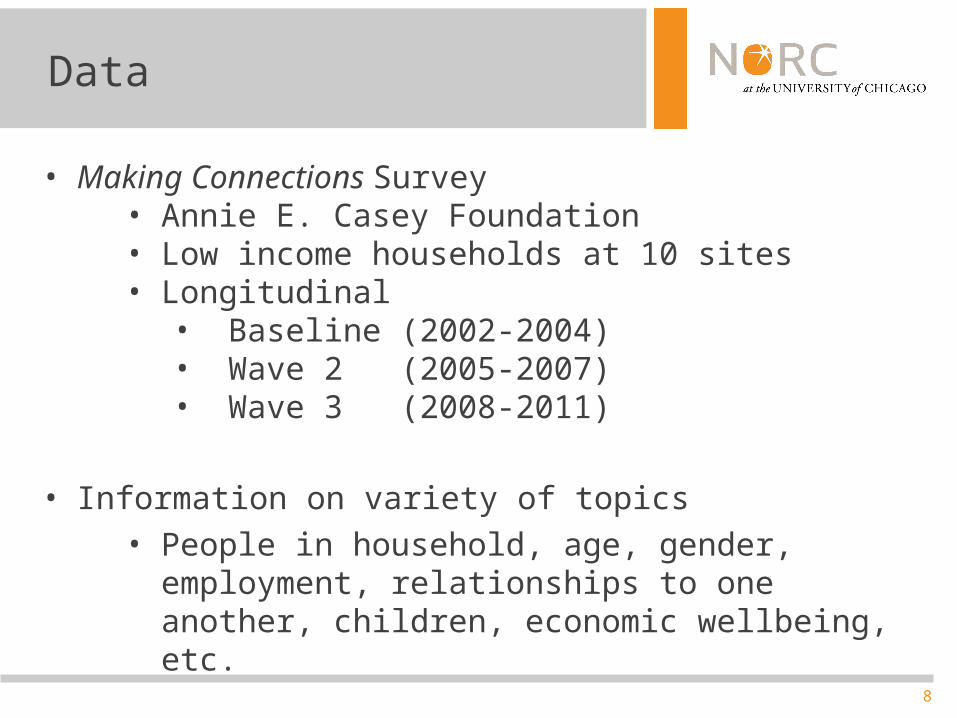
Data
• Making Connections Survey• Annie E. Casey Foundation• Low income households at 10 sites• Longitudinal
• Baseline (2002-2004)• Wave 2 (2005-2007)• Wave 3 (2008-2011)
• Information on variety of topics• People in household, age, gender, employment,
relationships to one another, children, economic wellbeing, etc.
9
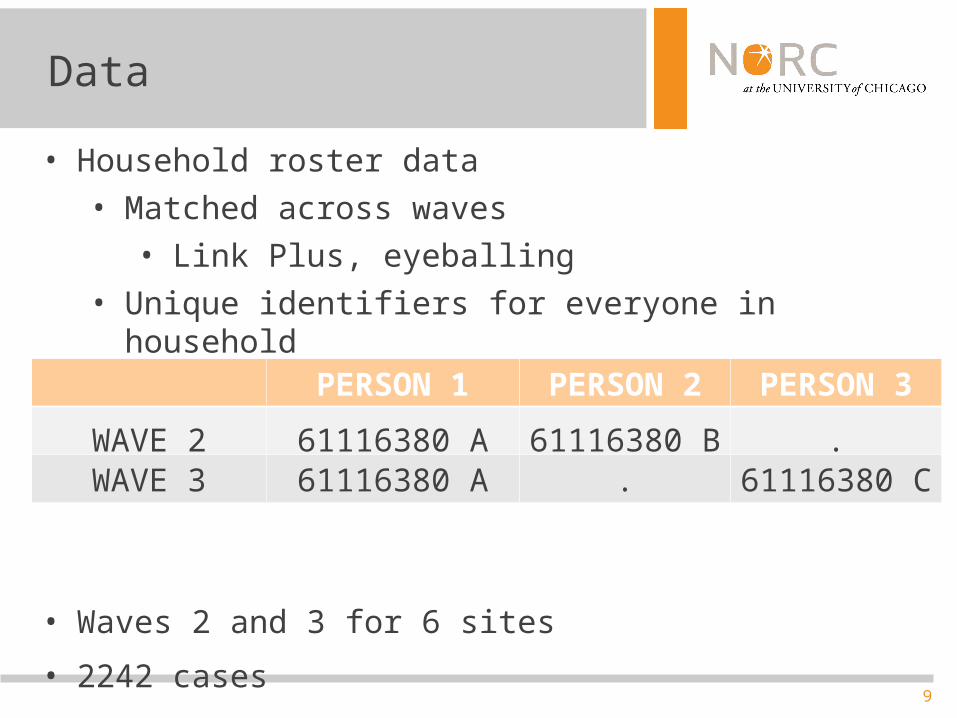
Data
• Household roster data
• Matched across waves
• Link Plus, eyeballing
• Unique identifiers for everyone in household
• Waves 2 and 3 for 6 sites
• 2242 cases
PERSON 1 PERSON 2 PERSON 3
WAVE 3 61116380 A . 61116380 CWAVE 2 61116380 A 61116380 B .
10
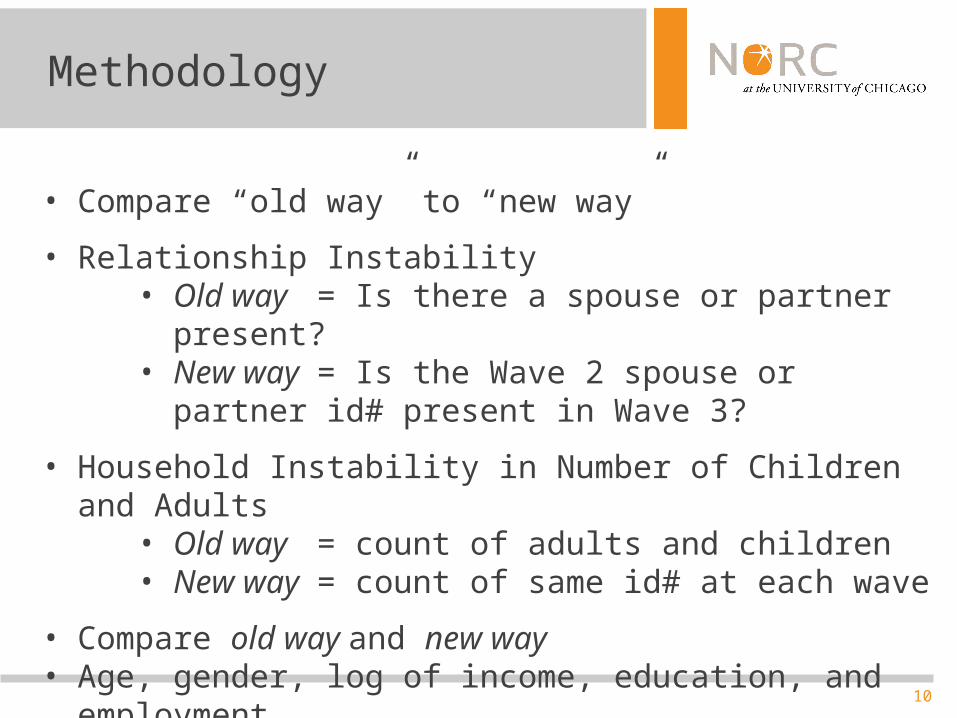
Methodology
• Compare “old way” to “new way”
• Relationship Instability• Old way = Is there a spouse or partner present?• New way = Is the Wave 2 spouse or partner id#
present in Wave 3?
• Household Instability in Number of Children and Adults• Old way = count of adults and children• New way = count of same id# at each wave
• Compare old way and new way• Age, gender, log of income, education, and employment
11
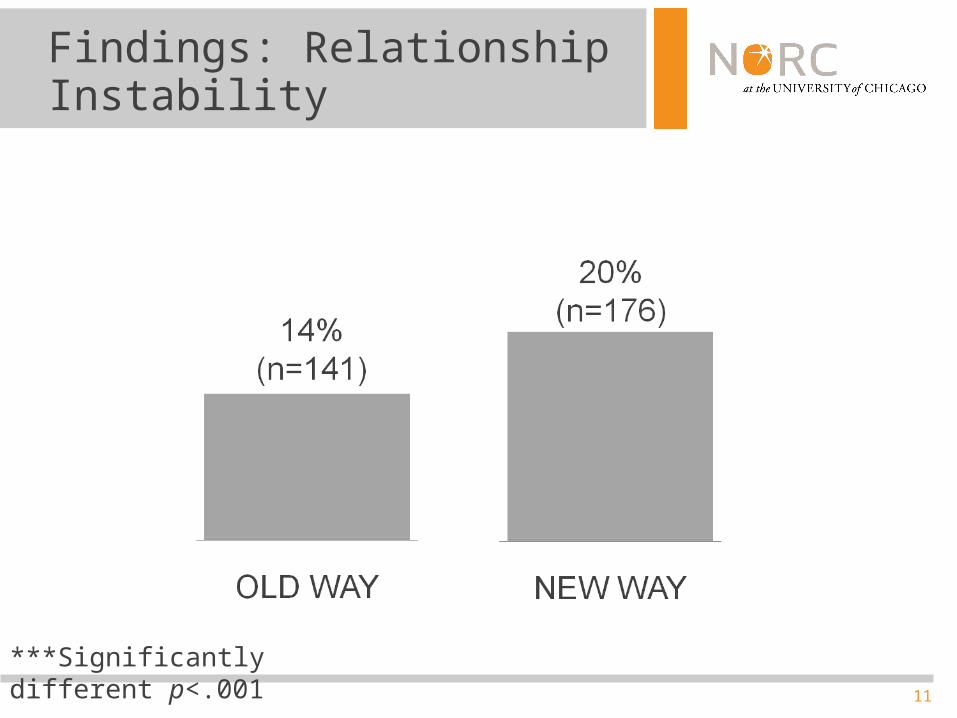
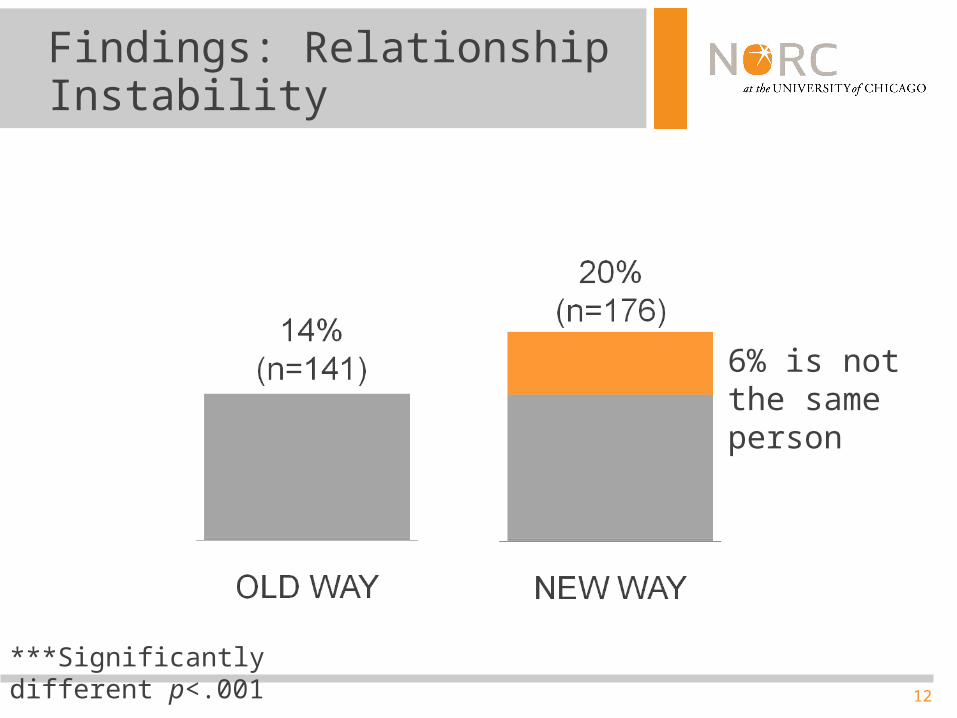
Findings: Relationship Instability
***Significantly different p<.001
12
Findings: Relationship Instability
6% is not the same person
***Significantly different p<.001
13
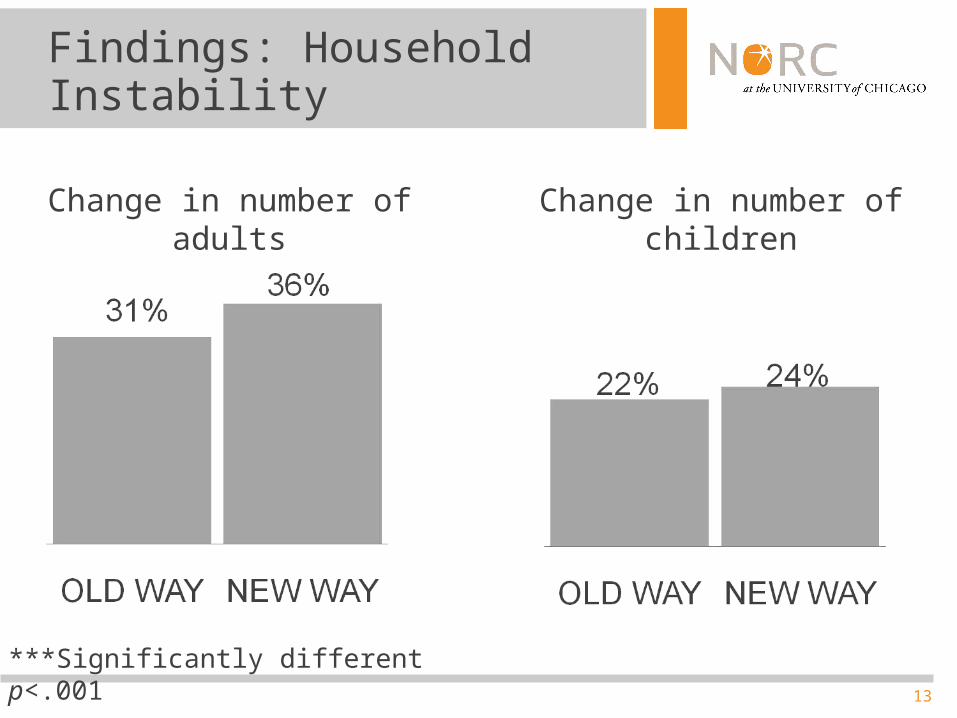
Findings: Household Instability
***Significantly different p<.001
Change in number of children
Change in number of adults
14
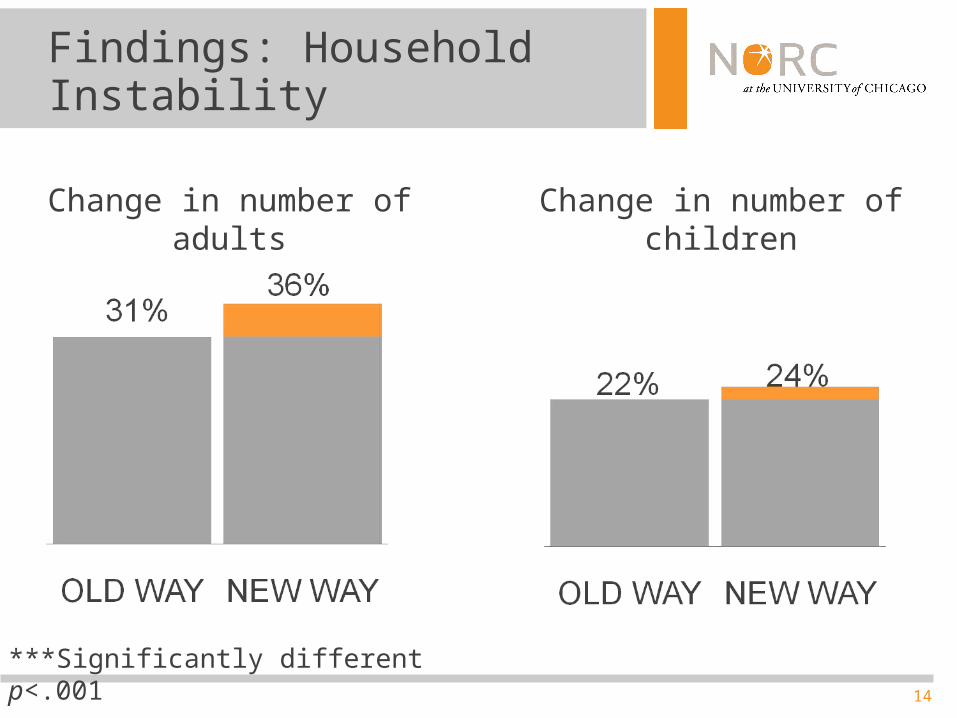
Findings: Household Instability
***Significantly different p<.001
Change in number of children
Change in number of adults
15
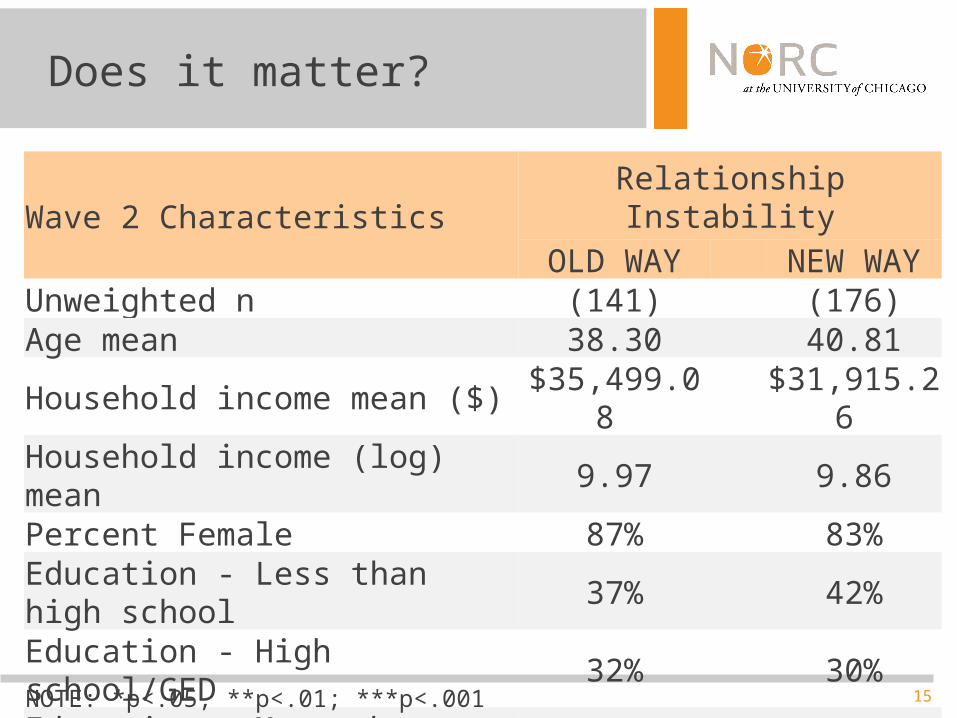
Does it matter?
Wave 2 CharacteristicsRelationship Instability
OLD WAY NEW WAYUnweighted n (141) (176)Age mean 38.30 40.81Household income mean ($) $35,499.08 $31,915.26 Household income (log) mean 9.97 9.86Percent Female 87% 83%Education - Less than high school 37% 42%Education - High school/GED 32% 30%Education - More than high school 31% 28%Employed respondent 56% 52%
NOTE: *p<.05, **p<.01; ***p<.001
16
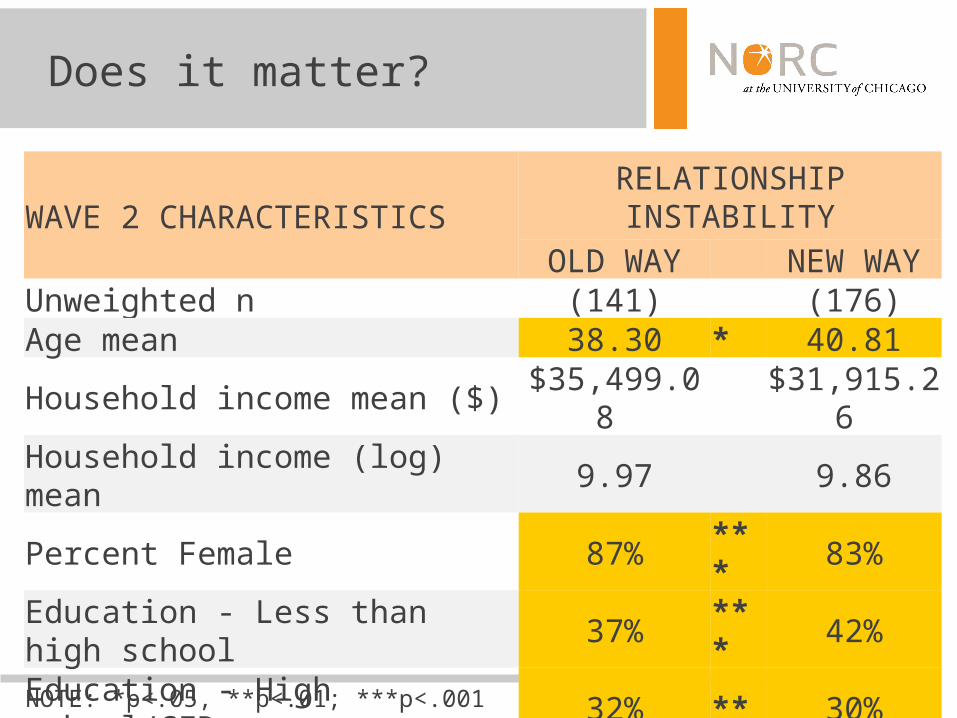
Does it matter?
WAVE 2 CHARACTERISTICSRELATIONSHIP
INSTABILITYOLD WAY NEW WAY
Unweighted n (141) (176)Age mean 38.30 * 40.81Household income mean ($) $35,499.08 $31,915.26 Household income (log) mean 9.97 9.86Percent Female 87% *** 83%Education - Less than high school 37% *** 42%Education - High school/GED 32% ** 30%Education - More than high school 31% *** 28%Employed respondent 56% *** 52%
NOTE: *p<.05, **p<.01; ***p<.001
17
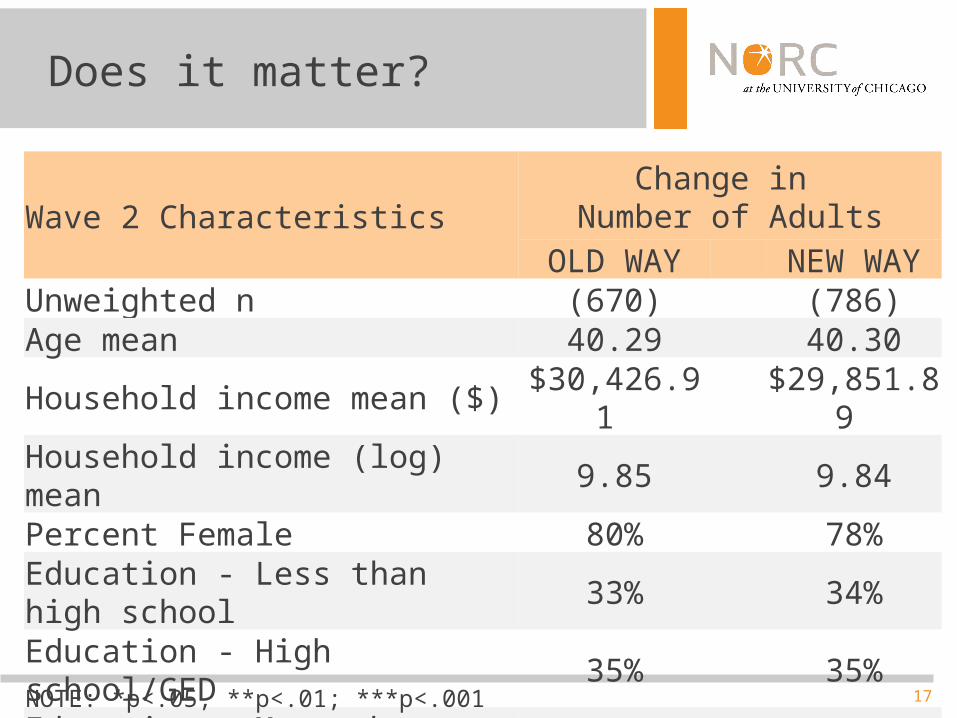
Does it matter?
Wave 2 CharacteristicsChange in
Number of AdultsOLD WAY NEW WAY
Unweighted n (670) (786)Age mean 40.29 40.30Household income mean ($) $30,426.91 $29,851.89 Household income (log) mean 9.85 9.84Percent Female 80% 78%Education - Less than high school 33% 34%Education - High school/GED 35% 35%Education - More than high school 31% 31%Employed respondent 58% 58%
NOTE: *p<.05, **p<.01; ***p<.001
18
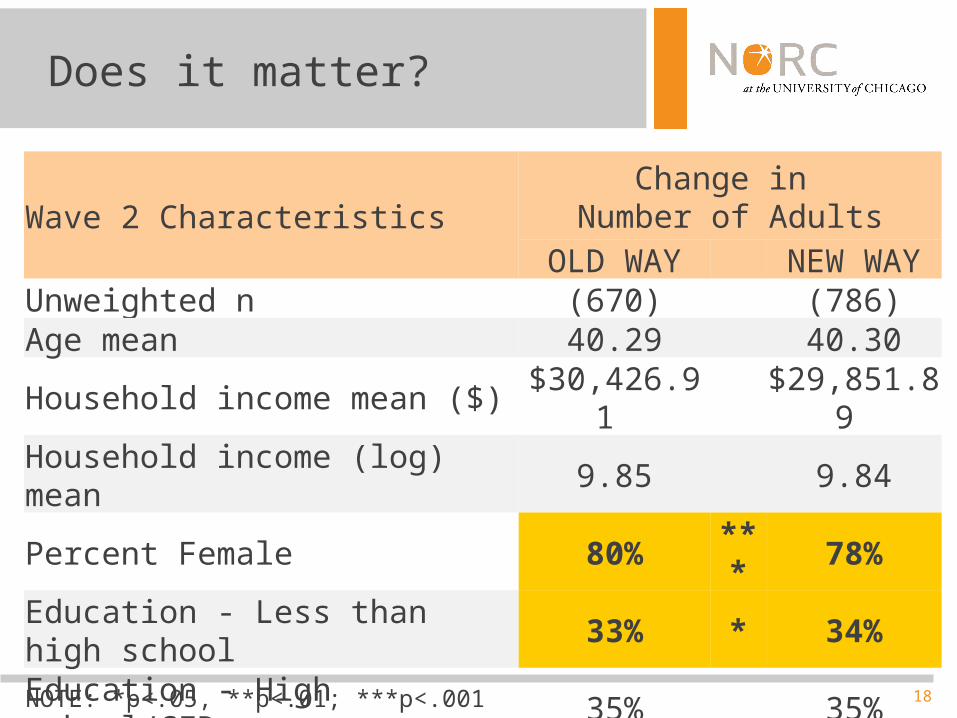
Does it matter?
Wave 2 CharacteristicsChange in
Number of AdultsOLD WAY NEW WAY
Unweighted n (670) (786)Age mean 40.29 40.30Household income mean ($) $30,426.91 $29,851.89 Household income (log) mean 9.85 9.84Percent Female 80% *** 78%Education - Less than high school 33% * 34%Education - High school/GED 35% 35%Education - More than high school 31% 31%Employed respondent 58% 58%
NOTE: *p<.05, **p<.01; ***p<.001

19
Does it matter?
Wave 2 CharacteristicsChange in
Number of AdultsOLD WAY NEW WAY
Unweighted n (511) (544)Age mean 35.56 35.62Household income mean ($) $26,994.62 $26,187.39 Household income (log) mean 9.73 9.72Percent Female 85% 85%Education - Less than high school 38% 38%Education - High school/GED 33% 34%Education - More than high school 28% 27%Employed respondent 59% 60%
NOTE: *p<.05, **p<.01; ***p<.001
20
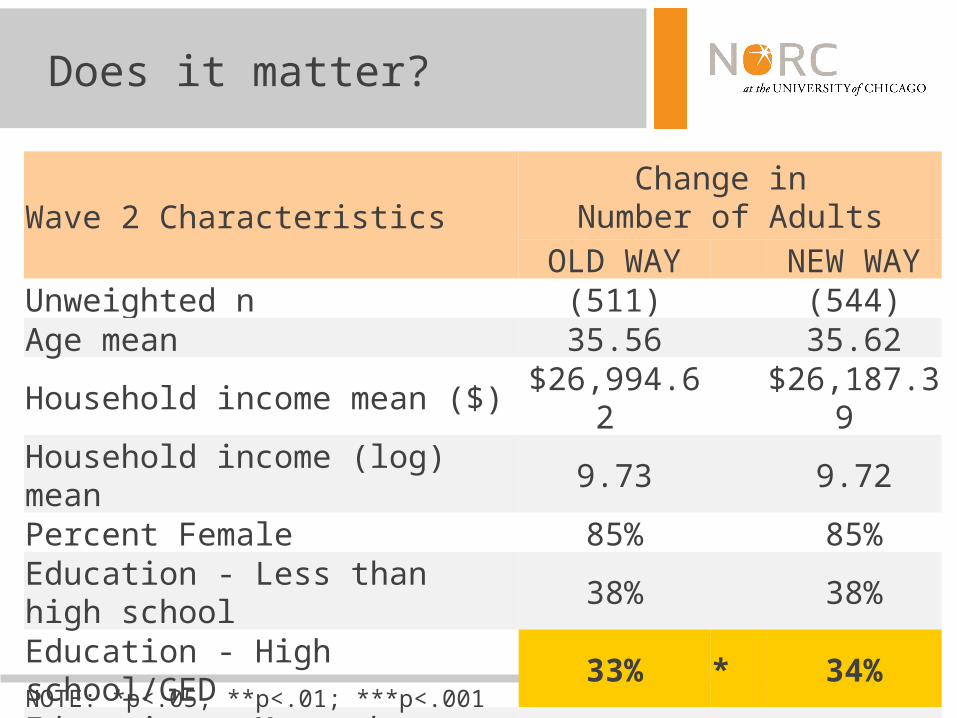
Does it matter?
Wave 2 CharacteristicsChange in
Number of AdultsOLD WAY NEW WAY
Unweighted n (511) (544)Age mean 35.56 35.62Household income mean ($) $26,994.62 $26,187.39 Household income (log) mean 9.73 9.72Percent Female 85% 85%Education - Less than high school 38% 38%Education - High school/GED 33% * 34%Education - More than high school 28% 27%Employed respondent 59% * 60%
NOTE: *p<.05, **p<.01; ***p<.001
21
Conclusions
• Is there another way to measure instability?• Roster matching and unique person identifiers add
depth
• How much instability is overlooked by current measures?• Old way overlooks significant amount of instability
• Does it matter?• Characteristics are significantly different
22
Conclusions
• Study is important• Household rosters are important part of questionnaire• Roster matching and unique identifiers add depth• Substantive topics are enhanced by the added details
• Limitations to roster matching and unique identifiers• Burdensome process• Ideal for longitudinal surveys
• But can be incorporated into cross-sectional surveys
• Very beneficial to capturing the whole picture