Noise Report PDF - Placer County, California
85
Prepared for: Attn: Nick Pappani 1501 Sports Drive Sacramento, CA 95834 Prepared by: j.c. brennan & associates, Inc. Jim Brennan, INCE President Member, Institute of Noise Control Engineering (INCE) Mill Creek EIR Placer County, California October 13, 2017 jcb Project # 2016-220 1287 High Street, Auburn, California 95603 * 530-823-0960 (p) * (530)823-0961 (f)
Transcript of Noise Report PDF - Placer County, California

Prepared for:
Attn: Nick Pappani1501 Sports DriveSacramento, CA 95834
Prepared by:
j.c. brennan & associates, Inc.
Jim Brennan, INCEPresidentMember, Institute of Noise Control Engineering (INCE)
Mill Creek EIR
Placer County, California
October 13, 2017
jcb Project # 2016-220
1287 High Street, Auburn, California 95603 * 530-823-0960 (p) * (530)823-0961 (f)

Table of Contents
INTRODUCTION ......................................................................................................................1 Project Overview.....................................................................................................................1 ENVIRONMENTAL SETTING ..................................................................................................3
Background Information on Noise and Vibration...................................................................3 Fundamentals of Acoustics ...............................................................................................3 Effects of Noise on People................................................................................................5
Existing Conditions................................................................................................................6 Surrounding Land Uses ........................................................................................................6 Existing Ambient Noise Levels..............................................................................................6 Existing Roadway Noise Levels ............................................................................................9
Existing Railroad Noise Levels............................................................................................10 Regulatory Context...............................................................................................................10
Federal ................................................................................................................................10 State....................................................................................................................................10
California Environmental Quality Act...............................................................................10 California State Building Codes ......................................................................................10
Placer County General Plan................................................................................................10 Placer County Noise Ordinance..........................................................................................13
Summary of Placer County Noise Standards..................................................................16 Transportation Noise.......................................................................................................16 Non-Transportation Noise ...............................................................................................16 Substantial Increase Criteria ...........................................................................................16
Vibration Standards.............................................................................................................17 IMPACTS AND MITIGATION MEASURES ...........................................................................17
Traffic Noise Impact Assessment Methodology..............................................................17 Construction Noise and Vibration Impact Methodology...................................................17 Thresholds of Significance ..................................................................................................18 Project-Specific Impacts and Mitigation Measures .............................................................19 Impact 1: Construction Noise at Sensitive Receptors .....................................................19 Impact 2: Construction Vibration at Sensitive Receptors ................................................20 Impact 3: Transportation Noise at Existing Sensitive Receptors.....................................24 Impact 4: Transportation Noise at New Sensitive Receptors..........................................23 Impact 5: Non-transportation Noise at Existing and New Sensitive Receptors...............25
List of Figures Figure 1: Project Site Plan and Location.......................................................................................2 Figure 2: Noise Measurement Locations ......................................................................................7 Figure 3: Tentative Subdivision Map...........................................................................................25
List of Tables Table 1: Typical Noise Levels .......................................................................................................4 Table 2: Existing Ambient Noise Monitoring Results ....................................................................8 Table 3: Existing Noise Levels and Distances to Contours ..........................................................9 Table 4: Allowable Ldn Noise Levels Within Specified Zone Districts Applicable to New Projects
Affected by or Including Non-Transportation Noise Sources ..........................................13 Table 5: Maximum Allowable Noise Exposure (Ldn) for Transportation Noise Sources.............13 Table 6: Hourly Exterior Noise Performance Standards for Stationary (Non-Transportation)
Noise Sources.................................................................................................................14 Table 7: Significance of Changes in Noise Exposure .................................................................16 Table 8: Effects of Vibration on People and Buildings ................................................................17 Table 9: Construction Equipment Noise .....................................................................................19 Table 10: Vibration Levels for Varying Construction Equipment.................................................19 Table 11: Predicted Traffic Noise Levels and Project-Related Traffic Noise Level Increases
(Existing Traffic Conditions) ............................................................................................22 Table 12: Predicted Traffic Noise Levels and Project-Related Traffic Noise Level Increases
(Cumulative Traffic Conditions).......................................................................................23 Table 13: Transportation Noise Levels at Proposed Residential Uses.......................................24 Table 14: Predicted Hourly Exterior Noise Levels at The Nearest Sensitive Receptors Recreational Areas..............................................................................................26 Table 15: Noise Measurement Results: Roseville Storage 24-Hour Measurement Site B..............................................................................27 Table 16: Predicted Hourly Exterior Noise Levels at The Nearest On-Site Receptors Roseville Storage................................................................................................28
List of Appendices
A Acoustical Terminology B 24-hour Noise Monitoring Data and Short Term Noise Monitoring Data C FHWA Traffic Noise Modeling Inputs and Results D Noise Barrier Inputs and Results E Linebar Inputs and Results

j.c. brennan & associates, Inc. Job # 2016-220
Environmental Noise AnalysisMill Creek EIR – Placer County, California
Page 1
INTRODUCTION
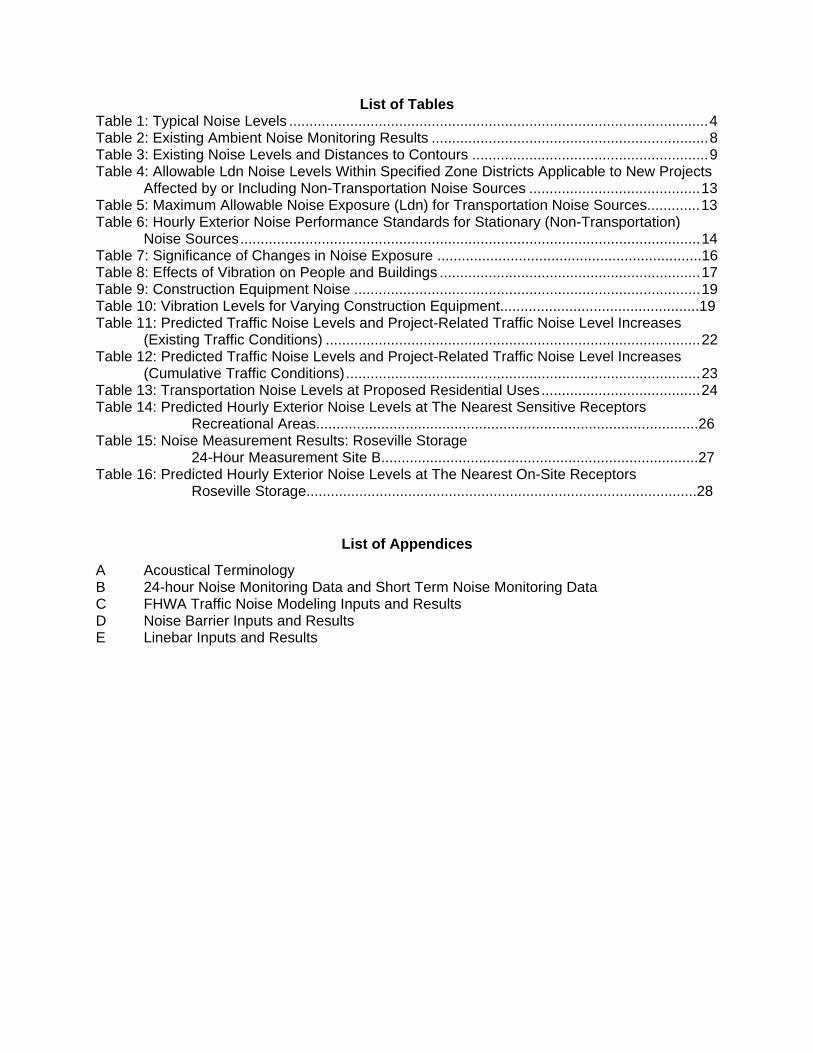
This report has been prepared to address the noise impacts due to and upon the Mill Creek project proposed by Meritage Homes. The proposed project site is located immediately south of PFE Road in the southern portion of the Dry Creek West Placer Community Plan (DCWPCP) area of unincorporated Placer County.
Figure 1 shows the project site plan and location.
PROJECT OVERVIEW
The proposed project is comprised of 110.1 acres owned by three families including APNs 474-130-007, -009, -010, -017, -018, -022, -024 and 474-120-017. Meritage Homes proposes to develop a residential community of 308 homes with three parks and open space. The community would be split into three residential villages with an average residential density of 3.8 units per acre.
The primary noise sources which may affect the project site include roadway traffic, rail operations, industrial uses, and on-site park use. Noise sources associated with the project which may impact adjacent uses include increased roadway traffic and on-site park uses.

j.c. brennan & associates, Inc. Job # 2016-220
Environmental Noise AnalysisMill Creek EIR – Placer County, California
Page 3
ENVIRONMENTAL SETTING
Background Information on Noise and Vibration
Fundamentals of Acoustics
Acoustics is the science of sound. Sound may be thought of as mechanical energy of a vibrating object transmitted by pressure waves through a medium to human (or animal) ears. If the pressure variations occur frequently enough (at least 20 times per second), then they can be heard and are called sound. The number of pressure variations per second is called the frequency of sound, and is expressed as cycles per second or Hertz (Hz).
Noise is a subjective reaction to different types of sounds. Noise is typically defined as (airborne) sound that is loud, unpleasant, unexpected or undesired, and may therefore be classified as a more specific group of sounds. Perceptions of sound and noise are highly subjective from person to person.
Measuring sound directly in terms of pressure would require a very large and awkward range of numbers. To avoid this, the decibel scale was devised. The decibel scale uses the hearing threshold (20 micropascals), as a point of reference, defined as 0 dB. Other sound pressures are then compared to this reference pressure, and the logarithm is taken to keep the numbers in a practical range. The decibel scale allows a million-fold increase in pressure to be expressed as 120 dB, and changes in levels (dB) correspond closely to human perception of relative loudness.
The perceived loudness of sounds is dependent upon many factors, including sound pressure level and frequency content. However, within the usual range of environmental noise levels, perception of loudness is relatively predictable, and can be approximated by A-weighted sound levels. There is a strong correlation between A-weighted sound levels (expressed as dBA) and the way the human ear perceives sound. For this reason, the A-weighted sound level has become the standard tool of environmental noise assessment. All noise levels reported in this section are in terms of A-weighted levels, but are expressed as dB, unless otherwise noted.
The decibel scale is logarithmic, not linear. In other words, two sound levels 10 dB apart differ in acoustic energy by a factor of 10. When the standard logarithmic decibel is A-weighted, an increase of 10 dBA is generally perceived as a doubling in loudness. For example, a 70 dBA sound is half as loud as an 80 dBA sound, and twice as loud as a 60 dBA sound.
Community noise is commonly described in terms of the ambient noise level, which is defined as the all-encompassing noise level associated with a given environment. A common statistical tool to measure the ambient noise level is the average, or equivalent, sound level (Leq), which corresponds to a steady-state A weighted sound level containing the same total energy as a time varying signal over a given time period (usually one hour). The Leq is the foundation of the composite noise descriptor, Ldn, and shows very good correlation with community response to noise.
The day/night average level (Ldn) is based upon the average noise level over a 24-hour day, with a +10 decibel weighing applied to noise occurring during nighttime (10:00 p.m. to 7:00 a.m.) hours. The nighttime penalty is based upon the assumption that people react to nighttime noise exposures as though they were twice as loud as daytime exposures. Because Ldn represents a 24-hour average, it tends to disguise short-term variations in the noise environment.
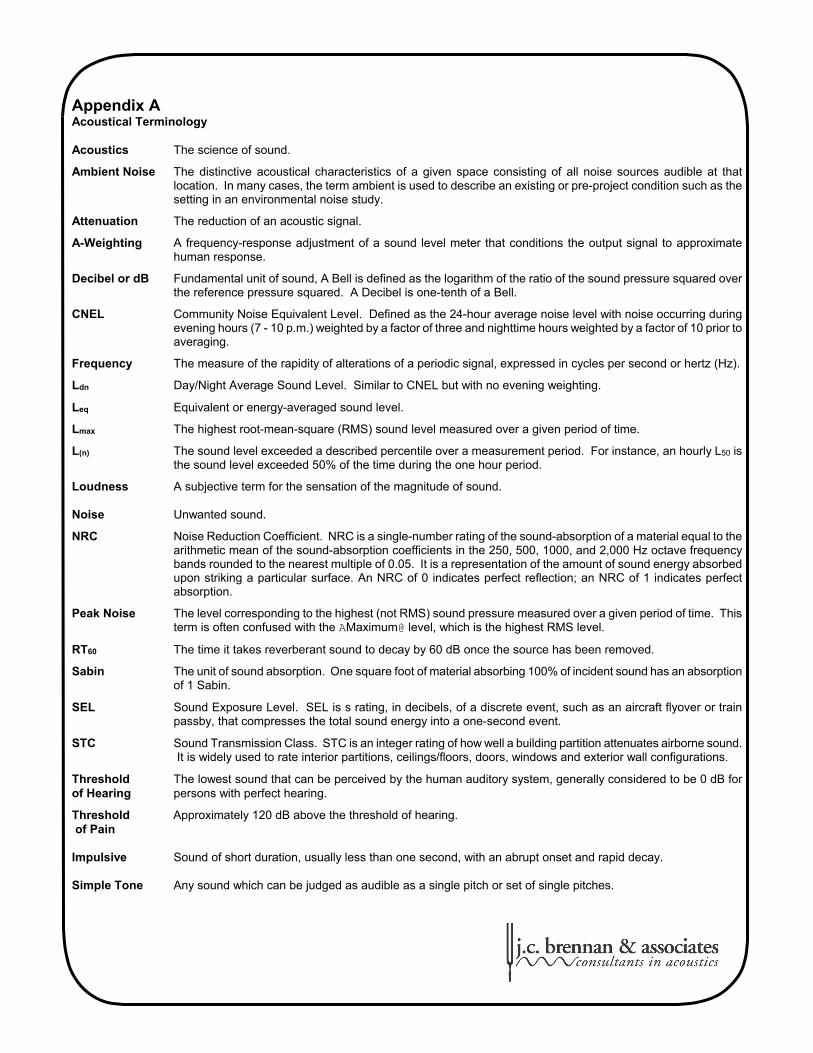
Table 1 lists several examples of the noise levels associated with common situations. Appendix A provides a summary of acoustical terms used in this report.

j.c. brennan & associates, Inc. Job # 2016-220
Environmental Noise AnalysisMill Creek EIR – Placer County, California
Page 4
TABLE 1: TYPICAL NOISE LEVELS
Common Outdoor Activities Noise Level (dBA) Common Indoor Activities
--110-- Rock Band
Jet Fly-over at 300 m (1,000 ft) --100--
Gas Lawn Mower at 1 m (3 ft) --90--
Diesel Truck at 15 m (50 ft),at 80 km/hr (50 mph)
--80-- Food Blender at 1 m (3 ft) Garbage Disposal at 1 m (3 ft)
Noisy Urban Area, DaytimeGas Lawn Mower, 30 m (100 ft)
--70-- Vacuum Cleaner at 3 m (10 ft)
Commercial AreaHeavy Traffic at 90 m (300 ft)
--60-- Normal Speech at 1 m (3 ft)
Quiet Urban Daytime --50-- Large Business Office
Dishwasher in Next Room
Quiet Urban Nighttime --40-- Theater, Large Conference Room (Background)
Quiet Suburban Nighttime --30-- Library
Quiet Rural Nighttime --20-- Bedroom at Night, Concert Hall (Background)
--10-- Broadcast/Recording Studio
Lowest Threshold of Human Hearing --0-- Lowest Threshold of Human Hearing
Source: Caltrans, Technical Noise Supplement, Traffic Noise Analysis Protocol. November 2009.
j.c. brennan & associates, Inc. Job # 2016-220
Environmental Noise AnalysisMill Creek EIR – Placer County, California
Page 5
Effects of Noise on People
The effects of noise on people can be placed in three categories:
Subjective effects of annoyance, nuisance, and dissatisfaction
Interference with activities such as speech, sleep, and learning
Physiological effects such as hearing loss or sudden startling
Environmental noise typically produces effects in the first two categories. Workers in industrial plants can experience noise in the last category. There is no completely satisfactory way to measure the subjective effects of noise or the corresponding reactions of annoyance and dissatisfaction. A wide variation in individual thresholds of annoyance exists and different tolerances to noise tend to develop based on an individual’s past experiences with noise.
Thus, an important way of predicting a human reaction to a new noise environment is the way it compares to the existing environment to which one has adapted: the so-called ambient noise level. In general, the more a new noise exceeds the previously existing ambient noise level, the less acceptable the new noise will be judged by those hearing it.
With regard to increases in A-weighted noise level, the following relationships occur:
Except in carefully controlled laboratory experiments, a change of 1 dBA cannot be perceived;
Outside of the laboratory, a 3 dBA change is considered a just-perceivable difference;
A change in level of at least 5 dBA is required before any noticeable change in human response would be expected; and
A 10 dBA change is subjectively heard as approximately a doubling in loudness, and can cause an adverse response.
Stationary point sources of noise – including stationary mobile sources such as idling vehicles – attenuate (lessen) at a rate of approximately 6 dB per doubling of distance from the source, depending on environmental conditions (i.e. atmospheric conditions and either vegetative or manufactured noise barriers, etc.). Widely distributed noises, such as a large industrial facility spread over many acres, or a street with moving vehicles, would typically attenuate at a lower rate.

j.c. brennan & associates, Inc. Job # 2016-220
Environmental Noise AnalysisMill Creek EIR – Placer County, California
Page 6
Existing Conditions
The project site is mostly undeveloped and is characterized by grasslands and scattered trees. Antelope Road extends north to south through the project site from PFE Road and divides the site into two portions. The site west of Antelope Road contains a drainage swale that extends southwest of PFE road through the northwest corner of the project site. The site east of Antelope Road contains two unnamed tributaries that flow through a box culvert under PFE Road into Dry Creek, which is located north of the project site.
Surrounding Land Uses
Surrounding land uses include single-family residential units to the immediate south, a storage center to the southeast, school district offices and two residential units to the west, five single family residential units to the north, and light industrial uses to the east and southeast. Cook Riolo Road is located along the western boundary of the project site, and PFE Road is located along the northern boundary of the project site.
Existing Ambient Noise Levels
On March 28th and March 29th, 2017, j.c. brennan & associates, Inc. staff conducted short-term noise level measurements and continuous 24-hour noise level measurements on the project site to quantify the existing ambient noise environment in the project vicinity. The noise measurement locations are shown on Figure 2. The noise level measurement survey results are provided in Table 2. Appendix B provides the complete results of the continuous noise level measurement survey and the short-term noise level measurements.
Larson Davis Laboratories (LDL) Model 820 and Model 824 precision integrating sound level meters were used for the ambient noise level measurement survey. The meters were calibrated before and after use with an LDL Model CAL200 acoustical calibrator to ensure the accuracy of the measurements. The equipment used meets all pertinent specifications of the American National Standards Institute for Type 1 sound level meters (ANSI S1.4).
The sound level meters were programmed to record the maximum, median, and average noise levels at each site during the survey. The maximum value, denoted Lmax, represents the highest noise level measured. The average value, denoted Leq, represents the energy average of all of the noise received by the sound level meter microphone during the monitoring period. The median value, denoted L50, represents the sound level exceeded 50 percent of the time during the monitoring period.


j.c. brennan & associates, Inc. Job # 2016-220
Environmental Noise AnalysisMill Creek EIR – Placer County, California
Page 8
TABLE 2: EXISTING AMBIENT NOISE MONITORING RESULTS Continuous 24-hour Noise Measurement Site
March 28th – 29th, 2017
Average Measured Hourly Noise Levels, dBA
Daytime (7:00 am – 10:00 pm)
Nighttime (10:00 pm -7:00 am)
Site Location Ldn Leq L50 Lmax Leq L50 Lmax
A Northwest edge of West Village project site, near PFE Road
72 71 64 87 64 48 84
B Southeast edge of East Village project site, near Antelope Road
63 63 56 78 53 50 71
C Eastern edge of East Village project site
57 50 47 63 50 47 65
Short-Term Noise Measurement Sites March 28th, 2017
Site Location Time Leq L50 Lmax Notes
1 130-ft from Antelope Rd, southern edge of project site
11:34 a.m. 59 56 72 Traffic is main source of noise, train horn audible in the distance.
2 100-ft from Antelope Rd, northern edge of project site
12:02 p.m. 66 53 88 Traffic from the intersection of PFE Road and Antelope Road is the primary source of noise.
3 450-ft from Antelope Rd, eastern edge of project site
12:37 p.m. 52 52 59 Industrial work is audible. Traffic noise is very mild.
4 200-ft from Cook Riolo Rd, western edge of project site
1:35 p.m. 53 53 65
Strong winds through vegetation are loudest noise. Landscaping equipment audible in the distance
Source: j.c. brennan & associates, Inc., 2017
Based upon field observations and the data shown in Table 2, the existing ambient noise levels at the project site are primarily defined by traffic along local roadways. The East Village portion of the project site is also characterized by industrial noise sources from the adjacent truck storage yard to the south and light industrial uses to the east.

j.c. brennan & associates, Inc. Job # 2016-220
Environmental Noise AnalysisMill Creek EIR – Placer County, California
Page 9
Existing Roadway Noise Levels
The Federal Highway Administration Highway Traffic Noise Prediction Model (FHWA RD-77-108) was used to predict existing noise levels due to traffic. The model is based upon the Calveno reference noise emission factors for automobiles, medium trucks, and heavy trucks, with consideration given to vehicle volume, speed, roadway configuration, distance to the receiver, and the acoustical characteristics of the site. The FHWA model was developed to predict hourly Leq values for free-flowing traffic conditions. Traffic volumes for existing conditions were obtained from the traffic study prepared by KD Anderson and Associates, Inc. Truck percentages and vehicle speeds on the local area roadways were estimated from field observations. Traffic noise levels are predicted at 75-feet from the centerline along each project-area roadway segment. Sensitive receptors may be located at distances which vary from the assumed calculation distance and may experience shielding from intervening barriers or sound walls. However, the traffic noise analysis is believed to be representative of the majority of sensitive receptors located closest to the project-area roadway segments analyzed in this report. Table 3 shows the existing traffic noise levels in terms of Ldn at 75-feet from the centerline along each roadway segment. This table also shows the distances to existing traffic noise contours. A complete listing of the FHWA Model input data is contained in Appendix C. The actual distances to noise level contours may vary from the distances predicted by the FHWA model due to roadway curvature, grade, shielding from local topography or structures, elevated roadways, or elevated receivers. The distances reported in Table 3 are generally considered to be conservative estimates of noise exposure along the project-area roadways.
Table 3: Existing Traffic Noise Levels and Distances to Contours @ 75-feet Distance to Contours (feet)
Roadway Segment
Exterior Noise
Level, Ldn (dB) 70 dB 65 dB 60 dB
PFE Road Watt Avenue to Walerga Road 61.0 19 40 87
PFE Road Walerga Road to Oly Lane 62.0 22 48 103
PFE Road Oly Lane to Cook Riolo Road 62.1 22 48 104
PFE Road Cook Riolo Road to North Antelope Road 63.2 26 57 122
PFE Road North Antelope Road to Hilltop Road 64.0 30 64 139
Cook Riolo Road Baseline Road to Vineyard Road 57.3 11 23 49
Cook Riolo Road Vineyard Road to CRES 58.4 13 27 58
Cook Riolo Road CRES to PFE Road 57.1 10 22 48
Cook Riolo Road South of PFE Road 45.4 2 4 8
North Antelope Road PFE Road to Great Valley Drive 63.3 27 58 124
North Antelope Road Great Valley Drive to Poker Lane 63.9 29 63 136
Notes: Distances to traffic noise contours are measured in feet from the centerlines of the roadways. Source: FHWA-RD-77-108 with inputs from KD Anderson and j.c. brennan & associates, Inc. 2017.

j.c. brennan & associates, Inc. Job # 2016-220
Environmental Noise AnalysisMill Creek EIR – Placer County, California
Page 10
Existing Railroad Noise Levels
Railroad activity in the project vicinity occurs at the Union Pacific Railroad Yard, which is located approximately 2,400-feet, or further, from the project site. While rail yard activity is audible, measurements indicate that rail yard activity did not contribute significantly to background noise levels.
REGULATORY CONTEXT
Federal
There are no federal regulations related to noise that apply to the Proposed Project.
State
California Environmental Quality Act
The California Environmental Quality Act (CEQA) Guidelines, Appendix G, indicate that a significant noise impact may occur if a project exposes persons to noise levels in excess of local general plans or noise ordinance standards, or cause a substantial permanent or temporary increase in ambient noise levels.
California State Building Codes
The State Building Code, Title 24, Part 2 of the State of California Code of Regulations establishes uniform minimum noise insulation performance standards to protect persons within new buildings which house people, including hotels, motels, dormitories, apartment houses and dwellings other than single-family dwellings. Title 24 mandates that interior noise levels attributable to exterior sources shall not exceed 45 dB Ldn or CNEL in any habitable room.
Title 24 also mandates that for structures containing noise-sensitive uses to be located where the Ldn or CNEL exceeds 60 dB, an acoustical analysis must be prepared to identify mechanisms for limiting exterior noise to the prescribed allowable interior levels. If the interior allowable noise levels are met by requiring that windows be kept closed, the design for the structure must also specify a ventilation or air conditioning system to provide a habitable interior environment
Placer County General Plan
The Goals and Policies of the Placer County General Plan Noise Element which are relative to this project are listed below:
Goal 9.A: To protect County residents from the harmful and annoying effects of exposure to excessive noise.
Policies:
9.A.1. New development of noise-sensitive uses shall not be permitted where the noise level due to non-transportation noise sources will exceed the noise level standards of Table 9-1 [Table 4 of this report] as measured immediately within the property line of the new development, unless effective noise mitigation measures have been incorporated into the development design to achieve the standards specified in Table 9-1.

j.c. brennan & associates, Inc. Job # 2016-220
Environmental Noise AnalysisMill Creek EIR – Placer County, California
Page 11
9.A.2. Noise created by new proposed non-transportation noise sources shall be mitigated so as not to exceed the noise level standards of Table 9-1 [Table 4 of this report] as measured immediately within the property line of lands designated for noise-sensitive uses: provided, however, the noise created by occasional events occurring within a stadium on land zoned for university purposes may temporarily exceed these standards as provided in an approved Specific Plan.
9.A.3. The County shall continue to enforce the State Noise Insulation Standards (California Code of Regulations, Title 24) of the California Building Code and Placer County Code Article 9.36, Noise.
9.A.4. The feasibility of proposed projects with respect to existing and future transportation noise levels shall be evaluated by comparison to Table 9-3 [Table 5 of this report].
9.A.5. New development of noise-sensitive land uses shall not be permitted in areas exposed to existing or projected levels of noise from transportation noise sources, including airports, which exceed the levels specified in Table 9-3 [Table 5 of this report], unless the project design includes effective mitigation measures to reduce noise in outdoor activity areas and interior spaces to the levels specified in Table 9-3 [Table 5 of this report].
9.A.9. Noise created by new transportation noise sources, including roadway improvement projects, shall be mitigated so as not to exceed the levels specified in Table 9-3 [Table 5 of this report] or the performance standards in Table 9-3 [Table 5 of this report] at outdoor activity areas or interior spaces of existing noise sensitive land uses.
9.A.10. Where noise-sensitive land uses are proposed in areas exposed to existing or projected exterior noise levels exceeding the levels specified in Table 9-3 [Table 5 of this report] or the performance standards of Table 9-1 [Table 4 of this report], the County shall require submission of an acoustical analysis as part of the environmental review process so that noise mitigation may be included in the project design. At the discretion of the County, the requirement for an acoustical analysis may be waived provided that all of the following conditions are satisfied:
a. The development is for less than five single-family dwellings or less than 10,000 square feet of total gross floor area for office buildings, churches, or meeting halls; [This discussion disqualifies this project from having its acoustical requirement waived.]
9.A.11. The County shall require one or more of the following mitigation measures where existing noise levels significantly impact existing noise-sensitive land uses, or where the cumulative increase in noise levels resulting from new development significantly impacts noise-sensitive land uses:
a. Rerouting traffic onto streets that have available traffic capacity and that do not adjoin noise-sensitive land uses;
b. Lowering speed limits, if feasible and practical;
c. Programs to pay for noise mitigation such as low cost loans to owners of noise-impacted property or establishment of developer fees;
d. Acoustical treatment of buildings; or,
e. Construction of noise barriers.

j.c. brennan & associates, Inc. Job # 2016-220
Environmental Noise AnalysisMill Creek EIR – Placer County, California
Page 12
9.A.12. Where noise mitigation measures are required to achieve the standards of Tables 9-1 and 9-3, the emphasis of such measures shall be placed upon site planning and project design. The use of noise barriers shall be considered as a means of achieving the noise standards only after all other practical design-related noise mitigation measure have been integrated into the project.

j.c. brennan & associates, Inc. Job # 2016-220
Environmental Noise AnalysisMill Creek EIR – Placer County, California
Page 13
TABLE 4: ALLOWABLE LDN NOISE LEVELS WITHIN SPECIFIED ZONE DISTRICTS APPLICABLE TO NEW PROJECTS
AFFECTED BY OR INCLUDING NON-TRANSPORTATION NOISE SOURCES (TABLE 9-1 OF THE PLACER COUNTY
GENERAL PLAN)
Zone District of Receptor Property Line of Receiving Use Interior Space1
Residential adjacent to industrial Other Residential Office/Professional Open Space Neighborhood Commercial
60 dBA 50 dBA 70 dBA
--- 70 dBA
45 dBA 45 dBA 45 dBA
--- 45 dBA
Notes for Table 4: *Except where noted otherwise, noise exposures will be those which occur at the property line of
the receiving use. *Where existing transportation noise levels exceed the standards of this table, the allowable Ldn
shall be raised to the same level as that of the ambient level. *If the noise source generated by, or affecting, the uses shown above consists primarily of speech
or music, or if the noise source is impulsive in nature, the noise standards shown above shall be decreased by 5 dB.
1Interior spaces are defined as any locations where some degree of noise sensitivity exists. Examples include all habitable rooms of residences, and areas where communication and speech intelligibility are essential, such as classrooms and offices.
Table 9-1 of the Placer County General Plan Noise Element has been summarized for use on this project; please see the Placer County General Plan Noise Element for the full Table and Footnotes.
TABLE 5: MAXIMUM ALLOWABLE NOISE EXPOSURE (LDN) FOR TRANSPORTATION NOISE SOURCES (TABLE 9-2
OF THE PLACER COUNTY GENERAL PLAN)
Outdoor Activity Areas 1 Interior Spaces
Land Use Ldn/CNEL, dB Ldn/CNEL, dB Leq, dB 2
Residential Transient Lodging
Hospitals, Nursing Homes Theaters, Auditoriums
Churches, Meeting Halls Office Buildings
Schools, Libraries, Museums Playgrounds, Neighborhood Parks
60 3 60 3 60 3 --
60 3 -- -- 70
45 45 45 -- -- -- -- --
-- -- -- 35 40 45 45 --
Notes:
1 Where the location of outdoor activity areas is unknown the exterior noise level standard shall be applied to the property line of the receiving land use. 2 As determined for a typical worst-case hour during periods of use. 3 Where it is not possible to reduce noise in outdoor activity areas to 60 Ldn/CNEL or less using a practical application of the best-available noise reduction measures, an exterior noise level of up to 65 dB Ldn/CNEL may be allowed provided that available exterior noise level reduction measures have been implemented and interior noise levels are in compliance with this table.
Placer County Noise Ordinance
The Placer County Code, Section 9.36.060 establishes sound limits for sensitive receptors, as shown in Table 6. The standards are measured at the property line of the receiving sensitive receptor. It should be noted that the County also applies a limit of 5 dB over the existing

j.c. brennan & associates, Inc. Job # 2016-220
Environmental Noise AnalysisMill Creek EIR – Placer County, California
Page 14
ambient noise level or the Table 6 standards, whichever is greater.
Section 9.36.020 of the code defines a sensitive receptor as “a land use in which there is a reasonable degree of sensitivity to noise. Such uses include single-family and multi-family residential uses, frequently used outbuildings, schools, hospitals, churches, rest homes, cemeteries, public libraries and other sensitive uses as determined by the enforcement officer.” The purpose of the Noise Ordinance is to implement the Noise Standards identified in the Placer County General Plan. The County Noise Ordinance is enforced with the Penal Code to establish standards for reported nuisance abatement and enforcement within the County.
The Table 6 criteria are based upon hourly average (Leq) and maximum (Lmax) noise level descriptors.
TABLE 6: HOURLY EXTERIOR NOISE PERFORMANCE STANDARDS FOR STATIONARY (NON-TRANSPORTATION) NOISE SOURCES
Acceptable Noise Level, dBA Noise Metric Daytime (7 a.m. – 10 p.m.) Nighttime (10 p.m. – 7 a.m.)
Leq 55 45
Lmax 70 65
Section 9.36.030 of the Ordinance provides exemptions as follows:
A. Sound or noise emanating from the following sources and activities are exempt from the provisions of this title:
1. Sound sources typically associated with residential uses (e.g., children at play, air conditioners in good working order, etc.);
2. Sound sources typically associated with property maintenance (e.g. lawn mowers, edgers, snow blowers, blowers, pool pumps, power tools, etc.) provided such activities take place between the hours of seven a.m. and nine p.m.;
3. Safety, warning and alarm devices, including house and car alarms, and other warning devices that are designed to protect the health, safety and welfare, provided such devices are not negligently maintained or operated;
4. The normal operation of public and private schools typically consisting of classes and other school-sponsored activities;
5. Maintenance (e.g., lawn mowers, edgers, aerators, blowers, etc.) of golf courses, provided such activities take place between the hours of five a.m. and nine p.m. May through September, and seven a.m. and six p.m. October through April;
6. Emergencies, involving the execution of the duties of duly authorized governmental personnel and others providing emergency response to the general public, including but not limited to sworn peace officers, emergency personnel, utility personnel, and the operation of emergency response vehicles and equipment;
7. Construction (e.g., construction, alteration or repair activities) between the hours of six a.m. and eight p.m. Monday through Friday, and between the hours of eight a.m. and eight p. m. Saturday and Sunday Provided, however, that all construction equipment shall be fitted with factory installed muffling devices and that all construction equipment shall be maintained in good working order;
8. Infrequent repair, rebuilding, reconstruction or dismantling of any motor vehicle between the hours of eight a.m. and eight p.m.;
9. Sound sources associated with agricultural operations on agricultural land, as defined by Placer County Code Article 5.24.040, which are carried out in any manner consistent

j.c. brennan & associates, Inc. Job # 2016-220
Environmental Noise AnalysisMill Creek EIR – Placer County, California
Page 15
with the practice and within the standards of the agricultural industry. This includes without limitation all mechanical devices, apparatus or equipment utilized for the protection or salvage of agricultural crops during periods of adverse weather conditions or when the use of mobile sources is necessary for pest control;
10. Sound sources associated with existing legal non-conforming and/or existing permitted commercial, industrial or non-profit operations, which do not significantly change in existing on-site activities, or result in a change in the number of days or daily hours of operation;
11. Gunfire occurring while hunting consistent with all state laws on private property shall be allowed;
12. Animal noise (These noises are handled elsewhere in the code.);
13. Any vehicle, otherwise compliant with state law, being operated upon any public highway, street or right-of-way or driveway for the purpose of exiting or entering property. This exception does not include any amplified sound emanating from the vehicle, vehicle alarms or horn-honking. (Ord. 5294-B, 2004; Ord. 5280-B, 2004)
Section 9.36.030 A.7 of the Ordinance provides an exception for construction noise so long as all construction equipment is “fitted with factory installed muffling devices and that all construction equipment shall be maintained in good working order.” Allowable time periods for this construction noise are as follows: 6 a.m. to 8 p.m., Monday through Friday; and 8 a.m. to 8 p.m., Saturdays and Sundays. However, Planning Commission revisions to the Placer County Board of Supervisors Minute Order 90-08 indicate the following:
“Construction noise emanating from any construction activities for which a Grading or Building Permit is required is prohibited on Sundays and Federal Holidays, and shall only occur:
a) Monday through Friday, 6:00 a.m. to 8:00 p.m. (during daylight savings) b) Monday through Friday, 7:00 a.m. to 8:00 p.m. (during standard time) c) Saturdays, 8:00 a.m. to 6:00 p.m.
In addition, temporary signs shall be located throughout the project, as determined by the Development Review Committee, at key intersections depicting the above construction hour limitations.”
Section 9.36.080 of the Ordinance provides Exceptions as follows:
D. If the applicant can show to the County, or his or her designee that immediate compliance with the requirements of this chapter would not result in a hazardous condition or nuisance, and strict compliance would be unreasonable due to the circumstances of the requested exception, a permit to allow exception from the provisions contained in all or a portion of this chapter may be issued. Factors considered for all requests for exceptions, other than construction or special events, shall include but not be limited to the following:
1. Conformance with the intent of this chapter and General Plan Policies; 2. Uses of property and existence of sensitive receptors within the area affected by sound; 3. Factors related to initiating and completing all remedial work; 4. Age and useful life of the existing sound source; 5. Hardship to the applicant, or community of not granting the exception; 6. The time of day or night the exception will occur; 7. The duration of the exception; and 8. The general public interest, welfare and safety
j.c. brennan & associates, Inc. Job # 2016-220
Environmental Noise AnalysisMill Creek EIR – Placer County, California
Page 16
Summary of Placer County Noise Standards Transportation Noise
The Placer County General Plan Noise Element applies 60 dB Ldn/CNEL exterior and 45 dB Ldn/CNEL noise level standards for residential uses affected by transportation noise sources.
Placer County may conditionally allow exterior noise levels between 60-65 dB Ldn for residential uses, provided that practical noise reduction measures have been implemented and interior noise levels remain in compliance with the 45 dB Ldn interior standard.
Non-Transportation Noise
For non-transportation noise sources, the Placer County noise ordinance standards shown in Table 6 are more restrictive than those contained in the Placer County General Plan. Therefore, the standards of the noise ordinance will be applied to non-transportation noise sources associated with the project.
Substantial Increase Criteria The noise standards applicable to the project include the relevant portions of Placer County General Plan, the Placer County Noise Ordinance described in the Regulatory Framework section above, and the following common practice guidelines. Generally, a project may have a significant effect on the environment if it will substantially increase the ambient noise levels for adjoining areas or expose people to measurably severe noise levels. In practice, a noise impact may be considered significant if it would generate noise that would conflict with local project criteria or ordinances, or substantially increase noise levels at noise sensitive land uses. The potential increase in traffic noise from the project is a factor in determining significance. Research into the human perception of changes in sound level indicates the following1:
A 3-dB change is barely perceptible,
A 5-dB change is clearly perceptible, and
A 10-dB change is perceived as being twice or half as loud.
Placer County, like many jurisdictions, does not have an adopted policy regarding significant increases in ambient noise. A common practice in many jurisdictions is to use a 3-5 dB increase as a threshold of significance. However, a limitation of using a single noise level increase value to evaluate noise impacts is that it fails to account for pre-project noise conditions.
Table 7 is based upon recommendations made by the Federal Interagency Committee on Noise (FICON) to provide guidance in the assessment of changes in ambient noise levels resulting from aircraft operations. The recommendations are based upon studies that relate aircraft noise levels to the percentage of persons highly annoyed by the noise. Although the FICON recommendations were specifically developed to assess aircraft noise impacts, it has been widely accepted that they are applicable to transportation-related noise sources described in terms of cumulative noise exposure metrics such as the Ldn or CNEL.
1 California Department of Transportation. Technical Noise Supplement to the Traffic Analysis Protocol. September 2013.

j.c. brennan & associates, Inc. Job # 2016-220
Environmental Noise AnalysisMill Creek EIR – Placer County, California
Page 17
TABLE 7: SIGNIFICANCE OF CHANGES IN NOISE EXPOSURE
Ambient Noise Level Without Project, Ldn Increase Required for Significant Impact <60 dB +5.0 dB or more
60-65 dB +3.0 dB or more >65 dB +1.5 dB or more
Source: Federal Interagency Committee on Noise (FICON)
Vibration Standards
Vibration is like noise in that it involves a source, a transmission path, and a receiver. While vibration is related to noise, it differs in that in that noise is generally considered to be pressure waves transmitted through air, whereas vibration usually consists of the excitation of a structure or surface. As with noise, vibration consists of an amplitude and frequency. A person’s perception to the vibration will depend on their individual sensitivity to vibration, as well as the amplitude and frequency of the source and the response of the system which is vibrating.
Vibration can be measured in terms of acceleration, velocity, or displacement. A common practice is to monitor vibration measures in terms of peak particle velocities in inches per second. Standards pertaining to perception as well as damage to structures have been developed for vibration levels defined in terms of peak particle velocities.
Placer County does not have specific policies pertaining to vibration levels. However, vibration levels associated with construction activities and project operations are addressed as potential noise impacts associated with project implementation.
Human and structural response to different vibration levels is influenced by a number of factors, including ground type, distance between source and receptor, duration, and the number of perceived vibration events. Table 8 indicates that the threshold for damage to structures ranges from 0.2 to 0.6 peak particle velocity in inches per second (in/sec p.p.v). The general threshold at which human annoyance could occur is noted as 0.1 in/sec p.p.v.
TABLE 8: EFFECTS OF VIBRATION ON PEOPLE AND BUILDINGS Peak Particle Velocity
mm/sec. in./sec. Human Reaction Effect on Buildings
0.15-0.30 0.006-0.019 Threshold of perception; possibility of intrusion
Vibrations unlikely to cause damage of any type
2.0 0.08 Vibrations readily perceptible Recommended upper level of the vibration to which ruins and ancient monuments should be subjected
2.5 0.10 Level at which continuous vibrations begin to annoy people
Virtually no risk of “architectural” damage to normal buildings
5.0 0.20
Vibrations annoying to people in buildings (this agrees with the levels established for people standing on bridges and subjected to relative short periods of vibrations)
Threshold at which there is a risk of “architectural” damage to normal dwelling - houses with plastered walls and ceilings. Special types of finish such as lining of walls, flexible ceiling treatment, etc., would minimize “architectural” damage
10-15 0.4-0.6
Vibrations considered unpleasant by people subjected to continuous vibrations and unacceptable to some people walking on bridges
Vibrations at a greater level than normally expected from traffic, but would cause “architectural” damage and possibly minor structural damage.
Source: Caltrans. Transportation Related Earthborne Vibrations. TAV-02-01-R9601 February 20, 2002.

j.c. brennan & associates, Inc. Job # 2016-220
Environmental Noise AnalysisMill Creek EIR – Placer County, California
Page 18
IMPACTS AND MITIGATION MEASURES
Method of Analysis Traffic Noise Impact Assessment Methodology
To describe future noise levels due to traffic, the Federal Highway Administration Highway Traffic Noise Prediction Model (FHWA RD-77-108) was used. Direct inputs to the model included ADT traffic volumes provided by KD Anderson & Associates, Inc.. The FHWA model is based upon the Calveno reference noise factors for automobiles, medium trucks and heavy trucks, with consideration given to vehicle volume, speed, roadway configuration, distance to the receiver, and the acoustical characteristics of the site. The FHWA model was developed to predict hourly Leq values for free-flowing traffic conditions. To predict Ldn/CNEL values, it is necessary to determine the day/night distribution of traffic and adjust the traffic volume input data to yield an equivalent hourly traffic volume. Construction Noise and Vibration Impact Methodology
Construction noise and vibration was analyzed using data compiled for various pieces of construction equipment at a representative distance of 50 feet. Construction activities are discussed relative to the applicable Placer County noise policies. Potential impacts and mitigation measures are discussed.
Thresholds of Significance
Consistent with Appendix G of the CEQA Guideline, and the County’s General Plan and Noise Ordinance, the project will have a significant impact related to noise if it will result in:
A. Exposure of persons to, or generation of noise levels in excess of standards established in the local general plan or noise ordinance, or applicable standards of other agencies. Specifically, an exterior noise level of 60 dB Ldn and an interior noise level of 45 dB Ldn for residential uses exposed to transportation noise sources. For non-transportation noise sources, a daytime (7:00 am to 10:00 pm) limit of 55 dB Leq and 70 dB Lmax and nighttime (10:00 pm to 7:00 am) limits of 45 dB Leq and 65 dB Lmax.
B. Exposure of persons to or generation of excessive groundborne vibration or groundborne noise levels. Specifically, a limit of 0.1 in/sec p.p.v., as discussed above;
C. A substantial permanent increase in ambient noise levels in the project vicinity above levels existing without the project;
D. A substantial temporary or periodic increase in ambient noise levels in the project vicinity beyond levels permissible under the County’s General Plan and Noise Ordinance;
E. For a project located within an airport land use plan or, where such a plan has not been adopted, within two miles of a public airport or public use airport, expose people residing or working in the project area to excessive noise levels within two miles of a public airport or public use airport; or

j.c. brennan & associates, Inc. Job # 2016-220
Environmental Noise AnalysisMill Creek EIR – Placer County, California
Page 19
F. For a project within the vicinity of a private airstrip, expose people residing or working in the project area to excessive noise levels.
The proposed project is not located within two miles of a public or private airport or airstrip. Therefore, aircraft noise is not discussed further in this analysis.
Project-Specific Impacts and Mitigation Measures
Impact 1 Construction Noise at Sensitive Receptors
Construction of the Proposed Project would temporarily increase noise levels during construction. This would be a potentially significant impact.
During the construction of the project, and associated off-site improvements, including roads, water and sewer lines and related infrastructure, noise from construction activities would add to the noise environment in the project vicinity. Activities involved in construction would generate maximum noise levels, as indicated in Table 9, ranging from 76 to 90 dB at a distance of 50-feet. Construction activities would be temporary in nature and are anticipated to occur during normal daytime working hours.
Noise would also be generated during the construction phase by increased truck traffic on area roadways. A substantial project-generated noise source would be truck traffic associated with transport of heavy materials and equipment to and from construction sites. This noise increase would be of short duration, and would likely occur primarily during daytime hours.
TABLE 9 : CONSTRUCTION EQUIPMENT NOISE
Type of Equipment Maximum Level, dB at 50 feet
Backhoe 78
Compactor 83
Compressor (air) 78
Concrete Saw 90
Dozer 82
Dump Truck 76
Excavator 81
Generator 81
Jackhammer 89
Pneumatic Tools 85
Source: Roadway Construction Noise Model User’s Guide. Federal Highway Administration. FHWA-HEP-05-054. January 2006.
Construction activities are conditionally exempt from the Noise Ordinance during certain hours. Construction activities are exempt from the noise standard from 6 a.m. to 8 p.m. Monday through Friday, and from 8 a.m. to 6 p.m. on Saturdays and Sundays.
j.c. brennan & associates, Inc. Job # 2016-220
Environmental Noise AnalysisMill Creek EIR – Placer County, California
Page 20
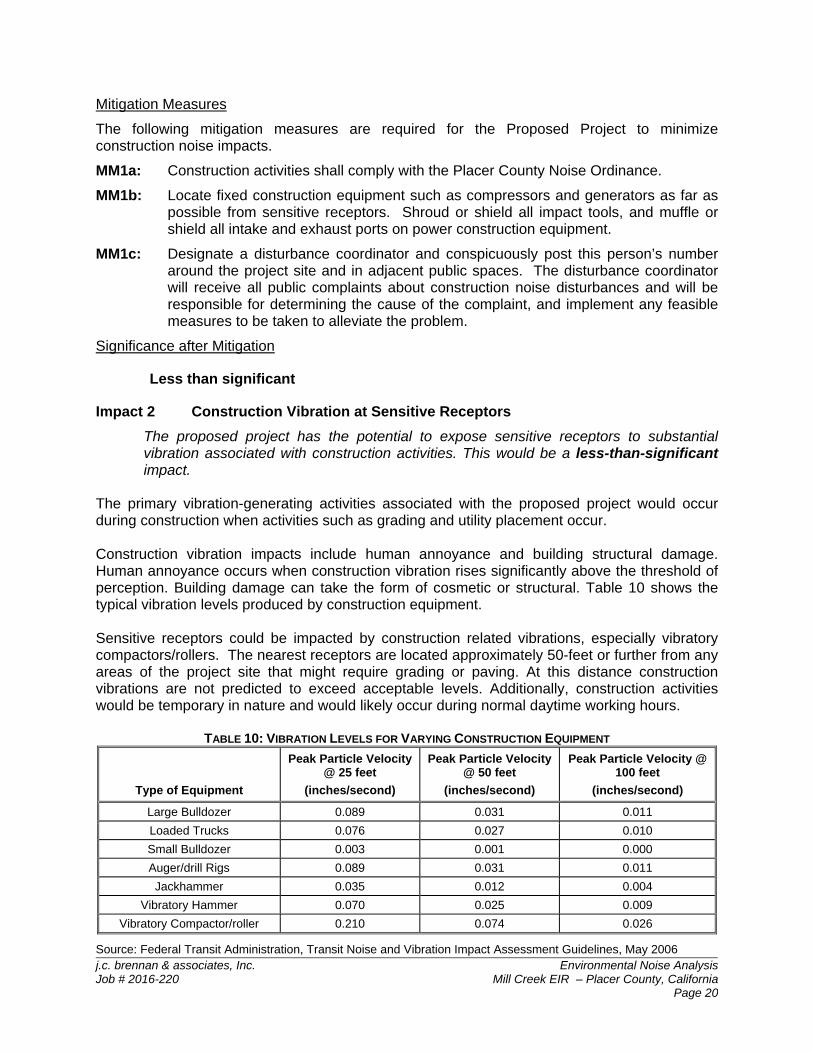
Mitigation Measures
The following mitigation measures are required for the Proposed Project to minimize construction noise impacts.
MM1a: Construction activities shall comply with the Placer County Noise Ordinance.
MM1b: Locate fixed construction equipment such as compressors and generators as far as possible from sensitive receptors. Shroud or shield all impact tools, and muffle or shield all intake and exhaust ports on power construction equipment.
MM1c: Designate a disturbance coordinator and conspicuously post this person’s number around the project site and in adjacent public spaces. The disturbance coordinator will receive all public complaints about construction noise disturbances and will be responsible for determining the cause of the complaint, and implement any feasible measures to be taken to alleviate the problem.
Significance after Mitigation
Less than significant
Impact 2 Construction Vibration at Sensitive Receptors
The proposed project has the potential to expose sensitive receptors to substantial vibration associated with construction activities. This would be a less-than-significant impact.
The primary vibration-generating activities associated with the proposed project would occur during construction when activities such as grading and utility placement occur. Construction vibration impacts include human annoyance and building structural damage. Human annoyance occurs when construction vibration rises significantly above the threshold of perception. Building damage can take the form of cosmetic or structural. Table 10 shows the typical vibration levels produced by construction equipment. Sensitive receptors could be impacted by construction related vibrations, especially vibratory compactors/rollers. The nearest receptors are located approximately 50-feet or further from any areas of the project site that might require grading or paving. At this distance construction vibrations are not predicted to exceed acceptable levels. Additionally, construction activities would be temporary in nature and would likely occur during normal daytime working hours.
TABLE 10: VIBRATION LEVELS FOR VARYING CONSTRUCTION EQUIPMENT
Type of Equipment
Peak Particle Velocity @ 25 feet
(inches/second)
Peak Particle Velocity @ 50 feet
(inches/second)
Peak Particle Velocity @ 100 feet
(inches/second)
Large Bulldozer 0.089 0.031 0.011
Loaded Trucks 0.076 0.027 0.010
Small Bulldozer 0.003 0.001 0.000
Auger/drill Rigs 0.089 0.031 0.011
Jackhammer 0.035 0.012 0.004
Vibratory Hammer 0.070 0.025 0.009
Vibratory Compactor/roller 0.210 0.074 0.026
Source: Federal Transit Administration, Transit Noise and Vibration Impact Assessment Guidelines, May 2006

j.c. brennan & associates, Inc. Job # 2016-220
Environmental Noise AnalysisMill Creek EIR – Placer County, California
Page 21
The Table 10 data indicate that construction vibration levels anticipated for the project are less than the 0.1 in/sec criteria at distances of 50-feet. Therefore, construction vibrations are not predicted to cause damage to existing buildings or cause annoyance to sensitive receptors. Implementation of the proposed project would have a less than significant impact.
Mitigation for Impact 2: None required
Impact 3 Transportation Noise at Existing Sensitive Receptors
Traffic generated by the Proposed Project could generate traffic noise increases exceeding the substantial increase criteria, as outlined in the Thresholds of Significance criteria above. This would be a less-than-significant impact.
Table 11 shows the predicted traffic noise level increases on the local roadway network for existing and existing plus project conditions. Table 12 shows the predicted traffic noise level increases on the local roadway network for cumulative and cumulative plus project conditions.
Appendix C provides the complete inputs and results of the FHWA traffic noise modeling.

j.c. brennan & associates, Inc. Job # 2016-220
Environmental Noise AnalysisMill Creek EIR – Placer County, California
Page 22 of 31
TABLE 11: PREDICTED TRAFFIC NOISE LEVELS AND PROJECT-RELATED TRAFFIC NOISE LEVEL INCREASES (EXISTING TRAFFIC CONDITIONS)
Predicted Ldn @ Closest Sensitive Receptors – 1st Floor Outdoor Activity Areas
Roadway Segment Existing Existing + Project Change Criteria Significant?
PFE Road Watt Avenue to Walerga Road 61.0 dB 61.1 dB +0.1 dB +3.0 dB No
PFE Road Walerga Road to Oly Lane 62.0 dB 62.2 dB +0.2 dB +3.0 dB No
PFE Road Oly Lane to Cook Riolo Road 62.1 dB 62.3 dB +0.2 dB +3.0 dB No
PFE Road Cook Riolo Road to North Antelope Road 63.2 dB 63.7 dB +0.5 dB +3.0 dB No
PFE Road North Antelope Road to Hilltop Road 64.0 dB 64.5 dB +0.5 dB +3.0 dB No
Cook Riolo Road Baseline Road to Vineyard Road 57.3 dB 57.8 dB +0.5 dB +5.0 dB No
Cook Riolo Road Vineyard Road to CRES 58.4 dB 58.9 dB +0.5 dB +5.0 dB No
Cook Riolo Road CRES to PFE Road 57.1 dB 57.9 dB +0.8 dB +5.0 dB No
Cook Riolo Road South PFE Road 48.0 dB 48.0 dB +0.0 dB +5.0 dB No
North Antelope Road PFE Road to Great Valley Drive 63.3 dB 63.9 dB +0.6 dB +3.0 dB No
North Antelope Road Great Valley Drive to Poker Lane 63.9 dB 64.4 dB +0.5 dB +3.0 dB No
Source: j.c. brennan & associates, Inc., Inc., FHWA RD-77-108 Traffic Noise Prediction Model, and KD Anderson 2017

j.c. brennan & associates, Inc. Job # 2016-220
Environmental Noise AnalysisMill Creek EIR – Placer County, California
Page 23 of 31
TABLE 12: PREDICTED TRAFFIC NOISE LEVELS AND PROJECT-RELATED TRAFFIC NOISE LEVEL INCREASES (CUMULATIVE TRAFFIC CONDITIONS)
Predicted Ldn @ Closest Sensitive Receptors – 1st Floor Outdoor Activity Areas
Roadway Segment
Cumulative
(2035)
Cumulative (2035)
+ Project Change Criteria Significant?
PFE Road Watt Avenue to Walerga Road 65.1 dB 65.2 dB +0.1 dB +1.5 dB No
PFE Road Walerga Road to Oly Lane 65.1 dB 65.2 dB +0.1 dB +1.5 dB No
PFE Road Oly Lane to Cook Riolo Road 65.4 dB 65.5 dB +0.1 dB +1.5 dB No
PFE Road Cook Riolo Road to North Antelope Road 67.2 dB 67.4 dB +0.2 dB +1.5 dB No
PFE Road North Antelope Road to Hilltop Road 68.9 dB 69.1 dB +0.2 dB +1.5 dB No
Cook Riolo Road Baseline Road to Vineyard Road 63.1 dB 63.3 dB +0.2 dB +1.5 dB No
Cook Riolo Road Vineyard Road to CRES 64.4 dB 64.5 dB +0.1 dB +1.5 dB No
Cook Riolo Road CRES to PFE Road 63.6 dB 63.8 dB +0.2 dB +1.5 dB No
Cook Riolo Road South PFE Road 48.0 dB 48.0 dB +0.0 dB +5.0 dB No
North Antelope Road PFE Road to Great Valley Drive 69.4 dB 69.6 dB +0.2 dB +1.5 dB No
North Antelope Road Great Valley Drive to Poker Lane 69.6 dB 69.7 dB +0.1 dB +1.5 dB No
Source: j.c. brennan & associates, Inc., Inc., FHWA RD-77-108 Traffic Noise Prediction Model, and KD Anderson 2017.
j.c. brennan & associates, Inc. Job # 2016-220
Environmental Noise AnalysisMill Creek EIR – Placer County, California
Page 24 of 31
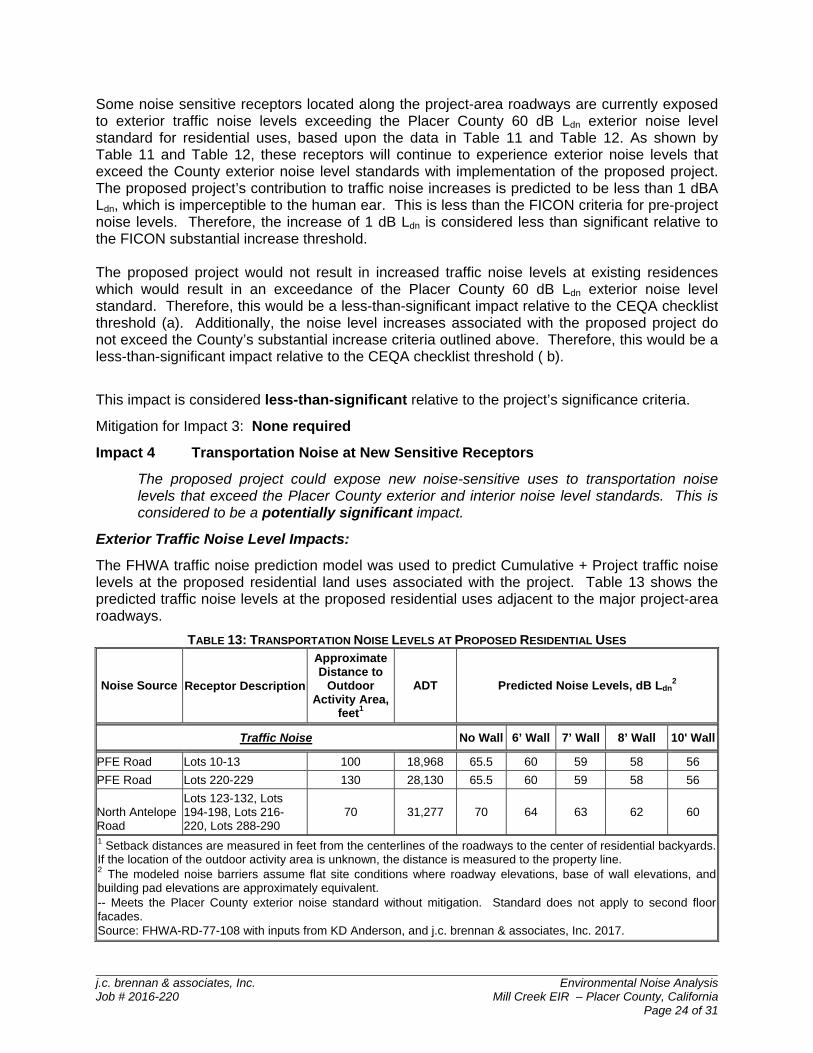
Some noise sensitive receptors located along the project-area roadways are currently exposed to exterior traffic noise levels exceeding the Placer County 60 dB Ldn exterior noise level standard for residential uses, based upon the data in Table 11 and Table 12. As shown by Table 11 and Table 12, these receptors will continue to experience exterior noise levels that exceed the County exterior noise level standards with implementation of the proposed project. The proposed project’s contribution to traffic noise increases is predicted to be less than 1 dBA Ldn, which is imperceptible to the human ear. This is less than the FICON criteria for pre-project noise levels. Therefore, the increase of 1 dB Ldn is considered less than significant relative to the FICON substantial increase threshold. The proposed project would not result in increased traffic noise levels at existing residences which would result in an exceedance of the Placer County 60 dB Ldn exterior noise level standard. Therefore, this would be a less-than-significant impact relative to the CEQA checklist threshold (a). Additionally, the noise level increases associated with the proposed project do not exceed the County’s substantial increase criteria outlined above. Therefore, this would be a less-than-significant impact relative to the CEQA checklist threshold ( b).
This impact is considered less-than-significant relative to the project’s significance criteria.
Mitigation for Impact 3: None required
Impact 4 Transportation Noise at New Sensitive Receptors
The proposed project could expose new noise-sensitive uses to transportation noise levels that exceed the Placer County exterior and interior noise level standards. This is considered to be a potentially significant impact.
Exterior Traffic Noise Level Impacts:
The FHWA traffic noise prediction model was used to predict Cumulative + Project traffic noise levels at the proposed residential land uses associated with the project. Table 13 shows the predicted traffic noise levels at the proposed residential uses adjacent to the major project-area roadways.
TABLE 13: TRANSPORTATION NOISE LEVELS AT PROPOSED RESIDENTIAL USES
Noise Source Receptor Description
Approximate Distance to
Outdoor Activity Area,
feet1
ADT Predicted Noise Levels, dB Ldn2
Traffic Noise No Wall 6’ Wall 7’ Wall 8’ Wall 10' Wall
PFE Road Lots 10-13 100 18,968 65.5 60 59 58 56
PFE Road Lots 220-229 130 28,130 65.5 60 59 58 56
North Antelope Road
Lots 123-132, Lots 194-198, Lots 216-220, Lots 288-290
70 31,277 70 64 63 62 60
1 Setback distances are measured in feet from the centerlines of the roadways to the center of residential backyards. If the location of the outdoor activity area is unknown, the distance is measured to the property line. 2 The modeled noise barriers assume flat site conditions where roadway elevations, base of wall elevations, and building pad elevations are approximately equivalent. -- Meets the Placer County exterior noise standard without mitigation. Standard does not apply to second floor facades. Source: FHWA-RD-77-108 with inputs from KD Anderson, and j.c. brennan & associates, Inc. 2017.

j.c. brennan & associates, Inc. Job # 2016-220
Environmental Noise AnalysisMill Creek EIR – Placer County, California
Page 25 of 31
The Table 13 data indicate that predicted exterior noise levels would not comply with the Placer County 60 dB Ldn exterior noise level standard without additional noise control measures. A sound wall of 6-feet in height would reduce exterior traffic noise levels to the 60 dB Ldn standard for lots adjacent to PFE Road. For lots adjacent to North Antelope Road, a barrier 6-feet in height adjacent to North Antelope Road would reduce traffic noise levels within compliance with the 65 dB Ldn upper limit exterior noise level standard. Appendix D provides the complete inputs and results to the FHWA traffic noise prediction model and barrier calculations. Figure 3 shows the locations of the barriers.
Interior Noise Impacts:
Modern construction typically provides a 25 dB exterior-to-interior noise level reduction with windows closed. Therefore, sensitive receptors exposed to exterior noise of 70 dB Ldn, or less, will typically comply with the Placer County 45 dB Ldn interior noise level standard. Additional noise reduction measures, such as acoustically rated windows are generally required for exterior noise levels exceeding 70 dB Ldn.
It should be noted that exterior noise levels are typically 2-3 dB higher at second floor locations. Additionally, noise barriers do not reduce exterior noise levels at second floor locations. The proposed residential uses are predicted to be exposed to unmitigated first floor exterior traffic noise levels ranging between 61-70 dB Ldn. After barriers are constructed, interior noise levels are expected to be 45 dB Ldn or less at first floor locations. Second floor facades are predicted to be exposed to exterior traffic noise levels between 64-73 dB Ldn. Based upon a 25 dB exterior-to-interior noise level reduction, interior traffic noise levels are predicted to range between 39-48 dB Ldn at second story facades. The first row of lots adjacent to Antelope Road are expected to exceed the interior noise level of 45 dB Ldn at second floor facades facing Antelope Road. Therefore, interior noise control measures would be required for traffic noise exposure. Mitigation Measures
The following mitigation measures are required for the Proposed Project to minimize transportation noise impacts on the proposed project.
MM 4a: For lots adjacent to PFE Road, the project applicant shall construct a sound wall
6-feet in height at the property line adjacent to PFE Road, and will comply with the Placer County noise level criterion of 60 dB Ldn. For lots adjacent to North Antelope Road, the project applicant shall construct a sound wall 6-feet in height at the property line adjacent to North Antelope Road, and will comply with the Placer County upper limit exterior noise level standard of 65 dB Ldn. Figure 3 shows the location of the recommended sound walls.
MM 4b: The first row of units facing North Antelope Road shall include windows and
doors with a minimum STC rating of 33. This shall only occur at second floor facades parallel and perpendicular to North Antelope Road. This will result in compliance with the interior noise level standard of 45 dB Ldn.
MM 4c: Mechanical ventilation shall be installed in all residential uses to allow residents
to keep doors and windows closed, as desired for acoustical isolation. Significance after Mitigation: Less-than-significant.

j.c. brennan & associates, Inc. Job # 2016-220
Environmental Noise AnalysisMill Creek EIR – Placer County, California
Page 27 of 31
Impact 5: Non-transportation Noise at Existing and New Sensitive Receptors
The proposed project could expose existing and new noise-sensitive uses to non-transportation noise levels that exceed the Placer County noise level standards. This is considered to be a less than significant impact.
Recreational Areas
The project proposes 3 public parks totaling 4.18 acres. A 1.31-acre park, identified as Park 1 in Figure 1 and Lot D in Figure 3, will be located in the West Village community. The two remaining parks, 1.31-acres and 1.56-acres, are identified as Park 2 and Park 3 in Figure 1, and Lot K and Lot Q in Figure 3, respectively, and will be located in the East Village community. All three parks are located on the interior of the project site and all three parks are proposed to include areas for active sports and seating areas with gazebos. Both East Village parks would be located adjacent to the proposed 16.8-acre open space area, which includes walking trails along the east boundary of the site.
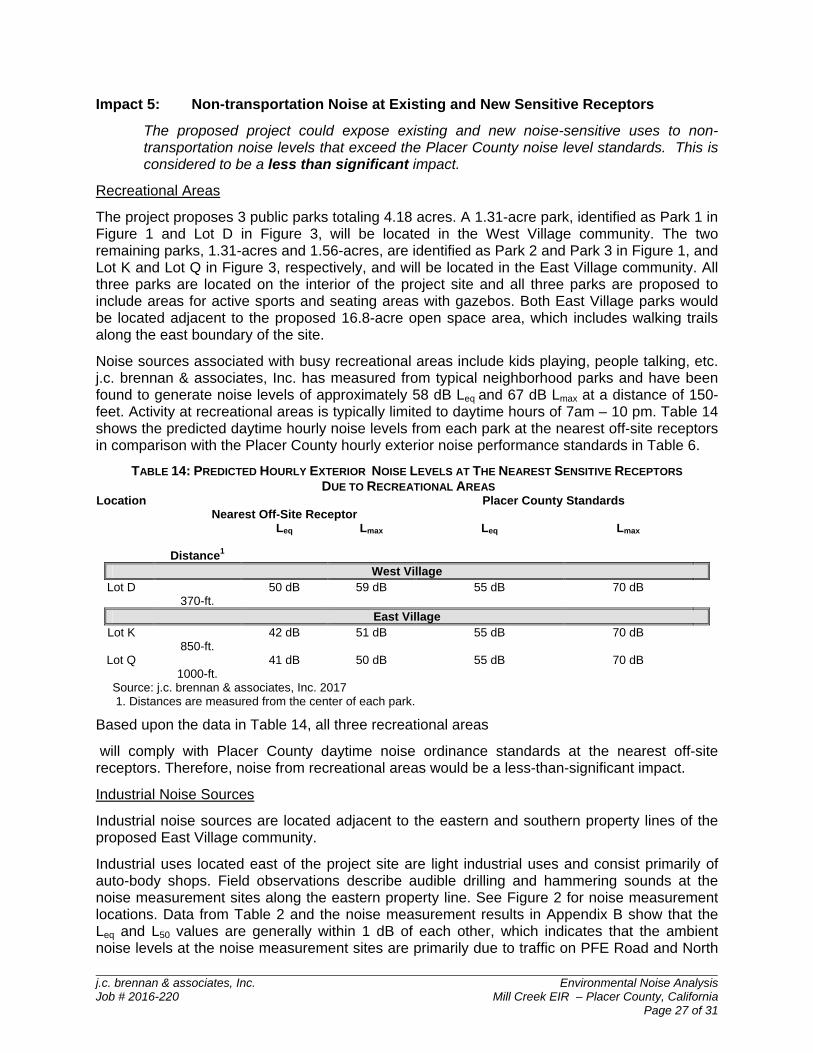
Noise sources associated with busy recreational areas include kids playing, people talking, etc. j.c. brennan & associates, Inc. has measured from typical neighborhood parks and have been found to generate noise levels of approximately 58 dB Leq and 67 dB Lmax at a distance of 150-feet. Activity at recreational areas is typically limited to daytime hours of 7am – 10 pm. Table 14 shows the predicted daytime hourly noise levels from each park at the nearest off-site receptors in comparison with the Placer County hourly exterior noise performance standards in Table 6.
TABLE 14: PREDICTED HOURLY EXTERIOR NOISE LEVELS AT THE NEAREST SENSITIVE RECEPTORS DUE TO RECREATIONAL AREAS
Nearest Off-Site Receptor
Placer County Standards Location
Distance1
Leq Lmax Leq Lmax
West Village Lot D
370-ft. 50 dB 59 dB 55 dB 70 dB
East Village Lot K
850-ft. 42 dB 51 dB 55 dB 70 dB
Lot Q 1000-ft.
41 dB 50 dB 55 dB 70 dB
Source: j.c. brennan & associates, Inc. 2017 1. Distances are measured from the center of each park.
Based upon the data in Table 14, all three recreational areas
will comply with Placer County daytime noise ordinance standards at the nearest off-site receptors. Therefore, noise from recreational areas would be a less-than-significant impact.
Industrial Noise Sources
Industrial noise sources are located adjacent to the eastern and southern property lines of the proposed East Village community.
Industrial uses located east of the project site are light industrial uses and consist primarily of auto-body shops. Field observations describe audible drilling and hammering sounds at the noise measurement sites along the eastern property line. See Figure 2 for noise measurement locations. Data from Table 2 and the noise measurement results in Appendix B show that the Leq and L50 values are generally within 1 dB of each other, which indicates that the ambient noise levels at the noise measurement sites are primarily due to traffic on PFE Road and North

j.c. brennan & associates, Inc. Job # 2016-220
Environmental Noise AnalysisMill Creek EIR – Placer County, California
Page 28 of 31
Antelope Road. Ambient noise levels due to industrial noise sources are typically characterized by a 5 dB difference between Leq and L50 values. Therefore, the industrial noise sources east of the East Village community do not contribute significantly to the ambient noise levels at the residential portion of the project site. Noise from industrial sources east of the project site would be a less-than-significant impact.
The southern property line of the East village community project site is adjacent to Roseville Storage, a truck storage facility. The facility is accessible 24-hours a day, seven days a week and provides services to RV's, boats, and semi-trucks. Field observations at the noise measurement site, shown in Figure 2, describe the truck storage operations as a primary characteristic of background noise levels. Based upon the data in Table 2 and the full noise measurement results in Appendix B, the average daytime and nighttime Leq values and the average daytime and nighttime Lmax values are considered to be representative of the noise levels due to storage facility operations. Table 15 shows the representative noise measurement values. As a part of the project design, the applicant proposes to construct a 10-foot tall sound wall at the storage area property line. Table 16 shows the predicted hourly daytime and nighttime noise levels at the nearest on-site receptors, while accounting for the proposed 10-foot tall cmu masonry wall.
TABLE 15: NOISE MEASUREMENT RESULTS: ROSEVILLE STORAGE 24-HOUR MEASUREMENT SITE B1
Leq Lmax Daytime (7:00 am – 10:00 pm)
63 dB 78 dB Nighttime (10:00 pm – 7:00 am)
53 dB 71 dB Source: j.c. brennan & associates, Inc. 2017 1. Measurement distance is 190-feet, measured from the center of the storage facility to the property line.

j.c. brennan & associates, Inc. Job # 2016-220
Environmental Noise AnalysisMill Creek EIR – Placer County, California
Page 29 of 31
TABLE 16: PREDICTED HOURLY EXTERIOR NOISE LEVELS AT THE NEAREST ON-SITE RECEPTORS ROSEVILLE STORAGE
Predicted Noise Levels Placer County Standards Location Distance1
Leq Lmax Leq Lmax Unmitigated
Daytime (7:00 am – 10:00 pm) Lot 290, Lot 291, Lot 300 245-ft. 55 dB 70 dB 55 dB 70 dB
Nighttime (10:00 pm – 7:00 am) Lot 290, Lot 291, Lot 300 245-ft. 45 dB 68 dB 45 dB 65 dB
Source: j.c. brennan & associates, Inc. 2017 1. Distances are measured from the center of the storage facility to the property line.
Based upon Table 16, the predicted Roseville Storage noise levels at the nearest on-site sensitive receptors would generally comply with the Placer County exterior noise level standards, while including shielding from the proposed 10-foot sound wall. The one exception is that the nighttime maximum noise level is expected to exceed the noise ordinance standard by 3 dB. The Placer County Noise Element also has an interior noise level standard of 45 dB Ldn, as shown in Table 4. Based upon noise measurements at Site B, of the Roseville Storage operations, the measured noise levels without a wall resulted in an overall Ldn of 63 dB. The 10-foot tall wall will result in an Ldn of 55 dB. Interior noise levels will comply with the interior noise level standard of 45 dB Ldn. Appendix E provides the complete inputs and results to the barrier insertion calculations.
Although there is an inconsistency with the Noise Ordinance nighttime maximum noise level standard, the noise levels generally comply with the General Plan and Noise Ordinance standards. The maximum noise levels during the nighttime period would generally only occur during the early morning for approximately 1 hour between 6:00 a.m. and 7:00 a.m., while trucks are idling and leaving the site. This time of day is when people are inside their homes. In addition, the 3 dB increase over the noise level standard would be a barely perceptible increase. Section 9.36.060 allows Exceptions to the standards. In order to properly address this conflict, an exception to the Placer County exterior noise level standard has been included as a project entitlement, requiring Placer County approval (see Chapter 3 of the DEIR, Project Description). Upon County approval of the requested exception, an inconsistency would not occur as a result of the proposed project.
Mitigation
None Required
Appendix A Acoustical Terminology
Acoustics The science of sound.
Ambient Noise The distinctive acoustical characteristics of a given space consisting of all noise sources audible at that location. In many cases, the term ambient is used to describe an existing or pre-project condition such as the setting in an environmental noise study.
Attenuation The reduction of an acoustic signal.
A-Weighting A frequency-response adjustment of a sound level meter that conditions the output signal to approximate human response.
Decibel or dB Fundamental unit of sound, A Bell is defined as the logarithm of the ratio of the sound pressure squared over the reference pressure squared. A Decibel is one-tenth of a Bell.
CNEL Community Noise Equivalent Level. Defined as the 24-hour average noise level with noise occurring during evening hours (7 - 10 p.m.) weighted by a factor of three and nighttime hours weighted by a factor of 10 prior to averaging.
Frequency The measure of the rapidity of alterations of a periodic signal, expressed in cycles per second or hertz (Hz).
Ldn Day/Night Average Sound Level. Similar to CNEL but with no evening weighting.
Leq Equivalent or energy-averaged sound level.
Lmax The highest root-mean-square (RMS) sound level measured over a given period of time.
L(n) The sound level exceeded a described percentile over a measurement period. For instance, an hourly L50 is the sound level exceeded 50% of the time during the one hour period.
Loudness A subjective term for the sensation of the magnitude of sound. Noise Unwanted sound.
NRC Noise Reduction Coefficient. NRC is a single-number rating of the sound-absorption of a material equal to the arithmetic mean of the sound-absorption coefficients in the 250, 500, 1000, and 2,000 Hz octave frequency bands rounded to the nearest multiple of 0.05. It is a representation of the amount of sound energy absorbed upon striking a particular surface. An NRC of 0 indicates perfect reflection; an NRC of 1 indicates perfect absorption.
Peak Noise The level corresponding to the highest (not RMS) sound pressure measured over a given period of time. This term is often confused with the AMaximum@ level, which is the highest RMS level.
RT60 The time it takes reverberant sound to decay by 60 dB once the source has been removed.
Sabin The unit of sound absorption. One square foot of material absorbing 100% of incident sound has an absorption of 1 Sabin.
SEL Sound Exposure Level. SEL is s rating, in decibels, of a discrete event, such as an aircraft flyover or train passby, that compresses the total sound energy into a one-second event.
STC Sound Transmission Class. STC is an integer rating of how well a building partition attenuates airborne sound. It is widely used to rate interior partitions, ceilings/floors, doors, windows and exterior wall configurations.
Threshold The lowest sound that can be perceived by the human auditory system, generally considered to be 0 dB for of Hearing persons with perfect hearing.
Threshold Approximately 120 dB above the threshold of hearing. of Pain Impulsive Sound of short duration, usually less than one second, with an abrupt onset and rapid decay. Simple Tone Any sound which can be judged as audible as a single pitch or set of single pitches.

Appendix B
Hour Leq Lmax L50 L9010:00:00 69.6 84.2 60.9 49.211:00:00 69.3 84.2 60.9 48.5 High Low Average High Low Average12:00:00 69.4 86.8 62.0 48.9 Leq (Average) 73 66 71 71 56 6413:00:00 70.0 84.6 63.6 50.8 Lmax (Maximum) 96 82 87 92 79 8414:00:00 71.6 91.7 68.7 54.9 L50 (Median) 71 52 64 61 42 4815:00:00 72.0 85.4 69.6 56.1 L90 (Background) 58 44 51 52 39 4416:00:00 71.4 85.4 68.9 53.917:00:00 72.3 95.8 69.2 54.5 Computed Ldn, dB 7218:00:00 70.0 87.6 64.6 50.2 % Daytime Energy 87%19:00:00 68.1 83.9 59.3 46.4 % Nighttime Energy 13%20:00:00 66.9 87.7 55.0 44.521:00:00 66.0 82.3 52.2 44.222:00:00 64.5 88.4 47.6 42.423:00:00 60.6 79.7 43.5 39.60:00:00 58.9 80.2 41.9 39.41:00:00 58.1 79.4 44.1 40.92:00:00 56.4 79.9 47.2 43.63:00:00 57.1 79.3 48.2 45.84:00:00 61.9 84.3 47.8 45.45:00:00 67.8 91.6 52.5 46.66:00:00 70.5 91.2 61.0 52.27:00:00 73.1 86.6 71.1 58.18:00:00 72.0 86.7 68.5 54.59:00:00 70.0 92.7 61.9 50.1
Providence Park EIR24hr Continuous Noise Monitoring - Site A
Daytime (7 a.m. - 10 p.m.)
March 28th - 29th, 2017
Statistical SummaryNighttime (10 p.m. - 7 a.m.)

Ldn = 72 dB
Providence Park EIR24hr Continuous Noise Monitoring - Site A
March 28th - 29th, 2017
Appendix B
30.0
40.0
50.0
60.0
70.0
80.0
90.0
100.0
10 AM 2 PM 6 PM 10 PM 2 AM 6 AM
Hour of Day
So
un
d L
evel
, dB
Leq Lmax L50 L90

Appendix B
Hour Leq Lmax L50 L9011:00:00 64.9 83.4 59.8 53.012:00:00 63.9 80.4 58.5 51.9 High Low Average High Low Average13:00:00 68.0 83.8 61.0 53.6 Leq (Average) 68 53 63 58 49 5314:00:00 65.8 81.2 61.1 54.9 Lmax (Maximum) 87 68 78 76 63 7115:00:00 64.6 82.1 59.6 54.4 L50 (Median) 61 50 56 56 47 5016:00:00 65.3 86.5 60.3 54.2 L90 (Background) 55 47 52 53 45 4717:00:00 63.9 78.5 58.9 54.418:00:00 61.1 77.3 56.3 50.5 Computed Ldn, dB 6319:00:00 57.3 77.0 53.6 49.0 % Daytime Energy 94%20:00:00 54.3 74.2 52.2 48.9 % Nighttime Energy 6%21:00:00 53.1 68.1 51.5 47.622:00:00 53.1 69.2 51.1 48.323:00:00 52.9 74.5 48.8 45.20:00:00 49.8 69.2 47.6 45.01:00:00 49.0 63.0 47.4 44.72:00:00 52.5 70.6 49.8 45.83:00:00 50.5 71.4 48.3 45.54:00:00 51.3 69.5 49.3 46.85:00:00 54.9 74.6 51.9 49.46:00:00 58.0 76.3 56.3 52.97:00:00 59.9 82.6 57.8 55.18:00:00 54.6 70.4 52.9 49.99:00:00 53.3 70.4 51.0 48.4
10:00:00 53.9 72.3 49.8 47.0
Providence Park EIR24hr Continuous Noise Monitoring - Site B
Daytime (7 a.m. - 10 p.m.)
March 28th - 29th, 2017
Statistical SummaryNighttime (10 p.m. - 7 a.m.)

Ldn = 63 dB
Providence Park EIR24hr Continuous Noise Monitoring - Site B
March 28th - 29th, 2017
Appendix B
30.0
40.0
50.0
60.0
70.0
80.0
90.0
100.0
11 AM 3 PM 7 PM 11 PM 3 AM 7 AM
Hour of Day
So
un
d L
evel
, dB
Leq Lmax L50 L90
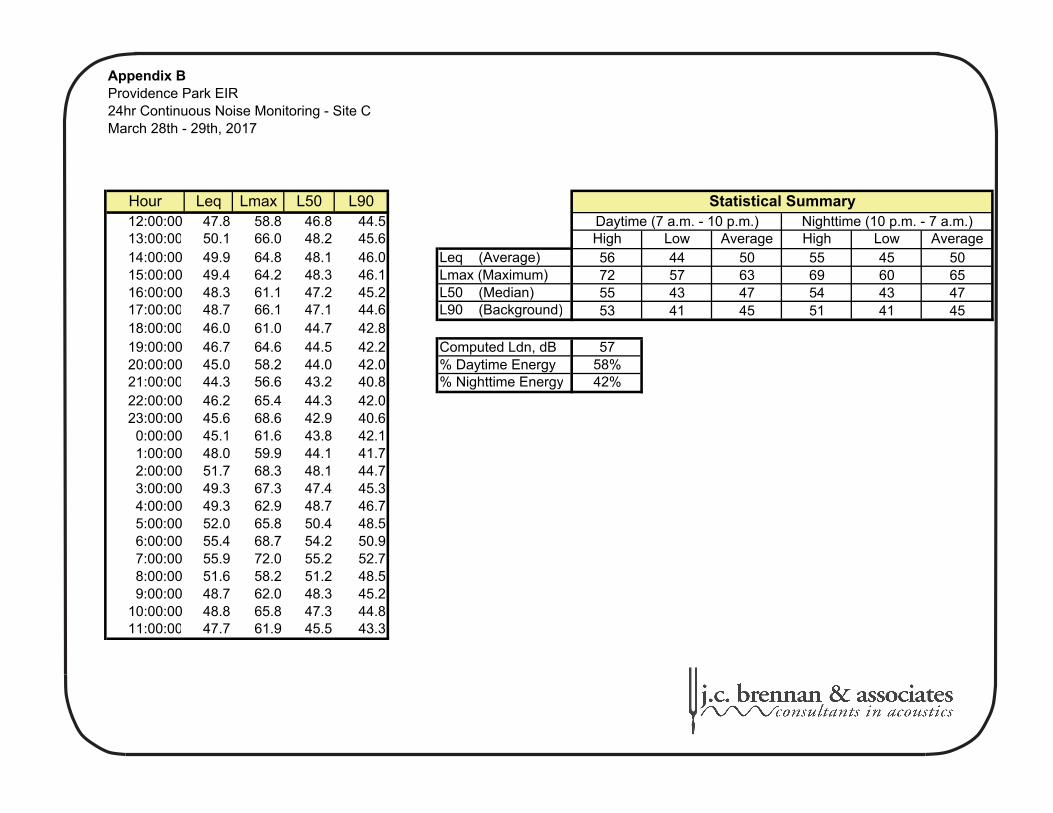
Appendix B
Hour Leq Lmax L50 L9012:00:00 47.8 58.8 46.8 44.513:00:00 50.1 66.0 48.2 45.6 High Low Average High Low Average14:00:00 49.9 64.8 48.1 46.0 Leq (Average) 56 44 50 55 45 5015:00:00 49.4 64.2 48.3 46.1 Lmax (Maximum) 72 57 63 69 60 6516:00:00 48.3 61.1 47.2 45.2 L50 (Median) 55 43 47 54 43 4717:00:00 48.7 66.1 47.1 44.6 L90 (Background) 53 41 45 51 41 4518:00:00 46.0 61.0 44.7 42.819:00:00 46.7 64.6 44.5 42.2 Computed Ldn, dB 5720:00:00 45.0 58.2 44.0 42.0 % Daytime Energy 58%21:00:00 44.3 56.6 43.2 40.8 % Nighttime Energy 42%22:00:00 46.2 65.4 44.3 42.023:00:00 45.6 68.6 42.9 40.60:00:00 45.1 61.6 43.8 42.11:00:00 48.0 59.9 44.1 41.72:00:00 51.7 68.3 48.1 44.73:00:00 49.3 67.3 47.4 45.34:00:00 49.3 62.9 48.7 46.75:00:00 52.0 65.8 50.4 48.56:00:00 55.4 68.7 54.2 50.97:00:00 55.9 72.0 55.2 52.78:00:00 51.6 58.2 51.2 48.59:00:00 48.7 62.0 48.3 45.2
10:00:00 48.8 65.8 47.3 44.811:00:00 47.7 61.9 45.5 43.3
Providence Park EIR24hr Continuous Noise Monitoring - Site C
Daytime (7 a.m. - 10 p.m.)
March 28th - 29th, 2017
Statistical SummaryNighttime (10 p.m. - 7 a.m.)

Ldn = 57 dB
Providence Park EIR24hr Continuous Noise Monitoring - Site C
March 28th - 29th, 2017
Appendix B
30.0
40.0
50.0
60.0
70.0
80.0
90.0
100.0
12 PM 4 PM 8 PM 12 AM 4 AM 8 AM
Hour of Day
So
un
d L
evel
, dB
Leq Lmax L50 L90

Appendix BShort-Term Noise Monitoring Summary
Project: Providence Park EIRLocation: Site 1 Calibrator: LDL CAL 200
Date: 3/28/2017 Wind Speed: 16 mph N-NWTime: 11:34 AM Weather: Clear, 39 % Humidity, 65 degrees FSLM: Larson Davis Model 824-1 Field Tech: AT
Measurement Results, dBA
Duration: 0:10Leq: 59.2 dBA
Lmax: 71.6 dBALmin: 49.1 dBAL50: 56.0 dBAL90: 51.4 dBA
NotesTraffic on Antelope Road is the main source of noise. Well/generator not providing noise. Train horn audible. 29
31
33
37
43
46 45 45 43
43 42 41 41
45
50
51
51 50 48
45 43
40 39 37 37
28
29
43
50
59
66
58
63
59
55
50 51
50 51
60 60
62 61
59
55
52
49
46
44
40
0
10
20
30
40
50
60
70
80
90
100
31.5 40 50 63 80 100
125
160
200
250
315
400
500
630
800
1000
1250
1600
2000
2500
3150
4000
5000
6300
8000
1/3 Octave Band Center Frequency, Hz
So
un
d P
ress
ure
Lev
el, d
BA
Leq Lmax
Noise Measurement Site

Appendix BShort-Term Noise Monitoring Summary
Project: Providence Park EIRLocation: Site 2 Calibrator: LDL CAL 200
Date: 3/28/2017 Wind Speed: 16 mph N-NWTime: 12:02 PM Weather: Clear, 39 % Humidity, 65 degrees FSLM: Larson Davis Model 824-1 Field Tech: AT
Measurement Results, dBA
Duration: 0:10Leq: 66.2 dBA
Lmax: 87.6 dBALmin: 50.8 dBAL50: 53.3 dBAL90: 52.1 dBA
NotesIntersection has significant traffic and is primary source of noise.
26
29
35
39
45
47
52 50 49 47
50 50
51
53
55
56
57
58
58 56 54 52 50
53
45
31
35
36
43
60
65
56
66 67
62
73 74
72
73
76 76 77
80
81
78
76
74
72
67
62
0
10
20
30
40
50
60
70
80
90
100
31.5 40 50 63 80 100
125
160
200
250
315
400
500
630
800
1000
1250
1600
2000
2500
3150
4000
5000
6300
8000
1/3 Octave Band Center Frequency, Hz
So
un
d P
ress
ure
Lev
el, d
BA
Leq Lmax
Noise Measurement Site
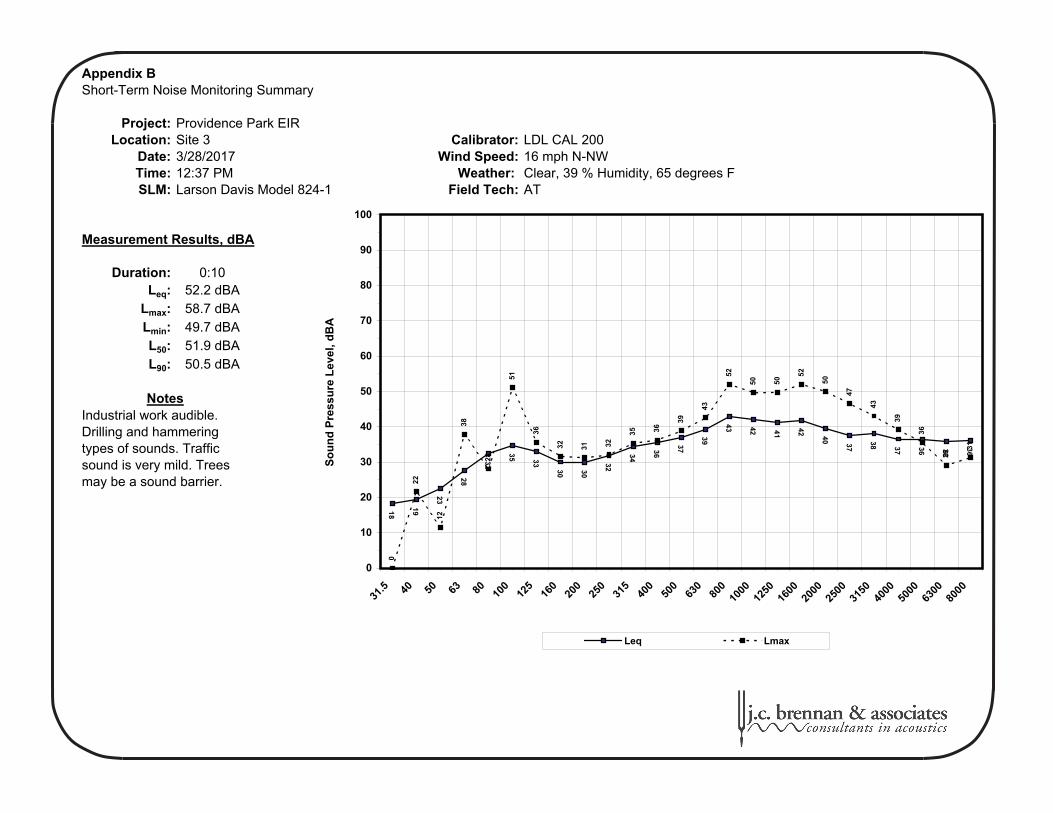
Appendix BShort-Term Noise Monitoring Summary
Project: Providence Park EIRLocation: Site 3 Calibrator: LDL CAL 200
Date: 3/28/2017 Wind Speed: 16 mph N-NWTime: 12:37 PM Weather: Clear, 39 % Humidity, 65 degrees FSLM: Larson Davis Model 824-1 Field Tech: AT
Measurement Results, dBA
Duration: 0:10Leq: 52.2 dBA
Lmax: 58.7 dBALmin: 49.7 dBAL50: 51.9 dBAL90: 50.5 dBA
NotesIndustrial work audible. Drilling and hammering types of sounds. Traffic sound is very mild. Trees may be a sound barrier.
18
19
23
28
32
35 33
30 30
32
34
36
37
39
43 42 41
42 40 37
38 37 36 36
36
0
22
12
38
28
51
36
32 31 32
35 36
39
43
52
50 50
52
50
47
43
39
36
29
31
0
10
20
30
40
50
60
70
80
90
100
31.5 40 50 63 80 100
125
160
200
250
315
400
500
630
800
1000
1250
1600
2000
2500
3150
4000
5000
6300
8000
1/3 Octave Band Center Frequency, Hz
So
un
d P
ress
ure
Lev
el, d
BA
Leq Lmax
Noise Measurement Site

Appendix BShort-Term Noise Monitoring Summary
Project: Providence Park EIRLocation: Site 4 Calibrator: LDL CAL 200
Date: 3/28/2017 Wind Speed: 16 mph N-NWTime: 1:35 PM Weather: Clear, 39 % Humidity, 65 degrees FSLM: Larson Davis Model 824-1 Field Tech: AT
Measurement Results, dBA
Duration: 0:10Leq: 53.4 dBA
Lmax: 65.0 dBALmin: 49.4 dBAL50: 52.8 dBAL90: 50.0 dBA
NotesStrong winds through grass and trees are loudest noise. Traffic inaudible. Landscaping equipment in use ~300 feet away.
23
26
28
30
31
34
42 40 38
40 38
40 39
39
41 40 40
41 41
41
41 40 39 38 37
15
13
21
27
33
37
65
43
41
51
42
50
48
44
42 42 41 41 41
43
42
40
38
33 32
0
10
20
30
40
50
60
70
80
90
100
31.5 40 50 63 80 100
125
160
200
250
315
400
500
630
800
1000
1250
1600
2000
2500
3150
4000
5000
6300
8000
1/3 Octave Band Center Frequency, Hz
So
un
d P
ress
ure
Lev
el, d
BA
Leq Lmax
Noise Measurement Site

Project #:Description:Ldn/CNEL: LdnHard/Soft: Soft
Segment Roadway Name Segment Description ADT Day % Eve % Night %
% Med. Trucks
% Hvy. Trucks Speed Distance Offset (dB)
1 PFE Road Watt Avenue to Walerga Road 4,326 85 15 2.0 1 45 752 PFE Road Walerga Road to Oly Lane 5,543 85 15 2.0 1 45 753 PFE Road Oly Lane to Cook Riolo Road 5,636 85 15 2.0 1 45 754 PFE Road Cook Riolo Rd to N. Antelope Rd 7,229 85 15 2.0 1 45 755 PFE Road N. Antelope Rd to Hilltop Rd 8,720 85 15 2.0 1 45 756 Cook Riolo Road Baseline Rd to Vineyard Rd 3,355 85 15 2.0 1 35 757 Cook Riolo Road Vineyard Road to CRES 4,347 85 15 2.0 1 35 758 Cook Riolo Road CRES to PFE Road 3,208 85 15 2.0 1 35 759 Cook Riolo Road South of PFE Road 401 85 15 2.0 1 35 7510 North Antelope Road PFE Road to Great Valley Drive 7,388 85 15 2.0 1 45 7511 North Antelope Road Great Valley Drive to Poker Lane 8,508 85 15 2.0 1 45 751213141516171819202122232425262728293031323334
Appendix C
2016-220
FHWA-RD-77-108 Highway Traffic Noise Prediction Model
Existing
Data Input Sheet

Project #:Description:Ldn/CNEL:Hard/Soft:
Medium HeavySegment Roadway Name Autos Trucks Trucks Total
1 PFE Road 59.7 51.1 52.6 61.02 PFE Road 60.8 52.2 53.7 62.03 PFE Road 60.9 52.3 53.7 62.14 PFE Road 61.9 53.3 54.8 63.25 PFE Road 62.8 54.2 55.6 64.06 Cook Riolo Road 55.5 48.3 50.5 57.37 Cook Riolo Road 56.6 49.4 51.6 58.48 Cook Riolo Road 55.3 48.1 50.3 57.19 Cook Riolo Road 46.2 39.1 41.3 48.0
10 North Antelope Road 62.0 53.4 54.9 63.311 North Antelope Road 62.7 54.0 55.5 63.9
Segment DescriptionWatt Avenue to Walerga RoadWalerga Road to Oly LaneOly Lane to Cook Riolo RoadCook Riolo Rd to N. Antelope RdN. Antelope Rd to Hilltop RdBaseline Rd to Vineyard Rd
Great Valley Drive to Poker Lane
Vineyard Road to CRESCRES to PFE RoadSouth of PFE RoadPFE Road to Great Valley Drive
Appendix C
2016-220
LdnSoft
Existing
FHWA-RD-77-108 Highway Traffic Noise Prediction ModelPredicted Levels
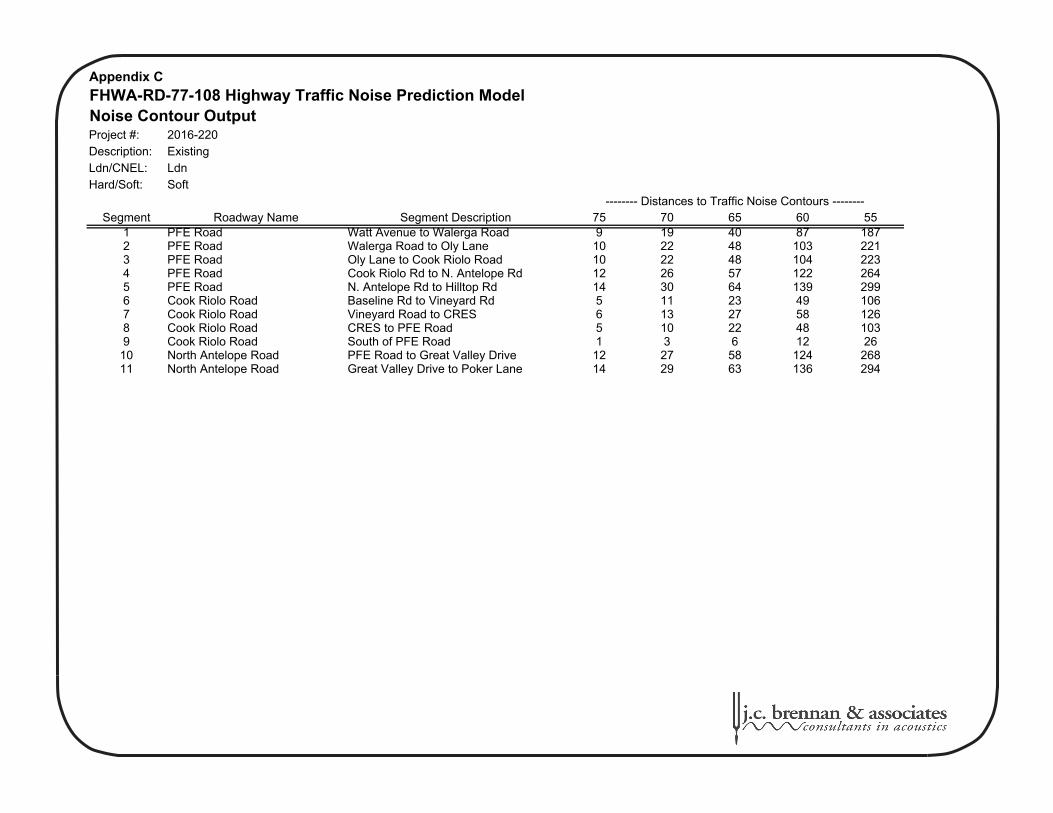
Project #:Description:Ldn/CNEL:Hard/Soft:
Segment Roadway Name Segment Description 75 70 65 60 551 PFE Road Watt Avenue to Walerga Road 9 19 40 87 1872 PFE Road Walerga Road to Oly Lane 10 22 48 103 2213 PFE Road Oly Lane to Cook Riolo Road 10 22 48 104 2234 PFE Road Cook Riolo Rd to N. Antelope Rd 12 26 57 122 2645 PFE Road N. Antelope Rd to Hilltop Rd 14 30 64 139 2996 Cook Riolo Road Baseline Rd to Vineyard Rd 5 11 23 49 1067 Cook Riolo Road Vineyard Road to CRES 6 13 27 58 1268 Cook Riolo Road CRES to PFE Road 5 10 22 48 1039 Cook Riolo Road South of PFE Road 1 3 6 12 26
10 North Antelope Road PFE Road to Great Valley Drive 12 27 58 124 26811 North Antelope Road Great Valley Drive to Poker Lane 14 29 63 136 294
Existing
-------- Distances to Traffic Noise Contours --------
LdnSoft
FHWA-RD-77-108 Highway Traffic Noise Prediction ModelNoise Contour Output
Appendix C
2016-220
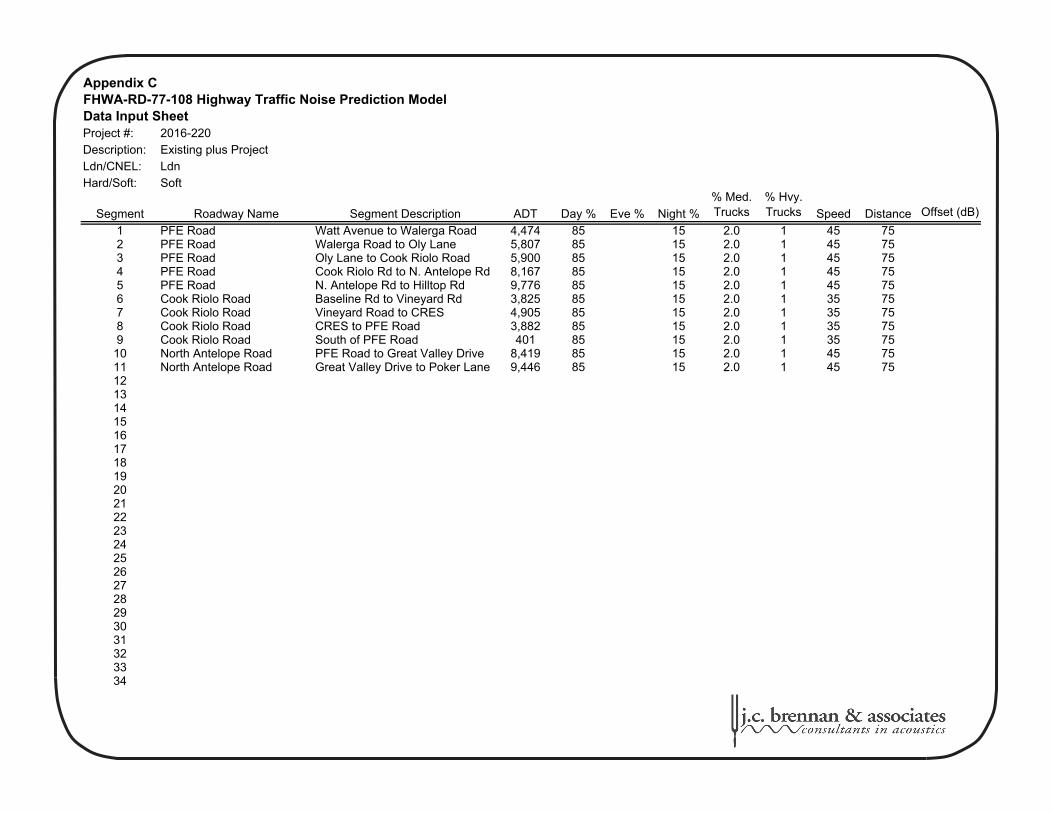
Project #:Description:Ldn/CNEL: LdnHard/Soft: Soft
Segment Roadway Name Segment Description ADT Day % Eve % Night %
% Med. Trucks
% Hvy. Trucks Speed Distance Offset (dB)
1 PFE Road Watt Avenue to Walerga Road 4,474 85 15 2.0 1 45 752 PFE Road Walerga Road to Oly Lane 5,807 85 15 2.0 1 45 753 PFE Road Oly Lane to Cook Riolo Road 5,900 85 15 2.0 1 45 754 PFE Road Cook Riolo Rd to N. Antelope Rd 8,167 85 15 2.0 1 45 755 PFE Road N. Antelope Rd to Hilltop Rd 9,776 85 15 2.0 1 45 756 Cook Riolo Road Baseline Rd to Vineyard Rd 3,825 85 15 2.0 1 35 757 Cook Riolo Road Vineyard Road to CRES 4,905 85 15 2.0 1 35 758 Cook Riolo Road CRES to PFE Road 3,882 85 15 2.0 1 35 759 Cook Riolo Road South of PFE Road 401 85 15 2.0 1 35 7510 North Antelope Road PFE Road to Great Valley Drive 8,419 85 15 2.0 1 45 7511 North Antelope Road Great Valley Drive to Poker Lane 9,446 85 15 2.0 1 45 751213141516171819202122232425262728293031323334
Appendix C
2016-220
FHWA-RD-77-108 Highway Traffic Noise Prediction Model
Existing plus Project
Data Input Sheet

Project #:Description:Ldn/CNEL:Hard/Soft:
Medium HeavySegment Roadway Name Autos Trucks Trucks Total
1 PFE Road 59.9 51.3 52.7 61.12 PFE Road 61.0 52.4 53.9 62.23 PFE Road 61.1 52.5 53.9 62.34 PFE Road 62.5 53.9 55.4 63.75 PFE Road 63.3 54.6 56.1 64.56 Cook Riolo Road 56.0 48.9 51.1 57.87 Cook Riolo Road 57.1 50.0 52.1 58.98 Cook Riolo Road 56.1 48.9 51.1 57.99 Cook Riolo Road 46.2 39.1 41.3 48.0
10 North Antelope Road 62.6 54.0 55.5 63.911 North Antelope Road 63.1 54.5 56.0 64.4
Existing plus Project
FHWA-RD-77-108 Highway Traffic Noise Prediction ModelPredicted Levels
Appendix C
2016-220
LdnSoft
Vineyard Road to CRESCRES to PFE RoadSouth of PFE RoadPFE Road to Great Valley Drive
Watt Avenue to Walerga RoadWalerga Road to Oly LaneOly Lane to Cook Riolo RoadCook Riolo Rd to N. Antelope RdN. Antelope Rd to Hilltop RdBaseline Rd to Vineyard Rd
Great Valley Drive to Poker Lane
Segment Description

Project #:Description:Ldn/CNEL:Hard/Soft:
Segment Roadway Name Segment Description 75 70 65 60 551 PFE Road Watt Avenue to Walerga Road 9 19 41 89 1912 PFE Road Walerga Road to Oly Lane 11 23 49 106 2283 PFE Road Oly Lane to Cook Riolo Road 11 23 50 107 2304 PFE Road Cook Riolo Rd to N. Antelope Rd 13 29 62 133 2865 PFE Road N. Antelope Rd to Hilltop Rd 15 32 69 150 3226 Cook Riolo Road Baseline Rd to Vineyard Rd 5 12 25 54 1167 Cook Riolo Road Vineyard Road to CRES 6 14 29 63 1378 Cook Riolo Road CRES to PFE Road 5 12 25 54 1179 Cook Riolo Road South of PFE Road 1 3 6 12 26
10 North Antelope Road PFE Road to Great Valley Drive 14 29 63 135 29211 North Antelope Road Great Valley Drive to Poker Lane 15 32 68 146 315
FHWA-RD-77-108 Highway Traffic Noise Prediction ModelNoise Contour Output
Appendix C
2016-220Existing plus Project
-------- Distances to Traffic Noise Contours --------
LdnSoft

Project #:Description:Ldn/CNEL: LdnHard/Soft: Soft
Segment Roadway Name Segment Description ADT Day % Eve % Night %
% Med. Trucks
% Hvy. Trucks Speed Distance Offset (dB)
1 PFE Road Watt Avenue to Walerga Road 11,345 85 15 2.0 1 45 752 PFE Road Walerga Road to Oly Lane 11,284 85 15 2.0 1 45 753 PFE Road Oly Lane to Cook Riolo Road 12,011 85 15 2.0 1 45 754 PFE Road Cook Riolo Rd to N. Antelope Rd 18,030 85 15 2.0 1 45 755 PFE Road N. Antelope Rd to Hilltop Rd 27,074 85 15 2.0 1 45 756 Cook Riolo Road Baseline Rd to Vineyard Rd 12,945 85 15 2.0 1 35 757 Cook Riolo Road Vineyard Road to CRES 17,294 85 15 2.0 1 35 758 Cook Riolo Road CRES to PFE Road 14,555 85 15 2.0 1 35 759 Cook Riolo Road South of PFE Road 401 85 15 2.0 1 35 7510 North Antelope Road PFE Road to Great Valley Drive 30,246 85 15 2.0 1 45 7511 North Antelope Road Great Valley Drive to Poker Lane 31,588 85 15 2.0 1 45 751213141516171819202122232425262728293031323334
Appendix C
2016-220
FHWA-RD-77-108 Highway Traffic Noise Prediction Model
Cumulative
Data Input Sheet

Project #:Description:Ldn/CNEL:Hard/Soft:
Medium HeavySegment Roadway Name Autos Trucks Trucks Total
1 PFE Road 63.9 55.3 56.8 65.12 PFE Road 63.9 55.3 56.8 65.13 PFE Road 64.1 55.5 57.0 65.44 PFE Road 65.9 57.3 58.8 67.25 PFE Road 67.7 59.1 60.6 68.96 Cook Riolo Road 61.3 54.2 56.4 63.17 Cook Riolo Road 62.6 55.4 57.6 64.48 Cook Riolo Road 61.8 54.7 56.9 63.69 Cook Riolo Road 46.2 39.1 41.3 48.0
10 North Antelope Road 68.2 59.6 61.0 69.411 North Antelope Road 68.3 59.7 61.2 69.6
Cumulative
FHWA-RD-77-108 Highway Traffic Noise Prediction ModelPredicted Levels
Appendix C
2016-220
LdnSoft
Vineyard Road to CRESCRES to PFE RoadSouth of PFE RoadPFE Road to Great Valley Drive
Watt Avenue to Walerga RoadWalerga Road to Oly LaneOly Lane to Cook Riolo RoadCook Riolo Rd to N. Antelope RdN. Antelope Rd to Hilltop RdBaseline Rd to Vineyard Rd
Great Valley Drive to Poker Lane
Segment Description

Project #:Description:Ldn/CNEL:Hard/Soft:
Segment Roadway Name Segment Description 75 70 65 60 551 PFE Road Watt Avenue to Walerga Road 17 36 77 165 3562 PFE Road Walerga Road to Oly Lane 16 35 76 165 3553 PFE Road Oly Lane to Cook Riolo Road 17 37 80 172 3704 PFE Road Cook Riolo Rd to N. Antelope Rd 23 48 104 225 4855 PFE Road N. Antelope Rd to Hilltop Rd 30 64 137 295 6366 Cook Riolo Road Baseline Rd to Vineyard Rd 12 26 56 121 2617 Cook Riolo Road Vineyard Road to CRES 15 32 68 147 3168 Cook Riolo Road CRES to PFE Road 13 28 61 131 2829 Cook Riolo Road South of PFE Road 1 3 6 12 26
10 North Antelope Road PFE Road to Great Valley Drive 32 68 147 318 68511 North Antelope Road Great Valley Drive to Poker Lane 33 70 152 327 705
FHWA-RD-77-108 Highway Traffic Noise Prediction ModelNoise Contour Output
Appendix C
2016-220Cumulative
-------- Distances to Traffic Noise Contours --------
LdnSoft

Project #:Description:Ldn/CNEL: LdnHard/Soft: Soft
Segment Roadway Name Segment Description ADT Day % Eve % Night %
% Med. Trucks
% Hvy. Trucks Speed Distance Offset (dB)
1 PFE Road Watt Avenue to Walerga Road 11,493 85 15 2.0 1 45 752 PFE Road Walerga Road to Oly Lane 11,548 85 15 2.0 1 45 753 PFE Road Oly Lane to Cook Riolo Road 12,275 85 15 2.0 1 45 754 PFE Road Cook Riolo Rd to N. Antelope Rd 18,968 85 15 2.0 1 45 755 PFE Road N. Antelope Rd to Hilltop Rd 28,130 85 15 2.0 1 45 756 Cook Riolo Road Baseline Rd to Vineyard Rd 13,415 85 15 2.0 1 35 757 Cook Riolo Road Vineyard Road to CRES 17,852 85 15 2.0 1 35 758 Cook Riolo Road CRES to PFE Road 15,229 85 15 2.0 1 35 759 Cook Riolo Road South of PFE Road 401 85 15 2.0 1 35 7510 North Antelope Road PFE Road to Great Valley Drive 31,277 85 15 2.0 1 45 7511 North Antelope Road Great Valley Drive to Poker Lane 32,526 85 15 2.0 1 45 751213141516171819202122232425262728293031323334
Appendix C
2016-220
FHWA-RD-77-108 Highway Traffic Noise Prediction Model
Cumulative plus Project
Data Input Sheet

Project #:Description:Ldn/CNEL:Hard/Soft:
Medium HeavySegment Roadway Name Autos Trucks Trucks Total
1 PFE Road 64.0 55.4 56.8 65.22 PFE Road 64.0 55.4 56.9 65.23 PFE Road 64.2 55.6 57.1 65.54 PFE Road 66.1 57.5 59.0 67.45 PFE Road 67.8 59.2 60.7 69.16 Cook Riolo Road 61.5 54.3 56.5 63.37 Cook Riolo Road 62.7 55.6 57.7 64.58 Cook Riolo Road 62.0 54.9 57.1 63.89 Cook Riolo Road 46.2 39.1 41.3 48.0
10 North Antelope Road 68.3 59.7 61.2 69.611 North Antelope Road 68.5 59.9 61.4 69.7
Cumulative plus Project
FHWA-RD-77-108 Highway Traffic Noise Prediction ModelPredicted Levels
Appendix C
2016-220
LdnSoft
Vineyard Road to CRESCRES to PFE RoadSouth of PFE RoadPFE Road to Great Valley Drive
Watt Avenue to Walerga RoadWalerga Road to Oly LaneOly Lane to Cook Riolo RoadCook Riolo Rd to N. Antelope RdN. Antelope Rd to Hilltop RdBaseline Rd to Vineyard Rd
Great Valley Drive to Poker Lane
Segment Description
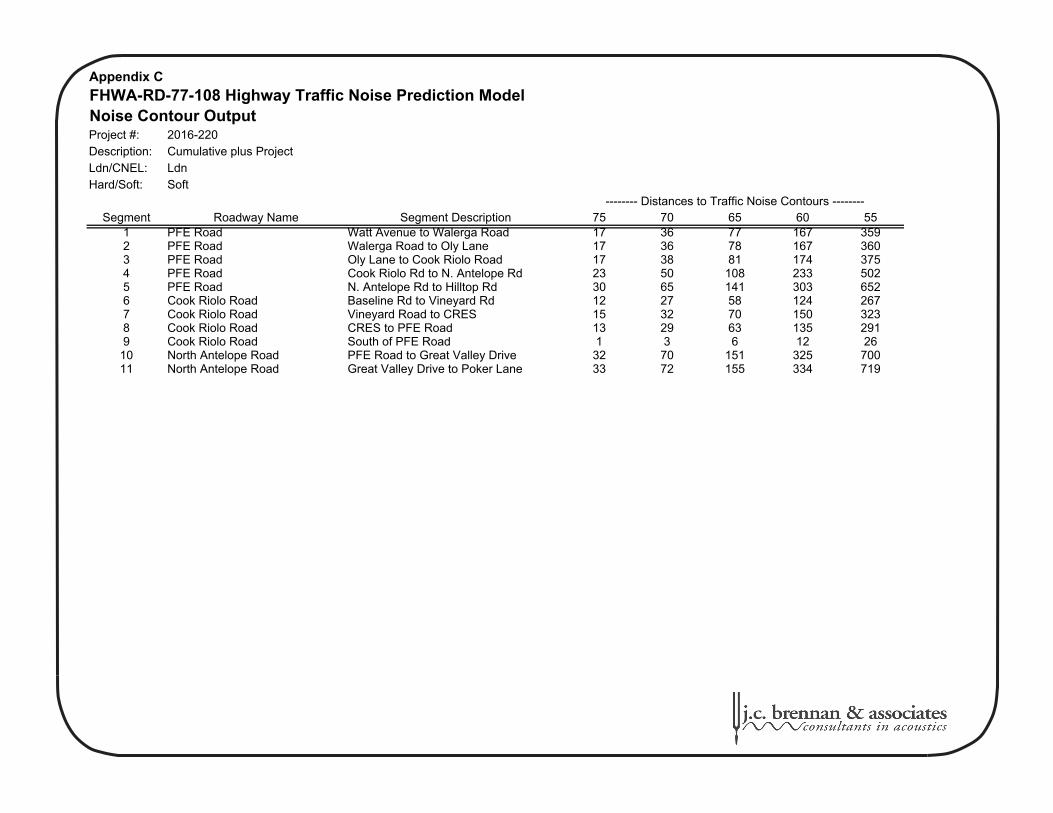
Project #:Description:Ldn/CNEL:Hard/Soft:
Segment Roadway Name Segment Description 75 70 65 60 551 PFE Road Watt Avenue to Walerga Road 17 36 77 167 3592 PFE Road Walerga Road to Oly Lane 17 36 78 167 3603 PFE Road Oly Lane to Cook Riolo Road 17 38 81 174 3754 PFE Road Cook Riolo Rd to N. Antelope Rd 23 50 108 233 5025 PFE Road N. Antelope Rd to Hilltop Rd 30 65 141 303 6526 Cook Riolo Road Baseline Rd to Vineyard Rd 12 27 58 124 2677 Cook Riolo Road Vineyard Road to CRES 15 32 70 150 3238 Cook Riolo Road CRES to PFE Road 13 29 63 135 2919 Cook Riolo Road South of PFE Road 1 3 6 12 26
10 North Antelope Road PFE Road to Great Valley Drive 32 70 151 325 70011 North Antelope Road Great Valley Drive to Poker Lane 33 72 155 334 719
FHWA-RD-77-108 Highway Traffic Noise Prediction ModelNoise Contour Output
Appendix C
2016-220Cumulative plus Project
-------- Distances to Traffic Noise Contours --------
LdnSoft

Project #:Description:Ldn/CNEL: LdnHard/Soft: Soft
Segment Roadway Name ADT Day % Eve % Night %% Med. Trucks
% Hvy. Trucks Speed Distance
Offset (dB)
1 PFE Road 18,968 85 15 2 1 45 1300 -102 PFE Road 18,968 85 15 2 1 45 680 -103 PFE Road 18,968 85 15 2 1 45 445 -104 PFE Road 18,968 85 15 2 1 45 1005 PFE Road 18,968 85 15 2 1 45 6656 PFE Road 28,130 85 15 2 1 45 1307 PFE Road 28,130 85 15 2 1 45 3058 PFE Road 28,130 85 15 2 1 45 8659 Cook Riolo Road 401 85 15 2 1 35 5010 Cook Riolo Road 401 85 15 2 1 35 40011 Cook Riolo Road 401 85 15 2 1 35 490 -1012 Cook Riolo Road 401 85 15 2 1 35 865 -1013 North Antelope Road 31,277 85 15 2 1 45 7014 North Antelope Road 31,277 85 15 2 1 45 7015 North Antelope Road 31,277 85 15 2 1 45 7016 North Antelope Road 31,277 85 15 2 1 45 7017 North Antelope Road 31,277 85 15 2 1 45 701819202122232425
Lot 72Lots 63-70Lots 20-24
Appendix D
2016-220
Segment Description
FHWA-RD-77-108 Highway Traffic Noise Prediction Model
Impact (Cumulative + Project)
Data Input Sheet
Lots 198-215Lots 220-229Lots 238-240Lot 308
Lots 72-77Lot 83Lots 20-24Lots 10-13
Lots 13-14Lots 123-132Lots 194-198Lots 216-221Lots 269-276Lots 288-290

Project #:Description:Ldn/CNEL:Hard/Soft:
Medium HeavySegment Roadway Name Autos Trucks Trucks Total
1 PFE Road 37.6 28.9 30.4 38.82 PFE Road 41.8 33.2 34.7 43.03 PFE Road 44.5 35.9 37.4 45.84 PFE Road 64.3 55.7 57.1 65.55 PFE Road 51.9 43.3 44.8 53.26 PFE Road 64.3 55.7 57.1 65.57 PFE Road 58.7 50.1 51.6 60.08 PFE Road 51.9 43.3 44.8 53.29 Cook Riolo Road 48.9 41.7 43.9 50.7
10 Cook Riolo Road 35.3 28.2 30.4 37.111 Cook Riolo Road 24.0 16.8 19.0 25.812 Cook Riolo Road 20.3 13.1 15.3 22.113 North Antelope Road 68.8 60.1 61.6 70.014 North Antelope Road 68.8 60.1 61.6 70.015 North Antelope Road 68.8 60.1 61.6 70.016 North Antelope Road 68.8 60.1 61.6 70.017 North Antelope Road 68.8 60.1 61.6 70.0
Appendix D
2016-220
LdnSoft
Impact (Cumulative + Project)
Segment Description
FHWA-RD-77-108 Highway Traffic Noise Prediction ModelPredicted Levels
Lot 72Lots 63-70Lots 20-24Lots 13-14
Lots 198-215Lots 220-229Lots 238-240Lot 308
Lots 72-77Lot 83Lots 20-24Lots 10-13
Lots 123-132Lots 194-198Lots 216-221Lots 269-276Lots 288-290
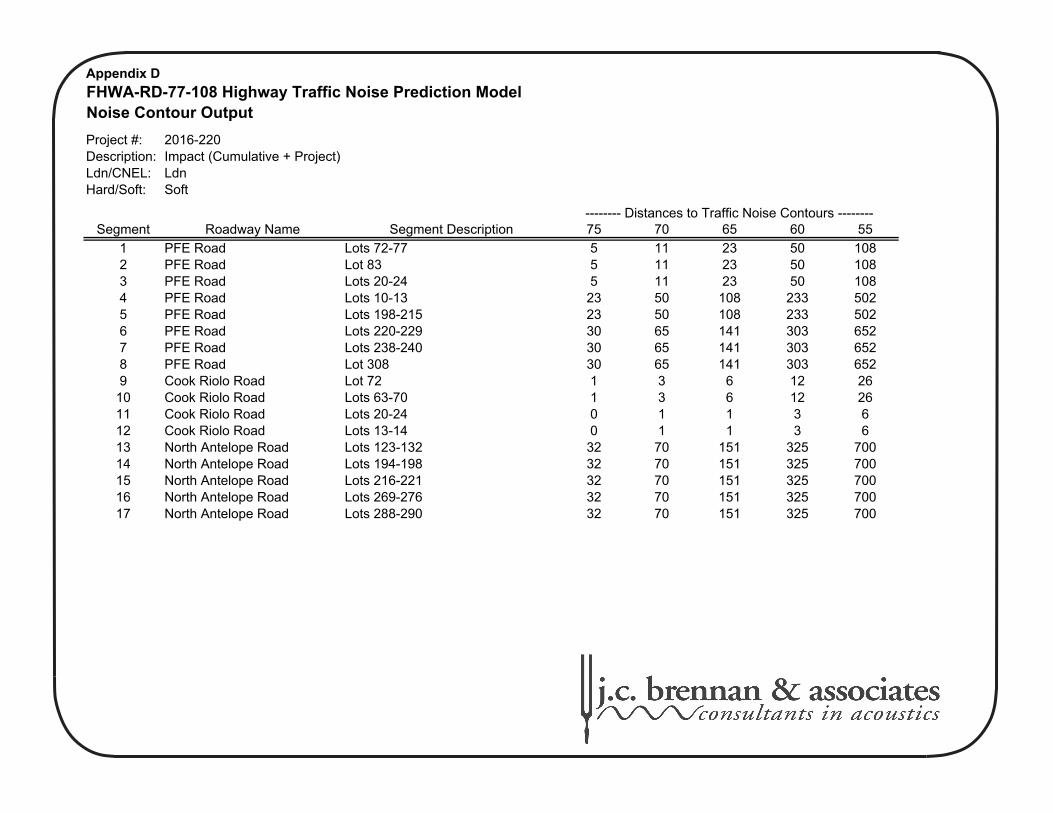
Project #:Description:Ldn/CNEL:Hard/Soft:
Segment Roadway Name 75 70 65 60 55
1 PFE Road 5 11 23 50 1082 PFE Road 5 11 23 50 1083 PFE Road 5 11 23 50 1084 PFE Road 23 50 108 233 5025 PFE Road 23 50 108 233 5026 PFE Road 30 65 141 303 6527 PFE Road 30 65 141 303 6528 PFE Road 30 65 141 303 6529 Cook Riolo Road 1 3 6 12 26
10 Cook Riolo Road 1 3 6 12 2611 Cook Riolo Road 0 1 1 3 612 Cook Riolo Road 0 1 1 3 613 North Antelope Road 32 70 151 325 70014 North Antelope Road 32 70 151 325 70015 North Antelope Road 32 70 151 325 70016 North Antelope Road 32 70 151 325 70017 North Antelope Road 32 70 151 325 700
Impact (Cumulative + Project)
Segment Description-------- Distances to Traffic Noise Contours --------
LdnSoft
FHWA-RD-77-108 Highway Traffic Noise Prediction ModelNoise Contour Output
Appendix D
2016-220
Lot 72Lots 63-70Lots 20-24Lots 13-14
Lots 198-215Lots 220-229Lots 238-240Lot 308
Lots 72-77Lot 83Lots 20-24Lots 10-13
Lots 123-132Lots 194-198Lots 216-221Lots 269-276Lots 288-290

64
56
57
100
20
0280506
Autos
Medium Trucks
Heavy Trucks Total Autos?
Medium Trucks?
Heavy Trucks?
6 58 50 52 60 Yes Yes Yes7 57 49 52 59 Yes Yes Yes8 56 48 50 58 Yes Yes Yes9 55 47 49 57 Yes Yes Yes10 54 46 48 56 Yes Yes Yes11 53 45 47 55 Yes Yes Yes12 53 44 46 54 Yes Yes Yes13 52 43 46 53 Yes Yes Yes14 51 43 45 52 Yes Yes Yes
Notes:
Noise Barrier Effectiveness Prediction WorksheetFHWA Traffic Noise Prediction Model (FHWA-RD-77-108)Appendix D
Project Information:
Noise Level Data:
Site Geometry:
PFE Road4Location(s):
Auto Ldn, dB:2025
Job Number:Description
Barrier
Height2 (ft)
1.Standard receiver elevation is five feet above grade/pad elevations at the receiver location(s)
Barrier Effectiveness:
14
9101112
Top of Barrier
Elevation (ft)
13
Roadway Name:
Year:
Impact (Cumulative + Project)
Heavy Truck Ldn, dB:
Medium Truck Ldn, dB:
2016-220
Barrier Breaks Line of Sight to…
Centerline to Barrier Distance (C1):
Barrier to Receiver Distance (C2):
Pad/Ground Elevation at Receiver:
Base of Barrier Elevation:Starting Barrier Height
-------------------- Ldn, dB --------------------
Lots 10-13
78
Receiver Description:
Medium Truck Elevation:Heavy Truck Elevation:
Receiver Elevation1:
Automobile Elevation:
6

64
56
57
130
20
0280506
Autos
Medium Trucks
Heavy Trucks Total Autos?
Medium Trucks?
Heavy Trucks?
6 59 50 52 60 Yes Yes Yes7 57 49 51 59 Yes Yes Yes8 56 48 50 58 Yes Yes Yes9 55 47 49 57 Yes Yes Yes10 54 46 48 56 Yes Yes Yes11 54 45 47 55 Yes Yes Yes12 53 44 47 54 Yes Yes Yes13 52 44 46 53 Yes Yes Yes14 51 43 45 53 Yes Yes Yes
Notes:
78
Receiver Description:
13
6
Top of Barrier
Elevation (ft)
Barrier
Height2 (ft)
Medium Truck Elevation:Heavy Truck Elevation:
Receiver Elevation1:
14
9101112
Year:
Impact (Cumulative + Project)
Heavy Truck Ldn, dB:
Medium Truck Ldn, dB:
Automobile Elevation:
Barrier Breaks Line of Sight to…
Lots 220-229Centerline to Barrier Distance (C1):
Barrier to Receiver Distance (C2):
Pad/Ground Elevation at Receiver:
Barrier Effectiveness:
Base of Barrier Elevation:Starting Barrier Height
-------------------- Ldn, dB --------------------
1.Standard receiver elevation is five feet above grade/pad elevations at the receiver location(s)
Project Information:
Noise Level Data:
Site Geometry:
PFE Road6Location(s):
Auto Ldn, dB:2025
Noise Barrier Effectiveness Prediction WorksheetFHWA Traffic Noise Prediction Model (FHWA-RD-77-108)Appendix D
Job Number:Description
Roadway Name:
2016-220

69
60
62
70
20
0280506
Autos
Medium Trucks
Heavy Trucks Total Autos?
Medium Trucks?
Heavy Trucks?
6 63 54 57 64 Yes Yes Yes7 61 53 56 63 Yes Yes Yes8 60 52 55 62 Yes Yes Yes9 59 51 54 61 Yes Yes Yes10 58 50 53 60 Yes Yes Yes11 57 49 52 59 Yes Yes Yes12 56 48 51 58 Yes Yes Yes13 56 48 50 57 Yes Yes Yes14 55 47 49 57 Yes Yes Yes
Notes:
78
Receiver Description:
13
6
Top of Barrier
Elevation (ft)
Barrier
Height2 (ft)
Medium Truck Elevation:Heavy Truck Elevation:
Receiver Elevation1:
14
9101112
Year:
Impact (Cumulative + Project)
Heavy Truck Ldn, dB:
Medium Truck Ldn, dB:
Automobile Elevation:
Barrier Breaks Line of Sight to…
Lots 123-132Centerline to Barrier Distance (C1):
Barrier to Receiver Distance (C2):
Pad/Ground Elevation at Receiver:
Barrier Effectiveness:
Base of Barrier Elevation:Starting Barrier Height
-------------------- Ldn, dB --------------------
1.Standard receiver elevation is five feet above grade/pad elevations at the receiver location(s)
Project Information:
Noise Level Data:
Site Geometry:
North Antelope Road13Location(s):
Auto Ldn, dB:2025
Noise Barrier Effectiveness Prediction WorksheetFHWA Traffic Noise Prediction Model (FHWA-RD-77-108)Appendix D
Job Number:Description
Roadway Name:
2016-220
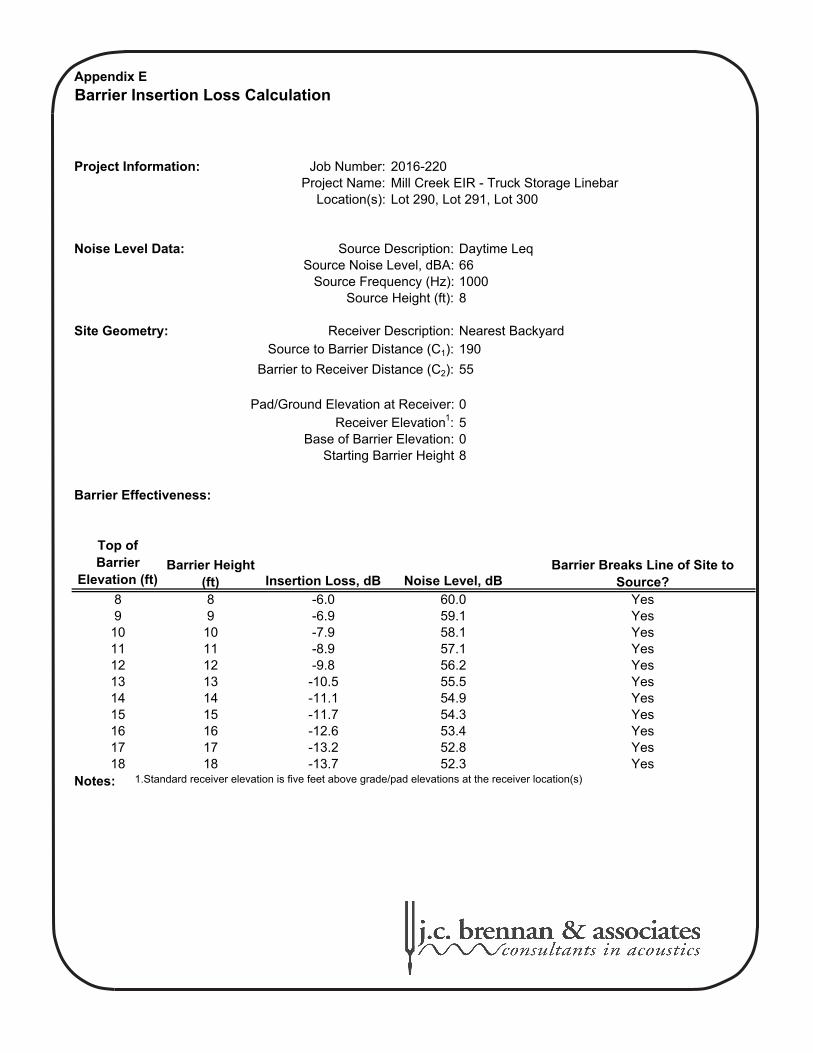
6610008
190
55
0508
89101112131415161718
Notes:18 -13.7 52.3 Yes
53.4
Noise Level, dBInsertion Loss, dB
17 -13.2 52.8
910
16
14YesYes
60.059.158.157.156.255.554.9
Yes
YesYes
Barrier Breaks Line of Site to Source?
YesYesYes
15
8
Top of Barrier
Elevation (ft)Barrier Height
(ft)
111213
Job Number:Project Name:
Source Description:
Mill Creek EIR - Truck Storage Linebar
Source Height (ft):Source Frequency (Hz):
2016-220
Nearest BackyardSource to Barrier Distance (C1):
Barrier to Receiver Distance (C2):
Pad/Ground Elevation at Receiver:
Receiver Description:
Receiver Elevation1:
Barrier Effectiveness:
Base of Barrier Elevation:Starting Barrier Height
1.Standard receiver elevation is five feet above grade/pad elevations at the receiver location(s)
Project Information:
Noise Level Data:
Site Geometry:
Lot 290, Lot 291, Lot 300Location(s):
Source Noise Level, dBA:Daytime Leq
-6.0-6.9
Barrier Insertion Loss CalculationAppendix E
-7.9
Yes
-11.7-12.6
-8.9-9.8-10.5-11.1
54.3
Yes

7610008
190
55
0508
89101112131415161718
Notes:
-7.9
Yes
-11.7-12.6
-8.9-9.8-10.5-11.1
64.3
Yes
Barrier Insertion Loss CalculationAppendix E
1.Standard receiver elevation is five feet above grade/pad elevations at the receiver location(s)
Project Information:
Noise Level Data:
Site Geometry:
Lot 290, Lot 291, Lot 300Location(s):
Source Noise Level, dBA:Daytime Lmax
-6.0-6.9
Barrier Effectiveness:
Base of Barrier Elevation:Starting Barrier Height
Nearest BackyardSource to Barrier Distance (C1):
Barrier to Receiver Distance (C2):
Pad/Ground Elevation at Receiver:
Receiver Description:
Receiver Elevation1:
Job Number:Project Name:
Source Description:
Mill Creek EIR - Truck Storage Linebar
Source Height (ft):Source Frequency (Hz):
2016-220
15
8
Top of Barrier
Elevation (ft)Barrier Height
(ft)
111213 Yes
Yes
Barrier Breaks Line of Site to Source?
YesYesYes
YesYes
70.069.168.167.166.265.564.9
Yes
63.4
Noise Level, dBInsertion Loss, dB
17 -13.2 62.8
910
16
14
18 -13.7 62.3 Yes

5610008
190
55
0508
89101112131415161718
Notes:
-7.9
Yes
-11.7-12.6
-8.9-9.8-10.5-11.1
44.3
Yes
Barrier Insertion Loss CalculationAppendix E
1.Standard receiver elevation is five feet above grade/pad elevations at the receiver location(s)
Project Information:
Noise Level Data:
Site Geometry:
Lot 290, Lot 291, Lot 300Location(s):
Source Noise Level, dBA:Nighttime Leq
-6.0-6.9
Barrier Effectiveness:
Base of Barrier Elevation:Starting Barrier Height
Nearest BackyardSource to Barrier Distance (C1):
Barrier to Receiver Distance (C2):
Pad/Ground Elevation at Receiver:
Receiver Description:
Receiver Elevation1:
Job Number:Project Name:
Source Description:
Mill Creek EIR - Truck Storage Linebar
Source Height (ft):Source Frequency (Hz):
2016-220
15
8
Top of Barrier
Elevation (ft)Barrier Height
(ft)
111213 Yes
Yes
Barrier Breaks Line of Site to Source?
YesYesYes
YesYes
50.049.148.147.146.245.544.9
Yes
43.4
Noise Level, dBInsertion Loss, dB
17 -13.2 42.8
910
16
14
18 -13.7 42.3 Yes

6910008
190
20
0508
89101112131415161718
Notes:18 -16.3 52.7 Yes
53.7
Noise Level, dBInsertion Loss, dB
17 -15.9 53.1
910
16
14YesYes
61.359.858.757.756.555.654.9
Yes
YesYes
Barrier Breaks Line of Site to Source?
YesYesYes
15
8
Top of Barrier
Elevation (ft)Barrier Height
(ft)
111213
Job Number:Project Name:
Source Description:
Mill Creek EIR - Truck Storage Linebar
Source Height (ft):Source Frequency (Hz):
2016-220
Nearest BackyardSource to Barrier Distance (C1):
Barrier to Receiver Distance (C2):
Pad/Ground Elevation at Receiver:
Receiver Description:
Receiver Elevation1:
Barrier Effectiveness:
Base of Barrier Elevation:Starting Barrier Height
1.Standard receiver elevation is five feet above grade/pad elevations at the receiver location(s)
Project Information:
Noise Level Data:
Site Geometry:
Lot 290, Lot 291, Lot 300Location(s):
Source Noise Level, dBA:Nighttime Lmax
-7.7-9.2
Barrier Insertion Loss CalculationAppendix E
-10.3
Yes
-14.6-15.3
-11.3-12.5-13.4-14.1
54.4
Yes

Job Number: 2016-220Project Name: Mill Creek EIR - Truck Storage Linebar
Source Description: Daytime LeqLocation(s): Lot 290, Lot 291, Lot 300
190
55
8
0508
Notes: 1. Standard receiver elevation is five feet above grade/pad elevations at the receiver location(s)
Centerline to Barrier Distance (C1):
Appendix E
Barrier Insertion Graphic
Pad/Ground Elevation at Receiver:
Barrier to Receiver Distance (C2):
Source Elevation:
Receiver Elevation1:Base of Barrier Elevation:
Barrier Height:
Receiver
SourceBarrier
0
1
2
3
4
5
6
7
8
9
0 50 100 150 200 250 300
Distance (feet)
Ele
vati
on
(fe
et)

Job Number: 2016-220Project Name: Mill Creek EIR - Truck Storage Linebar
Source Description: Daytime LmaxLocation(s): Lot 290, Lot 291, Lot 300
190
55
8
0508
Notes:
Barrier Height:
1. Standard receiver elevation is five feet above grade/pad elevations at the receiver location(s)
Centerline to Barrier Distance (C1):
Appendix E
Barrier Insertion Graphic
Pad/Ground Elevation at Receiver:
Barrier to Receiver Distance (C2):
Source Elevation:
Receiver Elevation1:Base of Barrier Elevation:
Receiver
SourceBarrier
0
1
2
3
4
5
6
7
8
9
0 50 100 150 200 250 300
Distance (feet)
Ele
vati
on
(fe
et)
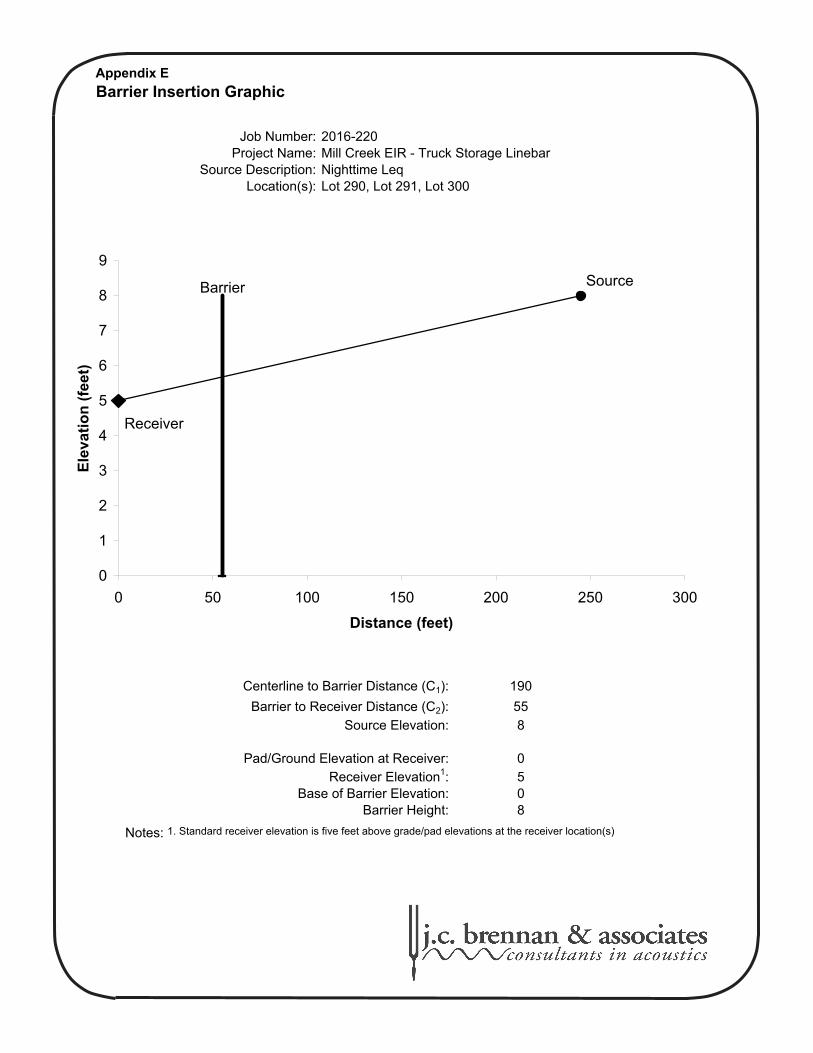
Job Number: 2016-220Project Name: Mill Creek EIR - Truck Storage Linebar
Source Description: Nighttime LeqLocation(s): Lot 290, Lot 291, Lot 300
190
55
8
0508
Notes:
Barrier Height:
1. Standard receiver elevation is five feet above grade/pad elevations at the receiver location(s)
Centerline to Barrier Distance (C1):
Appendix E
Barrier Insertion Graphic
Pad/Ground Elevation at Receiver:
Barrier to Receiver Distance (C2):
Source Elevation:
Receiver Elevation1:Base of Barrier Elevation:
Receiver
SourceBarrier
0
1
2
3
4
5
6
7
8
9
0 50 100 150 200 250 300
Distance (feet)
Ele
vati
on
(fe
et)

Job Number: 2016-220Project Name: Mill Creek EIR - Truck Storage Linebar
Source Description: Nighttime LmaxLocation(s): Lot 290, Lot 291, Lot 300
190
20
8
0508
Notes: 1. Standard receiver elevation is five feet above grade/pad elevations at the receiver location(s)
Centerline to Barrier Distance (C1):
Appendix E
Barrier Insertion Graphic
Pad/Ground Elevation at Receiver:
Barrier to Receiver Distance (C2):
Source Elevation:
Receiver Elevation1:Base of Barrier Elevation:
Barrier Height:
Receiver
SourceBarrier
0
1
2
3
4
5
6
7
8
9
0 50 100 150 200 250
Distance (feet)
Ele
vati
on
(fe
et)

6210008
190
205
0508
89101112131415161718
Notes:18 -10.5 51.5 Yes
52.3
Noise Level, dBInsertion Loss, dB
17 -10.2 51.8
910
16
14YesYes
56.956.556.055.454.754.253.6
Yes
YesYes
Barrier Breaks Line of Site to Source?
YesYesYes
15
8
Top of Barrier
Elevation (ft)Barrier Height
(ft)
111213
Job Number:Project Name:
Source Description:
Mill Creek EIR - Truck Storage Linebar
Source Height (ft):Source Frequency (Hz):
2016-220
Nearest BackyardSource to Barrier Distance (C1):
Barrier to Receiver Distance (C2):
Pad/Ground Elevation at Receiver:
Receiver Description:
Receiver Elevation1:
Barrier Effectiveness:
Base of Barrier Elevation:Starting Barrier Height
1.Standard receiver elevation is five feet above grade/pad elevations at the receiver location(s)
Project Information:
Noise Level Data:
Site Geometry:
Lots 301-305Location(s):
Source Noise Level, dBA:Daytime Leq
-5.1-5.5
Barrier Insertion Loss CalculationAppendix E
-6.0
Yes
-9.1-9.7
-6.6-7.3-7.8-8.4
52.9
Yes
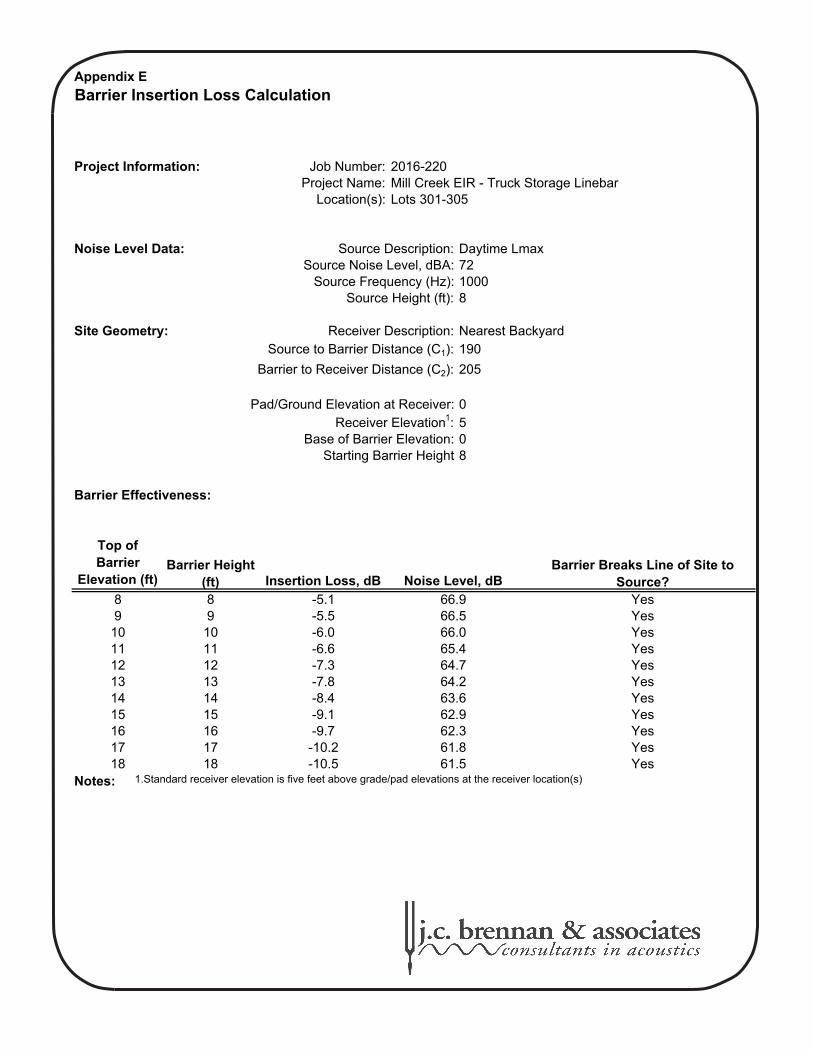
7210008
190
205
0508
89101112131415161718
Notes:
-6.0
Yes
-9.1-9.7
-6.6-7.3-7.8-8.4
62.9
Yes
Barrier Insertion Loss CalculationAppendix E
1.Standard receiver elevation is five feet above grade/pad elevations at the receiver location(s)
Project Information:
Noise Level Data:
Site Geometry:
Lots 301-305Location(s):
Source Noise Level, dBA:Daytime Lmax
-5.1-5.5
Barrier Effectiveness:
Base of Barrier Elevation:Starting Barrier Height
Nearest BackyardSource to Barrier Distance (C1):
Barrier to Receiver Distance (C2):
Pad/Ground Elevation at Receiver:
Receiver Description:
Receiver Elevation1:
Job Number:Project Name:
Source Description:
Mill Creek EIR - Truck Storage Linebar
Source Height (ft):Source Frequency (Hz):
2016-220
15
8
Top of Barrier
Elevation (ft)Barrier Height
(ft)
111213 Yes
Yes
Barrier Breaks Line of Site to Source?
YesYesYes
YesYes
66.966.566.065.464.764.263.6
Yes
62.3
Noise Level, dBInsertion Loss, dB
17 -10.2 61.8
910
16
14
18 -10.5 61.5 Yes

5210008
190
205
0508
89101112131415161718
Notes:
-6.0
Yes
-9.1-9.7
-6.6-7.3-7.8-8.4
42.9
Yes
Barrier Insertion Loss CalculationAppendix E
1.Standard receiver elevation is five feet above grade/pad elevations at the receiver location(s)
Project Information:
Noise Level Data:
Site Geometry:
Lots 301-305Location(s):
Source Noise Level, dBA:Nighttime Leq
-5.1-5.5
Barrier Effectiveness:
Base of Barrier Elevation:Starting Barrier Height
Nearest BackyardSource to Barrier Distance (C1):
Barrier to Receiver Distance (C2):
Pad/Ground Elevation at Receiver:
Receiver Description:
Receiver Elevation1:
Job Number:Project Name:
Source Description:
Mill Creek EIR - Truck Storage Linebar
Source Height (ft):Source Frequency (Hz):
2016-220
15
8
Top of Barrier
Elevation (ft)Barrier Height
(ft)
111213 Yes
Yes
Barrier Breaks Line of Site to Source?
YesYesYes
YesYes
46.946.546.045.444.744.243.6
Yes
42.3
Noise Level, dBInsertion Loss, dB
17 -10.2 41.8
910
16
14
18 -10.5 41.5 Yes

6510008
190
205
0508
89101112131415161718
Notes:18 -10.5 54.5 Yes
55.3
Noise Level, dBInsertion Loss, dB
17 -10.2 54.8
910
16
14YesYes
59.959.559.058.457.757.256.6
Yes
YesYes
Barrier Breaks Line of Site to Source?
YesYesYes
15
8
Top of Barrier
Elevation (ft)Barrier Height
(ft)
111213
Job Number:Project Name:
Source Description:
Mill Creek EIR - Truck Storage Linebar
Source Height (ft):Source Frequency (Hz):
2016-220
Nearest BackyardSource to Barrier Distance (C1):
Barrier to Receiver Distance (C2):
Pad/Ground Elevation at Receiver:
Receiver Description:
Receiver Elevation1:
Barrier Effectiveness:
Base of Barrier Elevation:Starting Barrier Height
1.Standard receiver elevation is five feet above grade/pad elevations at the receiver location(s)
Project Information:
Noise Level Data:
Site Geometry:
Lots 301-305Location(s):
Source Noise Level, dBA:Nighttime Lmax
-5.1-5.5
Barrier Insertion Loss CalculationAppendix E
-6.0
Yes
-9.1-9.7
-6.6-7.3-7.8-8.4
55.9
Yes

Job Number: 2016-220Project Name: Mill Creek EIR - Truck Storage Linebar
Source Description: Daytime LeqLocation(s): Lots 301-305
190
205
8
0508
Notes: 1. Standard receiver elevation is five feet above grade/pad elevations at the receiver location(s)
Centerline to Barrier Distance (C1):
Appendix E
Barrier Insertion Graphic
Pad/Ground Elevation at Receiver:
Barrier to Receiver Distance (C2):
Source Elevation:
Receiver Elevation1:Base of Barrier Elevation:
Barrier Height:
Receiver
SourceBarrier
0
1
2
3
4
5
6
7
8
9
0 50 100 150 200 250 300 350 400 450
Distance (feet)
Ele
vati
on
(fe
et)

Job Number: 2016-220Project Name: Mill Creek EIR - Truck Storage Linebar
Source Description: Daytime LmaxLocation(s): Lots 301-305
190
205
8
0508
Notes:
Barrier Height:
1. Standard receiver elevation is five feet above grade/pad elevations at the receiver location(s)
Centerline to Barrier Distance (C1):
Appendix E
Barrier Insertion Graphic
Pad/Ground Elevation at Receiver:
Barrier to Receiver Distance (C2):
Source Elevation:
Receiver Elevation1:Base of Barrier Elevation:
Receiver
SourceBarrier
0
1
2
3
4
5
6
7
8
9
0 50 100 150 200 250 300 350 400 450
Distance (feet)
Ele
vati
on
(fe
et)

Job Number: 2016-220Project Name: Mill Creek EIR - Truck Storage Linebar
Source Description: Nighttime LeqLocation(s): Lots 301-305
190
205
8
0508
Notes:
Barrier Height:
1. Standard receiver elevation is five feet above grade/pad elevations at the receiver location(s)
Centerline to Barrier Distance (C1):
Appendix E
Barrier Insertion Graphic
Pad/Ground Elevation at Receiver:
Barrier to Receiver Distance (C2):
Source Elevation:
Receiver Elevation1:Base of Barrier Elevation:
Receiver
SourceBarrier
0
1
2
3
4
5
6
7
8
9
0 50 100 150 200 250 300 350 400 450
Distance (feet)
Ele
vati
on
(fe
et)

Job Number: 2016-220Project Name: Mill Creek EIR - Truck Storage Linebar
Source Description: Nighttime LmaxLocation(s): Lots 301-305
190
205
8
0508
Notes: 1. Standard receiver elevation is five feet above grade/pad elevations at the receiver location(s)
Centerline to Barrier Distance (C1):
Appendix E
Barrier Insertion Graphic
Pad/Ground Elevation at Receiver:
Barrier to Receiver Distance (C2):
Source Elevation:
Receiver Elevation1:Base of Barrier Elevation:
Barrier Height:
Receiver
SourceBarrier
0
1
2
3
4
5
6
7
8
9
0 50 100 150 200 250 300 350 400 450
Distance (feet)
Ele
vati
on
(fe
et)

5910008
190
370
0508
89101112131415161718
Notes:18 -9.8 49.2 Yes
50.2
Noise Level, dBInsertion Loss, dB
17 -9.3 49.7
910
16
14YesYes
54.053.853.453.052.451.951.3
Yes
YesYes
Barrier Breaks Line of Site to Source?
YesYesYes
15
8
Top of Barrier
Elevation (ft)Barrier Height
(ft)
111213
Job Number:Project Name:
Source Description:
Mill Creek EIR - Truck Storage Linebar
Source Height (ft):Source Frequency (Hz):
2016-220
Nearest BackyardSource to Barrier Distance (C1):
Barrier to Receiver Distance (C2):
Pad/Ground Elevation at Receiver:
Receiver Description:
Receiver Elevation1:
Barrier Effectiveness:
Base of Barrier Elevation:Starting Barrier Height
1.Standard receiver elevation is five feet above grade/pad elevations at the receiver location(s)
Project Information:
Noise Level Data:
Site Geometry:
Lots 306-308Location(s):
Source Noise Level, dBA:Daytime Leq
-5.0-5.2
Barrier Insertion Loss CalculationAppendix E
-5.6
Yes
-8.2-8.8
-6.0-6.6-7.1-7.7
50.8
Yes

6910008
190
370
0508
89101112131415161718
Notes:
-5.6
Yes
-8.2-8.8
-6.0-6.6-7.1-7.7
60.8
Yes
Barrier Insertion Loss CalculationAppendix E
1.Standard receiver elevation is five feet above grade/pad elevations at the receiver location(s)
Project Information:
Noise Level Data:
Site Geometry:
Lots 306-308Location(s):
Source Noise Level, dBA:Daytime Lmax
-5.0-5.2
Barrier Effectiveness:
Base of Barrier Elevation:Starting Barrier Height
Nearest BackyardSource to Barrier Distance (C1):
Barrier to Receiver Distance (C2):
Pad/Ground Elevation at Receiver:
Receiver Description:
Receiver Elevation1:
Job Number:Project Name:
Source Description:
Mill Creek EIR - Truck Storage Linebar
Source Height (ft):Source Frequency (Hz):
2016-220
15
8
Top of Barrier
Elevation (ft)Barrier Height
(ft)
111213 Yes
Yes
Barrier Breaks Line of Site to Source?
YesYesYes
YesYes
64.063.863.463.062.461.961.3
Yes
60.2
Noise Level, dBInsertion Loss, dB
17 -9.3 59.7
910
16
14
18 -9.8 59.2 Yes

4910008
190
370
0508
89101112131415161718
Notes:
-5.6
Yes
-8.2-8.8
-6.0-6.6-7.1-7.7
40.8
Yes
Barrier Insertion Loss CalculationAppendix E
1.Standard receiver elevation is five feet above grade/pad elevations at the receiver location(s)
Project Information:
Noise Level Data:
Site Geometry:
Lots 306-308Location(s):
Source Noise Level, dBA:Nighttime Leq
-5.0-5.2
Barrier Effectiveness:
Base of Barrier Elevation:Starting Barrier Height
Nearest BackyardSource to Barrier Distance (C1):
Barrier to Receiver Distance (C2):
Pad/Ground Elevation at Receiver:
Receiver Description:
Receiver Elevation1:
Job Number:Project Name:
Source Description:
Mill Creek EIR - Truck Storage Linebar
Source Height (ft):Source Frequency (Hz):
2016-220
15
8
Top of Barrier
Elevation (ft)Barrier Height
(ft)
111213 Yes
Yes
Barrier Breaks Line of Site to Source?
YesYesYes
YesYes
44.043.843.443.042.441.941.3
Yes
40.2
Noise Level, dBInsertion Loss, dB
17 -9.3 39.7
910
16
14
18 -9.8 39.2 Yes

6210008
190
370
0508
89101112131415161718
Notes:18 -9.8 52.2 Yes
53.2
Noise Level, dBInsertion Loss, dB
17 -9.3 52.7
910
16
14YesYes
57.056.856.456.055.454.954.3
Yes
YesYes
Barrier Breaks Line of Site to Source?
YesYesYes
15
8
Top of Barrier
Elevation (ft)Barrier Height
(ft)
111213
Job Number:Project Name:
Source Description:
Mill Creek EIR - Truck Storage Linebar
Source Height (ft):Source Frequency (Hz):
2016-220
Nearest BackyardSource to Barrier Distance (C1):
Barrier to Receiver Distance (C2):
Pad/Ground Elevation at Receiver:
Receiver Description:
Receiver Elevation1:
Barrier Effectiveness:
Base of Barrier Elevation:Starting Barrier Height
1.Standard receiver elevation is five feet above grade/pad elevations at the receiver location(s)
Project Information:
Noise Level Data:
Site Geometry:
Lots 301-305Location(s):
Source Noise Level, dBA:Nighttime Lmax
-5.0-5.2
Barrier Insertion Loss CalculationAppendix E
-5.6
Yes
-8.2-8.8
-6.0-6.6-7.1-7.7
53.8
Yes

Job Number: 2016-220Project Name: Mill Creek EIR - Truck Storage Linebar
Source Description: Daytime LeqLocation(s): Lots 306-308
190
370
8
0508
Notes: 1. Standard receiver elevation is five feet above grade/pad elevations at the receiver location(s)
Centerline to Barrier Distance (C1):
Appendix E
Barrier Insertion Graphic
Pad/Ground Elevation at Receiver:
Barrier to Receiver Distance (C2):
Source Elevation:
Receiver Elevation1:Base of Barrier Elevation:
Barrier Height:
Receiver
SourceBarrier
0
1
2
3
4
5
6
7
8
9
0 100 200 300 400 500 600
Distance (feet)
Ele
vati
on
(fe
et)

Job Number: 2016-220Project Name: Mill Creek EIR - Truck Storage Linebar
Source Description: Daytime LmaxLocation(s): Lots 306-308
190
370
8
0508
Notes:
Barrier Height:
1. Standard receiver elevation is five feet above grade/pad elevations at the receiver location(s)
Centerline to Barrier Distance (C1):
Appendix E
Barrier Insertion Graphic
Pad/Ground Elevation at Receiver:
Barrier to Receiver Distance (C2):
Source Elevation:
Receiver Elevation1:Base of Barrier Elevation:
Receiver
SourceBarrier
0
1
2
3
4
5
6
7
8
9
0 100 200 300 400 500 600
Distance (feet)
Ele
vati
on
(fe
et)

Job Number: 2016-220Project Name: Mill Creek EIR - Truck Storage Linebar
Source Description: Nighttime LeqLocation(s): Lots 306-308
190
370
8
0508
Notes:
Barrier Height:
1. Standard receiver elevation is five feet above grade/pad elevations at the receiver location(s)
Centerline to Barrier Distance (C1):
Appendix E
Barrier Insertion Graphic
Pad/Ground Elevation at Receiver:
Barrier to Receiver Distance (C2):
Source Elevation:
Receiver Elevation1:Base of Barrier Elevation:
Receiver
SourceBarrier
0
1
2
3
4
5
6
7
8
9
0 100 200 300 400 500 600
Distance (feet)
Ele
vati
on
(fe
et)
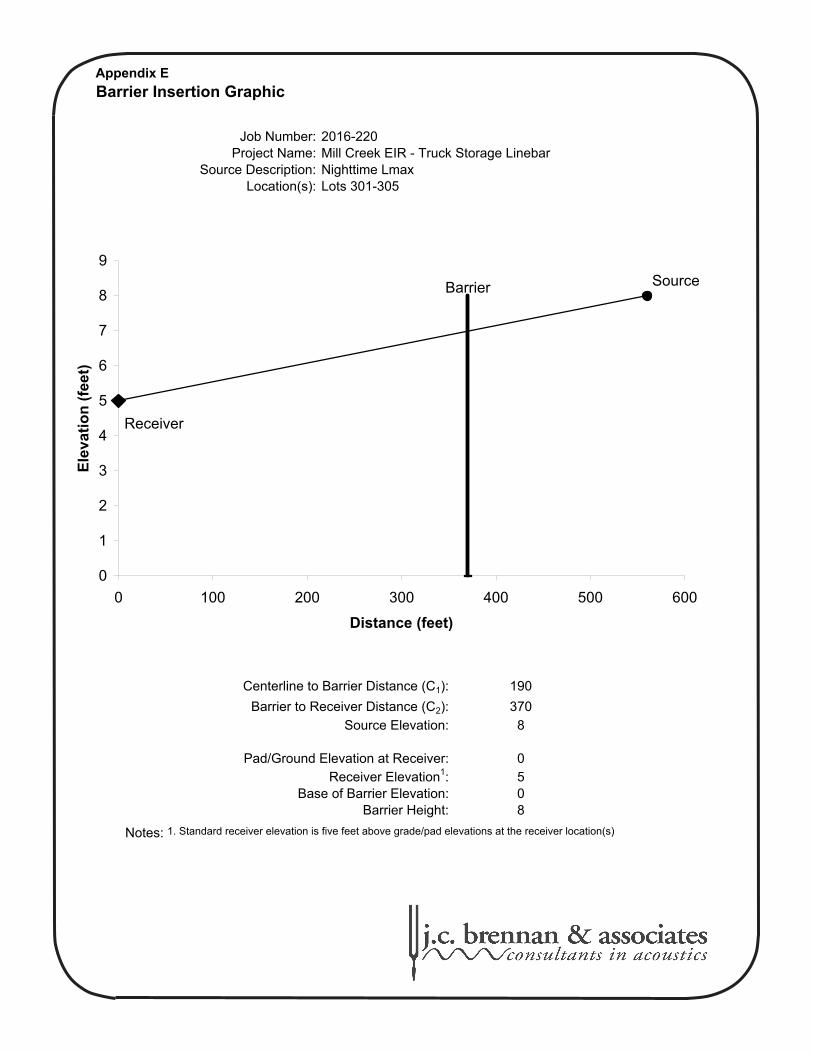
Job Number: 2016-220Project Name: Mill Creek EIR - Truck Storage Linebar
Source Description: Nighttime LmaxLocation(s): Lots 301-305
190
370
8
0508
Notes: 1. Standard receiver elevation is five feet above grade/pad elevations at the receiver location(s)
Centerline to Barrier Distance (C1):
Appendix E
Barrier Insertion Graphic
Pad/Ground Elevation at Receiver:
Barrier to Receiver Distance (C2):
Source Elevation:
Receiver Elevation1:Base of Barrier Elevation:
Barrier Height:
Receiver
SourceBarrier
0
1
2
3
4
5
6
7
8
9
0 100 200 300 400 500 600
Distance (feet)
Ele
vati
on
(fe
et)