NOISE FACTORS IN HEALTHCARE FACILITIES: A...
18
INTRODUCTION This paper investigates a number of healthcare centers in Turkey namely Haceepe University, Gazi University, Zonguldak Karaelmas University Medical Schools and State Hospitals, Baskent University Medical School and Private Research Hospitals, and the Safranbolu State Hospital. The sound levels present in these centers were compared with number international as well as Turkish standards (1-4) . Research was carried out in the following way: Firstly physicians and nurses were surveyed by means of a questionnaire. Then, the hospital buildings were examined in terms of their architectural design features. Lastly, sound levels were measured in the consequent spaces where questionnaires were also conducted. A similar survey made in Johns Hopkins Hospital (5) back in 2005 had revealed that surgery patients in recovery were found to require additional medications due to sound levels being high Minckley (6) (over 60 dB at re 20 µPa). No significant difference was observed in terms of staff performance with or without the presence of sound. In another research, Murthy et al found that speech efficiency and short-term memory declined in the presence of typical operating-room noise among anesthetists (7). He also found that speech recognition declined by 23% and speech thresholds were increased roughly by 25% for the same level of comprehension -a result with important implications for medical safety. In addition, noise in hospitals can be detrimental as it helps to present their environment as quiet and peaceful. The World Health Organization (WHO) provides guidelines for hospitals in this respect in its Guidelines for Community Noise published in 1995 (4). These guidelines recommend an L max of no more than 40 dB (A) (at referenced (re) 20 µPa) at night time measured on the fast mode. They also suggest patient room L eq of no more than 35 dB (A) during the day. ANSI (The American National Standard Institution) (1) S12.2, published in 1995, recommends a maximum Room Criterions Curves (NCC) value ranging from 25 to 40 depending on the room type, and a maximum Noise Criteria Balanced (NCB) value ranging from 25 to 40. A NOISE FACTORS IN HEALTHCARE FACILITIES: A SURVEY OF HOSPITALS IN TURKEY Filiz BAL KOÇYİĞİT* Received: 01.11.2011; Final Text: 18.08.2012 Keywords: noise; architecture; frequency; A-weighted sound; acoustic comfort; sound spectra; hospital units; healthcare units. 1. ANSI (1999). 2. EPA (1974). 3. WHO (1999). 4. Turkish National News (2005). 5. Busch-Vishniac et al. (2005). 6. Minckley (1968). 7. Murthyet al. (1995). METU JFA 2012/2 (29:2) 351-368 DOI: 10.4305/METU.JFA.2012.2.16 * Atılım University, Ankara, TURKEY.
Transcript of NOISE FACTORS IN HEALTHCARE FACILITIES: A...
NOISE FACTORS IN HEALTHCARE FACILITIES METU JFA 2012/2 351
INTRODUCTION
This paper investigates a number of healthcare centers in Turkey namely Hacettepe University, Gazi University, Zonguldak Karaelmas University Medical Schools and State Hospitals, Baskent University Medical School and Private Research Hospitals, and the Safranbolu State Hospital. The sound levels present in these centers were compared with number international as well as Turkish standards (1-4) . Research was carried out in the following way: Firstly physicians and nurses were surveyed by means of a questionnaire. Then, the hospital buildings were examined in terms of their architectural design features. Lastly, sound levels were measured in the consequent spaces where questionnaires were also conducted. A similar survey made in Johns Hopkins Hospital (5) back in 2005 had revealed that surgery patients in recovery were found to require additional medications due to sound levels being high Minckley (6) (over 60 dB at re 20 µPa). No significant difference was observed in terms of staff performance with or without the presence of sound. In another research, Murthy et al found that speech efficiency and short-term memory declined in the presence of typical operating-room noise among anesthetists (7). He also found that speech recognition declined by 23% and speech thresholds were increased roughly by 25% for the same level of comprehension -a
result with important implications for medical safety. In addition, noise in hospitals can be detrimental as it helps to present their environment as quiet and peaceful. The World Health Organization (WHO) provides guidelines for hospitals in this respect in its Guidelines for Community Noise published in 1995 (4). These guidelines recommend an Lmax of no more than 40 dB (A) (at referenced (re) 20 µPa) at night time measured on the fast mode. They also suggest patient room Leq of no more than 35 dB (A) during the day. ANSI (The American National Standard Institution) (1) S12.2, published in 1995, recommends a maximum Room Criterions Curves (NCC) value ranging from 25 to 40 depending on the room type, and a maximum Noise Criteria Balanced (NCB) value ranging from 25 to 40. A
NOISE FACTORS IN HEALTHCARE FACILITIES: A SURVEY OF HOSPITALS IN TURKEY Filiz BAL KOÇYİĞİT*
Received: 01.11.2011; Final Text: 18.08.2012
Keywords: noise; architecture; frequency; A-weighted sound; acoustic comfort; sound spectra; hospital units; healthcare units.
1. ANSI (1999).
2. EPA (1974).
3. WHO (1999).
4. Turkish National News (2005).
5. Busch-Vishniac et al. (2005).
6. Minckley (1968).
7. Murthyet al. (1995).
METU JFA 2012/2(29:2) 351-368
DOI: 10.4305/METU.JFA.2012.2.16
* Atılım University, Ankara, TURKEY.

FİLİZ BAL KOÇYİĞİT352 METU JFA 2012/2
document issued by the Environmental Protection Agency (EPA) back in the late 1960s summarizing significant community noise studies provides recommendations in terms of the Ld&n (day-night sound pressure level) not to exceed 45 dB(A) (2). Besides these standards and guidelines, it can be seen that the WHO’s criteria are the most frequently cited in the literature and, thus, this paper also takes the same standards into consideration in its measurements. The Institute of Turkish Standards (TSE) is also working on this subject and the first national standard about ambient noise issued at 1989 Table 11 (with the translation of ISO 140, 1996-1 and 2).
SURVEY OF THE HOSPITALS SOUND PRESSURE LEVELS (SPL) SINCE 2005 (METHODOLOGY)
Prior to the launching of the survey, the available literature regarding noise in healthcare centers around the world was fully studied. The question at issue is, if the noise levels change dramatically from hospital to hospital, what is the impact on the staff. Philbin (8), by gathering data to answer these questions, discovered a problem raised with the hospital noise. Given the absence of a hospital noise standard, it is seen that on the measurements in literature vary from A-weighted Leq to unweighted Leq and Lpeak and other measures. For consistency, only A-weighted Leq and Lpeak values have been considered here as these were found to be the most often measured. Even with this restriction, we should note that there is no known uniformity in
the averaging time for the Leq and Lpeak; besides, it is not clear whether the SPL meter gathering data in each case was set to slow or fast modes. Figure 1 shows the relation of the layout of five hospitals with the main road. The research influencing environmental factors on hospitals will be compared and evaluated.
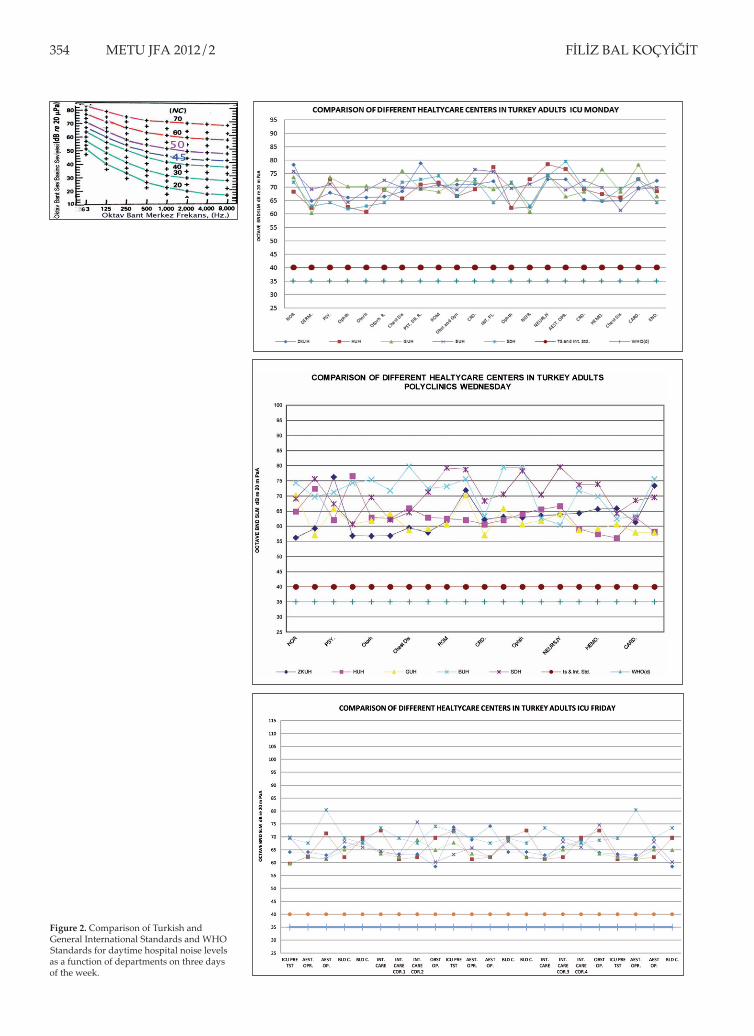
Figure 2 shows the results of the compilation of the existing noise studies. In these and all the other figures in this paper, dB-A are referenced to 20 µPa, and the decibel averages refer to the logarithmic and energy averages. The A-weighted Leq are graphed as a function of location, frequency, and day of the week. Figure 2 demonstrates the results for the selected weeks days and Figure 3 for the comparison of day and night time hours using the same hourly division as in the Ld&n (day-night) when necessary. When the available data does not specify time, it is only included in the day time graph. The results include hospitals of various types, from major research facilities to community hospitals, located throughout the world. No distinction is made as to the medical unit or the hospital. Most of the data, particularly that which is recent, shows sound levels 20–40 dB-A higher than the acceptable level. This certainly raises the question of what significance the guidelines have. Ambient noise, additionally effected by hospital equipments and different machines, lighting systems, motors, ultrasonic machines … etc. These machines effect ambient noise relted with frequency. Some type of motors produce low-frequency noise and many electronic equipments and lighting systems produce high-frequency noise. Figure 4 demonstrates ambient noise levels as a factor of frequency. Because of equipment noise, high frequency levels are higher then expected and because of other motors, pedestrian circulation and the similar, low-frequency levels’ sound pressure levels are higher then 500 Hz. sound pressure levels.
Also, hospital noise levels have changed consistently over the past fifty years, and there is a clear trend in such noise levels on the rise. A straight line in Figure 2 represents the standards proposed by the TS, EPA, WHO,
8. Philbin (2000).
9. Institute of Turkish Standardization (1996).
10. Intenational Standard Organization (1996).
11. Koçyiğit (2004).
12. Biley (1994).
13. Balogh et al. (1993).
14. Baker (1984).
15. Turner et al. (1975).
16. Aitken (1982).
17. Allaouchiche et al. (2002).
18. Bayoet al. (1995).
19. Bovenzi and Collareta (1984).
20. De Camp (1979).
21. Falk and Woods (1973).
22. Goodfriend and Cardinell 1963.
23. Guerrero (2001).
24. Haslam (1970).
25. Hilton (1985).
26. Holmberg and Coon (1999).
27. Kahnet al. (1998).
28. Ogilvie (1980).
29. Omokhodian and Sridhar (2003).
30. Pimentel-Souza et al. (2003) http://www.icb.ufmg.br/lpf/2-19.html.
31. Shankaret al. (2001).
32. Benini et al. (1996).
33. Bentley et al. (1977).
34. Blennow et al. (1974).
35. Kam et al. (1994).
36. TS EN ISO 140-8; Acoustics – Measurement of sound insulation in buildings and of building elements – Part 8: Laboratory measurements of the reduction of transmitted impact noise by floor coverings on a heavyweight standard floor.
37. TS ISO 140-5; Acoustics-Measurement of Sound Insulation in Buildings And of Building Elements-Part V: Field Measurements of Airborne Sound Insulation of Facade Elements on Facades.

NOISE FACTORS IN HEALTHCARE FACILITIES METU JFA 2012/2 353
and ANSI, showing an increase on average of 10-20 dB. The logarithmic average A-weighted Leq’s in hospitals here seem to rise from 60 dBA in 2005 to 75 dBA 2010 during day time hours, and from 45 dBA in 2005 to 60 dBA in 2010 during night time hours. Measurements collected according to TS 9798 (ISO 1996 – 2) and TS 9315 (ISO 1996 – 1)(9). All measurements were obtained using by the B&K 2260, 2260I, 2239A and PC. Measurements in
hallways and patient rooms were performed closed to the room center at a height of roughly 1.25m, 1,5m. or 3m. far (according to places) from the walls. Finishing materials were listed with measures for their calculated reverberation times. A new parallel article for measurements regarding every researched room and corridors is under preparation. Here the problem was no acoustical tiles could used because of hygienic.
THE IMPACT OF PERSONNEL PAGING AND A GENERAL SURVEY OF SOUND LEVELS IN THE HOSPITAL
In general, survey results indicate a difference between sound levels inside the hospital and the standards provided by the TSE, WHO, EPA, ASA and the European Union There are a small number of hospital noise surveys in the open literature (5-39). Figure 1 shows the Zonguldak Karaelmas University and Hacettepe University, Gazi University National Research Hospitals, Başkent University Private Research Hospitals, and Safranbolu National Hospitals locations. In all locations, roads which are near to hospitals have heavy traffic density. Hospital ground floor plans could not added because of safety and security of hospitals and patients as explain in limitation department.
In spite of limitation to reach all plans, it can be said that in all hospitals, corridors which connect the departments are very narrow and long, walls are parallel, and finishing materials are hard and flat, with no reliefs except in the HU Hospital. During the last decade, Hacettepe University made some restoration inside the hospital and added reliefs on corridor walls. Figure 2 indicates the result of the studies on the existing noise at day time and night time in different areas inside the hospitals. In these and in all other figures in this article, dB (A) is referenced to 20 µPa and the decibel averages refer to the logarithmic averages. The A-weighted Leq’s are
Figure 1. Başkent University, Gazi University, Hacettepe University, Safranbolu National Hospital and Zonguldak Karaelmas University locations (from left to right).
FİLİZ BAL KOÇYİĞİT354 METU JFA 2012/2
Figure 2. Comparison of Turkish and General International Standards and WHO Standards for daytime hospital noise levels as a function of departments on three days of the week.
NOISE FACTORS IN HEALTHCARE FACILITIES METU JFA 2012/2 355
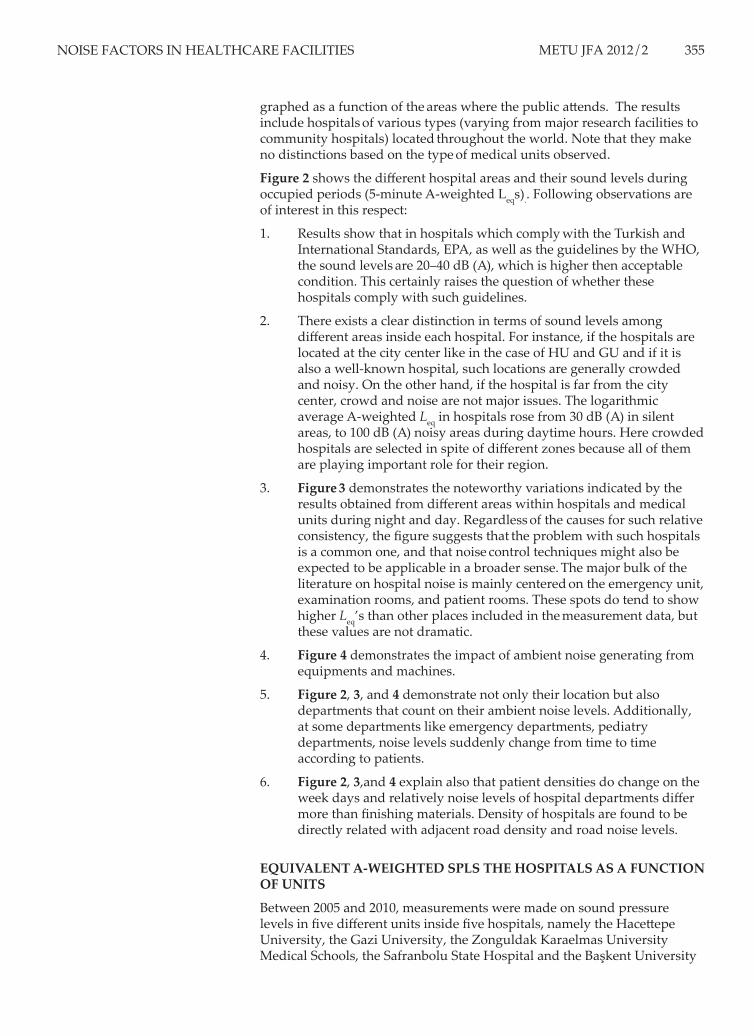
graphed as a function of the areas where the public attends. The results include hospitals of various types (varying from major research facilities to community hospitals) located throughout the world. Note that they make no distinctions based on the type of medical units observed.
Figure 2 shows the different hospital areas and their sound levels during occupied periods (5-minute A-weighted Leqs).. Following observations are of interest in this respect:
1. Results show that in hospitals which comply with the Turkish and International Standards, EPA, as well as the guidelines by the WHO, the sound levels are 20–40 dB (A), which is higher then acceptable condition. This certainly raises the question of whether these hospitals comply with such guidelines.
2. There exists a clear distinction in terms of sound levels among different areas inside each hospital. For instance, if the hospitals are located at the city center like in the case of HU and GU and if it is also a well-known hospital, such locations are generally crowded and noisy. On the other hand, if the hospital is far from the city center, crowd and noise are not major issues. The logarithmic average A-weighted Leq in hospitals rose from 30 dB (A) in silent areas, to 100 dB (A) noisy areas during daytime hours. Here crowded hospitals are selected in spite of different zones because all of them are playing important role for their region.
3. Figure 3 demonstrates the noteworthy variations indicated by the results obtained from different areas within hospitals and medical units during night and day. Regardless of the causes for such relative consistency, the figure suggests that the problem with such hospitals is a common one, and that noise control techniques might also be expected to be applicable in a broader sense. The major bulk of the literature on hospital noise is mainly centered on the emergency unit, examination rooms, and patient rooms. These spots do tend to show higher Leq’s than other places included in the measurement data, but
these values are not dramatic.
4. Figure 4 demonstrates the impact of ambient noise generating from equipments and machines.
5. Figure 2, 3, and 4 demonstrate not only their location but also departments that count on their ambient noise levels. Additionally, at some departments like emergency departments, pediatry departments, noise levels suddenly change from time to time according to patients.
6. Figure 2, 3,and 4 explain also that patient densities do change on the week days and relatively noise levels of hospital departments differ more than finishing materials. Density of hospitals are found to be directly related with adjacent road density and road noise levels.
EQUIVALENT A-WEIGHTED SPLS THE HOSPITALS AS A FUNCTION OF UNITS
Between 2005 and 2010, measurements were made on sound pressure levels in five different units inside five hospitals, namely the Hacettepe University, the Gazi University, the Zonguldak Karaelmas University Medical Schools, the Safranbolu State Hospital and the Başkent University
FİLİZ BAL KOÇYİĞİT356 METU JFA 2012/2
Private Hospitals. It has to be stated that this research is still in progress and a number of other analysis including reverberation times, and sound propagation, is still ahead. Figure 2, 3, and 4 show sound levels at the various measurement locations of the PEU (Pediatric Emergency Unit) and PICU (Pediatric Intensive Care Unit), PP (Pediatric Polyclinics), AEU (Adult Emergency Unit), AICU (Adult Intensive Care Unit), and AP (Adult Polyclinics). In each unit, we first measured five-minute Leq’s at various spots, always including patient rooms, hallways, doctors’ offices and nurse stations. The octave-band SPL’s were obtained in the same spots simultaneously. Subsequently, measurements were also taken at a minimum of three locations per unit - a patient room, a nurse station, and an error-free patient room. In each case, physicians and nurses were asked to continue with their normal routine activities. A number of halls
and rooms had acoustic tile ceilings, but with no other specification of similar nature. Other locations had no acoustic treatment whatsoever. All of the facilities were normally found to be quite reverberant. Figure 3 also shows the 5-minute A-weighted Leq’s as a function of location for all of the five hospitals. In each case, the figure reflects the Pmax, Lmax, Leq, and Lmin obtained using the slow-averaging setting of the meter. In general, there is more variation among rooms in one unit than among different spots in the hall. Indication has been made as to the comparison of Leq’s of different hospitals’ emergency and polyclinic units noise levels, including LMax, PMax, LMin, and Leq, and their comparison with the Turkish, international and as well as the WHO’s standards.
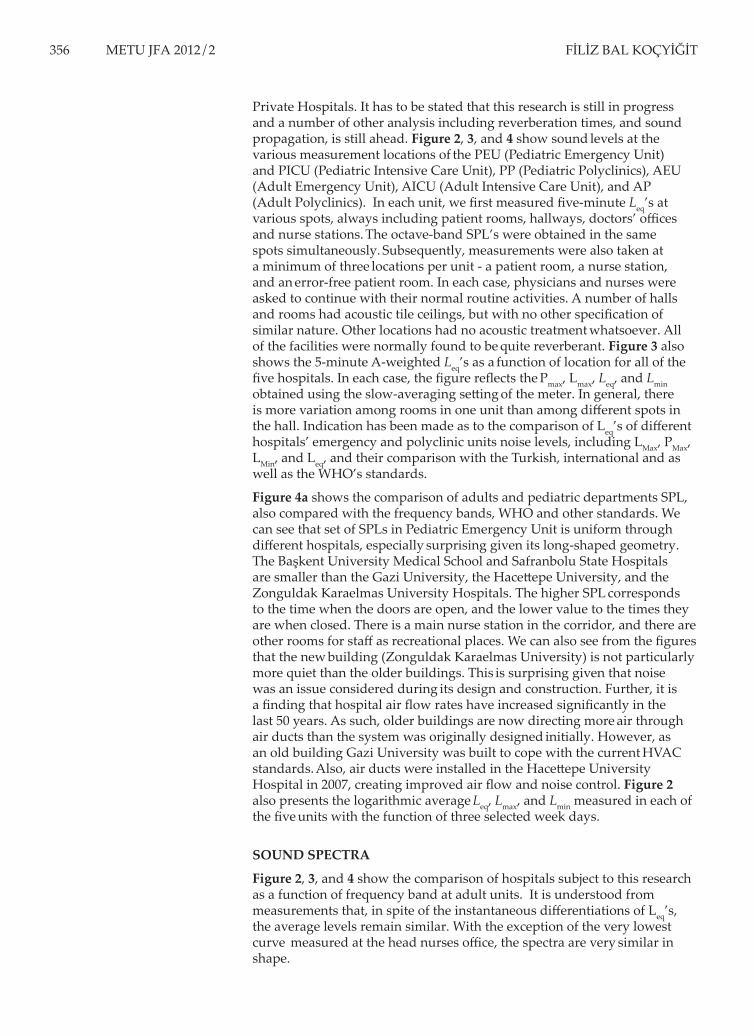
Figure 4a shows the comparison of adults and pediatric departments SPL, also compared with the frequency bands, WHO and other standards. We can see that set of SPLs in Pediatric Emergency Unit is uniform through different hospitals, especially surprising given its long-shaped geometry. The Başkent University Medical School and Safranbolu State Hospitals are smaller than the Gazi University, the Hacettepe University, and the Zonguldak Karaelmas University Hospitals. The higher SPL corresponds to the time when the doors are open, and the lower value to the times they are when closed. There is a main nurse station in the corridor, and there are other rooms for staff as recreational places. We can also see from the figures that the new building (Zonguldak Karaelmas University) is not particularly more quiet than the older buildings. This is surprising given that noise was an issue considered during its design and construction. Further, it is a finding that hospital air flow rates have increased significantly in the
last 50 years. As such, older buildings are now directing more air through air ducts than the system was originally designed initially. However, as an old building Gazi University was built to cope with the current HVAC standards. Also, air ducts were installed in the Hacettepe University Hospital in 2007, creating improved air flow and noise control. Figure 2 also presents the logarithmic average Leq, Lmax, and Lmin measured in each of the five units with the function of three selected week days.
SOUND SPECTRA
Figure 2, 3, and 4 show the comparison of hospitals subject to this research as a function of frequency band at adult units. It is understood from measurements that, in spite of the instantaneous differentiations of Leq’s, the average levels remain similar. With the exception of the very lowest curve measured at the head nurses office, the spectra are very similar in shape.

NOISE FACTORS IN HEALTHCARE FACILITIES METU JFA 2012/2 357
According to the Figures 2, 3, and 4, the SPL at Hacettepe University has been taken with different frequency bands, and prominent differences are visible between the adult and the pediatric units. The spectrum also reveals that the SPL reaches its maximum level between 16-64 Hz; and 64-125 Hz., the octave bands sound level is nearly flat, rolling down slowly at 125-500 Hz., nearly flat at 500-2000; rolling down again and reaching the minimum level between 2000-8000 Hz. The flat sound spectrum region (500-2000 Hz.) generally encompasses the speech band and, at the low frequency end, it is almost certainly caused by heating and ventilation. Over 2000 Hz. the flat sound spectrum region appears again encompassing the hospital equipments bands, such as laboratory, surgery, and lighting equipments. Additionally, given the presence of the constant sound of conversations as well as mobile phones in hospitals, the octave band levels for the five hospital units are quite similar in form, as shown in Figure 4. In the pediatric units sound levels around 1000 Hz. are generally higher then the adult units, because of the children’s voice which has higher frequency bands than adults. Presented in this figure is the logarithmic average Leq in each unit and in each octave band. The similarity in the shape of the curves also shows a significant difference in their levels. For instance, the largest differences shown in Figure 4b are approximately 20 dB in the 16 kHz octave band, although the difference is more typically 15–20 dB. However, a major difference is visible from one unit to another unit, although the overall form of the spectra is quite similar.
At low frequency, noise levels are surprisingly high because of the non-stop maintaining in and out of hospitals. The high frequency noise roll-
Figure 3. Comparison of hospitals in terms of the function of frequency band in pediatric and adult units’ emergency and polyclinic departments SPL (Day and Night).
FİLİZ BAL KOÇYİĞİT358 METU JFA 2012/2
off in the hospital units is more gradual than the one commonly seen in public buildings. What has to be taken into account here is that hospital equipment, such as X-ray machines, faulty lighting systems, and alarms are important contributors to high-frequency noise levels. Noise levels between 500- 4000 Hz. show high level of noise, which is easily understandable for human talking frequencies especially around 4000 Hz. are children cries. Over 4000 Hz. noise level must be roll-off under the 20 dB(A) but because of electronic equipments, the level over this frequency reaches 45 dB(A) at hospitals.
EQUIVALENT A-WEIGHTED SPL’S AS A FUNCTION OF DAY AND UNIT
We obtained measurements of the Leqs from the outpatient units, and an occupied pediatric room, and either an unoccupied pediatric room or an examination room. Figure 3, 4, and 5 illustrate the A-weighted levels of 24-hour Leq in the pediatric emergency rooms as a function of days and units in the different hospitals. As the figure shows, the variation exceeds 25 dB between the lowest and the highest SPL. By contrast, hospitals with medical school indicate a 15-dB variation, clearly showing when the units have been occupied in a particular day. In the intensive care units (ICU), measurements appeared similar during night and day in the selected weekdays, which is not surprising even though other units have different conditions through out of the daytime and night time. The continuous noise along with the light factor appeared to create sleeping difficulties
Figure 4a. Different hospitals SPL measurements with different frequency octave bands without ambient noise.

NOISE FACTORS IN HEALTHCARE FACILITIES METU JFA 2012/2 359
Figure 4b. Comparison of five hospitals ambient noise averages at three days of the week.

FİLİZ BAL KOÇYİĞİT360 METU JFA 2012/2
among patients into in the ICU’s- which might explain the psychosis experiences by such patients according to related literature. It should be noted here that the data include a “quiet” period that appears between approximately 23:00 and 07:00, but it is only about 20 -25 dB quieter than the remainder of the day. Measurements also include several spots near and inside the main nurse stations, bedrooms and polyclinic rooms, one occupied pediatric room and the unoccupied pediatric rooms. The three nurse station spots are very similar and have higher levels than the patient rooms, with the occupied pediatric room only slightly different, possessing brief periods of lower levels. The unoccupied pediatric room is about 20 dB quieter across the board. Figure 2 also shows the comparison of Leq measurements within three days at the polyclinic regarding SPL. Once again, the nurses’ station had the highest noise levels-in this case, significantly above those measured in the occupied polyclinic rooms and in the examination rooms. These data provide less evidence of a “no-quiet” period through the day than was originally experienced. Figure 5 and 6 summarize the Leq results according to the Turkish standards, within the 24h measurements by averaging the levels found in all five units in PEU, PPU, AEU, APU, and ICU. Here, there is evidence of a quiet period from about midnight until 07:00. One point to consider in this figure is that the examination room, which is rarely used and has two sets of doors separating it from the hallway, exhibits a relatively high level of noise. In this case, as for the other empty patient and examination rooms shown in Figures 2, 3, and 4 the noise levels are directly attributable to HVAC noise, implying that it is the mechanical systems which are largely responsible for
this facility failing to meet the WHO’s guidelines. Unoccupied pediatric rooms and nights time periods, on the other hand, meet these guidelines. Only the empty rooms show significant distinctions in noise as a function of day. Consequently, on average the hospital noise levels, mostly impacting the patients, staff, and visitors, are at the same constant level.
COMPARISON OF HOSPITALS IN TURKEY AND THE UNITED STATES: AN EXAMPLE
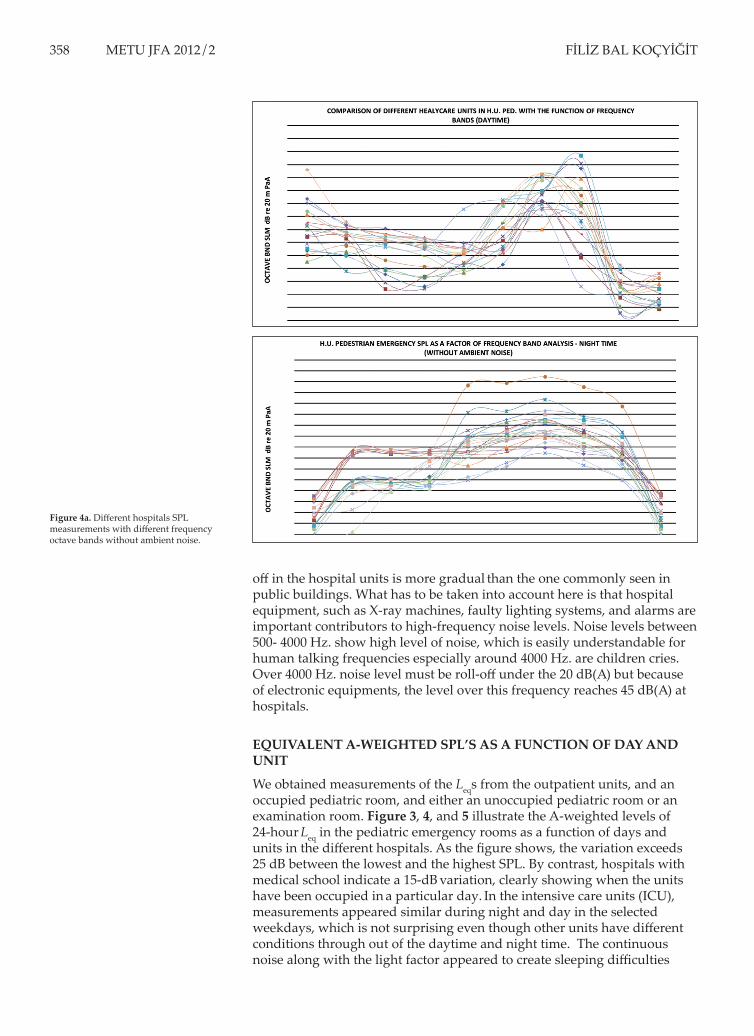
Quite obviously, the above-presented results demonstrate a noise problem in hospitals in Turkey and subject to this research, while it seems that this problem probably exists virtually in all other modern hospitals as well. Figure 5 shows the comparison between these Turkish hospitals and the
COMPARISON OF FIVE HOSPITAL STAFF'S AVERAGE RANGE EFFECTED FROM NOISE AT 50 DIFFERENT POINTS AS A FUNCTION OF DAYS
HACETTEPE GAZI UNIV. ZKU BASKENT U. SAFRANBOLU N.U.
Figure 4c. Comparison of five hospital’s staff’s average effecting range from noise at 50 different points as a function of days.
NOISE FACTORS IN HEALTHCARE FACILITIES METU JFA 2012/2 361
Johns Hopkins Hospital in the United States. In this figure, noise levels are clearly different. Yet, both hospitals still possess noise levels that are much higher than acceptable according to international standards. The sound pressure levels are high enough to interfere with sleep, potentially impact speech intelligibility (unless voices are raised), and to create a general and persistent low-pitch noise that is annoying to many.
Other aspects of noise include its effects on speech quality as well as the direct effect on the hospital staff such as physicians and nurses. The presence of air ducts, constant paging, and other medical electronic equipments are also among the causes for such high levels in noise. Figure 5 and 6 show a comparison of these noise levels according to the frequency bands in the selected Turkish and the United States hospitals. It can be inferred from these figures that air ducts and other equipments generate high-level noise at low frequencies, along with human communication noise levels between 500–2000 Hz. However, the figures clearly indicate that human communication frequencies are higher among Turkish hospitals when compared to Johns Hopkins. Adding the reverberation time to this condition, it can be said that, generally, the noise averages of hospitals in Turkey are higher than the US hospital sample. This problem is mainly due to over crowdedness and faulty equipments. Also, the middle frequencies in Turkish hospitals are higher, yet higher frequency noise levels remain within the same range.
Figure 5. Comparison of A-weighted equivalent SPL measured in Turkey and the United States.

FİLİZ BAL KOÇYİĞİT362 METU JFA 2012/2
Figure 6. Comparison of different hospitals octave-band Leq’s measured in various PICU locations.
Figure 7. Summary of the Leq results at different departments in Hacettepe hospital.

NOISE FACTORS IN HEALTHCARE FACILITIES METU JFA 2012/2 363
THE EFFECT OF MATERIALS ON REVERBERATION TIME AND RELATIVELY AMBIENT NOISE LEVELS IN HOSPITALS
The use of hard, non-relief and non-porous materials in hospitals is directly effecting ambient noise and RT, with impact on reverberation times indoor ICUs and corridors. Additionally narrow, long corridors and theirs’ parallel walls directly effect carrying the noise from one point to another with the fluctuation effect. Absorptive human bodies are also sound sources and can not roll off ambient noise levels properly. All these negative conditions are effecting ambient noise levels at occupied periods of hospitals.
DISCUSSION
This paper investigated noise levels at five different hospitals in Turkey, along with their comparison with a sample hospital in the United States. The results indicate that noise is an important factor which affects working conditions in all types of hospitals in Turkey, whether they are state hospitals or research facility. Although individuals in these areas do not appear to react to this issue, noise level measurements have proved to be above the Turkish and international standards. Similar conditions were experienced in another research on the subway station noise levels in Ankara. According to TS and the ISO/R 1996:1974 (10), “if the noise level is +5 more than the comfort level, there may be some personal reactions. If the noise level is +10 more than the comfort level, mass reaction will be seen”. “Individuals with normal hearing are well-adapted to detecting speech signals embedded in noise, as evident by their ability to interpret speech correctly even when the S/N ratio is as low as -6dB. However, the same statement cannot be applied to automated speech recognition systems, where one normally needs an S/N ratio of at least +15 dB in order to ensure correct interpretation of the signal”. When researchers ask this condition to users of hospitals, subjects of questionnaires and patients reply “we are used to this condition”. Thus, the distinction between human ear and automated speech recognizers is very important for the hospital setting, as there is a great desire to automate many hospital operations and this requires the use of such speech recognition. Here, acoustics are dependent on common knowledge and practice regarding room noise ambience as well as the material used. Further, when correct speech interpretation is critical, as is often the case in the case of hospitals, a +15 dB
Figure 8. Two views from hospital bed room and corridor from one of the researched hospitals. (No permission for the name of hospital).

FİLİZ BAL KOÇYİĞİT364 METU JFA 2012/2
S/N requirement is appropriate. None of the hospitals where research was conducted have acoustic ceilings because they house immune-compromised patients, and there are concerns about the holes bearing bacteria in the standard acoustic tiles.
Our survey shows that especially daytime SPL in all hospitals are dramatically higher than the national and international standards, and even at night time the equivalent sound levels (Leqs) are only at acceptable levels. Figure 3, 4, and 5 indicate the major differences between day and night time periods. It can be seen that in the emergency units, noise levels are much more variable and higher than the international standards. In the same way, all other departments where research was conducted were also found to be at non-acceptable levels according to the standards. Especially, 8:30 on Monday mornings which is the entrance time, outpatient rooms and corridors are more crowded than the other areas. Figure 2, 4, and 5
show that there is little variation in the sound levels measured among the six units studied at the selected hospitals. The average Leq varies between
45 to 75 dB (A). The Pediatric emergency unit is the noisiest unit of the six (PEU, PICU, PP, AEU, AICU, and AP), and also the most variable unit. In terms of noise levels, an interesting observation is the comparison of the measured noise levels with the WHO guidelines and the typical speech levels. Clearly, the observed sound levels exceed the WHO’s guidelines significantly by at least 20 dB (A) on average levels, and by at least 45 dB (A) on Lmax. Further, all of the measured logarithmic average SPLs exceed the typical speech level between two persons of commonly 45–60 dB (A), suggesting that the staff needs to raise their voice above the noise routinely in order to be heard. Given the evidence that sound levels in hospitals are rising annually, it might eventually become difficult to orally communicate even by means of shouting. Considering the correlation between the two signals (with the appropriate time delay to travel to the wall from the air vent), it is possible to determine whether the low frequency SPL in the units is structure-born or airborne. On the basis of some of the measurements, which generally produced low correlations, the author believes the sound to be airborne.
Figure 2 shows the Leq results obtained from intensive care units in the hospitals subject to this research. The results are quite similar to those obtained in other units. However, here the “quiet” period is shorter and rather similar to the noisy period than is the case for these units. Especially, the three measurements in and near the nurse stations are the most intense. The occupied pediatric room is quite similar to the nurses station. The unoccupied pediatric room is however, significantly quieter. The 40dB level seen in the quiet periods (or at night time), thus, defines the noise level in this room - the lowest observed in measurements. What is also interesting is that hospital activity increased this noise level to about 50 dB (A) even though the room remained empty and both sets of doors were closed. It was noted that all doors in all the five hospitals investigated have large gaps between the bottom frame and the floor; hence, there is no surprise as to their lack of acoustic insulation.
LIMITATIONS AND THOUGHTS FOR THE FUTURE
Throughout the course of this research, many obstacles HAVE been overcome, including hospital regulations and their overall status. Firstly; because of safety and security regulations, managements do not accept to give views, statistical and project information on the issue. They are
NOISE FACTORS IN HEALTHCARE FACILITIES METU JFA 2012/2 365
only willing to give this information to limited users and to managerial bodies using conditions like evaluation, comparison, statistical work, and recommendation. Also at some of the units, such as the psychiatric unit, access is limited. In the case of such units, consequently, the hospital staff had to be employed for the purpose of measurement. Not one patient was allowed to see a foreigner or any person who is measuring. Other units where measurements were taken under restrictions and possible inaccuracies secured are the emergency and the surgical units. The limitations in these units occurred due to the insufficient number of spots for measurements as well as the sudden change in the setting, such as a patient being rushed in. With regards to the correlation between staff comfort in the hospital, the questionnaire results indicate that the staff does not favor entirely-silent working conditions, and that environments with average noise have a more reassuring effect than the silent atmosphere. These results conform to the author’s personal experiences and inquiries regarding noise levels at home, at work, and in public places in Turkey (11). In addition to these direct effects of noise, there are other serious questions that remain and that have not been answered adequately by research studies; namely, whether elevated noise levels contribute to medical
errors. Overall, individuals are likely to spend some time in a hospital throughout their lives, and many will probably spend a large amount of
time in them. The problem of hospital noise is clearly under-studied and not well-understood. The goal is to alter this neglected field in meaningful ways. The present study shows similar results to the research conducted at Johns Hopkins, in that continuous background noise is not as counter-effective on the staff as unexpected and sharp noise is. Several alternatives emerge when considering this research in terms of psycho-acoustics, noise control, and architectural design. First, although measurements have been taken in some major units in these hospitals, many other units and areas have yet to be taken into consideration for this purpose. Later, measurements will need to be continued given the frequency band analysis, which can help to determine the different sound sources and their impact on such environments. For instance, the type of octave band sound sources that are dominant, and the type of analysis to characterize the existing environment and to understand the potential location of such sound sources. Additionally, collaboration has been initiated with the medical staff at the selected hospitals to find technological solutions for the communication problems which lead to improved speech recognition. In particular, the advantage of stereophonic sound reception has not been exploited in hospital environments using conventional sound systems. As a result, work has been started to demonstrate such systems and to incorporate their application in hospitals. Finally, there is an urgent need for the development of silent HVAC systems. With regards to the overhead paging systems, such items need be tested and installed on the basis of their ability to perform well while producing less noise.
ACKNOWLEDGMENTSFor this research, the author would like to thank the former Middle East Technical University President Prof. Dr. Ural Akbulut and her instructor Prof. Dr. Mehmet Çalışkan, the Hacettepe University vice President and Chairman of Audiology Department, Prof. Dr. Erol Belgin, along with the Chairpersons of medical school Gazi University, Zonguldak Karaelmas University, and Başkent University.
FİLİZ BAL KOÇYİĞİT366 METU JFA 2012/2
REFERENCES
AITKEN, R.J. (1982) Quantitative noise analysis in a modern hospital, Arch. Environ. Health, n:37, 361-4.
ALLAOUCHICHE, B., DUFLO F., DEBON R., BERGERET A., and CHASSARD D. (2002) Noise in the postanaesthesia care unit, British Journal of Anaesthesia, n:88; 369-73.
ANSI (1995) American National Standards Institute, “Criteria for evaluating room noise: S12.2” reaffirmed on 24 May, 1999.
BAKER, C. (1984) “Sensory overload and noise in the ICU: Sources of environmental stress,” Intensive Critical Care Nurs., n:6; 66-79.
BAL KOÇYİĞİT, F. (2004) Factor Effect of Frequency Band for Noise Control; Case Study From Kızılay, 4-7 July 2004, ICSV 11. International Congress, St. Petersburg, Russia; 639-46.
BALOGH, D., KITTINGER, E., BENZER, A., and HACKL, J. (1993) Noise in the ICU, Journal of Intensive Care Medicine (JIC), n:19; 343-6.
BAYO M., GARCIA A., and AMANDO G. (1995) Noise levels in an urban hospital and workers’ subjective responses, Arch. Environ. Health, n:50, 247-51.
BENINI, F., MAGNAVITA, V., LAGO, P., ARSLAN, E., and PIASO, P. (1996) Evaluation of noise in the neonatal intensive care unit, American Journal of Perinatology, n:13, 37-41.
BENTLEY, S., MURPHY, F., and DUDLEY, H. (1977) Perceived noise in surgical wards and an intensive care area: An objective analysis, British Medical Journal., n:2; 1503-6.
BILEY, F. (1994) Effects of noise in hospitals, British Medical Journal, n:3, 110-113.
BLENNOW, G., SVENNINGSEN, N., and ALMQUIST, B. (1974) Noise levels in incubators: Adverse effects?, Pediatrics, n:53; 29-32.
BOVENZI, M. and COLLARETA, A. (1984) Noise levels in a hospital, J. Industrial Health, n:22; 75-82.
BUSCH-VISHNIAC, I.J., WEST, J.E., BARNHILL, C., HUNTER, T., ORELLANA, D., and CHIVUKULA, R. (2005) Noise levels in Johns Hopkins Hospital, Journal of Acoustical Society of America; 3629-45.
DE CAMP, U. (1979) The measurement of sound levels in hospitals, Noise Control Eng., n:13; 24-7.
EPA (1974) United States Environmental Protection Agencies “Information on levels of environ. noise requisite to protect public health and welfare with an adequate margin of safety”.
FALK, S. and WOODS, N. (1973) Hospital noise - Levels and potential health hazards, North. England Journal of Medical, n:289; 774-80.
GOODFRIEND, L. and CARDINELL, R. (1963) Noise in hospitals, Technical Report No. 930-D-11, Public Health Service, Division of Hospital and Medical Facilities.
GUERRERO, R. (2001) Intermittent noise sampling and control strategies in the hospital environment, Master’s thesis, NJIT.
HASLAM, P. (1970) Noise in hospitals: Its effect on the patient, Nurs. Clinic North America, n:5; 715-24.
NOISE FACTORS IN HEALTHCARE FACILITIES METU JFA 2012/2 367
HILTON, B. (1985) Noise in acute patient care areas, Research of Nurs. Health, n:8; 283-91.
HOLMBERG, S. and COON, S. (1999) Ambient sound levels in a state psychiatric hospital, Arch. Psychiatr. Nurs., N:XIII, 117126.
Institute of Turkish Standardization, TS 9798 (ISO 1996 – 2) ve TS 9315 (ISO 1996– 1).
Intenational Standard Organization (ISO/R) 1996:1974.
KAHN, D., COOK, T., CARLISLE, C., NELSON, D., KRAMER, N., and MILLMAN, R. (1998) Identification and modification of environmental noise in an ICU setting, Chest, n:114; 535-40.
KAM, P., KAM, A., and THOMPSON, J. (1994) Noise pollution in the anaesthetic and intensive care environment, Anaesthesia, n:49; 982-6.
MINCKLEY, B. (1968) “A study of noise and its relationship to patient discomfort in the recovery room,” Nursing Reserch,n:17; 247-50.
MURTHY, V., MALHOTRA, S., BALA, I., and RAGHUNATHAN, M. (1995) Detrimental effects of noise on anesthetists, Canadian Journal of Anaesthesis, n:42; 608-11.
OGILVIE, A. (1980) Sources and levels of noise on the ward at night, Nursing Times, n:76; 1363-6.
OMOKHODIAN, F. and SRIDHAR, M. (2003) Noise levels in the hospital environment in Ibadan, African Journal of Medical Science, n:32; 139-42.
PHILBIN, M. (2000) The full-term and premature newborn: The influence of auditory experience on the behavior of preterm newborns, Journal of Perinatal. n: 20; 77-87.
PIMENTEL-SOUZA, F., CARVALHO, J., ALVARES, P., RODRIGUES, C., and SIQUEIRA, A. (2003) Noise and sleep quality in two hospitals in the city of Belo Horizonte, Brazil. http://www.icb.ufmg.br/lpf/2-19.html.
SHANKAR, N., MALHOTRA, K., AHUJA, S., and TANDON, O. (2001) Noise pollution: A study of noise levels in the operation theatres of a general hospital during various surgical procedures, Journal of Indian Medical Association, n:99; 244-7.
TS EN ISO 140-8 Akustik – Yapılarda ve yapı elemanlarında ses yalıtımının ölçülmesi – Bölüm 8: Fazla ağır standard bir zeminde iletilen darbe gürültüsünün zemin kaplamaları tarafından azaltılmasına ilişkin lâboratuvar ölçmeleri (modified with;TS EN ISO 10140-5:2010 :2011; TS EN ISO 10140-4:2010 :2011; TS EN ISO 10140-3:2010 :2011; TS EN ISO 10140-2:2010 :2011; TS EN ISO 10140-1:2010 :2011).
TS ISO 140-5; Akustik Yapılarda ve Yapı Elemanlarında Ses Yalıtımının Ölçülmesi- Bölüm 5: Dış Cephe Kaplama Elemanları ve Dış Cephe Kaplamalarının Hava İle Yayılan Ses Yalıtımının Alan Ölçmeleri,16.01.1996 (modified).
Turkish National News (2005) Evaluation of Environmental Noise, (National News) Table 7 and 12, Part 31, Ap.4.
TURNER, A., KING, C., and CRADDOCK, J. (1975) Measuring and reducing noise, Hospitals, n:49; 85-90.
WHO (1999) World Health Organization “Guide for community noise,” B. Berglund, T. L, D. H. S, K. T. Goh, Tech. Report.
FİLİZ BAL KOÇYİĞİT368 METU JFA 2012/2
SAĞLIK TESİSLERİNDE GÜRÜLTÜ ETMENLERİ: TÜRKİYE’DEKİ HASTANELERDEN ÖRNEKLEMELER
Bu makale, çalışma alanının gürültü seviyesinden kaynaklanan iletişim kaybı nedeni ile çalışmaların etkilendiği sağlık merkezlerinde gürültü seviyesini değerlendirmek ve gürültü seviyesinin aynı zamanda binanın mimari tasarımı ile etkileşimini araştırmayı, elde edilen sonuçlar ile ileride yapılacak çözüm önerisi çalışmalarına ışık tutmayı amaçlamaktadır. Çalışma kapsamını sınırlamak amacı ile beş hastane seçilmiştir. Örnek alınan hastanelerin hem kent hem de yakın ve uzak çevreden gelen hastaları kabul eden hasta kapasitesi yüksek hastaneler olmasına dikkat edilmiştir. Devlet ve özel hastanelerden seçilen örneklerden birisi yöre hastanesi görünümünde olmasına karşın konumu nedeni ile çevreden kapasitesi üzerinde hasta kabul eden devlet hastanesi, birisi yine geniş bir bölgeden hasta alan özel üniversite araştırma hastanesi, bir diğeri Karadeniz bölgesi çevresinde geniş bölgeden hasta kabul eden devlet üniversitesi hastanesi, ikisi Ankara merkezinde devlet üniversitesi araştırma hastanesidir. Sonuçlar eşdeğer ses basınç seviyeleri (her alanda 20 noktadan 5’er dakikalık Leq şeklinde olmak üzere), Lmax, Lmin ölçümleri fast ve slow mode olarak alındı. Türkiye ve Amerika Birleşik Devletleri’nden alınan örnek hastanede elde edilen sonuçların, Dünya Sağlık Örgütü (WHO)’nün kabul edilebilir bulduğu seviyelerin üzerinde olduğu tespit edilmiştir. 24 saatlik ortalama aralıkta ortalama eşdeğer basınç seviyesi Amerikadaki hastanelerde 50-60 dB(A) Türkiye’dekilerde ise 55-75 dB(A) arası olduğu belirlenmiştir. Bu seviye aralıkları 30-100dB (düşük mod) ve 50-120 dB (yüksek mode) arasında değiştirerek ölçülmüştür. Spektrum makine seslerinin de değerlendirilebilmesi için 16-8000 Hz. arasında Lmax-Lmin azami için oktav bantlar ve Leq ölçümleri için A-ağırlıklandırma şeklinde ölçülmüştür. Spektrumları çizelgesine göre, düşük frekanslar olan 63-500 Hz oktav bantları içinde genellikle düzdür, 500-4000 Hz artış göstermekte, 4000 Hz. üzeri insan sesi seviyesi üzerindeki frekanslarda ses basınç seviyeleri düşmektedir. Son altı yıldır alınan ölçümlerden oluşturulan grafikler geceleri ortam ses seviyelerinin belirgin biçimde düştüğünü, gündüzleri ise ulusal ve uluslararası standartların çok üstünde olduğunu göstermektedir. Ölçüm sonuçlarında elde edilen kabul edilebilir ses seviyesinden yüksek sonuçların kullanıcılar üzerindeki etkileri hastanelerde yapılan anketler ile de desteklenmiştir.
FİLİZ BAL KOÇYİĞİT; B.Arch., M.Arch., PhD.Received her degrees at Department of Architecture, METU, Department of Civil Engineering, İTÜ, Department of Architecture, Gazi Univ., Department of Interior Design, HU. Has researched about noise control in hospitals, metro stations, and education buildings. Her main field of interests are architectural acoustics, lighting, statics and construction, and building materials. Has been employed at the Atılım University since 2010. [email protected], [email protected], [email protected].
Alındı: 01.11.2011; Son Metin: 18.08.2012
Anahtar Sözcükler: gürültü; mimarlık; frekans; A-ağırlıklı sesler; akustik konfor; ses spektrumu; hastane bölümleri; sağlık merkezleri.