Noise - Colorado Department of Transportation
50
I-70 Mountain Corridor PEIS Noise Technical Report August 2010 Reissued March 2011
Transcript of Noise - Colorado Department of Transportation

I-70 Mountain Corridor PEIS Noise Technical Report August 2010
Reissued March 2011

Noise Technical Report
This page intentionally left blank.

Noise Technical Report
I-70 Mountain Corridor PEIS Technical Reports August 2010 Page i
Table of Contents Section 1. Purpose of the Report .............................................................................................. 1 Section 2. Background and Methodology ................................................................................ 1
2.1 Noise Concepts ............................................................................................................... 1 2.1.1 Measurement of Noise .......................................................................................... 1 2.1.2 Noise Terminology ................................................................................................. 2 2.1.3 Human Perception of Changes in Noise Levels .................................................... 3
2.2 Laws Governing Noise from Highways and Transit Facilities .......................................... 3 2.3 Noise Assessment Methodology ..................................................................................... 5
Section 3. Description of Alternatives ...................................................................................... 6 3.1 Minimal Action Alternative ............................................................................................... 6 3.2 Transit Alternatives .......................................................................................................... 6
3.2.1 Rail with Intermountain Connection ....................................................................... 7 3.2.2 Advanced Guideway System ................................................................................. 7 3.2.3 Dual-mode Bus in Guideway ................................................................................. 7 3.2.4 Diesel Bus in Guideway ......................................................................................... 7
3.3 Highway Alternatives ....................................................................................................... 7 3.3.1 Six-Lane Highway 55 mph Alternative ................................................................... 8 3.3.2 Six-Lane Highway 65 mph Alternative ................................................................... 8 3.3.3 Reversible Lanes Alternative ................................................................................. 8
3.4 Combination Alternatives ................................................................................................. 8 3.5 Preferred Alternative—Minimum and Maximum Programs ............................................. 9 3.6 No Action Alternative ....................................................................................................... 9
Section 4. Affected Environment ............................................................................................. 10 4.1 Measured Noise Levels ................................................................................................. 10 4.2 Other Corridor Noise Studies and Mitigation ................................................................. 12
4.2.1 Eagle Interchange ............................................................................................... 12 4.2.2 Eagle-Vail Half-Diamond Interchange ................................................................. 12 4.2.3 Vail Noise Study .................................................................................................. 12 4.2.4 Dillon Valley Noise Abatement ............................................................................ 13 4.2.5 Silver Plume Noise Wall ...................................................................................... 13 4.2.6 Idaho Springs Noise Wall .................................................................................... 13 4.2.7 Hogback Noise Assessment ................................................................................ 13 4.2.8 Sand Storage Berms ........................................................................................... 13
Section 5. Environmental Consequences .............................................................................. 14 5.1 Direct Impacts ................................................................................................................ 14
5.1.1 Noise Attributes of Each Alternative .................................................................... 14 5.1.2 Summary of Source Noise Level Changes Without Regard to Location or Topography .................................................................................................................. 18 5.1.3 Effect of Location and Topography on Noise Propagation .................................. 19 5.1.4 Terrain-Specific Issues in Analyzed Areas .......................................................... 21 5.1.5 Summary of Predicted Noise Levels.................................................................... 37 5.1.6 Potential to Exceed CDOT Guidelines ................................................................ 40
5.2 Indirect Impacts ............................................................................................................. 41 5.3 Construction Noise ........................................................................................................ 41 5.4 Impacts in 2050 ............................................................................................................. 41
Section 6. Tier 2 Considerations ............................................................................................. 42 Section 7. Mitigation Strategies to Reduce Highway Noise Levels...................................... 42
7.1 Noise Walls .................................................................................................................... 42

Noise Technical Report
Technical Reports I-70 Mountain Corridor PEIS Page ii August 2010
7.1.1 Strategy ............................................................................................................... 42 7.1.2 Noise Reduction .................................................................................................. 43
7.2 Noise Berms .................................................................................................................. 43 7.2.1 Strategy ............................................................................................................... 43 7.2.2 Noise Reduction .................................................................................................. 43
7.3 Small Concrete Barriers (“Jersey Barriers”) ................................................................... 43 7.3.1 Strategy ............................................................................................................... 43 7.3.2 Noise Reduction .................................................................................................. 43
7.4 Acquisition of Property to Form Buffer Zone .................................................................. 43 7.5 Alteration of Horizontal Alignment ................................................................................. 43 7.6 Alteration of Vertical Alignment ...................................................................................... 44 7.7 Engine Compression Brakes ......................................................................................... 44 7.8 Noise Insulation of Buildings .......................................................................................... 44 7.9 Pavement Type .............................................................................................................. 44 7.10 Active Noise Control .................................................................................................... 44
Section 8. References ............................................................................................................... 46
List of Figures Figure 1. Vail Cross Section, Westbound View ...................................................................... 23 Figure 2. West Vail 66 dB(A) Noise Contours and Measurement Locations ....................... 24 Figure 3. Central Vail 66 dB(A) Noise Contours and Measurement Locations ................... 25 Figure 4. East Vail 66 dB(A) Noise Contours and Measurement Locations ........................ 26 Figure 5. Dillon 66 dB(A) Noise Contours and Measurement Locations ............................. 28 Figure 6. Dillon Valley Cross Section, Eastbound View ........................................................ 29 Figure 7. Silver Plume 66 dB(A) Noise Contours and Measurement Locations ................. 30 Figure 8. Silver Plume Cross Section, Eastbound View ....................................................... 31 Figure 9. Georgetown 66 dB(A) Noise Contours and Measurement Locations .................. 32 Figure 10. Georgetown Cross Section View, Eastbound View ............................................. 33 Figure 11. Dumont Cross Section View, Eastbound View .................................................... 34 Figure 12. Idaho Springs 66 dB(A) Noise Contours and Measurement Locations ............. 35 Figure 13. Idaho Springs Cross Section, Eastbound View ................................................... 37
List of Charts Chart 1. Perception of Changes in Traffic Noise Levels ......................................................... 3 Chart 2. Truck and Compression Brake Noise Levels .......................................................... 12 Chart 3. Representative Changes between Existing and No Action Noise Levels ............. 15 Chart 4. Lmax Train Noise Audibility ......................................................................................... 16
List of Tables Table 1. Typical A-Weighted Noise Levels ............................................................................... 2 Table 2. CDOT Noise Abatement Criteria ................................................................................. 4 Table 3. Measured Noise Levels, 2001–2004 .......................................................................... 10 Table 4. Increase in Noise Levels from Alternatives Without Regard to Location,
“Loudest Hour” .......................................................................................................... 18 Table 5. Predicted Noise Levels .............................................................................................. 38 Table 6. Possible Mitigation Examples and Potential Effectiveness ................................... 45

Noise Technical Report
I-70 Mountain Corridor PEIS Technical Reports August 2010 Page 1
Section 1. Purpose of the Report This I-70 Mountain Corridor PEIS Noise Technical Report supports the information contained in Chapter 3, Section 3.10 of the I-70 Mountain Corridor Preliminary Environmental Impact Statement (PEIS). It identifies:
Methods used to identify existing noise conditions in the Corridor and estimate potential noise impacts of proposed alternatives
Applicable state and federal noise regulations Description of existing noise conditions in the Corridor Estimated noise impacts from the Action Alternatives evaluated in the I-70 Mountain Corridor
PEIS Noise analysis considerations for Tier 2 processes Mitigation strategies to reduce highway and transit noise impact
Section 2. Background and Methodology The primary purpose of the noise study conducted for the PEIS was to provide the lead agencies and stakeholders the ability to compare noise levels between alternatives. Given the relatively large number of alternatives, and the 160-mile length of the Corridor, it was not the intent of the study to estimate noise levels at all noise-sensitive receptors (e.g., residences) located along the Corridor for each alternative or to recommend specific noise mitigation (reduction) measures. That level of detail will be provided as part of project-specific Tier 2 processes (see Section 6 for more detail), when noise analyses will study alternatives in a specific location. The current Tier 1 study compares and contrasts noise among alternatives on a relatively qualitative basis in seven representative locations, and provides a list of possible mitigation measures that could be considered during Tier 2 processes.
Noise has been a topic of great concern to stakeholders at numerous public, local agency, and state/Federal agency meetings since the beginning of the PEIS process. The results of noise measurements, analysis methodologies, analysis results, and mitigation strategies were discussed in detail at approximately 10 public meetings (open to all stakeholders), approximately six individual meetings with local Clear Creek County officials, and a variety of other meetings with stakeholders such as historical advocates and parks officials.
2.1 Noise Concepts 2.1.1 Measurement of Noise Noise is most commonly measured on the decibel scale, which ranges from 0 decibels (dB), the threshold of audibility, to 140 dB, the threshold of pain. In addition to level or loudness, sound has a frequency or pitch component. The human ear is more sensitive to high-frequency sounds than to low-frequency sounds. An A-weighted decibel is a unit of measure corresponding to the way the human ear perceives the magnitude of sounds at different frequencies. A-weighted noise levels are expressed as dB(A).
Direct Noise Impacts • Increases in Corridor noise levels
from Action Alternatives due to: • Increased traffic volumes • Addition of buses and rail systems • Construction
Indirect Noise Impacts • Increased traffic on major access
routes to transit stations • Noise from growth in general

Noise Technical Report
Technical Reports I-70 Mountain Corridor PEIS Page 2 August 2010
Table 1 shows the A-weighted noise levels of some common sources. All noise levels discussed in this Technical Report are A-weighted decibels.
Table 1. Typical A-Weighted Noise Levels
Noise Source Noise Level (dB(A))
Amplified rock band 120
Commercial jet takeoff at 200 feet 110
Community warning siren at 100 feet 100
Busy urban street 90
Construction equipment at 50 feet 80
Freeway traffic at 50 feet 70
Normal conversation at 6 feet 60
Typical office interior 50
Soft radio music 40
Typical residential interior 30
Typical whisper at 6 feet 20
Human breathing 10
Source: Federal Highway Administration, September 1980
2.1.2 Noise Terminology Leq Leq is an abbreviation for “equivalent level,” and represents the average noise level over a stated time period. The one-hour Leq is used in this and most other environmental noise studies to describe traffic and transit noise levels.
“Loudest Hour” Noise Level Per Federal Highway Administration (FHWA) and Colorado Department of Transportation (CDOT) noise policies, the noise study was conducted for the "loudest hour" of the day. For the Highway Alternatives, this occurs at or near "rush hour," depending on the highway's capacity to handle all of the traffic demand without congestion occurring. Specifically, the loudest hour occurs when the highway is full, yet traffic is still moving at free-flow speeds (meaning, the posted speed). After this point, additional traffic demand causes congestion, speeds are reduced, and so are noise levels. For Rail with Intermountain Connection and Advanced Guideway System alternatives, the “loudest hour” Leq corresponds to the hour of peak service. For Combination Alternatives, the loudest hour was assumed to occur when the highway was at capacity and peak transit service was ongoing.
Lmax The Lmax is the maximum instantaneous noise level. It was used on this project to identify potential noise impacts from the Rail with Intermountain Connection and Advanced Guideway System alternatives. Noise impacts from these sources are not completely captured by the one-hour Leq, given the intermittent nature of their operation (versus a relatively full highway that produces a constant noise).

Noise Technical Report
I-70 Mountain Corridor PEIS Technical Reports August 2010 Page 3
2.1.3 Human Perception of Changes in Noise Levels As depicted in Chart 1, increases in noise levels of less than 3 dB(A) are generally considered imperceptible to humans outside of a laboratory environment. Increases of 3 to 5 dB(A) are considered noticeable, and increases of 10 dB(A) are perceived as a doubling of loudness. These relationships hold true, however, only when there is no change to the character of the noise. This would be the case with the No Action, Bus in Guideway, and Highway alternatives, as these sources only add more of the same sort of noise source (traffic). However, the Rail with Intermountain Connection and Advanced Guideway System alternatives would introduce noise sources with different frequency and time characteristics. Noise from these sources would likely be at least noticeable even when it is less loud than the highway.
Chart 1. Perception of Changes in Traffic Noise Levels
Source: Federal Highway Administration, September 1980
2.2 Laws Governing Noise from Highways and Transit Facilities Three federal agencies have noise regulations that are in some way related to this project:
Federal Highway Administration Federal Transit Administration (FTA) Federal Railroad Administration (FRA)
The Federal Railroad Administration defers to FTA noise and vibration impact assessment procedures for assessing impacts from conventional passenger rail lines and stationary rail facilities, as well as for horn noise assessment. These procedures are documented in the FTA report entitled Transit Noise and Vibration Impact Assessment (FTA 2006), and were used to predict noise levels from rail and advanced guideway system sources on this project. The predicted noise levels were then compared to FHWA impact criteria (versus FTA impact criteria). This is consistent with FTA guidelines, which recommend for multi-modal projects such as this that FHWA noise impact criteria be used where highway noise dominates (which is the case with the Action Alternatives). For subsequent Tier 2 processes, the noise impact criteria to be used (FHWA or FTA) will depend on the loudest noise source expected under the proposed alternatives. For projects where highway noise is dominant, FHWA impact criteria will be used.

Noise Technical Report
Technical Reports I-70 Mountain Corridor PEIS Page 4 August 2010
In isolated cases in the Corridor, rail or advanced guideway system may be the dominant source, and in this case FTA impact criteria will be used.
Federal Highway Administration noise regulations appear in 23 Code of Federal Part 772. The Colorado Department of Transportation has established procedures that implement the federal regulation. See CDOT Noise Analysis and Abatement Guidelines (CDOT, December, 2002) for details. These guidelines state that noise mitigation must be considered for any noise-sensitive receiver where predicted traffic noise levels, using future traffic volumes and roadway conditions, equal or exceed the noise abatement criteria shown in Table 2. Mitigation must also be considered for any receivers where predicted noise levels for future conditions are greater than existing noise levels by 10 dB(A) or more. A noise-sensitive receiver is any location where traffic noise may be detrimental to the enjoyment and functional use of property (primarily residences, but also schools, parks, and other community facilities)
Table 2. CDOT Noise Abatement Criteria
Activity Category
Leq1
(dB(A)) Description of Activity Category (Noise Receivers)
A 56 (Exterior) Lands on which serenity and quiet are of extraordinary significance and serve an important public need and where the preservation of those qualities is essential if the area is to continue to serve its intended purpose
B 66 (Exterior) Picnic areas, recreation areas, playgrounds, active sports areas, parks, residences, motels, hotels, schools, churches, libraries, and hospitals
C 71 (Exterior) Developed lands, properties, or activities not included in Categories A or B above
D N/A Undeveloped lands
E 51 (Interior) Residences, motels, hotels, public meeting rooms, schools, churches, libraries, hospitals, and auditoriums
Source: CDOT, December 2002 1 Hourly A-weighted equivalent level for the “loudest hour” of the day in the design year.
Key to Abbreviations/Acronyms dB(A)= A-weighted decibel Leq = equivalent level
In considering mitigation, the feasibility and reasonableness of proposed measures must be determined. Feasibility issues include:
If a noise barrier is to be constructed, can it be constructed in a continuous manner? (For example, gaps in noise barriers required for driveway entrances substantially degrade their performance.)
Can at least 5 dB(A) of noise reduction be achieved at front row receivers (receivers closest to the noise source)?
Are there any “fatal flaw” maintenance or safety issues involved with the proposed measure?
Reasonableness issues include:
What is the cost per benefited receiver per dB(A) of reduction? How loud are projected noise levels? Do a majority of the residents affected by the proposed measure approve of it? Is the majority of the development in the area noise abatement criteria Activity Category B?

Noise Technical Report
I-70 Mountain Corridor PEIS Technical Reports August 2010 Page 5
How long has the development under consideration for mitigation been in existence? How do future noise levels compare to existing levels?
Maps, Figure 7 through Figure 13, at the end of this Technical Report illustrate how far from proposed transportation facilities noise levels of 66 dB(A) or more will occur. (Noise levels of 66 dBA or higher are levels at which CDOT considers noise-sensitive receptors to be impacted by noise.) The maps show a line (contour) up to which noise from project alternatives are at least 66 dB(A). Beyond the contour, noise levels are lower than 66 dB(A).
The federal law governing highway noise analysis and mitigation is currently being revised, and is expected to be finalized in 2011. Expected changes include revisions to the Noise Abatement Criteria categories and to the manner in which mitigation cost-effectiveness is determined.
Note that a different threshold for mitigation may apply at Tier 2 processes to receivers that are also identified as historic properties. Because specific effects on specific historic properties cannot be determined at this stage in the NEPA process, the outcome of Section 106 for Tier 1 is the Programmatic Agreement among the Federal Highway Administration, the Advisory Council on Historic Preservation, the Colorado State Historic Preservation Officer, the Colorado Department of Transportation, the United States Forest Service, and the United States Bureau of Land Management regarding implementation of the Interstate 70 Mountain Corridor Project (referred to as the Programmatic Agreement and included in Appendix B of the I-70 Mountain Corridor PEIS). The Programmatic Agreement establishes the process through which FHWA and CDOT will take into account the effects of Tier 2 processes on historic properties, including noise effects. This Programmatic Agreement was developed in consultation with the consulting parties under Section 106 of the National Historic Preservation Act and was executed by the signatory agencies in April 2008.
2.3 Noise Assessment Methodology Due to the programmatic nature of this study, noise was analyzed only within seven major communities adjacent to the I-70 highway in the Corridor that are considered representative of the range of impacts that will occur in the entire Corridor:
Dowd Canyon Vail Dillon Valley Silver Plume Lawson, Downieville, and Dumont Georgetown Idaho Springs
Noise monitors placed at each of these locations monitored noise levels continuously over several days in 2001 and 2004 to establish the existing “loudest hour” noise level. Although these noise measurements are 6 to 9 years old, they are still representative of noise conditions in the Corridor. The noise level analysis considers noise conditions during the loudest hour of the day (the hour of peak traffic volumes, when traffic is traveling at free-flow speeds). The majority of the Corridor areas studied already reached the loudest hour on a regular basis at the time of the measurements, meaning, the highway was filling to capacity during the measurements and thus got as loud as it is going to get under current capacity while maintaining free-flowing travel speeds. In areas where the highway still has capacity, and therefore existing loudest hour noise levels have the potential to increase, increases would be small (1 dB or less). This increase would not affect the general conclusion that most of the residences along the Corridor
Noise Technical Report
Technical Reports I-70 Mountain Corridor PEIS Page 6 August 2010
would be impacted by noise. Also, existing noise levels will be re-assessed during the Tier 2 processes, and project-specific noise analyses will be conducted.
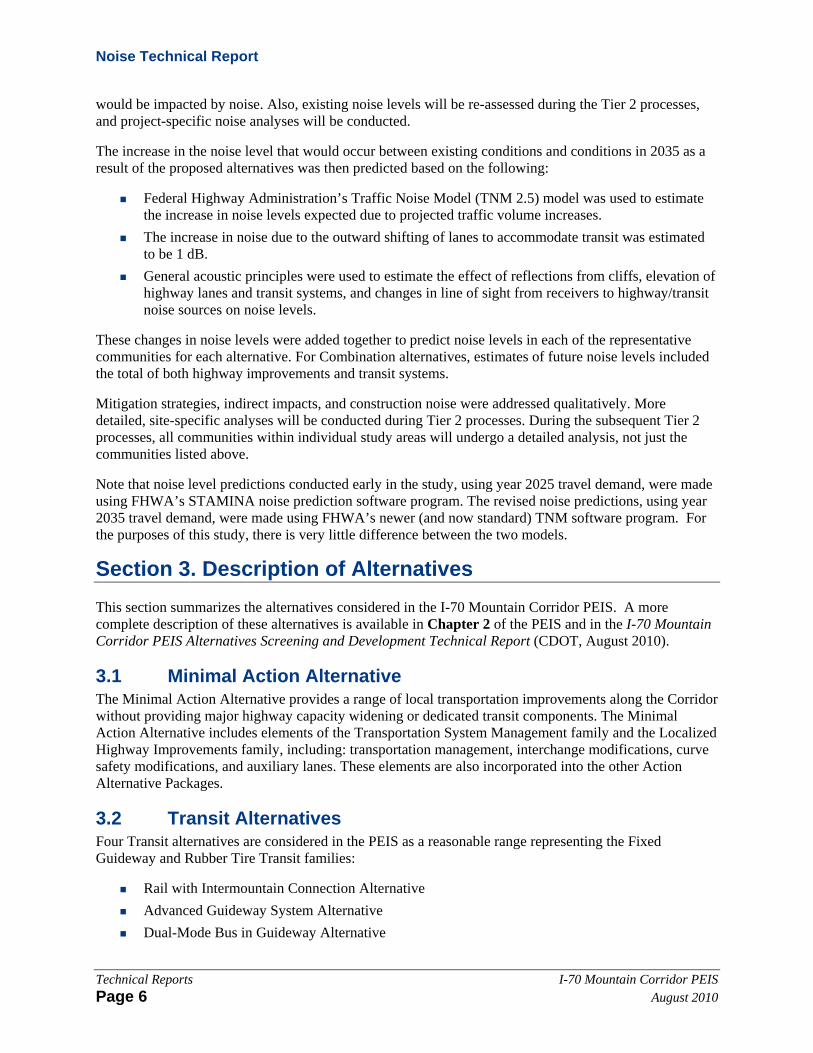
The increase in the noise level that would occur between existing conditions and conditions in 2035 as a result of the proposed alternatives was then predicted based on the following:
Federal Highway Administration’s Traffic Noise Model (TNM 2.5) model was used to estimate the increase in noise levels expected due to projected traffic volume increases.
The increase in noise due to the outward shifting of lanes to accommodate transit was estimated to be 1 dB.
General acoustic principles were used to estimate the effect of reflections from cliffs, elevation of highway lanes and transit systems, and changes in line of sight from receivers to highway/transit noise sources on noise levels.
These changes in noise levels were added together to predict noise levels in each of the representative communities for each alternative. For Combination alternatives, estimates of future noise levels included the total of both highway improvements and transit systems.
Mitigation strategies, indirect impacts, and construction noise were addressed qualitatively. More detailed, site-specific analyses will be conducted during Tier 2 processes. During the subsequent Tier 2 processes, all communities within individual study areas will undergo a detailed analysis, not just the communities listed above.
Note that noise level predictions conducted early in the study, using year 2025 travel demand, were made using FHWA’s STAMINA noise prediction software program. The revised noise predictions, using year 2035 travel demand, were made using FHWA’s newer (and now standard) TNM software program. For the purposes of this study, there is very little difference between the two models.
Section 3. Description of Alternatives This section summarizes the alternatives considered in the I-70 Mountain Corridor PEIS. A more complete description of these alternatives is available in Chapter 2 of the PEIS and in the I-70 Mountain Corridor PEIS Alternatives Screening and Development Technical Report (CDOT, August 2010).
3.1 Minimal Action Alternative The Minimal Action Alternative provides a range of local transportation improvements along the Corridor without providing major highway capacity widening or dedicated transit components. The Minimal Action Alternative includes elements of the Transportation System Management family and the Localized Highway Improvements family, including: transportation management, interchange modifications, curve safety modifications, and auxiliary lanes. These elements are also incorporated into the other Action Alternative Packages.
3.2 Transit Alternatives Four Transit alternatives are considered in the PEIS as a reasonable range representing the Fixed Guideway and Rubber Tire Transit families:
Rail with Intermountain Connection Alternative Advanced Guideway System Alternative Dual-Mode Bus in Guideway Alternative

Noise Technical Report
I-70 Mountain Corridor PEIS Technical Reports August 2010 Page 7
Diesel Bus in Guideway Alternative
3.2.1 Rail with Intermountain Connection The Rail with Intermountain Connection Alternative would provide rail transit service between the Eagle County Regional Airport and C-470. Between Vail and C-470 the rail would be primarily at-grade running adjacent to the I-70 highway. The segment between Vail and the Eagle Count Airport would be constructed within the existing Union Pacific Railroad right-of-way. A new Vail Transportation Center, including new track, would be constructed between Vail and Minturn to complete the connection between the diesel and electric trains. This alternative also includes auxiliary lane improvements at eastbound Eisenhower-Johnson Memorial Tunnels to Herman Gulch and westbound Downieville to Empire and the other Minimal Action Alternative elements except for curve safety modifications at Dowd Canyon, buses in mixed traffic and other auxiliary lane improvements.
3.2.2 Advanced Guideway System The Advanced Guideway System Alternative would provide transit service between the Eagle County Regional Airport and C-470 with a 24-foot-wide, 118 mile, fully elevated system. The Advanced Guideway System Alternative would use a new technology that provides higher speeds than the other Fixed Guideway Transit technologies studied for the PEIS. Any Advanced Guideway System would require additional research and review before it could be implemented in the Corridor. Although the Federal Transit Administration-researched urban magnetic levitation system is considered in the PEIS, the actual technology would be developed in a Tier 2 process. This alternative includes the same Minimal Action elements as described previously for the Rail with Intermountain Connection Alternative.
3.2.3 Dual-mode Bus in Guideway This alternative includes a guideway located in the median of the I-70 highway with dual-mode buses providing transit service between the Eagle County Regional Airport and C-470. This guideway would be 24 feet wide with 3 foot high guiding barriers and would accommodate bidirectional travel. The barriers direct the movement of the bus and separate the guideway from general purpose traffic lanes. While traveling in the guideway, buses would use guidewheels to provide steering control, thus permitting a narrow guideway and providing safer operations. The buses use electric power in the guideway and diesel power when traveling outside the guideway in general purpose lanes. This alternative includes the same Minimal Action Alternative elements as described previously for the Rail with Intermountain Connection Alternative.
3.2.4 Diesel Bus in Guideway This includes the components of the Dual-mode Bus in Guideway Alternative except that the buses use diesel power at all times.
3.3 Highway Alternatives Three Highway alternatives are advanced for consideration in the PEIS as a reasonable range and representative of the Highway improvements, including Six-Lane Highway 55 mph, Six-Lane Highway 65 mph, and Reversible/HOV/HOT Lanes. The Highway alternatives considered both 55 and 65 mph design speeds to 1) establish corridor consistency and 2) address deficient areas within the Corridor. The 55 mph design speed establishes a consistent design speed throughout the Corridor, which currently does not exist. The 65 mph design speed further improves mobility and addresses safety deficiencies in key locations such as Dowd Canyon and the Twin Tunnels. Both the 55 mph and the 65 mph design speed options are augmented by curve safety improvements, but the 65 mph design speed constructs tunnels in two of the locations: Dowd Canyon and Floyd Hill/Hidden Valley.
Noise Technical Report
Technical Reports I-70 Mountain Corridor PEIS Page 8 August 2010
3.3.1 Six-Lane Highway 55 mph Alternative This alternative includes six-lane highway widening in two locations: Dowd Canyon and the Eisenhower- Johnson Memorial Tunnels to Floyd Hill. This alternative includes auxiliary lane improvements at eastbound Avon to Post Boulevard, both directions on the west side of Vail Pass, eastbound Frisco to Silverthorne and westbound Morrison to Chief Hosa, and the Minimal Action Alternative elements except for buses in mixed traffic and other auxiliary lane improvements.
3.3.2 Six-Lane Highway 65 mph Alternative This alternative is similar to the Six-Lane Highway 55 mph Alternative; it includes the same six-lane widening and all of the Minimal Action Alternative elements except the curve safety modification at Dowd Canyon. The higher design speed of 65 mph alternatives requires the curve safety modifications near Floyd Hill and Fall River Road to be replaced with tunnels.
3.3.3 Reversible Lanes Alternative This alternative is a reversible lane facility accommodating high occupancy vehicles and high occupancy toll lanes. It changes traffic flow directions as needed to accommodate peak traffic demands. It includes two additional reversible traffic lanes from the west side of the Eisenhower-Johnson Memorial Tunnels to just east of Floyd Hill. From the Eisenhower-Johnson Memorial Tunnels to US 6, two lanes are built with one lane continuing to US 6 and the other lane to the east side of Floyd Hill. This alternative includes one additional lane in each direction at Dowd Canyon. This alternative includes the same Minimal Action Alternative Elements as the Six-Lane Highway 55 mph Alternative.
3.4 Combination Alternatives Twelve Combination alternatives, combining Highway and Transit alternatives are considered in the PEIS. Four of these alternatives involve the buildout of highway and transit components simultaneously. Eight alternatives include preservation options, the intent of which is to include, or not preclude, space for future modes in the I-70 Mountain Corridor. The Combination alternatives all include the Six-Lane Highway 55 mph Alternative for highway components.
Combination Rail and Intermountain Connection and Six-Lane Highway Alternative—This alternative includes the 55 mph six-lane highway widening between Floyd Hill and Eisenhower-Johnson Memorial Tunnels, the Rail and Intermountain Connection transit components, and most of the components of the Minimal Action Alternative. The exception is that only one of the Minimal Action auxiliary lane improvements (from Morrison to Chief Hosa westbound) is included.
Combination Advanced Guideway System and Six-Lane Highway Alternative—This alternative includes the 55 mph six-lane highway widening between Floyd Hill and Eisenhower-Johnson Memorial Tunnels and the Advanced Guideway System transit components. It includes the same Minimal Action Alternative elements as the Combination Rail and Intermountain Connection and Six-Lane Highway Alternative.
Combination Bus in Guideway (Dual-Mode) and Six-Lane Highway Alternative—This alternative the 55 mph six-lane highway widening between Floyd Hill and Eisenhower-Johnson Memorial Tunnels and the dual-mode bus in guideway transit components. It includes the same Minimal Action Alternative elements as the Combination Rail and Intermountain Connection and Six-Lane Highway Alternative.
Combination Bus in Guideway (Diesel) and Six-Lane Highway Alternative—This alternative includes the 55 mph six-lane highway widening between Floyd Hill and Eisenhower-Johnson Memorial Tunnels and the diesel bus in guideway transit components. It includes the same Minimal Action

Noise Technical Report
I-70 Mountain Corridor PEIS Technical Reports August 2010 Page 9
Alternative elements as the Combination Rail and Intermountain Connection and Six-Lane Highway Alternative.
Combination Rail & Intermountain Connection and Preservation of Six-Lane Highway Alternative—This alternative includes the Rail and Intermountain Connection Alternative and preserves space to construct the Six-Lane Highway 55 mph at a later point.
Combination Advanced Guideway System and Preservation of Six-Lane Highway Alternative— This alternative includes the Advanced Guideway System and preserves space to construct the Six-Lane Highway 55 mph at a later point.
Combination Bus in Guideway (Dual-Mode) and Preservation of Six-Lane Highway Alternative—This alternative includes the Combination Bus in Guideway (Dual-Mode) Alterative and preserves space to construct the Six-Lane Highway 55 mph at a later point.
Combination Bus in Guideway (Diesel) and Preservation of Six-Lane Highway Alternative—This alternative includes the Bus in Guideway (Diesel) Alternative and preserves space to construct the Six-Lane Highway 55 mph at a later point.
Combination Preservation of Rail and Intermountain Connection and Six-Lane Highway Alternative—This alternative includes the Six-Lane 55 mph Highway Alternative and also preserves space to construct the Rail and Intermountain Connection at a later point.
Combination Preservation of Advanced Guideway System and Six-Lane Highway Alternative—This alternative includes the Six-Lane 55 mph Highway Alternative and also preserves space to construct the Advanced Guideway System at a later point.
Combination Preservation of Bus in Guideway (Dual-Mode) and Six-Lane Highway Alternative—This alternative includes the Six-Lane Highway Alternative and also preserves space to construct the Bus in Guideway (Dual-Mode) at a later point.
Combination Preservation of Bus in Guideway (Diesel) and Six-Lane Highway Alternative—This alternative includes the Six-Lane Highway Alternative and also preserves space to construct the Bus in Guideway (Diesel) at a later point.
3.5 Preferred Alternative—Minimum and Maximum Programs The Preferred Alternative provides for a range of improvements. Both the Minimum and the Maximum Programs include the Advanced Guideway System Alternative. The primary variation between the Minimum and Maximum Programs is the extent of the highway widening between the Twin Tunnels and the Eisenhower-Johnson Memorial Tunnels. The Maximum Program includes six-lane widening between these points (the Twin Tunnels and the Eisenhower-Johnson Memorial Tunnels), depending on certain events and triggers and a recommended adaptive management strategy.
3.6 No Action Alternative The No Action Alternative provides for ongoing highway maintenance and improvements with committed funding sources highly likely to be implemented by the 2035 planning horizon. The projected highway maintenance and improvements are committed whether or not any other improvements are constructed with the I-70 Mountain Corridor project. Specific improvements under the No Action Alternative include highway projects, park and ride facilities, tunnel enhancements, and general maintenance activities.

Noise Technical Report
Technical Reports I-70 Mountain Corridor PEIS Page 10 August 2010
Section 4. Affected Environment
4.1 Measured Noise Levels Noise levels were measured in the areas under study on several occasions from 2001 to 2004. Table 3 lists the locations, dates and times, and results of these measurements. As discussed in Section 2.3, although these noise measurements are six to nine years old, they are still representative of noise conditions in the Corridor. Most of the measurements were taken at a distance of 250 feet from the centerline of the I-70 highway. The measurement locations are shown in Figure 7 through Figure 13. The measured levels shown in Table 3 indicate that existing loudest hour noise levels along the I-70 highway range from 52 to 72 dB(A).
Noise levels were measured continuously for anywhere from one to seven days at each location. Where more than one day was measured, a consistent daily traffic noise pattern was observed and the noise level shown in Table 3 is that occurring during the “loudest hour.” Where only one day was measured, the level in Table 3 is that which occurred during the “loudest hour” that day. Noise impact and mitigation decisions will be made using predictions of “loudest hour” conditions.
“Loudest hour” traffic noise levels in the Corridor likely have not changed considerably between the time the noise measurements were taken and the present. The reason is that, in all of the areas studied, except Vail and Dowd Canyon, the I-70 highway was filling to capacity during the measurements and thus got as loud as it is going to get under current capacity while maintaining free-flowing travel speeds.
Table 3. Measured Noise Levels, 2001–2004
Town Location Site No. Date
Day of Week
Number of 24 Hour Periods
Measured
“Loudest Hour” Leq (dB(A))
Dowd Canyon Creekside Condos M4 January 17–21, 2003 All 4 62
Kayak Crossing Condos M5 January 17–21, 2003 All 4 60
Vail Golf course M1 March 9–10, 2001 Friday 1 63
West side of town, south of the I-70 highway
M2 March 9–10, 2001 Friday 1 67
West side of town, north of the I-70 highway
M3 March 9–10, 2001 Friday 1 65
Dillon Valley (before construction of noise wall – see Section 4.2.4 of this Technical Report)
East side of residential area M1 March 7–8, 2001 Wednesday 1 66
West side of residential area M2 March 7–8, 2001 Wednesday 1 61
Church M3 March 7–8, 2001 Wednesday 1 69
Silver Plume Behind existing noise wall M1 February 28– March 1, 2004
Wednesday 1 57
Near interchange M2 February 28–March 1, 2004
Wednesday 1 59
East end of town M3 February 28–March 1, 2004
Wednesday 1 68
Railroad depot M4 January 17–21, 2003 All 4 63

Noise Technical Report
I-70 Mountain Corridor PEIS Technical Reports August 2010 Page 11
Table 3. Measured Noise Levels, 2001–2004
Town Location Site No. Date
Day of Week
Number of 24 Hour Periods
Measured
“Loudest Hour” Leq (dB(A))
Georgetown Below the I-70 highway bench
M1 March 1–2, 2004 Friday 1 52
East of interchange M2 March 1–2, 2004 Friday 1 68
Lawson, Downieville, and Dumont
Lawson: South side of the I-70 highway, along Silver Lakes Drive
M1 July 19–26, 2004 All 7 65
Dumont: South side of the I-70 highway, along Stanley Road
M2 July 19–26, 2004 All 7 68
Idaho Springs Residences on east end of town
M1 March 2–5, 2001 Sunday 5 65
Downtown M2 February 20–21, March 2–5, 2001
Sunday 6 65
Residences on west end of town
M3 February 20–21, 2001 Tuesday 1 64
Charlie Tayler Water Wheel M4 January 17–21, 2003 All 4 72
Source: Hankard Environmental, Inc., March 2001, January 2003, February 2004
Key to Abbreviations/Acronyms dB(A)= A-weighted decibel Leq= equivalent level
Noise measurements were conducted in various communities in March 2003 to obtain information on passing trucks and compression brake use. Chart 2 shows results of the measurements taken along Silver Lakes Drive in Lawson. The average noise level over this time period was 64 dB(A) (Leq). Maximum noise levels from individual eastbound truck pass-bys and from compression brake events ranged from 68 to 74 dB(A). The measurements were taken at a distance of approximately 150 feet from the center of the I-70 highway.

Noise Technical Report
Technical Reports I-70 Mountain Corridor PEIS Page 12 August 2010
Chart 2. Truck and Compression Brake Noise Levels
40
45
50
55
60
65
70
75
80
12:45
12:46
12:47
12:48
12:49
12:50
12:51
12:52
12:53
12:54
12:55
12:56
12:57
12:58
12:59
Time
Noi
se L
evel
(2-s
econ
d L
eq, d
BA
)
EB SemiJake
Jake
UnknownJakeEB Semi
EB Semi Jake
Source: Hankard, March 2003
4.2 Other Corridor Noise Studies and Mitigation 4.2.1 Eagle Interchange The proposed interchange connecting the Eagle County Airport to the I-70 highway will accommodate the recent expansion of the airport and anticipated growth among surrounding communities. There are several residences in the valley near the four proposed ramp alternatives, in addition to many proposed commercial receivers along Cooley Mesa Road. A noise assessment was completed for the receivers, according to CDOT requirements. None of the residential receivers were considered affected, as predicted future noise levels would neither exceed 66 dB(A) nor increase 10 dB(A) from existing conditions. Many of the commercial receivers were considered affected, but mitigation was deemed unreasonable due to access issues. (Hankard Environmental Inc., February 2004)
4.2.2 Eagle-Vail Half-Diamond Interchange A half-diamond interchange was recently constructed in the Eagle-Vail area. A noise assessment of the area was completed to determine if noise levels at any of the existing residential or commercial receivers located within the study area exceeded CDOT’s noise abatement criteria, and if so, to evaluate the feasibility and reasonableness of implementing mitigation measures. Current land use in the area includes residences, office, and retail. The noise study considered many of these receivers to be affected but deemed mitigation unreasonable due to excessive cost. (Hankard Environmental Inc., June 2001)
4.2.3 Vail Noise Study The town of Vail commissioned a noise study of the area in 2000. The study concluded that approximately 25 percent of the residences in Vail exceed CDOT’s 66 dB(A) noise abatement criteria. The study also concluded that noise walls are reasonable and feasible in several locations. (Hankard Environmental Inc., October 2005)

Noise Technical Report
I-70 Mountain Corridor PEIS Technical Reports August 2010 Page 13
4.2.4 Dillon Valley Noise Abatement A 1996 CDOT project that added an eastbound acceleration/climbing lane from Dillon to the Eisenhower-Johnson Memorial Tunnels required that a noise assessment be completed to evaluate the impacts on adjacent Dillon Valley homeowners. The noise impacts and “feasibility and reasonableness” criteria justified noise abatement for the segment of the eastbound I-70 highway from mileposts 206.3 to 207.8. A noise berm constructed in 1997 and finished in 2001 fulfilled abatement recommendations for the central portion of the noise-affected area. A noise wall was constructed to complete the noise abatement requirements. The 8- to 12-foot-tall precast concrete wall was designed to reduce noise levels by at least 5 dB(A) at the first row of residences. Dillon Valley Homeowners Association and residents selected the aesthetic components of the noise wall (Hankard Environmental Inc., March 2001).
4.2.5 Silver Plume Noise Wall The Colorado Department of Transportation constructed the Silver Plume noise wall in 1994, under the Colorado Type II Noise Wall Program. The wall is unique for its recycled plastic composition and its pocketed design for vegetation. Plant cover was never established on the wall due to the harsh mountain conditions. The 1,200-foot-long wall varies from 9 to 14 feet in height and runs parallel to the westbound shoulder of the interstate and the westbound entrance ramp west of the town center (Air Sciences Inc. et. al., April 1999).
4.2.6 Idaho Springs Noise Wall The noise wall located between the westbound I-70 highway mileposts 239 and 240 in Idaho Springs was constructed as a part of the Type II Noise Wall Program in 1993. The wooden wall is 1,168 feet long and 14 feet tall and provides noise reduction to a residential neighborhood in the west part of town.
4.2.7 Hogback Noise Assessment A noise assessment was completed as part of the Hogback Parking Facility Environmental Assessment, which studied the effects of expanding the existing Hogback Parking Lots 2 and 3 near US 40 in Jefferson County (CDOT, 2001). Three receivers (two commercial and one residential) were considered close enough to the project to be affected by increased noise. Roadway noise levels were predicted to increase by 3 to 4 dB(A) as a result of projected traffic increases and the fact that US 40 will be realigned closer to the receivers. Noise levels from the parking lot project were predicted to increase by 5 to 8 dB(A) as a result of the increase in size of the site and the fact that it, too, will be closer to two of the three receivers. Of the three receivers, only the service station/convenience store was considered affected, with a predicted noise level of 71 dB(A). Mitigation was deemed to be infeasible for this receiver because a break is required in a noise barrier for access, degrading the acoustic performance of the barrier and possibly creating a safety hazard.
4.2.8 Sand Storage Berms Over the past few years, CDOT has used sand removed from sediment basins on Straight Creek and Black Gore Creek to construct berms (hills) along a few residential areas adjacent to the I-70 highway near Frisco and Vail. The berms were seeded to prevent erosion, have a more natural appearance than noise walls, and have a much lower cost.

Noise Technical Report
Technical Reports I-70 Mountain Corridor PEIS Page 14 August 2010
Section 5. Environmental Consequences In general, each of the Action Alternatives would increase noise levels in the Corridor. The increase at any one location would depend on changes to the source of noise (for example, the addition of a rail system and/or the increase in the number of highway lanes), and on topography (for example, the proximity and relative elevation of homes and businesses to the transportation system, the presence of barriers, and the presence of cliffs).
5.1 Direct Impacts 5.1.1 Noise Attributes of Each Alternative This section discusses the noise impacts likely to result from each alternative, without consideration of location within the Corridor or surrounding topography.
No Action Alternative Per FHWA and CDOT noise policies, the noise study was conducted for the "loudest hour" of the day. This occurs at or near "rush hour," depending on the highway's capacity to handle all of the traffic demand without congestion occurring. Specifically, the loudest hour occurs when the highway is full, yet traffic is still moving at free-flow speeds (at least posted speed). After this point, additional traffic demand causes congestion, speeds are reduced, and so are noise levels. Therefore, whether or not loudest hour noise levels would increase under the No Action Alternative depends on whether or not the highway in each specific town under study is already reaching capacity on a regular basis or not. This is the case in all of Clear Creek County and in Dillon Valley, therefore loudest hour noise levels in these communities under the No Action alternative would be no louder than they are today. In Vail and Dowd Canyon, maximum existing hourly traffic volumes are approximately 2,400 vehicles per hour, yet the highway in these areas can accommodate approximately 4,200 vehicles per hour before congestion begins to occur. If traffic volumes were to reach 4,200 vehicles per hour, which represents maximum possible loudest hour conditions under the No Action alternative, noise levels would be expected to increase by approximately 2 dBA. The noise levels measured at the Charlie Tayler Water Wheel in Idaho Springs illustrate the effect of congestion on noise levels. Chart 3 shows the measured levels, taken over a 24-hour period during a peak weekend. Noise levels rise from their nighttime lows between 7:00 AM and 8:00 AM as traffic volumes increase. The levels remain somewhat constant throughout the day, until about 4:00 PM, when they drop considerably due to the decrease in speed from traffic congestion.
The line labeled “Estimated 2035 No Build Noise Levels” on Chart 3 illustrates what could happen to the noise levels under the No Action Alternative over a representative 24-hour period. These are approximations, as traffic studies do not predict every hour of the day, but rather focus on peak-hour estimates. At night, during which time the I-70 highway has the capacity to absorb more traffic at free-flow speeds, noise levels would increase by 3 dB(A) if traffic were to double. During the daytime, where some additional capacity exists, noise levels would increase by about 1 to 2 dB(A). The length of time the highway would be congested would increase, as would the length of time of lower noise levels. The “loudest hour” noise level, which occurs just before the period of congestion, would not increase.
Overall, increases in noise levels under the No Action Alternative would be barely perceptible to most people, provided traffic volumes did not more than double at night. Predicted increases would be relatively small because no physical changes would be made to the highway, and there would be no change in the character of the sound.

Noise Technical Report
I-70 Mountain Corridor PEIS Technical Reports August 2010 Page 15
Minimal Action Alternative The buses in mixed traffic component was the only Minimal Action component analyzed for noise impacts (the impact of the Georgetown climbing lanes would be similar to that of the Highway alternatives). For the most part, the changes in noise levels under this alternative would be the same as those for the No Action Alternative. The only difference is that approximately 180 buses per hour would be added to the traffic stream during peak times. Standard diesel buses are approximately equivalent to a “semi” in terms of noise. This is predicted to result in an increase of 1 dB(A) in the “loudest hour” noise level over existing conditions. Again, because this alternative would add more of the same type of noise source that currently exists, and would involve no physical change to the existing highway, the projected noise level increases would likely be imperceptible to most people.
Chart 3. Representative Changes between Existing and No Action Noise Levels
50
55
60
65
70
75
80
12:00 AM 2:00 AM 4:00 AM 6:00 AM 8:00 AM 10:00 AM 12:00 PM 2:00 PM 4:00 PM 6:00 PM 8:00 PM 10:00 PM
Time of Day
Noi
se L
evel
(15-
min
ute
Leq
, dB
A) Existing Noise Levels
Estimated 2035 No Build Noise Levels
Source: Hankard Environmental, Inc., March 2001, January 2003, February 2004
Rail with Intermountain Connection Alternative Unlike the Bus in Guideway and Highway alternatives, which would involve adding more internal combustion rubber tire vehicles to the highway, the Rail with Intermountain Connection Alternative would introduce an entirely new and different noise source into the area. However, on a one-hour average basis, the trains would produce relatively little noise compared to the highway. For example, even when considering the greatest number of trains expected in the Corridor in any given hour (45), noise from trains would cause the overall level to increase by only about 3 dB(A).
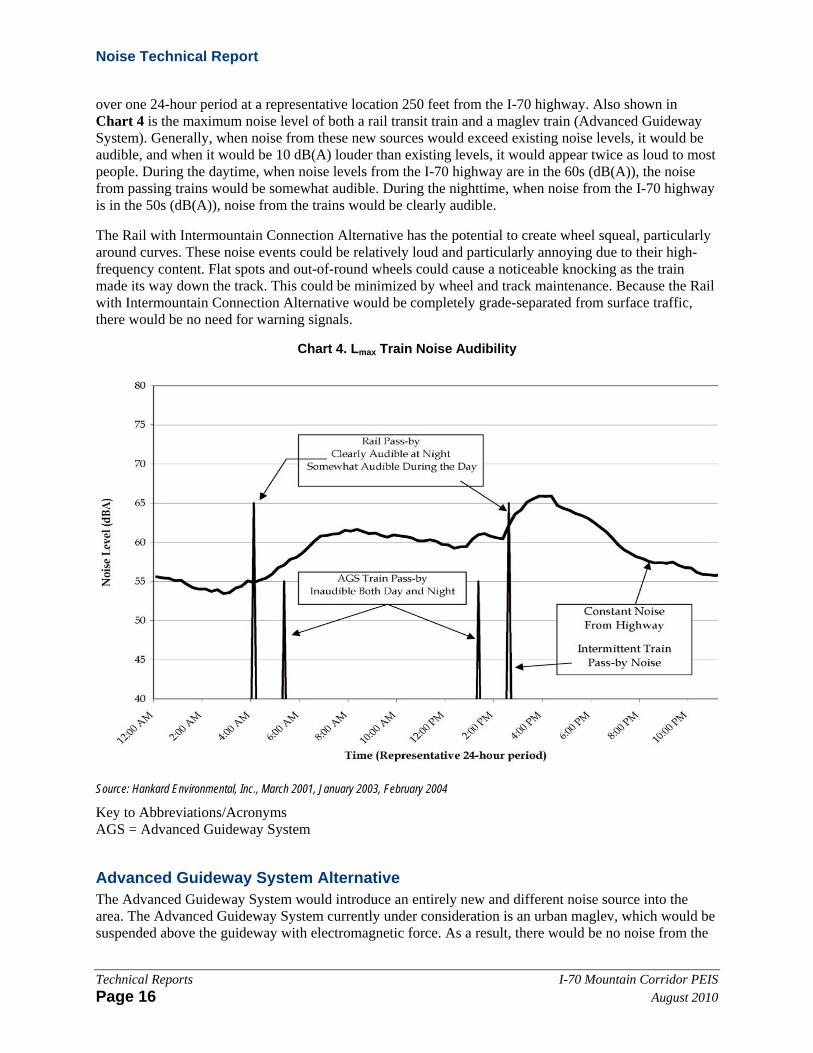
While average train noise levels are used to assess impact according to federal regulations, it is useful to understand the potential annoyance of maximum noise levels. Maximum noise levels would occur when a train was directly in front of a receiver, as well as when there was a squeal from the interaction of steel wheels and rails. The impact of these noise events would depend on their maximum noise level (Lmax), the time of day during which they would occur, and the number of times per day that they would occur. Chart 4 demonstrates the audibility of train noise Lmax levels and shows the existing highway noise level
Noise Technical Report
Technical Reports I-70 Mountain Corridor PEIS Page 16 August 2010
over one 24-hour period at a representative location 250 feet from the I-70 highway. Also shown in Chart 4 is the maximum noise level of both a rail transit train and a maglev train (Advanced Guideway System). Generally, when noise from these new sources would exceed existing noise levels, it would be audible, and when it would be 10 dB(A) louder than existing levels, it would appear twice as loud to most people. During the daytime, when noise levels from the I-70 highway are in the 60s (dB(A)), the noise from passing trains would be somewhat audible. During the nighttime, when noise from the I-70 highway is in the 50s (dB(A)), noise from the trains would be clearly audible.
The Rail with Intermountain Connection Alternative has the potential to create wheel squeal, particularly around curves. These noise events could be relatively loud and particularly annoying due to their high-frequency content. Flat spots and out-of-round wheels could cause a noticeable knocking as the train made its way down the track. This could be minimized by wheel and track maintenance. Because the Rail with Intermountain Connection Alternative would be completely grade-separated from surface traffic, there would be no need for warning signals.
Chart 4. Lmax Train Noise Audibility
Source: Hankard Environmental, Inc., March 2001, January 2003, February 2004
Key to Abbreviations/Acronyms AGS = Advanced Guideway System
Advanced Guideway System Alternative The Advanced Guideway System would introduce an entirely new and different noise source into the area. The Advanced Guideway System currently under consideration is an urban maglev, which would be suspended above the guideway with electromagnetic force. As a result, there would be no noise from the
Noise Technical Report
I-70 Mountain Corridor PEIS Technical Reports August 2010 Page 17
interaction of the train and the guideway. On a one-hour average basis, the Advanced Guideway System would produce relatively little noise compared to the highway. For example, even when considering the greatest number of trains expected in the Corridor in any given hour (45), noise from trains would cause overall noise levels to increase by less than 1 dB(A). As shown on Chart 4, the Advanced Guideway System would be generally inaudible at a distance of 250 feet. Because the Advanced Guideway System would also be completely grade-separated from surface traffic, no warning signals would be required.
Dual-Mode Bus in Guideway Alternative Under the Dual-Mode Bus in Guideway Alternative, buses would be propelled by electric motors while in the guideway. Electric buses have the advantage of no engine noise, but tire noise, gear noise, and cooling system noise are still present. Overall, this alternative is predicted to increase existing “loudest hour” noise levels by 2 dB(A). When operating outside the guideway, these buses would have noise characteristics similar to those of standard diesel buses.
Diesel Bus in Guideway Alternative Under the Diesel Bus in Guideway Alternative, diesel buses would operate in a guideway located in the median of the I-70 highway from Silverthorne to C-470. The operation of the buses would increase “loudest hour” noise levels by 2 dB(A) over existing conditions, and overall the changes would be similar to the buses in mixed traffic in the Minimal Action Alternative. When operating outside the guideway, these buses would have noise characteristics similar to those of standard diesel buses. Physical changes could be made to the existing highway to accommodate this alternative; the effects of which are discussed in Section 5.1.3 of this Technical Report.
Highway Alternatives The amount of noise produced by a highway depends on the volume, speed, and type of traffic traveling on it. Under the Six-Lane Highway (55 mph or 65 mph) and Reversible/High-Occupancy Vehicle (HOV)/ High-Occupancy Toll (HOT) Lanes alternatives, two additional lanes would be added on the I-70 highway. This would allow more traffic to travel at free-flow speed and would result in noise level increases of 2 dB(A) during peak times. Because there would be very little difference among the three Highway alternatives in terms of noise impacts, they are for the most part treated together as Highway alternatives. The difference among these alternatives would occur where the alignment of the Six-Lane Highway 65 mph differs from that of the other two. Section 5.1.4 of this Technical Report discusses these differences.
Aside from average traffic noise levels, there is the issue of the loud bursts of noise from the use of unmuffled compression brakes, which are engine compression brakes equipped on many large trucks. From Chart 2, maximum noise levels from individual truck pass-bys and from compression brake events are 5 to 10 dB(A) above average traffic noise levels.
Combination Alternatives Combination alternatives include three implementation scenarios:
Build Combination simultaneously Build Transit and preserve for highway Build Highway and preserve for transit
For Combination alternatives where Highway and Transit components would be built simultaneously, noise impacts are determined by totaling the Highway Alternative impacts and the Transit Alternative impacts.

Noise Technical Report
Technical Reports I-70 Mountain Corridor PEIS Page 18 August 2010
For Combination alternatives where Transit components would be built first, noise impacts would be the same as those under the Transit alternatives, until the point in time when the full combination was completed.
For Combination alternatives where Highway components would be built first, noise impacts would be the same as those under the Highway alternatives, until the time when the full combination was completed.
Preferred Alternative The Minimum Program of Improvements of the Preferred Alternative consists of the Advanced Guideway System and select highway improvements. As stated previously, the Advanced Guideway System would introduce an entirely new and different noise source into the area. The Advanced Guideway System currently under consideration is an urban maglev suspended above the guideway with electromagnetic force. As a result, the Advanced Guideway System would be relatively quiet, certainly quieter than four lanes of traffic on the I-70 highway during the “loudest hour” of the day. Of the seven areas studied, the only one that would be in the vicinity of highway improvements would be Dowd Canyon. There, under the 55 mph option, two lanes would be added to the I-70 highway and noise levels are predicted to increase by approximately 4 dB as a result. Under the 65 mph option, the I-70 highway would travel in a new tunnel behind the residences and the noise level would decrease as a result.
The Maximum Program of Improvements of the Preferred Alternative at 55 mph would be the same as the Combination Six-Lane Highway with Advanced Guideway System Alternative. The 65 mph design speed alternative would differ little in most areas with respect to noise. Noise impacts would be a total of the Highway Alternative impacts and the Transit Alternative impacts.
5.1.2 Summary of Source Noise Level Changes Without Regard to Location or Topography
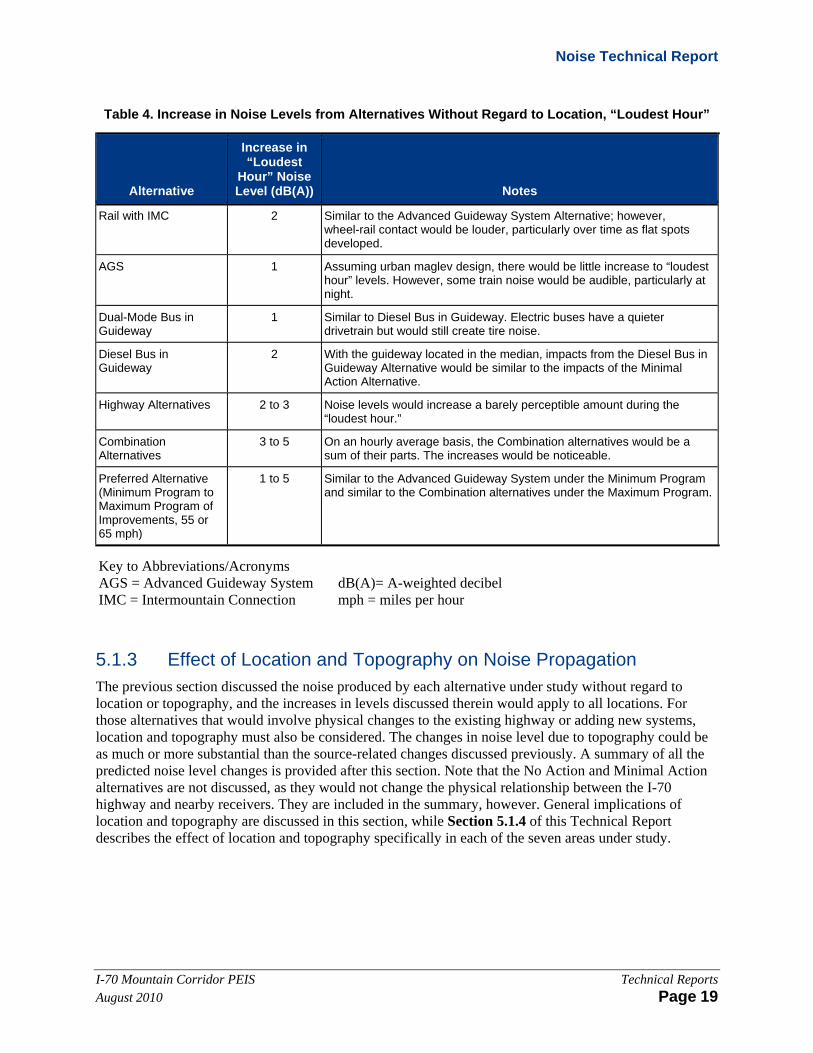
Table 4 summarizes the increases in noise levels expected from each alternative without consideration of location within the Corridor or surrounding topography. These levels refer to the “loudest hour,” which for Transit alternatives would be the hour of the day when the most trips are planned. For Highway alternatives, it would be the hour of the day when the highway was at the highest capacity that still allowed traffic to move at a free-flow speed. These increases would occur at all locations, without respect to topography. Additional increases specific to certain locations would also be possible, as discussed in Section 5.1.3 of this Technical Report.
Table 4. Increase in Noise Levels from Alternatives Without Regard to Location, “Loudest Hour”
Alternative
Increase in “Loudest
Hour” Noise Level (dB(A)) Notes
Existing N/A Existing levels generally range from the mid-50s to the mid-60s (dB(A)) at a distance 250 feet from the center of the I-70 highway.
No Action ~ 1 The changes in noise levels under the No Action Alternative would depend on growth in travel demand and the capacity of the highway to carry traffic at free-flow speeds.
Minimal Action ~ 1 Because the Minimal Action Alternative entails adding a small number of buses relative to the existing traffic volume and involves no physical alterations, its implementation would be barely noticeable.
Noise Technical Report
I-70 Mountain Corridor PEIS Technical Reports August 2010 Page 19
Table 4. Increase in Noise Levels from Alternatives Without Regard to Location, “Loudest Hour”
Alternative
Increase in “Loudest
Hour” Noise Level (dB(A)) Notes
Rail with IMC 2 Similar to the Advanced Guideway System Alternative; however, wheel-rail contact would be louder, particularly over time as flat spots developed.
AGS 1 Assuming urban maglev design, there would be little increase to “loudest hour” levels. However, some train noise would be audible, particularly at night.
Dual-Mode Bus in Guideway
1 Similar to Diesel Bus in Guideway. Electric buses have a quieter drivetrain but would still create tire noise.
Diesel Bus in Guideway
2 With the guideway located in the median, impacts from the Diesel Bus in Guideway Alternative would be similar to the impacts of the Minimal Action Alternative.
Highway Alternatives 2 to 3 Noise levels would increase a barely perceptible amount during the “loudest hour.”
Combination Alternatives
3 to 5 On an hourly average basis, the Combination alternatives would be a sum of their parts. The increases would be noticeable.
Preferred Alternative (Minimum Program to Maximum Program of Improvements, 55 or 65 mph)
1 to 5 Similar to the Advanced Guideway System under the Minimum Program and similar to the Combination alternatives under the Maximum Program.
Key to Abbreviations/Acronyms AGS = Advanced Guideway System dB(A)= A-weighted decibel IMC = Intermountain Connection mph = miles per hour
5.1.3 Effect of Location and Topography on Noise Propagation The previous section discussed the noise produced by each alternative under study without regard to location or topography, and the increases in levels discussed therein would apply to all locations. For those alternatives that would involve physical changes to the existing highway or adding new systems, location and topography must also be considered. The changes in noise level due to topography could be as much or more substantial than the source-related changes discussed previously. A summary of all the predicted noise level changes is provided after this section. Note that the No Action and Minimal Action alternatives are not discussed, as they would not change the physical relationship between the I-70 highway and nearby receivers. They are included in the summary, however. General implications of location and topography are discussed in this section, while Section 5.1.4 of this Technical Report describes the effect of location and topography specifically in each of the seven areas under study.
Noise Technical Report
Technical Reports I-70 Mountain Corridor PEIS Page 20 August 2010
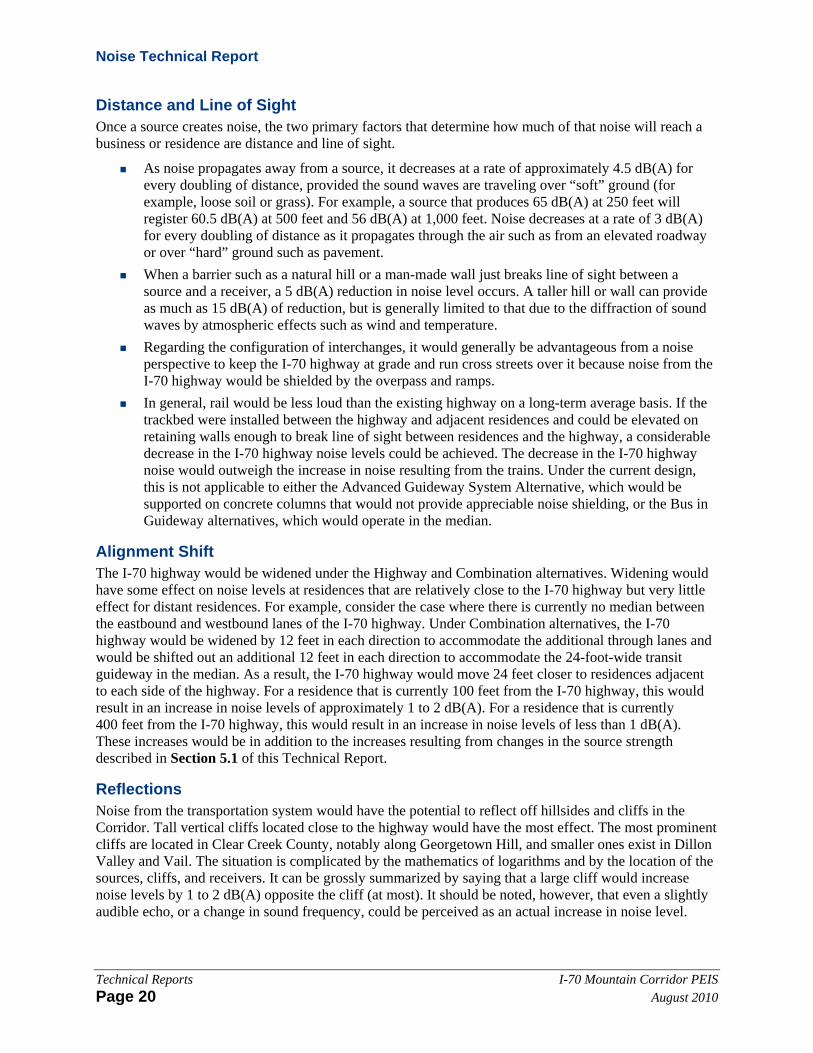
Distance and Line of Sight Once a source creates noise, the two primary factors that determine how much of that noise will reach a business or residence are distance and line of sight.
As noise propagates away from a source, it decreases at a rate of approximately 4.5 dB(A) for every doubling of distance, provided the sound waves are traveling over “soft” ground (for example, loose soil or grass). For example, a source that produces 65 dB(A) at 250 feet will register 60.5 dB(A) at 500 feet and 56 dB(A) at 1,000 feet. Noise decreases at a rate of 3 dB(A) for every doubling of distance as it propagates through the air such as from an elevated roadway or over “hard” ground such as pavement.
When a barrier such as a natural hill or a man-made wall just breaks line of sight between a source and a receiver, a 5 dB(A) reduction in noise level occurs. A taller hill or wall can provide as much as 15 dB(A) of reduction, but is generally limited to that due to the diffraction of sound waves by atmospheric effects such as wind and temperature.
Regarding the configuration of interchanges, it would generally be advantageous from a noise perspective to keep the I-70 highway at grade and run cross streets over it because noise from the I-70 highway would be shielded by the overpass and ramps.
In general, rail would be less loud than the existing highway on a long-term average basis. If the trackbed were installed between the highway and adjacent residences and could be elevated on retaining walls enough to break line of sight between residences and the highway, a considerable decrease in the I-70 highway noise levels could be achieved. The decrease in the I-70 highway noise would outweigh the increase in noise resulting from the trains. Under the current design, this is not applicable to either the Advanced Guideway System Alternative, which would be supported on concrete columns that would not provide appreciable noise shielding, or the Bus in Guideway alternatives, which would operate in the median.
Alignment Shift The I-70 highway would be widened under the Highway and Combination alternatives. Widening would have some effect on noise levels at residences that are relatively close to the I-70 highway but very little effect for distant residences. For example, consider the case where there is currently no median between the eastbound and westbound lanes of the I-70 highway. Under Combination alternatives, the I-70 highway would be widened by 12 feet in each direction to accommodate the additional through lanes and would be shifted out an additional 12 feet in each direction to accommodate the 24-foot-wide transit guideway in the median. As a result, the I-70 highway would move 24 feet closer to residences adjacent to each side of the highway. For a residence that is currently 100 feet from the I-70 highway, this would result in an increase in noise levels of approximately 1 to 2 dB(A). For a residence that is currently 400 feet from the I-70 highway, this would result in an increase in noise levels of less than 1 dB(A). These increases would be in addition to the increases resulting from changes in the source strength described in Section 5.1 of this Technical Report.
Reflections Noise from the transportation system would have the potential to reflect off hillsides and cliffs in the Corridor. Tall vertical cliffs located close to the highway would have the most effect. The most prominent cliffs are located in Clear Creek County, notably along Georgetown Hill, and smaller ones exist in Dillon Valley and Vail. The situation is complicated by the mathematics of logarithms and by the location of the sources, cliffs, and receivers. It can be grossly summarized by saying that a large cliff would increase noise levels by 1 to 2 dB(A) opposite the cliff (at most). It should be noted, however, that even a slightly audible echo, or a change in sound frequency, could be perceived as an actual increase in noise level.

Noise Technical Report
I-70 Mountain Corridor PEIS Technical Reports August 2010 Page 21
Noise from Engine Braking The grade of the I-70 highway in much of the Corridor is steep, and engine braking is common. Currently, more than 70 percent of trucks are equipped with an engine brake, and more than 80 percent of the trucks being produced have them (Colorado Motor Carriers, 2004). When engaged, the brake uses pressure from the truck’s engine to slow the vehicle. Because the engine brake does not have a separate exhaust, the noise created by the braking system is vented though the truck’s standard muffler. Engine brakes are considered a key safety component, particularly in the Corridor.
The Environmental Protection Agency limits the noise level of trucks manufactured after 1986 to 87 dB(A) at a distance of 50 feet while traveling down the road. This limit applies to all of the noise made by a traveling truck, including the engine brake. Measurements conducted in Vail in August revealed that a tractor-trailer with a functioning muffler registered about 85 dB(A) with the engine brake on. The sound of the engine brake was indistinguishable. A similar truck with the muffler disconnected registered almost 100 dB(A) with the engine brake on, and the brake was distinctly noticeable. Given this, the key to reducing the noise from engine brake use is the inspection of and maintenance of standard mufflers on all large trucks.
The Action Alternatives would not appreciably change engine brake use. It is possible that engine brake use would increase under the No Action Alternative because congestion would be more prevalent, and congestion causes braking.
Wind and Other Weather Conditions Atmospheric conditions have a substantial effect on the propagation of noise from the alternatives. Most notable is wind direction. During “downwind conditions,” which occur when the wind is blowing from a source toward a receiver and is greater in speed at the earth’s surface than aloft, noise levels can increase as sound waves that have otherwise propagated into the air are bent back toward the ground. Conversely, during upwind conditions noise levels can be reduced by 20 dB(A) or more. Crosswinds have less effect. Noise levels can also increase somewhat during temperature inversions, when the air aloft is warmer than that at the surface. These occur regularly in Colorado, particularly at night. The noise level predictions made on this project represent “typical” sound propagation conditions.
5.1.4 Terrain-Specific Issues in Analyzed Areas Dowd Canyon On the west end of the Dowd Canyon study area, there is a large condominium development (Kayak Crossing et al.). Currently, the I-70 highway passes within approximately 600 feet of these residences but is shielded by a large landform. “Loudest hour” noise levels here were measured at approximately 60 dB(A) in 2001. See Table 5 for predicted “loudest hour” noise level from 250 feet from the center line of the I-70 highway. The Rail with Intermountain Connection Alternative, which would follow the existing Union Pacific Railroad (UPRR) line in this area, would pass as close as 100 feet to this development. This is predicted to create hourly average noise levels of approximately 64 dB(A), including both Rail with Intermountain Connection and Highway alternatives. The Advanced Guideway System would travel along the median of the I-70 highway in this area and would be mostly inaudible over existing highway noise levels. The Bus in Guideway alternatives would result in noise levels of approximately 63 dB(A), an increase of 3 dB(A) over existing conditions, or 1 dB(A) over the No Action Alternative.
Under the Highway alternatives, the I-70 highway would be either widened in its existing alignment (with minor shifts to account for curve safety modification) or routed through a new tunnel. If widened in its current alignment, noise levels would increase only as a result of the source increases discussed previously. The proposed tunnel would daylight approximately 1,000 feet west of the condominium

Noise Technical Report
Technical Reports I-70 Mountain Corridor PEIS Page 22 August 2010
complex and around the corner of a large hillside. Highway noise levels would be reduced by at least 5 to 10 dB(A) as a result.
At the east end of the Dowd Canyon study area, there is a residential development along the north side of the I-70 highway (Creekside Condominiums). In this area, the Rail with Intermountain Connection, Advanced Guideway System, and Bus in Guideway alternatives would follow the I-70 highway median, and only the increases in source noise levels discussed previously would result. Under the Six-Lane Highway 65 mph Alternative, the I-70 highway would veer away (to the north) from its current alignment and travel into a tunnel. This would provide a substantial noise decrease (5 to 10 dB(A)) for the residents there, which would outweigh any increase in noise levels created by the tunnel portal (1 to 2 dB(A) within 200 feet of the portal). Overall, noise levels under the Six-Lane Highway 65 mph Alternative at the residences in this area are predicted to be below 66 dB(A). This will need to be verified during Tier 2 processes.
Vail The Town of Vail is located in a relatively broad valley, as shown in Figure 7 through Figure 9. Noise levels were measured in 2001 at the locations shown in the figures (all 250 feet from the center of the I-70 highway) and ranged from 63 to 67 dB(A). The I-70 highway is situated slightly higher up the north slope of the valley, as depicted in the typical cross section shown in Figure 1. In general, the cross section shows that noise would propagate similarly from both sides of the highway in Vail. Levels would drop off at a rate of 4.5 dB(A) per doubling of distance. Additional decrease in noise with distance would result from shielding by buildings (approximately 3 dB(A) per row of buildings). Development to the south would be generally lower in elevation than the highway, and development to the north would be generally higher in elevation. As a result, barriers placed along the highway would generally be more effective on the south side of the I-70 highway, as line of sight from residences to the highway would be effectively blocked. Barriers placed on the north side of the I-70 highway would be less effective in many locations, particularly for those receivers located higher up on the slope. Figure 1 shows typical barrier noise reductions.
Another issue related to mitigation is the frontage roads that are prevalent in Vail. A wall placed along the I-70 highway could effectively block noise from the highway, but it would not reduce frontage traffic noise (in some cases, it could reflect frontage road noise). It is typically infeasible to locate a wall on the development side of the frontage road due to access and sight line requirements.
Because of the relatively gentle slope of the valley hillsides and the lack of rock cliffs close to the highway/rail alignment, valley wall reflection would not likely be substantial in Vail in terms of actual noise level increases. However, as noted previously, even a small audible echo could be perceived as an actual, substantial increase in noise level.

Noise Technical Report
I-70 Mountain Corridor PEIS Technical Reports August 2010 Page 23
Figure 1. Vail Cross Section, Westbound View
Key to Abbreviations/Acronyms AGS = Advanced Guideway System
The Rail with Intermountain Connection Alternative would run at grade along the median of the I-70 highway. Therefore, terrain would affect the propagation of noise from the rail system in the same way it does currently for the highway. As a result, there would be no terrain-specific increases in average noise levels among the alternatives, only the source noise changes discussed previously. The Lmax levels discussed in Section 5.1.1 of this Technical Report would be lower in some locations due to shielding from buildings. The Advanced Guideway System would run on a 16-foot-tall structure located in the median of the I-70 highway. As a result, the view of this system would be greater. However, noise levels from the urban maglev trains would be low relative to the I-70 highway traffic.
Figure 2 through Figure 4 show the location of the 66 dB(A) noise level contour for both existing and 2035 “loudest hour” conditions. The existing conditions contour is based on a total traffic volume of 2,388 vehicles per hour, with 5 percent medium and 5 percent heavy trucks, and a free-flow speed of 65 mph. The future condition predicts the total volume of 3,555 vehicles per hour at a free-flow speed of 65 mph. Although there would be no highway improvements in this area, noise from the highway is predicted to increase by 2 dB(A), which would move the existing 66 dB(A) contour out another 100 feet. Note that this noise increase would be the result of additional traffic under the No Action Alternative. Vail has some existing capacity to increase volume even with the current two lanes. Adding the Rail with Intermountain Connection Alternative would increase the predicted 2035 noise level by an additional 1 dB(A). Adding the Advanced Guideway System Alternative would not increase “loudest hour” noise levels at all. The Bus in Guideway alternatives would increase the predicted 2035 noise level by 3 dB(A) over existing conditions, or 1 dB(A) over the No Action Alternative.
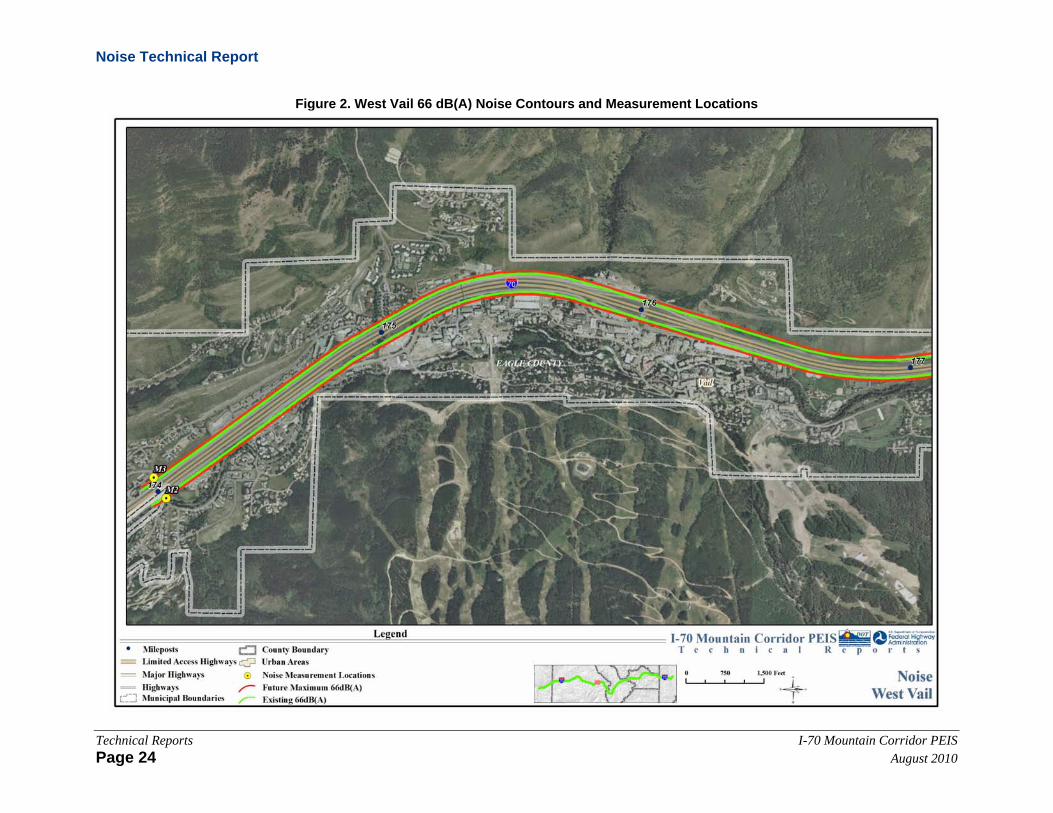
Noise Technical Report
Technical Reports I-70 Mountain Corridor PEIS Page 24 August 2010
Figure 2. West Vail 66 dB(A) Noise Contours and Measurement Locations

Noise Technical Report
I-70 Mountain Corridor PEIS Technical Reports August 2010 Page 25
Figure 3. Central Vail 66 dB(A) Noise Contours and Measurement Locations
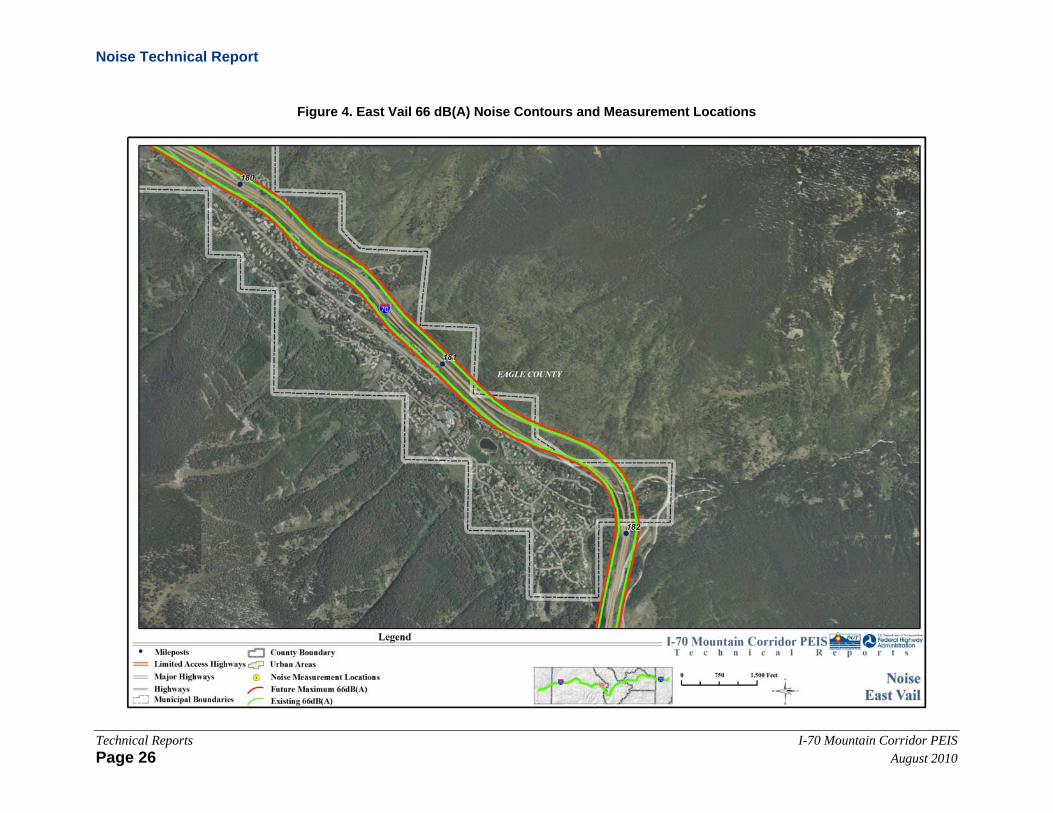
Noise Technical Report
Technical Reports I-70 Mountain Corridor PEIS Page 26 August 2010
Figure 4. East Vail 66 dB(A) Noise Contours and Measurement Locations

Noise Technical Report
I-70 Mountain Corridor PEIS Technical Reports August 2010 Page 27
Dillon Valley As shown in Figure 5, aside from the Ptarmigan Ranch on the north side of the I-70 highway, all of the residences in this area are located to the south. At the east end of the residential development, the highway is located on a bench and is elevated above the residences by as much as 50 feet. Toward the west end of the residential area, the highway becomes level with the homes. Noise levels were measured in 2001 at the locations shown in Figure 5 and the levels range from 61 to 69 dB(A). In 2003 the Colorado Department of Transportation completed the construction of earthen berms and an 8- to 12-foot-tall noise wall along this entire area. As a result, noise levels are predicted to decrease by at least 5 dB(A) at the homes closest to the I-70 highway. Figure 6 shows a representative cross section of the Dillon Valley area, as well as the typical noise reductions that are expected from the wall/berm. Figure 2 also shows the existing noise levels with the wall/berm in place.
The increases in average source noise levels discussed in Section 5.1.1 of this Technical Report would be largely unaffected by topography in Dillon Valley. The reason is that the Rail with Intermountain Connection and Bus in Guideway alternatives would be located at grade in the median, and even though the elevated Advanced Guideway System would be visible over the noise wall, it would not affect average noise levels appreciably. The Lmax levels discussed previously for the rail system would be approximately 5 dB(A) lower due to the noise wall. The wall would not affect Advanced Guideway System Lmax levels. Some reflection of transportation noise could occur in Dillon Valley near the west side of the developed area, as there is a large rock cliff on the north side of the I-70 highway in that area.

Noise Technical Report
Technical Reports I-70 Mountain Corridor PEIS Page 28 August 2010
Figure 5. Dillon 66 dB(A) Noise Contours and Measurement Locations

Noise Technical Report
I-70 Mountain Corridor PEIS Technical Reports August 2010 Page 29
Figure 6. Dillon Valley Cross Section, Eastbound View
Key to Abbreviations/Acronyms AGS = Advanced Guideway System
Silver Plume As shown in Figure 7, most residences in Silver Plume are on the north side of the I-70 highway. As shown in the typical cross section in Figure 8, the houses adjacent to the highway are generally lower in elevation than the road. The land rises to the north, such that the residences further from the I-70 highway are either at grade with or above the highway. The north wall of the valley in this area is relatively steep and may reflect highway noise in some areas. The slope of the south wall of the valley is gentler and does not likely reflect any substantial amounts of noise. In 1994, the Colorado Department of Transportation constructed a 1,200-foot-long noise wall along portions of the north side of the I-70 highway in Silver Plume. This wall provides 5 to 10 dB(A) of reduction, based on field observations and its similarity to other walls with known performance.
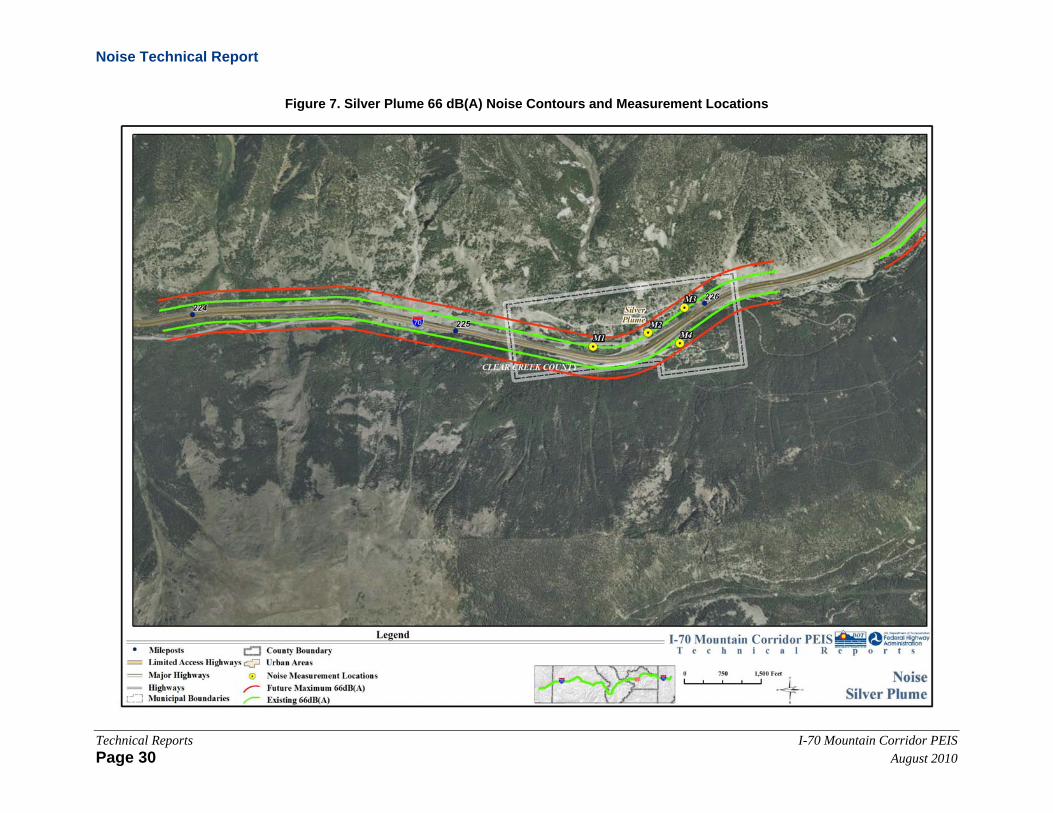
Noise Technical Report
Technical Reports I-70 Mountain Corridor PEIS Page 30 August 2010
Figure 7. Silver Plume 66 dB(A) Noise Contours and Measurement Locations

Noise Technical Report
I-70 Mountain Corridor PEIS Technical Reports August 2010 Page 31
Figure 8. Silver Plume Cross Section, Eastbound View
Key to Abbreviations/Acronyms AGS = Advanced Guideway System
The Rail with Intermountain Connection Alternative would travel over the I-70 highway at the east end of town and along the north side of the I-70 highway through town. One method to reduce noise in Silver Plume would be to keep the trackbed elevated on a retaining wall to shield the I-70 highway noise. This could result in a 5 to 10 dB(A) decrease in highway noise levels. The Advanced Guideway System would follow the same path, but would not act as a shield because it would be supported on columns. The Bus in Guideway alternatives would be placed in the median of the I-70 highway, which would require a shifting of the highway closer to residents. This would result in an increase in noise levels of approximately 1 dB(A). An increase of 2 dB(A) would occur under the Highway alternatives, as the I-70 highway would be widened to accommodate the additional lane. Figure 7 shows the 66 dB(A) noise level contours for Silver Plume. They are approximate, as they would be greatly affected by the placement and elevation of the different transportation modes.
Georgetown As shown in Figure 9, the I-70 highway in the Georgetown area is oriented north-south. In the northern portion of Georgetown, residential development is fairly level in elevation with the I-70 highway. On the southern end of town, the I-70 highway climbs a steep grade and travels along a bench high above town. There is a relatively tall (approximately 6 feet) solid concrete safety barrier along the edge of the eastbound lanes in this area. As illustrated in Figure 10, the edge of the bench and the safety barrier act together to reduce noise levels at the foot of the bench. This is reflected in the measured noise levels shown in Table 3. Measurements at M1 and M2 were taken at the same time, and both at a distance of 250 feet from the highway. However, the levels at M1 (located below the bench) are 16 dB(A) less than those at M2 (which has a clear view of the highway). Predictions indicate that existing noise levels will reach the upper 50s (dB(A)) further from the bench before they start to decrease with distance. Also, the wall of the valley along the north side of the I-70 highway consists of a steep rocky cliff that reflects traffic noise and may increase noise levels by approximately 1 dB(A) in Georgetown.

Noise Technical Report
Technical Reports I-70 Mountain Corridor PEIS Page 32 August 2010
Figure 9. Georgetown 66 dB(A) Noise Contours and Measurement Locations

Noise Technical Report
I-70 Mountain Corridor PEIS Technical Reports August 2010 Page 33
The Rail with Intermountain Connection and Advanced Guideway System alternatives would run along the eastbound side of the I-70 highway. As a result, the edge of the bench and safety barrier would not reduce noise levels from these sources, and they would increase noise levels to a greater degree than in areas where both the highway and Rail/Advanced Guideway System would be directly visible. As a result, the Advanced Guideway System would increase noise levels by 3 dB(A) (versus the 1 dB(A) increase, as shown in Table 4 without regard to location). Rail would increase noise levels by 4 dB(A) (versus the 2 dB(A) increase, as shown in Table 4 without regard to location). However, with the Rail with Intermountain Connection Alternative, overall average noise levels would increase by approximately 4 dB(A), more than the 1 to 2 dB(A) increase, as shown in Table 4 without regard to location). Because the Bus in Guideway alternatives would operate in the median, the edge of the bench and safety barrier would decrease bus noise in the same manner as it does highway noise. The only source noise increase that would occur for the Bus in Guideway alternatives are discussed in Section 5.1.1 of this Technical Report.
Figure 10. Georgetown Cross Section View, Eastbound View
Key to Abbreviations/Acronyms AGS = Advanced Guideway System
Lawson, Downieville, and Dumont The portion of Lawson situated along Alvarado Road is located below the elevation of the I-70 highway and is shielded from some traffic noise by the edge of the highway. The area along Silver Lakes Drive has a direct view of the highway. Some residences are located just east of the Downieville exit, on the north side of the I-70 highway. These residences are shielded by noise somewhat from the edge of the highway that is elevated near the interchange. There are homes on both sides of the highway in Dumont, as shown in the representative cross section in Figure 11. On the north side, the homes are shielded somewhat, as the highway is in a cut. The homes on the south side of the I-70 highway have a clear view of the highway and are elevated somewhat.

Noise Technical Report
Technical Reports I-70 Mountain Corridor PEIS Page 34 August 2010
Figure 11. Dumont Cross Section View, Eastbound View
Key to Abbreviations/Acronyms AGS = Advanced Guideway System
Idaho Springs Idaho Springs is located in a relatively steep-walled valley. Most of the residential and commercial development is located on the north side of the highway, although there are homes to the south. A number of topographical features in Idaho Springs affect noise levels, including the elevation of the highway with respect to residences and businesses, the proximity of steep rock cliffs, and the fact that portions of the proposed expanded highway alignment would be placed on an elevated structure. Figure 12 shows a plan view of Idaho Springs. Because of the complexity of the situation, the analysis was broken into the four areas discussed below. The effect of elevated lanes is discussed first and then the changes in noise levels in each area.
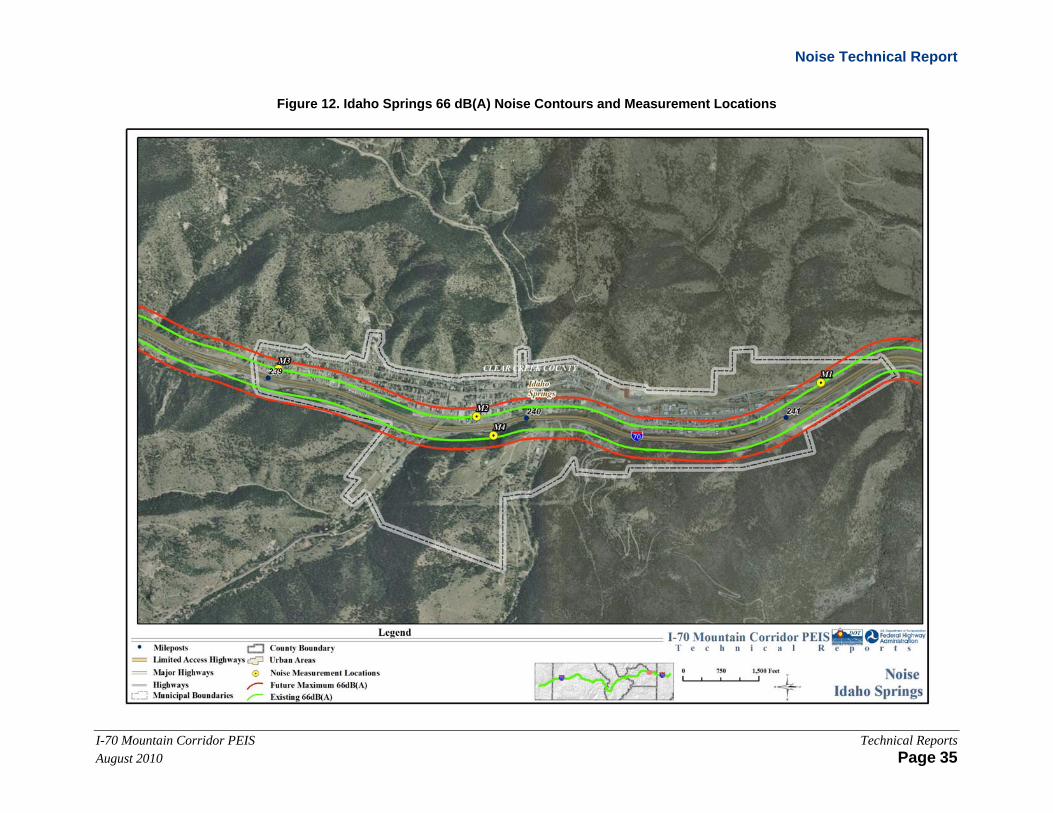
Noise Technical Report
I-70 Mountain Corridor PEIS Technical Reports August 2010 Page 35
Figure 12. Idaho Springs 66 dB(A) Noise Contours and Measurement Locations

Noise Technical Report
Technical Reports I-70 Mountain Corridor PEIS Page 36 August 2010
Elevated Highway Lanes The proposed structures in Idaho Springs would have three implications to noise:
1. Noise from traffic next to and under the structures would reflect off the sides and undersides of the structures,
2. The traffic on the structure would be either more or less visible at area residences, depending on location, and
3. The acoustic ground effect would be lost for traffic on the structure.
The magnitude of each of these effects would be location dependent, as discussed below. Note that the increases discussed here are additive to those discussed previously that are due to any changes in capacity or the addition of transit.
Reflections – The physics of how sound bounces around under the structure and reflect back toward town is complex. In general, though, reflections never add more than about 2 dB(A).
Visibility – Noise acts similar to light in that if one can see a highway better, one can hear it better (louder). The changes in visibility of the highway or transit facility due to placing it on a structure could either increase or decrease noise levels at adjacent properties. It could decrease noise levels at those residences located at the toe of the slope of the section of the I-70 highway in Idaho Springs that is up on a bench. Standing at this vantage point, one would not be able to see the traffic on the structured lane very well because the edge of the structure, with its 3-foot tall solid safety barrier, would block the view. Noise levels would increase by as much as 5 to 10 dB(A) at those locations in town where the view of I-70 is currently blocked by some building or terrain feature, but the view of the elevated facility would be clear.
Ground Effect – When it travels along “soft” ground, such as grass, noise energy is lost due to interactions of the sound wave with the ground. Noise from the elevated portion of the highway would travel toward town through the air, not along the ground. Thus, the “ground effect” would be lost, which would cause a small (perhaps 2 dB(A)) increase in noise levels for receivers located between 200 to 300 feet of the highway. No substantial change due to this is expected within 100 feet or beyond 300 feet from the highway.
Area 1 on the East End of Town – At the far east end of Idaho Springs, the highway is currently level with homes located across the river. The Rail with Intermountain Connection and Advanced Guideway System alternatives would run on the south side of the highway near here and would have minimal impact on residences. The Bus in Guideway, Highway, and Combination alternatives would all require widening of the highway and elevating the eastbound lanes. Widening would add about 1 dB(A), and the elevated lanes would increase noise levels another 1 to 2 dB(A) due to the airborne travel of the noise. These increases would be in addition to the source increases discussed in Section 5.1.1 of this Technical Report.
Area 2 near the Safeway – Traveling west, the highway rises and travels along a bench, with the highest point near the Safeway grocery store. Figure 13 illustrates a cross section of the terrain in this area. The northern edge of the highway acts as a barrier to noise, such that levels at the toe of the highway embankment could in some cases be lower than those further out (where the edge of the highway does not act as a barrier). Elevating the eastbound lanes would not affect the situation appreciably in this area because the edge of the elevated structure would also act as a barrier.
Area 3 near Downtown – Near the downtown area, the highway is coming off the bench to the east, travels directly adjacent to downtown, and climbs again to the west. As a result, a large portion of the highway is visible from downtown. A wall adjacent to downtown would not substantially reduce noise levels because
Noise levels decrease at a rate of approximately 4.5 dB(A) for every doubling of distance when sound propagates from an at-grade source over “soft” ground (for example, loose soil or grass). Noise decreases at a rate of 3 dB(A) for every doubling of distance when sound propagates through the air from an elevated source or over “hard” ground such as pavement.

Noise Technical Report
I-70 Mountain Corridor PEIS Technical Reports August 2010 Page 37
portions of the highway would be visible over the wall to the east and west where it would climb in elevation. Exacerbating this situation would be the presence of large cliffs on the south side of the highway, which have the potential to reflect some noise back toward the downtown area. Structured lanes would increase the visibility. Therefore, the audibility of I-70 would increase from certain locations in town where line of sight is currently blocked by a building or by terrain but would not be with the elevated highway. A wall placed along the elevated roadway would be effective.
Area 4 on the West End of Town – The highway climbs again to the west and is above adjacent residences in some stretches. In general, the ground slopes upward to the north such that residences and businesses further from the highway are higher than those closer to it. There is an existing noise wall on the west end of town between mileposts 239 and 240. The wooden wall is 1,168 feet long and approximately 15 feet tall. The Rail with Intermountain Connection Alternative would benefit from this wall, while the Advanced Guideway System Alternative would not. The wall would not reduce noise from the elevated eastbound lanes, resulting in an additional increase of approximately 5 dB(A) unless a wall was constructed along the elevated lanes as well.
Figure 13. Idaho Springs Cross Section, Eastbound View
Key to Abbreviations/Acronyms AGS = Advanced Guideway System
5.1.5 Summary of Predicted Noise Levels Table 5 provides predicted noise levels by alternative for the seven Corridor locations mapped and discussed in this section. Noise impacts of the Six-Lane Highway and Reversible HOV/HOT Lanes alternatives were not analyzed in Vail or Dillon Valley because the alternatives would not include improvements in those locations. Note that a maximum increase of up to 5 dB(A) is predicted for any alternative.
In general, the Advanced Guideway System Alternative is predicted to generate noise at a similar level to the No Action Alternative, with the Rail with Intermountain Connection Alternative somewhat higher. The Highway alternatives would result in a greater increase in “loudest hour” noise levels than the Rail with Intermountain Connection or Advanced Guideway System alternatives. The Combination alternatives would result in the greatest increases in “loudest hour” noise levels.

Noise Technical Report
Technical Reports I-70 Mountain Corridor PEIS Page 38 August 2010
The location of the 66 dB(A) noise level contour for both existing and future conditions are shown in Figures 2, 3, 4, 5, 7, 9, and 12. The future condition shown is that of the loudest alternatives (Combination alternatives). All of the area between the highway and the contours has a predicted noise level that equals or exceeds CDOT’s 66 dB(A) noise abatement criteria for residential land use. The figures also show the noise measurement locations (M1 through M4).
Table 5. Predicted Noise Levels
Area (West to East) Alternative
Representative Existing “Loudest Hour” Noise Level
250 feet from Center of I-70
(dB(A))1
2035 “Loudest Hour” Noise
Level 250 Feet from Center of
I-70 (dB(A)) Comments
Dowd Canyon No Action 60 62 Assumes transit on existing railroad line Minimal Action 62
Rail with IMC 64
AGS 62
Dual-Mode Bus in Guideway 63
Diesel Bus in Guideway 63
6-Lane Highway (55 mph) and Reversible/HOV/HOT Lanes 64
6-Lane Highway (65 mph) Decrease2
Combination 6-Lane Highway with Rail and IMC 65
Combination 6-Lane Highway with AGS 64
Combination 6-Lane Highway with Bus in Guideway 64
Preferred Alternative – 55 mph (Minimum Program to Maximum Program) 64
Preferred Alternative – 65 mph (Minimum Program to Maximum Program) Decrease2
Vail No Action 65 67 Assumes transit in median
Minimal Action 67
Rail with IMC 68
AGS 67
Dual-Mode Bus in Guideway 68
Diesel Bus in Guideway 68
Combination 6-Lane Highway with Rail and IMC 68
Combination 6-Lane Highway with AGS 67
Combination 6-Lane Highway with Bus in Guideway 67
Preferred Alternative (55 and 65 mph, Minimum Program to Maximum Program) 67
Dillon Valley (Assumes construction of noise wall.)
No Action 59 59 All alternatives would be behind the existing noise wall
Minimal Action 59
Rail with IMC 60
AGS 60
Dual-Mode Bus in Guideway 60
Diesel Bus in Guideway 61
Combination 6-Lane Highway with Rail and IMC 60

Noise Technical Report
I-70 Mountain Corridor PEIS Technical Reports August 2010 Page 39
Table 5. Predicted Noise Levels
Area (West to East) Alternative
Representative Existing “Loudest Hour” Noise Level
250 feet from Center of I-70
(dB(A))1
2035 “Loudest Hour” Noise
Level 250 Feet from Center of
I-70 (dB(A)) Comments Combination 6-Lane Highway with AGS 60
Combination 6-Lane Highway with Bus in Guideway 60
Preferred Alternative (55 and 65 mph, Minimum Program to Maximum Program) 60
Silver Plume No Action 57 57 Assumes existing noise wall remains or is rebuilt Minimal Action 57
Rail with IMC 58
AGS 58
Dual-Mode Bus in Guideway 58
Diesel Bus in Guideway 58
Highway Alternatives 59
Combination 6-Lane Highway with Rail and IMC 61
Combination 6-Lane Highway with AGS 61
Combination 6-Lane Highway with Bus in Guideway 61
Preferred Alternative (55 and 65 mph, Minimum Program to Maximum Program) 58 - 61
Georgetown No Action 53 53 Location analyzed is 350 feet from center of I-70, near the Loop Railroad depot in Georgetown
Minimal Action 57
Rail with IMC 57
AGS 56
Dual-Mode Bus in Guideway 54
Diesel Bus in Guideway 54
Highway Alternatives 55
Combination 6-Lane Highway with Rail and IMC 57
Combination 6-Lane Highway with AGS 57
Combination 6-Lane Highway with Bus in Guideway 57
Preferred Alternative (55 and 65 mph, Minimum Program to Maximum Program) 56 - 57
Lawson, Downieville, and Dumont
No Action 65 65 Assumes transit in median
Minimal Action 67
Rail with IMC 66
AGS 65
Dual-Mode Bus in Guideway 66
Diesel Bus in Guideway 66
Highway Alternatives 67
Combination 6-Lane Highway with Rail and IMC 68
Combination 6-Lane Highway with AGS 68

Noise Technical Report
Technical Reports I-70 Mountain Corridor PEIS Page 40 August 2010
Table 5. Predicted Noise Levels
Area (West to East) Alternative
Representative Existing “Loudest Hour” Noise Level
250 feet from Center of I-70
(dB(A))1
2035 “Loudest Hour” Noise
Level 250 Feet from Center of
I-70 (dB(A)) Comments Combination 6-Lane Highway with Bus in Guideway 68
Preferred Alternative (55 and 65 mph, Minimum Program to Maximum Program) 65 - 68
Idaho Springs No Action 65 65 Assumes structured elements Minimal Action 65
Rail with IMC 66
AGS 65
Dual-Mode Bus in Guideway 69
Diesel Bus in Guideway 69
Highway Alternatives 70
Combination 6-Lane Highway with Rail and IMC 70
Combination 6-Lane Highway with AGS 70
Combination 6-Lane Highway with Bus in Guideway 70
Preferred Alternative (55 and 65 mph, Minimum Program to Maximum Program) 65 - 70
Notes: 1 Values modeled for year 2000 using year 2000 data for the purpose of providing an appropriate comparison point. 2 Noise levels would decrease. The amount of reduction would depend on what became of the abandoned section of I-70.
Key to Abbreviations/Acronyms AGS = Advanced Guideway System dB(A)= A-weighted decibel HOT = High-Occupancy Toll HOV = High-Occupancy Vehicle IMC = Intermountain Connection
5.1.6 Potential to Exceed CDOT Guidelines As stated previously, CDOT guidelines state that noise mitigation must be considered for any receiver or group of receivers where predicted traffic noise levels (using future traffic volumes and roadway conditions) equal or exceed 66 dB(A) for residences (see Table 2), and where design year levels are projected to be 10 dB(A) or more above existing levels. In general, the latter would not be the case.
The 66 dB(A) contours show that the residences adjacent to I-70 in most towns would be affected by the loudest alternatives (generally the Combination alternatives) and would require some sort of mitigation analysis (see Figures 2, 3, 4, 5, 7, 9, and 12). While it is not feasible to show the differences in the contours for each alternative at this Tier 1 level, it is likely that the number of affected residences would follow the pattern of the predicted levels shown in Table 5. That is to say, the Advanced Guideway System Alternative is similar to the No Action Alternative and would affect the fewest residences, followed by the Rail with Intermountain Connection Alternative. The Highway alternatives would affect a higher number of residences than Rail. The Combination alternatives would result in the greatest number of residences requiring mitigation analysis.

Noise Technical Report
I-70 Mountain Corridor PEIS Technical Reports August 2010 Page 41
5.2 Indirect Impacts One potential indirect noise impact on this project would be traffic traveling to transit stations. The main roads that feed the transit stations would see an increase in traffic volume. Noise levels would increase 3 dB(A) for every doubling of traffic volume, provided there was no congestion.
A second potential indirect noise impact would be that related to induced growth. Additional growth in the area would result in more background noise, including traffic on local streets, building construction, and people going about daily activities such as mowing the lawn. On a long-term average basis, noise levels would increase by 3 dB(A) for every doubling of the population. Higher shorter-term increases would result, such as those that exist in the vicinity of where a new home was being constructed.
5.3 Construction Noise Construction of the action alternatives would generate noise from diesel-powered earthmoving equipment, (for example, dump trucks and bulldozers, backup alarms on certain equipment, compressors, or pile drivers). There is the potential for impact because this equipment needs to operate in proximity to residences and businesses. Also, given the magnitude and complexities of the proposed action alternatives, nighttime work would likely be required, and work would be ongoing for months to years. Construction noise at offsite receptor locations usually depends on the loudest one or two pieces of equipment operating nearby. Noise levels from diesel-powered equipment range from 80 to 95 dB(A) at a distance of 50 feet. Impact equipment such as rock drills and pile drivers could generate louder noise levels.
Construction noise is subject to local ordinances. Most of the towns in the Corridor have only “nuisance” codes in place and do not specifically address construction noise. One exception is Vail, where construction noise is limited to 90 dB(A) between 7:00 AM and 7:00 PM.
Construction activities could produce considerable vibration levels, particularly pile driving, blasting, and drilling. Although the FTA regulations were not used to analyze noise impacts for this analysis, the FTA impact assessment procedures provide limits for both damage and annoyance from vibration that must be followed during construction.
5.4 Impacts in 2050 Loudest-hour noise levels from highway and transit facilities in 2050 would likely be nearly the same as those in 2035. Interstate 70 is the loudest noise source in the Corridor and would reach capacity in most areas under all alternatives by 2035. Any additional traffic demand would increase congestion, which would decrease rather than increase noise levels. In areas with additional peak-hour capacity in 2035, the extra capacity and the corresponding traffic increases would be so small, associated loudest-hour noise level increases would be imperceptible. Maximum noise levels from intermittent noise such as compression brakes would not increase between 2035 and 2050. Changes in auto technology could result in quieter-operating vehicles between 2035 and 2050, which could reduce noise levels (however, such changes would likely be small).
Regarding transit service, if bus or train service operated more frequently, noise levels would increase. On a long-term average basis, service frequency would need to double before noise level increases would become perceptible, and such high service increases are unlikely. Also, the maximum noise level created by passing trains would not get any louder. However, the number of noise “events” caused by passing trains would increase correspondingly with service increases.

Noise Technical Report
Technical Reports I-70 Mountain Corridor PEIS Page 42 August 2010
Section 6. Tier 2 Considerations Tier 2 processes will include a more robust analysis of potential noise impacts and mitigation based on the configuration of proposed highway improvements, associated traffic projections, and refined field noise measurements taken at potentially affected receptor locations. Noise studies will be conducted in accordance with required regulations; that is, following CDOT noise impact assessment methodology for highway improvements, and FTA noise impact assessment methods for rail improvements. Some stakeholders suggest that travel patterns and noise conditions in the Corridor are more variable than typical highways and, therefore, are not represented accurately by CDOT and FHWA noise policies. Lead agencies must follow statewide and national noise guidance but acknowledge that noise is an important issue to be evaluated further in Tier 2. Information about noise studies, methodologies, and modeling results will be included in any public involvement efforts associated with Tier 2 processes.
Colorado Department of Transportation noise policies suggest that a quantitative analysis of construction noise be considered for large, complex projects. This is the case here, and the lead agencies should conduct such an analysis as part of any future Tier 2 environmental processes. The lead agencies should also analyze transportation- and construction-generated vibration as part of Tier 2 environmental processes.
The lead agencies will develop specific and more detailed mitigation strategies and measures, and develop best management practices specific to each project, during Tier 2 processes. The lead agencies will also adhere to any new laws and regulations that may be in place when Tier 2 processes are underway, including new regulations regarding noise abatement criteria expected to go into effect in July 2011.
Section 7. Mitigation Strategies to Reduce Highway Noise Levels
The lead agencies do not propose any specific mitigation strategies at this time but will consider the range of mitigation options discussed below in Tier 2 processes to reduce highway noise for impacted communities. A brief description of each mitigation option to be considered is provided below, along with information as to its applicability to the I-70 Mountain Corridor. The following mitigation measures are considered general noise abatement techniques.
Table 6 provides examples of site-specific treatments at community locations, their anticipated effectiveness, and possible concerns associated with their implementation. It should be noted that while these site-specific treatment scenarios indicate what the mitigation effectiveness could be, these mitigation scenarios are not being proposed at this time. These measures will be considered where applicable in future based upon final analyses prepared during Tier 2 processes. Noise mitigation measures will be evaluated during Tier 2 processes for properties that meet the impact criteria under the appropriate regulations (FHWA/FTA) based on the future proposed alternatives.
7.1 Noise Walls 7.1.1 Strategy Noise walls are the most commonly employed form of noise mitigation. They reduce noise by blocking the line of sight between a source and a receiver, thereby forcing the sound waves to diffract over the top of the wall. Noise walls are typically placed along the shoulder of the roadway and can be placed on structures (such as bridges and elevated roadways), if necessary. In certain circumstances, they can be placed outside the I-70 right-of-way. This is appropriate for residences on a hill, where a wall along the roadway does not break line of sight. The cost-benefit of walls is taken into account by calculating the “cost per benefited receiver per dB(A) of reduction.” In terms of benefit, a 5 dB(A) reduction is required. Otherwise, the wall is only minimally effective.

Noise Technical Report
I-70 Mountain Corridor PEIS Technical Reports August 2010 Page 43
The most cost-effective way to increase the performance of a noise wall is to increase its height. However, height may be limited by aesthetics or weight (for walls on structure), or shading of icy roadways. Absorptive treatments to reduce noise barrier reflections back into unprotected areas could enhance their effectiveness, as could irregular wall top patterns or curved or branched elements on the wall top.
7.1.2 Noise Reduction When residences are level with the highway, a 15-foot-tall wall will provide approximately 5 to 10 dB(A) of noise reduction. This will be a noticeable reduction, but the highway is audible. This will apply only to residences located within 100 to 200 feet of the wall. Residences further back, or those located on a hill overlooking the highway, will experience less noise reduction.
7.2 Noise Berms 7.2.1 Strategy Noise berms are typically preferred over walls for aesthetic reasons, particularly in the mountain environment. The main issue with berms is space, as they require a footprint that is about six times their height (that is, a 15-foot-tall berm requires a footprint of 90 feet). This sort of land often does not exist in developed areas. Over the past few years, CDOT has constructed earthen berms along parts of the Corridor.
7.2.2 Noise Reduction Noise berms will provide equal or better reduction than a noise wall of the same height. Also, they will reflect very little noise to the other side of the road; noise reflection could be an issue with walls.
7.3 Small Concrete Barriers (“Jersey Barriers”) 7.3.1 Strategy The 3-foot-tall solid concrete barriers that currently separate the eastbound and westbound lanes of I-70 in many locations will form the guideway for the Bus in Guideway alternatives and will separate the Rail with Intermountain Connection Alternative from the highway, thus providing some noise reduction.
7.3.2 Noise Reduction A 3 to 5 dB(A) reduction in tire noise could be achieved for residences that are located (1) within 200 feet of the highway, and (2) below the elevation of I-70 by at least 5 to 10 feet. These barriers will provide very little, if any, reduction for residences located beyond 200 feet from the highway or those elevated above it.
7.4 Acquisition of Property to Form Buffer Zone Generally, this mitigation measure is a viable alternative only for undeveloped lands where noise impact prevention is the goal. This will be difficult to implement on this project because I-70 is generally located in narrow valleys that are already at least partially developed.
7.5 Alteration of Horizontal Alignment To provide a perceptible noise reduction (at least 3 dB(A)) at a given receiver, the distance that currently exists between the receiver and the highway will need to be doubled. This is not a viable mitigation option in the Corridor, given the land constraints. Also, in many cases this action will only shift impact on receivers on the opposite side of the highway, and it will be extremely costly.

Noise Technical Report
Technical Reports I-70 Mountain Corridor PEIS Page 44 August 2010
7.6 Alteration of Vertical Alignment Changing the vertical alignment of I-70, that is, lowering its elevation by depressing it into the ground, could provide a considerable noise reduction at roadside receivers. This option is not feasible in many areas along the Corridor due to drainage and floodplain issues that prohibit construction. It is feasible in other areas in terms of constructibility, but the costs are substantial. The idea of depressing I-70 into the ground and covering it with a structure (called “cut and cover”) has been discussed in Vail, as the land it would create for development could help offset the cost.
7.7 Engine Compression Brakes The use of unmuffled engine compression brakes by large trucks is an annoyance issue in the Corridor. Noise walls are minimally effective in reducing this noise, as it is generated at the mouth of the exhaust stack that is located as much as 10 feet off the surface of the road. Compression brake noise is effectively reduced if the truck is equipped with a working muffler. Enforcement of muffler use is the most direct noise mitigation measure. Existing state law imposes a $500 fine for commercial vehicles that have no muffler.
7.8 Noise Insulation of Buildings The insulation or soundproofing of buildings typically involves the installation of double-pane windows that are specially designed to provide a high degree of noise attenuation. Colorado Department of Transportation guidelines state that noise insulation be applied only to public or nonprofit buildings (for example, schools and churches) unless there is a severe impact (absolute noise levels of 75 dB(A) or an increase of 30 dB(A) over existing levels), and other exterior noise mitigation measures are as cost-effective.
7.9 Pavement Type Different pavements exhibit different levels of noise for a given traffic flow. Current research indicates that specialty more porous asphalt and quiet concrete compositions can be less noisy than denser, conventional pavements. How durable the quieter pavement types are and how long, in terms of years, this noise reduction benefit lasts are unclear. Currently FHWA does not acknowledge use of quieter pavements for mitigation of noise impacts. However, although not technically a mitigation measure, the restriction of known rigid, or loud, surface pavement types can prevent exasperating noise conditions along a sensitive corridor. Pavement types should be carefully evaluated for their noise properties and safety compatibility prior to final pavement selection.
7.10 Active Noise Control Active noise control is a method of canceling noise with noise that is out of phase with the undesired noise. Noise from the source of interest is measured with a microphone, and speakers then broadcast the measured noise after it has been digitally processed to be 180 degrees out of phase with the incoming noise. This technology has been applied with some success to noise inside aircraft and in industrial settings to fans, compressors, and generators. The technology is best suited for narrow bandwidth, low frequency sounds, and it not currently advanced enough to be applied to highways.

Noise Technical Report
I-70 Mountain Corridor PEIS Technical Reports August 2010 Page 45
Table 6. Possible Mitigation Examples and Potential Effectiveness
Area Alternative Example
Mitigation Likely Effectiveness Concerns With Mitigation
Dowd Canyon Rail with IMC Wall along rail line 10 dB(A) of reduction at ground level condos
Visual
6-Lane Highway 55 mph Reversible/HOV/HOT Lanes
Enhance existing landform
Additional 3 dB(A) of reduction None identified
6-Lane Highway 65 mph Relocation of highway
5 to 15 dB(A) of reduction Visual
Vail Combination 6-Lane Highway with Rail and IMC
Wall along highway 10 dB(A) to south where houses are lower in elevation; 0 to 5 dB(A) at residences to the north
Effectiveness, reflection of noise to opposite side of highway, aesthetics, blocking of views, icing
Dillon Valley All Wall-berm combination
5 to 10 dB(A) Wall-berm is in place
Silver Plume Rail with IMC Use of rail bed as barrier Wall
5 to 10 dB(A) Visual
Bus in Guideway Alternatives Highway Alternatives
Wall along highway 5 to 10 dB(A) Reflection of noise to opposite side of highway, aesthetics
Georgetown (“flats” area)
All Berm on south side of highway
3 to 5 dB(A) Residents somewhat distant from highway
Lawson, Downieville, Dumont
Rail with IMC Lawson: Wall along south side of highway Downieville: Wall along rail alignment in front of town Dumont: Wall along north side of rail alignment
Lawson: Very effective due to houses being close to highway and lower in elevation Downieville: Ineffective, as highway would need to be mitigated too Dumont: Would effectively block both rail and highway noise, as I-70 is in a cut
Lawson: Icing on I-70 Downieville: Cost and complexity of walls near interchange versus benefit Dumont: Reflection of noise to residences on south side of highway
Idaho Springs Rail with IMC Wall along north side of highway
5 to 10 dB(A) in east and west parts of town; 0 to 5 dB(A) in central part of town and residents to north that are higher in elevation
Effectiveness, aesthetics, icing, reflection of noise to opposite side of highway
Bus in Guideway Alternatives Wall along north side of highway and elevated roadway
5 to 10 dB(A) in east and west parts of town; 0 to 5 dB(A) in central part of town and residents to north that are higher in elevation
Effectiveness, aesthetics, icing, reflection of noise to opposite side of highway
Highway Alternatives Wall along north side of highway and elevated roadway
5 to 10 dB(A) in east and west parts of town; 0 to 5 dB(A) in central part of town and residents to north that are higher in elevation
Effectiveness, aesthetics, icing, reflection of noise to opposite side of highway
Notes: At this time, mitigation was not discussed for the Advanced Guideway System Alternative. If this alternative is advanced for future Tier 2 processes, it will be evaluated in greater detail. The reductions provided for noise walls are approximate and apply only to residences located within 300 feet of the highway/rail line. Little to no reduction is provided at residences located 500 feet or more from the highway/rail line or for those located higher in elevation.
Key to Abbreviations/Acronyms dB(A)= A-weighted decibel HOT = High-Occupancy Toll HOV = High-Occupancy Vehicle IMC = Intermountain Connection

Noise Technical Report
Technical Reports I-70 Mountain Corridor PEIS Page 46 August 2010
The lead agencies will follow I-70 Mountain Corridor Context Sensitive Solutions Aesthetic Guidelines and consider landscaping and vegetated berms for noise mitigation during design. The Colorado Department of Transportation will work with local planning agencies to minimize noise effects on planned development in the Corridor.
Generally, the most practical noise mitigation strategy to avoid or reduce direct effects in the Corridor includes the construction of noise barriers. In some areas, topography may reduce the effectiveness of noise barriers—for example, when receivers sit higher than the road—and Tier 2 processes will conduct project-specific noise analyses to determine where noise barriers would be effective mitigation. Other strategies to mitigate noise impacts, such as land acquisition for buffer zones and altering the horizontal and vertical alignment, are effective but may be less practical in the Corridor because of topographic and development constraints.
Construction noise impacts could be mitigated as follows:
Limiting work to certain hours of the day where possible Requiring the use of well-maintained equipment (particularly with respect to mufflers) Modifying backup alarm systems within acceptable safety guidelines Locating haul roads Providing public outreach
Section 8. References Air Sciences Inc., Hankard Environmental Inc., and Felzburg, Holt, and Ullevig. 1999. Summary of CDOT
Noise Barrier Statistics and TxDOT Survey, CDOT Project No. C SWOO-135. April.
Colorado Department of Transportation (CDOT). 2002. CDOT Noise Analysis and Abatement Guidelines. December 1.
Colorado Motor Carriers. 2004. URL: www.cmca.com
Federal Highway Aministration. 1980. Fundamentals and Abatement of Highway Traffic Noise. September
Federal Transit Administration (FTA). 2006. Report FTA-VA-90-1003-06, Transit Noise and Vibration Impact Assessment. May.
Hankard Environmental Inc. 2001. Dillon Valley Noise Wall Project Draft Noise Technical Report. March.
—. 2001. Eagle-Vail Half-Diamond Project Noise Technical Report, CDOT Project IM 0702-228. June.
Hankard Environmental Inc. 2003.Colorado Department of Transportation. 2001. Hogback Parking Facility Environmental Assessment.
—. 2003. Highway Noise Analysis.
—. 2004. Eagle Airport Interchange Project EA Noise Technical Report, CDOT Project IM 0703-244. February.
—. 2005. Evaluation of Highway Noise Mitigation Alternatives for Vail Colorado Final Noise Technical Report. October.