Noise assessment report
29
Proposed Hydropower Archimedean Screw Osney Lock and Weir, Oxford Noise Impact Assessment TECHNICAL REPORT
Transcript of Noise assessment report
Proposed Hydropower Archimedean Screw
Osney Lock and Weir, Oxford
Noise Impact Assessment
TECHNICAL REPORT

Hydropower Archimedean Screw
Noise Impact Assessment
Prepared for: The Low Carbon Hub, 23 Park End Street, Oxford OX1 1HU
Site address: Osney Lock and Weir, Oxford
Table of Contents 1 INTRODUCTION ............................................................................................................................... 1
2 DEVELOPMENT SITE ........................................................................................................................ 2
3 NOISE CRITERIA ............................................................................................................................... 3
NATIONAL PLANNING POLICY FRAMEWORK ...................................................................................... 3
BS4142:1997 RATING INDUSTRIAL NOISE IN MIXED RESIDENTIAL AND INDUSTRIAL AREAS ............ 3
WORLD HEALTH ORGANISATION – GUIDELINES FOR COMMUNITY NOISE ........................................ 4
4 ENVIRONMENTAL NOISE STUDY ..................................................................................................... 6
ASSESSMENT OF BACKGROUND NOISE LEVELS .................................................................................. 7
5 SOURCE NOISE STUDY ..................................................................................................................... 9
PREDICTION OF NOISE FROM MECHANICAL PLANT (NOISE MODELLING) ....................................... 11
6 NOISE ASSESSMENT ...................................................................................................................... 15
7 CONCLUSIONS ............................................................................................................................... 17
Appendix A: Glossary of Acoustic Terms .............................................................................................. I
Appendix B: Noise Measurement Locations ...................................................................................... III
Appendix C: Scheme Design ............................................................................................................... VI
Appendix D: Noise Survey Summary ................................................................................................. VII

PO Box 755, Capel St Mary, Ipswich, Suffolk IP9 2WF Tel No: 0845 5212 096 Fax No: 0845 5212 097
[email protected] www.soundsolutionconsultants.co.uk
VAT No. 844 9267 90 Registration No. 5651834 Registered Address: 57 Thorney Road, Capel St. Mary, Ipswich IP9 2XH
SSC PROJECT NO: 14024
STATUS SIGNATURE / NAME / POSITION DATE
ORIGINATED Steve Skingle BSc. (Hons) MAES MIOA
Senior Acoustic Consultant
28th September 2012 Revision R1
APPROVED Mark Page MIOA
Managing Director
28th September 2012 Revision R1
DOC REFERENCE 14024 R1

Sound Solution Consultants Limited Doc ref: 14024 R1 28/09/2012
1 INTRODUCTION
1 INTRODUCTION
1.1 Sound Solution Consultants Limited were commissioned to undertake a noise assessment of a proposed renewable energy development at Osney Lock and Weir; to establish the noise impact of mechanical plant proposals on those in the vicinity of the development.
1.2 A noise survey has been requested to supplement a prospective planning application for hydropower development at Osney Lock and Weir. Consultation with the Environmental Health Department of Oxford City Council has highlighted that the prospect of planning permission being granted is dependent on the applicant addressing impact on neighbours. One issue that requires assessment includes the impact of noise on surrounding noise sensitive locations.
1.3 The objective of this study is to quantify the acoustic environment in the vicinity of the existing site by carrying out a noise assessment using the methodology outlined in BS4142:1997. Further guidance is to be advised considering the World Health Organisation Guidance for Community Noise.
Sound Solution Consultants Limited Doc ref: 14024 R1 28/09/2012
2 DEVELOPMENT SITE
2 DEVELOPMENT SITE
2.1 The development site is a triangular shaped island bound by the River Thames to the north and Osney Weir Pool to the south; as shown in the block plan in Appendix B. The proposal is to locate a hydropower scheme in the south west corner of the site, to utilise the flow of water across the existing lock and generate a sustainable source of electricity for the local community.
2.2 The scheme incorporates an Archimedean screw positioned across the fall of the lock, along with a fish pass and main building containing a generator. The development only operates where there is sufficient flow over the lock as to turn the screw and generator; which is rated to produce up to 30kW of electrical power.
2.3 The noise sensitive locations of Bridge Street lie west of the mechanical plant proposals and with line-of-site to the development. The nearest residence of No. 47 Bridge Street is nominally 22m from the proposed building and mechanical plant locations. South of the development site lies the Boat House, nominally 30m from the development, containing commercial premises. Adjacent to this property is the residential dwelling of the Lock House.
2.4 The following tasks have been undertaken as part of this noise assessment:
Survey of noise levels about the application site, representing the ambient noise climate of properties closest to the proposed development.
Measurement of noise levels of a similar Archimedean screw, representing the noise level of the development proposal.
Calculation of noise levels from the proposed scheme at the nearest noise sensitive locations using specific noise data from a similar scheme and noise modelling.
Assessment of the background noise level with regard to the proposed development against the guidance provided by BS4142:1997 – Rating industrial noise affecting mixed residential and industrial areas.
2.5 A glossary of acoustic terms is shown in Appendix A.

Sound Solution Consultants Limited Doc ref: 14024 R1 28/09/2012
3 NOISE CRITERIA
3 NOISE CRITERIA NATIONAL PLANNING POLICY FRAMEWORK
3.1 The National Planning Policy Framework (NPPF) sets out the Government’s planning policies for England and how these are expected to be applied. It provides a framework where local Councils can produce their own local and neighbourhood plans, which reflect the needs of their communities.
3.2 In conserving and enhancing the natural environment, the planning system should prevent both new and existing development from contributing to, or being put at, unacceptable risk from environmental factors including noise.
3.3 Planning policies and decisions should aim to avoid noise giving rise to significant adverse impacts on health and quality of life as a result of new development. Conditions may be used to mitigate and reduce noise to a minimum so that adverse impacts on health and quality of life are minimised. Reference is made within NPPF to the Noise Policy Statement for England (NPSE) as published by DEFRA in March 2010.
3.4 Consultation with Oxford City Council planning department has highlighted an absence of specific sustainable development standards and supplementary planning guidance with respect to industrial environmental noise and protection of residential amenity. Suitable noise guidance is taken from BS4142:1997 Rating Industrial Noise in Mixed Residential and Industrial Areas and the World Health Organisation – Guidance for Community Noise.
BS4142:1997 RATING INDUSTRIAL NOISE IN MIXED RESIDENTIAL AND INDUSTRIAL AREAS
3.5 The most relevant criteria to assess the impact of industrial noise levels on residential dwellings are contained within BS4142:1997 – Rating industrial noise affecting mixed residential and industrial areas. This British Standard describes a method of determining the level of a noise of an industrial nature, together with procedures for assessing whether the noise in question is likely to give rise to complaints from persons living in the vicinity.
3.6 The likelihood of complaint in response to a noise depends on factors including the margin by which it exceeds the background noise level, its absolute level, time of day, change in the noise environment, as well as local attitudes to the premises and the nature of the neighbourhood. BS4142:1997 is only concerned with the rating of a noise of an industrial nature, based on the margin by which it exceeds a background noise level with an appropriate allowance for the acoustic features present in the noise. As this margin increases, so does the likelihood of complaint.
3.7 Certain acoustic features can increase the likelihood of complaint over that expected from a simple comparison between the specific noise level and the background noise level. Where present as part of the assessment, such features are taken into account by adding 5 dB to the specific noise level to obtain the rating level:

Sound Solution Consultants Limited Doc ref: 14024 R1 28/09/2012
4 NOISE CRITERIA
The noise contains a distinguishable, discrete, continuous note (whine, hiss, screech, hum, etc.);
The noise contains distinct impulses (bangs, clicks, clatters, or thumps);
The noise is irregular enough to attract attention.
3.8 The rating level is equal to the specific noise level if there are no such features present or expected to be present.
3.9 To assess the likelihood of complaints using BS4142:1997 the measured background noise level is subtracted from the rating level. The greater this difference the greater the likelihood of complaints, such as:
A difference of around +10 dB or more indicates that complaints are likely.
A difference of around + 5 dB is of marginal significance.
If the rating level is more than 10 dB below the measured background noise level then this is a positive indication that complaints are unlikely.
3.10 BS4142:1997 states that:
‘The likelihood that an individual will complain depends on individual attitudes and perceptions in addition to the noise levels and acoustic features present. This standard makes no recommendations in respect of the extent to which individual attitudes and perceptions should be taken into account in any particular case.’
WORLD HEALTH ORGANISATION – GUIDELINES FOR COMMUNITY NOISE
3.11 The scope of WHO Guidelines for Community Noise was to consolidate scientific knowledge on the health impacts of community noise, to provide guidance to environmental health authorities and professionals trying to protect people from the harmful effects of noise in non-industrial environments. The health risk to human from exposure to environmental noise was evaluated and guidelines derived.
3.12 The WHO presents a measure to assess adverse health effects from steady-state ‘anonymous’ noises such as traffic. There are no specific health guidelines for the influence of noises with specific character (i.e. tonality or intermittency), or with respect to specific sources of noise; such as industrial sources.
3.13 Internal design levels within the WHO guidelines are recommended in line with those mentioned in BS8233:1999:
‘The effects of noise in dwellings, typically, are sleep disturbance, annoyance and speech interference. For bedrooms the critical effect is sleep disturbance. Indoor guideline values for bedrooms are 30 dB LAeq for continuous noise.... At night-time, outside sound levels about 1 metre from facades of living spaces should not exceed 45 dB LAeq, so that people may sleep with

Sound Solution Consultants Limited Doc ref: 14024 R1 28/09/2012
5 NOISE CRITERIA
bedroom windows open. This value was obtained by assuming that the noise reduction from outside to inside with the window open is 15 dB. To enable casual conversation indoors during daytime, the sound level of interfering noise should not exceed 35 dB LAeq.’
3.14 In addition to the above:
‘The capacity of a noise to induce annoyance depends upon its physical characteristics, including the sound pressure level, spectral characteristics and variations of these properties with time. During daytime, few people are highly annoyed at LAeq levels below 55 dB(A), and few are moderately annoyed at LAeq levels below 50 dB(A). Sound levels during the evening and night should be 5–10 dB lower than during the day.’

Sound Solution Consultants Limited Doc ref: 14024 R1 28/09/2012
6 ENVIRONMENTAL NOISE STUDY
4 ENVIRONMENTAL NOISE STUDY
4.1 An environmental noise survey was undertaken over a weekday period from Tuesday 24th July to Thursday 26th July 2012, to sample existing background noise levels during different times of the day in accordance with BS4142:1997 and BS7445-1:1993.
4.2 The equipment used during the survey consisted of the following Type 1 and Class 1 precision noise monitoring equipment listed below. All equipment listed has traceable calibration history to relevant British Standards, valid in accordance with BS4142.
Manufacturer Model
No. Description Serial No. Calibration Date
Larson Davis 824 3rd Octave Band Sound Level Meter 2897 03/12
Larson Davis 902 Microphone pre-amplifier 1837 03/12
Larson Davis 2541 ½” Condenser microphone 7778 03/12
Larson Davis LxT Octave Band Sound Level Meter 2680 12/10
Larson Davis PRMLXT1 Microphone pre-amplifier 15591 12/10
Larson Davis 377B02 ½” Electret microphone 122141 12/10
Larson Davis CAL200 Sound Level Calibrator 7544 04/12
Table 1 – Noise monitoring equipment.
4.3 The main sources of noise at the background measurement location consisted of water flow noise from Osney Lock and Weir, along with intermittent community noises in and around the measurement locations.
4.4 Ambient noise measurements were taken at a height of 1.5m from the ground in free-field conditions away from objects that would adversely affect the data measured; in accordance with the guidance contained within BS4142:1997 and BS7445-1:2003.
4.5 A brief description of the measurement positions are detailed below and shown on the annotated drawing and photographs in Appendix B:
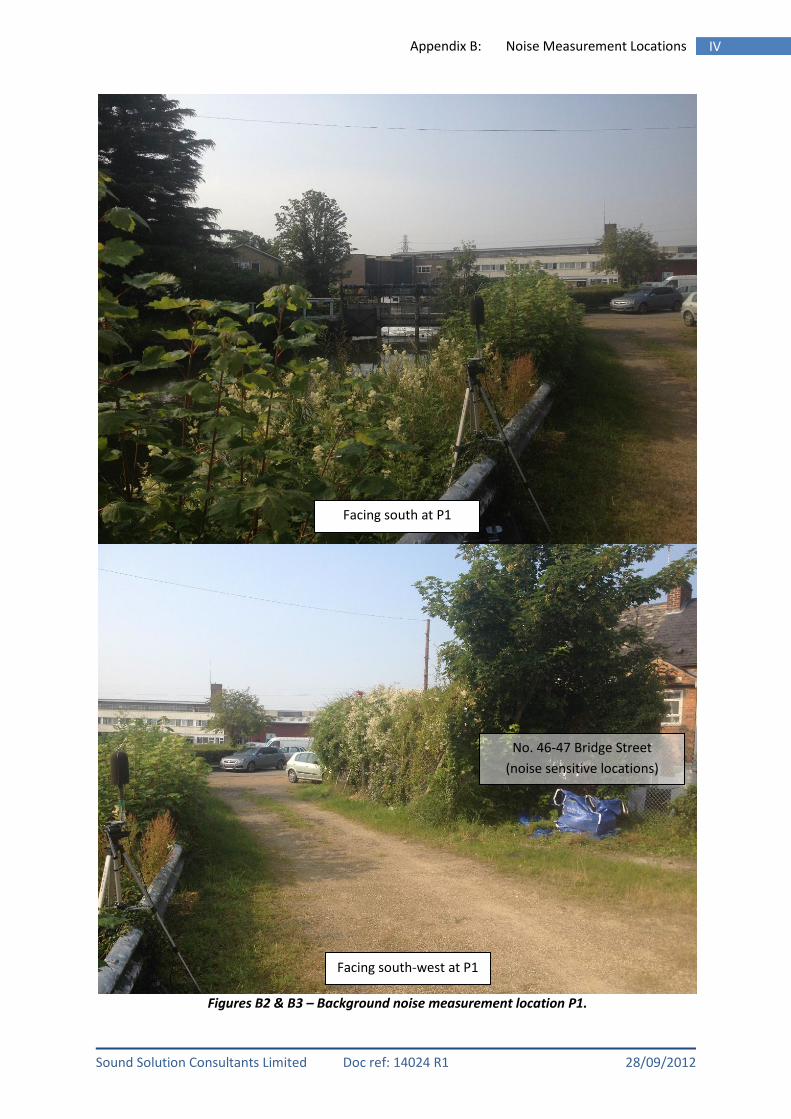
Position 1) North of the development site, on the bank of the river and in line with the rear of No. 46 Bridge Street. Noise measurements at this location were judged to be the same as those experienced at the nearest noise sensitive location of No. 47 Bridge Street, being equidistant from Osney Lock.
Position 2) South of the development site at the west end of a handrail on the bank of the river. This noise measurement location was at least 3.5m from the Boat House with clear line-of-site to the surrounding lock and weir.
4.6 The weather at the start of the noise survey was measured using a Kestrel 4500 weather station to be 25°C and 40% relative humidly, with a breeze less than 1m/s. Good measurement conditions were reported throughout the survey such that the weather conditions did not have significant adverse affects on the noise levels monitored.

Sound Solution Consultants Limited Doc ref: 14024 R1 28/09/2012
7 ENVIRONMENTAL NOISE STUDY
4.7 In line with the requirements of BS4142, the following lowest LA90,T noise levels are considered for the development. Given that ambient noise levels are reasonably constant over the measurement period from Tuesday 24th July to Thursday 26th July 2012; the lowest LA90,1hr level is taken at each measurement location as a baseline for noise assessment.
Location Date Measurement Time
HH:MM BS4142:1997 Period
Residual noise level
Free-field LA90, T
P1 25/07/2012 21:00 – 05:00 Lowest LA90, 1hr 57dB(A)
P2 26/07/2012 04:00 – 05:00 Lowest LA90, 1hr 66dB(A)
Table 2 – Lowest recorded LA90, T noise levels for noise assessment.
4.8 Daytime operation is normally considered between the hours of 07:00 and 23:00, with night time operation between 23:00 and 07:00. These times are taken in line with time periods and guidance defined by BS7445 and BS4142. The noise levels in Table 2 are representative of the minimum noise level measured in a 24-hour period, whose lowest levels are typically seen during the evening and night.
4.9 The following design criteria are considered applicable for cumulative mechanical noise levels 1m from the nearest residential premises, based on a complaint is unlikely criteria in accordance with BS4142. Achieving the rating assessment of complaint is unlikely depends on whether the noise source has distinguishable features as defined by Section 8.2 of the standard.
Design Description BS4142:1997
Rating Assessment
Noise Level LAeq,T dB re. 20µPa
P1 P2
Anonymous mechanical noises 10dB(A) below existing background
Complaint is unlikely 47 56
Distinguishable mechanical noises 15dB(A) below existing background
Complaint is unlikely 42 51
Table 3 – Design noise levels for mechanical equipment at noise sensitive locations.
ASSESSMENT OF BACKGROUND NOISE LEVELS
4.10 Ambient noise level data recorded in this assessment is representative of a sample of environmental conditions over the specified monitoring period. Seasonal variation should be expected with ambient noise adjacent to the site, where the area is dominated by water-flow noise and river flows typically change across the year. It is reasonable to predict therefore, that environmental noise levels may increase or decrease depending on the flow of water over Osney Lock and Weir.
4.11 The effect of changing environmental noise levels relative to river flow is difficult to quantify without extensive monitoring of different water levels, flow rates and lock configurations during different times of the year. No attempt has been made to quantify the change in ambient noise levels across seasonal variations where such detail is reasonably beyond the scope of this assessment.
4.12 The issue of varying environmental noise was discussed with the Environmental Health team of Oxford City Council during the noise assessment. It was verbally established that long term

Sound Solution Consultants Limited Doc ref: 14024 R1 28/09/2012
8 ENVIRONMENTAL NOISE STUDY
noise monitoring would be unnecessary for an outline planning survey if some technical evaluation was provided on the river flow during noise assessment, against those which otherwise could be expected at different times of the year. Where the river flow rate during noise assessment can be shown as ‘typical’ of the yearly average, then ambient noise levels may be considered proportionately so. Conversely, this exercise may highlight a need for further noise assessment at periods of significantly reduced river flow.
4.13 River flow data has been obtained and interpreted by Mannpower Consulting Limited for the period of ambient noise survey about Osney Lock and Weir. The following information is summarised from the data obtained:
Water conditions were reasonably consistent from Tuesday 24th to Wednesday 25th July with flow rates around 25m3/s (25th Q-percentile).
Flow rates reduced on Thursday 26th July to around 20m3/s (32nd Q-percentile).
Flow conditions during the survey period were marginally above the annual mean of 14m3/s (35th Q-percentile).
The setting of the lock gates was close to the average expected in July.
4.14 The noise level data shown graphically in Appendix D shows no indication of reduced noise levels during Thursday 26th July even though a lower flow rate has been determined during this period. It is therefore logical to suggest that:
Marginal changes in river flow (-5m3/s) above the average level have no measurable effect on the ambient noise level in the area.
The noise level measurements are likely to be representative of the average river flow.

Sound Solution Consultants Limited Doc ref: 14024 R1 28/09/2012
9 SOURCE NOISE STUDY
5 SOURCE NOISE STUDY
5.1 Further noise assessment was undertaken during the afternoon of Thursday 26th July 2012 to establish noise levels of a similar hydropower development to that proposed at Osney. Noise measurements were taken at an existing Archimedean screw off Rosemary Lane, Bath BA2. This site was taken to be representative of the Osney development where it was of similar construction and electrical capacity.
5.2 The nature of noise from an Archimedean screw is complex in nature and consists of more than one noise component. These can be summarised as follows:
A. Mechanical noise from the generator at the top of the screw.
B. Blade-entry and water flow noise from the top of the screw.
C. Water flow noise from the lower (out-water) end of the screw.
D. Noise from water running through the fish pass.
Figure 1 – Identification of development noises using a similar site.
5.3 Those sources A to C are considered to be the most distinguishable or significant noises from the Archimedean screw that warrant specific noise assessment. No noise assessment is made on the installation of a fish pass at Osney where this element is representative of low-level water noise and wholly comparable to the natural environment.
5.4 The noise source [A] of the mechanical generator emits broadband noise and specific tonal component relative to the operational speed of the unit. Noise measurements of this source were made at 1m from the open housing, accounting for direct noise from the generator and reverberant noise from the enclosure. A level of 86dB(A) was noted at full-speed operation.
A
B
C
D

Sound Solution Consultants Limited Doc ref: 14024 R1 28/09/2012
10 SOURCE NOISE STUDY
5.5 Noise emanating from the top of the screw in [B] consists of broadband water flow noise and rhythmic blade-entry noise. The leading-edges of the screw are fitted with rubber fish bumpers to protect fish which may pass through the screw. As these fish bumpers enter the water they emit a cyclic ‘plunging’ noise, relative to the number of screw blades and rotational speed of the screw. The phenomenon of blade-plunging noise is most noticeable at high speed operation (20-21rpm) where a specific component is audible at low frequency.
Recent improvements in screw design have determined that low-frequency blade plunging noise in [B] can be designed out by angling the blade entry into the water. This design consideration should be adopted at Osney where it is to be installed in a residential area.
5.6 Noise measurements of [B] included some component of [A] where the generator housing was not fully insulating against noise from the generator. The housing contained ventilation apertures which allowed sound to pass directly from internal to external areas with minimal attenuation. A noise level of 79dB(A) at 2m was recorded but contains some component from the generator, particularly at 630Hz.
5.7 Out-water noise at [C] is produced as a result of turbulent water flow over the supporting lower section of the screw and blade-exits. This noise is typically broadband in nature but also contains some low-frequency content, subjectively less noticeable than at blade-entry [B]. A noise level of 81dB(A) at 1m was recorded with the screw at full speed operation.
Figure 2 – Noise level measurements of a similar site.
5.8 The weather at the start of the noise survey was measured using a Kestrel 4500 weather station to be 30°C and 44% relative humidly, with a breeze averaging less than 0.5m/s.
5.9 The Larson Davis 824 sound level meter assembly as listed in Table 1 was used to determine the above noise levels over a nominal 1-2minute period at each point. Short term noise levels of 1-2 minutes were recorded given that the sources were constant in duration. The data measured in this section is considered applicable to long-term running noise that can be expected from the screw when operating at maximum speed.
40 45 50 55 60 65 70 75 80 85 90
25 H
z
31.5
Hz
40 H
z
50 H
z
63 H
z
80 H
z
100
Hz
125
Hz
160
Hz
200
Hz
250
Hz
315
Hz
400
Hz
500
Hz
630
Hz
800
Hz
1 kH
z
1.25
kH
z
1.6
kHz
2 kH
z
2.5
kHz
3.15
kH
z
4 kH
z
5 kH
z
6.3
kHz
8 kH
z
10 k
Hz
So
un
d P
re
ssu
re
Le
ve
l d
B r
e.
20
µP
a
Third Octave Band Centre Frequency (Hz)
1m from outwater 2m from screw top 1m from generator
Sound Solution Consultants Limited Doc ref: 14024 R1 28/09/2012
11 SOURCE NOISE STUDY
PREDICTION OF NOISE FROM MECHANICAL PLANT (NOISE MODELLING)
5.10 The measured sound pressure level data in Figure 2 has been used to determine resulting noise levels 1m from nearest noise sensitive premises about Osney Lock and Weir. Third-octave-band sound pressure data has been used over the frequency range from 25Hz to 10kHz (as to cover octave bands from 31.5Hz to 8kHz) along with a scale model of the area extracted from land surveys and scheme proposals.
5.11 Mediterranean Acoustics Research & Development Ltd. Olive Tree Lab Terrain software V1.4.2 has been used to calculate the resulting noise level about the nearest noise sensitive premises. The modelling software is used to generate accurate results of sound pressure level with the following assumptions:
The noise data in Figure 2 is used as input to the model, accounting for noise occurring at each part of the screw. Noise sources are taken to be omni-directional so no account is made for source directivity.
Cumulative noise levels are considered from all three noise sources [A-C] at two receiver locations, assuming all noises are coherent. Noise from the generator and screw are initially considered separately to evaluate noise mitigation on each part of the development.
Site geometry and layout is based on information obtained from topographical land surveys scheme design drawings.
Surface attenuation factors are considered in line with the existing environment (i.e. water, gravel car park, grass).
Receiver location is taken 1m from the façade of the nearest premises, 1.5m above the ground.
Atmospheric absorption is based on ISO9613 Part 1, using meteorological conditions of 10°C and 70% relative humidity.
Complex screening attenuation has been estimated from the noise model where line-of-sight may be partially restricted between proposed plant and nearest noise sensitive windows.
5.12 A recent paper1 presented by the developers of Olive Tree Lab Terrain shows the benefits of using its software-based noise estimates, in comparison to measured results and common industry-adopted methods such as ISO 9613-2. The use of Terrain’s complex calculation algorithms (based on purely scientific research) can be shown to produce very accurate diffraction and propagation estimates of noise.
1 P. Economou, P. Charalampous, “A comparison of ISO9613-2 and advanced calculation methods using Olive Tree Lab-Terrain, an outdoor sound propagation software application: predictions verses experimental results”. Institute of Acoustics Vol 34. Pt. 1. 2012.

Sound Solution Consultants Limited Doc ref: 14024 R1 28/09/2012
12 SOURCE NOISE STUDY
5.13 Notwithstanding the accuracy of the software used, the success of any noise model is substantially dependent on the software user to generate valid and representative results. Reasonable care needs to be taken with the design of the model and ensuring that the topography is representative of the design proposals.
5.14 The noise level results presented in this section are considered to be an accurate account of the development noise level, based on measured input values and site topography. Two fundamental scenarios are considered in noise assessment, for different purposes of noise control, but considered cumulatively in noise impact assessment. These are listed as follows:
1) Contribution of screw noises [B + C] propagating to noise sensitive locations.
2) Estimation of generator noise [A] at nearest noise sensitive locations.
5.15 The results of part (1) will realistically determine the screw noise level at nearest receptor points. An appropriate sound insertion loss characteristic of the generator housing (being a self-contained room of the development) will be determined separately in (2) where the modelled approach using Terrain cannot directly verify the amount of noise that travels through a building element, or from a contained room.
Figure 3 – Geometric noise modelling (ray tracing solution for screw noise at Bridge Street).
5.16 The following estimates have been obtained from modelling screw noise about the proposed development at Osney Lock and Weir against the scheme design shown in Appendix C.

Sound Solution Consultants Limited Doc ref: 14024 R1 28/09/2012
13 SOURCE NOISE STUDY
Ref Description
Octave Band Data dB re. 20µPa
Total
(A)
31
.5 H
z
63
Hz
12
5 H
z
25
0 H
z
50
0 H
z
1 k
Hz
2 k
Hz
4 k
Hz
8 k
Hz
M1 Screw noise
No. 47 Bridge Street 46 41 45 40 38 36 32 25 15 41
M2 Screw noise
The Boat House 49 57 53 52 52 51 46 43 41 55
Table 4 – Preliminary noise modelling results.
5.17 It is considered difficult to attenuate out-water noise in the direction of The Boat House where clear line-of-sight results from development to receiver position. The contribution of out-water noise is estimated to account for 54dB(A) at this receptor location, whose noise content should relate the existing (water noise dominated) environment.
5.18 From modelling the propagation of generator noise at Osney Weir, it can be shown that respective noise levels of 60dB(A) will result at No. 47 Bridge Street and 56dB(A) at The Boat House; if the unit is placed in a free-field environment. This scenario is substantially unrealistic knowing that the generator will be contained within a dedicated outbuilding; however one limitation of the chosen modelling approach is that it cannot determine noise breakout.
5.19 With knowledge of the resulting generator sound pressure level at the nearest receptor position, it can be shown that reducing generator noise (to below NR29) at No. 47 Bridge Street will typically result in achieving a cumulative noise level of 42dB(A). This process is used to specify a suitable sound reduction index of the generator building where the result falls in line with the design target noise levels listed in Table 3.
Ref Description
Octave Band Data dB re. 20µPa
Total
(A)
31
.5 H
z
63
Hz
12
5 H
z
25
0 H
z
50
0 H
z
1 k
Hz
2 k
Hz
4 k
Hz
8 k
Hz
M4 Generator noise (free-field)
No. 47 Bridge Street 52 55 58 52 60 48 54 47 42 60
SRI Noise excess above NR29 Generator Building SRI
- - +11 +13 +27 +19 +28 +23 +20 -
- Generator noise (attenuated)
No. 47 Bridge Street 55 55 47 39 33 29 26 24 22 38
M3 Screw noise
No. 47 Bridge Street 46 41 45 40 38 36 32 25 15 41
X Cumulative noise level
No. 47 Bridge Street 55 55 49 43 39 37 33 27 23 42
Table 5 – Estimation of generator enclosure SRI and cumulative noise level at No. 47 Bridge Street.
5.20 The resulting level of attenuated generator noise at The Boat House is insignificant when compared to the level of screw (out-water) noise at this location.

Sound Solution Consultants Limited Doc ref: 14024 R1 28/09/2012
14 SOURCE NOISE STUDY
Ref Description
Octave Band Data dB re. 20µPa
Total
(A)
31
.5 H
z
63
Hz
12
5 H
z
25
0 H
z
50
0 H
z
1 k
Hz
2 k
Hz
4 k
Hz
8 k
Hz
M5 Generator noise (free-field)
The Boat House 49 53 51 43 57 50 48 42 35 56
SRI Generator Building SRI
Taken from above - - +11 +13 +27 +19 +28 +23 +20 -
- Generator noise (attenuated)
The Boat House 49 53 41 29 29 31 20 18 15 34
M2 Screw noise
The Boat House 49 57 53 52 52 51 46 43 41 55
Y Cumulative noise level
The Boat House 52 58 53 52 52 51 46 43 41 55
Table 6 – Estimation of cumulative noise level at The Boat House.
5.21 Cumulative specific noise levels of 42dB(A) and 55dB(A) are used in noise assessment at the respective locations of No. 47 Bridge Street and The Boat House.

Sound Solution Consultants Limited Doc ref: 14024 R1 28/09/2012
15 NOISE ASSESSMENT
6 NOISE ASSESSMENT
6.1 Cumulative noise levels from the proposed development have been assessed at the nearest noise sensitive locations of No. 47 Bridge Street and The Boat House. The difference between predicted BS4142 rating noise levels and lowest measured daytime LA90 background noise levels has been calculated to attain the BS4142 difference rating.
6.2 Rating penalties specified in Section 8.2 of BS4142 are considered as a precautionary measure with the proposed hydropower development; where resulting noise levels may contain low-frequency or tonal components and be distinguishable from the surrounding environment.
6.3 The following noise assessment can be made for the proposed development:
Receiver location
Specific
Noise Level
dB(A)
Rating
Penalty dB
BS4142:1997
Rating Level
dB(A)
Lowest LA90, T
Noise Level
BS4142:1997
Rating
Assessment
No. 47 Bridge Street 42 +5 47 57 -10
The Boat House 55 +5 60 66 -6
'Complaint is unlikely'
'Marginal significance'
‘Complaint is likely’
Table 7 – BS4142 assessment 1m from the nearest noise sensitive locations.
6.4 BS4142 states that where the rating level is 10dB below the measured background noise level then this a positive indication that complaints are unlikely. Use of the proposed scheme during a 24-hour period at Osney Lock and Weir is predicted to have a negligible impact on the neighbouring residences along Bridge Street with a -10dB rating assessment.
6.5 There is no description within BS41242 to describe a rating assessment of -6dB, as estimated at the commercial premise of The Boat House. A similarly low impact is expected occur at this location given the specific noise level is substantially below the lowest measured LA90 noise level.
6.6 Where specific noise levels are calculated 11-15dB below the existing background noise over a 24-hour period; it is predicted that the development will have no significant or measureable effect on the background noise level at the closest noise sensitive locations.
6.7 Quantification of the predicted noise level against the existing background noise level is an important step to demonstrate that the development will minimise ‘background creep’ in the neighbouring area. This phenomenon only occurs if developments are permitted whereby the resultant noise level at the nearest noise sensitive location is close to or greater than the existing background noise.
6.8 Considering that an open window loss of 15dB will apply to the noise level inside the nearest neighbouring residential buildings of Bridge Street; a resultant internal noise level of 27dB LAeq, T can be expected. Consulting noise level guidance in Section 3 of this assessment, anticipated

Sound Solution Consultants Limited Doc ref: 14024 R1 28/09/2012
16 NOISE ASSESSMENT
noise levels will be within the WHO health limit of 30dB(A) for a bedroom. The specified scheme would therefore be unlikely to cause negative effects on sleep inside nearby residences.
6.9 A continuous equivalent noise level of 27dB LAeq, T predicted inside nearby dwellings is unlikely to provoke a significant annoyance response from residences. Noise levels are significantly below the 35dB LAeq, T critical health limit where moderate annoyance or speech interference may occur for a few people during the daytime and evening.
6.10 Resulting noise levels at the Boat House are unlikely to be excessive when referring to internal noise level guidance within BS8233:1999 Sound Insulation and Noise Reduction for Buildings – Code of Practice. Assuming a reduction of 15dB reduction through an open window; an internal noise level of 40dB(A) will maintain reasonable conditions for study and work requiring concentration.
Sound Solution Consultants Limited Doc ref: 14024 R1 28/09/2012
17 CONCLUSIONS
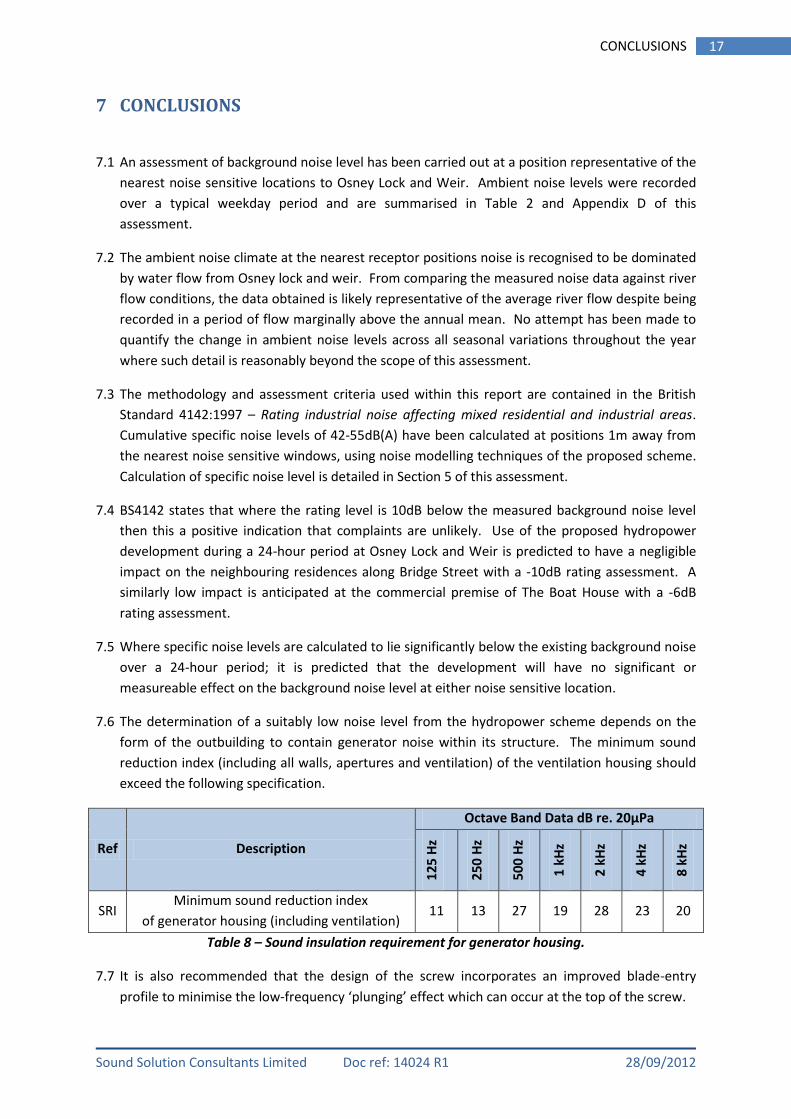
7 CONCLUSIONS
7.1 An assessment of background noise level has been carried out at a position representative of the nearest noise sensitive locations to Osney Lock and Weir. Ambient noise levels were recorded over a typical weekday period and are summarised in Table 2 and Appendix D of this assessment.
7.2 The ambient noise climate at the nearest receptor positions noise is recognised to be dominated by water flow from Osney lock and weir. From comparing the measured noise data against river flow conditions, the data obtained is likely representative of the average river flow despite being recorded in a period of flow marginally above the annual mean. No attempt has been made to quantify the change in ambient noise levels across all seasonal variations throughout the year where such detail is reasonably beyond the scope of this assessment.
7.3 The methodology and assessment criteria used within this report are contained in the British Standard 4142:1997 – Rating industrial noise affecting mixed residential and industrial areas. Cumulative specific noise levels of 42-55dB(A) have been calculated at positions 1m away from the nearest noise sensitive windows, using noise modelling techniques of the proposed scheme. Calculation of specific noise level is detailed in Section 5 of this assessment.
7.4 BS4142 states that where the rating level is 10dB below the measured background noise level then this a positive indication that complaints are unlikely. Use of the proposed hydropower development during a 24-hour period at Osney Lock and Weir is predicted to have a negligible impact on the neighbouring residences along Bridge Street with a -10dB rating assessment. A similarly low impact is anticipated at the commercial premise of The Boat House with a -6dB rating assessment.
7.5 Where specific noise levels are calculated to lie significantly below the existing background noise over a 24-hour period; it is predicted that the development will have no significant or measureable effect on the background noise level at either noise sensitive location.
7.6 The determination of a suitably low noise level from the hydropower scheme depends on the form of the outbuilding to contain generator noise within its structure. The minimum sound reduction index (including all walls, apertures and ventilation) of the ventilation housing should exceed the following specification.
Ref Description
Octave Band Data dB re. 20µPa
12
5 H
z
25
0 H
z
50
0 H
z
1 k
Hz
2 k
Hz
4 k
Hz
8 k
Hz
SRI Minimum sound reduction index
of generator housing (including ventilation) 11 13 27 19 28 23 20
Table 8 – Sound insulation requirement for generator housing.
7.7 It is also recommended that the design of the screw incorporates an improved blade-entry profile to minimise the low-frequency ‘plunging’ effect which can occur at the top of the screw.

Sound Solution Consultants Limited Doc ref: 14024 R1 28/09/2012
18 CONCLUSIONS
7.8 With the inclusion of appropriate mitigation measures incorporated into the design of proposed outbuilding; noise should not be a detrimental issue for the hydropower scheme proposal at Osney Lock and Weir.

Sound Solution Consultants Limited Doc ref: 14024 R1 28/09/2012
I Appendix A: Glossary of Acoustic Terms
Appendix A: Glossary of Acoustic Terms DEFINITIONS AND UNITS
A1.1 Noise is defined as unwanted sound. The range of audible sound is from 0dB to 140dB, which is taken to be the threshold of pain. The sound pressure detected by the human ear covers an extremely wide range. The decibel (dB) is used to condense this range into a manageable scale by taking the logarithm of the ratio of the sound pressure and a reference sound pressure.
A1.2 The unit of frequency is Hz. 1 Hz is one pressure fluctuation in one second. The frequency response of the ear is usually taken to be about 16Hz (number of oscillations per second) to 18,000Hz. The ear does not respond equally to different frequencies at the same level. It is more sensitive in the mid-frequency range than at the lower and higher frequencies, and because of this, the low and high frequency component of a sound are reduced in importance by applying a weighting (filtering) circuit to the noise measuring instrument. The weighting which is most used and which correlates best with the subjective response to noise is the dB(A) weighting. This electronic filter matches the variation in the frequency sensitivity of the meter to that of the human ear. This is an internationally accepted standard for noise measurements.
A1.3 The ear can just distinguish a difference in loudness between two noise sources when there is a 3dB(A) difference between them. Also when two sound sources of the same noise level are combined the resultant level is 3dB(A) higher than the single source. When two sounds differ by 10dB(A) one is said to be twice as loud as the other.
A1.4 A few examples of noise of various levels are given below:
Sound Level, dB(A) Environmental Condition
0 – 10 Threshold of hearing
10 - 20 Broadcasting studio
20 – 30 Bedroom at night
30 – 40 Library
40 – 50 Living room urban area
50 – 60 Typical business offices
60 – 70 Conversation speech
70 – 80 Average traffic on street corner
80 – 90 Inside a factory
100 – 110 Burglar alarm (1m away)
110 – 120 Pneumatic drill (1m away)
120 – 130 Jet aircraft take off
130 - 140 Threshold of pain
Table A1 – Example noise levels.
A1.5 The subjective response to a noise is dependent not only upon the sound pressure level and its frequency, but also its intermittency. Various statistical indices have been developed to

Sound Solution Consultants Limited Doc ref: 14024 R1 28/09/2012
II Appendix A: Glossary of Acoustic Terms
try and correlate annoyances with the noise level and its fluctuations in a changing noise environment. The indices and parameters used in this report are defined below:
A1.6 LAeq: Equivalent Continuous Sound Pressure Level The A-weighted sound pressure level of a steady sound that has, over a given period, the same energy as the fluctuating sound under investigation. It is in effect the energy average level over the specified measurement period (T) and is the most widely used indicator for environmental noise.
A1.7 LAN: the A-weighted sound level exceeded for N% of the measurement period. In BS7445 the LA90 is used to define the background noise level, i.e. the noise that would remain once all local noise sources were removed. The LA10 gives an indication of the upper limit of fluctuating noise and is used in the assessment of road traffic noise.
A1.8 LAMAX: The maximum ‘A’ weighted noise level recorded during the measurement period.

Sound Solution Consultants Limited Doc ref: 14024 R1 28/09/2012
III Appendix B: Noise Measurement Locations
Appendix B: Noise Measurement Locations
Figure B1 – Background noise measurement locations.
Site boundary
Measurement location
Measurement position
Site boundary
P1
P2
Sound Solution Consultants Limited Doc ref: 14024 R1 28/09/2012
IV Appendix B: Noise Measurement Locations
Figures B2 & B3 – Background noise measurement location P1.
Facing south-west at P1
No. 46-47 Bridge Street (noise sensitive locations)
Facing south at P1

Sound Solution Consultants Limited Doc ref: 14024 R1 28/09/2012
V Appendix B: Noise Measurement Locations
Figures B4 & B5 – Background noise measurement location P2.
Facing north at P2
Facing east at P2
Boat House (noise sensitive location)

Sound Solution Consultants Limited Doc ref: 14024 R1 28/09/2012
Appendix C: Scheme Design VI
Appendix C: Scheme Design
Figure C1 – Scheme Design.

Sound Solution Consultants Limited Doc ref: 14024 R1 28/09/2012
Appendix D: Noise Survey Summary VII
Appendix D: Noise Survey Summary
0
10
20
30
40
50
60
70
80
90
100 12
:00:
00
13:0
0:00
14
:00:
00
15:0
0:00
16
:00:
00
17:0
0:00
18
:00:
00
19:0
0:00
20
:00:
00
21:0
0:00
22
:00:
00
23:0
0:00
00
:00:
00
01:0
0:00
02
:00:
00
03:0
0:00
04
:00:
00
05:0
0:00
06
:00:
00
07:0
0:00
08
:00:
00
09:0
0:00
10
:00:
00
11:0
0:00
12
:00:
00
13:0
0:00
14
:00:
00
15:0
0:00
16
:00:
00
17:0
0:00
18
:00:
00
19:0
0:00
20
:00:
00
21:0
0:00
22
:00:
00
23:0
0:00
00
:00:
00
01:0
0:00
02
:00:
00
03:0
0:00
04
:00:
00
05:0
0:00
06
:00:
00
07:0
0:00
08
:00:
00
09:0
0:00
So
un
d P
re
ssu
re
Le
ve
l d
B r
e.2
0µ
Pa
Measurement Time HH:MM:SS
Figure D1 - Background noise survey graphical data. Position 1: North of Osney Lock and Weir.
LAFmax
LAFeq
LAF90
LAFmin

Sound Solution Consultants Limited Doc ref: 14024 R1 28/09/2012
Appendix D: Noise Survey Summary VIII
0
10
20
30
40
50
60
70
80
90
100
12:0
0:00
13
:00:
00
14:0
0:00
15
:00:
00
16:0
0:00
17
:00:
00
18:0
0:00
19
:00:
00
20:0
0:00
21
:00:
00
22:0
0:00
23
:00:
00
00:0
0:00
01
:00:
00
02:0
0:00
03
:00:
00
04:0
0:00
05
:00:
00
06:0
0:00
07
:00:
00
08:0
0:00
09
:00:
00
10:0
0:00
11
:00:
00
12:0
0:00
13
:00:
00
14:0
0:00
15
:00:
00
16:0
0:00
17
:00:
00
18:0
0:00
19
:00:
00
20:0
0:00
21
:00:
00
22:0
0:00
23
:00:
00
00:0
0:00
01
:00:
00
02:0
0:00
03
:00:
00
04:0
0:00
05
:00:
00
06:0
0:00
07
:00:
00
08:0
0:00
09
:00:
00
So
un
d P
re
ssu
re
Le
ve
l d
B r
e.2
0µ
Pa
Measurement Time HH:MM:SS
Figure D2 - Background noise survey graphical data. Position 2: South of Osney Lock and Weir.
LAFmax
LAFeq
LAF90
LAFmin