Noise as Information for Illiquidityjunpan/Noise.pdfnoise measure is not driven by poor yield curve...
47
Noise as Information for Illiquidity Grace Xing Hu, Jun Pan, and Jiang Wang ∗ July 1, 2012 Abstract We propose a market-wide liquidity measure by exploiting the connection between the amount of arbitrage capital in the market and observed price deviations in U.S. Treasury bonds. During normal times, abundant arbitrage capital smoothes out the Treasury yield curve and keeps the deviations small. During market crises, however, the shortage of arbitrage capital leaves the yields to move more freely relative to the curve, resulting in more “noise” in prices. As such, “noise” in Treasury prices can be informative about the broad market liquidity conditions. Indeed, we find that our “noise” measure captures episodes of liquidity crises of different origins and magnitudes across the financial market, providing information above and beyond existing liquidity proxies. Moreover, using it as a priced risk factor, we show that it helps explain cross-sectional returns on hedge funds and currency carry trades, both known to be sensitive to the general liquidity conditions of the market. ∗ Hu ([email protected]) is from University of Hong Kong, Pan ([email protected]) and Wang ([email protected]) are from MIT Sloan School of Management, CAFR, and NBER. We are grateful to Cam Harvey (the editor), the associate editor, two anonymous reviewers, Darrell Duffie, Mark Kritzman, Krishna Ramaswamy, Dimitri Vayanos, Adrien Verdelhan, and Haoxiang Zhu for valuable discussions. We also thank comments from seminar participants at Boston University, Shanghai University of Finance and Economics, University of Maryland, University of Michigan, University of Pennsylvania, University of Western Australia, Capula Investment Management LLC, 2011 NBER Asset Pricing Program Spring Meeting, Moody’s 2011 Credit Risk Conference, Morgan Stanley, and Q Group 2012 Spring Conference.
Transcript of Noise as Information for Illiquidityjunpan/Noise.pdfnoise measure is not driven by poor yield curve...

Noise as Information for Illiquidity
Grace Xing Hu, Jun Pan, and Jiang Wang∗
July 1, 2012
Abstract
We propose a market-wide liquidity measure by exploiting the connection between theamount of arbitrage capital in the market and observed price deviations in U.S. Treasurybonds. During normal times, abundant arbitrage capital smoothes out the Treasury yieldcurve and keeps the deviations small. During market crises, however, the shortage ofarbitrage capital leaves the yields to move more freely relative to the curve, resulting inmore “noise” in prices. As such, “noise” in Treasury prices can be informative about thebroad market liquidity conditions. Indeed, we find that our “noise” measure capturesepisodes of liquidity crises of different origins and magnitudes across the financial market,providing information above and beyond existing liquidity proxies. Moreover, using it asa priced risk factor, we show that it helps explain cross-sectional returns on hedge fundsand currency carry trades, both known to be sensitive to the general liquidity conditionsof the market.
∗Hu ([email protected]) is from University of Hong Kong, Pan ([email protected]) and Wang([email protected]) are from MIT Sloan School of Management, CAFR, and NBER. We are grateful to CamHarvey (the editor), the associate editor, two anonymous reviewers, Darrell Duffie, Mark Kritzman, KrishnaRamaswamy, Dimitri Vayanos, Adrien Verdelhan, and Haoxiang Zhu for valuable discussions. We also thankcomments from seminar participants at Boston University, Shanghai University of Finance and Economics,University of Maryland, University of Michigan, University of Pennsylvania, University of Western Australia,Capula Investment Management LLC, 2011 NBER Asset Pricing Program Spring Meeting, Moody’s 2011Credit Risk Conference, Morgan Stanley, and Q Group 2012 Spring Conference.

1 Introduction
The level of liquidity in the aggregate financial market is closely connected to the amount of
arbitrage capital available. During normal times, institutional investors such as investment
banks and hedge funds have abundant capital, which they can deploy to supply liquidity.
Consequently, big price deviations from the fundamental values are largely eliminated by
arbitrage forces, and assets are traded at prices closer to their fundamental values. During
market crises, however, capital becomes scarce and/or willingness to deploy it diminishes.
The liquidity in the overall market dries up. The lack of sufficient arbitrage capital limits the
force of arbitrage and assets can be traded at prices significantly away from their fundamental
values.1 Thus, temporary price deviations, or “noise” in prices, being a key symptom of
shortage in arbitrage capital, contains important information about the amount of liquidity
in the aggregate market. In this paper, we analyze the “noise” in the price of U.S. Treasuries
and examine its informativeness as a measure of overall market illiquidity.
Our basic premise is that the abundance of arbitrage capital during normal times helps
smooth out the Treasury yield curve and keep the average dispersion low. This is particularly
true given the presence of many proprietary trading desks at investment banks and fixed-
income hedge funds that are dedicated to relative value trading with the intention to arbitrage
across various habitats on the yield curve.2 During liquidity crises, however, the lack of
arbitrage capital forces the proprietary trading desks and hedge funds to limit or even abandon
their relative value trades, leaving the yields to move more freely in their own habitats and
resulting in more noise in the yield curve. We therefore argue that these abnormal noises
in Treasury prices are a symptom of a market in severe shortage of arbitrage capital. More
importantly, to the extent that capital is allocated across markets for major marginal players
in the market, this symptom is not only specific to the Treasury market, but also more broadly
to the overall financial market.
In addition to its close connection to arbitrage capital, the U.S. Treasury market is ideal for
our empirical investigation for several reasons. First, it is a market of central importance and
investors of many types come to the Treasury market to trade, not just for investment but also
funding needs (Treasuries are probably the most important collateral in short term financing).
As such, trading in the Treasury market contains information about liquidity needs for the
broader financial market. Second, the fundamental values of Treasury bonds are characterized
1There is an extensive literature on how the amount of arbitrage capital in a specific market affects theeffectiveness of arbitrage forces, or “limits of arbitrage,” and possible price deviations. See, for example, Merton(1987), Leland and Rubinstein (1988), Shleifer and Vishny (1997), Gromb and Vayanos (2002), Brunnermeierand Pedersen (2009) and Duffie (2010).
2Vayanos and Vila (2009), for example, model the interaction between habitat investors and risk-aversearbitrageurs and its impact on bond yields.
1

by a small number of interest rate factors, which can be easily captured empirically. This gives
us a more reliable benchmark to measure price deviations, and this aspect of the market is
important because we would like to keep the information content as “pure” as possible. Other
markets such as the corporate bond market, the equity market, or the index options market
might also be informative, but their information is “contaminated” by the presence of other
risk factors. Third, the U.S. Treasury market is one of the most active and liquid markets,
one with the highest credit quality, and is the number one safe haven during crisis. A shortage
of liquidity in this market provides a strong signal about liquidity in the overall market.
Using CRSP Daily Treasury database, we construct our noise measure by first backing
out, day by day, a smooth zero-coupon yield curve. This yield curve is then used to price all
available bonds on that day. Associated with each bond is the deviation of its market yield
from the model yield. Aggregating the deviations across all bonds by calculating the root
mean squared error, we obtain our noise measure. We call it “noise” only to the extent that
in the fixed-income literature, deviations from a given pricing model are often referred to as
noise.
Whether this noise measure indeed captures the liquidity condition of the overall market
is primarily an empirical matter. If it does, we expect it to exhibit the following properties:
First, it should serve as a good indicator during liquidity crises in different parts of the market.
Second, it should provide new information about market liquidity beyond various existing
liquidity measures. Third and very importantly, given its systematic nature, it should, as
an additional risk factor, help us understand returns on assets beyond the Treasury market,
especially those which are sensitive to the liquidity condition of the overall market.
Our results show that the noise measure is rather informative about the liquidity condition
of the overall market. During normal times, the noise is kept at an average level around 3.61
basis points, which is comparable to the average bid/ask yield spread of 2 basis points. In other
words, the arbitrage capital on the yield curve is effective in keeping the deviations within
a range that is unattractive given the transaction cost. During crises, however, our noise
measure spikes up much more prominently than the bid/ask spread, implying a high degree
of misalignment in bond yields that would have been attractive for relative value arbitrage
during normal times and are in fact attractive given the contemporaneous transaction cost.
These include the 1987 crash, when the noise was over 13 basis points; the aftermath of the
LTCM crisis, when the noise peaked at 5.89 basis points; the first trading day after the 9/11
terrorist attack, when the noise was at 12.54; the days following the sale of Bear Stearns to
JPMorgan, when the noise peaked at 8.08 basis points; and the aftermath of Lehman default,
when the noise was above 15 basis points for a sustained period of time. Given the sample
standard deviation of 2.17 basis points for the noise measure, these are large deviations away
from the mean.
2

To further understand the uniqueness of the information captured by the noise measure, we
examine its relation to other known measures of liquidity. One popular measure of liquidity for
the Treasury market is the premium enjoyed by on-the-run bonds. Since our noise measure is a
daily aggregate of cross-sectional pricing errors, the on-the-run premium is in fact a component
of our measure. We find a positive relation between the two, but our noise measure is by far
more informative about the overall liquidity condition in the market. In particular, our noise
measure spikes up much more prominently than the on-the-run premium during crises. This
is because our noise measure collects information over the entire yield curve, while the on-the-
rum premium focuses only on a couple of isolated points on the yield curve. As such, our noise
measure is much more sensitive to the commonality of pricing errors across the yield curve. If
such commonality heightens during crises, then it will be captured by our noise measure, but
not by a measure that focuses only on a couple of isolated points on the yield curve. Indeed,
this is how noise becomes information. Our results also show that factors known to be related
to systematic liquidity such at the CBOE VIX index and the Baa-Aaa yield spreads have a
significant relation with our noise measure. By contrast, term structure variables such as the
short- and long-term interest rates and interest-rate volatility do not have strong explanatory
power for the time-variation for our noise measure. In other words, the time-variation in our
noise measure is not driven by poor yield curve fitting.3
It is important to emphasize that our noise measure comes from the U.S. Treasury bond
market — the one with the highest credit and liquidity quality and is the number one safe
haven during crises, and yet it was able to reflect liquidity crises of varying origins and mag-
nitudes. In this respect, what is captured in our noise measure is not the liquidity concerns
specific to the Treasury market. Rather it is a reflection on how different liquidity crises
might transmit through financial markets via the movements of arbitrage capital. In other
words, rather than being a measure specific only to the Treasury market, our noise measure
is a reflection of the overall market condition.4 This insight becomes important as we move
forward to examine the asset pricing implications of this liquidity risk factor. Asset returns
such as equity and bond are within the confined of their own asset classes. While important
in explaining the risk factors within their own markets, such standard test portfolios are not
good test portfolios for our purpose. What we need are portfolios or trading strategies that
transcend the asset class boundaries and are sensitive to liquidity risks or crises across a spec-
trum of markets. We find hedge fund returns to be ideal for this purpose. They are known to
3In the appendix, we take up the issue of yield curve fitting more seriously by examining the robustness ofour main results using alternative and more flexible curve fitting methods. Our results are robust.
4More specifically, our measure is not a reflection of how constrained the market makers in the Treasurymarket are. In fact, the bid and ask spreads of Treasury bond prices can be a better measure of such “local”liquidity.
3

be in close association with arbitrage capital, react substantially to market upheavals, and is
not localized to just one market.
We use TASS hedge fund data from 1994 through 2011 to obtain hedge fund returns. Using
a two-factor model that includes monthly changes in noise as one factor and returns on the
stock market portfolio as the other, we find that the liquidity risk is indeed priced by hedge
fund returns. The estimated risk premium is statistically significant, and is also economically
important. For two hedge funds with the same market beta but differing liquidity beta, one
unit difference in liquidity beta generates a difference of 0.69% per month in returns. This
liquidity risk premium explains why some hedge funds can generate superior performance:
because of their high exposures to a priced, market-wide liquidity risk factor. Interestingly,
such highly exposed hedge funds are also found to have a higher exit rate in 2008 to the
graveyard sample. Using other measures of liquidity such as RefCorp yield spread, on-the-run
premiums, Pastor-Stambaugh equity market liquidity measure, CBOE VIX, or default spreads
to price the same set of hedge fund returns, we find no evidence that any of these liquidity
proxies is priced.
We further extend our hedge fund pricing results to explain the performance of currency
carry trade — a trading strategy widely known to be linked to arbitrage capital and is sensitive
to liquidity conditions in the broad market. A typical currency carry trade is to take long
positions on “asset” currencies with high interest rates and fund the trade with “funding”
currencies with low interest rates. In our sample, the average return on the “asset” currencies
is about 79 basis points a month and is statistically significant. Using our noise measure as a
liquidity risk factor, we find that the “asset” currencies have high liquidity exposures, while
the “funding” currencies have minimal exposures. Using the liquidity risk premium estimated
from hedge fund returns to make risk adjustment, we find that the superior performance of
the “asset” currencies is diminished in magnitude and is no longer statistically significant. In
other words, high exposure to market-wide liquidity risk is a key driver for currency carry
profits.
Our paper contributes to the existing literature in several dimensions. It explores the
empirical implications of the theoretical theme on the “limits of arbitrage,” which emphasizes
the link between shortage of capital, market liquidity and price deviations (see, for example,
Merton (1987), Shleifer and Vishny (1997), Kyle and Xiong (2001), and Gromb and Vayanos
(2002)). Recent empirical work, such as Coval and Stafford (2007) on equity fire sales by
mutual funds and Mitchell, Pedersen, and Pulvino (2007) on convertible bond arbitrage by
hedge funds, provides additional empirical evidence on this link.5 While these papers focus
5More recently, Mitchell and Pulvino (2011) provide a detailed and informative account on the financingof hedge funds during the 2008 crisis and its potential implications on asset prices. Nagel (2011) connects thereturns of short-term reversal strategies in equity markets with the expected returns from liquidity provision.
4

mostly on the connection between arbitrage capital and liquidity in specific markets, our paper
considers the liquidity in the overall market. In particular, our liquidity measure is able to
capture episodes of liquidity crises of varying origins and is not limited to one specific market.
As such, the fluctuation of arbitrage capital captured by our noise measure is not confined to
market makers of certain markets, or hedge funds of certain styles.
A growing body of work explores asset pricing implications of liquidity and liquidity risk.
This includes, for example, Pastor and Stambaugh (2003) and Acharya and Pedersen (2005)
on equities, Bao, Pan, and Wang (2011) on corporate bonds and Mancini, Ranaldo, and
Wrampelmeyer (2012) on foreign currencies.6 These studies follow a common approach, which
is to focus on a specific market to both construct and test the liquidity risk measure. We
instead focus on the liquidity risk of the overall market by extracting our liquidity measure
from the U.S. Treasury market, one of the most liquid markets in the world. We then use
test portfolios from other markets, namely hedge fund and currency carry trade strategies, to
confirm the importance of this aggregate liquidity risk factor in asset pricing.
Our results also complement studies on hedge fund and carry trade returns.7 For example,
Sadka (2010) extracts a liquidity risk factor from the equity market and finds it to be important
in explaining hedge fund returns. His measure of liquidity risk, similar to that of Pastor and
Stambaugh (2003), is based on price impact in the equity market, thus is equity specific, while
ours is more market-wide. Moreover, we do not find a significant risk premium for the Pastor-
Stambaugh equity liquidity risk factor using hedge fund returns as test portfolios. Since Fama
(1984), the source of currency carry trade returns has been an object of investigation by many
studies.8 Brunnermeier, Nagel, and Pedersen (2008) focus on interaction of crash risks of
currencies and funding conditions of currency speculators. Using CBOE VIX and LIBOR
Fleckenstein, Longstaff, and Lustig (2010) find that the prices of nominal Treasury bonds and TIPS appear tobe inconsistent with inflation swaps and document a large increase of this mis-pricing during the 2008 crisis.Lou, Yan, and Zhang (2012) find that anticipated and repeated Treasury auctions can generate temporaryprice deviations in the secondary market.
6Jankowitsch, Nashikkar, and Subrahmanyam (2011) also propose a dispersion-based liquidity measure forcorporate bonds. For each bond, they calculate root mean squared difference between the TRACE prices andthe respective Markit quotation and find it to be informative about the bond’s liquidity. Although similar inname, it is important to point out that their dispersion comes from the intraday price movements (one bondat a time) and has a very different economic meaning from the noise measure proposed in this paper.
7There is a growing literature in hedge fund studies that connects hedge fund activities to market liquidityand market crises such as Cao, Chen, Liang, and Lo (2010) and Billio, Getmansky, and Pelizzon (2010).
8It ranges from using consumption-based asset pricing models (e.g., Backus, Gregory, and Telmer (1993)and Verdelhan (2010)), reduced-form term structure models (e.g., Backus, Foresi, and Telmer (2001)), to,more recently, combining carry trade returns with currency options to incorporate tail risks (e.g., Jurek (2009)and Burnside, Eichenbaum, Kleshchelski, and Rebelo (2010)).
5

spreads as proxies for funding liquidity, they find that the carry trade tends to incur losses
during weeks in which illiquidity increases. Our result is consistent with this observation,
but more importantly, we are able to formally test the pricing implication. In particular, our
result explicitly links the superior performance of “asset” currencies to their high exposures
to the noise measure.
Finally, given the existing literature, we discuss the extent to which our noise measure
may be driven by the liquidity demand (instead of liquidity supply) in the Treasury market.
In order to address this issue, we first note that the price noise of a particular security arises
from the imbalance of the demand and supply of liquidity in this security. The demand for
liquidity comes from the transitory buying or selling pressures of this security, while the supply
of liquidity comes from market makers/arbitragers who accommodate these pressures. Hence,
a spike in the price noise of a particular security (or a subset) can come from an increase in
liquidity demand, a decrease in liquidity supply, or both. In this respect, it is only when the
liquidity demand of a particular security stays relatively stable, can we attribute an increase
in noise of this particular security to a decrease in liquidity supply. But one unique feature
of our noise measure is that it is averaged across a broad set of Treasury securities. As a
result, shocks to the liquidity demand of individual Treasuries are mostly averaged away and
do not yield to a spike in the noise measure.9 By contrast, the situation for liquidity supply
is different because arbitrage capital does not localize itself to one security. In particular,
when arbitrage capital is abundant, liquidity shocks to individual Treasuries are averaged
away as capital moves fluidly across the yield curve. But when there is an overall shortage of
arbitrage capital, liquidity supply becomes limited across the board, and our noise measure is
uniquely designed to capture this effect.10 Consequently, we expect the noise measure to be
more reflective of the overall liquidity supply in the Treasury market but less so of liquidity
demand.
The paper proceeds as follows. Section 2 describes the construction of our noise measure
from Treasury prices. In Section 3, we report the time series properties of the noise measure,
focusing in particular on its variation through various crises and its connection with other
measures of market liquidity. In Section 4, we provide the cross-sectional tests on our noise
measure as a liquidity risk factor using returns on hedge funds and use the pricing results
to explain currency carry profits. Section 5 concludes. In the appendix, we investigate the
robustness of our main results with respect to curve-fitting methods.
9A common shift in the buying or selling of Treasury securities will cause a shift in the yield curve ratherthan average noise.
10This unique feature of our noise measure also sets itself apart from measures such as on-the-run premiums,which focus only on a few isolated points on the yield curve. Not surprisingly, we find that our noise measureis much more informative about the overall liquidity condition in the market.
6

2 Constructing the Noise Measure
2.1 Treasury Data
We use the CRSP Daily Treasury database to construct our noise measure. The main variable
we use from the dataset is the daily cross-sections of end-of-day bond prices from 1987 through
2011. The dataset itself starts from January 1962, but we choose to start the sample from
1987 due to considerations over both data quality and the sample period of interest. In
particular, we will test our noise measure using hedge fund data, which is available only from
1990. Our sample consists of Treasury bills, notes and bonds that are noncallable, non-flower
and with no special tax treatment. Observations with obvious pricing errors such as negative
prices, negative yields, or negative bid/ask spreads are deleted from the sample. We dropped
Treasury securities with remaining maturities less than 1 month because of the potential
liquidity problems. We also drop bonds with maturity longer than 10 years to base our noise
measure on notes and bonds with maturity between 1 and 10 years. For bonds with maturity
long than 10 years, we have fewer observations and the fitted yield curve becomes less reliable.
Table 1 provides the details of our bond sample. On average, we have 163 bonds (including
notes) and bills every day to fit the yield curve and 109 bonds with maturity between 1 and
10 years to construct the noise measure. The cross-section varies over time, with a noticeable
dip around late 1990s and early 2000s. This coincided with record surpluses of US government
and the reduction of gross issuance of Treasury notes and bonds, which fell by 54 percent from
1996 to 2000. Also reported are the key characteristics of the bonds used in constructing the
noise measure. For example, the average maturity of the bonds is 3.85 years and the average
age of the bonds is 3.96 years. Over time, both variables remain stable, alleviating the concern
that the time-series variations in bond characteristics such as maturity and age might cause
the time-series variation in our noise measure. Also reported in Table 1 is the average spread
between bid and ask yields of the bonds used in our noise construction. The average bid/ask
spread is 2.11 basis points, with a decreasing time trend that is caused by both improved
liquidity in the market and improved data quality. In particular, after October 16, 1996, the
source for price quotations of the CRSP Treasury database changed to GovPX, which receives
its data from 5 inter-dealer bond brokers, who broker transactions among 37 primary dealers.
For most of the bond characteristics reported in Table 1, the cross-sectional mean and median
are close, indicating that the cross-section of bonds is unlikely to be dominated by a few bonds
with extremely different characteristics.
7

Tab
le1:
CR
SP
Tre
asu
ryD
ata
Sum
mary
Sta
tist
ics
Sam
ple
#bo
nds
#bo
nds
Cou
pon
Size
Bid
/Ask
Mat
urity
Age
Dur
atio
nP
rice
Yie
ldPer
iod
(1M
-10Y
)(1
Y-1
0Y)
(%)
($B
)(b
ps)
(yea
r)(y
ear)
(yea
r)($
)(%
)
mea
n19
87-1
990
170
115
9.37
7.64
3.99
3.89
3.43
3.15
103.
278.
0619
91-1
995
185
126
7.88
10.3
52.
613.
883.
683.
2110
6.48
5.85
1996
-200
017
111
17.
1612
.72
1.93
3.63
4.57
3.09
104.
715.
7420
01-2
005
111
665.
1919
.83
1.27
3.65
4.12
3.24
105.
033.
2320
06-2
011
178
124
4.05
24.2
21.
304.
143.
893.
6810
5.87
2.67
ALL
163
109
6.52
15.6
12.
113.
853.
963.
2910
5.18
4.90
med
ian
1987
-199
08.
947.
513.
593.
422.
412.
9510
1.75
8.07
1991
-199
57.
689.
842.
093.
322.
472.
9610
4.36
5.87
1996
-200
06.
3712
.98
1.63
3.02
2.81
2.72
101.
415.
7420
01-2
005
4.84
20.0
51.
022.
942.
442.
7210
3.60
3.13
2006
-201
13.
8123
.54
1.03
3.55
1.87
3.33
103.
302.
57A
LL
6.12
15.4
21.
773.
252.
382.
9510
2.95
4.86
stan
dard
devi
atio
n19
87-1
990
2.10
3.76
1.96
2.26
3.26
1.53
6.23
0.24
1991
-199
52.
055.
661.
532.
363.
681.
639.
320.
5519
96-2
000
2.31
7.76
1.06
2.25
4.84
1.66
8.93
0.15
2001
-200
52.
209.
210.
752.
424.
711.
946.
160.
6020
06-2
011
1.87
10.5
20.
872.
505.
861.
9810
.47
0.55
ALL
2.10
7.65
1.19
2.37
4.57
1.77
8.40
0.43
Bon
dsw
ith
mat
urity
rang
ing
from
(1M
-10Y
)ar
eus
edfo
ryi
eld
curv
efit
ting
,w
hile
bond
sw
ith
mat
urity
rang
ing
from
(1Y
-10Y
)ar
eus
edto
cons
truc
tth
eno
ise
mea
sure
.A
llot
her
vari
able
sar
ere
port
edfo
rth
esa
mpl
eof
bond
sus
edto
cons
truc
tth
eno
ise
mea
sure
,an
dre
port
edar
eth
etim
e-se
ries
aver
ages
ofth
ecr
oss-
sect
iona
lm
ean,
med
ian,
and
stan
dard
devi
atio
n.T
hesi
zeof
abo
ndis
its
amou
ntou
tsta
ndin
gin
billi
ons
ofdo
llars
.T
hebi
d/as
ksp
read
isth
ebi
dyi
eld
min
usth
eas
kyi
eld.
8

2.2 Curve Fitting
Various estimation methods can be employed to back out zero-coupon yield curves from
coupon-bearing Treasury securities. These approaches can be broadly classified into spline-
based and function-based models. Spline-based methods rely on piecewise polynomial func-
tions that are smoothly joined at selected knots to approximate the yield curve. Function-
based models, on the other hand, use a single parsimonious parametric function to describe
the entire yield curve. In this section, we will employ a function-based model, and later in the
appendix, we will revisit the issue of curve fitting. We will employ a variety of spline-based
methods to reconstruct our noise measure and check the robustness of our main results. We
will show that our main results are not specific to the particular curve-fitting method em-
ployed here. Instead, they are quite robust to various curve-fitting methods and the main
insight of our paper is quite general.
Popular models in the class of function-based models include Nelson and Siegel (1987)
and Svensson (1994). We choose the Svensson model because of its improved flexibility over
the Nelson-Siegel model. The Svensson model assumes the following functional form for the
instantaneous forward rate f :
f (m, b) = β0 + β1 exp
(−m
τ1
)+ β2
m
τ1exp
(−m
τ1
)+ β3
m
τ2exp
(−m
τ2
), (1)
where m denotes the time to maturity and b = (β0 β1 β2 β3 τ1 τ2) are model parameters to be
estimated. Given that f → β0 as m → ∞ and f → β0 + β1 as m → 0, it follows that β0
represents the forward rate at infinitely long horizon, and β0 + β1 represents the forward rate
at maturity zero. In addition, (β2, τ1) and (β3, τ2) control the “humps” of the forward rate
curve, while β2 and β3 determine the magnitude and direction of the humps, and τ1 and τ2
affect the position of the humps. Finally, in order to model nominal interest rates, a proper
set of parameters must satisfy the conditions that β0 > 0, β0 + β1 > 0, τ1 > 0 and τ2 > 0.
Using the parameterized forward curve, we can derive the corresponding zero-coupon yield
curve, which can then be used to price any coupon-bearing bonds. Conversely, we can use
market prices of such bonds to back out the model parameters b. Specifically, on each day
t, the inputs of our curve fitting are the market closing prices (mid bid/ask quotes) of all
Treasury bills and bonds in our sample with maturity between one month and ten years. The
output of the curve fitting on that day is the vector of model parameters bt, and the details
of curve fitting are as follows.
Let Nt be the number of bonds and bills available on day t for curving fitting and let
P it , i = 1, . . . , Nt, be their respective market observed prices. We choose the model parameters
bt by minimizing the weighted sum of the squared deviations between the actual and the
9

model-implied prices:
bt = argminb
Nt∑i=1
[(P i(b) − P i
t ) ×1
Di
]2
, (2)
where P i(b) is the model-implied price for bond i given model parameters b and Di is the
MaCaulay’s duration for bond i.11 Following the standard practice in the yield curve fitting
literature, we weight the price deviations by the inverse of bond duration. Effectively, we are
minimizing pricing errors in the yield space.12
2.3 Noise Measure
We construct our noise measure using the zero-coupon curve backed out from the daily cross-
section of bonds and bills. For each date t, let bt be the vector of model parameters backed out
from the data. Suppose that, on date t, there are Nt Treasury bonds with maturity between
1 and 10 years. For each of these Nt bonds, let yit denote its market observed yield, and let
yi(bt) denote its model-implied yield. As a measure of dispersions in yields around the fitted
yield curve, we construct our noise measure by calculating the root mean squared distance
between the market yields and the model-implied yields:13
Noiset =
√√√√ 1
Nt
Nt∑i=1
[yit − yi(bt)]
2. (3)
Unlike in curving fitting, where qualified bonds and bills with maturity between 1 month and
10 years are used, we use only bonds with maturity between one and ten years in constructing
the noise measure. While short-maturity bonds and bills are needed for fitting the short
end of the yield curve, we feel that their information content is limited with respect to the
availability of arbitrage capital in the overall market. This is because the short end of the yield
curve is known to be noisier than other parts of the yield curve, primarily due to temporary
demand/supply fluctuations in that segment of of the market. Moreover, the short end is
unlikely to be the object of arbitrage capital, which is the main motivation of our noise
measure. While the longer maturity bonds might be useful to further capture the effect
11We use the daily MaCaulay’s duration reported by CRSP.12Unlike minimizing directly in the yield space, this approach has the advantage of avoiding large computing
costs required by numerically converting prices into yields. In an earlier version of our paper, we also performedcurve fitting by minimizing pricing errors without duration weights. Our main results are robust with respectto both curve fitting approaches.
13In addition to measuring noise in the yield space, we also experimented with using squared pricing errorsscaled by duration, as in equation (2). Our main results are robust to both approaches of noise measures.
10

of fixed-income relative value trades, the supply of these bonds is not as stable and might
introduce unnecessary time-series noise to our measure.14 For this reason, we exclude bonds
with maturity longer than 10 years in constructing the noise measure.
To avoid having the pricing errors of one or two bonds driving the noise measure, we
also put in place a filter. Specifically, given the daily cross-section of bonds and their pricing
errors, we calculate the cross-sectional dispersion in pricing error in the yield space. Any bond
with yield to maturity 4 standard deviations away from the model yield is excluded from the
construction of the noise measure. In practice, this is a rather mild filter and affects only
one or two bonds when triggered. More specifically, from 1987 through 2011, this filter was
triggered on 24.4% of the days to remove one bond each day, on 8.0% of the days to remove
two bonds each day, on 2.7% of the days to remove three bonds each day, and on 0.67% of
the days to remove four bonds each day. There was no incident when this filter removed
more than four bonds. As reported in Table 1, there are on average 105 bonds contributing
to the daily noise measure. Consequently, the noise measure is a collective measure of the
entire yield curve and should not be driven by only one or two bonds. This additional filter
allows us to take out the few outliers that were missed in our initial sample cleaning process.
Indeed, as the data quality improves over time, this filter was triggered even less frequently.
For example, from 1994 through 2011, the sample period during which we will later perform
our pricing tests using hedge-fund returns, this filter was triggered only on 20.34% of the days
to remove one bond, 1.80% of the days to remove two bonds, and only once to remove three
bonds. There was no incident when this filter removed more than three bonds over this sample
period.15
To further illustrate the construction of our noise measure and the information content it
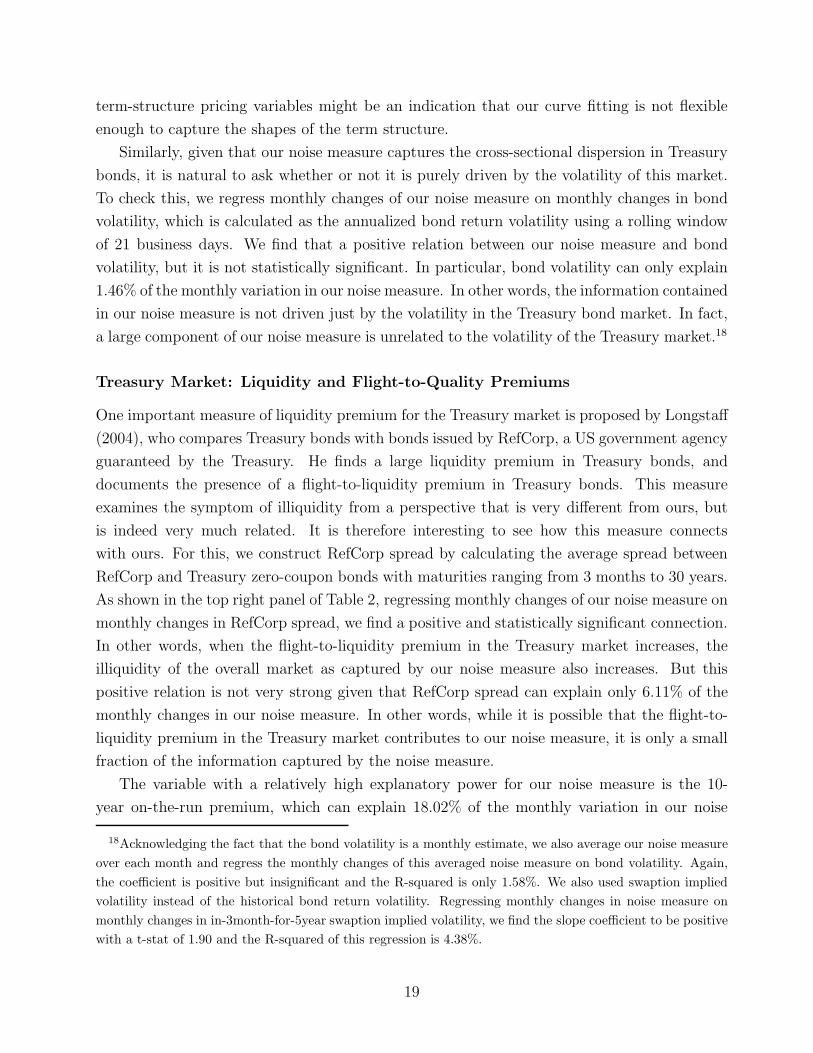
is supposed to capture, we plot in Figure 1 several examples of par-coupon yield curves and
the market-observed bond yields. The top left panel in Figure 1 plots three random days in
1994, which represent normal days in terms of curve fitting. As can be seen, our curve fitting
method does a reasonable job. The other panels in Figure 1 focus on the days surrounding five
events including the 1987 stock market crash, the 1998 LTCM crisis, the September 11, 2001
terrorist attack, the 2005 GM/Ford downgrade, and the Lehman default in September 2008.
For all of these events, we see significant increases in our noise measure. More importantly,
as shown in the cross-sectional plots, the sudden increases were not the result of poor curve
14For example, issuance of the 30-year Treasury bonds was suspended for a four and a half year periodstarting October 31, 2001 and concluding February 2006.
15To understand the robustness of our hedge-fund pricing results, we also experimented with cutoffs of othermagnitudes. For example, our hedge fund results still hold with a threshold of 6 standard deviations, whenthe winsorizing removes, at a monthly frequency, only one bond (out of the cross-section of over 100 bonds)5 times (out of the full sample of 216 months).
11

1 2 3 4 5 6 7 8 9 103.5
4.0
4.5
5.0
5.5
6.0
6.5
7.0
7.5
8.0
maturity
yiel
ds (%
)
Three Normal Days in 1994
19940201; N=2.8284
19940602; N=3.2907
19941201; N=2.7833
1 2 3 4 5 6 7 8 9 107.0
7.5
8.0
8.5
9.0
9.5
10.0
10.5
maturity
yiel
ds (%
)
1987 Stock Market Crash
19871016; N=4.449
19871019; N=13.3148
19871021; N=7.483
1 2 3 4 5 6 7 8 9 104.4
4.6
4.8
5.0
5.2
5.4
5.6
5.8
6.0
maturity
yiel
ds (%
)
1998 LTCM Crisis
19980501; N=1.9233
19980817; N=2.6868
19980923; N=3.508
1 2 3 4 5 6 7 8 9 102.5
3.0
3.5
4.0
4.5
5.0
maturity
yiel
ds (%
)
September 11, 2001
20010910; N=3.1378
20010921; N=12.5377
20010924; N=4.6793
1 2 3 4 5 6 7 8 9 103.2
3.4
3.6
3.8
4
4.2
4.4
4.6
4.8
maturity
yiel
ds (%
)
2005 GM/Ford Downgrade
20050315; N=1.3177
20050505; N=2.7793
20050524; N=2.545
1 2 3 4 5 6 7 8 9 101.0
1.5
2.0
2.5
3.0
3.5
4.0
4.5
maturity
yiel
ds (%
)
2008 Financial Crisis
20080912; N=5.9698
20080915; N=6.6368
20081031; N=17.5037
Figure 1: Examples of par-coupon yield curves and the market-observed bond yields, marked by “x”,“o”, or “+”. The top left panel plots three random days in 1994, and the other five panels focus onthe days surrounding five events: the 1987 stock market crash, the 1998 LTCM crisis, the September11, 2001 terrorist attack, the 2005 GE/Ford downgrade, and the Lehman default in September 2008.Marked in the legends are the date of observation and the level of the noise measure for that day.
12

fitting on these event days. Instead, they were caused by high levels of dispersion in bond
yields across the entire yield curve. In fact, a closer examination of this dispersion seems to
indicate comovement in dispersion within various bond habitats.
3 Time-Series Properties
3.1 Noise as Information for Liquidity Crises
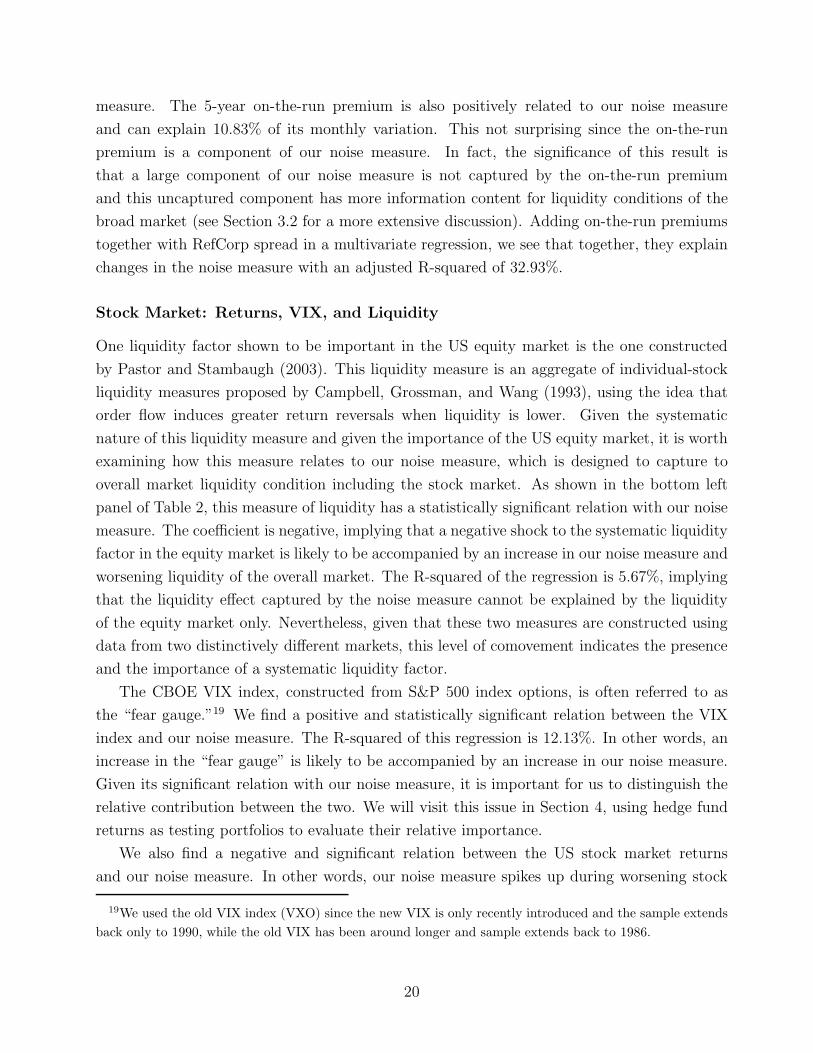
The daily time-series variation of our noise measure is plotted in Figure 2. The most interesting
aspect of this plot is the rich information content embedded in a variable that has been
traditionally treated as just noise or pricing errors. During normal times, the noise measure
fluctuates around its time-series average of 3.61 basis points with a standard deviation of 2.17
basis points, and it is highly persistent, with a daily autocorrelation of 98.11% and a monthly
autocorrelation of 90.75%. This level of noise and its fluctuation is in fact comparable to the
average spread between bid and ask yields of 2.11 basis points for the same sample of bonds.
In other words, the arbitrage capital on the yield curve is effective in keeping the deviations
within a range that is unattractive given the transaction cost.
During crises, however, our noise measure spikes up much more prominently than the
bid/ask spread, implying a high degree of mis-alignment in the yield curve that would have
been attractive for relative value trading during normal times and are in fact attractive given
the contemporaneous transaction cost. This includes the 1987 crash, when the noise was over
13 basis points; the aftermath of the LTCM crisis, when the noise peaked at 5.89 basis points;
the first trading day after 9/11 terrorist attack, when the noise was at 12.54; the days following
the sale of Bear Stearns to JPMorgan, when the noise was peaked at 8.08 basis points; and the
aftermath of Lehman default, when the noise was above 15 basis points for a sustained period
of time. Given its sample standard deviation of 2.17 basis points, these are large deviations
away from the mean.
Another interesting aspect captured by our noise measure is that while some liquidity
events, such as the 1987 crash or the 9/11 terrorist attack, are short lived, others take much
longer to play out. The Savings & Loan crisis in the late 80’s and early 90’s is one such example,
and the aftermath of the Lehman default on September 15, 2008 is another example. Figure 3
provides a closer examination of our noise measure during the period after Lehman default. It
shows that when Lehman defaulted on Monday, September 15, 2008, the noise measure was at
6.64, which was about one standard deviation above the historical mean. Compared with the
Friday before when the noise measure stood at 5.97, it was only a mild increase, especially give
the severity of the event.16 But as shown in Figure 3, the Lehman event was the beginning of
16From 1987 to 2011, the sample standard deviation of daily changes in noise measure is 0.42 basis points.
13

1990 1995 2000 2005 20100
5
10
15
20
25N
oise
(bp
s)
’87 Crash
FIRREA RTC
Fed
rate
hike
UK
currency
crisis
MEX
Peso
LTCM
Asia
dotcom
peak
9/11
GM/Ford
BSC
hedge
funds
BSC
LEH
Figure 2: Daily time-series of the noise measure (in basis points).
a cycle of worsening liquidity that lasted until late April and early May of 2009, when Federal
Reserve announced and implemented stress tests for large U.S. banks. During this period of
liquidity crisis, the noise measure had two noticeable peaks whose magnitudes dwarfed any of
the previous crises. The first one was in early November when it peaked at 19.85 on November
6, days after Treasury and Fed injected $125 billion of capital into 9 large US Banks via the
Capital Purchase Program (CPP), and the creation of the Commercial Paper Funding Facility
(CPFF). The second one was at the middle of December when the noise measure peaked at
20.47 on December 10 as concerns over the financial crisis deepened. Overall, this period was
when the crisis was at its worst and this fact was captured by our noise measure.
It is worth emphasizing that our noise measure comes from the U.S. Treasury bond market
— the one with the highest credit and liquidity quality and is the number one safe haven during
crises, and yet it was able to reflect liquidity crises of varying origins and magnitudes. In this
14

Sep Oct Nov Dec Jan Feb Mar Apr May4
6
8
10
12
14
16
18
20
22
Lehman
AIG$85B
TARP Proposal
WaMu
TARP DefeatedTARP Passed
Rate Cut
G7 Met (No Concrete Plan)
Record FRB Reserves ($441B)
CPP $125B(9 Banks)
↓Stimulus Passed House
Stimulus Passed Senate
Stimulus PassedCongress
↑Outlines of Stress Test
Rate Cut
CPP $33.5B
CPFF(announced)
CPFF (created)
MBSPurchase(announced)
MBSPurchase
Noi
se (
bps)
The Aftermath of Lehman
Figure 3: Daily time-series of the noise measure in late 2008 and early 2009. TARP: Troubled
Asset Relief Program; CPP: Capital Purchase Program; CPFF: Commercial Paper Funding
Facility; and the MBS Program is Fed’s $1.25 trillion program to purchase agency mortgage-
backed securities.
respect, what is captured in our noise measure is not the liquidity concerns specific to the
Treasury market, but liquidity conditions across the overall financial market.
3.2 Noise and the On-the-Run Premium
One popular measure of liquidity with respect to the Treasury market is the on-the-run and
off-the-run premium: the just issued (on-the-run) Treasury bond enjoys a price premium,
therefore lower yield, compared to old bonds with similar maturities. Since our noise measure
is a daily aggregate of cross-sectional pricing errors, the on-the-run premium is in fact a
component of our measure. Calculating the correlation between daily changes of our noise
measure and daily changes of the on-the-run premium, we find that the correlation is 5.7%
15

and 9.3%, respectively, for the five- and ten-year on-the-run premiums. Repeating the same
calculation at a month frequency, the correlation increases to 33.4% and 42.8%, respectively.
Overall, we see a positive relationship between our noise measure and the on-the-run premium,
which is relatively small at the daily frequency but grows larger at the monthly frequency.
Moreover, while the noise measure is on average smaller than the on-the-run premium,
it tends to spike up much more significantly during crises. For example, on October 19,
1987, the noise measure was 4.47 standard deviations above its sample average, while the
five-year on-the-run premium was 0.51 standard deviations above from its sample average and
the ten-year on-the-run premium was 0.04 standard deviation below its sample average. On
September 21, 2001, the first bond trading day after the terrorist attack, our noise measure
was 4.11 standard deviations above while the five- and ten-year on-the-run premiums were
0.58 and 1.58 standard deviations above, respectively. On October 15, 2008, when the crisis
after Lehman’s default deepened, our noise measure was 4.34 standard deviations above while
the ten-year premium was 4.63 standard deviations above and the five-year premium was 0.64
standard deviation below its sample average.
This comparison between our noise measure and the on-the-run premium is instructive as
it accentuates the important fact that the information captured by our noise measure is a
collective information over the entire yield curve.17 The fact that our noise measure spikes
up during liquidity crises much more prominently than the on-the-run premiums implies that
there is commonality in the pricing errors across the entire yield curve. And the heightened
commonality during crises is reflected in noisy and mis-aligned yield curves, which are captured
by our noise measure. This is how noise could become informative. By contrast, a couple
of isolated points on the yield curve as captured by the on-the-run premiums will not be as
informative.
3.3 Noise and Other Measures of Liquidity
To further investigate the connection between our noise measure and other measures of market
liquidity, we report in Table 2 results of OLS regression of monthly changes in our noise
measure on several important market variables. The regressions are done first univariately,
and then in multivariate form in the last column to compare their relative contribution. The
pairwise correlations of monthly changes of these variables are reported in Table 3.
17This observation sets our paper apart from the recent work by Musto, Nini, and Schwarz (2011) andLamoureux and Theocharides (2012), who focus on the relative pricing in the market for 10-year Treasurynotes. Consistent with our finding, both paper find substantial pricing deviations in the 10-year region duringthe recent financial crisis. Over the entire sample, however, the information content of our measure differsfrom theirs exactly because our measure is a collective information over the entire yield curve.
16

Tab
le2:
Month
lyC
hanges
ofN
ois
eM
easu
reR
egre
ssed
on
Oth
er
Mark
et
Vari
able
s
Tre
asury
:Lev
el,Slo
pe
and
Vol
atility
(1)
(2)
(3)
(4)
ΔT
B3M
-0.8
23-0
.439
[-2.
64]
[-1.
67]
ΔTer
m0.
010
0.00
7[2
.40]
[1.6
3]
ΔB
ondV
0.08
20.
046
[1.5
7][0
.77]
Adj
R2
(%)
4.66
5.64
1.78
6.98
#m
onth
299
299
299
299
On-t
he-
Run
Pre
miu
ms
and
Ref
Cor
p(1
)(2
)(3
)(4
)
ΔO
n5Y
0.10
40.
062
[5.5
5][2
.44]
ΔO
n10Y
0.08
80.
090
[2.4
9][2
.41]
ΔR
efC
orp
0.02
90.
028
[3.2
5][3
.60]
Adj
R2
(%)
10.8
318
.02
6.11
32.9
3#
mon
th29
929
924
824
8
Sto
ckM
arke
t:R
et,V
IX,an
dLiq
uid
ity
(1)
(2)
(3)
(4)
Stoc
kRet
-0.0
70-0
.040
[-2.
82]
[-1.
98]
ΔV
IX0.
065
0.04
2[2
.96]
[2.3
2]
ΔP
SLiq
-3.1
0-1
.35
[-3.
35]
[-1.
87]
Adj
R2
(%)
11.7
912
.13
4.21
16.6
5#
mon
th29
929
728
728
5
Rep
o,LIB
OR
and
Def
ault
(1)
(2)
(3)
(4)
ΔR
epo
-0.4
45-0
.309
[-3.
01]
[-2.
72]
ΔLIB
OR
0.00
70.
004
[3.2
4][1
.37]
ΔD
efau
lt0.
027
0.02
9[2
.12]
[2.1
1]
Adj
R2
(%)
3.43
3.25
13.0
021
.06
#m
onth
247
299
299
247
Rep
orte
dar
eO
LS
regr
essi
onco
effici
ents
with
New
ey-W
est
t-st
at’s
insq
uare
dbr
acke
ts.
On5
Yan
dO
n10Y
are
the
on-t
he-r
unpr
emiu
ms
for
5-ye
aran
d10
-yea
rbo
nds.
TB
3Mis
the
3-m
onth
Tbi
llra
te.
Rep
ois
the
over
nigh
tge
nera
lco
llate
ralre
pora
tes.
LIB
OR
isth
esp
read
of3-
mon
thLIB
OR
over
3-m
onth
Tbi
ll.D
efau
ltis
the
yiel
dsp
read
betw
een
Baa
and
Aaa
bond
indi
ces.
VIX
isth
evo
latilit
yin
dex
from
CB
OE
.R
efC
orp
isth
eav
erag
esp
read
betw
een
Tre
asur
yan
dR
efco
rpze
ro-c
oupo
nbo
nds.
ΔP
SLiq
isth
ein
nova
tion
sin
the
liqui
dity
fact
orby
Pas
tor
and
Stam
baug
h.St
ockR
etis
the
mon
thly
retu
rnon
the
CR
SPva
lue-
wei
ghte
din
dex.
Bon
dVis
the
annu
aliz
edre
turn
vola
tilit
yof
mon
thly
bond
retu
rns
calc
ulat
edfr
om5-
year
Tre
asur
yyi
elds
usin
ga
rolli
ngw
indo
wof
21bu
sine
ssda
ys.
Ter
mis
spre
adof
10-
over
1-ye
arTre
asur
yyi
elds
.
17

Table 3: Pairwise Correlations (in %)
2 3 4 5 6 7 8 9 10 11 12 13
1 ΔNoise -22 33 43 15 24 -20 25 19 36 35 -21 -352 ΔTB3M -18 -14 -25 -50 39 -12 -38 -14 -25 27 173 ΔOn5Y 13 30 17 -15 5 14 -7 29 -23 -254 ΔOn10Y -6 14 0 1 6 24 20 -11 -145 ΔBondV 21 -24 21 24 -5 29 -30 -126 ΔTerm -32 6 12 -6 4 -15 -47 ΔRepo -19 -19 -9 -2 11 -08 ΔRefCorp 17 21 5 -23 -79 ΔLIBOR 8 25 -17 -2210 ΔDefault 23 -2 -3111 ΔVIX -29 -6912 ΔPSLiq 3113 StockRet
Pairwise correlations are computed using monthly changes from 1987 through 2011 andreported in percentage. See Table 2 for definitions of variables.
Treasury Market: Level, Slope and Volatility
First, we examine the connection between our noise measure and the Treasury market variables
including the level, slope, and volatility of interest rates. Since our noise measure is computed
as pricing errors in yields, it is important to make sure that the time-variation in the noise
measure is not caused by time-variations in interest rates. Results are summarized in the
top left panel of Table 2. Regressing monthly changes of our noise measure on monthly
changes in three-month TBill rates, we find a negative and statistically significant relation.
This implies increasing illiquidity during decreasing short rates, which is consistent with the
fact that liquidity in the overall market typically worsens during episodes of flight to quality
and decreasing interest rates. The explanatory power of the short rate for our noise measure,
however, is rather limited. As shown in Table 2, the R-squared of the regression is only 4.66%.
Another important factor in the Treasury market is the slope of the term structure, which is
labeled as Term in Table 2. We find a positive relation between our noise measure and the
term spread, which is consistent with the observation that the slope of the term structure
steepens in the depth of economic recessions. This connection, however, is not very strong
and the R-squared of the regression is only 5.64%.
Overall, although our noise measure is constructed using pricing data in the Treasury
market, its connection to the time-variation in bond yields is not very strong. In fact, this is a
good indication for the “purity” of our noise measure. Otherwise, high correlations with such
18
term-structure pricing variables might be an indication that our curve fitting is not flexible
enough to capture the shapes of the term structure.
Similarly, given that our noise measure captures the cross-sectional dispersion in Treasury
bonds, it is natural to ask whether or not it is purely driven by the volatility of this market.
To check this, we regress monthly changes of our noise measure on monthly changes in bond
volatility, which is calculated as the annualized bond return volatility using a rolling window
of 21 business days. We find that a positive relation between our noise measure and bond
volatility, but it is not statistically significant. In particular, bond volatility can only explain
1.46% of the monthly variation in our noise measure. In other words, the information contained
in our noise measure is not driven just by the volatility in the Treasury bond market. In fact,
a large component of our noise measure is unrelated to the volatility of the Treasury market.18
Treasury Market: Liquidity and Flight-to-Quality Premiums
One important measure of liquidity premium for the Treasury market is proposed by Longstaff
(2004), who compares Treasury bonds with bonds issued by RefCorp, a US government agency
guaranteed by the Treasury. He finds a large liquidity premium in Treasury bonds, and
documents the presence of a flight-to-liquidity premium in Treasury bonds. This measure
examines the symptom of illiquidity from a perspective that is very different from ours, but
is indeed very much related. It is therefore interesting to see how this measure connects
with ours. For this, we construct RefCorp spread by calculating the average spread between
RefCorp and Treasury zero-coupon bonds with maturities ranging from 3 months to 30 years.
As shown in the top right panel of Table 2, regressing monthly changes of our noise measure on
monthly changes in RefCorp spread, we find a positive and statistically significant connection.
In other words, when the flight-to-liquidity premium in the Treasury market increases, the
illiquidity of the overall market as captured by our noise measure also increases. But this
positive relation is not very strong given that RefCorp spread can explain only 6.11% of the
monthly changes in our noise measure. In other words, while it is possible that the flight-to-
liquidity premium in the Treasury market contributes to our noise measure, it is only a small
fraction of the information captured by the noise measure.
The variable with a relatively high explanatory power for our noise measure is the 10-
year on-the-run premium, which can explain 18.02% of the monthly variation in our noise
18Acknowledging the fact that the bond volatility is a monthly estimate, we also average our noise measureover each month and regress the monthly changes of this averaged noise measure on bond volatility. Again,the coefficient is positive but insignificant and the R-squared is only 1.58%. We also used swaption impliedvolatility instead of the historical bond return volatility. Regressing monthly changes in noise measure onmonthly changes in in-3month-for-5year swaption implied volatility, we find the slope coefficient to be positivewith a t-stat of 1.90 and the R-squared of this regression is 4.38%.
19
measure. The 5-year on-the-run premium is also positively related to our noise measure
and can explain 10.83% of its monthly variation. This not surprising since the on-the-run
premium is a component of our noise measure. In fact, the significance of this result is
that a large component of our noise measure is not captured by the on-the-run premium
and this uncaptured component has more information content for liquidity conditions of the
broad market (see Section 3.2 for a more extensive discussion). Adding on-the-run premiums
together with RefCorp spread in a multivariate regression, we see that together, they explain
changes in the noise measure with an adjusted R-squared of 32.93%.
Stock Market: Returns, VIX, and Liquidity
One liquidity factor shown to be important in the US equity market is the one constructed
by Pastor and Stambaugh (2003). This liquidity measure is an aggregate of individual-stock
liquidity measures proposed by Campbell, Grossman, and Wang (1993), using the idea that
order flow induces greater return reversals when liquidity is lower. Given the systematic
nature of this liquidity measure and given the importance of the US equity market, it is worth
examining how this measure relates to our noise measure, which is designed to capture to
overall market liquidity condition including the stock market. As shown in the bottom left
panel of Table 2, this measure of liquidity has a statistically significant relation with our noise
measure. The coefficient is negative, implying that a negative shock to the systematic liquidity
factor in the equity market is likely to be accompanied by an increase in our noise measure and
worsening liquidity of the overall market. The R-squared of the regression is 5.67%, implying
that the liquidity effect captured by the noise measure cannot be explained by the liquidity
of the equity market only. Nevertheless, given that these two measures are constructed using
data from two distinctively different markets, this level of comovement indicates the presence
and the importance of a systematic liquidity factor.
The CBOE VIX index, constructed from S&P 500 index options, is often referred to as
the “fear gauge.”19 We find a positive and statistically significant relation between the VIX
index and our noise measure. The R-squared of this regression is 12.13%. In other words, an
increase in the “fear gauge” is likely to be accompanied by an increase in our noise measure.
Given its significant relation with our noise measure, it is important for us to distinguish the
relative contribution between the two. We will visit this issue in Section 4, using hedge fund
returns as testing portfolios to evaluate their relative importance.
We also find a negative and significant relation between the US stock market returns
and our noise measure. In other words, our noise measure spikes up during worsening stock
19We used the old VIX index (VXO) since the new VIX is only recently introduced and the sample extendsback only to 1990, while the old VIX has been around longer and sample extends back to 1986.
20

market conditions. The R-squared of this regression is 11.79%, Adding the Pastor-Stambaugh
stock market liquidity measure together with the VIX index and stock market returns in a
multivariate regression, we find that they can explain the changes in the noise measure with
an adjusted R-squared of 16.65%.
Credit Market: Default and LIBOR Spreads
The bottom right panel of Table 2 examines the connection between our noise measure and
default spreads, measured as the difference in yield between Baa and Aaa rated bonds. We
find a positive and significant relation, and the R-squared of the regression is 13%. This result
is consistent with the possibility that liquidity risk is an important component of the observed
default spreads. We perform a bi-variate OLS regression by including both the default spreads
and the VIX index — two variables with high explanatory power for our noise measure and
are often used as proxies for liquidity. We find the slope coefficients for both variables to be
positive and statistically significant, and the adjusted R-squared is 20.21%. In other words,
these popular proxies of liquidity are both related to our noise measure, but can explain only
a very limited amount of the time variation of our noise measure.20
Table 2 also reports the connection with overnight general collateral Repo rates and LIBOR
spreads. Overall, the results are in the expected direction. For example, our noise measure
increases with increasing LIBOR spreads, while our noise measure is negatively related with
the repo rates. Including the Repo rates, LIBOR spreads, and default spreads in a multi-
variate regression, we find that the repo rates and default spreads remain significant and the
adjusted R-squared of the regression is 21.06%.
All Together
Finally, when the 5-year and 10-year on-the-run premiums, the RefCorp spread, the VIX
index, stock market returns, the Pastor-Stambaugh liquidity factor, and default spreads are
put together in one regression, they can collectively explain 43.7% of the monthly variation
of our noise measure. In other words, over 50% of the uncertainty in our noise measure is left
unexplained. Our results in the next section will show that it is this unexplained component
that is important in explaining cross-sectional hedge fund returns.
20Indeed, as will be shown later in Section 4, our noise measure has important pricing implications andcommands a significant risk premium. Moreover, this result remains robust using a component of our noisemeasure that is orthogonal to VIX and default spreads. By contrast, we do not find strong pricing implicationsfor VIX or default spreads.
21

4 Cross-Sectional Pricing Tests
Our noise measure is designed to capture the lack of liquidity in the overall market. The
empirical evidences provided so far indicate that this noise measure indeed does a good job
in capturing the aggregate liquidity risk. Given the systematic nature of this risk, we now
investigate its asset-pricing implications, particularly its impact on asset returns. In order
to better identify this impact, we need to consider returns that are potentially sensitive to
the market-wide liquidity shocks. For this purpose, we employ two sets of returns for our
tests. The first set consists of returns on hedge funds, whose trading activities cover a broad
spectrum of asset classes and whose capital adequacy is a good representation of the amount
of arbitrage capital available in the market. The second set of returns are those from currency
carry trades, which are also known to be connected with the overall arbitrage capital in the
market.
4.1 Hedge Fund Returns as Test Portfolios
Hedge Fund Data
We obtain hedge fund returns, assets under management (AUM), and other fund character-
istics from the Lipper TASS database. The TASS database divides funds into two categories:
“Live” and “Graveyard” funds. The “Live” hedge funds are active ones as of the latest up-
date of the TASS database, in our case February 2012. Hedge funds are listed as “Graveyard”
funds when they stop reporting information to the database. Fund managers may decide not
to reporting their performance for a number of different reasons such as liquidation, merger
or closed to new investment. Although TASS has been collecting data since late 1970s, the
Graveyard database was created much later in 1994. We thus choose our sample period from
1994 through 2011 to mitigate the impact of survivorship bias.
We only include funds that report returns net of various fees in US dollars on a monthly
basis, which covers a majority of the funds in TASS. We also require that each fund has at
least $10 million assets under management, and at least 24 months of return history during
our sample period. This ensures that we have a sample of hedge funds of reasonable size and
each fund has a long enough time-series for meaningful regression results.21 The details of our
hedge fund sample are summarized in Table 4.
21As mentioned in Cao, Chen, Liang, and Lo (2010), smaller funds with AUM less than $10 million are ofless concern from an institutional investor’s perspective, and they have less impact on the market as well. Butwe do experiment with different size criteria such as $5 million, $50 million, and $100 million. Our main resultregarding the market price of the liquidity risk factor remains robust.
22

Tab
le4:
TA
SS
Hedge
Fund
Data
Sum
mary
Sta
tist
ics
Tot
alG
rave
yard
ret
(%)
stdre
t(%
)A
UM
($M
)iA
UM
($M
)re
por
ting
(mn)
age
(mn)
auto
corr
(#)
(#)
mea
nm
edm
ean
med
mea
nm
edm
ean
med
mea
nm
edm
ean
med
mea
nm
ed
PanelA
:A
llH
edge
Funds
1994
-199
918
5614
331.
811.
234.
473.
5278
.10
26.7
416
.58
5.40
129.
5113
3.00
29.9
121
.50
0.11
0.13
2000
-200
646
0232
010.
870.
762.
932.
0713
6.02
49.4
422
.32
8.18
92.7
879
.00
42.5
928
.00
0.12
0.13
2007
-201
140
8122
460.
210.
213.
832.
9423
4.64
68.2
229
.49
10.0
088
.73
74.0
075
.11
59.5
00.
170.
18
ALL
5392
3557
0.67
0.59
3.68
2.78
160.
2155
.70
26.8
99.
7184
.65
70.0
046
.34
37.5
00.
190.
19
PanelB
:H
edge
Funds
by
Sty
le
Lon
g/Shor
tE
quity
1393
1005
0.88
0.80
4.73
3.98
116.
1949
.09
16.9
26.
4786
.30
72.0
046
.97
38.0
00.
130.
13
Glo
bal
Mac
ro21
514
50.
730.
654.
103.
3531
8.71
53.8
542
.20
8.67
75.0
763
.00
41.8
733
.00
0.07
0.08
Fund
ofFunds
1504
936
0.39
0.38
2.58
2.06
156.
0855
.26
36.3
412
.29
87.7
575
.00
48.1
940
.00
0.24
0.25
Fix
edIn
com
eA
rb17
013
40.
580.
592.
392.
0319
5.14
93.9
527
.83
10.6
780
.56
71.0
042
.21
37.0
00.
220.
19
Man
aged
Futu
res
275
140
0.79
0.72
5.10
4.41
178.
1445
.65
21.4
35.
0310
1.04
76.0
057
.83
43.0
00.
030.
03
Eve
nt
Dri
ven
459
339
0.82
0.73
2.76
2.30
226.
5989
.16
25.4
67.
8092
.68
80.0
050
.49
41.5
00.
250.
24
Equity
Neu
tral
242
191
0.54
0.45
2.61
2.15
98.0
243
.98
25.4
89.
3472
.31
60.0
038
.04
31.2
50.
110.
12
Em
ergi
ng
Mar
kets
436
224
0.80
0.77
5.83
5.20
121.
1548
.85
27.7
110
.70
76.1
263
.00
42.2
034
.50
0.21
0.22
Con
vert
ible
Arb
153
123
0.57
0.58
2.66
1.99
171.
9568
.65
19.9
210
.00
91.1
882
.00
49.0
441
.00
0.38
0.43
Oth
ers
545
320
0.69
0.62
3.33
2.69
201.
3364
.42
32.1
110
.16
72.4
155
.00
39.6
630
.00
0.23
0.22
Hed
gefu
ndre
turn
s(“
ret”
)ar
em
onth
lyne
tof
fees
,and
“std
ret”
isth
est
anda
rdde
viat
ion
ofth
em
onth
lyre
turn
s.“A
UM
”is
the
asse
tun
der
man
agem
ent
inm
illio
nsof
dolla
rs,an
d“i
AU
M”
isth
ein
itia
lA
UM
ofth
ehe
dge
fund
.T
heto
talnu
mbe
rof
mon
ths
ahe
dge
repo
rts
retu
rns
inth
eda
taba
seis
reco
rded
by“r
epor
ting
.”Fo
rea
chfu
ndat
each
mon
tht,
we
also
calc
ulat
eits
“age
t”by
coun
ting
the
num
ber
ofm
onth
sfr
omits
ince
ptio
nto
mon
tht.
Als
ore
port
edar
eth
efir
st-o
rder
auto
-cor
rela
tion
s(a
uto
corr
)of
hedg
efu
nds’
mon
thly
retu
rns.
23

Portfolio Formation by Noise Betas
We follow the standard procedure of Fama and MacBeth (1973) to perform cross-sectional
tests on the noise measure. Let Rit be the month-t excess return of hedge fund i, and we
estimate its exposure to the noise measure by
Rit = β0 + βN
i ΔNoiset + βMi RM
t + εit , (4)
where ΔNoise is the monthly change of our noise measure, RM is the excess return of CRSP
value weighted portfolio,22 and βNi and βM
i are estimates of fund i’s exposures to the noise
measure and the stock market risk.
Our specification in Equation (4) implicitly assumes that, other than the liquidity risk
factor captured by our noise measure, the stock market risk is the main risk factor for hedge
funds. Given the varying styles of hedge funds in our sample, it is perhaps a strong assumption.
It is nevertheless a reasonable starting point as long as our noise measure is not a proxy for
some well known risk factors other than liquidity risk, and, given our analysis in Section 3.3,
this does not seem to be the case. We also experimented by adding other well known risk
factors such as term spreads in the Treasury market and default spreads in the corporate bond
market, and our results are robust.23 For this reason and to keep the specification simple, we
will perform the cross-sectional test using our simple specification.
For each month t and for each hedge fund i, we first use its previous 24 month returns to
estimate the pre-ranking βNi using Equation (4). We then sort the month-t cross-section of
hedge funds by their pre-ranking beta, βNi , into 10 portfolios. The post-ranking beta’s of the
10 portfolios are estimated by
Rpt = β0 + βN
p ΔNoiset + βMp RM
t + εpt , p = 1, . . . , 10 . (5)
where Rpt is the equal-weighted return for portfolio p in month t and this regression is done
over the entire sample period.24
Table 5 reports the expected returns of the 10 noise-beta sorted portfolios and their post-
ranking beta’s. A negative noise beta implies that when the noise measure increases during
22We use the Fama-French research factors posted on Ken French’s website.23We also incorporated the hedge fund benchmarks proposed by Fung and Hsieh (2001), which can be down-
loaded from http://faculty.fuqua.duke.edu/ dah7/DataLibrary/TF-FAC.xls. We regress the monthlychanges of our noise measure on these factors and use the residual as our noise factor in the cross-sectionaltest. Our results remain robust. In other words, the unexplained component in our noise measure is importantfor the cross-sectional pricing of hedge funds.
24We also repeated our analysis by weighting hedge fund returns by their asset under manage (AUM). Ourresults are quite similar. In the cross-sectional test to be performed later in this section, we always includefund AUM as a control. Large funds on average under perform small funds, but the difference is small inmagnitude.
24

crises, the hedge fund returns decreases. In other words, a hedge fund with negative noise beta
is the one with high exposure to liquidity risk. Among the 10 noise-beta sorted portfolios,
portfolio 1 therefore has a much higher exposure to liquidity risk than portfolio 10, and we can
loosely characterize the hedge funds in portfolio 1 as more aggressive and those in portfolio
10 as more conservative in taking liquidity risk.
More important for our cross-sectional pricing test, Table 5 also shows that hedge funds in
portfolio 1 differ from those in portfolio 10 in average performance. Specifically, the aggressive
funds outperform the conservative ones by a large margin. The average excess return for port-
folio 1 is 0.95% per month compared with 0.23% for portfolio 10, implying a superior monthly
performance of 0.72%. In fact, moving from portfolio 10 to 1, there is a general pattern of
increasing average returns, indicating improved performances with increasing exposures to the
liquidity risk. One direct implication of this pattern of risk and return is that the liquidity
risk as captured by our noise measure is priced, and this pricing implication will be formally
tested later in this section as we perform cross-sectional tests a la Fama and MacBeth (1973).
To further understand these 10 noise-beta sorted portfolios, we report in Table 6 the
characteristics of hedge funds within each portfolio. We see that the hedge funds in portfolios
1 and 10 are similar in their characteristics. Also reported in Table 6 is the relative allocation
of hedge funds within each style category to the 10 portfolios. One interesting observation is
that on average 29.62% of the hedge funds specializing in Emerging Markets show up in the
aggressive portfolio. Other than that, the distribution does not seem to be very informative,
although it does point to the fact that it is important to do the cross-sectional test at the
hedge fund level. In particular, test the liquidity risk at the style indices level will not be a
successful endeavor.
In Figure 4, we compare the liquidity risk of hedge funds in portfolio 1 versus portfolio
10 in a different way. For each year t, we report the one-year exit rate in the sample by
calculating how many hedge funds among the live sample end up in graveyard by the end
of year t. Conditioning on a fund’s exit from live sample to graveyard, we also track which
portfolio this fund belongs to prior to exiting. From Figure 4, we can see a distinctive increase
in exit rate in 2008. This is hardly surprising given the severity of the financial crisis in
2008. What’s interesting is that the exit rate is much higher for hedge funds in the aggressive
category (portfolio 1), while hedge funds in the conservative category have similar exit rate
as the sample average. It should be noted that hedge funds exit from the database for various
reasons and death is only one of them. In fact, for the sample period excluding 2008, the
hedge funds in portfolio 10 on average exit more often than those in portfolio 1. This baseline
makes the dramatic reversal in exit rate between the two portfolios even more interesting.
25

Tab
le5:
Nois
e-B
eta
Sort
ed
Port
folios,
Retu
rns
and
Beta
’s
Pre
Form
atio
nPos
tFo
rmat
ion
exre
tre
tΔ
Noi
seM
ktA
dj-R
2Δ
Noi
seM
ktA
dj-R
2Δ
Noi
seM
ktA
dj-R
2al
pha
(%)
rank
(%)
(%)
βN
βM
(%)
βN
βM
(%)
βN
+la
gβ
M+
lag
(%)
nola
gβ
wit
hla
gβ
10.
951.
20-2
.96
0.55
36.2
8-0
.64
0.49
52.7
7-1
.00
0.55
55.1
90.
010.
05[3
.51]
[4.3
9][-42
.68]
[33.
62]
[-5.
44]
[10.
67]
[-5.
53]
[9.7
1][0
.05]
[0.2
0]2
0.60
0.85
-1.2
00.
3734
.26
-0.4
10.
3358
.76
-0.5
50.
3961
.28
-0.0
10.
03[3
.50]
[4.8
8][-41
.74]
[35.
01]
[-3.
81]
[11.
14]
[-4.
10]
[10.
22]
[-0.
08]
[0.1
5]3
0.48
0.72
-0.7
20.
2833
.23
-0.2
50.
2654
.45
-0.3
10.
3257
.79
0.04
0.05
[3.4
9][5
.24]
[-36
.86]
[31.
47]
[-2.
53]
[10.
53]
[-2.
09]
[10.
99]
[0.2
9][0
.36]
40.
430.
67-0
.47
0.25
32.6
9-0
.28
0.23
54.4
6-0
.36
0.29
58.5
0-0
.01
0.01
[3.3
9][5
.26]
[-28
.51]
[32.
13]
[-3.
04]
[9.8
1][-2.
39]
[9.2
4][-0.
05]
[0.0
7]5
0.34
0.58
-0.2
90.
2231
.42
-0.3
00.
2052
.62
-0.3
60.
2556
.83
-0.0
7-0
.04
[3.0
1][5
.12]
[-19
.16]
[31.
25]
[-3.
31]
[9.2
0][-2.
43]
[8.4
0][-0.
63]
[-0.
37]
60.
380.
63-0
.14
0.21
28.8
8-0
.25
0.19
56.9
5-0
.34
0.24
61.7
00.
010.
03[3
.76]
[6.0
2][-9.
14]
[35.
25]
[-3.
16]
[9.4
8][-2.
61]
[8.9
8][0
.14]
[0.2
7]7
0.29
0.53
0.02
0.21
27.1
0-0
.24
0.19
56.4
4-0
.18
0.24
59.3
9-0
.07
-0.0
2[2
.87]
[5.2
1][1
.01]
[35.
28]
[-3.
17]
[9.3
3][-1.
69]
[8.3
8][-0.
70]
[-0.
15]
80.
380.
620.
240.
2426
.41
-0.2
00.
2155
.24
-0.0
40.
2657
.49
0.03
0.10
[3.5
1][5
.68]
[10.
02]
[36.
02]
[-2.
17]
[9.7
6][-0.
35]
[9.5
4][0
.30]
[0.9
4]9
0.36
0.60
0.63
0.29
26.1
3-0
.08
0.26
55.4
10.
080.
3156
.58
0.03
0.07
[2.7
5][4
.59]
[17.
09]
[33.
47]
[-0.
89]
[9.3
1][0
.57]
[9.3
2][0
.23]
[0.5
3]10
0.23
0.47
1.94
0.40
27.5
90.
150.
3335
.09
0.69
0.43
39.0
60.
000.
03[1
.21]
[2.4
9][2
5.49
][2
3.18
][0
.62]
[6.7
6][2
.60]
[8.0
8][-0.
01]
[0.1
6]
Hed
gefu
nds
are
sort
edby
thei
rno
ise-
beta
’sin
to10
port
folio
s.R
epor
ted
are
the
pre-
rank
ing
beta
’sas
esti
mat
edin
Equ
atio
n(4
)an
dth
epo
st-r
anki
ngpo
rtfo
liobe
ta’s
ases
tim
ated
inE
quat
ion
(5).
Tak
ing
into
acco
unt
ofpe
rsis
tenc
ein
hedg
efu
ndre
turn
s,th
esu
mof
cont
empo
rane
ous
and
lagg
edbe
ta’s
ases
tim
ated
inE
quat
ion
(6)
are
also
repo
rted
.T
hepo
rtfo
liore
turn
sar
em
onth
lyan
deq
ual-w
eigh
ted,
wit
h“r
et”
asre
turn
san
d“e
xret
”as
retu
rns
inex
cess
ofri
skfr
eera
te.
The
alph
a’s
repo
rted
inth
ela
sttw
oco
lum
nsar
eth
etw
o-fa
ctor
alph
a’s
usin
gth
eri
skpr
emiu
ms
estim
ated
from
Equ
atio
n(7
)an
dre
port
edin
Tab
le7.
26

Table 6: Noise-Beta Sorted Portfolios, Characteristics
Portfolio Rank 1 2 3 4 5 6 7 8 9 10
Panel A: CharacteristicsAUM ($M) 163 183 205 217 218 212 200 187 170 160iAUM ($M) 21.08 19.61 22.18 21.64 21.23 20.13 20.80 19.67 19.91 17.41reporting (mn) 130 128 132 135 134 135 133 133 129 130age (mn) 75.9 75.6 76.3 78.0 78.0 77.7 76.9 77.0 76.4 77.0stdret (%) 3.77 2.40 1.90 1.76 1.56 1.44 1.41 1.51 1.80 2.61auto corr 0.15 0.19 0.22 0.23 0.25 0.25 0.23 0.20 0.16 0.11
Panel B: Allocation within Hedge Fund Style (%)Long/Short Equity 11.99 12.08 9.16 7.22 6.08 6.27 7.51 10.16 13.85 15.67Global Macro 16.65 13.32 9.62 6.38 5.25 4.88 6.85 9.63 13.68 13.74Fund of Funds 4.12 7.62 11.48 14.73 15.75 14.82 12.61 9.46 5.98 3.42Fixed Income Arb 10.34 7.28 9.10 11.29 11.65 11.71 11.40 11.73 9.71 5.80Managed Futures 17.79 9.80 5.41 4.17 3.92 4.13 5.46 8.16 13.76 27.41Event Driven 4.87 8.33 10.91 11.16 12.23 12.91 12.62 12.65 8.68 5.63Equity Neutral 3.69 7.30 9.94 8.15 7.90 9.61 11.95 13.83 16.85 10.77Emerging Markets 29.62 15.91 9.86 6.30 4.87 4.54 5.12 6.22 7.57 10.00Convertible Arb 11.33 12.71 11.93 11.18 12.42 12.70 12.39 8.48 5.12 1.73Others 6.76 8.67 10.56 10.41 9.79 11.27 12.77 11.06 9.99 8.72
The 10 portfolios are ranked by their noise beta’s. See Table 4 for variable definitions.
Hedge Fund Data Quality
Given the voluntary nature of hedge fund reporting, we need to be concerned about how their
exiting behavior might introduce biases to our results. For example, hedge funds might simply
stop reporting after some poor performance. As a result, the dataset tends to overstate fund
returns since those missing returns are likely to be much lower than the sample average. For
our purpose, if this type of overstating is more prevalent among funds in portfolio 1, then it
will contribute to the superior performance of portfolio 1 over portfolio 10.
We address this issue by replacing the last month returns of all exiting funds by large
negative numbers such as -100%, -50%, and -20% and recalculate the average returns for the
10 portfolios. We see a marked reduction in average monthly returns across the 10 portfolios
(especially when -100% is used), but the relative performance of these 10 portfolios remains
very much as that exhibited in Table 5. Applying this approach to the Fama-MacBeth cross-
sectional test to be performed later in this section, we find very little difference in the estimated
liquidity risk premium. In fact, the point estimate for the liquidity risk premium is a bit
stronger. This is because on average funds in portfolio 10 tend to exit more frequently than
27

1996 1998 2000 2002 2004 2006 2008 20100
5
10
15
20
25
30
35
40
45
One
−Y
ear
Exi
t Rat
e (%
)entire sampleportfolio 1portfolio 10
Figure 4: The year-t exit rate of hedge funds in the top- and bottom-ranked noise-beta sorted
portfolios.
those in portfolio 1, and 2008 was of one of the few exceptions when this pattern is reversed.25
Overall, we believe that our results are robust with respect to this particular issue of hedge
fund data quality.
Another well known issue with respect to hedge fund data quality is the quality of the
reported returns. In fact, previous research has found relatively large auto-correlation in hedge
fund returns. As reported in the last two columns of Table 4, the monthly auto-correlation
is on average 19%. One possible explanation is return smoothing. While it would not have a
large impact on average performance, it will distort risk exposure. Later in this section, we
will introduce lagged beta’s to better capture risk exposures of hedge funds.
25We further experimented with other ways to better extract information from the exit event. For example,we count the number of exit conditioning on lower performance, say bottom 25% of the sample. Again, thispattern across portfolios 1 and 10 remains the same.
28

Post-Ranking Noise Beta
Also reported in Table 5 are the post-ranking noise beta’s, which are estimated with satis-
factory precisions and exhibit a close to monotonic relation to the portfolio rankings. This is
an encouraging sign for our empirical test, given the importance of having a good measure of
liquidity risk exposures.26 We sort hedge funds into portfolio 1 believing that their trading
strategies are more exposed to the systematic liquidity risk. The large and negative post-
ranking beta for portfolio 1 confirms that this is indeed the case: hedge funds in this portfolio
tend to under perform when the noise measure spikes up during crises. Moving from portfolio
1 to portfolio 10, the post-ranking beta becomes less negative as the liquidity exposure lessens.
This precision and consistency in the post-ranking noise beta’s form an important foundation
for our cross-sectional test to be performed in the next section.
We can further improve the precision of our risk exposure measures. As mentioned earlier,
one issue that is unique to the hedge fund data is that their returns are known to be highly
serially correlated. As shown in Getmansky, Lo, and Makarov (2004), one likely explanation
is their illiquidity and the possibility of smoothed returns at the fund level. In this respect, a
better way to capture a hedge fund’s risk exposure is to regress its returns on the contempo-
raneous as well as the lagged factor. Using this intuition, we estimate the post-ranking beta
by
Rpt = β0 + βN
p ΔNoiset + lagβNp ΔNoiset−1 + βM
p RMt + lagβM
p RMt−1 . (6)
Given the high serial correlation in hedge fund returns, a more accurate estimate of a portfolio’s
exposure to liquidity risk is βNp +lagβN
p . As reported in Table 5, there is much improvement in
terms of the spread of post-ranking noise beta as well as the statistical significance of the post-
ranking noise beta. It is also interesting to note that although the market exposure βMp +lagβM
p
also has some improvement, the improvement in noise beta is much more significant.
Estimating Liquidity Risk Premiums using Fama-MacBeth Regressions
Following Fama and MacBeth (1973), we perform the cross-sectional regression for each
month t:
Rit = γ0t + γN
t βNi + γM
t βMi + cage
t ageit + cAUM
t AUMit + εi
t . (7)
26Post-ranking beta’s for risk factors other than the market portfolio are always difficult to estimate. Itis usually difficult to construct portfolios with a strong enough spread in terms of their exposures to theparticular risk factor of interest. For example, using cross-sectional stock returns to test the the VIX index,Ang, Hodrick, Xing, and Zhang (2006) have issues in constructing portfolios with strong spread in their post-ranking beta’s. Facing a similar issue, Pastor and Stambaugh (2003) use predicted beta’s. Specifically, theytake advantage of stock characteristics that are more stable and postulate that their liquidity beta is an affinefunction of stock characteristics.
29

where Rit is the month-t return of hedge fund i, βN
i and βMi are the noise and market beta’s of
hedge fund i. Following Fama and French (1992), we assign the post-ranking portfolio beta’s,
which are estimated as in Equation (5), to each hedge fund in the portfolio.27 The fund’s age
and log of asset under management (AUM) are used as controls. The factor premiums are
estimated as the time-series average of γNt and γM
t .
Table 7 reports the factor risk premiums for our noise measure as well as the market port-
folio. The Fama-MacBeth t-stats are reported in squared brackets. We see that the liquidity
risk as captured by our noise measure is indeed priced. The coefficient that corresponds to
the noise risk premium is negative and statistically significant. When only contemporaneous
post-ranking beta’s are used in the test, the estimated coefficient is -0.69% per month with a
t-stat of -2.37. When the sum of contemporaneous and lagged beta’s, βNp + lagβN
p , are used
in the cross-sectional test, the estimated coefficient is -0.35% with a t-stat of -2.52.28
Given that our noise measure moves up when the market-wide liquidity deteriorates, this
means that the liquidity risk premium is positive and significant. Relating back to the earlier
discussions on the relative performance of portfolios sorted by noise beta (βN) as reported
in Table 5, this result provides a formal test in support of the intuition developed there.
Specifically, the reason why hedge funds with high negative noise beta provide higher expected
returns is because their high exposures to this priced liquidity risk.
Another way to see this result is to use the risk premiums estimated from this cross-
sectional test, plug it back to the two-factor model, and calculate the two-factor alpha’s for
the ten hedge fund portfolios. The last two columns of Table 5 report such alpha’s. The first
column is for the case when only contemporaneous post-ranking beta’s are used in the cross-
sectional test, while the second column is for the case that uses both contemporaneous and
lagged post-ranking beta’s in the cross-sectional test. Unlike the unadjusted portfolio returns
reported in the left two columns of Table 5, the two-factor alpha’s are no longer significant,
economically or statistically, and this is true for all ten hedge fund portfolios.
Pricing Tests on Variations of Noise Measure
In addition to the base case tests on the noise measure, we also perform hedge fund pricing
tests on a few variations of the noise measure.
To take into account of the fact that bid/ask spreads in the Treasury market also have
some time-variation, we scale our noise measure by the cross-sectional average of bid minus
27In addition to the 10 noise-beta sorted portfolio used here, we also perform our test using the 5x5 portfoliosdouble-sorted by noise-beta and market-beta. Our results on the liquidity risk premium remains robust.
28The slope coefficient is smaller in the latter case due to the increased spread in noise beta’s. We believethat including the lagged beta’s is important in order to better capture hedge funds exposure to the liquidityrisk.
30

Table 7: Estimating Liquidity Risk Premiums using Hedge Fund Returns
Factor Intercept Liquidity Market Age AUM
Panel A: Noise as Proxy of LiquidityNoise 1.73 -0.69 1.01 0.015 -0.10
[4.39] [-2.37] [1.65] [0.26] [-3.96]Noise (beta+lag beta) 1.77 -0.35 1.01 0.016 -0.10
[4.37] [-2.52] [1.8] [0.29] [-3.95]Noise/BASpreads 1.75 -0.56 0.89 0.009 -0.10
[4.38] [-2.20] [1.49] [0.16] [-3.93]Noise-VIX-Default 1.65 -1.19 0.97 0.008 -0.10
[4.14] [-2.26] [1.67] [0.15] [-3.88]
Panel B: Other Proxies of LiquidityOn5Y 2.00 -1.58 0.63 0.003 -0.10
[4.46] [-0.79] [0.93] [0.04] [-3.96]On10Y 1.80 -0.70 1.05 0.002 -0.09
[4.03] [-0.25] [1.76] [0.03] [-3.8]RefCorp 1.77 -5.32 0.73 0.017 -0.10
[4.37] [-1.27] [1.22] [0.31] [-4.01]PSLiq 1.87 -0.02 0.84 -0.032 -0.09
[4.51] [-0.22] [0.96] [-0.59] [-3.89]VIX 1.79 1.92 0.65 -0.004 -0.09
[4.23] [0.49] [0.72] [-0.08] [-3.83]Default 1.88 8.27 1.17 -0.015 -0.09
[4.19] [1.37] [1.79] [-0.28] [-3.89]
Each proxy of liquidity is tested together with the equity market portfolio in a two-factor modelusing hedge fund returns, with age and size (AUM) as additional controls. The coefficients for ageare reported as percentage points. The Fama-MacBeth t-stat’s are reported in squared brackets.Panel A focuses on the noise measure with the base case as described in Equations (5) and (7) andadditional cases. Panel B considers other proxies of liquidity. See Table 2 for variable definitions.
31

ask yield for all of the bonds used in the construction of the noise measure. As shown in Panel
A of Table 7, we find that this scaled version is priced with an estimated risk premium similar
to the base case in magnitude and statistical significance.
We also construct a variation of our noise measure to take into account of the fact that
the total amount outstanding varies across Treasury bonds. So instead of equal weighting the
squared yield deviations across bonds, we weight them by the size of the bond. Effectively,
the pricing errors of larger and therefore more liquidity bonds are weighted more. We find
similar hedge fund pricing results for this variation of noise measure.
Our time-series analysis shows that our noise measure is related to other known proxies of
liquidity including the VIX index and default spreads. To evaluate the relative importance of
the information that is captured in our noise measure versus those in VIX and default spread,
we perform our cross-sectional test on a noise measure that is orthogonal to these two variables.
Specifically, we first regress the monthly changes of our noise measure on the monthly changes
of VIX and default spreads, and then perform the pricing test using the residual. The result
is reported in Table 7, the last row of Panel A, under the case “Noise-VIX-Default.” We see
that after taking out the information contained in VIX and default spreads, our noise measure
maintains its significance and magnitude in pricing the cross-sectional hedge fund returns.
We repeat the same exercise by including the 5- and 10-year on-the-run premiums, the
Refcorp spread, and the Pastor-Stambaugh liquidity factor along with the VIX index and
default spreads in the regression. Performing the hedge fund pricing test on the residual, we
again reach the same conclusion. That is, the importance of noise measure as a liquidity risk
factor in pricing hedge funds is independent of these “usual suspects.” While all of these
variables are informative in their own right and for their respective market, we would like to
argue that the information captured in our noise measure is unique. Given the breadth of hedge
fund activities and their specialization on arbitrage activities and liquidity, we would further
argue that this unique information contained in our noise measure is broad and important.
Pricing Tests on Other Liquidity Proxies
What we have established so far is that our noise measure is an important priced liquidity
factor, above and beyond the information contained in other liquidity proxies such as the VIX
index and default spreads. The remaining question is are these liquidity proxies important for
the pricing of hedge fund returns? The importance of these proxies is widely known and they
have been shown to be important for their respective markets. But what are their implications
for the hedge fund returns?
For this purpose, we repeat the same hedge fund tests by replacing the noise measure
with one of other liquidity proxies. This includes the on-the-run premiums for 5- and 10-
year Treasury bonds, the RefCorp spread, the Pastor-Stambaugh stock market liquidity risk
32

factor, the VIX index, and default spreads. Again, we use the two-factor model including the
stock market return and the liquidity risk factor. We perform the test by first sorting hedge
funds by their exposures to the liquidity risk factor into 10 portfolios, and then perform the
Fama-MacBeth cross-sectional test. As shown in Panel B of Table 7, we find no evidence that
these risk factors are priced in hedge fund returns.
4.2 Explaining Carry Trade Returns
Building Currency Portfolios
Following Lustig, Roussanov, and Verdelhan (2011), we consider 36 currencies from both
developed and emerging countries. Currencies are included in the sample only when both
spot and forward rates are available. Our sample starts with 17 currencies, and reaches a
maximum of 34 currencies. Since the launch of the Euro in January 1999, our sample covers
24 currencies only. For each country, we obtain its end-of-month spot and forward exchange
rates with one-month maturity from Barclays and Reuters via Datastream. For both forward
and spot rates, we use mid bid-ask quotes in units of foreign currency per U.S. dollar. The
sample period spans from January 1987 to December 2011.
Let’s denote the log of the one-month forward rate by f , and the log of the spot rate by s.
At the end of each month t, we allocate all currencies into six carry trade portfolios based on
their forward discount ft − st. Because the covered interest parity holds closely at monthly
frequency, our portfolios sorted on forward discounts ft−st are equivalent to portfolios ranked
by interest rate differentials i∗t −it, where i∗t and it are the foreign and the U.S. one-month risk-
free interest rates, respectively. Portfolio 6 contains the currencies with the smallest forward
discounts (or lowest interest rates), and portfolio 1 contains the currencies with the biggest
forward discounts (or highest interest rates). From the perspective of a U.S. investor, the log
excess return rx of holding a foreign currency in the forward market and then selling it in the
spot market one month later at t + 1 is:
rxt+1 = ft − st+1 = i∗t − it + st − st+1 = i∗t − it −�st+1.
The log currency excess return for a carry trade portfolio is then calculated as the equally
weighted average of the log excess returns of all currencies in the portfolio. We re-balance
carry trade portfolios at the end of every month in our sample period.
Carry Trade Portfolios, Beta and Alpha
For the six carry trade portfolios described in the previous section, we first estimate their
factor risk exposures by
Rit = β0 + βN
i ΔNoiset + βMi RM
t + εit , (8)
33

Table 8: Currency Carry Portfolios, Beta and Alpha
Panel A: Developed and Emerging CountriesTwo Factor Model CAPM One Factor
Rank exret ΔNoise Market Adj-R2 alpha beta alpha ΔNoise(%) βN βM (%) (%) (%) beta
1 0.79 -0.57 0.15 11.10 0.24 0.19 0.69 -0.83[4.56] [-1.84] [2.64] [1.38] [3.08] [3.22] [-2.51]
2 0.35 -0.29 0.15 10.18 -0.01 0.17 0.26 -0.54[2.39] [-1.54] [2.90] [-0.07] [3.64] [1.55] [-2.80]
3 0.28 -0.32 0.09 6.96 -0.04 0.12 0.22 -0.48[2.14] [-1.41] [1.98] [-0.34] [2.36] [1.39] [-1.93]
4 0.15 -0.12 0.07 2.84 -0.01 0.08 0.11 -0.24[1.21] [-0.61] [1.65] [-0.08] [1.91] [0.77] [-1.13]
5 -0.05 -0.14 0.05 2.19 -0.21 0.07 -0.08 -0.23[-0.38] [-0.66] [1.34] [-1.72] [1.52] [-0.58] [-0.97]
6 -0.18 -0.05 0.00 0.06 -0.22 0.01 -0.18 -0.06[-1.37] [-0.33] [0.06] [-1.73] [0.24] [-1.30] [-0.38]
Panel B: Developed Countries OnlyTwo Factor Model CAPM One Factor
Rank exret ΔNoise Market Adj-R2 alpha beta alpha ΔNoise(%) βN βM (%) (%) (%) beta
1 0.53 -0.78 0.13 11.07 -0.15 0.19 0.43 -1.01[2.81] [-3.45] [2.06] [-0.79] [2.87] [1.98] [-4.33]
2 0.40 -0.69 0.15 14.78 -0.25 0.21 0.29 -0.96[2.35] [-2.51] [2.95] [-1.50] [3.37] [1.48] [-3.14]
3 0.25 -0.40 0.12 8.00 -0.16 0.15 0.17 -0.61[1.56] [-1.47] [2.30] [-1.00] [2.67] [0.95] [-2.08]
4 0.23 -0.18 0.05 1.48 0.05 0.07 0.19 -0.26[1.47] [-0.59] [1.01] [0.29] [1.26] [1.04] [-0.84]
5 0.03 -0.06 0.02 0.22 -0.05 0.03 0.01 -0.09[0.21] [-0.27] [0.40] [-0.32] [0.66] [0.08] [-0.40]
6 0.00 0.47 0.02 1.73 0.30 -0.01 0.01 0.44[0.01] [2.04] [0.27] [1.63] [-0.19] [0.04] [2.15]
Portfolios are formed monthly by sorting currencies by their forward discount, with currenciesin portfolio 1 having the highest forward discount and the highest interest rate while currenciesin portfolio 6 having the lowest interest rate. Returns are monthly in excess of the risk-free rate.The two-factor model includes ΔNoise and stock market returns, and the two-factor alpha’s arecalculated using the factor risk premiums estimated using hedge fund returns. Also reported arethe CAPM beta and alpha as well as the one-factor noise beta.
34
where Rit is the month-t excess return of carry portfolio i, RM
t is the month-t excess return of
the aggregate stock market, and ΔNoiset is monthly change of our noise measure for month t.
Panel A of Table 8 reports, for the six currency carry portfolios, their respective risk
exposures, βN and βM , to the noise measure and the stock market portfolio. Currencies in
portfolio 6 are those with the lowest interest rate and function as funding currencies, while
currencies in portfolio 1 have the highest interest rate and are on the asset side of the carry
trade. It is therefore interesting to see that the asset currencies in carry portfolio 1 have the
most negative noise beta among the six portfolios, implying a worsening portfolio performance
for such target curries during liquidity crises when our noise measure usually spikes up. By
contrast, carry portfolio 6 have a small and statistically insignificant beta on our noise measure,
implying very low exposure to liquidity risk. Moving from portfolio 1 to portfolio 6, we do
observe a general pattern of decreasing liquidity exposure, although it is not monotonic.
Also reported in Table 8 are the mean excess returns for the six portfolios. As expected,
moving from portfolio 6 to 1, the monthly mean excess return increases monotonically from
-18 basis points to 79 basis points, and this difference in performance is the main driver behind
the popularity of currency carry trades. Connecting this pattern in expected returns to that
in liquidity risk exposures βN , one could argue that the superior performance of portfolio 1 is
a result of its high exposure to liquidity risk.
To formally test this idea, we use the factor risk premiums estimated using hedge fund
returns (Table 7) to calculate the two-factor alpha for these six carry portfolios.29 Effectively,
we are using the pricing information obtained from the hedge fund tests to see whether or
not this information can help explain away the superior performance of currency carry trade.
Our results in Table 8 show that it does work in the right direction. Without risk adjustment,
the monthly expected return of portfolio 1 is 79 basis points with a t-stat of 4.56. After
adjusting for its risk exposures to our noise measure and the stock market portfolio, however,
its monthly expected return is only 24 basis point with a t-stat of 1.38. Similarly, the positive
and statistically significant expected returns to portfolios 2 and 3 shrink to near zero after the
risk adjustments.
By contrast, using the stock market alone in a one-factor model cannot help away the
carry profits. As reported in Table 8, the CAPM alpha for portfolio 1 is 69 basis points
per month with a t-stat of 3.08, which is large in magnitude and statistical significance. For
29We compute alpha by calculating the difference between the mean excess return for each portfolio and themean excess return implied by the two factor model, using the liquidity and market risk premiums estimatedfrom the hedge fund tests. In an earlier version of the paper, we use these six carry portfolios to test andestimate the liquidity risk premium. We find significant results. But given the limited number of test portfolios,we feel that this test is perhaps not very reliable. So we decide to use the risk premiums estimated using thehedge fund returns to explain the carry profits.
35
comparison, we also report the one-factor noise beta in Table 8. Unlike the CAPM beta, the
one-factor noise beta exhibits a very strong pattern of increasing liquidity exposure moving
from portfolio 6 to portfolio 1.30
Carry Portfolios with Developed Countries Only
As a robustness check, we also test our results on 14 developed countries: Australia, Bel-
gium, Canada, Denmark, France, Germany, Italy, Japan, Netherlands, New Zealand, Norway,
Sweden, Switzerland and United Kingdom. This smaller sample starts with 14 countries and
covers 10 countries after the launch of the Euro in January 1999. The results are summarized
in Panel B of Table 8.
Again, we see that a pattern of increasing exposures to liquidity risk as we move from
portfolio 6 that contains funding currencies to portfolio 1 that contains target currencies.
For this subsample including currencies from developed countries only, we can estimate the
noise beta’s with better precision, and the pattern of increasing liquidity exposure is indeed
monotonic. Without risk adjustment, portfolio 1 provides an average excess return of 53 basis
points per month. With risk adjustment, however, the two-factor alpha shrinks to -15 basis
points with a insignificant t-stat of 0.79. By contrast, using only the market portfolio as risk
adjustment, the CAPM alpha is 43 basis points with a t-stat of 1.98.
This robustness result is also consistent with what we find using other carry trade indices.
Given the popularity of carry trade, there are several existing carry trade indices provided
by money managers. The JP Morgan IncomeFX index is one of them and it focuses on 14
currency pairs of developed countries. Using its monthly returns from November 1995 through
December 2011, we find that this index return has a noise beta of -0.833 with a t-stat of -2.70.
Without any risk adjustment, its average monthly returns in excess of risk free rate is 59.7
basis points with a t-stat of 2.35. After adjust for risk exposures, however, its two-factor alpha
is no longer statistically significant.
5 Conclusions
In this paper, we use price deviations from asset fundamentals as a measure of market illiq-
uidity. Instead of focusing the liquidity condition of a specific market, we are interested in
the liquidity conditions of the overall market. For this purpose, we consider the U.S. Treasury
market, which is arguably the most important and one of the most liquid markets. Presum-
30We cannot use the liquidity risk premium estimated in a two-factor model to calculate the one-factoralpha, although it should be convincing to the reader that it is the liquidity risk that helps explain the carrytrade profits.
36

ably, signs of illiquidity in this market reflects a general shortage of arbitrage capital and
tightening of liquidity in the overall market, whatever its origins and causes. In particular, we
use the average “pricing errors” in U.S. Treasuries as a measure of illiquidity of the aggregate
market. Indeed, we found that this measure spikes up during various market crises, ranging
from the 1987 stock market crash, the near collapse of LTCM, 9/11, GM credit crisis, to the
fall of Bear Stearns and Lehman Brothers. This drastic variation of our illiquidity measure
over time, especially during crisis, suggests that it represents substantial market-wide liquidity
risk.
We further explore the pricing implications of this liquidity risk factor by examine its
connection with the returns on assets/trading strategies that are generally thought to be
sensitive to market liquidity conditions. Two sets of such returns are considered: returns
from hedge funds and currency carry trades. We found that the market-wide liquidity risk, as
measured by the variation in the price noise of Treasuries, can help to explain both the cross-
sectional variation in hedge fund returns and currency carry trade strategies, while various
liquidity-related risk factors obtained from other markets such as equity, corporate bonds and
equity options show no explanatory power.
37

Appendix: Robustness on Curve Fitting
In this Appendix, we investigate the robustness of our result with respect to the particular
curve-fitting method employed in Section 2.2. For this, we use two variations of the cubic-
spline method to fit the yield curve and then construct new noise measures based on the
fitted curves. We find that the information content in these alternative noise measures is very
similar to that found for the original one. Moreover, our main results remain quite robust
with respect to the various curve-fitting methods.
A Cubic Spline
Spline-based methods use piecewise polynomials that are smoothly joined at selected knots
to approximate the yield or forward curve. Cubic polynomials have been widely used for this
purpose (McCulloch (1971, 1975)). One of the short-comings of this cubic spline method is
that it tends to generate unstable and oscillating yield curves that are absent of economic
content. Fisher, Nychka, and Zervos (1995) improves on the traditional cubic spline method
by introducing a roughness penalty function. This smoothing spline method trades off between
the goodness-of-fit and the smoothness of the forward yield curve.
We assume that the instantaneous forward curve is a cubic spline with knot points on
(t0, t1, . . . , tk). On each of the subintervals [ti−1, ti], with 1 ≤ i ≤ k, the forward rate f is a
cubic polynomial function in maturity m:
f(m, b) = ai
(m − ti−1
ti − ti−1
)3
+ bi
(m − ti−1
ti − ti−1
)2
+ ci
(m − ti−1
ti − ti−1
)+ di ,
where b = ((ai, bi, ci, di), i = 1, 2, . . . , k) summarizes the cubic spline parameters. In addition,
we require that both f and its first derivative are continuous at the connecting knot points
over the k subintervals. We also impose the constraints that d0 > 0 and ak > 0 to ensure that
forward rates are positive at maturities of zero and infinity.
Given the the forward curve, the zero-coupon yield curve can be derived and, similar to
Section 2.2, the model parameters bt can be estimated using the market-observed Treasury
bond and bill prices by:
bt = argminb
[Nt∑i=1
[(P i(b) − P i
t ) ×1
Di
]2
+ λ
∫ tk
0
[f
′′(x, b)
]2
dx
], (A1)
where λ ≥ 0 and f ′′(x, b) is the second derivative of the forward rate function with respect
to maturity x. Compared to Equation (2) used earlier for curve fitting, the above objective
function includes a roughness penalty function, which measures the curvature of the forward
curve. As mentioned earlier, this penalty function was introduced by Fisher, Nychka, and
38

Zervos (1995) to curtail the stability issue inherent in cubic spline method and has been
widely used in the fixed-income community. With a small or close to zero penalty coefficient
λ, the emphasis is on fitting the curve well at the potential cost of having a highly fluctuating
forward curve. An increasing λ will produce smoother forward curve, at the sacrifice of the
goodness of fit. We will experiment with various λ with the objective to find a flexible enough
curve that fits the data well but doesn’t oscillate too much to over-fit the data.31
B Noise Measure Constructed using Cubic Spline
We consider two cases of cubic spline. In the first case, we pick three subintervals that are
joined at the knot points of 2-, 5-, and 10-year maturities. Given the importance of these
maturities in the Treasury bond market, we feel that this is a natural choice. There are four
parameters for each sub-interval, resulting in 12 parameters. The smoothness conditions at
the 2- and 5-year maturity junctions take away 4 degrees of freedom. Consequently, we have
8 free parameters in our curve fitting and we call this specification “Cubic8.” Compared with
the Svensson model used earlier, Cubic8 has two more free parameters. To further relax the
specification and give the curve fitting more degrees of freedom, we consider a second case with
more subintervals: (0, 1m, 3m, 6m, 1y, 2y, 3y, 5y, 7y, 10y). The knot points are chosen so that
we have similar number of bonds and bills within each subinterval. We call this specification
“Cubic20,” since it has 20 free parameters in curve fitting.
We perform curve fitting using cubic spline from 1994 through 2011 with a monthly fre-
quency. This is because the main robustness check we would like to perform is on the hedge
fund test results. Setting the roughness penalty coefficient λ to zero, we find that the correla-
tions between our original noise measure and the alternatives constructed using cubic spline
are 97.76% and 98.60%, respectively, for Cubic8 and Cubic20. In other words, even with a
more flexible curve fitting approach with 20 free parameters and zero requirement for smooth-
ness, the resulting noise measure is closely related to our original noise measure. This is not
surprising given that the noise measure is an aggregate of pricing errors across hundreds of
bonds. If we further impose a smoothness requirement by setting the roughness penalty coef-
ficient λ = 0.01, the correlations increase to 98.99% and 99.03%, respectively, for Cubic8 and
Cubic20. Given that our pricing tests are on the monthly changes of noise measure, it is also
instructive to report the correlations in changes. With λ = 0, the numbers are 83.30% and
88.59%, respectively for Cubic8 and Cubic20. With λ = 0.01, the numbers increase to 90.74%
and 91.91%, respectively for Cubic8 and Cubic20. We further perform the same set of time-
series analysis reported in Table 2 and find similar results. Not surprisingly, the information
31The penalty coefficient λ is often allowed to vary according to maturity m so as to fine tune the trade-offover different regions on the term structure. We decide to keep a simple specification with a constant λ.
39

1 2 3 4 5 6 7 8 9 104
4.5
5
5.5
6
6.5
7
maturity
yiel
ds (%
) 19940331 Lambda = 0.01
Svensson: Noise=3.26 Wiggle=0.21
Cubic8 : Noise=3.41 Wiggle=0.76
1 2 3 4 5 6 7 8 9 100.5
1
1.5
2
2.5
3
3.5
maturity
yiel
ds (%
)
20081128 Lambda = 0.01
Svensson: Noise=17.37 Wiggle=0.85
Cubic8 : Noise=16.62 Wiggle=7.38
1 2 3 4 5 6 7 8 9 104
4.5
5
5.5
6
6.5
7
maturity
yiel
ds (%
)
19940331 Lambda = 0.01
Svensson: Noise=3.26 Wiggle=0.21
Cubic20 : Noise=3.12 Wiggle=0.44
1 2 3 4 5 6 7 8 9 100.5
1
1.5
2
2.5
3
3.5
maturity
yiel
ds (%
)
20081128 Lambda = 0.01
Svensson: Noise=17.37 Wiggle=0.85
Cubic20 : Noise=16.21 Wiggle=13.32
1 2 3 4 5 6 7 8 9 104
4.5
5
5.5
6
6.5
7
maturity
yiel
ds (%
)
19940331 Lambda = 0
Svensson: Noise=3.26 Wiggle=0.21
Cubic20 : Noise=3.1 Wiggle=34.28
1 2 3 4 5 6 7 8 9 100.5
1
1.5
2
2.5
3
3.5
maturity
yiel
ds (%
)
20081128 Lambda = 0
Svensson: Noise=17.37 Wiggle=0.85
Cubic20 : Noise=15.23 Wiggle=977.84
Figure AI: Examples of par-coupon yield curves and the market-observed bond yields, marked by“x”. Left panels are for a normal day on 19940331, while right panels are for a stressful day on20081130. The Svensson model is the base case in all figures and is marked by solid lines in black.The cubic-spline models are marked by dashed lines in red. The first row plots Cubic8 with λ = 0.01,the second row plots Cubic20 with λ = 0.01 and the last row plots Cubic20 with λ = 0. Marked inthe legend are the levels of noise measure and “wiggle”— integrated curvature of the forward curve.
40

content in these alternative noise measures is very similar to that found for the original one.
Figure AI provides more textured information with respect to how the curves fitted using
cubic splines might differ those using the Svensson model. On the left panels, we plot the par-
coupon yield curves along with the market observed bond yields for a normal day on March
31, 1994. As we can see, the shape of the curve as well as the level of the noise measure are
pretty similar regardless of the curve fitting method or the choice of the roughness penalty
coefficient λ. Even when λ is set to zero in the last row, we see only a tiny improvement in
the goodness of fit as captured by the noise measure. The only signal that sets this case apart
from the others is the magnitude of “wiggle,” which is integrated curvature of the forward
curve (the penalty term in Equation A1). For the case of Cubic20 with λ = 0, there is no
requirement on smoothness and the wiggle is at 34.28. By contrast, the wiggle is only at 0.44
for the case of Cubic20 with λ = 0.01 and 0.21 for the Svensson model. Regardless of their
differences in wiggle, the noise measures produced by all four cases are very close.
For November 28, 2008, however, the differences in yield curves are more noticeable. In
particular, using cubic spline does improve the goodness of fit. For example, the noise measure
using the Svensson model is 17.37 basis points. It decreases to 16.62 basis points using Cubic8
with λ = 0.01. Using Cubic20 with no penalty further improves the goodness of fit and the
noise measure is at 15.23 basis points. Given the severity of the crisis during November and
December 2008, this difference in yield curve fitting is probably among the most extreme in
our sample. Nevertheless, we see that the noise measure is at 15.23 basis points even for
Cubic20 with λ = 0. In other words, the actual magnitude might vary from one curve fitting
method to another, but the important feature of our noise measure remains very much the
same. We would further argue that the main insight of our paper is in fact a quite general
one: Using any yield curve as a benchmark for pricing, we can construct a noise measure. As
long as this benchmark is generated by a smooth enough yield curve, which takes into account
the internal consistency of bond pricing, the corresponding noise measure contains valuable
information about the broad market liquidity.
C Cross-Sectional Tests using Hedge Fund Returns
We use the noise measure constructed from the cubic spline method to perform the hedge
fund test. The results for portfolio returns and post-ranking noise beta’s are similar, which
we will omit. Instead, we report in Table AI the estimated risk premiums for the two factor
model. Panel A reports the pricing results for both Cubic8 and Cubic20 while fixing the
roughness penalty coefficient λ at 0.01. As we can see that the estimated market prices of
risk for our noise measure are negative and significant, and our main results using the original
noise measure remain robust.
To further understand how sensitive our results are with respect to the choice of the
41

Table AI: Estimating Liquidity Risk Premiums using Hedge Fund Returns
Panel A: with fixed penalty coefficient λ = 0.01Cubic8 Cubic20
Liquidity Market Liquidity Market
Noise -0.61 0.88 -0.49 1.44[-2.23] [1.51] [-2.14] [2.23]
Noise(beta+lag beta) -0.30 0.79 -0.29 1.21[-2.28] [1.57] [-2.26] [2.16]
Noise/BASpreads -0.46 1.00 -0.40 1.23[-1.97] [1.74] [-1.99] [1.95]
Noise-VIX-Default -1.19 1.27 -1.17 2.50[-2.12] [2.06] [-2.11] [2.97]
Panel B: with varying penalty coefficient λ
Cubic8 Cubic20Liquidity Market Liquidity Market
λ = 0 -0.83 0.76 -0.33 1.10[-1.70] [1.22] [-1.68] [1.83]
λ = 0.005 -0.71 0.81 -0.45 1.54[-2.17] [1.37] [-1.94] [2.39]
λ = 0.01 -0.61 0.88 -0.49 1.44[-2.23] [1.51] [-2.14] [2.23]
λ = 0.02 -0.53 0.74 -0.47 1.34[-2.19] [1.25] [-2.10] [2.04]
λ = 0.03 -0.50 0.77 -0.51 1.19[-2.08] [1.28] [-2.22] [1.86]
λ = 0.04 -0.49 0.76 -0.48 1.18[-2.05] [1.23] [-2.10] [1.83]
λ = 0.05 -0.48 0.79 -0.44 1.19[-2.00] [1.26] [-2.02] [1.81]
The noise measure is tested together with the equity market portfolio in a two factor model usinghedge fund returns, with age and size as additional controls. The Fama-MacBeth t-stat’s are reportedin squared brackets. The noise measure is constructed using two cubic spline methods: Cubic8 andCubic20. Reported in the table are the estimated market prices of risk for our noise measure andthe equity market portfolio.
42

roughness penalty coefficient λ, we report in Panel B of Table AI the pricing results with
varying penalty coefficients. In each case, we perform month-by-month curve fitting with the
chosen λ and cubic spline method and then construct the noise measure using the fitted curve.
We then perform the hedge fund test on the noise measure and report the market prices of
risk. As we can see, our results remain quite robust. Except for the case when no roughness
penalty is imposed, our pricing results remain pretty strong with respect to the varying choices
of λ. Even for the case with no roughness penalty (λ = 0), our estimated coefficients are in
the right direction and are marginally significant. Overall, these robustness checks confirm
that indeed our results are quite general and is not an artifact of the curve fitting method.
43
References
Acharya, V. V. and L. H. Pedersen (2005). Asset Pricing with Liquidity Risk. Journal of
Financial Economics 77 (2), 375–410.
Ang, A., R. Hodrick, Y. Xing, and X. Zhang (2006). The Cross-Section of Volatility and
Expected Returns. Journal of Finance 61, 259–299.
Backus, D., S. Foresi, and C. Telmer (2001). Affine Term Structure Models and the Forward
Premium Anomaly. Journal of Finance 56, 279–304.
Backus, D., A. Gregory, and C. Telmer (1993). Accounting for Forward Rates in Markets
for Foreign Currency. Journal of Finance 48, 1887–1908.
Bao, J., J. Pan, and J. Wang (2011). The Illiquidity of Corporate Bonds. Journal of Fi-
nance 66, 911–946.
Billio, M., M. Getmansky, and L. Pelizzon (2010). Crises and Hedge Fund Risk. Working
Paper, University of Massachusetts, Amherst.
Brunnermeier, M., S. Nagel, and L. H. Pedersen (2008). Carry Trades and Currency Crashes.
NBER Macroeconomics Annual 23, 313–348.
Brunnermeier, M. K. and L. H. Pedersen (2009). Market Liquidity and Funding Liquidity.
Review of Financial Studies 22, 2201–2238.
Burnside, C., M. Eichenbaum, I. Kleshchelski, and S. Rebelo (2010). Do Peso Problems
Explain the Returns to the Carry Trade? Working Paper, Northwestern University.
Campbell, J., S. Grossman, and J. Wang (1993). Trading Volume and Serial Correlation in
Stock Returns. Quarterly Journal of Economics 108, 905–939.
Cao, C., Y. Chen, B. Liang, and A. Lo (2010). Can Hedge Funds Time Market Liquidity?
Working Paper, MIT Sloan School of Management.
Coval, J. and E. Stafford (2007). Asset fire sales (and purchases) in equity markets. Journal
of Financial Economics 86, 479–512.
Duffie, D. (2010). Asset Price Dynamics with Slow-Moving Capital. Journal of Finance 65,
1238–1268.
Fama, E. (1984). Forward and Spot Exchange Rates. Journal of Monetary Economics 14,
319–338.
Fama, E. and K. French (1992). The Cross-Section of Expected Stock Returns. Journal of
Finance 47, 427–465.
Fama, E. and J. MacBeth (1973). Risk, Return, and Equilibrium: Empirical Tests. Journal
of Political Economy 81, 607–36.
44
Fisher, M., D. Nychka, and D. Zervos (1995). Fitting the term structure of interest rates
with smoothing splines. Finance and Economics Discussion Series, Board of Governors
of the Federal Reserve System 1.
Fleckenstein, M., F. A. Longstaff, and H. Lustig (2010). why does the treasury issue tips?
the tipstreasury bond puzzle. Working Paper, UCLA Andersen School.
Fung, W. and D. A. Hsieh (2001). The Risk in Hedge Fund Strategies: Theory and Evidence
from Trend Followers. The Review of Financial Studies 14, 313–341.
Getmansky, M., A. Lo, and I. Makarov (2004). An Econometric Model of Serial Correlation
and Illiquidity in Hedge Fund Returns. Journal of Financial Economics 74, 529–609.
Gromb, D. and D. Vayanos (2002). Equilibrium and Welfare in Markets with Financially
Constrained Arbitrageurs. Journal of Financial Economics 66, 361–407.
Jankowitsch, R., A. Nashikkar, and M. G. Subrahmanyam (2011). Price dispersion in OTC
markets: A new measure of liquidity. Journal of Banking & Finance 35, 343–357.
Jurek, J. (2009). Crash-Neutral Currency Carry Trades. Working Paper, Princeton Univer-
sity.
Kyle, A. and W. Xiong (2001). Congagion as a Wealth Effect. Journal of Finance 62,
247–292.
Lamoureux, C. and G. Theocharides (2012). Coupon Spreads and Illiquidity in the Market
for 10-Year Treasury Notes. Working Paper, The University of Arizona.
Leland, H. and M. Rubinstein (1988). Comments on the Market Crash: Six Months After.
Journal of Economic Perspectives 2 (3), 45–50.
Longstaff, F. (2004). The Flight-to-Liquidity Premium in U.S. Treasury Bond Prices. Jour-
nal of Business 77, 511–525.
Lou, D., H. Yan, and J. Zhang (2012). Anticipated and Repeated Shocks in Liquid Markets.
Working Paper, LSE and Yale.
Lustig, H., N. Roussanov, and A. Verdelhan (2011). Common Risk Factors in Currency
Markets. Review of Financial Studies, forthcoming .
Mancini, L., A. Ranaldo, and J. Wrampelmeyer (2012). Liquidity in the Foreign Exchange
Market: Measurement, Commonality, and Risk Premiums. Journal of Finance, Forth-
coming .
McCulloch, J. H. (1971). Measuring the Term Structure of Interest Rates. Journal of Busi-
ness 44, 19–31.
McCulloch, J. H. (1975). The Tax-Adjusted Yield Curve. Journal of Finance 30, 811–830.
45

Merton, R. (1987). A Simple Model of Capital Market Equilibrium with Incomplete Infor-
mation. Journal of Finance 42 (3), 483–510.
Mitchell, M., L. H. Pedersen, and T. Pulvino (2007). Slow Moving Capital. The American
Economic Review, P&P 97, 215–220.
Mitchell, M. and T. Pulvino (2011). Arbitrage Crashes and the Speed of Capital. Journal
of Financial Economics, forthcoming .
Musto, D., G. Nini, and K. Schwarz (2011). Notes on Bonds: Liquidity at all Costs in the
Great Recession. Working Paper, The Wharton School.
Nagel, S. (2011). Evaporating Liquidity. Working Paper, Stanford University.
Nelson, C. R. and A. F. Siegel (1987, October). Parsimonious Modeling of Yield Curves.
Journal of Business 60 (4), 473–89.
Pastor, L. and R. Stambaugh (2003). Liquidity Risk and Expected Stock Returns. Journal
of Political Economy 111, 642–685.
Sadka, R. (2010). Liquidity Risk and the Cross-Section of Hedge-Fund Returns. Journal of
Financial Economics 98, 54–71.
Shleifer, A. and R. Vishny (1997). The Limits of Arbitrage. Journal of Finance 52, 35–55.
Svensson, L. (1994). Estimating and Interpreting Forward Interest Rates: Sweden 1992 -
1994. Working Paper 4871, National Bureau of Economic Research.
Vayanos, D. and J.-L. Vila (2009). A Preferred-Habitat Model of the Term Structure of
Interest Rates. Working Paper, London School of Economics.
Verdelhan, A. (2010). A Habit-Based Explanation of the Exchange Rate Risk Premium.
Journal of Finance 65, 123–145.
46