Types of attack. Brute force attack Forceful attack on a computer to escalate privileges.

I M P A C T O F T H E C O V I D - 1 9 P A N D EM I CO N H E A R T A T T A C K A ND OU T -O F -
HO S P I T A L C A R D I A C A R R E S T C A R E I NI R E L A N D
J A N U A R Y 2 0 1 9 – J U N E 2 0 2 0
NOCA COVID-19 HEART ATTACKREPORT ISSUE 1

2
Title NOCA COVID-19 HEART ATTACK REPORT ISSUE 1 IMPACT OF THE COVID-19 PANDEMIC ON HEART ATTACK AND OUT-OF-HOSPITAL CARDIAC ARREST CARE IN IRELAND (JANUARY 2019 –JUNE 2020)
Prepared for Health Service Executive; Department of Health
Copy to Collette Tully, Executive Director, NOCA
Prepared by Dr Ronan Margey, Clinical Lead, IHAA; Dr Sean Fleming, Chairperson IHAA; Dr Siobhan Masterson, NAS Lead for Clinical Strategy and Evaluation; Dr Conor Deasy, Chairperson, OHCAR steering group; Martin Quinn, OHCAR Manager; Joan McCormack, Cardiovascular Audit Programme Manager, NOCA; Olga Brych, Data Analyst, NOCA; Dr Fionnola Kelly, Head of Data Analytics and Research, NOCA; Gintare Valentelyte, Healthcare Outcome Research Centre, RCSI; Professor Jan Sorensen, Healthcare Outcome Research Centre, RCSI.
Reviewed by Professor Conor O’ Keane – Consultant, Mater Misericordiae University Hospital, Dublin; Dr Brian Creedon, Clinical Lead, NOCA; Dr Deirdre Mulholland – Director of Public Health, HSE East; Ms Deirdre Murphy, Head of HIPE & NPRS, Healthcare Pricing Office; Mr Fiachra Bane, Head of Data Analytics, Healthcare Pricing Office.
Date 5th May 2021
Terms of disclosure and usage
Recipients should acknowledge the National Office of Clinical Audit and the HealthCare Pricing Office as
the source of the data.
3
Contents
GLOSSARY...................................................................................................................................................... 4
CHAPTER 1: INTRODUCTION ......................................................................................................................... 6
CHAPTER 2: METHODS .................................................................................................................................. 9
INCLUSION CRITERIA ................................................................................................................................. 9
EXCLUSION CRITERIA .............................................................................................................................. 10
CHAPTER 3: HEART ATTACK ACTIVITY BASED ON HIPE DATA ..................................................................... 12
INTRODUCTION ....................................................................................................................................... 12
CASES WITH A HEART ATTACK AND COVID-19 DIAGNOSIS .................................................................... 21
SUMMARY ............................................................................................................................................... 22
CHAPTER 4: IRISH HEART ATTACK AUDIT ACTIVITY BASED ON HEARTBEAT DATA .................................... 23
INTRODUCTION ....................................................................................................................................... 23
IHAA ACTIVITY ......................................................................................................................................... 24
REPERFUSION THERAPY .......................................................................................................................... 27
SECONDARY PREVENTION ...................................................................................................................... 42
SUMMARY ............................................................................................................................................... 45
CHAPTER 5: THE NATIONAL OUT-OF-HOSPITAL CARDIAC ARREST REGISTER ACTIVITY ............................. 46
INTRODUCTION ....................................................................................................................................... 46
OHCAR ACTIVITY ..................................................................................................................................... 47
SURVIVAL STATUS ................................................................................................................................... 57
SUMMARY ............................................................................................................................................... 58
CONCLUSION ............................................................................................................................................... 59
REFERENCES ................................................................................................................................................ 61
ACKNOWLEDGEMENTS ............................................................................................................................... 64
Appendix 1: ICD 10 Codes for STEMI and NSTEMI ...................................................................................... 65
Appendix 2: Optimal Reperfusion Service Protocol .................................................................................... 66

4
GLOSSARY
Explanation of acronyms, abbreviations and other key terms used in this report.
CTB Call to Balloon
CTD Call to Door
Cath lab Catheterization laboratory
CI Confidence Interval (at the 95% level)
CPR Cardiopulmonary resuscitation
DFB Dublin Fire Brigade
DTB Door to Balloon
ECG Electrocardiogram
ED Emergency Department
EMS Emergency Medical Services
HeartBeat Web based data collection tool
HIPE Hospital In-Patient Enquiry
HPO Healthcare Pricing Office
HSE Health Service Executive
IHAA Irish Heart Attack Audit
KPI Key performance indicator
KQI Key quality indicator
LOS Length of stay
MI Myocardial Infarction
NAS National Ambulance Service
5
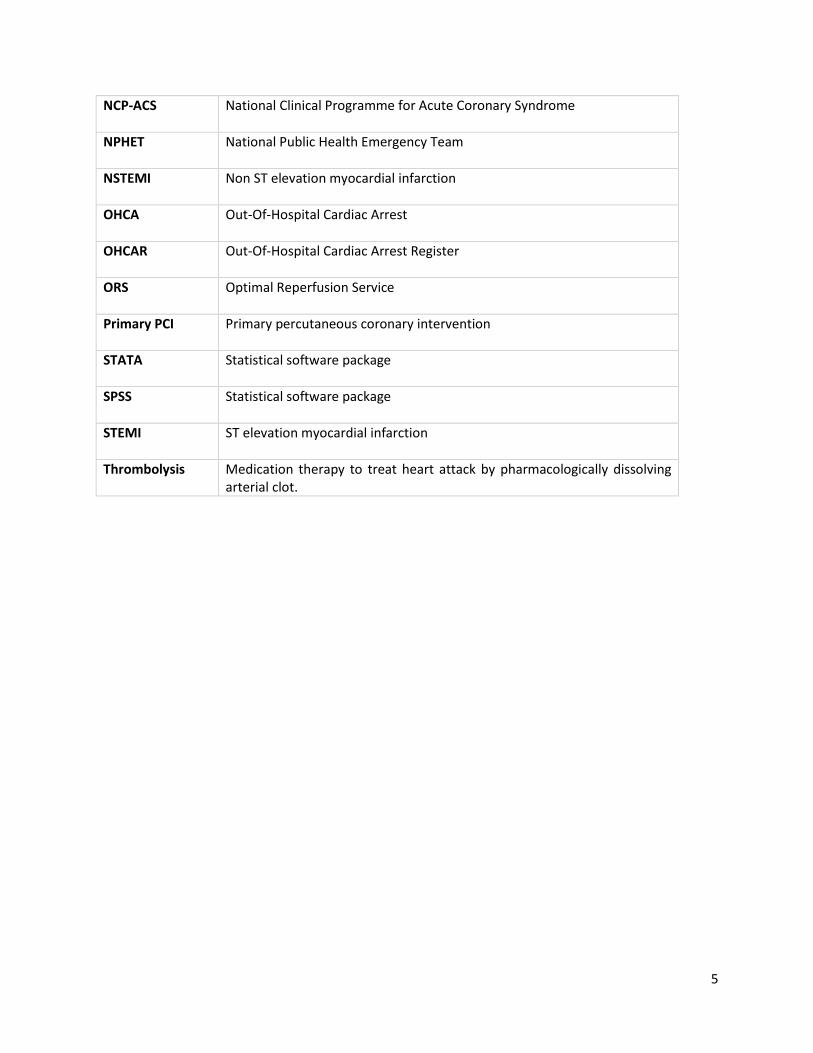
NCP-ACS National Clinical Programme for Acute Coronary Syndrome
NPHET National Public Health Emergency Team
NSTEMI Non ST elevation myocardial infarction
OHCA Out-Of-Hospital Cardiac Arrest
OHCAR Out-Of-Hospital Cardiac Arrest Register
ORS Optimal Reperfusion Service
Primary PCI Primary percutaneous coronary intervention
STATA Statistical software package
SPSS Statistical software package
STEMI ST elevation myocardial infarction
Thrombolysis Medication therapy to treat heart attack by pharmacologically dissolving arterial clot.

6
CHAPTER 1: INTRODUCTION
In December 2019, a novel strain of coronavirus disease commonly known as COVID-19, was identified in
the city of Wuhan in the Hubei province of China. This SARS (severe acute respiratory syndrome)-CoV-2
virus has spread globally and continues to cause significant disruption and strain on healthcare services,
societal life, and the economies all over the world.
On the 27th January 2020, the National Public Health Emergency Team (NPHET) for COVID-19 was created
to co-ordinate the Irish response to the pandemic. Following this, the Coronavirus Expert Advisory Group,
a subgroup of NPHET met for the first time on the 5th February 2020. The first confirmed case in Ireland
was identified on the 29th February 2020. Containment measures were put in place initially. In early
March a number of other cases were also diagnosed and the first fatality was documented on the 11th
March 2020. The World Health Organization declared a global pandemic outbreak on 11th March 2020.
On the 12th March 2020, An Taoiseach, Leo Varadkar T.D., announced the closure of all schools, colleges
and childcare facilities until 29th March. By the 27th March 2020, the Taoiseach announced further
restrictions designed to curb community viral transmission, and a national stay-at-home order was issued.
This was extended on the 10th April until 5th May 2020. By the 1st May 2020, the pandemic had resulted
in a total of 20,833 cases and 1,265 deaths (HPSC, 2020), and continued community transmission trends
led the Taoiseach to announce a further extension of restrictions until 18th May 2020. On the 15th May
2020 the Government of Ireland confirmed that phase one of easing the COVID-19 restrictions would
begin on 18th May.
During this period of extreme societal and economic strain, the healthcare system was under huge stress
and turbulence in preparation for potential surge of severely unwell patients with COVID-19. The
requirements undertaken by the healthcare system in preparation for this surge meant most elective and
routine work stopped abruptly. Work was undertaken to create capacity in the acute hospitals and in
particular in the intensive care units around Ireland. The preparedness of the healthcare service enabled
the hospitals to cope with the influx of COVID-19 admissions and prevent the health service becoming
acutely overwhelmed.
The reconfiguration of the health service towards potential care of COVID-19 and the impact of the
national stay-at-home order as well as public fear of contagion all potentially impact on the access,
delivery, and the outcomes of heart attack care across the Irish health system.
HEART ATTACK IN IRELAND
A heart attack is a life-threatening medical emergency in which the supply of blood to the heart is suddenly
interrupted or cut-off, usually by a blood clot forming at the site of narrowing
(atherosclerosis/arteriosclerosis; plaque build-up; “hardening of the arteries”). The abrupt lack of blood
supply to the heart can seriously damage the heart muscle. If left untreated, the heart muscle
downstream from the blockage will begin to die.
Whilst identifying people at higher risk for heart attack, treatments to reduce their risk, and interventions
to stop heart attack and reduce complications after heart attack have improved, resulting in a halving of
mortality in Ireland from heart attack compared to the 1970s, heart attack still affects an estimated 6000
people per year in Ireland. Thirty percent of people suffering a heart attack will die at home prior to

7
hospital admission. Of those who reach hospital, one in eight people experiencing a heart attack will die
within 30 days (12%), with three-quarters of deaths occurring within 24 hours of admission
(https://www.hse.ie/eng/health/az/h/heart-attack/).
Early recognition and treatment of heart attack is critical to the outcomes of people who have a heart
attack. There are two broad types of heart attack, distinguished by the electrocardiogram (ECG)
appearance:
ST elevation myocardial infarction (STEMI)
Non ST elevation myocardial infarction (NSTEMI).
STEMIs are major heart attacks caused by a blockage in the main arteries supplying blood to the heart
muscle (think of a blockage on a motorway and how it would affect traffic flow). STEMIs account for about
one quarter of all heart attacks each year in Ireland.
STEMIs are diagnosed using 12 lead ECG machines. They are treated urgently with reperfusion (restoring
blood flow) by either use of a clot-dissolving drug (thrombolysis) or by insertion of a wire into the artery
to open it using a balloon and/or stent (metal scaffold) to allow the blood to flow to the heart muscle
again. Internationally, the recognised gold standard treatment for STEMI is to perform emergency
reperfusion within 120 minutes of first medical contact. This is known as a primary percutaneous coronary
intervention (PPCI), sometimes referred to as a primary angioplasty and can only be done in a hospital
equipped with an emergency catheterisation laboratory. There is a national reperfusion treatment
protocol in Ireland for STEMI since 2012 (HSE, 2012).
NSTEMIs are slightly different in that a segment of plaque has either become eroded (think of a pothole
on the road) or ruptures (think of a volcano erupting) exposing the circulating blood to the underlying
internal surface of the artery resulting in clot formation on the surface which can temporarily interrupt
blood flow causing stuttering symptoms on and off over several hours or days. NSTEMIs account for about
three-quarters of heart attack admissions per year. NSTEMI heart attacks and unstable angina are initially
treated medically and in the majority of cases are sent for an early investigation of the arteries to the
heart (called an angiogram) done in a hospital equipped with a catheter laboratory, usually within 48
hours, and subsequent treatment can be with either medication, cardiac bypass surgery, or balloon
angioplasty/stenting, or combination of these treatments depending on the pattern of blockages, specific
characteristics and underlying conditions of each patient.
Internationally, COVID-19 surges and national lockdown measures have been reported to result in a
significant reduction in hospital admissions with acute myocardial infarction (ranging from 38% up to 48%
reductions in heart attack admissions), with reductions in both STEMI and NSTEMI admissions and
treatments reported in multiple jurisdictions, including the U.K. NHS (Mafram et al, 2020), USA (Solomon
et al, 2020; Garcia et al, 2020), Italy (DeRosa, 2020), Spain (Rodriguez-Leor, 2020) and Austria (Reinstadler
et al, 2020). The purpose of this report is to outline whether similar trends in declining heart attack
presentations occurred in Ireland, whether this was matched by a concomitant increase in out-of-hospital
cardiac arrests, and most importantly, whether the pandemic resulted in a negative impact on the process
and quality of heart attack care.

8
This report utilises data from the Hospital In-Patient Enquiry (HIPE) system, the Irish Heart Attack Audit
(IHAA) and from the Out-Of-Hospital Cardiac Arrest Register (OHCAR). Additional information on the IHAA
data and the OHCAR data is provided at the beginning of each chapter.
The aim of this report is to:
Assess the impact of COVID-19 on the admission numbers, quality of care and outcomes of heart attacks
included in HIPE, IHAA and OHCAR.
The objectives of this report are to:
• Assess the volume of inpatient activity before and during COVID-19 (2019-2020) for cases with
heart attack.
• Assess the change in the case-mix of heart attack admissions before and during COVID-19 (2019-
2020)
• Assess the quality and outcome of care provided pre-hospital and in-hospital for heart attack
using Key Quality Indicators (KQIs) before and during COVID-19 (2019-2020).
Target Audiences
Sharing of early learnings with the management of the HSE and the Department of Health to
help support the planning and management of the healthcare system during the COVID-19
pandemic. Inform future public health messaging regarding continuing usual emergency
healthcare during pandemic surges.
Wider healthcare community
General Public
Research community
9
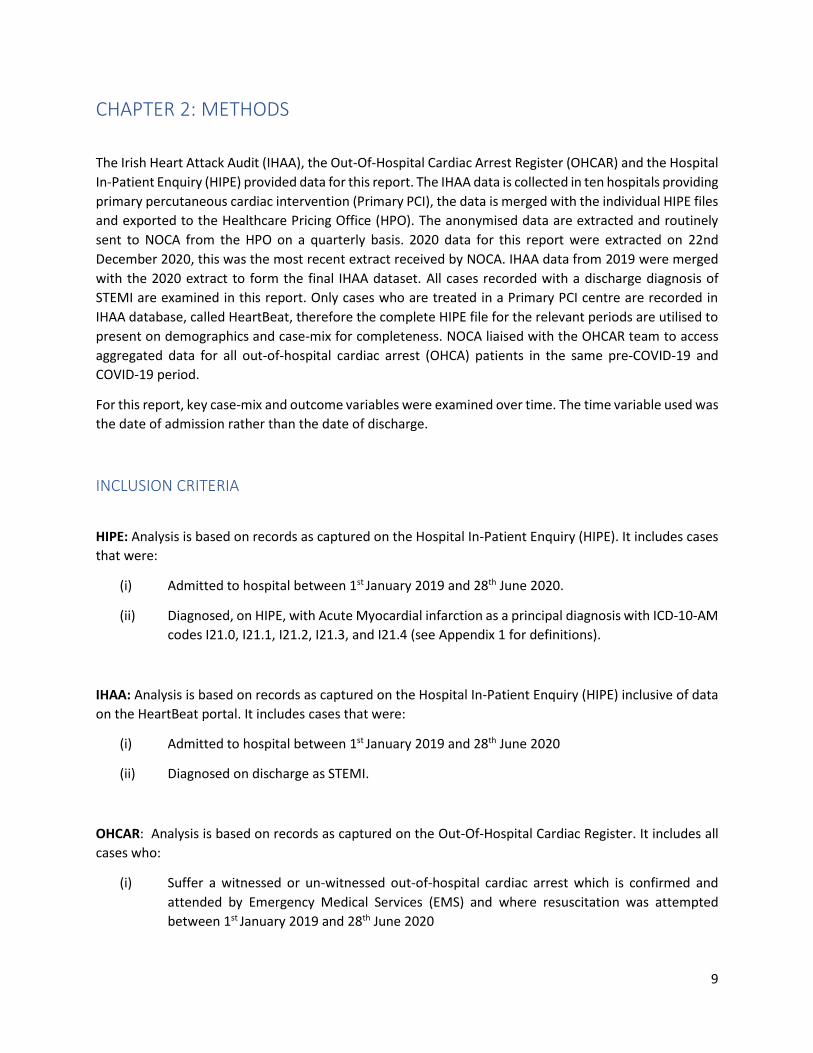
CHAPTER 2: METHODS
The Irish Heart Attack Audit (IHAA), the Out-Of-Hospital Cardiac Arrest Register (OHCAR) and the Hospital
In-Patient Enquiry (HIPE) provided data for this report. The IHAA data is collected in ten hospitals providing
primary percutaneous cardiac intervention (Primary PCI), the data is merged with the individual HIPE files
and exported to the Healthcare Pricing Office (HPO). The anonymised data are extracted and routinely
sent to NOCA from the HPO on a quarterly basis. 2020 data for this report were extracted on 22nd
December 2020, this was the most recent extract received by NOCA. IHAA data from 2019 were merged
with the 2020 extract to form the final IHAA dataset. All cases recorded with a discharge diagnosis of
STEMI are examined in this report. Only cases who are treated in a Primary PCI centre are recorded in
IHAA database, called HeartBeat, therefore the complete HIPE file for the relevant periods are utilised to
present on demographics and case-mix for completeness. NOCA liaised with the OHCAR team to access
aggregated data for all out-of-hospital cardiac arrest (OHCA) patients in the same pre-COVID-19 and
COVID-19 period.
For this report, key case-mix and outcome variables were examined over time. The time variable used was
the date of admission rather than the date of discharge.
INCLUSION CRITERIA
HIPE: Analysis is based on records as captured on the Hospital In-Patient Enquiry (HIPE). It includes cases
that were:
(i) Admitted to hospital between 1st January 2019 and 28th June 2020.
(ii) Diagnosed, on HIPE, with Acute Myocardial infarction as a principal diagnosis with ICD-10-AM
codes I21.0, I21.1, I21.2, I21.3, and I21.4 (see Appendix 1 for definitions).
IHAA: Analysis is based on records as captured on the Hospital In-Patient Enquiry (HIPE) inclusive of data
on the HeartBeat portal. It includes cases that were:
(i) Admitted to hospital between 1st January 2019 and 28th June 2020
(ii) Diagnosed on discharge as STEMI.
OHCAR: Analysis is based on records as captured on the Out-Of-Hospital Cardiac Register. It includes all
cases who:
(i) Suffer a witnessed or un-witnessed out-of-hospital cardiac arrest which is confirmed and
attended by Emergency Medical Services (EMS) and where resuscitation was attempted
between 1st January 2019 and 28th June 2020

10
EXCLUSION CRITERIA
HIPE: None
IHAA: Cases with a confirmed alternative diagnosis other than STEMI have been excluded.
OHCAR: None
Myocardial Infarction with concomitant COVID-19 DEFINITION
Cases with Myocardial Infarction were defined as having a positive COVID-19 status if they had a
secondary ICD-10-AM code recorded as:
I. U07.1: Coronavirus identified, confirmed by laboratory testing
II. B34.2: Coronavirus infection unspecified site
III. B97.2 Coronavirus as the cause of diseases classified to other chapters to identify the
infectious agent
The case definitions and availability of testing for COVID-19 varied throughout the initial stages of the
pandemic which may affect case ascertainment.
COVID-19 DATA PERIOD
For the purpose of the analysis in this report, we defined the pre-COVID-19 period as 1st January 2019 -
1st March 2020, and the COVID-19 period from 2nd March 2020 to 28th June 2020. The same periods were
applied and compared between the HIPE, IHAA and OHCAR datasets.
DATA ANALYSIS
Data analysis was conducted using STATA and SPSS. The analysis focused on identifying differences
between the pre-COVID-19 period (January 2019 - February 2020) and the COVID-19 period (March 2020
– June 2020) in terms of number of admissions, case-mix of admitted cases, and standards of care.
Graphical presentations show the weekly data for the two periods. Where appropriate, statistical tests
assessed the statistical difference between the two periods. Chi-squared statistical tests (for binary and
categorical variables) were used to determine whether there was a statistical difference in the distribution
of cases between the pre-COVID-19 and COVID-19 periods for key outcome and process variables. Where
appropriate, t-tests (continuous variable outcomes) were used, to determine the statistical difference in
the means between the pre-COVID-19 and COVID-19 periods. Mann-Whitney Test was used to determine
the statistical difference in the medians, and two-sample tests of proportions were used to test for
differences in proportions for categorical variables. As measure of statistical uncertainty 95% confidence
intervals were presented for means of numerical variables such as number of cases and length of stay.
Where the observed p-value was less than or equal to 0.05 this was considered to indicate statistical
significance. The cohort of MI cases identified were further sub divided into the following age groups:
young 20-40 years, middle aged 40-60 years, elderly 60-80 years, extreme elderly >80 years broadly based
on world health organisation (WHO) definitions of ageing. DATA LIMITATIONS

11
Due to the evolving nature of this pandemic, the analyses in this report should be interpreted with the
following caveats:
I. Case definition and testing for COVID-19 is new and evolving;
II. HIPE coding for COVID-19 is guided by classification releases from the World Health
Organisation and the Independent Hospital Pricing Authority, Australia. Further
guidance is awaited;
III. Timelines for HIPE coding of COVID-19 have been expedited;
IV. The HIPE dataset for this report has been created much earlier than normal i.e.
without the usual validation processes in order to facilitate rapid learning from this
evolving situation and therefore the HIPE dataset is still subject to change until the
file is closed in 2021;
V. Following the temporary suspension of the private healthcare sector in March 2020
and the use of their facilities by the HSE to deliver non-COVID-19 healthcare, it is
possible some patients with Heart Attack were cared for directly or following ED
transfer in the private hospital environment. These cases would not be included in
the HIPE or heartbeat portal figures;
VI. Information from death registration and certification statistics via the Central Statistics Office are not available to ascertain whether there was a concomitant increase in deaths attributable to diseases of the cardiovascular system, specifically myocardial infarction over the study period of interest.
VII. This is the first time that the IHAA data has been analysed in NOCA and it pre-dates the analysis of the first IHAA 2017-2020 National Report. Caution is advised if making direct comparison between the two reports as there may be some minor variations within the analysis.
REPORT STRUCTURE
This report focuses on data of cases with heart attack analysed from three data sources:
1) HIPE data has been used to look at all cases of STEMI and NSTEMI admitted to hospital, representing
the national level of service provision, with the following ICD-10-AM diagnoses: I21.0, I21.1, I21.2,
I21.3 (STEMI) and I21.4 (NSTEMI) as a principal diagnosis (Appendix 1).
2) IHAA data has been used to look to at the quality of care provided to patients with a diagnosis of
STEMI who received care in a Primary PCI or PCI centre, which is not routinely captured in HIPE data.
3) OHCAR has been used to look at the pre-hospital care provided to patients who had an out-of-
hospital cardiac arrest.
The above three data sets were used to capture the overall impact that the COVID-19 pandemic had on
the care of heart attack patients and patients who had an out of hospital cardiac arrest.
12
CHAPTER 3: HEART ATTACK ACTIVITY BASED ON HIPE DATA
INTRODUCTION
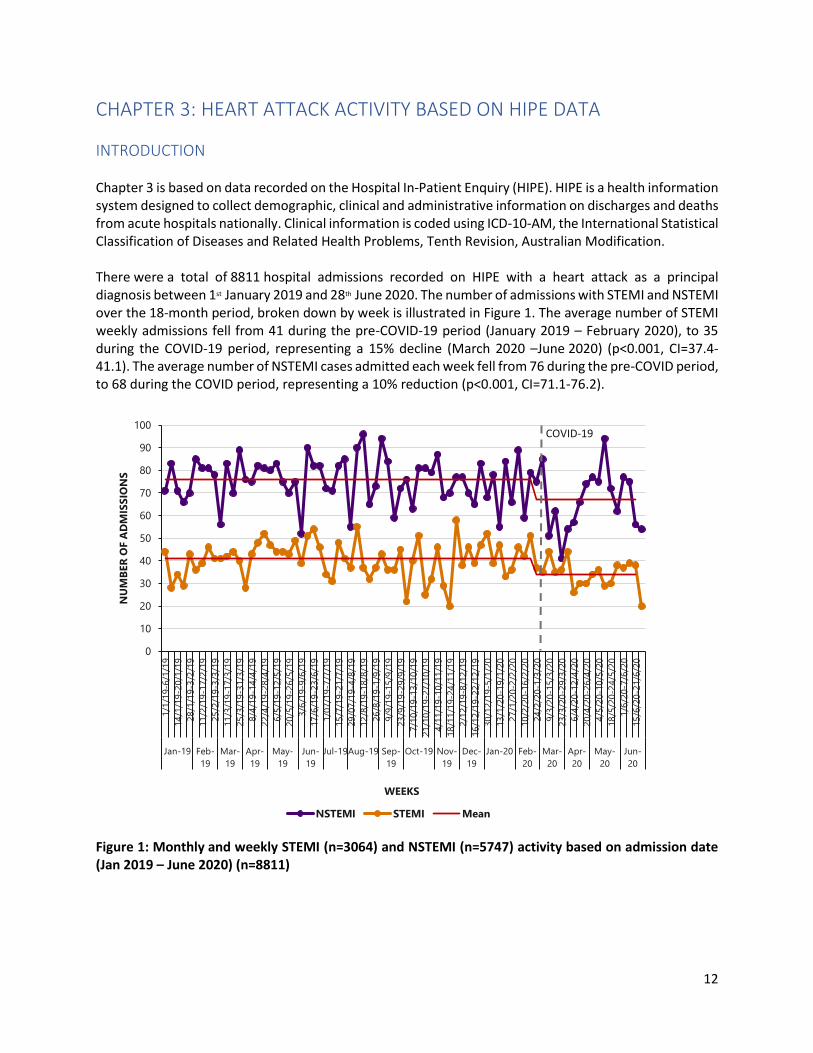
Chapter 3 is based on data recorded on the Hospital In-Patient Enquiry (HIPE). HIPE is a health information system designed to collect demographic, clinical and administrative information on discharges and deaths from acute hospitals nationally. Clinical information is coded using ICD-10-AM, the International Statistical Classification of Diseases and Related Health Problems, Tenth Revision, Australian Modification. There were a total of 8811 hospital admissions recorded on HIPE with a heart attack as a principal diagnosis between 1st January 2019 and 28th June 2020. The number of admissions with STEMI and NSTEMI over the 18-month period, broken down by week is illustrated in Figure 1. The average number of STEMI weekly admissions fell from 41 during the pre-COVID-19 period (January 2019 – February 2020), to 35 during the COVID-19 period, representing a 15% decline (March 2020 –June 2020) (p<0.001, CI=37.4-41.1). The average number of NSTEMI cases admitted each week fell from 76 during the pre-COVID period, to 68 during the COVID period, representing a 10% reduction (p<0.001, CI=71.1-76.2).
Figure 1: Monthly and weekly STEMI (n=3064) and NSTEMI (n=5747) activity based on admission date (Jan 2019 – June 2020) (n=8811)
0
10
20
30
40
50
60
70
80
90
100
1/1
/19-6
/1/1
9
14
/1/1
9-2
0/1
/19
28
/1/1
9-3
/2/1
9
11
/2/1
9-1
7/2
/19
25
/2/1
9-3
/3/1
9
11
/3/1
9-1
7/3
/19
25
/3/1
9-3
1/3
/19
8/4
/19-1
4/4
/19
22
/4/1
9-2
8/4
/19
6/5
/19-1
2/5
/19
20
/5/1
9-2
6/5
/19
3/6
/19-9
/6/1
9
17
/6/1
9-2
3/6
/19
1/0
7/1
9-7
/7/1
9
15
/7/1
9-2
1/7
/19
29
/07
/19-4
/8/1
9
12
/8/1
9-1
8/8
/19
26
/8/1
9-1
/9/1
9
9/9
/19-1
5/9
/19
23
/9/1
9-2
9/9
/19
7/1
0/1
9-1
3/1
0/1
9
21
/10
/19-2
7/1
0/1
9
4/1
1/1
9-1
0/1
1/1
9
18
/11
/19-2
4/1
1/1
9
2/1
2/1
9-8
/12/1
9
16
/12
/19-2
2/1
2/1
9
30
/12
/19-5
/1/2
0
13
/1/2
0-1
9/1
/20
27
/1/2
0-2
/2/2
0
10
/2/2
0-1
6/2
/20
24
/2/2
0-1
/3/2
0
9/3
/20-1
5/3
/20
23
/3/2
0-2
9/3
/20
6/4
/20-1
2/4
/20
20
/4/2
0-2
6/4
/20
4/5
/20-1
0/5
/20
18
/5/2
0-2
4/5
/20
1/6
/20-7
/6/2
0
15
/6/2
0-2
1/6
/20
Jan-19 Feb-
19
Mar-
19
Apr-
19
May-
19
Jun-
19
Jul-19Aug-19 Sep-
19
Oct-19 Nov-
19
Dec-
19
Jan-20 Feb-
20
Mar-
20
Apr-
20
May-
20
Jun-
20
NU
MB
ER
OF A
DM
ISS
ION
S
WEEKS
NSTEMI STEMI Mean
COVID-19

13
SEX AND AGE
Tables 1 and 2 and Figure 2 show the number and percentage of hospital admissions with a heart attack during the two time periods, pre-COVID-19 and COVID-19 broken down by sex and age group. The mean age of cases diagnosed with a heart attack was 67 years. During COVID-19, the majority of heart attack cases were male n=1274 (72.2%) and aged 60 to 79 years of age n=919 (52.1%). Overall, there was no statistically significant difference in the sex (p=0.193) of heart attack cases between the two time periods. However, there was a statistically significant difference in cases aged >80 years (p=0.029) which decreased from 21.1% (n=1483/7046) to 18.7% (n=330/1765) in the COVID-19 period. Table 1: Sex of heart attack admissions (STEMI and NSTEMI) during the pre-COVID-19 (n=7046) and COVID-19 (n=1765) periods
PRE-COVID-19 (Jan'19-Feb’20) COVID-19 (Mar’20-Jun’20) TOTAL
SEX n % n % n % p-value
Male 4975 70.6% 1274 72.2% 6249 70.9% 0.193
Female 2071 29.4% 491 27.8% 2562 29.1% 0.193
Total 7046 100% 1765 100% 8811 100%
Table 2: Age of heart attack admissions (STEMI and NSTEMI) during the pre-COVID-19 (n=7046) and COVID-19 (n=1765) periods
PRE-COVID-19
(Jan’19-Feb’20) COVID-19
(Mar’20-Jun’20) TOTAL
AGE n % n % n % p-value
20-39 years 133 1.9% 35 1.9% 168 1.9% 0.793
40-59 years 1909 27.1% 481 27.3% 2390 27.1% 0.893
60-79 3521 49.9% 919 52.1% 4440 50.4% 0.115
>=80 years 1483 21.1% 330 18.7% 1813 20.6% 0.029
Total 7046 100% 1765 100% 8811 100%

14
Figure 2: Age of heart attack admissions (STEMI and NSTEMI) during the pre-COVID-19 (n=7046) and COVID-19 (n=1765) periods (n=8811)1
1 Please note: Percentages may not sum to 100% due to rounding
2% 2%
27% 27%
49%52%
21%19%
0%
10%
20%
30%
40%
50%
60%
70%
80%
90%
100%
pre-COVID-19 (n=7046) COVID-19 (n=1765)
PER
CEN
TA
GE
20-39 40-59 60-79 80+
15
ADMISSION SOURCE
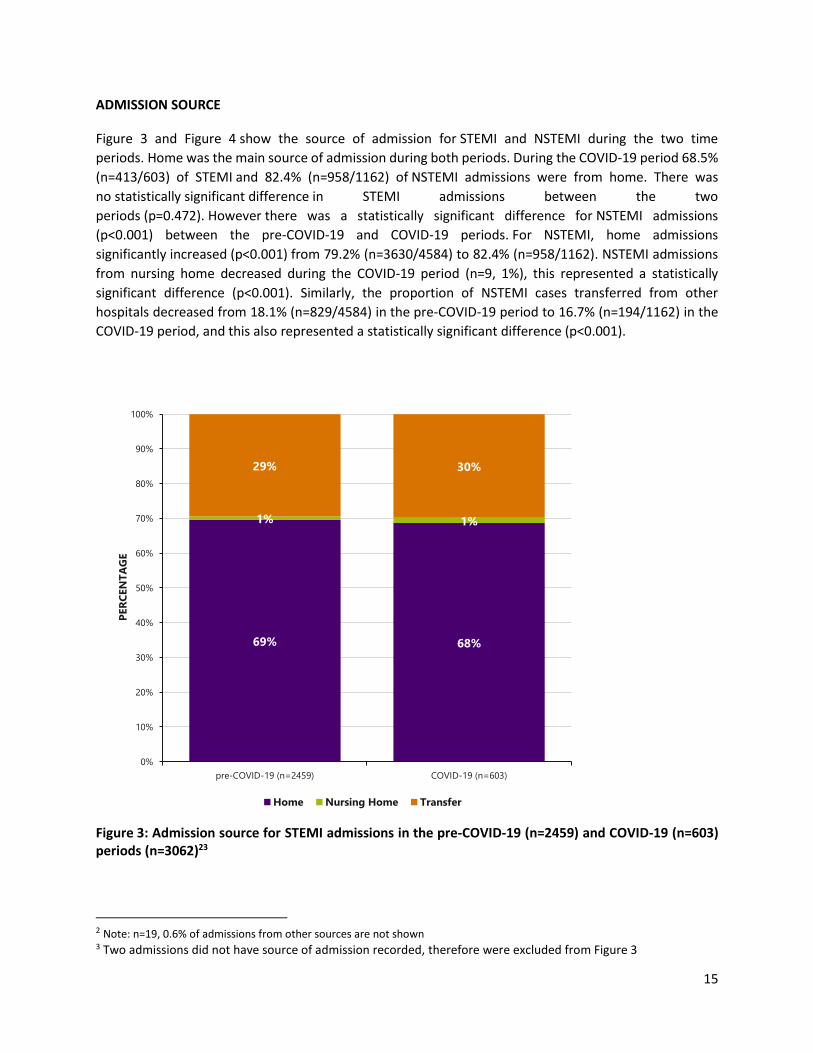
Figure 3 and Figure 4 show the source of admission for STEMI and NSTEMI during the two time
periods. Home was the main source of admission during both periods. During the COVID-19 period 68.5%
(n=413/603) of STEMI and 82.4% (n=958/1162) of NSTEMI admissions were from home. There was
no statistically significant difference in STEMI admissions between the two
periods (p=0.472). However there was a statistically significant difference for NSTEMI admissions
(p<0.001) between the pre-COVID-19 and COVID-19 periods. For NSTEMI, home admissions
significantly increased (p<0.001) from 79.2% (n=3630/4584) to 82.4% (n=958/1162). NSTEMI admissions
from nursing home decreased during the COVID-19 period (n=9, 1%), this represented a statistically
significant difference (p<0.001). Similarly, the proportion of NSTEMI cases transferred from other
hospitals decreased from 18.1% (n=829/4584) in the pre-COVID-19 period to 16.7% (n=194/1162) in the
COVID-19 period, and this also represented a statistically significant difference (p<0.001).
Figure 3: Admission source for STEMI admissions in the pre-COVID-19 (n=2459) and COVID-19 (n=603) periods (n=3062)23
2 Note: n=19, 0.6% of admissions from other sources are not shown 3 Two admissions did not have source of admission recorded, therefore were excluded from Figure 3
69% 68%
1% 1%
29% 30%
0%
10%
20%
30%
40%
50%
60%
70%
80%
90%
100%
pre-COVID-19 (n=2459) COVID-19 (n=603)
PER
CEN
TA
GE
Home Nursing Home Transfer

16
Figure 4: Admission source for NSTEMI admissions in the pre-COVID-19 (n=4584) and COVID-19 (n=1162) periods (n=5746)45
4 Note: n=27, 0.5% of admissions from other sources are not shown 5 One admissions did not have source of admission recorded, therefore weas excluded from Figure 4
79%82%
2%1%
18% 17%
0%
10%
20%
30%
40%
50%
60%
70%
80%
90%
100%
pre-COVID-19 (N=4584) COVID-19 (N=1162)
PER
CEN
TA
GE
Home Nursing home Transfer

17
LENGTH OF STAY
Figures 5 and 6 show the median length of stay of STEMI and NSTEMI hospital admissions during the reporting period. A rank sum statistical test (Mann-Whitney) was used to test ranks of the STEMI LOS in the two time periods, although the median LOS was the same for both pre-COVID-19 (median LOS=3 days; IQ=1, 6) and COVID-19 (median LOS=3 days; IQR=1, 5) periods, this test yielded a statistically significant difference (p<0.001). Similarly, for NSTEMI, there was a statistically significant difference (p<0.001) in the median length of stay of admissions during the pre-COVID-19 period (median LOS=4 days; IQR=2, 8) and the median length of stay of admissions during the COVID-19 period (median LOS=3.5 days; IQR=2, 7). Further work is required to understand the mechanisms leading to and implications of the reduction in median LOS both positive and negative.
Figure 5: Median Length of stay of STEMI admissions in the pre-COVID-19 (n=2461) and COVID-19 (n=603) periods (N=3064)
0
1
2
3
4
5
1/1
/19-6
/1/1
9
14
/1/1
9-2
0/1
/19
28
/1/1
9-3
/2/1
9
11
/2/1
9-1
7/2
/19
25
/2/1
9-3
/3/1
9
11
/3/1
9-1
7/3
/19
25
/3/1
9-3
1/3
/19
8/4
/19-1
4/4
/19
22
/4/1
9-2
8/4
/19
6/5
/19-1
2/5
/19
20
/5/1
9-2
6/5
/19
3/6
/19-9
/6/1
9
17
/6/1
9-2
3/6
/19
1/0
7/1
9-7
/7/1
9
15
/7/1
9-2
1/7
/19
29
/07
/19-4
/8/1
9
12
/8/1
9-1
8/8
/19
26
/8/1
9-1
/9/1
9
9/9
/19-1
5/9
/19
23
/9/1
9-2
9/9
/19
7/1
0/1
9-1
3/1
0/1
9
21
/10
/19-2
7/1
0/1
9
4/1
1/1
9-1
0/1
1/1
9
18
/11
/19-2
4/1
1/1
9
2/1
2/1
9-8
/12/1
9
16
/12
/19-2
2/1
2/1
9
30
/12
/19-5
/1/2
0
13
/1/2
0-1
9/1
/20
27
/1/2
0-2
/2/2
0
10
/2/2
0-1
6/2
/20
24
/2/2
0-1
/3/2
0
9/3
/20-1
5/3
/20
23
/3/2
0-2
9/3
/20
6/4
/20-1
2/4
/20
20
/4/2
0-2
6/4
/20
4/5
/20-1
0/5
/20
18
/5/2
0-2
4/5
/20
1/6
/20-7
/6/2
0
15
/6/2
0-2
1/6
/20
Jan-19 Feb-
19
Mar-
19
Apr-
19
May-19 Jun-19 Jul-19 Aug-19 Sep-
19
Oct-19 Nov-
19
Dec-
19
Jan-20 Feb-
20
Mar-
20
Apr-
20
May-20 Jun-20
DA
YS
WEEKS
Median
COVID-19

18
Figure 6: Median Length of stay of NSTEMI admissions in the pre-COVID-19 (n=4585) and COVID-19 (n=1162) periods (n=5747)
0
1
2
3
4
5
6
7
1/1
/19-6
/1/1
9
14
/1/1
9-2
0/1
/19
28
/1/1
9-3
/2/1
9
11
/2/1
9-1
7/2
/19
25
/2/1
9-3
/3/1
9
11
/3/1
9-1
7/3
/19
25
/3/1
9-3
1/3
/19
8/4
/19-1
4/4
/19
22
/4/1
9-2
8/4
/19
6/5
/19-1
2/5
/19
20
/5/1
9-2
6/5
/19
3/6
/19-9
/6/1
9
17
/6/1
9-2
3/6
/19
1/0
7/1
9-7
/7/1
9
15
/7/1
9-2
1/7
/19
29
/07
/19-4
/8/1
9
12
/8/1
9-1
8/8
/19
26
/8/1
9-1
/9/1
9
9/9
/19-1
5/9
/19
23
/9/1
9-2
9/9
/19
7/1
0/1
9-1
3/1
0/1
9
21
/10
/19-2
7/1
0/1
9
4/1
1/1
9-1
0/1
1/1
9
18
/11
/19-2
4/1
1/1
9
2/1
2/1
9-8
/12/1
9
16
/12
/19-2
2/1
2/1
9
30
/12
/19-5
/1/2
0
13
/1/2
0-1
9/1
/20
27
/1/2
0-2
/2/2
0
10
/2/2
0-1
6/2
/20
24
/2/2
0-1
/3/2
0
9/3
/20-1
5/3
/20
23
/3/2
0-2
9/3
/20
6/4
/20-1
2/4
/20
20
/4/2
0-2
6/4
/20
4/5
/20-1
0/5
/20
18
/5/2
0-2
4/5
/20
1/6
/20-7
/6/2
0
15
/6/2
0-2
1/6
/20
Jan-19 Feb-
19
Mar-
19
Apr-
19
May-19 Jun-19 Jul-19 Aug-19 Sep-
19
Oct-19 Nov-
19
Dec-
19
Jan-20 Feb-
20
Mar-
20
Apr-
20
May-20 Jun-20
DA
YS
WEEKS
Median
COVID-19

19
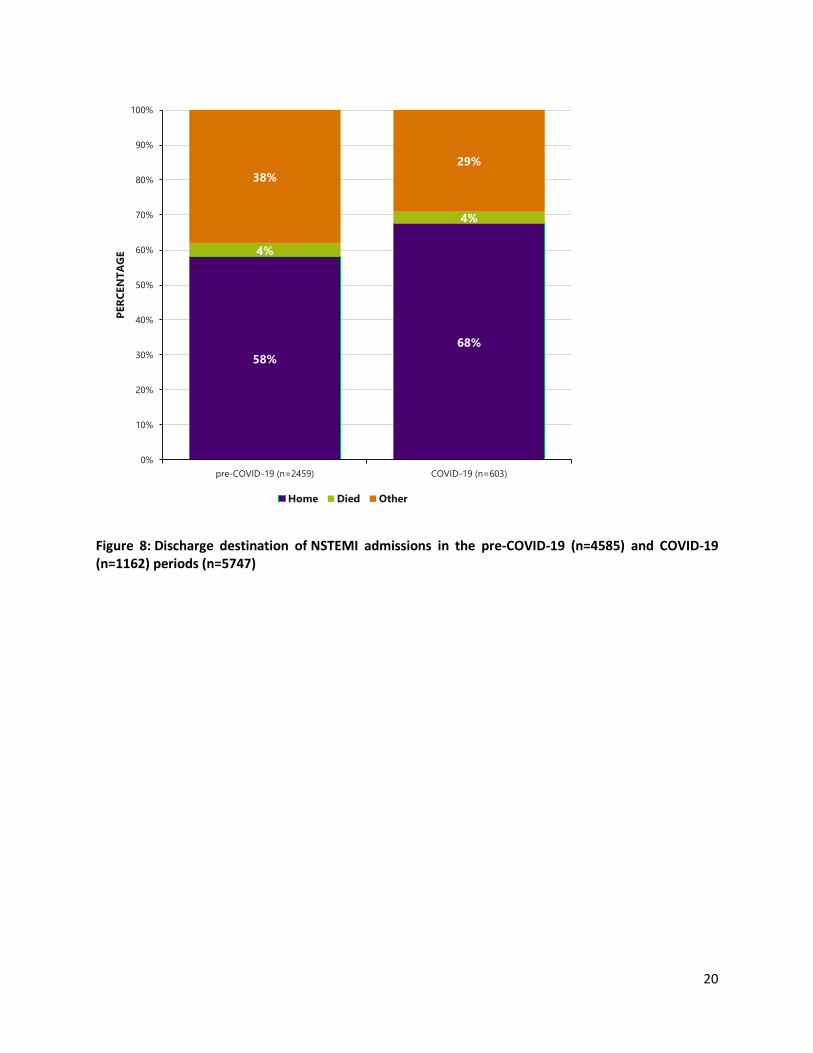
DISCHARGE DESTINATION
Figures 7 and 8 show the discharge destination of STEMI and NSTEMI admissions. There was a statistically significant difference for STEMI (p=0.017) and NSTEMI (p<0.001) admissions in the two time periods. For STEMI, discharges to home increased from 55.7% (n=1370/2461) pre-COVID-19 to 62% (n=374/603) in the COVID-19 period, and this was statistically significant (p<0.001). Similarly for NSTEMI, home discharges significantly increased from 58.1% (n=2663/4585) pre-COVID-19 to 67.6% (n=785/1162) in the COVID-19 period (p<0.001). There was no statistically significant differences across the remaining discharge outcomes between the two periods.
Figure 7: Discharge destination of STEMI admissions in the pre-COVID-19 (n=2461) and COVID-19 (n=603) periods (n=3064)
56%62%
6%
6%
38%32%
0%
10%
20%
30%
40%
50%
60%
70%
80%
90%
100%
pre-COVID-19 (n=2459) COVID-19 (n=603)
PER
CEN
TA
GE
Home Died Other
20
Figure 8: Discharge destination of NSTEMI admissions in the pre-COVID-19 (n=4585) and COVID-19 (n=1162) periods (n=5747)
58%
68%
4%
4%
38%
29%
0%
10%
20%
30%
40%
50%
60%
70%
80%
90%
100%
pre-COVID-19 (n=2459) COVID-19 (n=603)
PER
CEN
TA
GE
Home Died Other

21
CASES WITH A HEART ATTACK AND COVID-19 DIAGNOSIS
Preliminary data from HIPE show that 21 hospital admissions between March 1st and 30th June 2020 had a heart attack and a diagnosis of COVID-19 (Table 3). This cohort has been compared to heart attack hospital admissions in the same months (March to June) in 2019. Most heart attack admissions with a diagnosis of COVID-19 were NSTEMI (n=17, 81%). Admissions with a heart attack and a COVID-19 diagnosis were more likely to be male (n=15, 71%) and aged 60-79 years (n=9, 43%) compared to admissions in 2019. Furthermore, heart attack admissions with a COVID-19 diagnosis had a median length of stay of 9 days compared to 4 days for hospital admissions in 2019. In-patient mortality was recorded at 5% (n=1/21) in heart attack admissions with a COVID-19 diagnosis, and was the same as the 2019 admissions. It must be noted that the numbers in the COVID-19 cohort were extremely small, until we have more data we cannot conclusively state that there was any significant difference between these two cohorts. In addition, we cannot be definitive that this comprehensively captures all MI admissions with concomitant COVID-19 as some may be coded with alternative diagnosis such as type II myocardial infarction, Takotsubo or myocarditis and may not be reflected in these numbers.
Table 3. Cases with a heart attack and COVID-19
Heart Attack + COVID-19 2019 cases
Number of cases n=21 N=2,082
NSTEMI n=17 (81%) n=1,315 (63%)
STEMI n=4 (19%) n=767 (37%)
Sex
Male n=15 (71%) N=1,489 (72%)
Female n=6 (29%) N= 593(28%)
Age Group
40-59 years n=4 (19%) N=552 (27%)
60-79 years N=9 (43%) N=1,035 (50%)
80+ years n=8 (38%) N=457 (22%)
Median LOS 9 days 4 days
Admission source
Home n=17 (81%) N=1,555 (75%)
Other n=4 (19%) N=12 (0.6%)
Discharge destination
Home n=16 (76%) N=1,170 (56%)
Died n=1 (5%) N=96(5%)
Other n=4 (19%) N=816 (38%)

22
SUMMARY
The above HIPE data confirms similar trends in Ireland to those reported in the U.K., EU and the USA,
albeit with a smaller reduction in the numbers of STEMI and NSTEMI, at 15% and 10% respectively,
compared to 26% and 65% in Italy, and 21% and 37% respectively in the U.K. Similar to the U.K. experience,
the fall in numbers appears to predate the announcement of government restrictions by two weeks and
likely reflects widespread media reporting on rising viral transmission and case numbers generating
general population fear of viral contagion and therefore avoidance of healthcare settings. There was a
trend towards less admissions in particular in the elderly (>80) age group, perhaps due to the perceived
risk of potentially acquiring COVID-19 and higher risk of COVID-19 complications in this age group should
they seek medical attention or attend a healthcare setting.
As one would expect, the numbers admitted from home increased reflecting the stay-at-home directives,
and there were reductions in MI admissions from the nursing/care home sector, reflecting fear of viral
contagion with attendance at acute hospital settings, medical decisions to place ceilings on escalation of
care in residents in this sector to avoid hospital transfers and exposure to the virus in the hospital sector.
Similar to the U.K. and EU experience, less NSTEMI patients underwent hospital to hospital transfer likely
reflecting a decline in PCI rates in this population, more conservative medical management of
uncomplicated NSTEMI to shorten length of stay and avoid in-hospital viral acquisition and hospital to
hospital viral contamination. As a result, length of stay for NSTEMI declined, although some of this may
be due to transfer of NSTEMI patients into non-HSE private healthcare settings for angiography and
intervention where they remained to complete their episode of care.
Lastly, reflecting the desire to minimize cross infection of community healthcare settings, step down
facilities, and nursing homes, and the increased funding of community care packages to support care at
home, more patients were discharged directly home following myocardial infarction.

23
CHAPTER 4: IRISH HEART ATTACK AUDIT ACTIVITY BASED
ON HEARTBEAT DATA
INTRODUCTION
The IHAA utilises a clinical audit system called HeartBeat, aligned to the HIPE portal, to record data on
cases that are treated with primary percutaneous cardiac intervention (Primary PCI) and thrombolysis
following the Optimal Reperfusion Service (ORS) protocol (Appendix 2).
The ORS is a standardized treatment protocol developed by the National Clinical Programme for Acute
Coronary Syndrome (NCP-ACS) to standardise the care provided to patients with STEMI heart attack. Data
recorded on HeartBeat refers to patients who undergo reperfusion following the triggering of the ORS
protocol. HIPE records all episodes of STEMI including those that do not access a PPCI/PCI centre as part
of the ORS protocol and those that are transferred back from a Primary PCI centre following treatment.
As such, HIPE will always have a higher number of episodes than those recorded on HeartBeat. There are
10 hospitals that provide a Primary PCI service in Ireland. Seven hospitals are Primary PCI centres: six
provide a 24/7 service, (Altnagelvin Area Hospital provides PPCI coverage for Donegal as part of a cross-
border HSE-NHS care arrangement) and one centre provides a Monday -Friday 9am-5pm service. Three
other hospitals provide a Primary PCI service on a Monday-Friday 9am-5pm basis to patients who self-
present or are already in-patients within the hospital.
This chapter presents all cases recorded on HeartBeat with a discharge diagnosis of STEMI for the pre-
COVID-19 (Jan 19-Feb 20) and COVID-19 (Mar 20-Jun 20) periods.
24
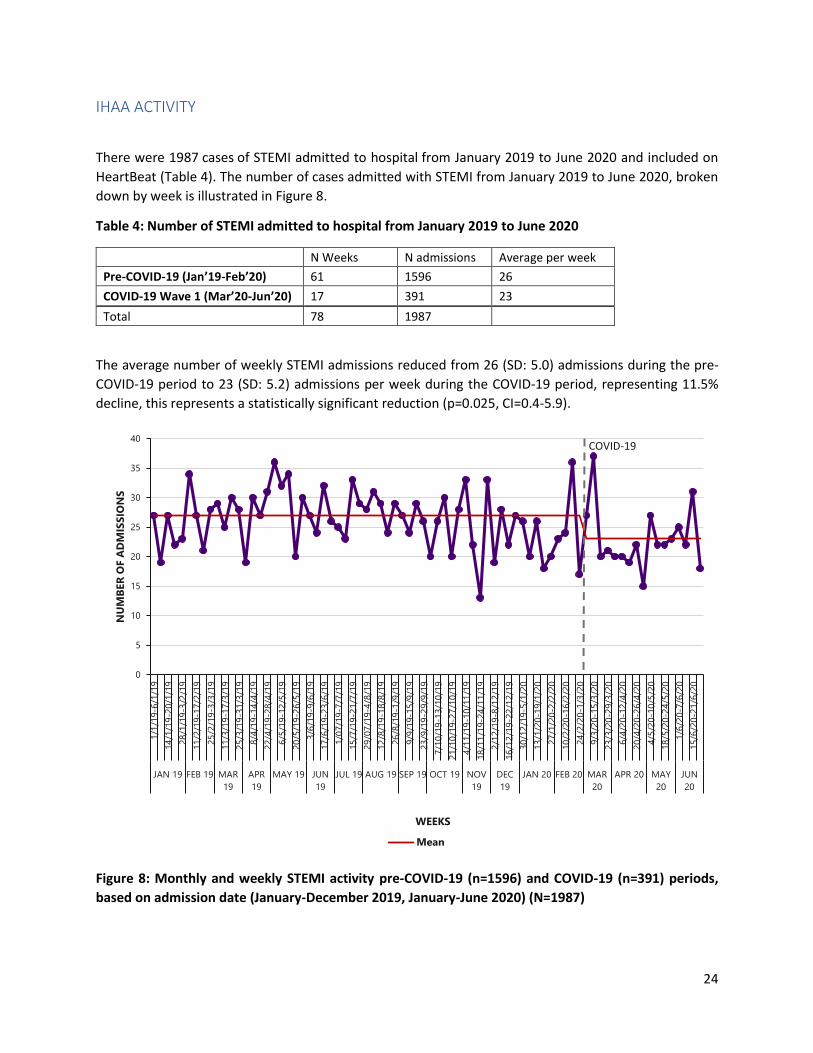
IHAA ACTIVITY
There were 1987 cases of STEMI admitted to hospital from January 2019 to June 2020 and included on
HeartBeat (Table 4). The number of cases admitted with STEMI from January 2019 to June 2020, broken
down by week is illustrated in Figure 8.
Table 4: Number of STEMI admitted to hospital from January 2019 to June 2020
The average number of weekly STEMI admissions reduced from 26 (SD: 5.0) admissions during the pre-
COVID-19 period to 23 (SD: 5.2) admissions per week during the COVID-19 period, representing 11.5%
decline, this represents a statistically significant reduction (p=0.025, CI=0.4-5.9).
Figure 8: Monthly and weekly STEMI activity pre-COVID-19 (n=1596) and COVID-19 (n=391) periods,
based on admission date (January-December 2019, January-June 2020) (N=1987)
0
5
10
15
20
25
30
35
40
1/1
/19-6
/1/1
9
14
/1/1
9-2
0/1
/19
28
/1/1
9-3
/2/1
9
11
/2/1
9-1
7/2
/19
25
/2/1
9-3
/3/1
9
11
/3/1
9-1
7/3
/19
25
/3/1
9-3
1/3
/19
8/4
/19-1
4/4
/19
22
/4/1
9-2
8/4
/19
6/5
/19-1
2/5
/19
20
/5/1
9-2
6/5
/19
3/6
/19-9
/6/1
9
17
/6/1
9-2
3/6
/19
1/0
7/1
9-7
/7/1
9
15
/7/1
9-2
1/7
/19
29
/07
/19-4
/8/1
9
12
/8/1
9-1
8/8
/19
26
/8/1
9-1
/9/1
9
9/9
/19-1
5/9
/19
23
/9/1
9-2
9/9
/19
7/1
0/1
9-1
3/1
0/1
9
21
/10
/19-2
7/1
0/1
9
4/1
1/1
9-1
0/1
1/1
9
18
/11
/19-2
4/1
1/1
9
2/1
2/1
9-8
/12/1
9
16
/12
/19-2
2/1
2/1
9
30
/12
/19-5
/1/2
0
13
/1/2
0-1
9/1
/20
27
/1/2
0-2
/2/2
0
10
/2/2
0-1
6/2
/20
24
/2/2
0-1
/3/2
0
9/3
/20-1
5/3
/20
23
/3/2
0-2
9/3
/20
6/4
/20-1
2/4
/20
20
/4/2
0-2
6/4
/20
4/5
/20-1
0/5
/20
18
/5/2
0-2
4/5
/20
1/6
/20-7
/6/2
0
15
/6/2
0-2
1/6
/20
JAN 19 FEB 19 MAR
19
APR
19
MAY 19 JUN
19
JUL 19 AUG 19 SEP 19 OCT 19 NOV
19
DEC
19
JAN 20 FEB 20 MAR
20
APR 20 MAY
20
JUN
20
NU
MB
ER
OF A
DM
ISS
ION
S
WEEKS
Mean
COVID-19
N Weeks N admissions Average per week
Pre-COVID-19 (Jan’19-Feb’20) 61 1596 26
COVID-19 Wave 1 (Mar’20-Jun’20) 17 391 23
Total 78 1987

25
SEX AND AGE
Table 5 and Figure 9 show the number and percentage of cases included in HeartBeat during the two time
periods, pre-COVID-19 and COVID-19 broken down by sex and age group. The majority of STEMI cases
during the pre-COVID-19 (n=1228, 76.9%) and during the COVID-19 (n=314, 80.3%) period were male.
There was no statistically significant difference in the sex (p=0.153) of cases with STEMI in the two time
periods.
The mean age of cases with STEMI pre-COVID-19 was 64 years and during the COVID-19 period was 63
years. There were less cases aged >80 years admitted during COVID-19 (n=35, 9.0%) compared to the -
COVID-19 period (n=189, 11.8%). However, this did not represent a statistically significant difference
(p=0.308).
Table 5: Sex of cases with STEMI admitted to hospital during the pre-COVID-19 and COVID-19 Wave 1
time periods
pre-COVID-19 (Jan’19-Feb’20) COVID-19 (Mar’20-Jun’20) p-values
N % N %
Male 1228 76.9% 314 80.3% 0.153
Female 368 23.1% 77 19.7% 0.153
Total 1596 100.0% 391 100.0%
Figure 9: Age groups of cases with STEMI admitted to hospital during the pre-COVID-19 (n=1596) and
COVID-19 (n=391) periods (N=1987)
2% 3%
37% 39%
49%49%
12% 9%
PER
CEN
TA
GE

26
LENGTH OF STAY
Figure 10 displays the weekly median number of days spent in a hospital. The median length of stay was
three days in both the pre-COVID-19 period (IQR = 1, 5) and in the COVID-19 period (IQR = 1, 4). A rank
sum statistical test (Mann-Whitney) was used to test ranks of the LOS in the two time periods, although
the median LOS was the same for both pre-COVID-19 and COVID-19 periods, this test yielded a statistically
significant difference (p<0.001).
Figure 10: Monthly and weekly length of stay pre-COVID-19 (n=1596) and COVID-19 (n=391) periods,
based on admission date (January-December 2019, January-June 2020) (N=1987)
0
1
2
3
4
5
6
1/1
/19-6
/1/1
9
14
/1/1
9-2
0/1
/19
28
/1/1
9-3
/2/1
9
11
/2/1
9-1
7/2
/19
25
/2/1
9-3
/3/1
9
11
/3/1
9-1
7/3
/19
25
/3/1
9-3
1/3
/19
8/4
/19-1
4/4
/19
22
/4/1
9-2
8/4
/19
6/5
/19-1
2/5
/19
20
/5/1
9-2
6/5
/19
3/6
/19-9
/6/1
9
17
/6/1
9-2
3/6
/19
1/0
7/1
9-7
/7/1
9
15
/7/1
9-2
1/7
/19
29
/07
/19-4
/8/1
9
12
/8/1
9-1
8/8
/19
26
/8/1
9-1
/9/1
9
9/9
/19-1
5/9
/19
23
/9/1
9-2
9/9
/19
7/1
0/1
9-1
3/1
0/1
9
21
/10
/19-2
7/1
0/1
9
4/1
1/1
9-1
0/1
1/1
9
18
/11
/19-2
4/1
1/1
9
2/1
2/1
9-8
/12/1
9
16
/12
/19-2
2/1
2/1
9
30
/12
/19-5
/1/2
0
13
/1/2
0-1
9/1
/20
27
/1/2
0-2
/2/2
0
10
/2/2
0-1
6/2
/20
24
/2/2
0-1
/3/2
0
9/3
/20-1
5/3
/20
23
/3/2
0-2
9/3
/20
6/4
/20-1
2/4
/20
20
/4/2
0-2
6/4
/20
4/5
/20-1
0/5
/20
18
/5/2
0-2
4/5
/20
1/6
/20-7
/6/2
0
15
/6/2
0-2
1/6
/20
JAN-19 FEB-
19
MAR-
19
APR-
19
MAY-19 JUN-
19
JUL-
19
AUG-19 SEP-
19
OCT-19 NOV-
19
DEC-
19
JAN-20 FEB-
20
MAR-
20
APR-
20
MAY-20 JUN-
20
MED
IAN
DA
YS
WEEKS
Median
COVID-19

27
REPERFUSION THERAPY
Reperfusion therapy is the treatment provided for STEMI patients aiming to reopen the occluded
(blocked) artery responsible for the heart attack in a timely fashion to minimize long-term heart injury. It
can be either a drug therapy; thrombolysis or an interventional treatment such as percutaneous cardiac
intervention (PCI). The aim of the ORS strategy is to maximise the number of patients accessing
reperfusion therapy following a heart attack and to optimise the timeliness of that reperfusion therapy.
The two national Key Performance Indicators (KPI) report on the percentage of cases who are reperfused
and the percentage of cases that access timely reperfusion. Timely Primary PCI is defined as the maximum
time from STEMI diagnosis (1st positive ECG) to Primary PCI (wire cross/balloon) less than or equal to 120
minutes by the NCP-ACS (HSE, 2012) based on ESC guidelines 2011 (ESC, 2011).
In some cases, patients are not eligible for reperfusion therapy and these cases are recorded as
‘contraindicated’. The most common reason for contraindication is presentation too late to access
treatment within the agreed timeframe.
There was a smaller proportion of cases that were contraindicated during the COVID-19 period (n=17,
4.3%) compared to the pre-COVID-19 period (n=151, 9.5%) (Figure 11). This represents a statistically
significant difference (p<0.001). The difference appears to be linked to age as evident from Figure 12.
There was a smaller proportion of cases that were contraindicated in the 40-59 year age group during the
COVID-19 period (n<5, 1.3%) compared to the pre-COVID-19 period (n=46, 7.7%). This represents a
statistically significant difference (p<0.001).
Figure 11: Percentage of cases with STEMI that were admitted to hospital during the pre-COVID-19
(n=1595) and COVID-19 (n=391) periods that were contraindicated (N=1986)6
6 One cases did not have contraindication recorded, therefore was excluded from Figure 11
9%4%
91%96%
pre-COVID-19 (n=1595) COVID-19 (n=391)
PER
CEN
TA
GE
Contra-indicated Not contra-indicated

28
Figure 12: Percentage of cases with STEMI that were admitted to hospital during the pre-COVID-19
(n=1595) and COVID-19 (n=391) time periods that were contraindicated by age group (N=1986)7
7 One cases did not have contraindication recorded, therefore was excluded from Figure 12
13%8% 9%
17%9% 8% 1% 5%
14%
4%
87%92% 91%
83%91% 92%
99% 95%
86%
96%
0%
20%
40%
60%
80%
100%
<39 40-59 60-79 80+ Total <39 40-59 60-79 80+ Total
pre-COVID-19 (n=1595) COVID-19 (n=391)
PER
CEN
TA
GE
AGE GROUPS
Contra-indicated Not contra-indicated

29
KPI 1: PERCENTAGE OF STEMI PATIENTS (WITHOUT CONTRAINDICATION TO REPERFUSION THERAPY)
WHO RECEIVED PRIMARY PCI
Overall there were 1818 cases (pre-COVID-19: n=1444; COVID-19: n=374) with STEMI who were not
contraindicated to reperfusion therapy. Out of those cases, 1736 received Primary PCI or hospital and pre-
hospital thrombolysis (pre-COVID-19: n=1379, 95.5%; COVID-19: n=357, 95.5%).
Figure 13 shows a breakdown of the percentage of cases who received Primary PCI and thrombolysis over
the two time periods. There was no statistically significant difference (p=0.715) in the proportion of cases
who received Primary PCI or thrombolysis in the two time periods.
Figure 13: KPI 1 Reperfusion therapy type of cases with STEMI admitted to hospital during the pre-
COVID-19 (n=1444) and COVID-19 (n=374) time periods (N=1818)8
8 Figure 13 only include cases who were not contraindicated
4% 5%
92% 91%
5% 5%
pre-COVID-19 (n=1444) COVID-19 (n=374)
PER
CEN
TA
GE
Hospital thrombolysis and pre-hosp thrombolysis Primary PCI None

30
KPI 2: PERCENTAGE OF REPERFUSED STEMI PATIENTS WHO RECEIVED TIMELY PRIMARY PCI
Primary Percutaneous Coronary Intervention (Primary PCI)
The proportion of cases who received timely Primary PCI declined from 67.2% (n=889) in the pre-COVID-
19 period to 64.6% (n=219) in the COVID-19 period (Figure 14), however this was not a statistically
significant (p=0.366) reduction.
Figure 14: KPI 2 Timely Primary PCI of cases with STEMI admitted to hospital during the pre-COVID-19
(n=1323) and COVID-19 (n=339) time periods (N=1662)9
9 Figure 14 only include cases who were not contraindicated and received Primary PCI
67% 65%
33% 35%
PER
CEN
TA
GE
Timely PPCI Not timely PPCI

31
Hospital and pre-hospital thrombolysis
There was a slight increase in the proportion of cases who received timely hospital and pre-hospital
thrombolysis, increasing from 30.4% (n=17) in the pre-COVID-19 period to 33.3% (n=6) in the COVID-19
period (Figure 15). This difference was not statistically significant (p=0.812).
Figure 15: KPI 2 Timely hospital and pre-hospital thrombolysis of cases with STEMI admitted to hospital
during the pre-COVID-19 (n=56) and COVID-19 (n=18) time periods (N=74)10
10 Figure 15 only include cases who were not contraindicated and received hospital and pre-hospital thrombolysis
70% 67%
30% 33%
PER
CEN
TA
GE
Timely hospital and pre-hospital thrombolysis
Not timely hospital and pre-hospital thrombolysis

32
Arrival at the Primary PCI centre
Cases that are brought directly by ambulance to a Primary PCI centre can be brought either directly to the
catheterisation laboratory (cath lab) or to the emergency department (ED).
Figure 16 indicates the location of arrival at the Primary PCI centre of cases with STEMI, who were
admitted directly via ambulance during the pre-COVID-19 and COVID-19 time periods. There was a higher
proportion of cases admitted directly to the cath lab during COVID-19 period (n=208, 84.9%) compared to
the pre-COVID-19 period and this was statistically significant (p=0.001). Current ESC guidelines endorse
ED bypass protocols as standard of care to minimize reperfusion delays.
Figure 16: location of arrival at the Primary PCI centre of cases with STEMI, who were admitted directly
via ambulance during the pre-COVID-19 (n=897) and COVID-19 (n=245) time periods (N=1142)11
11 Figure 16 only includes cases who were admitted directly via ambulance service
1%
73%
85%
26%
15%
0%
10%
20%
30%
40%
50%
60%
70%
80%
90%
100%
pre-COVID-19 (n=897) COVID-19 (n=245)
PER
CEN
TA
GE
Ambulance delivery into emergency department directly
Ambulance delivery into catheterization laboratory directly
Unknown

33
ACCESS TO REPERFUSION
The patient pathway to reperfusion is different for patients depending on how they access the service.
There are two distinct time intervals as illustrated in Figure 17. Firstly, the time from when a patient makes
the first call for help to the arrival at the Primary PCI centre. This is referred to as ‘Call to Door’ (CTD). The
second time interval is the time between arrival at the Primary PCI centre and the time of reperfusion
(balloon/wire cross). This is referred to as Door to Balloon (DTB). Within these time intervals are multiple
steps in the pathway. The definition of ‘call for help’ can be different when calculating the CTD and these
will be expanded upon within each section. The CTD and DTB combined is referred to as the ‘Call to
Balloon’ (CTB).
The next section presents the difference in the time intervals for patients who are brought to a Primary
PCI centre directly by ambulance in the pre-COVID-19 and COVID-19 periods and those that are
transferred from another hospital to the Primary PCI centre in the two time periods. There are various
ways in which patients access the service e.g. via a walk-in service to a Primary PCI centre or having been
transferred as an in-patient from another hospital. These cases are low and are not presented in this
report.
Figure 17: Patient pathway to reperfusion

34
TIMELINES FOR PATIENTS BROUGHT DIRECT VIA AMBULANCE TO PRIMARY PCI CENTRE FOR
PRE-COVID PERIOD AND COVID-19 PERIOD
Call to Door: Direct by ambulance
For patients who are brought directly to the Primary PCI centre by ambulance the ‘Call for Help’ is the
time that the patient contacted the ambulance service. When the ambulance arrives at the scene the
ambulance personnel perform an electrocardiogram (ECG), if the ECG indicates a STEMI and if the
ambulance can bring the patient to a Primary PCI centre within 90 minutes, the patient is brought to a
Primary PCI centre. Overall there were 1034 cases (pre-COVID-19: n=810; COVID-19 n=224) that were
brought to a Primary PCI centre directly via ambulance and had a Primary PCI performed. Out of those
cases, 1000 had date and time information for call to door recorded and recorded correctly (pre-COVID-
19: n=786, 97.0%; COVID-19: n=214, 95.5%).
Figure 18 shows median time in minutes from call to door by week. Pre-COVID-19 median time was 83
minutes (IQR = 58, 113), this increased to 88 minutes (IQR = 66, 125) during the COVID-19 period,
representing a 6% increase. This represented a statistically significant increase (p=0.010).
Figure 18: Time between call for help and arrival to primary PCI centre for cases brought direct by
ambulance to Primary PCI center during the pre-COVID-19 (n=786) and COVID-19 (n=214) time periods
(N=1000)12
12 Figure 18 only includes cases that were brought direct by ambulance and had Primary PCI performed. Cases that did not have time information recorded or it was recorded incorrectly were excluded (N=34)
0
20
40
60
80
100
120
140
1/1
/19-6
/1/1
9
14
/1/1
9-2
0/1
/19
28
/1/1
9-3
/2/1
9
11
/2/1
9-1
7/2
/19
25
/2/1
9-3
/3/1
9
11
/3/1
9-1
7/3
/19
25
/3/1
9-3
1/3
/19
8/4
/19-1
4/4
/19
22
/4/1
9-2
8/4
/19
6/5
/19-1
2/5
/19
20
/5/1
9-2
6/5
/19
3/6
/19-9
/6/1
9
17
/6/1
9-2
3/6
/19
1/0
7/1
9-7
/7/1
9
15
/7/1
9-2
1/7
/19
29
/07
/19-4
/8/1
9
12
/8/1
9-1
8/8
/19
26
/8/1
9-1
/9/1
9
9/9
/19-1
5/9
/19
23
/9/1
9-2
9/9
/19
7/1
0/1
9-1
3/1
0/1
9
21
/10
/19-2
7/1
0/1
9
4/1
1/1
9-1
0/1
1/1
9
18
/11
/19-2
4/1
1/1
9
2/1
2/1
9-8
/12/1
9
16
/12
/19-2
2/1
2/1
9
30
/12
/19-5
/1/2
0
13
/1/2
0-1
9/1
/20
27
/1/2
0-2
/2/2
0
10
/2/2
0-1
6/2
/20
24
/2/2
0-1
/3/2
0
9/3
/20-1
5/3
/20
23
/3/2
0-2
9/3
/20
6/4
/20-1
2/4
/20
20
/4/2
0-2
6/4
/20
4/5
/20-1
0/5
/20
18
/5/2
0-2
4/5
/20
1/6
/20-7
/6/2
0
15
/6/2
0-2
1/6
/20
JAN-19 FEB-
19
MAR-
19
APR-
19
MAY-19 JUN-
19
JUL-19 AUG-19 SEP-
19
OCT-19 NOV-
19
DEC-
19
JAN-20 FEB-
20
MAR-
20
APR-
20
MAY-20 JUN-
20
MED
IAN
TIM
E (
MIN
UT
ES
)
WEEKS
Median
COVID-19

35
Door to Balloon: Direct by ambulance
When the patient arrives at the Primary PCI centre, the pathway measures the time between arrival at
the Primary PCI centre and the time when the patient is reperfused. This is recorded as the time of wire
cross or balloon inflation. Figure 19 shows median time in minutes from door to balloon, by week. The
pre-COVID-19 median time was 26 minutes (IQR = 19, 40) while in the COVID-19 period the median time
was 25 minutes (IQR = 18, 37) representing a 3.8% decrease in door to balloon times. There was no
statistically significant difference between the two time periods (p=0.225).
Figure 19: Time between arrival to primary PCI centre and balloon time for cases brought direct by
ambulance to Primary PCI center during the pre-COVID-19 (n=809) and COVID-19 (n=224) time
periods (N=1033)13
13 Figure 19 only includes cases that were brought direct by ambulance and had Primary PCI performed. Cases that did not have time information recorded or it was recorded incorrectly were excluded.
0
10
20
30
40
50
60
70
1/1
/19-6
/1/1
9
14
/1/1
9-2
0/1
/19
28
/1/1
9-3
/2/1
9
11
/2/1
9-1
7/2
/19
25
/2/1
9-3
/3/1
9
11
/3/1
9-1
7/3
/19
25
/3/1
9-3
1/3
/19
8/4
/19-1
4/4
/19
22
/4/1
9-2
8/4
/19
6/5
/19-1
2/5
/19
20
/5/1
9-2
6/5
/19
3/6
/19-9
/6/1
9
17
/6/1
9-2
3/6
/19
1/0
7/1
9-7
/7/1
9
15
/7/1
9-2
1/7
/19
29
/07
/19-4
/8/1
9
12
/8/1
9-1
8/8
/19
26
/8/1
9-1
/9/1
9
9/9
/19-1
5/9
/19
23
/9/1
9-2
9/9
/19
7/1
0/1
9-1
3/1
0/1
9
21
/10
/19-2
7/1
0/1
9
4/1
1/1
9-1
0/1
1/1
9
18
/11
/19-2
4/1
1/1
9
2/1
2/1
9-8
/12/1
9
16
/12
/19-2
2/1
2/1
9
30
/12
/19-5
/1/2
0
13
/1/2
0-1
9/1
/20
27
/1/2
0-2
/2/2
0
10
/2/2
0-1
6/2
/20
24
/2/2
0-1
/3/2
0
9/3
/20-1
5/3
/20
23
/3/2
0-2
9/3
/20
6/4
/20-1
2/4
/20
20
/4/2
0-2
6/4
/20
4/5
/20-1
0/5
/20
18
/5/2
0-2
4/5
/20
1/6
/20-7
/6/2
0
15
/6/2
0-2
1/6
/20
JAN-19 FEB-
19
MAR-
19
APR-
19
MAY-19 JUN-
19
JUL-19 AUG-19 SEP-
19
OCT-19 NOV-
19
DEC-
19
JAN-20 FEB-
20
MAR-
20
APR-
20
MAY-20 JUN-
20
MED
IUM
TIM
E (
MIN
UT
ES
)
WEEKS
Median
COVID-19

36
Figure 20 summarizes the ‘Call to Door’ and ‘Call to Balloon’ median times for cases brought direct by
ambulance to the Primary PCI center during the pre-COVID-19 and COVID-19 periods.
Figure 20: Median time (minutes) Call to Door and Door to Balloon times during the pre-COVID-19 and COVID-19
time periods
Call to Balloon: Direct by ambulance
The Call to Balloon is the total time of the patient pathway. Out of 1034 cases that were admitted directly
to a Primary PCI centre via ambulance, 1005 had date and time information for call to balloon recorded
and recorded correctly (pre-COVID-19: n=790, 97.5%; COVID-19: n=215, 96.0%).
Figure 21 shows the median time in minutes from call for help to balloon by week. The pre-COVID-19
median time was 115 minutes (IQR = 89, 150), this increased to 121 minutes (IQR = 91, 160) in the COVID-
19 period, a 5% increase in overall reperfusion time. This difference was not statistically significant
(p=0.090).

37
Figure 21: Time between call for help and balloon time for cases brought direct by ambulance to Primary
PCI centre during the pre-COVID-19 (n=790) and COVID-19 (n=215) time periods (N=1005)14
14 Figure 21 only includes cases that were brought direct by ambulance and had Primary PCI performed. Cases that did not have time information recorded or it was recorded incorrectly were excluded (n=29)
0
20
40
60
80
100
120
140
160
180
1/1
/19-6
/1/1
9
14
/1/1
9-2
0/1
/19
28
/1/1
9-3
/2/1
9
11
/2/1
9-1
7/2
/19
25
/2/1
9-3
/3/1
9
11
/3/1
9-1
7/3
/19
25
/3/1
9-3
1/3
/19
8/4
/19-1
4/4
/19
22
/4/1
9-2
8/4
/19
6/5
/19-1
2/5
/19
20
/5/1
9-2
6/5
/19
3/6
/19-9
/6/1
9
17
/6/1
9-2
3/6
/19
1/0
7/1
9-7
/7/1
9
15
/7/1
9-2
1/7
/19
29
/07
/19-4
/8/1
9
12
/8/1
9-1
8/8
/19
26
/8/1
9-1
/9/1
9
9/9
/19-1
5/9
/19
23
/9/1
9-2
9/9
/19
7/1
0/1
9-1
3/1
0/1
9
21
/10
/19-2
7/1
0/1
9
4/1
1/1
9-1
0/1
1/1
9
18
/11
/19-2
4/1
1/1
9
2/1
2/1
9-8
/12/1
9
16
/12
/19-2
2/1
2/1
9
30
/12
/19-5
/1/2
0
13
/1/2
0-1
9/1
/20
27
/1/2
0-2
/2/2
0
10
/2/2
0-1
6/2
/20
24
/2/2
0-1
/3/2
0
9/3
/20-1
5/3
/20
23
/3/2
0-2
9/3
/20
6/4
/20-1
2/4
/20
20
/4/2
0-2
6/4
/20
4/5
/20-1
0/5
/20
18
/5/2
0-2
4/5
/20
1/6
/20-7
/6/2
0
15
/6/2
0-2
1/6
/20
JAN-19 FEB-
19
MAR-
19
APR-
19
MAY-19 JUN-
19
JUL-19 AUG-19 SEP-
19
OCT-19 NOV-
19
DEC-
19
JAN-20 FEB-
20
MAR-
20
APR-
20
MAY-20 JUN-
20
MED
IUM
TIM
E (
MIN
UT
ES
)
WEEKS
Median
COVID-19
38
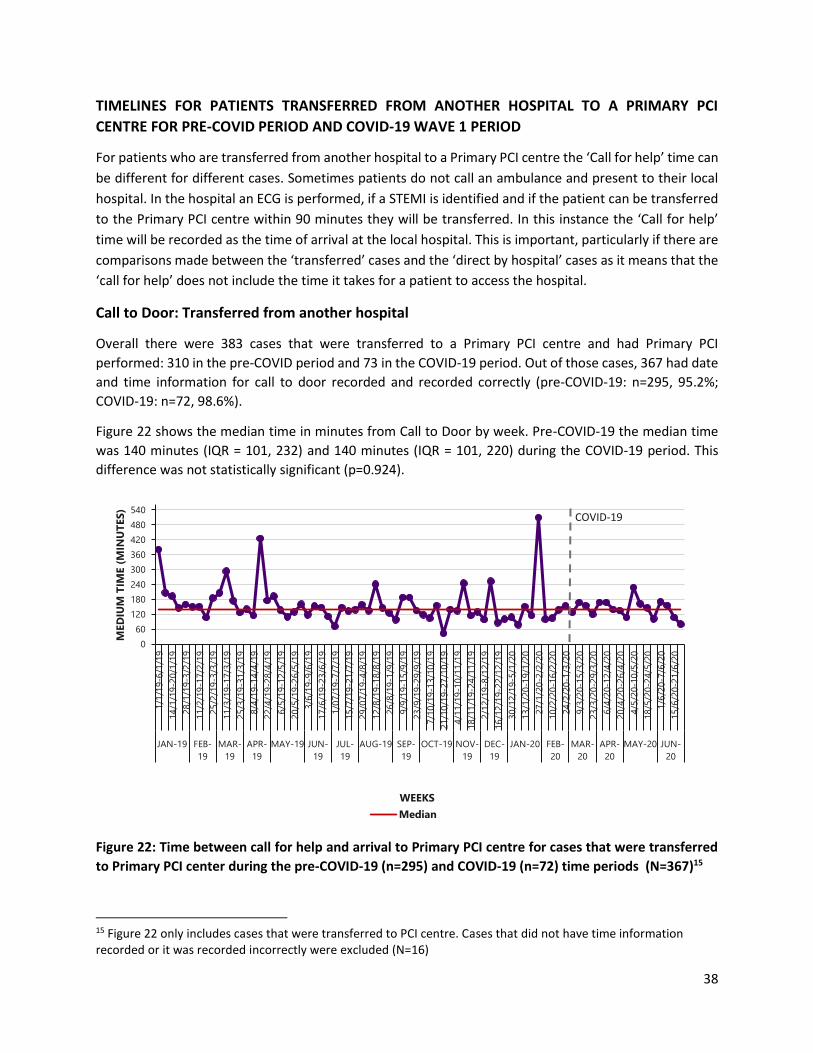
TIMELINES FOR PATIENTS TRANSFERRED FROM ANOTHER HOSPITAL TO A PRIMARY PCI
CENTRE FOR PRE-COVID PERIOD AND COVID-19 WAVE 1 PERIOD
For patients who are transferred from another hospital to a Primary PCI centre the ‘Call for help’ time can
be different for different cases. Sometimes patients do not call an ambulance and present to their local
hospital. In the hospital an ECG is performed, if a STEMI is identified and if the patient can be transferred
to the Primary PCI centre within 90 minutes they will be transferred. In this instance the ‘Call for help’
time will be recorded as the time of arrival at the local hospital. This is important, particularly if there are
comparisons made between the ‘transferred’ cases and the ‘direct by hospital’ cases as it means that the
‘call for help’ does not include the time it takes for a patient to access the hospital.
Call to Door: Transferred from another hospital
Overall there were 383 cases that were transferred to a Primary PCI centre and had Primary PCI
performed: 310 in the pre-COVID period and 73 in the COVID-19 period. Out of those cases, 367 had date
and time information for call to door recorded and recorded correctly (pre-COVID-19: n=295, 95.2%;
COVID-19: n=72, 98.6%).
Figure 22 shows the median time in minutes from Call to Door by week. Pre-COVID-19 the median time
was 140 minutes (IQR = 101, 232) and 140 minutes (IQR = 101, 220) during the COVID-19 period. This
difference was not statistically significant (p=0.924).
Figure 22: Time between call for help and arrival to Primary PCI centre for cases that were transferred
to Primary PCI center during the pre-COVID-19 (n=295) and COVID-19 (n=72) time periods (N=367)15
15 Figure 22 only includes cases that were transferred to PCI centre. Cases that did not have time information recorded or it was recorded incorrectly were excluded (N=16)
0
60
120
180
240
300
360
420
480
540
1/1
/19-6
/1/1
9
14
/1/1
9-2
0/1
/19
28
/1/1
9-3
/2/1
9
11
/2/1
9-1
7/2
/19
25
/2/1
9-3
/3/1
9
11
/3/1
9-1
7/3
/19
25
/3/1
9-3
1/3
/19
8/4
/19-1
4/4
/19
22
/4/1
9-2
8/4
/19
6/5
/19-1
2/5
/19
20
/5/1
9-2
6/5
/19
3/6
/19-9
/6/1
9
17
/6/1
9-2
3/6
/19
1/0
7/1
9-7
/7/1
9
15
/7/1
9-2
1/7
/19
29
/07
/19-4
/8/1
9
12
/8/1
9-1
8/8
/19
26
/8/1
9-1
/9/1
9
9/9
/19-1
5/9
/19
23
/9/1
9-2
9/9
/19
7/1
0/1
9-1
3/1
0/1
9
21
/10
/19-2
7/1
0/1
9
4/1
1/1
9-1
0/1
1/1
9
18
/11
/19-2
4/1
1/1
9
2/1
2/1
9-8
/12/1
9
16
/12
/19-2
2/1
2/1
9
30
/12
/19-5
/1/2
0
13
/1/2
0-1
9/1
/20
27
/1/2
0-2
/2/2
0
10
/2/2
0-1
6/2
/20
24
/2/2
0-1
/3/2
0
9/3
/20-1
5/3
/20
23
/3/2
0-2
9/3
/20
6/4
/20-1
2/4
/20
20
/4/2
0-2
6/4
/20
4/5
/20-1
0/5
/20
18
/5/2
0-2
4/5
/20
1/6
/20-7
/6/2
0
15
/6/2
0-2
1/6
/20
JAN-19 FEB-
19
MAR-
19
APR-
19
MAY-19 JUN-
19
JUL-
19
AUG-19 SEP-
19
OCT-19 NOV-
19
DEC-
19
JAN-20 FEB-
20
MAR-
20
APR-
20
MAY-20 JUN-
20
MED
IUM
TIM
E (
MIN
UT
ES
)
WEEKS
Median
COVID-19
39
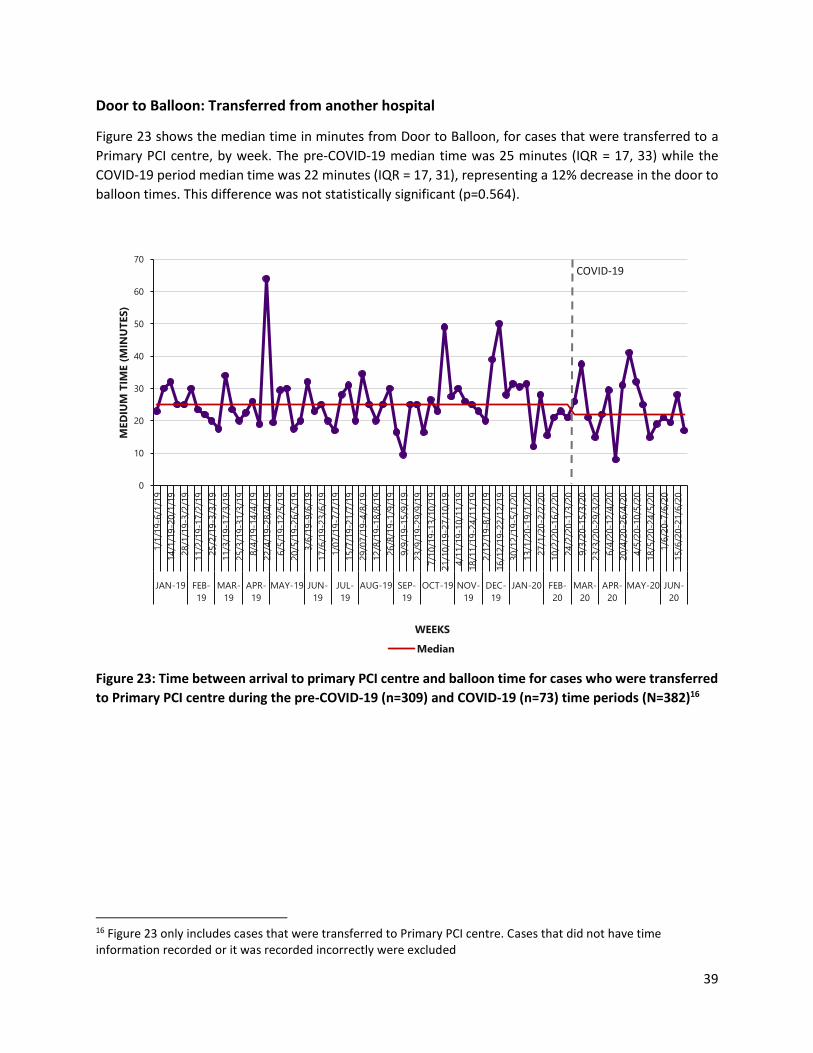
Door to Balloon: Transferred from another hospital
Figure 23 shows the median time in minutes from Door to Balloon, for cases that were transferred to a
Primary PCI centre, by week. The pre-COVID-19 median time was 25 minutes (IQR = 17, 33) while the
COVID-19 period median time was 22 minutes (IQR = 17, 31), representing a 12% decrease in the door to
balloon times. This difference was not statistically significant (p=0.564).
Figure 23: Time between arrival to primary PCI centre and balloon time for cases who were transferred
to Primary PCI centre during the pre-COVID-19 (n=309) and COVID-19 (n=73) time periods (N=382)16
16 Figure 23 only includes cases that were transferred to Primary PCI centre. Cases that did not have time information recorded or it was recorded incorrectly were excluded
0
10
20
30
40
50
60
70
1/1
/19-6
/1/1
9
14
/1/1
9-2
0/1
/19
28
/1/1
9-3
/2/1
9
11
/2/1
9-1
7/2
/19
25
/2/1
9-3
/3/1
9
11
/3/1
9-1
7/3
/19
25
/3/1
9-3
1/3
/19
8/4
/19-1
4/4
/19
22
/4/1
9-2
8/4
/19
6/5
/19-1
2/5
/19
20
/5/1
9-2
6/5
/19
3/6
/19-9
/6/1
9
17
/6/1
9-2
3/6
/19
1/0
7/1
9-7
/7/1
9
15
/7/1
9-2
1/7
/19
29
/07
/19-4
/8/1
9
12
/8/1
9-1
8/8
/19
26
/8/1
9-1
/9/1
9
9/9
/19-1
5/9
/19
23
/9/1
9-2
9/9
/19
7/1
0/1
9-1
3/1
0/1
9
21
/10
/19-2
7/1
0/1
9
4/1
1/1
9-1
0/1
1/1
9
18
/11
/19-2
4/1
1/1
9
2/1
2/1
9-8
/12/1
9
16
/12
/19-2
2/1
2/1
9
30
/12
/19-5
/1/2
0
13
/1/2
0-1
9/1
/20
27
/1/2
0-2
/2/2
0
10
/2/2
0-1
6/2
/20
24
/2/2
0-1
/3/2
0
9/3
/20-1
5/3
/20
23
/3/2
0-2
9/3
/20
6/4
/20-1
2/4
/20
20
/4/2
0-2
6/4
/20
4/5
/20-1
0/5
/20
18
/5/2
0-2
4/5
/20
1/6
/20-7
/6/2
0
15
/6/2
0-2
1/6
/20
JAN-19 FEB-
19
MAR-
19
APR-
19
MAY-19 JUN-
19
JUL-
19
AUG-19 SEP-
19
OCT-19 NOV-
19
DEC-
19
JAN-20 FEB-
20
MAR-
20
APR-
20
MAY-20 JUN-
20
MED
IUM
TIM
E (
MIN
UT
ES
)
WEEKS
Median
COVID-19

40
Figure 24 illustrates the CTD and DTB times for cases who were transferred to Primary PCI centre during
the pre-COVID-19 and COVID-19 time periods.
Figure 24: Median time (minutes) Call to Door and Door to Balloon times for cases transferred to a
Primary PCI centre during the pre-COVID-19 and COVID-19 time periods
Call to Balloon: Transferred from another hospital
Out of the 383 cases that were transferred to a Primary PCI centre, 371 had date and time information for
Call to Balloon recorded and recorded correctly (pre-COVID-19: n=299, 96.5%; COVID-19: n=72, 98.6%).
Figure 25 shows the median time in minutes from call for help to balloon by week, for cases that were
transferred to a Primary PCI centre. The pre-COVID-19 median time was 174 minutes (IQR = 130, 260),
this decreased to 166 minutes (IQR = 125, 251) in the COVID-19 period, representing a 4.6% decline
perhaps highlighting faster processing of these transferred patients directly into the cath lab rather than
to the Coronary Care Unit (CCU) or ED environment. This difference was not statistically significant
(p=0.640).
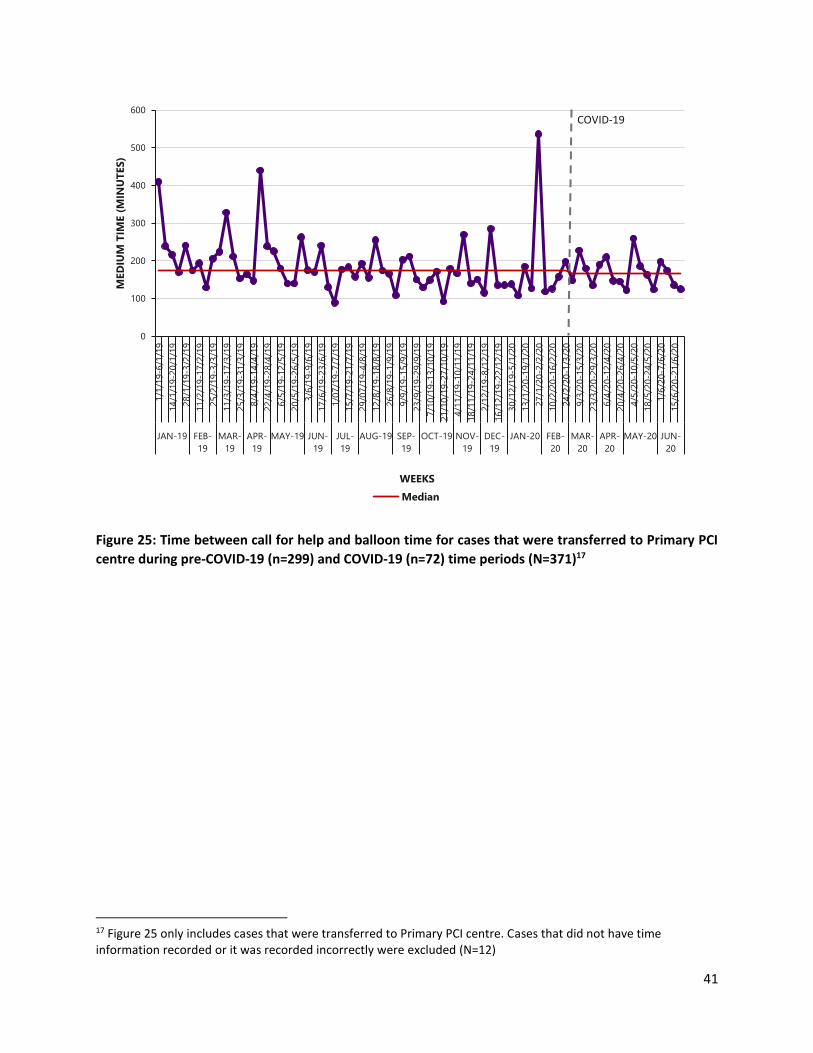
41
Figure 25: Time between call for help and balloon time for cases that were transferred to Primary PCI
centre during pre-COVID-19 (n=299) and COVID-19 (n=72) time periods (N=371)17
17 Figure 25 only includes cases that were transferred to Primary PCI centre. Cases that did not have time information recorded or it was recorded incorrectly were excluded (N=12)
0
100
200
300
400
500
600
1/1
/19-6
/1/1
9
14
/1/1
9-2
0/1
/19
28
/1/1
9-3
/2/1
9
11
/2/1
9-1
7/2
/19
25
/2/1
9-3
/3/1
9
11
/3/1
9-1
7/3
/19
25
/3/1
9-3
1/3
/19
8/4
/19-1
4/4
/19
22
/4/1
9-2
8/4
/19
6/5
/19-1
2/5
/19
20
/5/1
9-2
6/5
/19
3/6
/19-9
/6/1
9
17
/6/1
9-2
3/6
/19
1/0
7/1
9-7
/7/1
9
15
/7/1
9-2
1/7
/19
29
/07
/19-4
/8/1
9
12
/8/1
9-1
8/8
/19
26
/8/1
9-1
/9/1
9
9/9
/19-1
5/9
/19
23
/9/1
9-2
9/9
/19
7/1
0/1
9-1
3/1
0/1
9
21
/10
/19-2
7/1
0/1
9
4/1
1/1
9-1
0/1
1/1
9
18
/11
/19-2
4/1
1/1
9
2/1
2/1
9-8
/12/1
9
16
/12
/19-2
2/1
2/1
9
30
/12
/19-5
/1/2
0
13
/1/2
0-1
9/1
/20
27
/1/2
0-2
/2/2
0
10
/2/2
0-1
6/2
/20
24
/2/2
0-1
/3/2
0
9/3
/20-1
5/3
/20
23
/3/2
0-2
9/3
/20
6/4
/20-1
2/4
/20
20
/4/2
0-2
6/4
/20
4/5
/20-1
0/5
/20
18
/5/2
0-2
4/5
/20
1/6
/20-7
/6/2
0
15
/6/2
0-2
1/6
/20
JAN-19 FEB-
19
MAR-
19
APR-
19
MAY-19 JUN-
19
JUL-
19
AUG-19 SEP-
19
OCT-19 NOV-
19
DEC-
19
JAN-20 FEB-
20
MAR-
20
APR-
20
MAY-20 JUN-
20
MED
IUM
TIM
E (
MIN
UT
ES
)
WEEKS
Median
COVID-19

42
SECONDARY PREVENTION
CARDIAC REHABILITATION
Cardiac rehabilitation is a continuous process of care which begins in hospital and designed to improve
cardiovascular health. It includes education on risk factor management, exercise and lifestyle. There was
no significant difference in the proportion of cases who were referred to cardiac rehabilitation, between
the pre-COVID (n=1208, 75.7%) and COVID-19 (n=296, 75.7%) periods. Furthermore there was a
significant increase in the proportion of patients who did not have their information about referral to
cardiac rehabilitation recorded during the COVID-19 period (p=0.001) (Figure 26). In the COVID-19 period
cardiac rehabilitation was limited due to infection control measures this may account for the difference
in how cardiac rehabilitation was recorded. In addition, although the patients may have been referred to
cardiac rehabilitation they may not have accessed it.
Figure 26: Referrals to cardiac rehabilitation during the pre-COVID-19 and COVID-19 time periods
(N=1987)
76% 76%
5%1%
7%
3%1%
12%19%
0%
10%
20%
30%
40%
50%
60%
70%
80%
90%
100%
pre-COVID-19 (N=1595) COVID-19 (N=391)
PER
CEN
TA
GE
Yes No - patient declined No - due to co-morbidity No – no reason Unknown

43
SMOKING CESSATION
Out of all the cases with STEMI who were admitted to hospital between January 2019 and June 2020, 36%
were recorded as smokers (pre-COVID-19: n=568, 35.6%; COVID-19: n=142, 36.3%). Figure 27 displays the
proportion of smokers who received smoking cessation advice for each of the time periods. A higher
proportion of cases received smoking cessation advice during the pre-COVID-19 period (n=530, 93.3%),
than during the COVID-19 period (n=127, 89.4%). This difference was not statistically significant (p=0.282).
Figure 27: Percentage of cases who received smoking cessation during the pre-COVID-19 and COVID-19
time periods (N=710)18
18 Figure 27 only includes current smokers
93%89%
2%3%
5% 8%
0%
10%
20%
30%
40%
50%
60%
70%
80%
90%
100%
pre-COVID-19 (N=568) COVID-19 (N=142)
PER
CEN
TA
GE
Yes No-patient declined Unknown

44
MEDICATION
During pre-COVID-19, 92.4% (n=1475) of STEMI cases were discharged with one or more secondary
preventative medication, this decreased to 81.8% (n=320) during COVID-19. Figure 28 shows the
medication prescribed on discharge for the two time periods.
There was a statistically significant (p<0.001) difference in prescription of each medication between the
two time periods. The difference was most notable in the unknown category - during COVID-19 period
there was a higher proportion of cases that did not have any of their medication on discharge recorded
(n=71, 18.2%) when compared to the pre-COVID-19 period (n=120, 7.5%). This issue highlights the need
for continued good quality data collection in the primary PCI centres.
When cases with missing data on prescribed medication on discharge were removed, statistical analysis
showed no difference between the two time periods (ACEI or ARB: p=0.261; Aspirin: p=0.096; Beta-
blocker: p=0.102; Statin: p=0.849; Second anti-platelet agent: p=0.471).
Figure 28: Percentage of cases discharged on preventative medication on discharge during the pre-
COVID-19 and COVID-19 time periods (N=1987)
80%
69%
64%
81%
59%
89%
87%
80%
90%
75%
0% 10% 20% 30% 40% 50% 60% 70% 80% 90% 100%
Second anti-platelet agent
Statin
Betablocker
Aspirin
ACEI or ARB
PERCENTAGE
MED
ICA
TIO
N O
N D
ISC
HA
RG
E
pre-COVID-19 (N=1595) COVID-19 (N=391)

45
SUMMARY
Weekly admissions with ST elevation MI (STEMI) declined by just over 11% during the COVID-19 period.
No statistically significant differences were seen between these two time-based cohorts in the proportion
of female patients, nor in the age profile of patients although there was a trend to less admissions in the
>80 year old age cohort.
The proportion of patients receiving PPCI, the optimal reperfusion treatment for STEMI, during the COVID-
19 period was maintained at 95%. This was unchanged from the pre-COVID period and is above the target
of 80% set out in the ACS programme (HSE, 2012). The percentage of this group reaching the timeliness
target for PPCI fell marginally from 67% in the pre-COVID period to 65% during the COVID period, this
difference did not reach statistical significance. These timeliness figures remain below the KPI set out in
the ACS programme of 90% and are below the figure of 70.9% reported for 2016 (HSE, 2016).
Pre-hospital delays contribute in the main to health-care related delays to accessing reperfusion in
Ireland. This held true both in the COVID-19 and reference periods. During the COVID-19 period, small
changes were seen in care delivery timelines. There were small increases observed in EMS related delays.
It is probable that additional infection control measures coupled with increased demand for ambulance
services contributed to this small increase. These were partly offset by reductions in door-to-balloon time.
Notably, during the COVID-19 period patients at the Primary PCI hospitals were significantly more likely
to be admitted directly to the cath lab rather than via the emergency department. This change aligns with
ESC (2017) recommendations for ED bypass directly to the cath lab and provides a target and platform for
further quality improvement after the pandemic.
Heart attack care does not end with reperfusion. Pharmacotherapies and cardiac rehabilitation help to
restore wellness and to reduce the risk of further heart attack. These therapies are often prescribed and
delivered in healthcare settings other than the Primary PCI hospital and are incompletely captured in
HeartBeat. From HeartBeat we can see that referral to cardiac rehab fell during the COVID-19 period and
remains significantly below the KPI of a 90% referral rate. We do not have information on whether cardiac
rehab was in fact delivered. In terms of information on discharge pharmacotherapy, the amount of
incomplete data increased significantly in the COVID period. Both the decline in referral to cardiac rehab
and in recording of discharge medication prescribing likely reflects reassignment of cardiac rehab and
cardiac data collection nurse resources to frontline healthcare duties during the pandemic and the
suspension of out-patient cardiac rehab programmes to avoid virus transmission. Considering patients for
whom data was available there was a trend to less prescribing of guideline recommended medical therapy
although not reaching statistical significance between the two time-based cohorts. This is most likely due
to incomplete data collection but with trends to shorter length of stay, it is feasible less medication
initiation and titration occurred during the index admission in the Primary PCI centre.

46
CHAPTER 5: THE NATIONAL OUT-OF-HOSPITAL CARDIAC
ARREST REGISTER ACTIVITY
INTRODUCTION The National Out-of-Hospital Cardiac Arrest Register (OHCAR) was established in June 2007 in response
to a recommendation in the “Report of the Task Force on Sudden Cardiac Death” (DoH, 2006). OHCAR is
hosted in the Department of Public Health Medicine in the Health Service Executive (HSE) North
West region, and is funded by the National Ambulance Service (NAS). It is administered and supported by
the Discipline of General Practice, National University of Ireland Galway, and is guided an OHCAR Steering
Group (OHCAR, 2020). The aim of OHCAR is to support improved outcomes from out-of-hospital cardiac
arrests in Ireland (OHCAR, 2020).
OHCAR registers “all patients who suffer a witnessed or un-witnessed out-of-hospital cardiac arrest in
Ireland which is confirmed and attended by Emergency Medical Services (EMS) and resuscitation
attempted” (OHCAR, 2020). A resuscitation attempt is defined in the Utstein guidelines (Perkins et al.,
2015) as performance of cardiopulmonary resuscitation (CPR) and/or attempted defibrillation where
there is evidence of a cardiac arrest rhythm. Incidents attended by the EMS where resuscitation is not
attempted due to obvious signs of death, injuries incompatible with life, or a ‘do not resuscitate’ order
have only been included in OHCAR since July 1st 2020. As this report covers time periods prior to July 1st
2020, cases where resuscitation has not been attempted are not included but will be included in future
issues. The primary sources of OHCAR data are Patient Care Reports (PCRs) and ambulance dispatch data
from the two statutory ambulance services, the National Ambulance Service (NAS) and the Dublin Fire
Brigade (DFB).
International literature during the initial phase of the COVID-19 pandemic suggest a link
between increased numbers of OHCAs and decreased numbers of hospital admissions with heart attack
(Campo et al, 2020; Mafham, 2020). For this reason NOCA has collaborated with the OHCAR Steering
Group and agreed to share data for the duration of the COVID-19 pandemic. This chapter presents
the relevant OHCAR data during the pre-COVID-19 (January 2019-February 2020) and COVID-19
(March 2020-June 2020) periods.
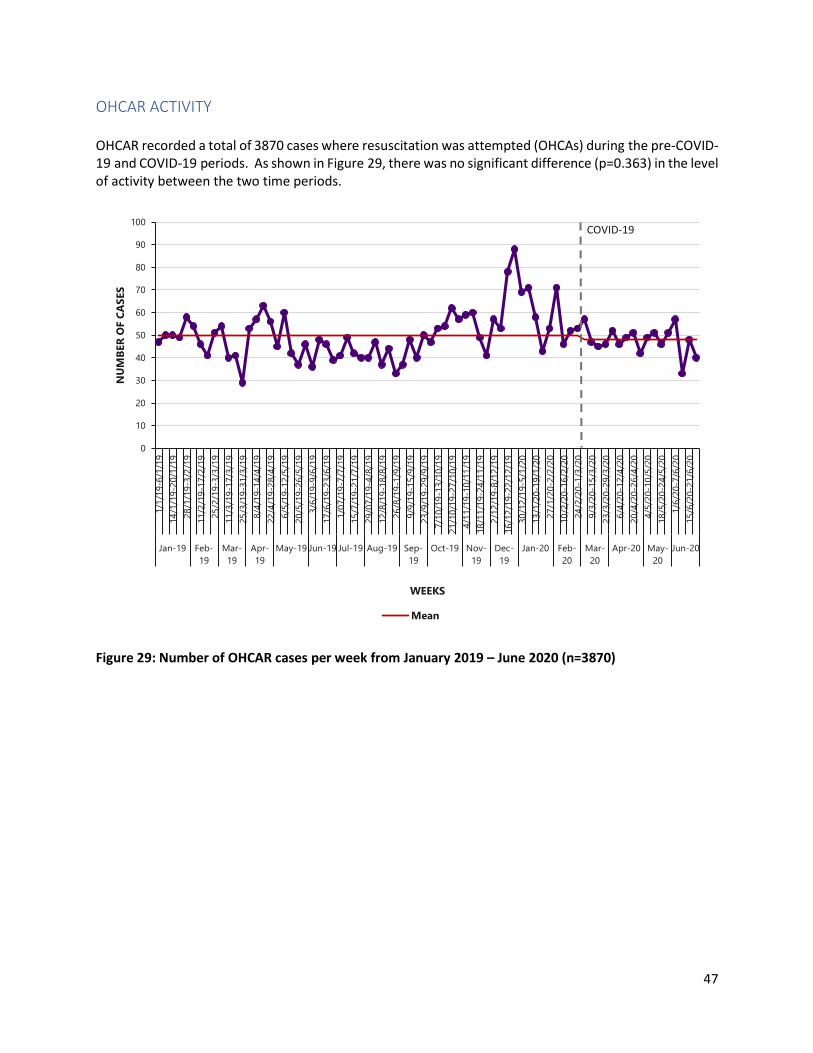
47
OHCAR ACTIVITY OHCAR recorded a total of 3870 cases where resuscitation was attempted (OHCAs) during the pre-COVID-19 and COVID-19 periods. As shown in Figure 29, there was no significant difference (p=0.363) in the level of activity between the two time periods.
Figure 29: Number of OHCAR cases per week from January 2019 – June 2020 (n=3870)
0
10
20
30
40
50
60
70
80
90
100
1/1
/19-6
/1/1
9
14
/1/1
9-2
0/1
/19
28
/1/1
9-3
/2/1
9
11
/2/1
9-1
7/2
/19
25
/2/1
9-3
/3/1
9
11
/3/1
9-1
7/3
/19
25
/3/1
9-3
1/3
/19
8/4
/19-1
4/4
/19
22
/4/1
9-2
8/4
/19
6/5
/19-1
2/5
/19
20
/5/1
9-2
6/5
/19
3/6
/19-9
/6/1
9
17
/6/1
9-2
3/6
/19
1/0
7/1
9-7
/7/1
9
15
/7/1
9-2
1/7
/19
29
/07
/19-4
/8/1
9
12
/8/1
9-1
8/8
/19
26
/8/1
9-1
/9/1
9
9/9
/19-1
5/9
/19
23
/9/1
9-2
9/9
/19
7/1
0/1
9-1
3/1
0/1
9
21
/10
/19-2
7/1
0/1
9
4/1
1/1
9-1
0/1
1/1
9
18
/11
/19-2
4/1
1/1
9
2/1
2/1
9-8
/12/1
9
16
/12
/19-2
2/1
2/1
9
30
/12
/19-5
/1/2
0
13
/1/2
0-1
9/1
/20
27
/1/2
0-2
/2/2
0
10
/2/2
0-1
6/2
/20
24
/2/2
0-1
/3/2
0
9/3
/20-1
5/3
/20
23
/3/2
0-2
9/3
/20
6/4
/20-1
2/4
/20
20
/4/2
0-2
6/4
/20
4/5
/20-1
0/5
/20
18
/5/2
0-2
4/5
/20
1/6
/20-7
/6/2
0
15
/6/2
0-2
1/6
/20
Jan-19 Feb-
19
Mar-
19
Apr-
19
May-19 Jun-19 Jul-19 Aug-19 Sep-
19
Oct-19 Nov-
19
Dec-
19
Jan-20 Feb-
20
Mar-
20
Apr-20 May-
20
Jun-20
NU
MB
ER
OF C
AS
ES
WEEKS
Mean
COVID-19

48
LOCATION OF OHCAs The location of the OHCA is categorised as public: industrial place or premises, public building, GP Surgery, recreational or sports place (includes hotels), street or road, in ambulance, other (lakes, mountainside, river, canal, pier or beach) or non-public: home, residential institution or farm. In the pre-COVID-19 period, 23% of OHCAs happened in a public area. This reduced to 12% in the COVID-19 period (Figure 30). This statistically significant reduction (p<0.001) coincides with the government request to stay-at-home.
Figure 30: Location of out-of-hospital cardiac arrest events between January 2019 – June 2020 (n=3870)
23%
12%
77%
88%
0%
10%
20%
30%
40%
50%
60%
70%
80%
90%
100%
Pre-COVID-19 (n=3060) COVID-19 (n=810)
PER
CEN
TA
GE
Public Private

49
AGE AND SEX Figures 31 and 32 show the percentage of OHCAs in the pre-COVID-19 and COVID-19 time periods, broken down by sex and age group. Overall, there was no statistically significant difference in the sex (p=0.844) or age (p=0.954) of OHCAs in the two time periods. Sixty-seven percent of OHCAs were male (n=2595) and 66% (n=2549) were aged 60 years or over during both time periods.
Figure 31: Gender of out-of-hospital cardiac arrest patients between January 2019 – June 2020 (n=3863)19
19 Seven cases did not have gender recorded, therefore were excluded from Figure 31
67% 68%
33% 32%
0%
10%
20%
30%
40%
50%
60%
70%
80%
90%
100%
Pre-COVID-19 (n=3053) COVID-19 (n=810)
PER
CEN
TA
GE
Male Female

50
Figure 32: Age profile of out-of-hospital cardiac arrest patients between January 2019 – June 2020 (n=3851)20
20 Cases that did not have age information recorded were excluded from Figure 32 (n=19)
12% 12%
22% 22%
43% 42%
23% 24%
0%
10%
20%
30%
40%
50%
60%
70%
80%
90%
100%
Pre-COVID-19 (n=3043) COVID-19 (n=808)
PER
CEN
TA
GE
<39yrs 40-59yrs 60-79yrs >80yrs

51
AETIOLOGY AND INITIAL CARDIAC ARREST RHYTHM In OHCAR, aetiology of the OHCA is classified in the Utstein style, using the data recorded by the attending prehospital practitioners. Classification includes: trauma, asphyxiation, submersion, electrocution and drug overdose. A medical aetiology is assumed in the absence of any other obvious cause. There was no statistically significant difference (p=0.484) between the aetiology of OHCA in the two time periods under review (Figure 33).
Figure 33: Aetiology of out-of-hospital cardiac arrests between January 2019 – June 2020 (n=3870)
86% 86%
4% 5%6% 5%3% 3%
1%
0%
10%
20%
30%
40%
50%
60%
70%
80%
90%
100%
Pre-COVID-19 (N=3060) COVID-19 (N=810)
PER
CEN
TA
GE
Medical Trauma Asphyxial Drug overdose Submersion Electrocution

52
Figure 34 shows the proportion of patients with a shockable or non-shockable initial cardiac arrest rhythm. In the pre-COVID-19 period, just over one in five patients (21.3%) was in a shockable rhythm at the time of first rhythm analysis. This proportion did not change significantly (p=0.810) in the COVID-19 period (19.3%).
Figure 34: Proportion of OHCA patients with an initial shockable or non-shockable cardiac arrest rhythm (n=3,869)21
21 One case that did not have information recorded and was excluded from Figure 34
21%19%
79%81%
0%
10%
20%
30%
40%
50%
60%
70%
80%
90%
Pre-COVID-19 (N=3060) COVID-19 (N=809)
PER
CEN
TA
GE
Initial shockable rhythm Initial non shockable rhythm

53
CALL RESPONSE INTERVAL In line with Utstein recommendations, the call response interval (CRI) is defined as the difference between the time the emergency call is received by ambulance control and the time the first ambulance resource arrives on scene. In the pre-COVID-19 period the median response time was 13 minutes. This increased to 14 minutes in the COVID-19 period and represents a statistically significant increase (p=0.001) (Figure 35). However, it should be noted that the proportion of OHCAs that had a CRI of 8 minutes or less did not vary significantly between the pre-COVID and COVID-19 periods under review ((25% vs. 23% respectively (p=0.22).
Figure 35: Weekly median Call-Response Interval for out-of-hospital cardiac arrests between January 2019 – June 2020 (n=3870)
0
2
4
6
8
10
12
14
16
18
1/1
/19-6
/1/1
9
14
/1/1
9-2
0/1
/19
28
/1/1
9-3
/2/1
9
11
/2/1
9-1
7/2
/19
25
/2/1
9-3
/3/1
9
11
/3/1
9-1
7/3
/19
25
/3/1
9-3
1/3
/19
8/4
/19-1
4/4
/19
22
/4/1
9-2
8/4
/19
6/5
/19-1
2/5
/19
20
/5/1
9-2
6/5
/19
3/6
/19-9
/6/1
9
17
/6/1
9-2
3/6
/19
1/0
7/1
9-7
/7/1
9
15
/7/1
9-2
1/7
/19
29
/07
/19-4
/8/1
9
12
/8/1
9-1
8/8
/19
26
/8/1
9-1
/9/1
9
9/9
/19-1
5/9
/19
23
/9/1
9-2
9/9
/19
7/1
0/1
9-1
3/1
0/1
9
21
/10
/19-2
7/1
0/1
9
4/1
1/1
9-1
0/1
1/1
9
18
/11
/19-2
4/1
1/1
9
2/1
2/1
9-8
/12/1
9
16
/12
/19-2
2/1
2/1
9
30
/12
/19-5
/1/2
0
13
/1/2
0-1
9/1
/20
27
/1/2
0-2
/2/2
0
10
/2/2
0-1
6/2
/20
24
/2/2
0-1
/3/2
0
9/3
/20-1
5/3
/20
23
/3/2
0-2
9/3
/20
6/4
/20-1
2/4
/20
20
/4/2
0-2
6/4
/20
4/5
/20-1
0/5
/20
18
/5/2
0-2
4/5
/20
1/6
/20-7
/6/2
0
15
/6/2
0-2
1/6
/20
Jan-19 Feb-
19
Mar-
19
Apr-
19
May-19 Jun-
19
Jul-19 Aug-19 Sep-
19
Oct-19 Nov-
19
Dec-
19
Jan-20 Feb-
20
Mar-
20
Apr-20 May-
20
Jun-
20
MIN
UT
ES
WEEKS
Median
COVID-19

54
BYSTANDER CPR AND DEFIBRILLATION BEFORE AMBULANCE SERVICE ARRIVAL The overall proportion of patients who had bystander CPR performed in the pre-COVID and COVID-19 periods did not differ significantly (p=0.292) (Figure 36). However, for the subset of people who collapsed in a public place, the proportion of patients who had bystander CPR dropped significantly from 71.0% (n=409/576) in the pre-COVID period to 56.2% (n=50/89) in the COVID-19 period (p=0.01). The proportion of people who had defibrillation attempted before arrival of the ambulance service did not differ significantly between the two periods, but trended downwards in the COVID-19 period (n=46/806; 5.6%) compared to the pre-COVID-19 period (n=227/3046; 7.5%) (p=0.06).
Figure 36: Proportion of OHCA patients who had bystander CPR performed (n=3448)22
22 Figure 36 excludes cases that were witnessed by the EMS
72% 73%
28% 27%
0%
10%
20%
30%
40%
50%
60%
70%
80%
90%
100%
Pre-COVID-19 (n=2734) COVID-19 (n=714)
PER
CEN
TA
GE
Bystander CPR for non-EMS witnessed cases No Bystander CPR for non-EMS witnessed cases
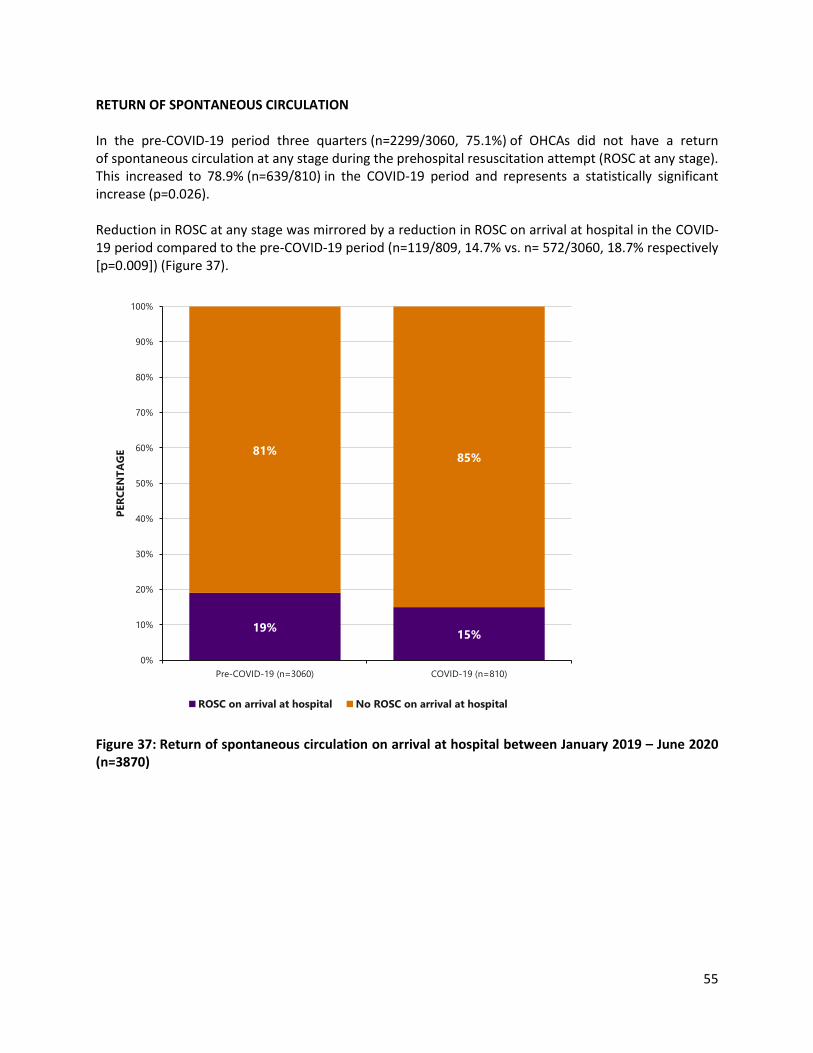
55
RETURN OF SPONTANEOUS CIRCULATION In the pre-COVID-19 period three quarters (n=2299/3060, 75.1%) of OHCAs did not have a return of spontaneous circulation at any stage during the prehospital resuscitation attempt (ROSC at any stage). This increased to 78.9% (n=639/810) in the COVID-19 period and represents a statistically significant increase (p=0.026). Reduction in ROSC at any stage was mirrored by a reduction in ROSC on arrival at hospital in the COVID-19 period compared to the pre-COVID-19 period (n=119/809, 14.7% vs. n= 572/3060, 18.7% respectively [p=0.009]) (Figure 37).
Figure 37: Return of spontaneous circulation on arrival at hospital between January 2019 – June 2020 (n=3870)
19%15%
81%85%
0%
10%
20%
30%
40%
50%
60%
70%
80%
90%
100%
Pre-COVID-19 (n=3060) COVID-19 (n=810)
PER
CEN
TA
GE
ROSC on arrival at hospital No ROSC on arrival at hospital
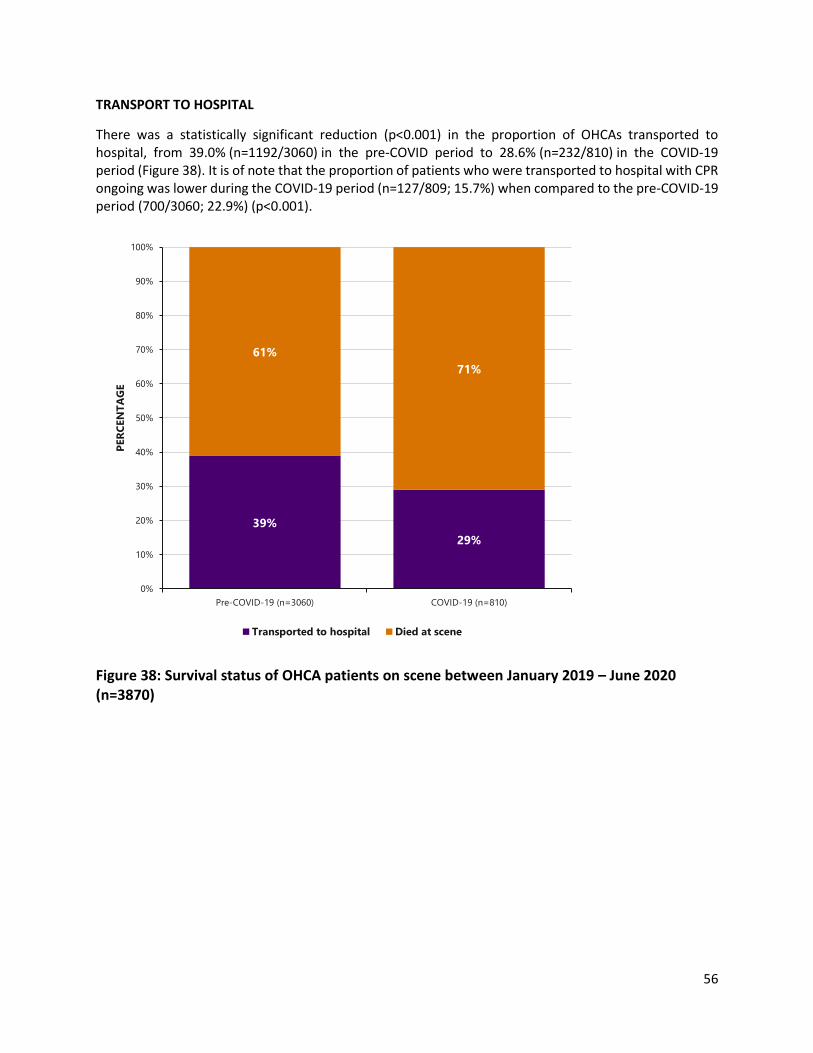
56
TRANSPORT TO HOSPITAL
There was a statistically significant reduction (p<0.001) in the proportion of OHCAs transported to hospital, from 39.0% (n=1192/3060) in the pre-COVID period to 28.6% (n=232/810) in the COVID-19 period (Figure 38). It is of note that the proportion of patients who were transported to hospital with CPR ongoing was lower during the COVID-19 period (n=127/809; 15.7%) when compared to the pre-COVID-19 period (700/3060; 22.9%) (p<0.001).
Figure 38: Survival status of OHCA patients on scene between January 2019 – June 2020 (n=3870)
39%
29%
61%
71%
0%
10%
20%
30%
40%
50%
60%
70%
80%
90%
100%
Pre-COVID-19 (n=3060) COVID-19 (n=810)
PER
CEN
TA
GE
Transported to hospital Died at scene

57
SURVIVAL STATUS
Figure 39 illustrates the subset of cases who were transported from the scene to hospital (n=1424). There was no significant difference in the proportion of patients who died, in the two time periods. Furthermore, there was no statistically significant difference in the proportion of patients who survived an OHCA in the pre-COVID-19 and COVID-19 periods (Figure 40).
Figure 39: Discharge status of out-of-hospital cardiac arrest patients who were transported to hospital between January 2019 – June 2020 (n=1424)23
23 Figure 39 only includes cases that were transported to hospital
19% 19%
81% 81%
0%
10%
20%
30%
40%
50%
60%
70%
80%
90%
100%
Pre-COVID-19 (n=1192) COVID-19 (n=232)
PER
CEN
TA
GE
% of those transported to ED who died
% of those transported to ED who were alive at discharge

58
Figure 40: Survival status of out-of-hospital cardiac arrest patients between January 2019 – June 2020 (n=3870)
SUMMARY The overall incidence of OHCAR cases did not increase during the COVID-19 period. This is in contrast to
increased incidence observed in similar cohorts in the U.S. (Chan et al, 2021), Lombardi (Italy) (Baldi et al,
2020), Victoria (Australia) (Ball et al, 2020), and London (Fothergill et al, 2021). In common with findings
from other international registries, during the COVID-19 period, a decreased percentage of cases had
characteristics associated with survival i.e. OHCA in a public place, bystander CPR performance (in a public
place), and defibrillation attempted before ambulance service arrival. Similarly, a significant reduction in
ROSC rates was common across international registries and worst in areas with high COVID-19 incidence
(Baldi et al, 2020; Fothergill et al, 2021; Rosell et al 2020). However, in contrast to reports from other
registries, the proportion of patients with an initially shockable cardiac arrest rhythm or cases that had a
CRI of 8 minutes or less did not decrease during the COVID-19 period. Finally, while the proportion of
patients discharged alive during the COVID-19 period was not statistically significant, since 2012, there
has been an increase in the absolute number of OHCAR survivors every year. Data for the COVID-19 period
suggests that it is unlikely that this trend will continue for 2020.
7% 6%
93% 94%
0%
10%
20%
30%
40%
50%
60%
70%
80%
90%
100%
Pre-COVID-19 (n=3060) COVID-19 (n=810)
PER
CEN
TA
GE
Discharged alive Did not survive

59
CONCLUSION
The preliminary data from IHAA, OHCAR and HIPE presented in this report are intended to provide rapid
learning for the health system during this ongoing pandemic. The data so far show that there was a decline
in STEMI and NSTEMI hospital admissions in quarter one and quarter two of 2020 compared to 2019. This
decline in hospital admissions started before the government introduced widespread lockdown measures
and likely therefore reflects generalized fear regarding viral contagion and risk of virus exposure with
hospital attendance. The most marked reduction was in the over 80 age group, reflecting the likely higher
levels of fear over virus exposure and risks of COVID-19 complications in this age group.
Changes noted between the pre-COVID-19 and COVID-19 periods include:
• A reduction in hospital admissions for STEMI and NSTEMI
• Less admissions from the nursing home sector and less hospital to hospital transfer for NSTEMI
• Increase in the time from call to help to arrival at both non-PCI and PCI sites reflecting increased
service demand on pre-hospital emergency services and delays related to COVID risk assessment
and donning/doffing of personal protective equipment (PPE)
• Increased proportion of patients going directly to the cath lab resulted in shorter door to
balloon times
• Reduction in collection of secondary prevention data
• A higher proportion of OHCAs occurred in the home, a location that is consistently associated
with poorer OHCA survival
• People who collapsed in public were less likely to have bystander CPR performed
• The proportion of people who had defibrillation attempted before arrival of the ambulance
service reduced.
In STEMI, whilst markers of hospital process of care such as DTB times and ED bypass improved, pre-
hospital CTD times increased, reflecting increased demand on pre-hospital emergency services, and delays
related to COVID risk assessment of patients on scene and at receiving hospitals as well as delays related
to donning/doffing of personal protective equipment. Markers of secondary post MI care showed a trend
towards decline which could be explained by shorter length of stay overall to minimize risk of virus cross-
contamination but more likely reflects increased incomplete data collection with reassignment of cardiac
rehab nurse resources and cardiac nurse data collection specialists to frontline nursing duties and the
suspension of out-patient rehabilitation programmes.
In NSTEMI, again, for similar reasons, there was a decline in attendance and a decline in hospital to
hospital transfer which may have been because there was a more conservative medical management of
uncomplicated NSTEMIs to avoid hospital to hospital transfers.

60
With regard to OHCAR data, whilst there was a decrease in hospital admissions for acute MI, especially in
the elderly, and nursing home residents, there was not a concomitant increase in OHCA. This may have
been because more patients were pronounced dead on scene or perhaps did not have CPR commenced.
A higher proportion of OHCAs occurred in the home, a location that is consistently associated with poorer
OHCA survival. In addition, people who collapsed in public were less likely to have bystander CPR
performed. The proportion of people who had defibrillation attempted before arrival of the ambulance
service reduced in the COVID-19 period albeit not to a statistically significant level. However it is of critical
note that defibrillation before ambulance service arrival is highly predictive of survival. While the
proportion of survivors during the COVID-19 period did not decrease significantly, for the first time since
national OHCAR data collection began, the absolute number of survivors has decreased.
There are a number of limitations with the data analysis presented. The nursing resources undertaking
data collection for the IHAA were reassigned to frontline healthcare duties during the pandemic and
therefore the amount of missing and incomplete data variables has increased. Limited follow-up
outcomes data are available for heart attack survivors and therefore mortality and morbidity outcomes
data are not presented. The IHAA and HIPE data analysed for this report have not been fully validated
either by NOCA or by the HPO. Although we have reported on heart attack patients who have had a
diagnosis of COVID-19, we must bear in mind, not only that we are dealing with small numbers but also
that during the reporting period the case definition, availability and type of testing and coding for COVID-
19 was evolving. Additionally, we do not have access to the numbers of cardiovascular deaths, and
specifically the numbers of deaths attributed to acute myocardial infarction, recorded by the CSO to
ascertain whether the decline in hospital admissions for heart attack coincided with an increase in death
registrations in the general population with heart attack.
Nevertheless, based on the early findings presented in this report we can provide some points that should
be considered when caring for heart attack patients, these include:
• Shortening pre-hospital and inter-hospital transfer delays for patients with symptoms of
suspected heart attack should remain a priority for the National Heart Programme. This accounts
for the largest proportion of time delays in reperfusion therapy and particular focus should be
given to improving door-in door-out times of non-PCI hospital to PCI hospital transfer patients
• Public Health messaging during the pandemic should emphasise the importance of heart attack
symptom recognition and the importance of early access to the Primary PCI programme
regardless of the pandemic
• ED bypass protocols have shortened door to balloon times and should be adopted widely and
maintained after the pandemic
• Data collection resources should be ring-fenced and maintained throughout the pandemic
• Cardiac rehabilitation programmes should continue with virtual programmes where possible.
This report is aimed at providing timely data to the health service which can in turn be used to improve
patient care in the future. When new and validated data are included in IHAA, HIPE and OHCAR,
subsequent reports will provide a more accurate picture of patient care during the COVID-19 pandemic.

61
REFERENCES
Baldi, E., Sechi, G. M., Mare, C., Canevari, F., Brancaglione, A., Primi, R., Klersy, C., Palo, A.,
Contri, E., Ronchi, V., Beretta, G., Reali, F., Parogni, P., Facchin, F., Rizzi, U., Bussi, D., Ruggeri, S.,
Oltrona Visconti, L., Savastano, S., & Lombardia CARe researchers (2020). COVID-19 kills at
home: the close relationship between the epidemic and the increase of out-of-hospital cardiac
arrests. European heart journal, 41(32), 3045–3054. Available from:
https://doi.org/10.1093/eurheartj/ehaa508 [Accessed 19 April 2021]
Ball, J., Bernard, S., Nehme, Z., Smith, K., Stephenson, M., Stub, D. (2020) Collateral damage:
Hidden impact of the COVID-19 pandemic on the out-of-hospital cardiac arrest system-of-care.
Resuscitation 2020. Available from: DOI10.1016/j.resuscitation.2020.09.017 [Accessed 19 April
2021]
Bennett, K., Kabir, Z., Unal, B., Shelley, E., Critchley, J., Perry, I., Feely, J., & Capewell, S. (2006).
Explaining the recent decrease in coronary heart disease mortality rates in Ireland, 1985-
2000. Journal of epidemiology and community health, 60(4), 322–327. Available from:
https://doi.org/10.1136/jech.2005.038638 [Accessed 19 April 2021]
Borja Ibanez, Stefan James, Stefan Agewall, et al, ESC Scientific Document Group. (2017) ESC
Guidelines for the management of acute myocardial infarction in patients presenting with ST-
segment elevation: The Task Force for the management of acute myocardial infarction in
patients presenting with ST-segment elevation of the European Society of Cardiology (ESC),
European Heart Journal, Volume 39, Issue 2, 07 January 2018, Pages 119–177, Available on:
https://doi.org/10.1093/eurheartj/ehx393 Section 4.1.1 [Accessed 24 April 2021]
Campoa,BG., Fortunac,D., Bertic,E., De Palmad, R., Di Pasqualed,G., Galvanie,M., Navaziof, A.,
Piovaccarig,G., Rubbolih, G., Guardiglia,G., Gali_ei, N., Borianij, G., Tondik, S., Ardissinol, D.,
Piepolim, M., Banchellic, F., Santarellig, A., Casellan,G. on behalf of the AMI-Co investigators
(2021) In- and out-of-hospital mortality for myocardial infarction during the first wave of the
COVID-19 pandemic in Emilia-Romagna, Italy: A population based observational study. The
Lancet Regional Health – Europe. 3: 100055. Available on:
https://doi.org/10.1016/j.lanepe.2021.100055 Accessed 19 April 2021]
Chan, PS., Girotra, S., Tang, Y., Al-Araji, R., Nallamothu, BK., McNally, B. (2019) Outcomes for
Out-of-Hospital Cardiac Arrest in the United States During the Coronavirus Disease 2019
Pandemic. JAMA cardiology 6(3): 296-303.
Department of Health and Children. (2006) Reducing the Risk: A Strategic Approach. The Report
of the Task Force on Sudden Cardiac Death. Dublin: Department of Health. Available from:
https://www.lenus.ie/handle/10147/43377 [Accessed 19 April 2021]

62
De Rosa,S., Spaccarotella, C., Basso, C., Calabrò, MP., Curcio, A., Filardi, PP., Mancone, M.,
Mercuro, G., Muscoli, S., Nodari, S., Pedrinelli, R., Sinagra, G., Indolfi, C., (2020) Società Italiana
di Cardiologia and the CCU Academy investigators group, Reduction of hospitalizations for
myocardial infarction in Italy in the COVID-19 era, European Heart Journal, Volume 41, Issue 22,
7 June 2020, Pages 2083–2088 Available from: https://doi.org/10.1093/eurheartj/ehaa409
[Accessed 19 April 2021]
Fothergill, RT., Smith, AL., Wrigley, F., Perkins, GD. (2021). Out-of-Hospital Cardiac Arrest in
London during the COVID-19 pandemic. Resuscitation plus, 5, 100066. Available
from: https://doi.org/10.1016/j.resplu.2020.100066 [Accessed 19 April 2021]
Garcia, S., Albaghdadi, MS., Meraj PM., Schmidt C., Garberich R., Jaffer FA., Dixon S., Rade JJ.,
Tannenbaum M., Chambers J., Huang PP., Henry TD. (2020) Reduction in ST-Segment Elevation
Cardiac Catheterization Laboratory Activations in the United States During COVID-19 Pandemic.
J Am Coll Cardiol 75(22):2871-2872. doi: 10.1016/j.jacc.2020.04.011 [Accessed 19 April 2021]
Hamm, CW., Bassand, JP., Agewall,S., Bax,J., Boersma,E., Bueno,H., Caso, P., Dudek, D., Gielen,
S., Huber, K., Ohman, M., Petrie, MC., Sonntag, F., Uva, MS., Storey, RF., Wijns, W., Zahger, D.
(2011). ESC Guidelines for the management of acute coronary syndromes in patients presenting
without persistent ST-segment elevation: The Task Force for the management of acute
coronary syndromes (ACS) in patients presenting without persistent ST-segment elevation of
the European Society of Cardiology (ESC), European Heart Journal, Volume 32, Issue 23, Pages
2999–3054. Available on: https://doi.org/10.1093/eurheartj/ehr236 [Accessed 19 April 2021]
Health Service Executive (2016) Heart Attack Care Ireland 2016. Dublin: Health Service
Executive. Available from https://www.hse.ie/eng/about/who/cspd/ncps/acs/resources/heart-
attack-care-in-2016.pdf [Accessed 23 April 2021]
Health Service Executive (2012) Acute Coronary Syndromes Model of Care. Dublin: Health
Service Executive. Available from: https://www.hse.ie/eng/about/who/cspd/ncps/acs/moc/
[Accessed 19 April 2021]
Irish National Out-of-Hospital Cardiac Arrest Register, OHCAR (2019) Annual Report.
Letterkenny: Ireland: National University of Ireland Galway. Available on:
https://www.nuigalway.ie/media/collegeofmedicinenursinghealthsciences/schools/schoolofme
dicine/generalpractice/docs/OHCAR-Annual-Report-2019.pdf [Accessed 19 April 2021]
Mafham, MM., Spata, E.,Goldacre, R., Gair, D., Curnow, P., Bray, M., Hollings, S., Roebuck, C.,
Gale, CP., Mamas, MA., Deanfield, JE., de Belder, MA., Luescher, TF., Denwood, T., Landray, MJ.,
Emberson, JR., Collins, R., Morrist, EJA., Casadeit, B., Baigent, C. (2020) COVID-19 pandemic and
admission rates for and management of acute coronary syndromes in England. Lancet, 396:
381-89. Available from: https://doi.org/10.1016/S0140-6736(20)31356-8 [Accessed 19 April
2021]

63
Perkins, GD., Jacobs, IG., Nadkarni, VM., Berg, RA., Bhanji, F., Biarent, D., Bossaert, LL.,
Chamberlain, D., de Caen, AR., Deakin, CD., Finn, JC., Gräsner, J., Hazinski, MF., Iwami, T.,.
Koster, RW., Lim, SH,. Huei-Ming Ma, M., McNally, BF., Morley, PT., Morrison, LJ., Monsieurs,
KG., Montgomery, W., Nichol, G., Okada, K., Ong, MEH., Travers, AH., Nolan, JP., Aikin, RP.,
Böttiger, BW., Callaway, CW., Castren, MK., Eisenberg, MS., Kleinman, ME., Kloeck, DA., Kloeck,
WG., Mancini, ME., Neumar, RW., Ornato, JP., Paiva, EF., Peberdy, MA., Soar, J., Rea, T., Sierra,
AF., Stanton, D., Zideman, DA. (2015) Cardiac Arrest and Cardiopulmonary Resuscitation
Outcome Reports: Update of the Utstein Resuscitation Registry Templates for Out-of-Hospital
Cardiac Arrest: A Statement for Healthcare Professionals From a Task Force of the International
Liaison Committee on Resuscitation (American Heart Association, European Resuscitation
Council, Australian and New Zealand Council on Resuscitation, Heart and Stroke Foundation of
Canada, InterAmerican Heart Foundation, Resuscitation Council of Southern Africa,
Resuscitation Council of Asia); and the American Heart Association Emergency Cardiovascular
Care Committee and the Council on Cardiopulmonary, Critical Care, Perioperative and
Resuscitation. Resuscitation 2015; 96: 328-40. Available from:
https://www.ahajournals.org/doi/full/10.1161/CIR.0000000000000144 [Accessed 19 April
2021]
Reinstadler, S.J., Reindl, M., Lechner, I., Holzknecht, M., Tiller, C., Roithinger, F.X., Frick, M.,
Hoppe, U.C., Jirak, P., Berger, R., Delle-Karth, G., Laßnig, E., Klug, G., Bauer, A., Binder, R.,
Metzler, B. (2020) Effect of the COVID-19 Pandemic on Treatment Delays in Patients with ST-
Segment Elevation Myocardial Infarction. J. Clin. Med. 9, 2183. Availablr from:
https://doi.org/10.3390/jcm9072183 [Accessed 19 April 2021]
Rodriguez-Leor, O., Cid-Alvarez, B. (2020). ST-Segment Elevation Myocardial Infarction Care
During COVID-19: Losing Sight of the Forest for the Trees. JACC. Case reports, 2(10), 1625–1627.
Availablr from: https://doi.org/10.1016/j.jaccas.2020.04.011 [Accessed 19 April 2021]
Rosell Ortiz, F., Fernández Del Valle, P., Knox, E. C., Jiménez Fábrega, X., Navalpotro Pascual, J.
M., Mateo Rodríguez, I., Ruiz Azpiazu, J. I., Iglesias Vázquez, J. A., Echarri Sucunza, A., Alonso
Moreno, D. F., Forner Canos, A. B., García-Ochoa Blanco, M. J., López Cabeza, N., Mainar
Gómez, B., Batres Gómez, S., Cortés Ramas, J. A., Ceniceros Rozalén, M. I., Guirao Salas, F. A.,
Fernández Martínez, B., Daponte Codina, A., OHSCAR investigators (2020). Influence of the
Covid-19 pandemic on out-of-hospital cardiac arrest. A Spanish nationwide prospective cohort
study. Resuscitation, 157, 230–240. Available from:
https://doi.org/10.1016/j.resuscitation.2020.09.037 [Accessed 19 April 2021]
Solomon, MD., McNulty, EJ., Rana, JS., Leong, TK., Ambrosy, AP., Sidney, S., (2020) The Covid-19
Pandemic and the Incidence of Acute Myocardial Infarction. New England Journal of Medicine ;
383:691-693. Available from: https://www.nejm.org/doi/full/10.1056/NEJMc2015630
[Accessed 19 April 2021]

64
ACKNOWLEDGEMENTS
In particular NOCA would like to acknowledge
• All of the audit coordinators and clinical leads in the hospitals
• Healthcare Pricing Office
• Out-Of-Hospital Cardiac Arrest Register Team
• Health Service Executive - Quality Improvement Team

65
Appendix 1: ICD 10 Codes for STEMI and NSTEMI
I21.0 Acute transmural myocardial infarction of anterior wall Transmural infarction (acute)(of)(STEMI):
• anterior (wall) NOS
• anteroapical
• anterolateral
• anterosepta
I21.1 Acute transmural myocardial infarction of inferior wall Transmural infarction (acute)(of)(STEMI):
• diaphragmatic wall
• inferior (wall) NOS
• inferolateral
• inferoposterior
I21.2 Acute transmural myocardial infarction of other sites Transmural infarction (acute)(of)(STEMI):
• apical-lateral
• basal-lateral
• high lateral
• lateral (wall) NOS
• posterior (true)
• posterobasal
• posterolateral
• posteroseptal
• septal NOS
I21.3 Acute transmural myocardial infarction of unspecified site ST elevation myocardial infarction [STEMI] NOS
• Transmural myocardial infarction NOS
I21.4 Acute subendocardial myocardial infarction(acute) NOS

66
Appendix 2: Optimal Reperfusion Service Protocol

+353 1 4028577 [email protected] @noca_irl www.noca.ie