
NO LONGER ‘MANAGING’
44
Institute for Public Policy Research NO LONGER ‘MANAGING’ THE RISE OF WORKING POVERTY AND FIXING BRITAIN'S BROKEN SOCIAL SETTLEMENT Clare McNeil and Henry Parkes with Kayleigh Garthwaite and Ruth Patrick May 2021
Transcript of NO LONGER ‘MANAGING’

Institute for Public Policy Research
NO LONGER ‘MANAGING’THE RISE OF WORKING POVERTY AND FIXING BRITAIN'S BROKEN SOCIAL SETTLEMENT
Clare McNeil and Henry Parkes with Kayleigh Garthwaite and Ruth Patrick
May 2021
ABOUT IPPRIPPR, the Institute for Public Policy Research, is the UK’s leading progressive think tank. We are an independent charitable organisation with our main offices in London. IPPR North, IPPR’s dedicated think tank for the North of England, operates out of offices in Manchester and Newcastle, and IPPR Scotland, our dedicated think tank for Scotland, is based in Edinburgh.
Our purpose is to conduct and promote research into, and the education of the public in, the economic, social and political sciences, science and technology, the voluntary sector and social enterprise, public services, and industry and commerce.
IPPR 14 Buckingham Street London WC2N 6DF T: +44 (0)20 7470 6100 E: [email protected] www.ippr.org Registered charity no: 800065 (England and Wales), SC046557 (Scotland)
This paper was first published in May 2021. © IPPR 2021
The contents and opinions expressed in this paper are those of the authors only.
The progressive policy think tank

IPPR | ‘No longer managing’ The rise of working poverty and fixing Britain's broken social settlement 1
CONTENTS
Summary ..........................................................................................................................3
1. Introduction ................................................................................................................8
2. Poverty in the UK: ................................................................................................... 11Overview .................................................................................................................... 11Working poverty has risen at the same time as record
employment rates ...............................................................................................14What factors are driving the rise in working poverty? ..................................14Which households are worst affected by the rise in working poverty? .... 19Poverty in the pandemic .......................................................................................25Conclusion ................................................................................................................ 27
3. The unchecked rise in working poverty over two decades and its consequences ....................................................................................................29
4. Next steps: Towards a new role for the welfare state in combatting working poverty ......................................................................................................321. Containing housing costs as a share of income per household .............342. Containing childcare costs as a proportion of income per
household, on a path towards universal childcare ....................................353. Making work pay ...............................................................................................36
References ................................................................................................................... 38
Annex ..............................................................................................................................41
2 IPPR | ‘No longer managing’ The rise of working poverty and fixing Britain's broken social settlement
DownloadThis document is available to download as a free PDF and in other formats at:http://www.ippr.org/research/publications/no-longer-managing
CitationIf you are using this document in your own writing, our preferred citation is: McNeil C and Parkes H (2021) ‘No longer managing’ The rise of working poverty and fixing Britain's broken social settlement, IPPR. http://www.ippr.org/research/publications/no-longer-managing
Permission to shareThis document is published under a creative commons licence: Attribution-NonCommercial-NoDerivs 2.0 UK http://creativecommons.org/licenses/by-nc-nd/2.0/uk/ For commercial use, please contact [email protected]
ABOUT THE AUTHORS Clare McNeil is associate director for work and the welfare state at IPPR and leads IPPR’s Future Welfare State programme.
Henry Parkes is a senior economist at IPPR.
Dr Kayleigh Garthwaite is a fellow at the department of social policy, sociology and criminology at the University of Birmingham.
Dr Ruth Patrick is a lecturer in social policy at the University of York.
ACKNOWLEDGEMENTS We would like to thank Paul Gregg for his valuable support in developing the analysis and insights set out in this report. We would also like to thank the Covid Realities research programme team, in particular Sophie Howes and Hannah Aldridge for their comments and the Covid Realities programme research participants, as well as members of IPPR’s Future Welfare State programme advisory board, Ashwin Kumar, Becky Milne, Carys Roberts and Harry Quilter-Pinner.
Finally, the Covid Realities research programme has been funded by the Nuffield Foundation, but the views expressed are those of the authors and not necessarily the Foundation. Visit www.nuffieldfoundation.org

IPPR | ‘No longer managing’ The rise of working poverty and fixing Britain's broken social settlement 3
SUMMARY
In this paper we trace the emergence of a poorly understood social challenge and one which symbolises Britain’s broken ‘social settlement’: the continued rise in working poverty since the beginning of this century. We find that rising housing costs for those on low incomes has been the key factor driving higher rates of working poverty in recent years. This is caused by the growth of people living in the private rented sector and the increasing cost of rents: housing costs for private tenants have risen by almost half (48 per cent) in real terms over 25 years. This in turn is contributing to widening inequality, as there is a growing ‘locked out’ group formed disproportionately of working families with children being pushed into poverty, while helping to grow the wealth of an inside rentier class of private landlords. These landlords are also receiving at least £11.1 billion in state spending on housing support annually.
Our welfare system is built on the notion that work is the main route out of poverty and this government has promised to ‘level up’ opportunity through skills, jobs and economic growth. Yet for increasing numbers of working families around the country, the promise of social mobility through ‘hard work’ as a route out of poverty alone is failing to deliver. The national focus on higher per capita GDP growth and the regional focus on higher per capita GVA growth have delivered little for working families over the past two decades. We argue for greater priority to be given in welfare and economic policy to bringing down the high costs of housing, childcare and other essential goods as a proportion of household income, as well as reforms to genuinely ‘make work pay’.
*****
Working poverty – poverty experienced in households where one or more people are in work – has been rising under successive governments since 2004. This contrasts with policy successes such as the fall in rates of worklessness over the same period, the turnaround in pensioner poverty over the past few decades, and the reductions in child poverty achieved between the late 90s and 2010. All of these past successes show that government policy can limit and indeed reverse increases in poverty.
With unemployment projected by the OBR to rise to 6.5 per cent by the end of the year, reducing worklessness is once again a key priority for government. But high levels of working poverty mean that many of those who are unemployed will simply swap ‘out of work’ poverty for ‘ in-work’ poverty once they do hopefully find work.
Understanding what lies behind the rise in working poverty is therefore crucial. The living standards of families who fall into the poorest half of households were once a key focus for the Conservatives with promises of support for ‘just about managing’ families. However, we find that a growing number of these families are ‘no longer managing’, as rising costs and falling incomes are increasingly dragging them below the relative poverty line.

4 IPPR | ‘No longer managing’ The rise of working poverty and fixing Britain's broken social settlement4
Based on analysis of the latest available data, we find that levels of in-work poverty are highest in London, Wales and the North of England and that in addition:• Rates of working poverty hit a new high of 17 per cent in working households
– more than one in six – before the pandemic took hold in early 2020. • In a significant shift from even a decade ago, families with one full-time and
one-part time earner are increasingly being pulled into poverty. For people in this group, the chances of being pulled into poverty have doubled over the past two decades – from one in 20 to one in 10.
• Even for households with two people in full-time work, the chances of being pulled into poverty have doubled, rising from 1.4 per cent to 3.9 per cent.
• Single parents, single earner couple families and large families are worst affected by rising working poverty. Working poverty rates among families with three or more children have reached a record high at 42 per cent – up more than two-thirds over the past decade.
• Couple households with one full-time earner now have a poverty rate of 31 per cent which is almost as high as working households where nobody works full-time.
We draw several conclusions as to what is driving these increases from our analysis of trends in earned income, costs facing families and social security support. • First, that spiralling housing costs in the private rented sector (PRS) which
have risen substantially faster among poor working households compared to the average, is a key factor driving increases in working poverty in recent years. Housing costs are 39 per cent higher for poor households than in 1996/97 in real terms, compared to just a 19 per cent increase of the median amongst all households over the same period. With one in four households projected to be living in the PRS by 2025, and average housing costs being highest in this sector, further increases in working poverty rates are all but guaranteed unless action is taken.
• Second, that wages are failing to provide enough protection against poverty. While ‘work still pays’, the returns are diminishing. Increasingly (for large families in particular) two full-time earners paid at the minimum wage are needed for families to avoid being pulled into poverty – and even this is not enough for an increasing number of households.
• Third, that our social security system (housing support in particular) is failing to keep up with the impact of runaway rents in the private sector for those on low incomes, particularly for families with children.
• Finally, given the increasing necessity of having two parents in regular work to avoid poverty for those on modest incomes, we find that a lack of flexible and affordable childcare, as well as accessible and flexible or part-time work, is a growing and neglected cause of modern working poverty.
These are the dire social consequences of an economy that has become unhealthily dependent on house price growth, assisted by the residualisation of the welfare state over decades, in particular the privatisation of housing and pensions which began under Margaret Thatcher in the 1980s. We argue that the continued rise in working poverty is unsustainable, both due to the damage it is doing to individuals, families and communities, and its wider social, economic and political consequences. Yet even the modest ambition of limiting the rise in working poverty will require a radical rethink of both political priorities and policy as we look to the future.
In order to begin to create a more just social settlement and to increase living standards for those on low and middle incomes, we argue that new objectives
IPPR | ‘No longer managing’ The rise of working poverty and fixing Britain's broken social settlement 5
are needed for welfare, economic and housing policy, focused on what needs to be done to increase household residual income - income left for discretionary spend after housing, utilities and transport.
The government's regional productivity and growth or ‘levelling up’ agenda is unlikely to benefit working families if it remains largely focused on physical infrastructure, and fails to put in place the policies needed to boost incomes after essential costs, thereby holding back economic growth and creating exclusion. Instead, an expanded alternative is needed, including tangible and easily understood objectives to bear down on some of the highest costs working families face – housing and childcare - and to ‘make work pay’.
We set out some illustrative options for these objectives. Targets towards achieving these could be regionally set and developed but would require reforms led by central government. Developing this agenda further will be a focus of future reports from this programme.
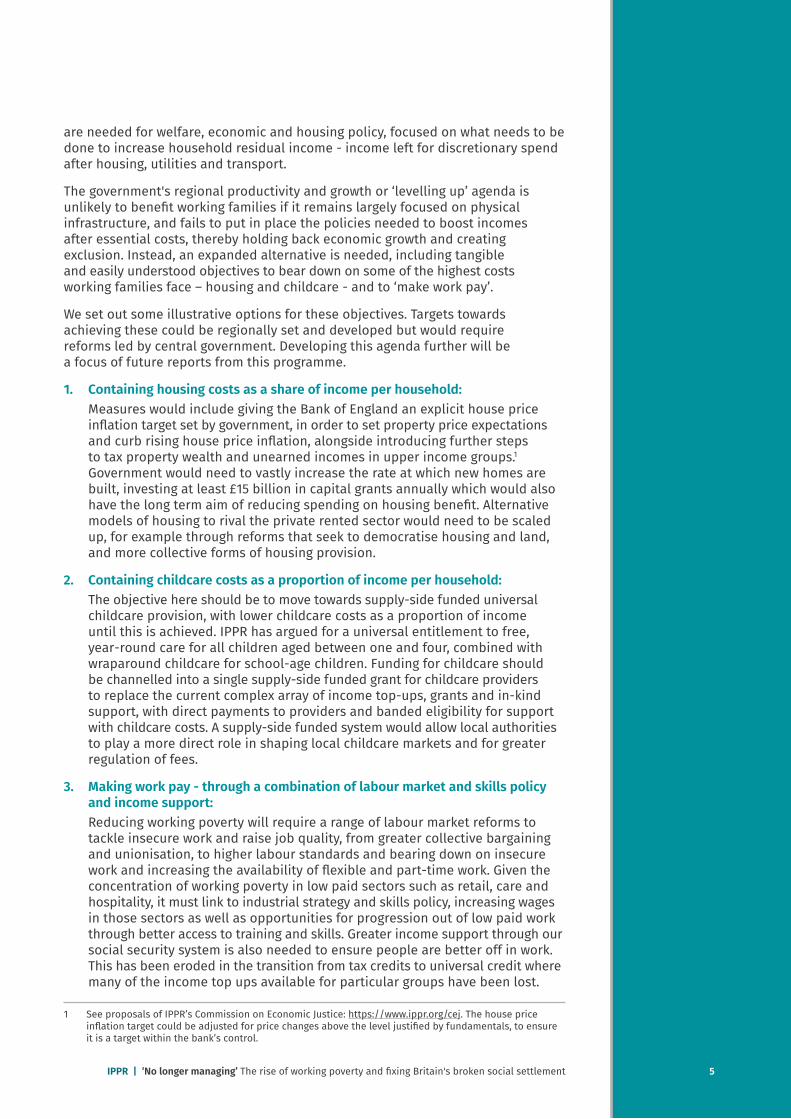
1. Containing housing costs as a share of income per household:Measures would include giving the Bank of England an explicit house price inflation target set by government, in order to set property price expectations and curb rising house price inflation, alongside introducing further steps to tax property wealth and unearned incomes in upper income groups.1 Government would need to vastly increase the rate at which new homes are built, investing at least £15 billion in capital grants annually which would also have the long term aim of reducing spending on housing benefit. Alternative models of housing to rival the private rented sector would need to be scaled up, for example through reforms that seek to democratise housing and land, and more collective forms of housing provision.
2. Containing childcare costs as a proportion of income per household:The objective here should be to move towards supply-side funded universal childcare provision, with lower childcare costs as a proportion of income until this is achieved. IPPR has argued for a universal entitlement to free, year-round care for all children aged between one and four, combined with wraparound childcare for school-age children. Funding for childcare should be channelled into a single supply-side funded grant for childcare providers to replace the current complex array of income top-ups, grants and in-kind support, with direct payments to providers and banded eligibility for support with childcare costs. A supply-side funded system would allow local authorities to play a more direct role in shaping local childcare markets and for greater regulation of fees.
3. Making work pay - through a combination of labour market and skills policy and income support:Reducing working poverty will require a range of labour market reforms to tackle insecure work and raise job quality, from greater collective bargaining and unionisation, to higher labour standards and bearing down on insecure work and increasing the availability of flexible and part-time work. Given the concentration of working poverty in low paid sectors such as retail, care and hospitality, it must link to industrial strategy and skills policy, increasing wages in those sectors as well as opportunities for progression out of low paid work through better access to training and skills. Greater income support through our social security system is also needed to ensure people are better off in work. This has been eroded in the transition from tax credits to universal credit where many of the income top ups available for particular groups have been lost.
1 See proposals of IPPR’s Commission on Economic Justice: https://www.ippr.org/cej. The house price inflation target could be adjusted for price changes above the level justified by fundamentals, to ensure it is a target within the bank’s control.
5
6 IPPR | ‘No longer managing’ The rise of working poverty and fixing Britain's broken social settlement
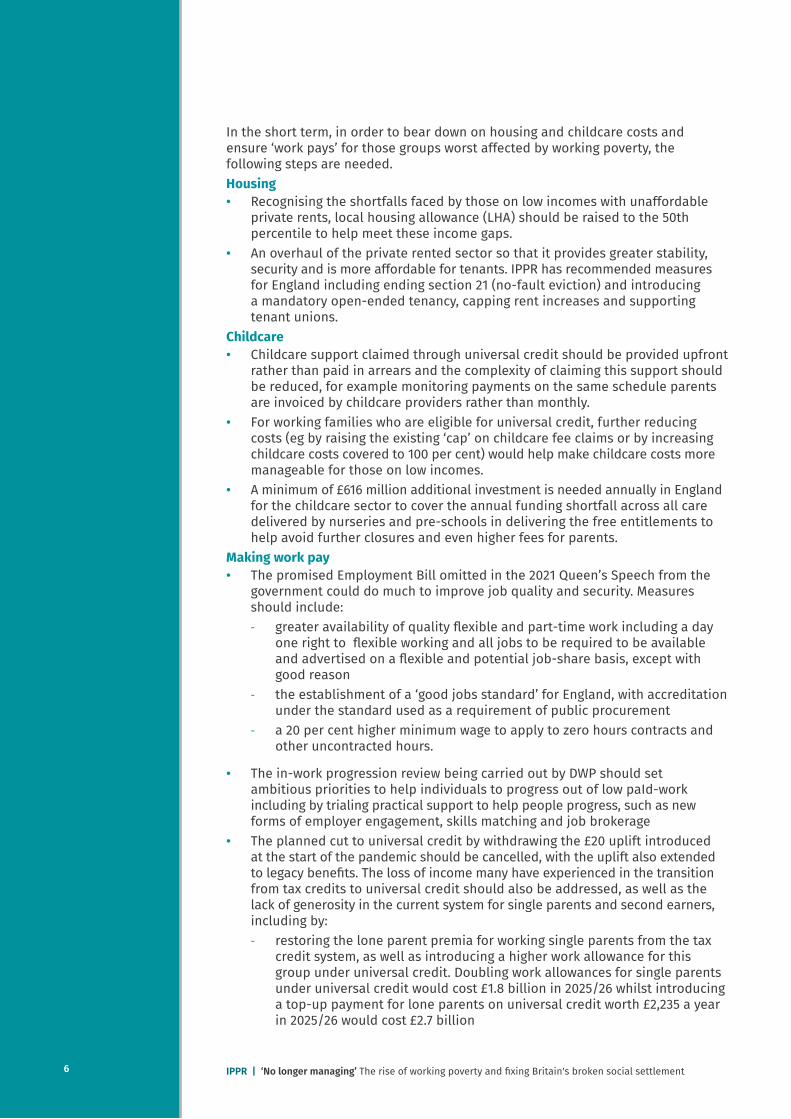
In the short term, in order to bear down on housing and childcare costs and ensure ‘work pays’ for those groups worst affected by working poverty, the following steps are needed. Housing• Recognising the shortfalls faced by those on low incomes with unaffordable
private rents, local housing allowance (LHA) should be raised to the 50th percentile to help meet these income gaps.
• An overhaul of the private rented sector so that it provides greater stability, security and is more affordable for tenants. IPPR has recommended measures for England including ending section 21 (no-fault eviction) and introducing a mandatory open-ended tenancy, capping rent increases and supporting tenant unions.
Childcare• Childcare support claimed through universal credit should be provided upfront
rather than paid in arrears and the complexity of claiming this support should be reduced, for example monitoring payments on the same schedule parents are invoiced by childcare providers rather than monthly.
• For working families who are eligible for universal credit, further reducing costs (eg by raising the existing ‘cap’ on childcare fee claims or by increasing childcare costs covered to 100 per cent) would help make childcare costs more manageable for those on low incomes.
• A minimum of £616 million additional investment is needed annually in England for the childcare sector to cover the annual funding shortfall across all care delivered by nurseries and pre-schools in delivering the free entitlements to help avoid further closures and even higher fees for parents.
Making work pay• The promised Employment Bill omitted in the 2021 Queen’s Speech from the
government could do much to improve job quality and security. Measures should include: - greater availability of quality flexible and part-time work including a day
one right to flexible working and all jobs to be required to be available and advertised on a flexible and potential job-share basis, except with good reason
- the establishment of a ‘good jobs standard’ for England, with accreditation under the standard used as a requirement of public procurement
- a 20 per cent higher minimum wage to apply to zero hours contracts and other uncontracted hours.
• The in-work progression review being carried out by DWP should set ambitious priorities to help individuals to progress out of low paId-work including by trialing practical support to help people progress, such as new forms of employer engagement, skills matching and job brokerage
• The planned cut to universal credit by withdrawing the £20 uplift introduced at the start of the pandemic should be cancelled, with the uplift also extended to legacy benefits. The loss of income many have experienced in the transition from tax credits to universal credit should also be addressed, as well as the lack of generosity in the current system for single parents and second earners, including by: - restoring the lone parent premia for working single parents from the tax
credit system, as well as introducing a higher work allowance for this group under universal credit. Doubling work allowances for single parents under universal credit would cost £1.8 billion in 2025/26 whilst introducing a top-up payment for lone parents on universal credit worth £2,235 a year in 2025/26 would cost £2.7 billion
6
IPPR | ‘No longer managing’ The rise of working poverty and fixing Britain's broken social settlement 7
- reintroducing a top-up payment for those with a limited capability for work on universal credit as was previously phased out in 2016/17. We estimate this would cost £1.4 billion in 2025/26
- removing the two-child limit which will increase already high rates of working poverty among large families with this impact increasing over time. We estimate this would cost £2.5 billion in 2025/26.
This paper is the fourth from IPPR’s Future Welfare State programme, which is reviewing the current shape of the welfare state and asking whether it is configured to address the urgent challenges and opportunities facing the UK in the 2020s and beyond. The wider context for this paper is the major transition the UK is undergoing after Brexit and the Covid-19 pandemic, both of which stand to entrench existing income and wealth inequalities, prompting calls for the UK to ‘build back better’ and 'level up’.
7

8 IPPR | ‘No longer managing’ The rise of working poverty and fixing Britain's broken social settlement
1. INTRODUCTION
Poverty reduction has, to a greater or lesser extent, always been an objective of the state. However, different political leaders, parties and projects have taken very different approaches to tackling poverty over time. In 1945, following the second world war, politicians of both major parties pushed for a collectivised welfare state that supported people ‘from cradle to grave’ against shared social shocks such as unemployment, sickness and ageing. This included the introduction of universal public services like the National Health Service, a National Insurance system to fund cash benefits and significant investment in shared assets such as social housing.
DEFINITIONS OF POVERTY AND FOCUS OF THIS PAPERThis paper examines the goal of poverty alleviation. Policymakers typically focus on different types of poverty and groups when approaching poverty alleviation. Firstly, we distinguish between working-age poverty and pensioner poverty. Our focus for this paper is primarily on working-age poverty. Pensioner poverty has fallen since the series of reforms introduced from the 2000s to reduce poverty among this group, culminating in the ‘triple lock’. The fall is also due to relatively high levels of home ownership among this age group compared with the working-age population.
When examining working-age poverty, we distinguish between in-work and out-of-work poverty. This distinction is becoming less important as a result of the introduction of universal credit, which brings together some in-work and out-of-work benefits. However, our focus in this paper is largely on in-work poverty, which has risen steadily over the past two decades, while out-of-work poverty is falling (though remains high).
In more recent decades, particularly under the premierships of Margaret Thatcher, John Major and later David Cameron, an alternative approach to the welfare state has been taken. This has seen growing restraints on public spending, a shift towards greater means testing rather than universality, and the privatisation of public assets, not least social housing through successive ‘help to buy’ schemes. The Labour governments under Tony Blair and Gordon Brown invested more funding in the welfare state, including through the introduction of tax credits and active labour market policies to tackle high unemployment rates, particularly among disadvantaged groups. However, in other respects, their welfare policy built on shifts that began under Thatcher, with the continuation of ‘help to buy’ housing policy and greater targeting of policy in the welfare regime.
Underpinning the paradigm shift we have seen in welfare policy in the UK over recent decades has been a simple and intuitively attractive idea: that the state – and in particular the benefits system – should focus on getting people into and helping them stay in work as the main route out of poverty. This idea has also been intrinsically linked to the concepts of social mobility and personal responsibility: those who work hard will get on, moving out of poverty and the ‘working class’. This has often led – by implication – to the belief (sometimes implicit rather than explicit) that those who remain in poverty simply aren’t working hard enough.

IPPR | ‘No longer managing’ The rise of working poverty and fixing Britain's broken social settlement 9
The premise of these arguments has always been highly questionable. Many of the factors that determine people’s life circumstances are structural rather than individual. This suggests that a collective rather than individual response is both likely to be more effective but also more socially just. Furthermore, there is also a growing acceptance, even among Conservative voters, that people often need support in order to ‘thrive’. Put simply: by providing everyone with a set of basic capabilities – including a decent income, education, a home and health – we ensure that people are able to create the foundations for a good life.
However, as we demonstrate in this paper, the ideas that have underpinned these policy changes – and in particular the argument that work is the main route out of poverty – have been challenged yet further by changes in our society in the last decade. Notably, in recent years the UK has enjoyed an employment boom, with record numbers of people in work. This is, in part, testament to the success of some of these welfare policies which have helped drive higher levels of employment. Yet despite this, the issue of poverty has remained, with a growing number of families in poverty. Moreover, staggeringly, most people in poverty in the UK now live in a family with at least one person in work.
There is little doubt that Covid-19 will see the challenge of worklessness re-emerge as a major problem, as it was in the 1970s and 1980s, with unemployment set to grow to a peak of 6.5 per cent by the end of 2021. IPPR has undertaken extensive work to set out how we can manage this new crisis, reduce unemployment and support people back into work. But the main lesson from our analysis in this paper is that to truly ‘build back better’, policymakers must take heed of the longer view of poverty in the UK. This will require them to grapple with the challenge of in-work poverty which pre-dates the Covid-19 pandemic. Moreover, it is becoming increasingly clear that our politics (and, as a result, our policy) has been unable to catch up to this new reality. Both Theresa May, in speaking of the ‘just about managing’, and Ed Miliband, talking of the ‘squeezed middle’, started to move towards a new political language and agenda to speak to the concerns, hopes and aspirations of this group of people in society. But, in truth, neither quite managed to find reforms to match their rhetoric. Both Boris Johnson’s levelling-up agenda and Keir Starmer’s aspiration to make the UK ‘the best place to grow up, and grow old, in’ must take on this challenge. This paper is an attempt to begin setting out how this can be achieved.
This report – part of our Future Welfare State programme – is our attempt to support government in doing this by returning to the objectives that underpinned the creation of the welfare state in 1945 and understanding how we measure up against them today. In particular, we ask the following.• Why in-work poverty has been growing over recent decades.• Which groups of people have been most impacted.• How the welfare state might adapt to address the problem.
As chapter 2 of this report sets out, our analysis reconfirms pre-existing IPPR work that highlights the challenge of low and stagnant pay for many in society, especially following the 2007/08 financial crisis. But our analysis also exposes that just as important is the issue of rising costs in the private rented sector, with a housing crisis at the heart of the problem. Increasingly, for many in society, home ownership is an unattainable dream and, with limited social housing available as a result of ‘right to buy’ and a failure to build more new social housing, too many people face the scourge of rising rents in the private sector. This is facilitating wealth accrual for a growing ‘rentier’ class, who are profiting from a lack of regulation and historically low mortgage rates, while private renters on low incomes are increasingly unable to afford to access to home ownership and are being pushed into debt and poverty.

10 IPPR | ‘No longer managing’ The rise of working poverty and fixing Britain's broken social settlement
Without reform of the housing sector and a shift in the UK’s reliance on the housing market as an engine of growth, either working poverty rates will continue to rise or social security payments will have to increase to keep up. In the final chapter we examine options for how welfare and economic policy can respond to this dilemma.
THE COVID REALITIES RESEARCH PROGRAMME Covid Realities is a research programme looking at the experiences of families on a low income during the pandemic, funded by the Nuffield Foundation. In this project, researchers have been working directly with over 100 parents and carers to understand the impact the Covid-19 pandemic is having on their day-to-day lives. Parents can log on to a safe online space, where they complete diary entries, respond to 'big questions of the week' and take part in virtual discussion groups.
We have been fortunate to work in partnership on this paper with the Covid Realities project, led by a research team from the universities of York and Birmingham and working in partnership with the Child Poverty Action Group. We also build on previous research carried out by organisations specialising in poverty and welfare policy, drawing widely on their evidence and expertise. These organisations include the Joseph Rowntree Foundation, Save The Children, the Resolution Foundation and the Child Poverty Action Group.

IPPR | ‘No longer managing’ The rise of working poverty and fixing Britain's broken social settlement 11
2. POVERTY IN THE UK: UNDERSTANDING THE RISE IN WORKING POVERTY
OVERVIEWPoverty trends present a mixed picture over the past 25 years, with some groups faring significantly worse than others. Pensioner poverty has almost halved over the past 20 years, while working-age poverty has remained relatively stable, varying between 18 to 21 per cent since 1994. After falling consistently between 1994/95 and 2004/05, child poverty then oscillated and has been gradually rising since 2010/11, when it was at its lowest point in recent years.
FIGURE 2.1 Poverty has nearly halved among pensioners, but has remained broadly stable among those of working ageRelative poverty rates (after housing costs)
Source: IPPR analysis of Households Below Average Income (DWP 2020a) and Family Resources Survey (DWP 2020b)
Pensioners have benefitted from favourable treatment from successive governments over this period in terms of improvement to benefits and ‘triple lock’ policies, which have enabled state-provided pensioner payments to grow in real terms – along with benefitting from generous private pension provision in many cases. At the same time, they have benefitted from rising levels of outright property ownership, with many pensioners having paid off their mortgages. As a consequence, they have higher disposable income on average relative to other groups.
0%
5%
10%
15%
20%
25%
30%
35%
40%
Working Age Pensioners Children
1994
/95
1995
/96
1996
/97
1997
/98
1998
/99
1999
/00
2000
/01
2001
/02
2002
/03
2003
/04
2004
/05
2005
/06
2006
/07
2007
/08
2008
/09
2009
/10
2010
/11
2011
/12
2012
/13
2013
/14
2014
/15
2015
/16
2016
/17
2017
/18
2018
/19
2019
/20

12 IPPR | ‘No longer managing’ The rise of working poverty and fixing Britain's broken social settlement
For working-age people, the story is different. Poverty rates among households not in paid work have been falling, but still exceed 50 per cent. For those who live in working households, however, the likelihood of being in poverty has steadily increased: growing from 13 per cent to 17 per cent over the past 25 years. This increase, combined with the fact that the ‘ in-work’ group is so large, meant that in 2019/20 the majority of those living in poverty were in households which had some form of paid work.
FIGURE 2.2Among those living in working households, the likelihood of being in poverty has increasedIn-work relative poverty, after housing costs
Source: IPPR analysis of Households Below Average Income (DWP 2020a) and Family Resources Survey (DWP 2020b)
Levels of in-work poverty vary significantly by region. We find that although in-work poverty has risen across the country over time, this growth has been particularly consistent and striking in London, which had fairly ‘average’ levels of in-work poverty in the late 1990s but has since climbed to rates which are considerably higher than elsewhere. More than one in five people in working households in London live in poverty (22 per cent) compared with 15 per cent in the South and East of England and 14 per cent in Scotland. Outside of London, Wales and the North of England have the highest levels of in-work poverty.
0%
2%
4%
6%
8%
10%
12%
14%
16%
18%
20%
1996
/97
1997
/98
1998
/99
1999
/00
2000
/01
2001
/02
2002
/03
2003
/04
2004
/05
2005
/06
2006
/07
2007
/08
2008
/09
2009
/10
2010
/11
2011
/12
2012
/13
2013
/14
2014
/15
2015
/16
2016
/17
2017
/18
2018
/19
2019
/20

IPPR | ‘No longer managing’ The rise of working poverty and fixing Britain's broken social settlement 13
FIGURE 2.3In-work poverty has risen across the country but most notably in London In-work poverty rates by region
Source: IPPR analysis of Households Below Average Income (DWP 2020a) and Family Resources Survey (DWP 2020b)Note: Regional figures are three year averages, so for example the statistic for 2019/20 relate to the period 2017/18 to 2019/20
POVERTY MEASUREMENTPoverty measurement in the UK is based on the analysis of the Households Below Average Income, an annual survey of representative households. Detailed data are collected for each household on all sources of income including wages, benefits and rental income, along with data on housing costs, namely rents/mortgage payments and water rates. Household costs are subtracted from income sources to arrive at a disposable income estimate for each household.
To enable meaningful comparisons between different households, these disposable incomes are then equivalised – that is, adjusted for the number of people who live in the household and how old they are.
The relative poverty line is computed as 60 per cent of the median equivalised household income, with any household under this amount being described as ‘ in poverty’. Equivalisation means that households of different types have different poverty lines. For example, in 2018/19 the poverty line for a single person was £147, whereas for a couple with two young children it was £354.
A growing proportion of those in work find themselves under the relative poverty line. An average person in a working household is 32 per cent more likely to be in poverty now than in 1996, approaching a one in five likelihood very soon if trends are not reversed. It is still the case that ‘work pays’: moving into work reduces the risk of falling into poverty by around half on average. This reduction is smaller for those whose work is more precarious – reflecting the fact that precarity and low pay often go hand in hand (Judge and Slaughter 2020). However, our analysis demonstrates that the returns to work are diminishing over time.
0%
5%
10%
15%
20%
25%
North of England South of England and East of EnglandLondon Midlands Wales Scotland
1998
/99
1999
/00
2000
/01
2001
/02
2002
/03
2003
/04
2004
/05
2005
/06
2006
/07
2007
/08
2008
/09
2009
/10
2010
/11
2011
/12
2012
/13
2013
/14
2014
/15
2015
/16
2016
/17
2017
/18
2018
/19
2019
/20

14 IPPR | ‘No longer managing’ The rise of working poverty and fixing Britain's broken social settlement
WORKING POVERTY HAS RISEN AT THE SAME TIME AS RECORD EMPLOYMENT RATESThe rise in working poverty has happened while the UK has enjoyed record levels of employment. Prior to the pandemic, the employment rate reached 76.6 per cent, the joint highest on record. Certain groups have seen very substantial increases in employment, such as single parents and second earners in couple households (both of which are disproportionately female). These increases were in part as a result of the active labour market policies (DWP 2013) and childcare reforms introduced in the 2000s (Brewer et al 2018).
FIGURE 2.4Single parents are increasingly likely to be in paid work, particularly those with younger childrenLone parent employment rates by age of youngest child
Source: IPPR analysis of Households Below Average Income (DWP 2020a) and Family Resources Survey (DWP 2020b)
The UK’s employment boom had begun to slow before the pandemic began, with unemployment rising from a record low of 3.8 per cent in November 2019 to four per cent in February 2020 (ONS 2021a). Now the Office for Budget Responsibility projects that as a result of the pandemic and disruptions to trade caused by Brexit, we will see unemployment rise by a further 500,000 to a peak of 6.5 per cent at the end of 2021 (OBR 2021).
Despite this, we may not experience an increase in relative poverty due to the temporary increase in universal credit and a fall in the median income and thus the ‘poverty line’, potentially disguising the negative impacts. However, we can expect increased long-term unemployment, job insecurity and underemployment in the short to medium term, all of which are likely to have a detrimental impact on earnings for those in the bottom half of the distribution, as well as increasing levels of destitution.
WHAT FACTORS ARE DRIVING THE RISE IN WORKING POVERTY?Working poverty will increase whenever disposable incomes (after subtracting housing costs) grow more slowly for the working poor than they do for middle income households. As such, working poverty may rise as a result of:
0-4 5-10 11-15 16-19
1994
/95
1995
/96
1996
/97
1997
/98
1998
/99
1999
/00
2000
/01
2001
/02
2002
/03
2003
/04
2004
/05
2005
/06
2006
/07
2007
/08
2008
/09
2009
/10
2010
/11
2011
/12
2012
/13
2013
/14
2014
/15
2015
/16
2016
/17
2017
/18
2018
/19
2019
/20
0%
10%
20%
30%
40%
50%
60%
70%
80%
90%

IPPR | ‘No longer managing’ The rise of working poverty and fixing Britain's broken social settlement 15
• changes in the labour market - for example if wages for the poorest workers fail to grow as quickly as they do for those in the middle
• changes in the social security system – if social security payments decline among those on low incomes (such changes will have a much smaller negative impact on ‘average’ income households)
• changes in costs facing low income families – for example if housing costs grow faster amongst low income groups than middle income groups
• changes in the incomes of pensioners relative to working age households – for example if pensioner incomes grows faster than working age incomes.
Of course, a combination of factors are generally at play and the picture is complex, with different forces pulling in different directions.
We know for instance that while wages having stagnated for middle earners since the financial crisis, labour market incomes have grown in real terms for those on the lowest incomes over the past decade. This has been helped along by increases in the minimum wage but this has not been enough. This is because much of this additional income is likely to be ‘swallowed up’ by withdrawal of benefits for those claiming in-work benefits and the fact that many on low pay are under-employed - working fewer hours than they would like (Innes 2020). We also know that pensioner incomes have grown faster than working age incomes, which will have contributed to rising working poverty. Alongside this is the broader context of a less adequate social security system since 2010 and higher housing costs for the poorest households, both of which our research finds have contributed significantly to the phenomena of growing in-work poverty in the past decade. We explore each of these factors below.
Housing costs have risen significantly Rising in-work poverty can be otherwise characterised as growth in poverty rates among renters. Rates of poverty have risen considerably among those in the private rented sector since 2000, with smaller but still significant growth among those living in social housing, who still have the highest overall rates of in-work poverty.
FIGURE 2.5In-work poverty has risen considerably among renters, but has been stable for mortgagers and people who own their home outrightIn-work poverty rates by housing tenure
Source: IPPR analysis of Households Below Average Income (DWP 2020a) and Family Resources Survey (DWP 2020b)
0%5%
10%15%20%25%30%35%40%45%
Owned outright Buying with a mortgage Social renters Private renters
1996
/97
1997
/98
1998
/99
1999
/00
2000
/01
2001
/02
2002
/03
2003
/04
2004
/05
2005
/06
2006
/07
2007
/08
2008
/09
2009
/10
2010
/11
2011
/12
2012
/13
2013
/14
2014
/15
2015
/16
2016
/17
2017
/18
2018
/19
2019
/20

16 IPPR | ‘No longer managing’ The rise of working poverty and fixing Britain's broken social settlement
On the other hand, rates of poverty among those who own property outright or who have been mortgagers have been low and stable over the period, with a small increase among mortgagers around the financial crisis.
The private rented sector has grown dramatically over the past 25 years, with a corresponding fall in home ownership, particularly among the young. In 1994/95, 65 per cent of under 40s were mortgagers, but this had fallen to 38 per cent by 2018/19. At the same time, the proportion of young renters has tripled (DWP 2020a). This means that over three million additional under 40s (ibid), instead of paying their own mortgage and building their own wealth, are paying the mortgages and building the wealth of their landlords. The poorest quintile are twice as likely to rent privately than in 2000, compared to a 50 per cent increase in the private rented sector overall
The rise of in-work poverty among the different tenancy groups is mirrored heavily by the extent to which housing costs have risen among these groups. Throughout the period, the costs for renters (both social and private) have been rising rapidly, while those on the property ladder have seen costs fall in real terms, as record low interest rates have kept costs down for mortgagers.
FIGURE 2.6Housing costs in the rented sector have risen dramatically, with private renter costs having increased by almost half in real terms over the past 25 yearsEquivalised median housing costs by tenure (2019/20 prices)
Source: IPPR analysis of Households Below Average Income (DWP 2020a) and Family Resources Survey (DWP 2020b)
The overall effect is that housing costs have increased much faster for poor working households than for those on average incomes (figure 2.7). Even with recent falls median housing costs are 39 per cent higher for working poor households than in 1996/97 in real terms, compared to just a 19 per cent increase of the median amongst all households over the same period.
Owned outright Buying with a mortgage
Social rented sector tenants Private renters
1994
/95
1995
/96
1996
/97
1997
/98
1998
/99
1999
/00
2000
/01
2001
/02
2002
/03
2003
/04
2004
/05
2005
/06
2006
/07
2007
/08
2008
/09
2009
/10
2010
/11
2011
/12
2012
/13
2013
/14
2014
/15
2015
/16
2016
/17
2017
/18
2018
/19
2019
/20
£0
£20
£40
£60
£80
£100
£120
£140
£160

IPPR | ‘No longer managing’ The rise of working poverty and fixing Britain's broken social settlement 17
FIGURE 2.7Poor households have experienced more dramatic housing cost growth overall, contributing to rising in-work povertyMedian housing costs, 2019/20 prices (1996/97 = 100)
Source: IPPR analysis of Households Below Average Income (DWP 2020a) and Family Resources Survey (DWP 2020b)
As Hassel and Palier (2021) have argued recently, the housing crisis we find ourselves in today is the result of the action (or inaction) of successive Westminster governments and has implications for both poverty and inequality.
THE HOUSING MARKET AND WEALTH INEQUALITY While Margaret Thatcher introduced the ‘right to buy’ scheme in the 1980s, the New Labour governments of the 1990s and 2000s did not dismantle the policy. While significant amounts of social housing was sold off, no new stocks of housing were built, such that by the 2010s the UK had the lowest levels of peacetime house-building since the 1920s.
At the same time, an unregulated rental market with high prices was allowed to grow unrestrained, effectively becoming a sub-contracted arm of the welfare state due to the lack of social housing. UK society has increasingly come to resemble the ‘haves’ and the ‘have-nots’, with access to home ownership and historically low mortgage costs the decisive factor in which group you belong to.
This rapid growth in the private rented sector and soaring rents are not only driving up poverty, they are also contributing to wealth inequality. In particular, there has been a marked increase in the number of people with second homes (the providers of the private rented sector). Indeed, the number of adults in families with additional property wealth has increased by more than 50 per cent this century (Bangham 2019). The total number of outstanding buy-to-let mortgages has risen 15 times since 2000 (ibid). This is facilitating wealth accrual to a ‘rentier’ class, who are profiting from a lack of regulation and historically low mortgage rates, while private renters are increasingly unable to afford to access to home ownership and are being pushed into debt and poverty. Limited action by government, such as introducing a stamp duty surcharge on the purchase of additional homes, has done little to stem the tide so far.
Poorest quintile All households
1996
/97
1997
/98
1998
/99
1999
/00
2000
/01
2001
/02
2002
/03
2003
/04
2004
/05
2005
/06
2006
/07
2007
/08
2008
/09
2009
/10
2010
/11
2011
/12
2012
/13
2013
/14
2014
/15
2015
/16
2016
/17
2017
/18
2018
/19
2019
/20
8090
100110120130140150160170

18 IPPR | ‘No longer managing’ The rise of working poverty and fixing Britain's broken social settlement
Childcare costs and availability prevent some households from escaping in-work povertyThe cost of housing is not the only significant cost facing low-income families. High childcare costs can prevent workers from being able to increase the number of hours they work, and thus to move out of poverty. Reductions in the generosity of the welfare system (as we highlight below) have effectively increased the level of earnings required to escape poverty, and therefore the number of hours that need to be worked. This impacts particularly on single parents, who face higher childcare costs than families with two earners and those with large families. What’s more, demand for the part-time and flexible work options often needed for those with pre-school and primary school age children considerably outstrips supply. Fewer than two in 10 jobs are advertised with options to work flexibly, despite the shift to home working seen during the pandemic (Timewise 2020).
The costs of childcare continue to rise year on year. In 2020 costs rose by 5 per cent, over twice the rate of inflation, and only half (56 per cent) of local authorities have enough childcare for parents working full-time (Coram Family and Childcare Trust 2020). For those who do pay for formal childcare, the significant impact of these costs on their residual household income is largely unaccounted for in official estimates, as the relative poverty measure does not subtract childcare costs when calculating disposable income. This means that working parents appear to fare better in the data than they are in reality. Previous analysis commissioned by Child Poverty Action Group has shown that poverty rates would be higher still for some groups of working parents if childcare costs were accounted for in the official poverty calculation (Hirsch and Valadez 2015). This problem is exacerbated by the fact that any childcare reimbursement through the universal credit and tax credit regimes is counted as income in the data, distorting the picture for these groups.
There is a growing shortfall in income support from social securityThe increases in the costs facing families have not been mirrored in rising incomes, and changes to the social security system in the past decade mean that different household types are now required to work more hours to escape in-work poverty. Research found that in 2019/20, a single parent with two children would have to work 23 hours per week at minimum wage to be above the poverty line, compared to just 16 hours had there been no post-2010 changes to the welfare system, representing a 44 per cent increase. A second earner in a couple would now need to work 19 hours compared to just nine hours previously (Judge and Slaughter 2020). For couple families, only those with one or no children do not require a second earner at all in order to escape poverty.
Social security support has failed in particular to keep up with rising housing costs. local housing allowance (LHA) was introduced in 2008 to help control the spiralling housing benefit bill driven by rising rents and ensuring that 50 per cent of the private rental market was affordable for claimants in their local area. However, in 2013 this was reduced to 30 per cent, followed by a less favourable uprating, then freezing up to the point of the pandemic, despite rental costs continuing to rise in many parts of the country. The situation was so severe in some places that less than 10 per cent of the private rented sector was affordable under LHAs (Kleynhans and Pennington 2020).
New data from Department for Work & Pensions (DWP) show that for households on universal credit, less than half (46 per cent) in the private rented sector had rent which was covered by LHA (DWP 2021). The recent decision to ‘re-set’ LHAs to the 30th percentile led to a modest improvement, but the current rate consistently falls short and drives financial precarity.
Our analysis of families in receipt of housing benefits over the past 25 years (figure 2.8) shows that the average shortfall between housing benefits and housing costs

19IPPR | ‘No longer managing’ The rise of working poverty and Britain's broken social settlement
has risen consistently over the past 15 years. This has been driven both by LHA policy and the removal of the spare room subsidy, which penalises households in the social rented sector who have what are deemed to be surplus bedrooms, impacting 240,000 households in the latest data (DWP 2021).
FIGURE 2.8Support for housing costs have declined in recent years Average shortfall between housing benefit and housing costs for out of work housing benefit recipients
Source: IPPR analysis of Households Below Average Income (DWP 2020a) and Family Resources Survey (DWP 2020b)Note: These calculations are three year averages, so figures for the period 2018/19 refer to the average of 2016/17 to 2018/19
SummaryDespite real growth in wages amongst the working poor over the past decade, driven in part by a higher minimum wage, in-work poverty has continued to increase. One driver is runaway housing costs amongst low-income groups who have been ‘locked in’ to the expensive private rented sector. At the same time, social security has become less generous - providing less support specifically for housing costs as well as less generous top-ups to low-income workers wages. Families may be prevented from increasing their hours due to childcare needs, particularly for single parents who face escalating prices, insufficient supply of childcare and a clunky reimbursement mechanism for costs through the universal credit and tax credit systems.
WHICH HOUSEHOLDS ARE WORST AFFECTED BY THE RISE IN WORKING POVERTY?We consider below which types of households have seen particularly large increases of in-work poverty.
Single parentsAmong all family types, single parents have seen a dramatic increase since around 2010, increasing from 20 to 40 per cent over the past 10 years. Smaller increases have also been seen across all other household types.
It’s worth noting that prior to this, employment rates among single parents were rising at the same time that poverty rates were falling, so there is no inevitability that growing employment rates must lead to higher rates of in-work poverty.
0%2%4%6%8%
10%12%14%16%18%
1998
/99
1999
/00
2000
/01
2001
/02
2002
/03
2003
/04
2004
/05
2005
/06
2006
/07
2007
/08
2008
/09
2009
/10
2010
/11
2011
/12
2012
/13
2013
/14
2014
/15
2015
/16
2016
/17
2017
/18
2018
/19
20 IPPR | ‘No longer managing’ The rise of working poverty and fixing Britain's broken social settlement
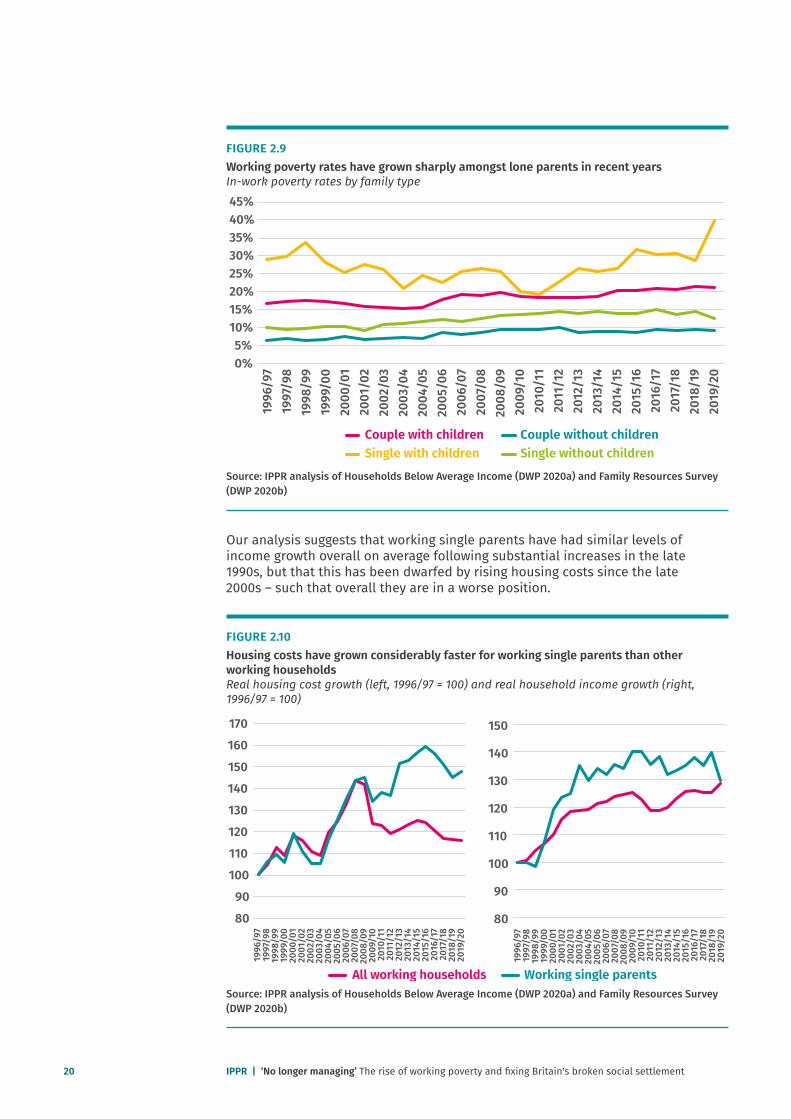
FIGURE 2.9Working poverty rates have grown sharply amongst lone parents in recent years In-work poverty rates by family type
Source: IPPR analysis of Households Below Average Income (DWP 2020a) and Family Resources Survey (DWP 2020b)
Our analysis suggests that working single parents have had similar levels of income growth overall on average following substantial increases in the late 1990s, but that this has been dwarfed by rising housing costs since the late 2000s – such that overall they are in a worse position.
FIGURE 2.10Housing costs have grown considerably faster for working single parents than other working householdsReal housing cost growth (left, 1996/97 = 100) and real household income growth (right, 1996/97 = 100)
Source: IPPR analysis of Households Below Average Income (DWP 2020a) and Family Resources Survey (DWP 2020b)
0%5%
10%15%20%25%30%35%40%45%
Couple with children Couple without childrenSingle with children Single without children
1996
/97
1997
/98
1998
/99
1999
/00
2000
/01
2001
/02
2002
/03
2003
/04
2004
/05
2005
/06
2006
/07
2007
/08
2008
/09
2009
/10
2010
/11
2011
/12
2012
/13
2013
/14
2014
/15
2015
/16
2016
/17
2017
/18
2018
/19
2019
/20
1996
/97
1997
/98
1998
/99
1999
/00
2000
/01
2001
/02
2002
/03
2003
/04
2004
/05
2005
/06
2006
/07
2007
/08
2008
/09
2009
/10
2010
/11
2011
/12
2012
/13
2013
/14
2014
/15
2015
/16
2016
/17
2017
/18
2018
/19
2019
/20
8090
100110120130140150160170
All working households Working single parents
1996
/97
1997
/98
1998
/99
1999
/00
2000
/01
2001
/02
2002
/03
2003
/04
2004
/05
2005
/06
2006
/07
2007
/08
2008
/09
2009
/10
2010
/11
2011
/12
2012
/13
2013
/14
2014
/15
2015
/16
2016
/17
2017
/18
2018
/19
2019
/20
80
90
100
110
120
130
140
150
IPPR | ‘No longer managing’ The rise of working poverty and fixing Britain's broken social settlement 21
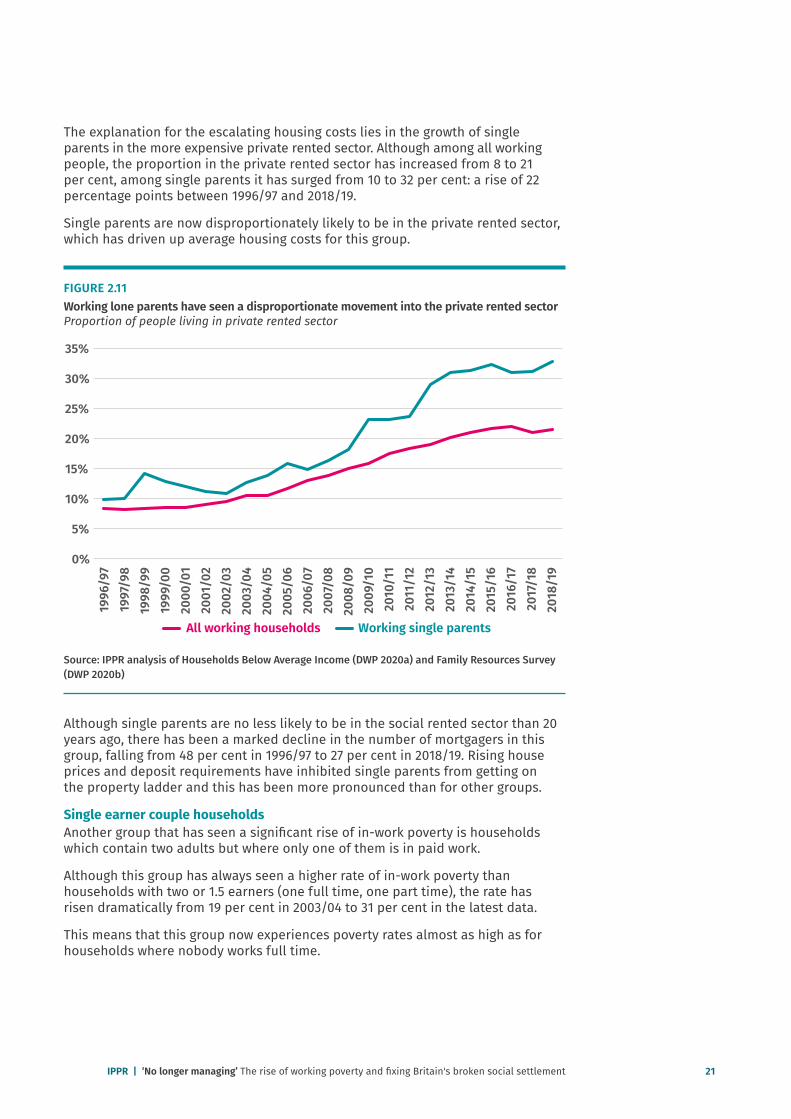
The explanation for the escalating housing costs lies in the growth of single parents in the more expensive private rented sector. Although among all working people, the proportion in the private rented sector has increased from 8 to 21 per cent, among single parents it has surged from 10 to 32 per cent: a rise of 22 percentage points between 1996/97 and 2018/19.
Single parents are now disproportionately likely to be in the private rented sector, which has driven up average housing costs for this group.
FIGURE 2.11Working lone parents have seen a disproportionate movement into the private rented sectorProportion of people living in private rented sector
Source: IPPR analysis of Households Below Average Income (DWP 2020a) and Family Resources Survey (DWP 2020b)
Although single parents are no less likely to be in the social rented sector than 20 years ago, there has been a marked decline in the number of mortgagers in this group, falling from 48 per cent in 1996/97 to 27 per cent in 2018/19. Rising house prices and deposit requirements have inhibited single parents from getting on the property ladder and this has been more pronounced than for other groups.
Single earner couple householdsAnother group that has seen a significant rise of in-work poverty is households which contain two adults but where only one of them is in paid work.
Although this group has always seen a higher rate of in-work poverty than households with two or 1.5 earners (one full time, one part time), the rate has risen dramatically from 19 per cent in 2003/04 to 31 per cent in the latest data.
This means that this group now experiences poverty rates almost as high as for households where nobody works full time.
0%
5%
10%
15%
20%
25%
30%
35%
1996
/97
1997
/98
1998
/99
1999
/00
2000
/01
2001
/02
2002
/03
2003
/04
2004
/05
2005
/06
2006
/07
2007
/08
2008
/09
2009
/10
2010
/11
2011
/12
2012
/13
2013
/14
2014
/15
2015
/16
2016
/17
2017
/18
2018
/19
All working households Working single parents

22 IPPR | ‘No longer managing’ The rise of working poverty and fixing Britain's broken social settlement
FIGURE 2.12In-work poverty has risen dramatically in households which contain two adults where only one of them is in paid work. In-work poverty by household work combinations
Source: IPPR analysis of Households Below Average Income (DWP 2020a) and Family Resources Survey (DWP 2020b)
It is useful to analyse some of the barriers this group in particular face to understand what could enable them to work and escape poverty. In the latest statistics, we find that of those non-workers:• 30 per cent were responsible for a child aged four or under compared to
15 per cent for all working households,• 14 per cent had three or more children compared to just six per cent among
all working households, and• 40 per cent lived in households with disabled people (core definition);
much higher than among all working households, where this statistic was just 25 per cent.
Considering specifically the characteristics of the non-workers: • around one in 10 identified themselves as informal carers and this has been
relatively stable throughout the period• the proportion of non-workers in these couples who have never worked has
more than doubled from eight per cent in 2000 to 20, suggesting that on average it will be increasingly difficult for these workers to find work
• among non-workers in these couples, around one in 10 say they are unemployed – much higher than in the general population. Among those in poverty, this increases to one in six. Of the non-workers, 17 per cent identify as permanently sick/disabled, though looking after the family/home remains the largest category for households both in and out of poverty.
0%5%
10%15%20%25%30%35%40%45%
One or more full-time self-employed Single/couple with all in full-time work
Couple with one full-time work and one part-time work
Couple with one full-time work and one not working
No one in full-time work with one or more in part-time work
1996
/97
1997
/98
1998
/99
1999
/00
2000
/01
2001
/02
2002
/03
2003
/04
2004
/05
2005
/06
2006
/07
2007
/08
2008
/09
2009
/10
2010
/11
2011
/12
2012
/13
2013
/14
2014
/15
2015
/16
2016
/17
2017
/18
2018
/19
2019
/20

IPPR | ‘No longer managing’ The rise of working poverty and fixing Britain's broken social settlement 23
FIGURE 2.13Non-workers in couples are most likely to identify as looking after the family for households both in and out of poverty Employment status of non-worker in single earner couple households (2018/19)
Source: IPPR analysis of Households Below Average Income (DWP 2020a) and Family Resources Survey (DWP 2020b)
Households where everybody works full or part timeThe majority of those in poverty where everybody works full time are single parent families. The level of in-work poverty among couple families where both people work full-time is still very low at just four per cent. Among households with 1.5 earners, the likelihood of being in poverty has increased from one in 20 to over one in 10.
FIGURE 2.14Both families with two full-time earners or where one person works full-time and the other part-time are now at greater risk of poverty than in the pastPoverty rate for couples where both work full time (left) and for couples with one full-time earner and one part-time earner (right)
Source: IPPR analysis of Households Below Average Income (DWP 2020a) and Family Resources Survey (DWP 2020b)
0%
5%
10%
15%
20%
25%
30%
35%
40%
45%
Unemployed
Retired
Student
Looking afte
r
family/home
Permanently
sick/d
isabled
Temporarily
sick/injured
Other inacti
ve
Not in poverty In poverty
0%2%4%6%8%
10%12%14%
1996/97 2019/200%2%4%6%8%
10%12%14%
1996/97 2019/20

24 IPPR | ‘No longer managing’ The rise of working poverty and fixing Britain's broken social settlement
Large familiesFinally, a group which has seen substantial rise of in-work poverty is that of families with three or more children relative to smaller families, and this has been particularly notable since 2012.
FIGURE 2.15Large families have seen the biggest increase of in-work poverty In-work poverty rates by number of children
Source: IPPR analysis of Households Below Average Income (DWP 2020a) and Family Resources Survey (DWP 2020b)
This rise of in-work poverty occurs as median housing costs for large families begins to substantially diverge from that of all working households. At the same time and compounding the issue, income growth has been even worse than average for working households
FIGURE 2.16Income growth for large working families has barely kept up with income growth for all working families and housing costs have risen considerably faster Median housing cost growth (left, 1996/97 = 100) and median income growth (right, 1996/97 = 100)
Source: IPPR analysis of Households Below Average Income (DWP 2020a) and Family Resources Survey (DWP 2020b)
0%5%
10%15%20%25%30%35%40%45%
No children One child Two children Three or more children
1996
/97
1997
/98
1998
/99
1999
/00
2000
/01
2001
/02
2002
/03
2003
/04
2004
/05
2005
/06
2006
/07
2007
/08
2008
/09
2009
/10
2010
/11
2011
/12
2012
/13
2013
/14
2014
/15
2015
/16
2016
/17
2017
/18
2018
/19
2019
/20
All working households Large working families
8090
100110120130140150160
8090
100110120130140150160
1996
/97
1997
/98
1998
/99
1999
/00
2000
/01
2001
/02
2002
/03
2003
/04
2004
/05
2005
/06
2006
/07
2007
/08
2008
/09
2009
/10
2010
/11
2011
/12
2012
/13
2013
/14
2014
/15
2015
/16
2016
/17
2017
/18
2018
/19
2019
/20
1996
/97
1997
/98
1998
/99
1999
/00
2000
/01
2001
/02
2002
/03
2003
/04
2004
/05
2005
/06
2006
/07
2007
/08
2008
/09
2009
/10
2010
/11
2011
/12
2012
/13
2013
/14
2014
/15
2015
/16
2016
/17
2017
/18
2018
/19
2019
/20

IPPR | ‘No longer managing’ The rise of working poverty and fixing Britain's broken social settlement 25
The two-child limit policy denies the child element of universal credit benefits (and the equivalent under child tax credits) to the third and any subsequent children in a family (born after April 2016). Our modelling shows that this is not responsible for much of the rise in working poverty that has occurred so far, as relatively few people in receipt of the benefits at this time have a third child (or subsequent children) born after the cut-off point. However, over time this will likely drive a substantial increase in the problem of in-work poverty. Our modelling predicts that this will increase the in-work poverty rate among large families by seven percentage points in 2030/31.
Finally a neglected aspect of the growth of the private sector for those on low incomes is the impact for those who are disabled or who have a family member who is disabled. For individuals with long-term sickness or disability, living in the private rented sector can lead to problems including a lack of accessibility as PRS properties are not always adaptable. There can be additional costs associated with this and with requiring a bigger property, for example to allow for wheelchair use or storing equipment. The mental health impacts of living in poor quality accommodation are also significant and can exacerbate existing mental health conditions such as depression and anxiety.
POVERTY IN THE PANDEMICThis section is informed by the Covid Realities project, a research programme looking at the experiences of families on a low income during the pandemic. Since the beginning of the project, researchers have seen how the pandemic has led to increasing pressures for almost all of the parents and carers involved in the research. The research has documented how low-income families have routinely experienced increased costs during the pandemic due to having children at home as a result of school closures, and due to higher utility and food bills (Brewer and Patrick 2021). It has also explored issues with the social security response to the pandemic, and with the complete absence of targeted support for families with dependent children (Power et al 2020).
Here, developing the analysis on working poverty above, the research focusses specifically on parents and carers who are part of a household where at least one member of the family is in paid employment. It presents the experiences of parents and carers in working households, exploring how the pandemic has impacted monthly budgets, and detailing the extent of the hardship that households experiencing in-work poverty routinely face. The analysis sets out the nature and extent of additional financial pressures facing families, as well as how these pressures are experienced (for example, as typified by having to make decisions over whether to ‘heat or eat’).
The everyday realities of poverty for working familiesThrough its work with parents and carers, Covid Realities has developed a rich evidence base that documents and details the everyday realities of hardship and struggle for many families. This includes working families, who, as we have seen, form a growing and large proportion of households experiencing poverty. The everyday realities of poverty and its negative impacts (for example, on mental health) should be emphasised. Below, Howie describes how her family’s budget is being managed:
"We have gone without a vehicle for some time, putting off MOT etc even though we live in a small place with no amenities or public transport. We are not eating much meat as I am using more money in the budget to get a veg box delivered in case we can’t get to the supermarket or get a delivery slot – the veg box costs more. I barely spent anything at Christmas and got a last-minute random cheap tree and turkey, which I never do usually. We have to decide when we can put the heating on for maximum benefit and when we can heat the water for baths."

26 IPPR | ‘No longer managing’ The rise of working poverty and fixing Britain's broken social settlement
The negative mental health impacts of the everyday management of poverty, together with the juggle of managing home-schooling and navigating day-to-day life, was an experience reported by many Covid Realities participants. As Erin explained:
"The pandemic has squashed our monthly budget quite tight and our bills have rocketed and continue to do so. Hit breaking point today mentally trying to cover everyone’s needs – the bills, home-schooling a six year old as well as two screaming toddlers to add to the mix. I generally feel so uptight and stressed and begging something to give somewhere just so I can recoup and start enjoying daily life."
This was felt particularly acutely in larger families such as Cara’s, for whom the increased cost of home-schooling felt unmanageable, due to significant increases in food and electricity costs:
"Having to home-school has increased the food budget unbelievably, never mind the cost of keeping four young children entertained indoors seven days a week. The electricity bills and gas bills are through the roof. It has definitely been a strain both emotionally and financially."
How has the pandemic impacted families’ monthly budgets?The pandemic had a significant negative financial impact on many of the working parents taking part in Covid Realities. A combination of the additional costs of working at home, as well as home-schooling, was an almost impossible juggling act. Danni reported:
"I’m definitely spending more money on energy. As we are mostly at home it’s constant use of energy and wi-fi to keep the children entertained. I’m also spending more on food as the children are not at school. My daughter usually gets free school meals as she is in P2 in Scotland. I’m also spending money on craft stuff and printer ink for home-school that I would never [have] bought before."
Several participants mentioned an expectation that lockdown would mean reduced outgoings, something which is commonly reported in coverage of the pandemic’s impact on household finances (Davenport et al 2020). On the contrary, for many families increased food, internet and activities costs meant that already stretched budgets were being pressurised even further. This could have negative impacts upon physical health, as Leonie reported:
"Heating is on regularly which is costing a fortune and of course being at home all day means you are eating (when possible) so we are getting through lots of toast! For someone with IBS this is causing health issues too, as much as I would love to have a superfood salad every day, money doesn’t go far enough."
Howie reported similar issues, with a resultant negative impact upon the mental health of herself and her family:
"I have lost so much work. I am self-employed (and a student) and am unable to run outdoor groups as I usually would. When we get to March I will have spent the best part of the last year with no work. I have had three months of work from Sept-Dec and now lockdown again. The original tremors are now becoming the tsunami. The accumulative effect of no work for this long is becoming impossible to patch up financially but also socially and for the future of my self-employed work, whenever Lockdown opens up. The not knowing what is happening financially is also starting to really impact the family mood too. I think although we are working hard to stay afloat my children are also anxious about the future."
IPPR | ‘No longer managing’ The rise of working poverty and fixing Britain's broken social settlement 27
Unexpected additional costsAlongside the additional costs of heating and increased food bills, participants spoke of the difficulties in reconciling budgets when an unexpected cost needed to be paid, such as a household appliance breaking down, placing further pressures on families. Gracie explained how the extra cost of PPE for herself while at work and daughter while at school was further disrupting her budgeting:
"PPE to do my job when I’m not working from home/for my daughter when she’s in school has also cost £40+. This covers the masks (I had to buy extra as my daughter’s school decided to make plain black ones essential when I had previously bought other colours, so this was an even bigger outlay), hand sanitiser which I could only get from my local shop as everywhere else was out of stock but they doubled the prices, and face masks. Employers should be providing these!"
Being at home more meant that issues relating to household repairs became more important, leading to other extra costs, as Esmee reported:
"I’ve also had additional house costs which may or may not be normal, but as we’re at home so much, I feel like lots of things are more noticeable, so I’ve had issues with mould and have had workmen round to make repairs outside to windows and pointing. I’ve also bought a dehumidifier which wasn’t cheap."
These examples illustrate the extent and nature of the hardship that working families have experienced throughout the pandemic. These experiences are themselves symptomatic of the failure of the social security system (and more broadly the labour market) to provide sufficient income to families to enable them to escape poverty. While there have been temporary increases to social security provision during the pandemic – such as the £20 uplift to universal credit – these have not been universally received (for example by those on legacy benefits), nor have they been sufficient to correct for the enduring issue of the inadequacy of social security support. These intersect with labour market issues to create significant hardship for families on a low income. These issues of course precede the pandemic, but have in many cases been extended and intensified by the conditions and added difficulties that the pandemic has created.
CONCLUSIONTaken together, the insights from families taking part in the Covid Realities project and our quantitative analysis show that the labour market and the social security system are increasingly failing to provide protection against poverty. Since the early 2000s, we find that there has been a significant rise in working poverty for single parents, single earner families, large families and even families with one full-time and one part-time earner, with a smaller increase for those families with two full-time earners. We find that it is spiralling housing costs relative to growth in incomes which is the key factor driving these increases, particularly among single parents and large families. Housing support through the universal credit housing element is covering a far lower proportion of these rising housing costs than in the past, and due to the reduction in welfare generosity overall since 2010, higher earnings are required to move out of poverty than in the past. Finally, as two earners at higher levels of pay and working more hours are increasingly needed for low-income families to avoid living in poverty, childcare and flexible working policies are failing to keep pace.
These trends are in part a consequence of a gradual shift in the composition of society, as Hick and Lanau (2017) have observed and as we saw earlier in this chapter, from a largely low poverty risk group (owners with mortgages) to a higher risk group (private renters). As there are no signs that the numbers of people living

28 IPPR | ‘No longer managing’ The rise of working poverty and fixing Britain's broken social settlement
in the private rented sector are to stop growing in the short-term at least, in-work poverty is likely to continue to grow alongside this unless action is taken. Even to stand still on working poverty rates, government will either need to bear down on the rising costs faced by those on low incomes, or increase income support through the social security system to help meet outgoings.

IPPR | ‘No longer managing’ The rise of working poverty and fixing Britain's broken social settlement 29
3. THE UNCHECKED RISE IN WORKING POVERTY OVER TWO DECADES AND ITS CONSEQUENCES
We saw in chapter 2 how working poverty in this country has been rising year on year for several decades and that families with children are worst affected. Rates of working poverty hit a new high of 17 per cent – approaching one in five – before the pandemic took hold in 2020 - up from 13 per cent 20 years earlier. For households with one person in full-time and one in part-time work, the chances of being pulled into poverty have doubled over the past two decades, from just over one in 20 (6 per cent) to more than one in 10 (12 per cent). Even for households with two people in full-time work, the chance of being pulled into poverty has almost tripled ,rising from 1.4 per cent to almost 4 per cent.
This is a dramatic backwards slide in prospects for an ever-growing number of citizens in the UK, and there is no end in sight. Housing costs in the private rented sector have risen rapidly, with average rental prices today almost twice those of 20 years ago. While there may be some market corrections as a result of the pandemic, the overall trajectory is unlikely to change. Meanwhile, wages are failing to keep up, as earnings have been flatlining since at least 2008 and look set to stay that way. According to the Institute for Fiscal Studies, average earnings will be no higher in 2026 than in 2008 (IFS 2021). What is more, the unrestrained growth of the private rented sector is leading to widening wealth inequality, as a growing ‘rentier’ class gets richer off the back of rising working poverty in the UK.
Our analysis shows that the welfare state is failing to prevent more families from being pulled into poverty. We find that housing support, which now comes in the form of the housing element of universal credit, is no longer helping to close the growing gap between housing costs and earnings for renters. Notwithstanding this, our analysis suggests that last year private landlords received £11.1 billion in state spending on housing support.2 Changes to our social security system mean that it is also contributing to the rise in working poverty: while the two-child limit is currently only affecting a small number of families, we find that the in-work poverty rate in 2029/30 is predicted to be five percentage points higher, at 40 per cent, than would otherwise be the case without the policy. More broadly, the poverty-creating aspects of universal credit have been extensively documented (see McNeil et al 2019).
These factors suggest that the UK will face a challenge to even stand still on working poverty rates unless there is a radical rethink of both politics and policy. Unless action is taken, we argue that there will be important social, economic and political consequences.
2 The £11.1 billion is an approximation, arrived at by taking a 2014/15 estimate of spending which went to private landlords from the National Housing Federation and uplifting by the expected increase in housing spend by DWP between 2014/15 and 2020/21 based on the latest forecasts

30 IPPR | ‘No longer managing’ The rise of working poverty and fixing Britain's broken social settlement
The first consequence is a broken social and political settlement. The growth of working poverty strikes at the heart of the social settlement that has driven politics and policy in the UK since Thatcher: the idea of a ‘property-owning democracy’, a status that can be attained through individual effort, competition and the meritocracy.
As we saw in chapter 2, not only have rates of home ownership fallen significantly across the population, but growing numbers of young people will never be able to own their own home, with up to a third of millennials facing renting ‘from cradle to grave’ (Judge and Tomlinson 2018), a situation likely to get worse still for future generations. Many would consider this fundamentally unjust. Indeed, the pandemic has underlined the growing gap between those with housing wealth and those without: households net worth grew by £0.9 trillion during the pandemic in 2020, due to rising property prices, defined contribution pensions and deposits (ONS 2021b). At the same time the government’s own data shows that private renters were financially worst affected by the pandemic, with over a third of private renters (35 per cent) reporting that their monthly household income had decreased by at least £100 per month.3 With neither an active policy agenda to push down housing costs in the private rented sector nor adequate compensatory support through the social security system, certain groups of families and individuals are effectively being set up to fail. And this shift disproportionately affects people according to their ethnicity, gender, social class, age and disability (Baxter and Murphy 2019).
Recent research found that hard work is seen by a large majority of people (76 per cent) as being the most important or a very important factor in determining success in life (Duffy et al 2021). Of course, this implies that working poverty should not exist, but it does also mean that in arguing for a better deal for those in working poverty, politicians can build on entrenched beliefs in ‘fairness’ among the public. When it comes to perceptions of ‘fairness’, the public does believe that families who work hard and ‘play by the rules’ should be able to achieve a decent standard of living (Innes 2020). And now that the interests of those in and out of work have been brought together through universal credit (which merges tax credits with unemployment benefits such as Jobseeker’s Allowance), this need not and should not result in a growing gap between in-work and out-of-work benefits – which in the past have been used to drive a wedge between the deserving and undeserving poor.
The second consequence is a threat to political stability. If the ‘broken’ nature of our social settlement is not given greater political expression, it will continue to have a corrosive effect, not simply on the lives of those unable to escape from poverty, but on all of us due to its destabilising economic and political effect. As political philosopher Michael J Sandel has argued, the promise of meritocracy is a ‘hollow political project’ at the heart of Anglo-American societies that pits people against one another and leads to a ‘politics of resentment’ (Sandel 2020).
In the UK too, educational success as a route to home ownership has become a ‘hollow political project’ for increasing numbers. Adler and Ansell (2020) have shown that there is a link between levels of local housing wealth and populism. For example, they find that the level of house prices in a local authority was negatively associated with support for leaving the European Union in the Brexit referendum of 2016: where house prices were low (£100,000) owners had a 59 per cent probability of voting for Brexit and non-owners around 54 per cent, whereas where prices are high (£750,000) homeowners have dropped to just 37 per cent probability whereas non-owners dropped only to 44 per cent. More broadly we
3 See: https://assets.publishing.service.gov.uk/government/uploads/system/uploads/attachment_data/file/955337/Household_Resilience_Study_Wave_1_June-July_2020_Report.pdf

IPPR | ‘No longer managing’ The rise of working poverty and fixing Britain's broken social settlement 31
are seeing declining levels of trust in politics, more polarisation and a gravitation towards populist authoritarian leaders who exploit this fact and channel grievances into right-wing extremism.
The political centre ground has failed to give legitimate expression to the grievances of those left behind in a property-owning democracy, or to formulate a political and policy agenda that can both articulate their frustrations and offer solutions. Ed Miliband’s ‘squeezed middle’ agenda came close to this with its ‘living standards’ agenda aimed at reducing costs for low and middle income families. But in its technocratic focus on ‘pre-distribution’ as a means of cutting the welfare bill, it did not sufficiently resonate with the public.
For the Conservatives, Theresa May’s concept of the ‘just about managing’ families was a successor to the squeezed middle agenda. But even if May’s premiership had not been cut short by Brexit, with its narrow focus on social mobility and its failure to recognise the structural causes of inequality, it was unlikely to have shifted the dial.
The strategic intent of the Johnson government in relation to poverty and inequality is first and foremost to reduce regional inequalities through its ‘levelling up’ agenda. However, with its limited focus on physical infrastructure to deliver on ‘levelling up’, rather than investing in communities, public services and the wider welfare state, it offers no coherent strategy for improving prospects for those on low incomes.
Indeed, in failing to extend the additional spending on universal credit that came in the wake of the coronavirus crisis (the £20 weekly ‘uplift’ to universal credit) at the 2021 budget and in outlining further reductions in public spending on top of those set out at the Autumn 2020 Spending Review, the government has signalled that following the pandemic, social security and public spending could again be dominated by an austerity agenda in all but name. This stands in direct contrast to countries such as the US, Germany and Canada (Jung et al 2021), which have chosen to boost social security spending on families and children in order to shore up the economic recovery and address the rise in inequalities associated with the pandemic.

32 IPPR | ‘No longer managing’ The rise of working poverty and fixing Britain's broken social settlement
4. NEXT STEPS: TOWARDS A NEW ROLE FOR THE WELFARE STATE IN COMBATTING WORKING POVERTY
We have seen how the increase in working poverty over the past two decades is in part a manifestation of the failure of centre-ground politics to respond to a realignment that is taking place in society: the gradual shift in housing tenures from a largely low poverty risk group (owners with mortgages) to a higher poverty risk group (private renters) and the decline in social housing that has contributed to this. Unless political parties respond to this realignment with policies that will stem the rising tide of unaffordable private rented sector tenancies, we are locking in either permanently higher levels of poverty (as we are currently seeing) or higher levels of compensation through the social security system.
House price growth and the privatisation of housing has become so central to our political economy, that shifting the status quo requires deep reform and tackling vested interests. The UK’s economy is increasingly reliant on low mortgage rates leading to higher housing demand and house prices, which in turn stimulates bank lending and household consumption. As we have seen, this has led to an explosion in multiple property ownership, with more than 700,000 landlords having been created between 2012-2016 and buy-to-let the fastest growing part of Britain’s multiple property wealth (Bangham 2019).
It is also the case that the welfare state has been almost entirely re-shaped in line with this economic model, having been transformed over time from the collectivised welfare state of the mid-20th century, to the increasingly residualised and liberal welfare state of today. Hassel and Palier (2020) have shown how a financialisation-driven growth strategy depends on the residualisation of public welfare and the rise of private social protection - the privatisation of housing and pensions for example, such that the only people with any real security in society today are those with personal assets such as property and savings. This is part of a wider ‘great risk shift’ we have described in our first paper from this programme (Quilter-Pinner et al 2019), which has taken place over decades with public funding and provision falling, with private funding (out of pocket payments) growing in response (Obolenskaya and Burchardt 2016).
Any arguments for reform of the welfare state therefore need to be grounded in a critique of the wider economic model of which it forms part. Changing this and building a new social settlement when the old one has so clearly broken down under such conditions is an enormous political undertaking, but it is a central task for progressives looking ahead to the next parliament. It will require some tough political choices to be confronted.
Since the ‘right to buy’ policy of the 1980s and accompanying financial sector deregulation, homes have increasingly become financial assets rather than simply a place to live. For many, the family home is now the primary source of wealth, and the consequence is a highly entrenched property-owning class with strong interests in a buoyant housing market.

IPPR | ‘No longer managing’ The rise of working poverty and fixing Britain's broken social settlement 33
This presents progressive political parties in particular with an important political challenge to resolve: whether (and how) they can maintain policies aimed at widening access to the benefits of home ownership, with policies which seek to increase public housing and may challenge the vested interests of home owners. Given the unsustainable rise in working poverty and its social and economic costs, it is a challenge they need to face head on.
As the box below shows, private renters are a group of increasing political salience, bringing together a diverse coalition of voters with common interests across political dividing lines of age and geography. However, they are still a minority despite their growing numbers, with 19 per cent living in the private rented sector, while 65 per cent of the population are still owner-occupiers and 17 per cent live in the social rented sector.
PRIVATE RENTERS: A GROWING POLITICAL CONSTITUENCY ACROSS AGE AND INCOME DIVIDES One obvious implication of a growing constituency of people living in the private rented sector is that they are becoming a group of increasing political significance. The proportion of voters in private rented accommodation has increased by four percentage points since 2010 and is expected to increase to 20 per cent by 2040 (Tanner 2019). They also straddle modern political dividing lines of age and rural/urban location. For example, it is interesting to note that someone who is renting in their sixties is no more likely to vote Conservative than someone who rents in their thirties. It is also the most ethnically diverse group of all housing tenures (ONS 2018).
Historically, private renters have voted more for the Labour party than for the Conservatives. Thirty-one per cent of private renters supported the Conservatives in 2019, a similar proportion to the previous two elections but less than any other housing tenure, including social renters. The Labour party continued to lead this group by 13 percentage points. However, more private renters voted for Labour in 2017 (54 per cent) than in 2019 (44 per cent) (Tanner 2019). At the next election therefore, both parties will be keen to appeal to private renters, but Labour needs to do so if it is to have a chance of making up lost ground.
As well as addressing the political challenge, reforming the social settlement to tackle working poverty and increase living standards for those on low incomes will require action across economic, welfare and housing policies. This must be conceived of as an integrated agenda, reflecting the reality that this is how these areas of policy currently operate.
New economic thinking from the Foundational Economy Collective offers some approaches for developing this new integrated approach (FEC 2020). The Foundational Economy (FE) critiques conventional ways of theorising and measuring the economy such as higher per capita output of GDP or GVA growth, and argues that a focus on these measures over decades has not translated into improvements in living standards for many households. It argues that the current narrow focus of economic policy overlooks the basic requirements of a good life for all citizens - including essential goods such as water, electricity, retail banking, and ‘providential services’ - such as education, health and care. In contrast to the UK’s financialisation-based economy, where growth is finance-led rather than wage-led, it provides a moral vision for an economy and society focused on establishing the conditions for human wellbeing and flourishing (ibid).

34 IPPR | ‘No longer managing’ The rise of working poverty and fixing Britain's broken social settlement
A central insight of the FE is that before ‘national income accounting’ became mainstream in the late 1940s, what are now typically considered as ‘welfare objectives’ (for example tackling child poverty or reducing housing costs) were instead considered as ‘national objectives’ aimed at supporting the ‘household economy’ (ibid). The FE argues that objectives such as increasing ‘household residual income’ - income left for discretionary spend after housing, utilities and transport - and access to essential services like education, health and care need once more to be placed at the heart of economic and welfare policy (ibid).
We argue that welfare, housing and economic policy should be brought together around a number of tangible and easily understood targets for bearing down on some of the highest costs working families face - housing and childcare. These new objectives should also focus on ‘making work pay’ through a combination of labour market policy and income support. A higher minimum wage and personal tax allowance increases are not the best ways to improve living standards for those facing working poverty. As we have shown, future increases to the minimum wage risk being swallowed by further rises in housing costs, and this policy is no substitute for a strong social safety net and secure housing.
We set out some illustrative options for these new targets here. Developing this agenda further will be a focus of our final report from this programme.
1. CONTAINING HOUSING COSTS AS A SHARE OF INCOME PER HOUSEHOLDAfter wages, housing costs are the key factor in determining household residual income. A focus on how residual income varies by region and housing tenure gives us a much more granular understanding of what a ‘liveable’ income is. As the Froud et al (2020) have argued, containing housing costs as a share of income per household could be a more relevant and achievable regional policy objective than higher per capita GVA.
This could be a general objective for regional policy or specific targets could be set by local policymakers, but widespread reform led by central government would be needed to create the conditions for containing housing costs as a share of income per household.
Firstly, on monetary policy, as IPPR’s Commission on Economic Justice has argued, house price inflation needs to be slowed so that it no longer exceeds the growth of earnings. We have proposed that the Bank of England has an explicit house price inflation target, set by government, in order to set property price expectations. This would help to start to curb rising house price inflation which increases wealth inequalities and traps households in private renting. On economic policy the commission set out proposals for taxing property wealth and unearned incomes in upper income groups.4
Secondly, we also need to increase the rate at which new homes are built. IPPR has called for £15 billion in capital grants annually from government to support the delivery of zero carbon submarket housing to support the delivery of social rent, living rent and affordable home ownership options. This is as compared with the £11.5 billion being spent on housebuilding over five years from 2021 (Webb and Murphy 2020). While increasing the supply of social housing is a public good in itself, this is also necessary to bring down government spending on housing benefit, which is benefiting a growing class of private landlords and exacerbating housing wealth inequality.
4 See proposals of IPPR’s Commission on Economic Justice: https://www.ippr.org/cej. The house price inflation target could be adjusted for price changes above the level justified by fundamentals, to ensure it is a target within the bank’s control.

IPPR | ‘No longer managing’ The rise of working poverty and fixing Britain's broken social settlement 35
These reforms will not bear fruit in the short-medium term, so as well as reducing costs, the focus should be on improving security of tenure, as well as the quality of housing. For example, IPPR has argued for an overhaul of the private rented sector in England so that it provides greater stability, security and is more affordable for tenants (Baxter and Murphy 2019). Recommended measures include ending section 21 (no-fault eviction) and introducing a mandatory open-ended tenancy, capping rent increases and supporting tenant unions, as well as encouraging local authorities to acquire ex-private rented and inherited properties, to re-deploy these homes to support local housing need.
Beyond this, more structural changes are needed which would increase alternative models of housing to rival the private rented sector. These would include reforms that seek to democratise housing and land, either through taxation to minimise rent extraction from land ownership, or introducing more collective forms of housing provision, including through public ownership and community ownership, such as community land trusts and housing models with capped resale prices, such as have been introduced in Hackney (Berry et al 2020).
Finally, recognising the shortfalls faced by those on low incomes with unaffordable private rents, Local Housing Allowance (LHA) should be raised to the 50th percentile to help meet these income gaps. It should then be kept there, helping to ensure that LHA covers median renters’ housing costs both now and in the future. Even while the proportion of market rent should stay at 50 per cent, over time the action taken to increase the supply of housing should see housing benefit bills fall.
This would be centrally led but regionally driven agenda, reflecting the fact that housing policy is devolved. As Froud et al (2020) have highlighted, there are significant and complex differences in household residual income both between and within regions such that clearly what may work in one area to boost household residual income will not work in another.
2. CONTAINING CHILDCARE COSTS AS A PROPORTION OF INCOME PER HOUSEHOLD, ON A PATH TOWARDS UNIVERSAL CHILDCAREAs we have shown, high housing costs and reductions in the generosity of the welfare system have increased the level of earnings required to escape poverty. Frequently for low income families, two parents need to be in full-time work paid at the minimum wage to avoid poverty, and for single parents on a low income, being in full-time work is often a necessity, given higher housing and childcare costs. However, the childcare needed for parents to work these hours is among the most expensive childcare in the world.
While childcare is currently subsidised for all three and four year olds in the UK, evidence from the OECD shows that for a family with two children in England with both parents in full-time employment (where one earns and average way and the second parent earns 67 per cent of average earnings) the net cost of childcare is 55 per cent of that family’s average earnings, the most expensive of any other advanced country. Childcare for families on universal credit is almost fully subsidised (85 per cent of costs) and this is a more generous policy relative to many other countries, yet the complexity and bureaucracy involved in claiming this support means that levels of take-up are very low.
It should be a target for policy to bring childcare costs down to acceptable levels as a proportion of household income. IPPR has argued for a universal entitlement to free, year-round care for all children aged between one and four, combined with wraparound childcare for school-age children. An income target for childcare could be a starting point for more universal provision, with the target lowered over time. However, in the short-medium term action would be needed to bring down costs and reduce complexity associated with the system.

36 IPPR | ‘No longer managing’ The rise of working poverty and fixing Britain's broken social settlement
• For working families who are eligible for universal credit, further reducing costs (eg by raising the existing ‘cap’ on childcare fee claims or by increasing childcare costs covered to 100 per cent) would help make childcare costs more manageable for those on low incomes. However, the biggest challenge for this group is with take-up of the existing offer. By default, parents pay for childcare costs upfront and then claim back the eligible costs afterwards. To address this, support should be provided upfront rather than in arrears and the complexity of claiming this support simplified (for example monitoring of payments placed on the same basis as invoicing from childcare providers).
• For families accessing subsidies for childcare support (the universal 15 hours and the extended entitlement of 30 hours, as well as tax-free childcare and child vouchers) reducing costs as a share of income will require additional public investment. It has been estimated that the funding shortfall per hour of childcare delivered through the free entitlement is between 37 and 20 per cent (Ceeda 2019). The sector is therefore heavily reliant on income from parent fees to recoup these costs, and these fees are typically charged at a higher rate, inflating fees for many. The annual funding shortfall in England across all care delivered by PVI nurseries and pre-schools was estimated to be at least £616 million pre-pandemic.5 This is therefore the minimum amount needed to avoid a further increase in fees for parents and to shore up providers faced with rising costs and falling income following the pandemic. The sector only received a small fraction of this however (£44 million funding for 2021-22) at the 2020 Spending Review.
• Claiming support is also complex and time consuming. We have argued that childcare funding should be channelled into a single supply-side funded grant for childcare providers to replace the current complex array of income top-ups, grants and in-kind support (Cory and McNeil 2017). Direct payments to providers and banded eligibility for support with childcare costs would significantly reduce complexity in accessing support for parents and if devolved to a regional level local would also allow for more direct role in shaping local childcare markets for local authorities including greater regulation of fees.
More research would be needed to identify an achievable target for childcare costs as a proportion of incomes (for families not accessing universal credit) and how this might apply. The Biden administration for example has pledged free preschool for all three- and four-year-olds and for children under the age of three, families earning less than 1.5 times the median income would pay no more than 7 per cent of their income for child care, with ‘the most-hard pressed working families’ paying nothing.
This must also be considered alongside labour market policy - more affordable childcare is only of limited help without greater availability of quality flexible and part-time work (Timewise 2020). Measures needed here range from improved parental leave, a day one right to flexible working and encourage the design and advertising of jobs as flexible, job share or part-time (Working Families 2020).
3. MAKING WORK PAY Working poverty is as much a consequence of under-employment as it is low pay, and is often due to second earners in a family being unable to work enough hours or to move out of insecure work (such as a zero-hours or temporary contracts) (Hick and Landau 2017). As such, reducing working poverty will require a range of labour market reforms to tackle insecure work and improve job quality, from greater
5 See: https://www.eyalliance.org.uk/families-set-foot-bill-new-figures-reveal-half-billion-shortfall-childcare-funding#:~:text=As%20a%20result%2C%20Ceeda%20calculates,63%20million%20for%20 the%2030

IPPR | ‘No longer managing’ The rise of working poverty and fixing Britain's broken social settlement 37
collective bargaining and unionisation, to higher labour standards and reforming the use of zero-hours contracts. IPPR’s Commission on Economic Justice proposed a number of measures that would help make these aspirations a reality (CEJ 2018) and could be included in the government’s forthcoming employment bill.• The establishment of a ‘good jobs standard’ for England, with accreditation
under the standard used as a requirement of public procurement.• A 20 per cent higher minimum wage to apply to zero hours contracts and other
uncontracted hours.• A target of doubling collective bargaining coverage to 50 per cent of workers
by 2030, with a focus on the lowest paid sectors.• That all jobs should be required to be available and advertised on a flexible
and potential job-share basis, except with good reason.
In addition to this, given that evidence suggests nearly three in four do not manage to escape low pay over the course of a decade, increasing opportunities for progression out of low paid work through access to training and skills is vitally important. The in-work progression review being carried out by DWP should set ambitious priorities to help individuals to progress out of low paId-work, including by trialing practical support to help people progress, such as new forms of employer engagement, skills matching and job brokerage.
Alongside steps to improve job quality and increase the availability of flexible and part-time work, income support through our social security system is needed to ensure people are better off in work. Our social security system is also intended to provide a decent foundation for family life in accepting that not all parents should work full-time. This has been eroded in the transition to universal credit and actively undermined through policies such as the two-child limit and the benefit cap.
A neglected aspect of the transition from the tax credits regime to universal credit is that many of the income top ups available for particular groups have been lost. This includes the disability premia in tax credits (previously worth up to £3,240 per year) for a disabled person in work on tax credits, where there would be no additional payment for the equivalent award of universal credit. Lone parents on working tax credits would previously have received a ‘lone parent element’ worth up to £2,060 a year, with no additional elements paid for the equivalent working lone parents on universal credit.
In the short to medium term, and in order to ensure ‘work pays’ for those groups worst affected by working poverty, we therefore recommend the following.• The planned cut to universal credit by withdrawing the £20 uplift introduced
at the start of the pandemic should be cancelled, with the uplift extended to legacy benefits.
• Restoring the lone parent premia for working single parents from the tax credit system as well as introducing a higher work allowance for this group under universal credit. Doubling work allowances for single parents under universal credit would cost £1.8 billion in 2025/26.
• Reintroducing a top-up payment for those with a limited capability for work on universal credit as was previously phased out in 2016/17. We estimate this would cost £1.4 billion in 2025/26.
• Introducing a second earner work allowance, increasing incomes for low-income households where both people are in work. As an illustration, we estimate that increasing the worker allowance for couples with children by £150/month would cost £2 billion in 2025/26.
• Removing the two-child limit which will increase already high rates of working poverty among large families with this impact increasing over time. We estimate this would cost £2.5 billion in 2025/26.

38 IPPR | ‘No longer managing’ The rise of working poverty and fixing Britain's broken social settlement
REFERENCES
Adler D and Ansell B (2020) ‘Housing and populism’, West European Politics, 43:2. https://www.tandfonline.com/doi/full/10.1080/01402382.2019.1615322
Bangham G (2019) Game of Homes: The rise of multiple property ownership in Great Britain, Resolution Foundation. https://www.resolutionfoundation.org/app/uploads/2019/06/Game-of-Homes.pdf
Baxter D and Murphy L (2019) Sign on the Dotted Line: A new rental contract, IPPR. https://www.ippr.org/files/2019-01/sign-on-the-dotted-line-jan19.pdf
Berry C, Macfarlane L and Nanda S (2020) Who Wins and Who Pays? Rentier power and the Covid crisis, IPPR. https://www.ippr.org/research/publications/who-wins-and-who-pays
Brewer M, Cattan S, Crawford C and Rabe B (2018) Does More Free Childcare Help Parents Work More?, Institute for Fiscal Studies. https://www.ifs.org.uk/uploads/WP201622.pdf
Brewer M and Patrick R (2021) Pandemic Pressures: Why families on a low income are spending more during Covid-19, Resolution Foundation. https://www.resolutionfoundation.org/app/uploads/2021/01/Pandemic-pressures.pdf
Ceeda (2020) ‘Early years sector faces £662 million funding deficit in 2019/20’, news story. https://www.ceeda.co.uk/news/2019/early-years-sector-faces-662-million-fundingdeficit-in-20192020/
Commission on Economic Justice [CEJ] (2018) Prosperity and Justice: A plan for the new economy – IPPR Commission on Economic Justice final report. https://www.ippr.org/research/publications/prosperity-and-justice
Coram Family and Childcare Trust (2020) Annual childcare survey. https://www.familyandchildcaretrust.org/childcare-survey-2020
Davenport A, Joyce R, Rasul I and Waters T (2020) Spending and Saving during the COVID-19 Crisis: Evidence from bank account data, Institute for Fiscal Studies. https://www.ifs.org.uk/publications/15146
Davies W (2007) ‘Tax Credits: The success and failure’, Prospect. https://www.prospectmagazine.co.uk/magazine/taxcreditsthesuccessandfailure
Department for Work and Pensions [DWP] (2013) Lone Parent Obligations: An impact assessment. https://assets.publishing.service.gov.uk/government/uploads/system/uploads/attachment_data/file/211688/rrep845.pdf
Department for Work and Pensions [DWP] (2020a) ‘Households below average income (HBAI)’, dataset, accessed via DWP Stat Xplore and the UK Data Service. beta.ukdataservice.ac.uk/datacatalogue/series/series?id=2000022
Department for Work and Pensions [DWP] (2020b) ‘Family Resources Survey (FRS)’, dataset, accessed via the UK Data Service. beta.ukdataservice.ac.uk/datacatalogue/series/series?id=200017
Department for Work and Pensions [DWP] (2021) ‘Universal Credit Statistics: Universal Credit supplementary data tables, up to 14 January 2021’, dataset. https://www.gov.uk/government/statistics/universal-credit-statistics-29-april-2013-to-14-january-2021
Dromey J, McNeil C and Roberts C (2017) Another lost decade: Building a skills system for the economy of the 2030s, IPPR. https://www.ippr.org/publications/skills-2030-another-lost-decade
Duffy B, Hewlett K, Hesketh R, Benson R and Wager A (2021) Unequal Britain: Attitudes to inequality in light of Covid. https://www.kcl.ac.uk/news/unequal-britain-attitudes- to-inequality-in-light-of-covid
Foundational Economy Collective [FEC] (2020) The Foundational Approach. https://foundationaleconomycom.files.wordpress.com/2020/08/fe-approach-2020.pdf

IPPR | ‘No longer managing’ The rise of working poverty and fixing Britain's broken social settlement 39
Froud J, Haslam C, Johal S and Williams K (2020) Cohesion through housing? Residual income, housing tenure and UK regional policy, Foundational Economy Collective. https://foundationaleconomycom.files.wordpress.com/2020/02/ fec-wp6-residual-income.pdf
Hassel A and Palier B [Eds] (2021) Growth & Welfare in Advanced Capitalist Economies: How have growth strategies evolved?, Oxford University Press
Hick R and Lanau A (2017) In-work Poverty in the UK: Problem, policy analysis and platform for action. https://www.cardiff.ac.uk/__data/assets/pdf_file/0009/758169/Hick-and-Lanau-In-work-poverty-in-the-UK.pdf
Hirsch D and Valadez L (2015) How Much does the Official Measure of Child Poverty Under-estimate its Extent by Failing to take Account of Childcare Costs?, Child Poverty Action Group. https://cpag.org.uk/sites/default/files/uploads/How%20much%20does%20the%20official%20measure%20of%20child%20poverty%20under%20estimate%20its%20extent%20by%20failing%20to%20take%20account%20of%20childcare%20costs_0.pdf
Innes D (2020) What has Driven the Rise of In-work Poverty?, Joseph Rowntree Foundation. https://www.jrf.org.uk/report/what-has-driven-rise-work-poverty
Institute for Fiscal Studies [IFS] (2021) Spring Budget 2021: IFS analysis. https://ifs.org.uk/budget-2021
Judge L and Tomlinson D (2018) Home Improvements, Resolution Foundation. https://www.resolutionfoundation.org/app/uploads/2018/04/Home-improvements.pdf
Judge L and Slaughter H (2020) Working Hard(ship): An exploration of poverty, work and tenure, Resolution Foundation. https://www.resolutionfoundation.org/app/uploads/2020/02/Working-hardship-report.pdf
Jung C, Dibb G and Patel P (2021) Boost it like Biden: Why the UK needs an economic stimulus four times the size currently planned, IPPR. https://www.ippr.org/research/publications/boost-it-like-biden
Kleynhans S and Pennington J (2020) LHA Impact Assessment: The effects of the reforms since 2011, Shelter. https://assets.ctfassets.net/6sxvmndnpn0s/3Juolb6VnYydSMiieRRLFt/59b0ee4558d22309e7a5d10175633b61/Final_version_of_the_impact_briefing.pdf
McNeil C and Cory G (2017) The future of childcare in London, IPPR. https://www.ippr.org/publications/the-future-of-childcare-in-london
McNeil C, Hochlaf D and Quilter-Pinner H (2019) Social (In)security: Reforming the UK’s social safety net, IPPR. https://www.ippr.org/research/publications/social-insecurity
Obolenskaya P and Burchardt T (2016) Public and Private Welfare Activity in England, LSE. http://sticerd.lse.ac.uk/dps/case/cp/casepaper193.pdf
Office for Budget Responsibility [OBR] (2021) Economic and Fiscal Outlook, March 2021. https://obr.uk/efo/economic-and-fiscal-outlook-march-2021/
Office for National Statistics [ONS] (2018) ‘UK Private Rented Sector’, webpage. https://www.ons.gov.uk/economy/inflationandpriceindices/articles/ukprivaterentedsector/2018
Office for National Statistics [ONS] (2021a) ‘Unemployment Rate (Aged 16 and Over, Seasonally Adjusted)’, dataset. https://www.ons.gov.uk/employmentandlabour market/peoplenotinwork/unemployment/timeseries/mgsx/lms
Office for National Statistics [ONS] (2021b)’The national balance sheet and capital stocks, preliminary estimates 2021’, dataset. https://www.ons.gov.uk/economy/nationalaccounts/uksectoraccounts/bulletins/thenationalbalancesheetandcapitalstockspreliminaryestimatesuk/2021
Power M, Page G, Garthwaite K and Patrick R (2020) Experiences of Social Security for Families on a Low Income during the Pandemic. https://media.covidrealities.org/benefitexperiences.pdf
Quilter-Pinner H, McNeil C and Hochlaf D (2019) The decades of disruption: new social risks and the future of the welfare state, IPPR. https://www.ippr.org/research/publications/decades-of-disruption
Rugg J and Rhodes D (2018) The Evolving Private Rented Sector: Its contribution and potential. http://www.nationwidefoundation.org.uk/wp-content/uploads/2018/ 09/Private-Rented-Sector-report.pdf

40 IPPR | ‘No longer managing’ The rise of working poverty and fixing Britain's broken social settlement
Sandel MJ (2020) The Tyranny of Merit: What’s become of the common good? Allen Lane, New York
Statham R, Parkes H and Gunson R (2021) Securing a Living Income in Scotland: Towards a minimum income guarantee, IPPR Scotland. http://www.ippr.org/research/publications/securing-a-living-income-in-scotland
Tanner W (2019) No Turning Back: The 2019 general election and the UK’s new electoral geography. https://www.ukonward.com/wp-content/uploads/2020/12/ noturningback.pdf
Timewise (2020) The Timewise Flexible Jobs Index 2020. https://timewise.co.uk/ wp-content/uploads/2020/12/Timewise-Flexible-Job-Index-2020.pdf
Webb J and Murphy L (2020) Renting Beyond their Means: The role of living rent in addressing housing affordability, IPPR. https://www.ippr.org/research/publications/living-rent
Working Families (2020) Flexistability - building back better for the UK’s working families. https://workingfamilies.org.uk/publications/flexistability/

IPPR | ‘No longer managing’ The rise of working poverty and fixing Britain's broken social settlement 41
ANNEX
Below we briefly look back at the key aims of welfare policy and the tools used to alleviate poverty at key points in the past two and a half decades, how they have changed over time and how they have reflected the wider economic context, ideology and values of their time.
POLICY LEVERS USED TO COMBAT POVERTY SINCE THE LATE-1990SLate-1990s/2000s – active labour market policies, minimum wage, tax creditsThe New Labour governments came to power with a specific agenda of poverty relief targeted at groups where this was highest: among children and pensioners. Labour succeeded in steadily reducing these rates over the period they were in power. Out-of-work poverty was very high as a result of legacy unemployment from the 1980s, so ‘active labour market programmes’ were introduced in the UK, as elsewhere in Europe. These ‘welfare to work’ programmes were targeted on supporting specific groups back into work, in particular single parents, older people and young people, in return for receiving unemployment benefit.
The minimum wage was introduced in 1998 in response to high rates of wage inequality and low pay, which had been rising since the 1980s. After its introduction, the minimum wage saw several increases that were above the rate of average earnings growth. Additionally, for those on low incomes, Gordon Brown in his first term as chancellor introduced the working families tax credit (along with disabled person’s tax credit and children’s tax credit). The policy had the twin aims of helping families in low-paid work to make ends meet and lifting families out of ‘welfare dependency’ by removing disincentives to work. Though fraught with complexity and design flaws (Davies 2007), tax credits directed billions into the pockets of low-paid workers, helping to make work pay and reduce inequality.
2010s – universal credit, higher minimum wage, cost containmentBy the 2010s, the numbers of people living in out-of-work households had fallen significantly. Despite the recession that followed the financial crisis in 2008, jobs growth continued strongly throughout the decade, though job insecurity intensified and job quality worsened. To help address low pay, in 2015, then chancellor George Osborne introduced the ‘national living wage’, a higher minimum wage for those over 25, in order to move from a low wages, high tax, high welfare economy to a high wages, low tax, low welfare economy.
The 2010s also saw the introduction of universal credit (UC), which overhauled both the structure and administration of the social security system. The aims of UC were to encourage more people into work by ‘making work pay’ and to simplify the social security system, including by bringing ‘out-of-work’ and ‘ in-work’ benefits together. By the 2010s, in-work poverty rates had been increasing steadily for over a decade. In recognition of this, UC was originally intended to help support progression at work, through a new conditionality regime. However, this has remained a policy intention and has not yet been implemented in practice. UC was introduced alongside an austerity agenda to help reduce the deficit which opened up after the 2008 financial crisis. In 2015, key ‘austerity policies’ were introduced, including the two-child limit and benefit cap, remaining in place today.

GET IN TOUCHFor more information about the Institute for Public Policy Research, please go to www.ippr.org
You can also call us on +44 (0)20 7470 6100, e-mail [email protected] or tweet us @ippr
Institute for Public Policy ResearchRegistered Charity no. 800065 (England & Wales), SC046557 (Scotland), Company no, 2292601 (England & Wales)
The progressive policy think tank


![[Dazai Osamu] No Longer Human](https://static.fdocuments.us/doc/165x107/5456a41fb1af9f02548b47f5/dazai-osamu-no-longer-human-55844ee401be1.jpg)


