No Free Shop - Columbia Business School Free... · No Free Shop: Why Target ... Abstract We study...
57
No Free Shop: Why Target Companies in MBOs and Private Equity Transactions Sometimes Choose Not to Buy ‘Go-Shop’ Options Adonis Antoniades, Charles W. Calomiris, and Donna M. Hitscherich * Abstract We study the decisions by targets in private equity and MBO transactions whether to actively “shop” executed merger agreements prior to shareholder approval. Targets can negotiate for a 'go-shop' clause, which permits the solicitation of offers from other would-be acquirors during the “go-shop” window and may lower the termination fee paid by the target in the event of a competing bid. The decision to retain the option to shop is predicted by various firm attributes, including larger size and more fragmented ownership. Go-shops are not a free option. We exploit the impact of various characteristics of the firms’ legal advisory team and procedures on the probability of inclusion of a go-shop provision to establish a negative relationship between go- shop provisions and initial acquisition premia. Importantly, that loss to shareholder value is not offset by gains associated with new competing offers. We conclude that the increased-use of go- shops reflects excessive concerns about litigation risks, possibly resulting from lawyers’ conflicts of interest in advising targets. Keywords: Private equity, management buyouts, mergers, acquisitions, offer premium, cumulative abnormal returns, conflicts, litigation risk, lawyers, merger agreements, go-shop, special committee. JEL codes: G32, G34, K22. * Antoniades is Economist, Bank for International Settlements; Calomiris is Henry Kaufman Professor of Financial Institutions, Columbia Business School, and a Research Associate of the National Bureau of Economic Research; Hitscherich is Senior Lecturer in the Discipline of Business in the Finance and Economics Division and Director of the Private Equity Program, Columbia Business School. The authors thank Michael Hillmeyer, Zheli He, and Greg Rafert for excellent research assistance, Andrea Pratt, Bernard Black, and Larry Wall for very useful discussions. The views expressed in this paper are those of the authors and do not necessarily reflect the views of the Bank for International Settlements.
Transcript of No Free Shop - Columbia Business School Free... · No Free Shop: Why Target ... Abstract We study...
No Free Shop: Why Target Companies in MBOs and Private Equity Transactions
Sometimes Choose Not to Buy ‘Go-Shop’ Options
Adonis Antoniades, Charles W. Calomiris, and Donna M. Hitscherich *
Abstract
We study the decisions by targets in private equity and MBO transactions whether to actively
“shop” executed merger agreements prior to shareholder approval. Targets can negotiate for a
'go-shop' clause, which permits the solicitation of offers from other would-be acquirors during
the “go-shop” window and may lower the termination fee paid by the target in the event of a
competing bid. The decision to retain the option to shop is predicted by various firm attributes,
including larger size and more fragmented ownership. Go-shops are not a free option. We exploit
the impact of various characteristics of the firms’ legal advisory team and procedures on the
probability of inclusion of a go-shop provision to establish a negative relationship between go-
shop provisions and initial acquisition premia. Importantly, that loss to shareholder value is not
offset by gains associated with new competing offers. We conclude that the increased-use of go-
shops reflects excessive concerns about litigation risks, possibly resulting from lawyers’ conflicts
of interest in advising targets.
Keywords: Private equity, management buyouts, mergers, acquisitions, offer premium,
cumulative abnormal returns, conflicts, litigation risk, lawyers, merger agreements, go-shop,
special committee.
JEL codes: G32, G34, K22.
* Antoniades is Economist, Bank for International Settlements; Calomiris is Henry Kaufman Professor of
Financial Institutions, Columbia Business School, and a Research Associate of the National Bureau of
Economic Research; Hitscherich is Senior Lecturer in the Discipline of Business in the Finance and
Economics Division and Director of the Private Equity Program, Columbia Business School. The authors
thank Michael Hillmeyer, Zheli He, and Greg Rafert for excellent research assistance, Andrea Pratt,
Bernard Black, and Larry Wall for very useful discussions. The views expressed in this paper are those of
the authors and do not necessarily reflect the views of the Bank for International Settlements.

1
I. Introduction
The manner in which firms sell themselves in the market is an important, and little-studied, topic.
Firms must decide whether to enter into an agreement with an acquiror as part of a bilateral discussion
or as part of a broader “auction” process. Once they have chosen to do one or the other, they must decide
how aggressively to continue to market themselves to other would-be acquirors prior to their
shareholders’ vote on the acquisition. Firms, unlike commodities, are unique assets and are acquired as
part of a costly process of investigation by potential acquirors. Interestingly, the process is not uniform;
the decisions targets make about how to market themselves to acquirors, both before and after they enter
into an acquisition agreement, vary greatly.
Legal constraints govern the duties of the board of directors in marketing targets in change of
control transactions; however, targets enjoy substantial latitude in determining the contract structure
through which they sell themselves. When a US public company agrees to be purchased by an acquiror in
a change of control transaction requiring the approval of the target company shareholders, the
transaction is announced publicly and the executed contract providing for the purchase (the merger
agreement) is filed as an exhibit to Form 8-K filed with the Securities and Exchange Commission (SEC). In
such a transaction, the board of directors of the target company must obtain the best transaction
reasonably available to the company. This mandate is often expressed as the board of directors’ “Revlon
duties” based on the 1986 Delaware case where the court held that in a “change of control” scenario
“[t]he directors’ role changed from defenders of the corporate bastion to auctioneers charged with
getting the best price for the shareholders at a sale of the company.”1 Revlon does not require any
particular procedure for sale of the company, but rather provides that if the target receives a competing
bid after the execution of the merger agreement but before the target shareholders approve the
transaction, the board of directors must consider the competing bid.
1 Revlon Inc. v. MacAndrews & Forbes Holdings, Inc., 506 A.2d 173, 182 (Del. 1986).

2
While the target board in a change of control transaction may choose not to market the company
widely prior to the initial accepted acquisition offer, and may also contractually agree not to actively
“shop” the target after the execution of the merger agreement, the target board of directors must
evaluate bona fide offers made by competing acquirors.2 It is for this reason that acquirors often contract
for a fee to be paid by the target company in the event that the target board terminates the merger
agreement to pursue the competing bid. These termination or “break-up” fees generally range between
3 and 5 percent of the transaction value of the target.
A go-shop provision in a merger agreement enables the investment bank financial advisor to the
target company to actively solicit (i.e., “shop”) and negotiate with other potential acquirors
(notwithstanding the executed merger agreement contract) with a reduced termination fee for a specified
period of time generally ranging from 30 to 50 days (such period of time being referred to as the “go-shop
window”). Should the target board of directors determine to terminate the merger agreement with the
acquiror based on a bid received during the go-shop window, the termination fee paid to the acquiror
typically will be approximately one-third to two-thirds of the full termination fee that would be payable
were the same bid to be received and pursued after the go-shop window.
Initially sparsely employed in merger agreements, over the last decade, “go-shop” provisions have
become more common. Figure 1 shows the number of deals in our sample per year for the period 2004-
2011, as well as the proportion of go-shops. M&A activity peaked in 2006 and 2007, with 65 and 64
acquisitions announced in each of those years, respectively, declined sharply in 2008-2009 to 23 and 18
deals, respectively, and partially recovered in 2010-2011. During this period, go-shop provisions rose in
popularity, and went from being employed in 13% of all deals in 2004 to 41% by 2007. Their share
2 Such a provision in the merger agreement is often referred to as a “no-shop.” The no-shop provision does not
eliminate the “fiduciary out” of the board of directors to evaluate bona fide competing offers received after the
execution of the merger agreement but before approval of the merger agreement by the target shareholders in a
change of control transaction.

3
remained at similarly elevated levels through and after the crisis, and declined to 24% only in 2011. These
patterns extend to the dollar volume of deals where, however, the decline in activity during 2008-2009 is
more pronounced (Figure 2).
In recent years, two academic commentators have argued that the option to shop an offer can,
and on average does, lead to a higher price for the target firm.3 The views of practitioners on the efficacy
of go-shops have been mixed, however, with some suggesting that the go-shop may in certain
circumstances be “window dressing” and others suggesting that the go-shop presents an opportunity to
overcome a “much lower threshold of obstacles” than would be faced by a competing bidder in the
absence of a go-shop.4 It is also recognized that the option to shop for an offer may have an additional
benefit of the reduction in litigation risk for the target.5 Nevertheless, when a target firm buys a go-shop
option it must pay for that option, and in theory that payment should take the form of a lower initial offer
price for the firm, ceteris paribus. The current literature on go-shops neither has come to grips fully with
the tradeoffs between the costs and benefits of go-shops, nor has provided empirical evidence about go-
shops that fully takes account of all those costs and benefits.
These questions have important policy consequences. There is an increasing risk that judges may
fail to recognize the economic costs to target shareholders of employing go-shop clauses. If judges
3 Subramanian (2008) and Jeon and Lee (2014). 4 Compare Potter Anderson & Corroon LLP (2008) (observing that the utility of the go-shop is a function of the
context in which the target board determines to negotiate for it and suggests that if the initial transaction is the
product of overreaching by target management then the go-shop will have little utility) with Signal Hill Capital
Group LLC (2012) (hereinafter “Signal Hill Study (2012)”)(quoting Robert Friedman, former Chief Legal Officer of
the Blackstone Group stating that “Go-Shops are meaningful…Both the strategic universe and the private equity
universe would be reticent to come in during a classic no-shop process [after a signed deal is announced]. We just
wouldn’t do it. But when you put a ‘For Sale’ on the door, and say come get me then people drop everything and
look because they are being invited in.”). New York Times (2006), Sautter (2008), and Bloch (2010) specifically note
the possibility that go-shops may be designed to provide litigation protection to targets, especially in the context of
a “sweetheart” deal between the target and its management. For further references, see Jeon and Lee (2014). 5 Compare Signal Hill Study 5 (observing that in the years 2010 and 2011 transactions with go-shops were subject
to litigation 70% and 76% of the time, respectively) with Cornerstone Research (2013) (observing that M&A
shareholder litigation of all deals valued at over $500 million impacted 95% and 96% of the deals in the years 2010
and 2011, respectively).
4
adopted an unbalanced view of the costs and benefits of go-shop clauses, that could push acquisition
targets to adopt go-shops even if the economic consequences of doing so were unfavorable.
We examine the determinants of the go-shop decision and the effects on the bidding activity and
pricing that result from the target board’s decision to include a go-shop clause rather than a no-shop
clause. Economic theory implies that there are countervailing considerations that the target board of
directors should take into account when deciding whether to include a go-shop clause, and we take these
considerations into account when modeling the go-shop decision and its consequences.
On the one hand, there is the obvious positive value, ex post facto of the signing of the merger
agreement, from retaining the option to shop any offer at a reduced termination fee for a period of time.
With an offer in hand, the target can attract new offers more easily by showing that a credible bidder has
already ascertained that the target firm is worth enough to warrant the offer that is being shopped. In the
presence of search and due diligence costs to potential acquirors, being able to shop an offer may attract
bidders who otherwise would not participate in the bidding to acquire the target, and it may encourage
them to bid above the price of the offer being shopped, especially if there are competitive considerations
leading competing bidders to want to prevent the original bidder from consummating its offer at the
agreed price.
On the other hand, if a target insists on a go-shop clause, doing so may have a chilling effect, ex
ante facto of signing the merger agreement, on the willingness of the initial acquiror to expend search
and due diligence costs, and to offer a high price for the target. Knowing that its offer will be shopped,
and understanding the positive externalities that its offer creates for other would-be acquirors (precisely
as the result of the search and due diligence costs that create ex post option value for the target), ceteris
paribus, the initial acquiror should be less likely to bid, and should bid at a lower price, if a target insists
on including a go-shop clause.

5
In addition to the two countervailing economic implications of the go-shop choice, there is a third
potential value-maximizing influence on the go-shop decision, namely concerns about legal liability or
what we will term “litigation risk aversion.” Target firms that employ go-shops may be concerned about
costly legal challenges from their shareholders about the bargaining process that resulted in the
acquisition. The duty of the board of directors of the target firm to act as “auctioneers” when considering
offers for the target firm in a change of control of transaction does not specifically require them to actively
solicit alternative offers, either before the merger agreement is executed (through what is sometimes
called a “pre-signing market check” or an “auction” of the firm), or after the merger agreement is executed
(through what is sometimes called a “post-signing market check” or a go-shop clause). Doing so, however,
may reduce the risk that a successful suit will be filed claiming that directors failed to fulfill their fiduciary
duties. For some target firms, including a go-shop may be value-maximizing because of its incremental
effect on expected litigation costs, even if absent those considerations (based on the first two
countervailing considerations) a go-shop clause would not have been value-maximizing. For other firms,
excessive litigation risk aversion may be value-destroying.
Target firms with different characteristics should differ with respect to the valuation
consequences of choosing a go-shop clause. For example, litigation risk aversion should be greater if
ownership is more diffuse; concentrated ownership makes it more difficult to prevail in such a suit
because it is prima facie evidence of less managerial latitude in accepting too low a price. With
concentrated ownership, it is likely that blockholders (who would have enough knowledge of the firm’s
prospects and enough voting power to block the transaction) are able to constrain management, making
undervalued sales that are contrary to shareholders’ interests less likely. Firms of different sizes may
experience greater costs or benefits from go-shop clauses, although size captures a number of potential
influences, and the net effect is hard to predict. On the one hand, smaller firms are less well-known and
therefore may benefit more from a go-shop. On the other hand, expected litigation costs should be an

6
increasing function of target size because of fixed costs that should deter would-be litigant shareholders
from suing smaller firms, and because ownership tends to be more concentrated in smaller firms.
In addition to the three influences that matter for the go-shop choice from the perspective of
value maximization, agency problems may also distort the go-shop decision. We take into account three
different agency problems.
First, the interests of target board of directors and/ or managers may conflict with target
shareholders with regard to the decision over the go-shop clause. If a target manager either is part of the
group acquiring the target (as in a management buyout or so called, MBO), or if the target manager is
promised employment by the would-be buyer, those conflicts of interest may make the manager more
willing to agree to a lower acquisition price, and less willing to insist on a go-shop clause in the merger
agreement (in order to discourage competing bids).6 Concerns about director and managerial conflicts of
interest are central to the Delaware court’s concerns about the sufficiency of offer prices.7
Second, the interest of the investment banker to the firm may diverge from that of the target’s
shareholders. It is sometimes suggested that investment banks may take into account the business the
bank may have with the acquiror as a consequence of the transaction (for example, target investment
banks can provide financing or other services to acquirors). If such conflicts of interest are important, no-
shops could be a means for conflicted investment bankers or managers to limit competition in pricing,
and thereby pass on an implicit side payment to the acquiror. According to this view, the absence of a go-
shop clause reflects a conflict of interest that leads to under-pricing of the target firm.
6 We find, however, that concerns about litigation risk make MBOs more likely to employ go-shops, ceteris paribus. 7 Weil Gotshal (2006) writes that “Delaware courts, including the recent decision concerning the 2005 SS&C
Technologies going-private transaction, have questioned the adverse effects that a private equity sponsor’s
arrangements with management can have on a sales process by chilling the potential for competing bids.” For
additional legal perspectives on the origins of “go-shop” clauses, see Potter Anderson (2007), Latham Watkins
(2007), Debevoise Plimpton (2006), and Subramanian (2008).
7
A third potential conflict of interest involves the firm’s legal counsel. To the extent that future
potential clients evaluate law firms on the basis of their ability to survive litigation challenges in the
crafting of merger agreements, lawyers seeking to acquire reputations for negotiating successful
transactions may advise their clients to use go-shops too frequently. Lawyers may benefit when their
clients include a go-shop clause, even if adopting a go-shop is not value maximizing for the client. To our
knowledge, we are the first to consider agency conflicts faced by lawyers when analyzing the contracting
choices faced by a target firm. We label the six posited influences on the go-shop choice as the (positive)
“ex post option effect,” the (negative) “ex ante chilling effect,” the (positive) “expected litigation cost
effect,” the (negative) “managerial agency effect,” the (negative) “banker agency effect,” and the
(positive) “lawyer agency effect” (where positive or negative refer to the effects on the probability of
choosing a go-shop provision). The importance of each of these six effects should vary across transactions,
depending on the characteristics of targets and the characteristics of their transactions. We consider the
nature of the cross-sectional variation in observable characteristics that might arise in the choice of go-
shops and we test those alternative perspectives in our empirical analysis of the choice of go-shop clauses
and their consequences for bids and for target firm value.
II. Literature Review
Roberts and Sweeting (2011) develop a theoretical framework that is most directly applicable to
go-shops, although it is more general in its treatment. Building on the theoretical and empirical M&A
studies of others, Roberts and Sweeting (2011) explore a range of theoretical questions related to the
differences between sequential and simultaneous auctions. They show that sequential auctions can be
value-creating for targets when bidder entry is costly and when potential bidders receive imperfectly
informative signals about their values prior to deciding whether to bid. In other words, sellers can benefit
from the learning process that occurs in a sequential auction, such as a go-shop. Under some

8
circumstances, structuring a bidding process for a target firm to elicit accepted bids in a sequence tends
to result in higher ultimate bids.
Subramanian (2008) analyzes 141 public company buyout transactions for US targets of greater
than $50 million in value announced between January 2006 and August 2007. He finds that go-shop
provisions are used in roughly a third of the transactions he studies, and that go-shop clauses yield greater
search (both pre- and post-signing of the merger agreement). He also finds that pure go-shops – go-shop
deals without pre-signing market checks – result in a higher post-offer bidder 17 percent of the time (a
total of six instances), and that target shareholders receive approximately 5 percent higher returns from
the pure go-shop process than they do under a no-shop. The exceptions are management buyouts
(MBOs), where the inclusion of a go-shop clause has no discernible effect on competing bidding.
Subramanian concludes that “the Delaware courts should generally permit go-shops as a means of
satisfying a sell-side board’s Revlon duties but should pay close attention to their structure, particularly in
the context of go-shop MBOs.”
Nevertheless, we do not believe that the empirical methodology employed in Subramanian (2008)
yields convincing estimates of the net expected benefits to targets from choosing go-shops. He does not
model the go-shop decision, nor adequately consider how differences in firms’ circumstances and in deal
characteristics increase or decrease the probability of the choice of a go-shop. When go-shop decisions
are an endogenous outcome of firms’ circumstances, a two-stage regression analysis is needed to
disentangle the extent to which the correlation between go-shops and acquisition premia reflects the go-
shop decision per se, or the consequences for acquisition pricing of cross-sectional differences in firm
attributes that also predict the use of go-shops. Subramanian recognizes this problem, and constructs a
“matched sample” of no-shops that he matches with his pure go-shops in an attempt to control for
differences in target firms’ circumstances. In his matched-sample comparisons, he again finds a 5 percent
difference in returns, although they are no longer statistically significant. The differences across deals that

9
Subramanian takes into account in his matched-sample comparisons (deal size, who initiates the deal, and
the timing of the transaction), however, as we show below, do not capture all of the important
heterogeneity in targets’ characteristics that matter for the go-shop choice. Because go-shop decisions
are not made randomly by firms, Subramanian’s methodology results in biased estimates of the effects of
go-shops on firms’ returns.
Jeon and Lee (2013) extend Subramanian’s (2008) results in several respects. They find that
choosing a go-shop increases each of the: (1) acquisition premium, (2) probability of receiving competing
bids after the merger agreement is executed, and (3) probability of deal completion. Methodologically,
they attempt to take account of the endogeneity problem of the go-shop decision by employing the
average proportion of go-shops in the target’s (or acquiror’s) industry.8 In doing so, they assume that the
average proportion of go-shops affects the go-shop choice, but is unrelated to (time-varying) industry
characteristics which may have a direct effect on acquisition premia. We do not find that identifying
restriction plausible. Industries experience changes over time in their riskiness and competitiveness, and
these factors should be central to the determination of acquisition premia. For that reason, the average
proportion of go-shops is not a valid go-shop instrument.9
Indeed, as we discuss in Section I, in theory, once the endogeneity of go-shops is taken into
account, the exogenous effect of go-shops on the initial offer price should be negative, not positive, and
the effect on returns is ambiguous. In our empirical work, we model the go-shop decision explicitly, and
measure the effect of plausibly exogenous influences on the go-shop choice on the offer price received
by the target, and on target returns, after controlling for firm and deal characteristics that affect the offer
price and target returns directly (rather than through the go-shop decision).
8 It is not clear in Jeon and Lee (2014) the time period over which the industry average is taken. 9 Indeed the OLS and 2SLS estimates in Jeon and Lee (2014) are remarkably similar, casting doubt on whether the
instruments do extract the exogenous component of the variation in the propensity to include a go-shop provision
in the initial merger agreement.

10
The literature on termination fees in mergers and acquisitions also bears on the consequences of
go-shops for bidding and valuation. After all, go-shops are, in essence, a temporary reduction in the target
termination fee. Thus, evidence that higher termination fees can be value-creating for targets is also
evidence in favor of potential value-creating consequences from no-shop provisions. Officer (2003) finds
that merger transactions with termination fees tend to result in higher acquisition premia and higher
success rates than transactions without termination fees. Bates and Lemmon (2003) show that
termination fees are used more in situations where bidding is costly. Both studies, as well as a related
study by Boone and Mulherin (2007), conclude that termination fees serve as an efficient contracting
device, not a means for incentive-conflicted managers to deter bidding to protect “sweetheart” deals that
benefit management at target shareholders’ expense. Jeon and Ligon (2011) find that the effects of
termination fees vary with their size: relatively low fees are an efficient contracting device, but higher fees
(reflecting agency problems) are sometimes employed.
We do not attempt a comprehensive review of the literatures on conflicts of interest here. With
respect to conflicts of target management in M&A transactions, Brewer, Jackson and Wall (2012) provide
a review of the literature, and an empirical methodology that shares many aspects with our approach (see
also Yim, 2013). For Brewer, Jackson and Wall (2012)’s sample of bank mergers, they find evidence that
CEOs wishing to find future employment opportunities (instrumented by age) limit the marketing of target
firms. For a review of the literature on investment bankers’ conflicts of interest in M&A transactions, see
Calomiris and Singer (2004) and Calomiris and Hitscherich (2007). These studies examine whether prior
relationships between a target’s investment bankers and the acquiror are associated with different
outcomes in acquisition premia for targets. Calomiris and Singer (2004) analyze 52 large hostile takeover
transactions between 1993 and 2003. They find no evidence that potential conflicts affect acquisition
premia. Calomiris and Hitscherich (2007) examine 170 cash acquisitions of more than $100 million over

11
the period 1994 to 2002. They find no evidence of a connection between a target bank’s prior relationship
with the acquiror and the acquisition premium.
With respect to potential lawyer conflicts, we are unaware of any prior study related to this
phenomenon. There are, however, studies that posit effects on corporate financing decisions that vary
with the identities of legal advisers. Coates (2001) shows that despite theoretical predictions suggesting
that takeover defenses can lead to lower proceeds in IPOs, "companies advised by larger law firms
with more takeover experience adopt more defenses." Coates argues that the decision to take an action
that can affect firm value is the net sum of a host of motivations, many of which may also directly correlate
with firm value. He argues that a key aspect of legal advisers is that they tend to be exogenous influences
on firm value, especially in light of the fact that the choice of legal counsel tends to pre-date the relevant
transactions being studied. The choice of legal advisor is thus a valid instrument that can help identify the
exogenous effect of the recommended action on firm value. Building on Coates (2001), Johnson, Karpoff
and Yi (2012) use the choice of legal advisor as an instrument to identify the causal effect of takeover
defenses on firm valuation. Our use of legal advisor identity is similar in spirit to these studies, although
the three measures related to the firm’s legal team are new, and reflect our desire to consider which
aspects of legal advice are more likely to be associated with a conservative posture toward litigation risk.
III. Data
As discussed in Section I, a proper analysis of the choice of go-shop clauses requires one to take
account of the heterogeneous circumstances of the target firms that are choosing whether to include go-
shop or no-shop clauses. Larger target firms, targets with more diffuse ownership, firms that did not
widely market a target before executing the merger agreement, firms where potential director,
managerial or investment banker conflicts of interest are absent, and firms and lawyers that are

12
excessively risk averse in their concerns about litigation risk, ceteris paribus, may be more likely to choose
a go-shop clause. These various considerations define the content of the dataset we assembled.
The transactions in our sample were identified based on information set forth in the database of
MergerMetrics, which is a product of FactSet. To be included in the sample, the transaction needed to
satisfy the following criteria: 1. The transaction reflects the consideration set forth in the initially executed
merger agreement between the target and acquiror and was announced between January 2004 and
December 2011; 2. The target was a US public company; 3. The consideration paid to the target
shareholders was cash and was offered pursuant to a transaction whereby public ownership in the target
would cease; 4. The acquiror was either a financial or private equity buyer; 5. The transaction was not
pursuant to a tender offer; and 6. The target had available each of the (a) merger agreement and Merger
Proxy Statement for the transaction and the most recent proxy statement for the regularly scheduled
annual meeting of shareholders on the EDGAR database of the SEC and (b) stock price data. These various
requirements, especially given the 52-week range of analysis of stock prices used in our study, reduced
the number of observations in the sample from 341 identified transactions to 306 usable transactions.10
For each of the transactions so identified, information on a number of attributes of the transaction was
obtained, as described in Table 1.
We focus on cash deals with financial or private equity buyers because these transactions permit
a clear analysis of the responses of returns to deal characteristics. Deals that involve the exchange of stock
or involve strategic buyers who may reap synergies from merging complicate the analysis of returns; once
an accepted bid is announced changes in target value reflect both the fortunes of the target and those of
the would-be acquiror.
10 The most significant source of attrition are price variables, for the computation of which we required no fewer
than 180 non-missing price observations over a calendar year (252 trading days)
13
Key Variables
The key explanatory variables used in the analysis, can be grouped into three broad categories,
based on the degree to which they convey information about target characteristics, market perceptions,
or attributes of the initial agreement.11
Target leverage may indicate growth opportunities, positive creditor perceptions, or managerial
discipline, and could thus enter the acquisition premium equation with a positive sign. We include a
dummy variable for larger targets. Target size proxies for a host of characteristics that could matter for
valuation (opacity, market access, etc…), and the effect of large size on the premium is uncertain.
We include dummy variables to describe the shareholding structure of the target. One variable
indicates whether the largest coordinated shareholding block (single shareholder or collective ownership
of owners and directors) controls more than 20% of the firm and the other indicates whether holders of
a minimum 5% stake collectively own more than 20% of the target firm. The effect of shareholding
structure on firm value is unclear on a priori grounds.
Market metrics can influence the offer price. Baker, Pan and Wurgler (2012) show that reference
point prices can have a positive effect on the bidder’s offer price. We include the 52 week high offer ratio
as the reference value. We also include returns volatility although its effect is not clear.
The merger agreement specifies termination fees for target and acquiror, and we include these
as important financial parameters of the agreement.12 The offer premium may covary with the financing
aspects of the contract. A financing condition permits the acquiror to exit the contract if financing cannot
be secured. Exit risk, however, can be mitigated if the target firm’s financial advisor offers financing to the
acquiror as needed. At the same time, this financing option may create a conflict of interest for the
11 Though a host of target firm characteristics can affect firm value, for identification we can limit our attention only
to those characteristics that may affect the offer premium, which measures the premium of the initial offer in relation
to a pre-announcement market measure of firm value. 12 Termination fees impose exit costs and may also reflect bargaining power differentials between the parties
involved in the acquisition, and, therefore, may covary with the offer premium.

14
financial advisor who, on one hand, has an incentive to obtain the highest offer possible for the target,
but on the other hand, may stand to profit from financing the deal for the acquiror. We include two binary
variables to indicate the presence of a financing condition or a financing option, and proxy for additional
potential conflicts of interest by including a binary variable indicating whether the target’s financial
advisor had a prior relationship with the acquiror. We also include a dummy variable that indicates
whether an auction was conducted as part of the process of obtaining the initial bid.
The acquisition may be a management buyout. We have no strong prior on the direction of this
effect but recognize that MBOs are qualitatively different from normal acquisitions, due to, for example,
the informational advantage managers enjoy over external acquirors. We therefore add a binary indicator
for whether the deal is an MBO. For robustness, in subsequent analyses we re-estimate all models on a
slightly smaller sample that excludes management buyouts.
Summary Statistics
Table 2 shows summary statistics for the key variables. Market variables have definitions that
depend on the choice of the base, pre-offer price. Our main analysis and discussion of market variables
rely on the pre-offer price defined as the closing price 30 days prior to the offer announcement. This
makes it unlikely that the pre-offer price will be affected by pre-announcement information concerning
the bidding for the target firm. In robustness tests we show that the results remain qualitatively
unaffected if we use the 5-day pre-announcement window.
The average enterprise value of target firms is $2.3bil, with values ranging from $300k to $123bil.
Target firms have an average leverage ratio of 0.22, with 29% of them financed entirely by equity. In 87%
of the target firms, significant owners (shareholders who individually own more than a 5% stake)
collectively control more than 20% of the target. 57% of the target firms have “concentrated ownership,”
which we define as the ownership of the largest shareholder or the collective ownership of officers and
15
directors (a coordinated block) exceeding 20%. The number of officers and directors of the firm varies
between 4 and 34, with the average at 13.
The average offer premium is 33%. There is substantial variation in the offer premium, with a
standard deviation of 45% and offer premia ranging from a low value of -75% to a high value of 352%. The
average 52- week high offer ratio is 149%, ranging from 100% to 1688%, and the average annualized
volatility of daily returns is 48%, ranging from 16% to 266%.
Management buyouts (MBOs) account for 10.5% of the transactions. In 61% of the deals, the
target was widely marketed (a so-called “auction” was conducted) as part of the process of determining
the initial bid. At 3.6%, the average termination fee for the target is slightly higher than the 3% average
termination fee for the acquiror (also known as the reverse termination fee). The difference is partly
driven by the large number of deals (123) in which the acquiror did not agree to a termination fee.
In 23% of the deals the acquiror has the option to exit the deal if they fail to secure financing for
the acquisition, but in 15% of the deals the target’s financial advisor agreed to offer the acquiror the
option of financing. In almost half the deals (49%), the target firm’s financial advisor has a prior
relationship with the acquiror.
Mean Comparisons: Go-shops vs no-shops
A central question of our paper is whether the inclusion of a go-shop provision in the merger
agreement affects the offer premium. Figure 3 shows the distribution of the offer premium for go-shop
and no-shop deals. Panel (a) shows the offer premium computed based on the 30-day pre-offer price and
panel (b) using the 5-day pre-offer price. The distributions of offer premia for go-shops have a higher
mean than those of no-shops; the differences are more pronounced for 5-day premia. The difference in
means tests shown in Table 3 indicate that the means of the two distributions are statistically
undifferentiated from each other.

16
The offer premium may depend on a number of factors. Firm attributes that may directly affect
the offer premium may also differ across the two types of deals. For example, as illustrated in Figure 4,
go-shops are associated with larger targets.
In Section I, we developed several theoretical predictions about the effects of choosing a go-shop,
and about differences between the attributes of go-shop and no-shop transactions. Table 3 provides initial
support for some of these theoretical predictions. The difference in means tests reported in Table 3 should
be interpreted as identifying systematic differences in the distribution of target/deal characteristics across
the two deal types, which may in turn reflect the influence of target characteristics on the decision to
include a go-shop clause; we study this possibility more formally in Section IV.
There are no large or statistically significant differences between go-shops and no-shops
associated with the 52-week high offer ratio, volatility, or the size of the termination fees for the target.
Go-shop provisions display higher target leverage, include higher acquirer termination fees, are less likely
to include a financing condition, and are marginally less likely to include the option for the acquiror to
obtain financing from the target firm’s financial advisor. These differences in contract structure may
reflect other aspects of no-shop transactions (e.g., greater opacity of no-shops, which may make financing
by an informed target banker useful).
Widely marketed deals (“auctions”) are much less likely to require go-shops, presumably because
there is less value in the go-shop option, and because there is less to be gained in terms of mitigating
litigation risk aversion from including a go-shop clause.
Greater ownership concentration should be associated with less use of go-shops, and we find
support for this in the data, both using the Total Ownership by 5% holders, and an indicator for whether
there is a >20% owner, as the measure of ownership concentration. Closely controlled targets may have
less need of a go-shop provision to mitigate litigation risk, because the implicit approval of the controlling

17
shareholder generally argues against the possibility of managerial conflicts of interest.13 We also find that
target firms with a greater number of officers and directors are more likely to choose go-shops. One
potential interpretation of this finding is that the presence of a high number of officers and directors
indicates a stronger preference for formalized procedures.
In theory, the effect of MBOs on the go-shop decision is ambiguous; in Table 3, MBOs tend to
make greater use of go-shops, presumably out of concerns about litigation, but the difference is not
statistically significant. Similarly, with respect to the effect of investment banker conflicts on the go-shop
decision (which is ambiguous in theory), go-shops are more likely to be chosen if the target’s investment
bank has a relationship with the acquiror.
OLS Regressions: Partial Covariance between Go-Shop Choice and the Offer Premium
We estimate the partial covariance between the go-shop choice and the initial offer premium
using a linear model of the offer premium, including a rich set of controls to account for distributional
differences in the populations of go-shops and no-shops.. Our OLS specification is shown in Equation (1):
(1)
is the offer premium for deal i announced in year t. is a dummy variable indicating whether the
initial agreement contained a go-shop provision and is a vector of additional controls
(definitions are shown in Table 1).14 We also include year fixed effects ( ) to control for the impact of
aggregate macroeconomic conditions on offer premia; is an idiosyncratic error term.
Table 4 shows the results for the OLS regression. Column (1) shows estimates for the complete
sample, which includes MBOs, using the 30-day closing price as the pre-offer price. We repeat the
13 Subramanian (2008) excludes acquisitions with a controlling target shareholder (using a threshold of 35%), on
the theory that “any shopping process would not be meaningful in these deals unless the controller agreed to sell
its shares into a higher-value competing bid (which is rare).” 14 The time index indicates the use of time-dependent rather than time-varying controls, as all controls are
measured at only one point in time for each deal.
itititit uControlsGOOP +⋅+⋅+= γβκ
itOP iGO
itControls
tκ
itu

18
estimation on a sample that excludes MBOs in column (2). Columns (3)-(4) repeat the estimates shown in
columns (1)-(2), using the 5-day closing price as the pre-offer price. In all four columns, the go-shop
provision covaries negatively with the offer premium, but the identified covariance is not statistically
significant. We do not discuss the partial covariances between the offer premium and the various control
variables, except to mention that several of them are statistically significant.
The estimated OLS coefficient on the go-shop choice should not be interpreted as measuring a
causal effect of the go-shop choice on the offer premium because the go-shop choice is itself an
endogenous variable. We address this endogeneity problem at length in Sections IV and V below.
IV. Identification Strategy
Our OLS estimates indicate no simple empirical connection between go-shops and offer premia
once one controls for firm, market and deal characteristics, but OLS estimates are not conclusive measures
of the effect of go-shop choice on the acquisition premium. The go-shop decision is endogenous to many
factors that are correlated with the acquisition premium. To identify the relationship between the choice
of the go-shop provision and the offer premium, we need to employ a framework that addresses the
endogeneity of the go-shop decision.
We employ the two-stage least squares methodology (2SLS) to estimate the effect of the go-shop
provision on the offer premium. We use a 2SLS estimator that utilizes a non-linear “zeroth” stage to better
fit the non-endogenous component of the go-shop variable; the details of the estimator are described in
the Appendix. In the Appendix, we also show that the results remain unchanged if we use a two-step
Heckman estimator instead.
Choice of exogenous instruments
We use three binary indicator variables to capture variation in the go-shop decision that is not
directly related to the target firm’s value and, therefore, should not directly affect the offer premium.

19
First, we include an indicator variable for whether a special committee was formed to examine
the transaction. The special committee explores different options before making a recommendation to
the board, and aims at structuring a deal which strengthens the legal defenses of the firm against future
lawsuits challenging the fairness of the transaction. If a special committee is formed to advise the board
on the transaction, a greater focus is placed on procedural concerns and gives greater weight to lawyers’
opinions on contractual terms.
Second, the number of legal advisors involved in the transaction is a potential indicator of greater
lawyer conflicts. A higher number of lawyers will be associated with a greater focus on procedural
concerns. In addition, retaining more lawyers increases the probability of a conservative legal opinion in
favor of a go-shop, which other lawyers would have little interest in opposing. We thus include a binary
indicator variable, indicating whether the target’s legal team included multiple legal advisors.
Third, for each legal advisor, we construct another binary indicator variable that captures whether
the legal advisor is a highly ranked law firm. The details of the construction are provided in the Appendix.
Higher ranked law firms have more reputational capital at stake from litigation challenges, and therefore,
more potential conflict of interest with target shareholders.
There are three potential interpretations of what the instruments are capturing. The first
interpretation is that the use of a special committee, the use of multiple lawyers and the use of high-
ranking law firms increase the potential for attorney conflicts of interest. A deal that results in highly costly
and disruptive litigation can cost a law firm valuable reputational capital. Attorneys, therefore, have an
incentive to immunize the deal against future litigation through a go-shop provision even if the economics
of that immunization would generate a net cost for the target firm’s shareholders.
The second potential interpretation of the instruments is that they capture unobserved
heterogeneity in levels of risk aversion across target firms. Targets with excessively litigation risk-averse
management retain the services of multiple legal firms, organize special committees, and hire highly

20
ranked law firms, and these decisions tend to result in greater legal immunizations to the deal. For such
firms, the decision to include a go-shop provision is but one of many manifestations of inherent aversion
to litigation risk, and the instruments proxy for the firm’s level of risk-aversion.
The third potential interpretation is reverse causality. The target firm’s managers may have
private information that leads them to expect a low offer premium, and managers may worry that
shareholders will infer that a low offer premium is the result of some managerial conflict of interest.
Anticipating unusual legal problems, the target may be spurred to take extra legal precautions. In this case
our three legal variables would be associated with a negative acquisition premium, with causality running
in the direction from the offer premium to the legal variables.
Under the first two interpretations, the instrumental variables are exogenous to firm value and
therefore satisfy the exclusion restrictions. Under the reverse causality interpretation, however, the
exclusion restriction is violated. In a robustness section, we discuss reverse causality further, estimate an
alternative specification to gauge its potential magnitude, and argue that endogeneity does not reverse
our central finding – that go-shop provisions are costly to acquirors and result in reduced initial offers for
targets. We recognize, however, that one cannot rule out the possibility that reverse causality may
introduce bias to the estimates that rely on the exclusion restrictions, and therefore, we abstain from
making strong inferences about the magnitude of our results.
Table 2 displays summary statistics for the instrumental variables. Litigation risk is an important
concern in acquisitions, as is evident by the fact that more than half of the deals (57%) had a special
committee of independent directors formed to make a recommendation to the full board of directors
with respect to the price and terms of the proposed transaction. Moreover, 10% of the target firms
retained the services of multiple legal advisors to advise them about the acquisition proposal. By
construction, roughly a fourth of the targets are classified as retaining the services of what we define as
“top-tier” legal advisors. The difference in means tests shown in Table 3, indicate that all three of the

21
binary legal variables are associated with a greater use of go-shops, though the difference in the dummy
variable for the presence of multiple lawyers is not statistically significant.
V. Regression Results
Determinants of the go-shop decision
Column (1) of Table 5 reports coefficients of a probit model of the go-shop decision for the
complete sample (including MBOs) with the full set of controls and instruments. Our specifications include
year fixed effects to sweep out aggregate macro effects in the propensity to include go-shop provisions in
initial merger agreements (Figure 1). The three instruments have a positive influence on the go-shop
decision. Legal_Adv_Rank and Special_Committee are both statistically significant at the 1% level, while
Multiple_Lawyers narrowly misses statistical significance at the 10% level.
Acquisitions where broad marketing (an “auction”) was conducted as part of determining the
initial bid are less likely to include a go-shop provision, since the auction process reduces the marginal
benefit of shopping around for competing bids.
Large targets are more likely to choose go-shops, due perhaps to higher levels of litigation risk
aversion. Targets with high concentration with a blockholder results are less likely to include a go-shop,
but, as indicated by the coefficient for ownership by 5% shareholders, high concentration without a block
holder possibly results in a higher go-shop probability (the latter effect is not statistically significant). One
interpretation is that high concentration without a blockholder may give greater incentives for a
disgruntled shareholder to challenge the deal, resulting in contractual features that shield the firm from
future litigation risk. We note that the net effect of concentration is negative.
Two more variables may be important for the go-shop decision, although they enter with
statistical significance that misses the 10% threshold. A high number of officers and directors may reflect
the need for more formal assurances in assessments of fairness. A financing condition may also result in

22
a higher propensity to include a go-shop provision. A financing condition offers the acquiror the option to
exit the deal if it is unable to secure financing and thus raises the need for a contingency plan in case the
initial deal collapses; the option of shopping around for competing bids provides such a contingency plan
through greater access to other potential acquirors.
Finally, market-related variables, leverage, termination fees and variables capturing various
aspects of the target’s financial advisor involvement do not have an impact on the go-shop decision.
Column (2) estimates the model using only the instrumental variables. The instruments’
coefficients are relatively unchanged, which attests to the very robust effect that these variables have on
the go-shop decision. Columns (3) and (4) repeat the regressions in the first two columns for the sample
that excludes MBOs. The results remain largely unchanged (however, the coefficients for Number_OD,
and Financing_Condition are now statistically significant at the 10% level).
2SLS estimates of the effect of the go-shop provision on the offer premium
Column (1) of Table 6 shows the 2SLS estimates. The option provided to the target firm by the go-
shop provision reduces the initial bid premium. The magnitude is large and statistically significant,
indicating that the go-shop provision results in a 35% decrease in the initial offer premium. In unreported
tests, we run more conservative one-tailed tests, which bound the absolute value of the decrease to 13%
and 7%, respectively at the 10% and 5% levels of statistical significance.
Column (2) of Table 6 repeats the same estimations on a subsample that excludes MBOs, where
we observe the same negative relationship. Columns (3) and (4) show that the results are robust to the
use of the more noisy15 5-day closing price as the pre-offer price, with slight decreases in magnitude and
statistical significance. In the Appendix, we show that the results remain unchanged if we employ the use
of a two-step Heckman estimator instead of the 2SLS estimator.
15 The 5-day price is closer to the day of the announcement of the merger and thus more likely to be affected by
pre-announcement leakage.
23
Endogenous litigation risk
As discussed in Section II, previous studies (Coates 2001 and Johnson, Karpoff and Yi 2012) have argued
that the choice of legal advisors is a valid instrument, both in the context of IPO transaction outcomes and
takeover defenses. As we discussed in Section IV, however, in our setting firms’ choices of legal counsel
and procedures may be driven by reverse causality, if a target believes that its anticipated (low) acquisition
premium would raise objections by target stockholders. Our regressions control for some of the most
obvious observable determinants of litigation risk that an acquiror would presumably find easy to price,
such as ownership concentration and reference price. Nevertheless, we recognize that unobservable
factors affecting acquisition premia cannot be ruled out. Indeed, one recent study – Krishnan and Masulis
(2013) – shows that target firms with higher exogenous risk of anti-trust litigation tend to choose higher-
ranked law firms to represent them. Krishnan and Masulis (2013), however, find that the choice of higher-
ranked law firms indicates a higher acquisition premium – implying that endogeneity may actually bias
our instrumented estimates to understate the true negative effect.
To ascertain the potential impact of endogeneity of the legal advisory variables, we estimate an
alternative specification that provides a lower bound – in absolute value – for the effect of the go-shop
decision on the offer premium. In this specification we treat all three instruments as control variables,
thus relying solely on the non-linearity of the go-shop decision as the source of identification. The three
legal variables now enter both the first- and second-stage regressions as control variables. Note that our
setting satisfies the conditions set in Escanciano, Jacho-Chávez, and Lewbel (forthcoming) for potentially
endogenous parameters to be strongly identified based solely on functional form, without exclusion
restrictions or instruments.16 The coefficient for the go-shop dummy under this specification is therefore
a reasonably precise estimate of the causal effect of go-shop choice on the offer premium.
16 Escanciano, Jacho-Chávez, and Lewbel (forthcoming) show that identification based solely on functional form
extends to a semiparametric setting where the only parameterization is that one index in the model is linear.

24
The results are shown in columns (1)-(2) of Table 7 for the complete sample and the subsample
which excludes MBOs. All of the instruments enter with negative coefficients, and Legal_Adv_Rank and
Multiple_Lawyers do so at statistically significant levels. Importantly, even when relying solely on the non-
linearity of the go-shop decision for identification, we still obtain a negative effect of the go-shop provision
on the initial offer premium, though the effect is not statistically significant, possibly due to the
combination of the limited sample size and the large number of covariates. In columns (3)-(4) we repeat
the same estimates using, as before, the full set of variables in the probit stage but only retaining in the
second stage variables that entered the estimates shown in columns (1)-(2) of Table 7 at robust levels of
statistical significance. In this more parsimonious specification we find the effect of the go-shop decision
to be statistically significant at the 5% level for the complete sample, and to marginally miss statistical
significance at the 10% level for the subsample which excludes MBOs. The coefficients are comparable in
magnitude to the ones obtained in columns (1)-(2) of both Table 6 and Table 7.
Taken together these results strongly indicate that go-shop decisions, on average, do not have a
positive impact on initial offers, and very likely have a negative one.
The Effect of Go-Shop Choice on Subsequent Bidding
That go-shop provisions result in lower initial offer premia may not imply that go-shops harm
target shareholders. The low initial bid could be offset by an increase in the probability of subsequent
bidding, which can result in an improvement of the terms in the original deal agreement. After all, go-
shops are designed to facilitate subsequent bidding by so-called “jumpers,” by allowing the target to
actively solicit bids and by including lower termination fees during the go-shop window. To test this
hypothesis, we examine post-merger agreement bidding behavior in go-shop and no-shop deals. We
define a dummy variable which takes the value of 1 if either (a) there is a change in the cash consideration
offered due to a subsequent bid being placed or (b) there is a change in the winning bidder; the dummy
variable otherwise takes the value of 0.

25
The lower initial acquisition premium associated with a go-shop provision is not offset by an
improvement in the frequency of subsequent bidding. First, in our sample the overall percentage of deals
with a jumper is very low, that is 4.5% for no-shops and 10.6% for go-shops. Though these differences
suggest that the inclusion of go-shop clauses results in more jumpers, a more formal analysis of the
difference shows no significant difference between go-shops and no-shops. Specifically, we employ a 2SLS
model to estimate the effect of go-shop choice on jumper propensity (using the same first-stage
regressions as shown in Table 5) and, as the results in Table 8 show, we find the effect of go-shop
provisions on the probability of a jumper to be small and statistically undifferentiated from 0.
Furthermore, if we assume, as our point estimate would imply, that go-shops do on average
increase the probability of a jumper by 4.2%, a back-of-the-envelope calculation shows that the expected
gain in the offer premium, conditional on obtaining a new deal as the result of the go-shop choice, would
have to exceed an additional 300% to compensate for the 13% decrease in the initial offer premium, which
is what we estimated as a reasonable lower bound of the effect of the go-shop to be (at the 10%
significance level).17 Even the more conservative 7% lower-bound estimate of the effect on the acquisition
premium derived above (assuming a 5% significance level) implies an implausibly high expected increase
(161%) in the acquisition premium conditional on a jumped deal. Increases of such magnitude are greatly
at odds with the data. In the data, the average additive increase in the offer premium effected by a jumper
is less than 20% for both no-shops and go-shops.
The Effect of Go-Shop Choice on CARs
Subramanian (2008) finds that go-shops provide a bona fide means of marketing a target firm
after the receipt of an accepted offer. His focus on returns is also potentially useful for distinguishing
whether go-shops are chosen in a manner consistent with value maximization. If go-shops are chosen by
17 The numbers remain qualitatively unchanged if we compute a more elaborate example which incorporates
information about the baseline probability of a jumper for no-shops and the fee structure of no-shops and go-
shops.
26
targets only in order to maximize expected target value, then holding other factors constant, the
cumulative abnormal returns associated with go-shop choice should be zero. As the market observes firms
predictably choosing go-shops or no-shops and bargaining to maximize their potential value, there should
be no consequence for abnormal returns of the predictable differences in contracting structure that
reflect firms’ heterogeneous circumstances. Conversely, if go-shops deliver negative excess abnormal
returns, after holding other factors constant, this would provide evidence in favor of the over-use of go-
shops by at least some of the go-shop firms.
We first plot the distribution of CARs for the 31-day window starting 15 days prior to the
announcement date. Figure 5 shows the distribution separately for the populations of go-shop and no-
shop deals. Go-shops exhibit slightly higher CARs. In Figure 6 we plot the daily evolution of average CARs
of go-shops and no-shops for the period starting 15 days prior to the announcement date and ending 15
days after the announcement date. Note that the means of the distributions shown in Figure 5 correspond
to the rightmost values in Figure 6.
Up until and including the day prior to the announcement date, CARs exhibit a slightly upward but
rather undifferentiated path between go-shops and no-shops; CARs reach a moderate 2% level at that
time. Then, we observe significant gains in CARs taking place on the day of the announcement and the
day following the announcement. By the end of the 31-day window, go-shop deals have accumulated an
excess of 4% in CARs when compared to no-shop deals. Interestingly, this difference is attained primarily
during the same two-day window where CARs exhibit their rapid ascent for both groups; the day of the
announcement and the day following the announcement.
Table 9 shows means tests for CARs for complete 31-day and 11-day windows centered at the
date of announcement, but also breaking down each window to its pre-announcement and post-
announcement components; the post announcement window is inclusive of the date of announcement.
At the end of the 31-day window, go-shop deals generate a statistically significant 4.69% excess CARs

27
compared to no-shop deals. Go-shops experience a statistically significant though economically
insignificant 0.9% decline in CARs during the pre-announcement window, but the major gains are
experienced from the day of the announcement onwards, where go-shops accumulate a 5.61% excess in
CARs. Similar observations hold if we examine the 11-day window instead.
OLS Estimates of the Effect of the Go-Shop Provision on CARs
Although the means tests suggest a positive effect of the go-shop provision on value (proxied by
CARs), these estimates are likely to contain significant omitted variable bias. We first correct for this bias
by estimating an OLS specification, where we include the same extensive list of explanatory variables used
in the offer premium equation. Column (1) of Table 10 shows the results for the 31-day CARs estimated
over the complete sample. The effect of the go-shop decision appears to be positive but not significant
under this specification. 52wk_high_ratio and Leverage correlates positively with CARs and Large_Target
and Auction come in with a negative sign; these effects are statistically significant.
Columns (2) and (3) break the 31-day window into a pre-announcement window and a post-
announcement one; the latter includes the announcement date. Note that the sum of the coefficients in
columns (2) and (3) should be equal to the coefficient in column (1). Comparing the two columns, the
main differences are the reversal of the sign of the go-shop decision and volatility. With regards to the go-
shop decision, we see that it has a positive but statistically not significant effect during the post-
announcement period, which drives the net positive effect identified in column (1). Columns (4), (5) and
(6) repeat the estimations on a sample that excludes MBOs and the results are qualitatively unchanged,
with the post-announcement effect decreasing slightly in magnitude and making the combined effect
negative but undifferentiated from zero.
2SLS estimates of the effect of the go-shop provision on CARs
We estimate the exogenous effect of the go-shop provision on CARs using the same 2SLS
methodology we employed in estimating the effect on the offer premium. Column (1) of Table 11 shows

28
the results for the 31-day CARs estimated over the complete sample.18 The sign of the go-shop variable is
positive but statistically undifferentiated from 0. Columns (2) and (3) break this effect into its pre- and
post- announcement components. The effects are not statistically significant. Columns (4)-(6) repeat the
estimation on the subsample with no MBOs, and the effect of the go-shop decision is still small and
statistically undifferentiated from zero in all regressions. In unreported regressions, we also show that the
estimates do not change if we examine an 11-day window instead, or if we employ the use of a two-step
Heckman estimator instead of the 2SLS. Overall, go-shop clauses do not appear to have any robust effect
on CARs during the pre- and post-announcement periods.
Robustness: CEO Age
Target CEOs may receive private benefits after the successful conclusion of the deal. Yim (2013)
develops and empirically validates a theory connecting CEO age to the propensity for acquisitions.
Propensity for acquisitions decreases with CEO age because private benefits to the CEO stemming from
an acquisition, such as permanent increases in compensation, accumulate over a longer period for
younger CEOs. Brewer, Jackson and Wall (2012) argue that a similar mechanism may be at play at the
target firm. The CEO of the target may be offered private benefits from the acquiror in exchange for
recommending a lower offer premium to the target’s board. To the extent that such benefits are
permanent and accumulate over time, there should be a positive relation between CEO age and the offer
premium. We tested this hypothesis in our sample19 and found that our results for the effect of go-shop
choice on the offer premium and CARs are robust to controlling for the age of the target’s CEO.
18 In the regressions involving CARs the sample size falls from 306 to 298 because 8 observations had fewer than 29
non-missing values during the 31-day window. 19 Following Brewer, Jackson and Wall (2012), we added as additional controls the age of the CEO, a dummy
variable indicating whether the CEO was chairman, and their interaction.

29
Robustness: 13E-3 Disclosure
A member of the target’s board may hold an equity share in the acquiring firm, or may be offered
equity participation in the merged entity. This presents a conflict of interest: the board member must
work to secure the best possible deal for the target shareholders, but he/she stands to benefit from the
acquiring firm’s concluding the deal at a lower price. Conflicts of interest of this nature are more likely to
arise in targets with concentrated ownership. One implication of the presence of such a correlation is that
the variable capturing the effects of concentrated ownership on the go-shop decision may actually be
capturing more than the higher probability of surviving future litigation.
The target firm needs to disclose such potential conflicts of interest by filing Schedule 13E-3. We
thus ran alternative specifications that include as a control an indicator variable to capture whether a
Schedule 13E-3 was filed. This allows us to test for the effect of these conflicts on either the go-shop
decision or on target firm value. We found this variable to have no statistically significant impact on either
the go-shop decision or CARs, and to affect the offer-premium only marginally in the estimates on the
sample that excluded MBOs. More importantly for the main findings of this paper, its inclusion did not
result in any qualitative or quantitative changes on the estimated effect of the go-shop decision on either
the offer-premium or CARs.20
Robustness: Reputation of the Investment Advisor
Golubov, Petmezas and Travlos (2012) show that top-tier financial advisors generate higher
bidder returns in public acquisitions. Since “tier” is determined by deal activity, the tier of the financial
advisor likely correlates positively with the tier of the legal advisor. It is therefore possible that our legal
20 We performed additional tests to assess whether other, plausibly exogenous, characteristics of the target’s
board may affect the decision to include a go-shop provision and/or firm value. In particular, we collected data on
the average director age, the number of directors who attended law school, who are practicing law, or who have
experience in private equity, as well as whether one of the board members is General Counsel. We ran several
tests in which these variables (or subsets or interactions of these variables) were treated as instruments or
controls, but did not find any robust evidence that they have an effect on the decision to include a go-shop
provision, on the offer premium, or on CARs.

30
instruments are capturing the effect of a high tier financial advisor. To test that hypothesis, we follow
Golubov, Petmezas and Travlos (2012) and include a binary variable indicating whether the target firm
worked with a top-tier financial advisor during the acquisition; the results remain unchanged with the
inclusion of this variable.
VII. Conclusion
We construct a theoretical framework for explaining the choice of go-shop clauses by acquisition
targets, which takes account of value-maximizing motivations, as well as agency problems related to
conflicts of interest of management, investment bankers, and lawyers. On the basis of that framework,
we empirically investigate the determinants of the go-shop decision, and the effects of the go-shop choice
on acquisition premia and on target firm value, using an empirical methodology that explicitly allows for
the endogeneity of the go-shop decision. Our sample includes data on 306 cash acquisition deals for the
period 2004-2011.
We allow many aspects of target firms to enter into their go-shop decision, including the nature
of their legal advisory team and procedures, their ownership structure, their size, and various other firm,
and deal characteristics. We find that the characteristics of the legal advisor and legal procedures,
ownership structure, and the extent to which the transaction was widely marketed prior to the first
accepted offer all matter for the go-shop decision.
Our paper is the first of which we are aware that explicitly considers potential conflicts of interest
between target shareholders and the attorneys that represent target firms. To investigate the potential
importance of such conflicts, we employ legal advisor characteristics, which capture differences in the
identity and structure of the legal team advising the target board of directors, as instruments when
analyzing the effects of go-shop decisions on target acquisition premia and value. These characteristics
play an important role in predicting targets’ use of go-shop provisions.

31
We find, as predicted in our theoretical review, that go-shops result in lower acquisition premia,
ceteris paribus. In other words, when targets – motivated by excessive litigation risk aversion or influenced
by conflicted legal counsel – insist on including a go-shop provision, they receive a lower offer. The adverse
effect of go-shop provisions on the initial acquisition premium is large. Estimates range widely (between
-24% and -41%), depending on the specification of the model, which is roughly the size of one standard
deviation of the merger premium. Given the size of the standard errors of our estimates, across all of
these various specifications, it seems clear that the effect of go-shop choice on the acquisition premium
is negative and large.
Our theoretical framework has an ambiguous prediction about the effects of go-shop choice on
target firm valuation. Whether the go-shop choice should increase the value of a target should depend on
a combination of the motivations underlying the go-shop choice (that is, whether it arises from value-
maximizing considerations or agency problems, such as attorneys’ conflicts of interest). Our examination
of the effect of go-shop clauses on the propensity for “jumpers” indicates that there is a small but
statistically insignificant improvement in attracting post-agreement bidders. Nevertheless, the large
adverse effect on the initial acquisition premium cannot be plausibly offset by the prospect of attracting
additional bidders, which indicates that go-shop choices have tended to be value-destroying for targets.
A positive post-announcement effect of go-shop choice on CARs is not robust to controlling for
endogeneity.

32
REFERENCES
Baker, Malcolm, Xin Pan, and Jeffrey Wurgler (2012). The Effect of Reference Point Prices on Mergers and
Acquisitions, Journal of Financial Economics, 106 (2012) 49-71.
Bates, Thomas W., and Michael L. Lemmon (2003). Breaking Up Is Hard To Do? An Analysis of Termination
Fee Provisions and Merger Outcomes. Journal of Financial Economics, 69: 469-504.
Boone, A. L., and J. H. Mulherin (2007). How Are Firms Sold?, Journal of Finance, 62(2), 847{875.
Bloch, A. (2010). Go-Shop Provisions: Beneficial Inducement Mechanisms or “Window Dressings” for
Powerful Private Equity Buyers? University of Chicago, working paper.
Brewer, Elijah, William Jackson and Larry D. Wall (2012). Takeover Targets Decision to Market Themselves
The Role of Governance, Federal Reserve Bank of Atlanta, working paper
Calomiris, C. and D. Hitscherich (2007). Banker fees and acquisition premia for targets in cash tender
offers: Challenges to the popular wisdom on banker conflicts, Journal of Empirical Legal Studies 4, 909-
938.
Calomiris, Charles W. and Singer, Hal J. (2004). How Often Do 'Conflicts of Interests' in the Investment
Banking Industry Arise During Hostile Takeovers? (February 26). Available at SSRN:
http://ssrn.com/abstract=509562 or http://dx.doi.org/10.2139/ssrn.509562
Coates, J. (2001). Explaining Variation in Takeover Defenses: Blame the lawyers, California Law Review 89,
1301-1422.
Cornerstone Research (2013). Recent Developments in Shareholder Litigation Involving Mergers and
Acquisitions.
Escanciano, Juan Carlos, David Jacho-Chávez, and Arthur Lewbel (forthcoming). Identification and
Estimation of Semiparametric Two Step Models, Quantitative Economics.
Golubov, A., Petmezas, D., Travlos, N. G. (2012). When It Pays to Pay Your Investment Banker: New
Evidence on the Role of Financial Advisors in M&As. Journal of Finance, 67: 271-312
Jeon, J. Q. and Lee, C. (2014), Effective Post-Signing Market Check or Window Dressing? The Role of Go-
Shop Provisions in M&A Transactions. Journal of Business Finance & Accounting, 41: 210–241
Jeon, J.Q., and J. A. Ligon (2011). How Much Is Reasonable? The Size of Termination Fees in Mergers and
Acquisitions, Journal of Corporate Finance 17: 959-981.
Johnson, William C., Karpoff, Jonathan M. and Yi, Sangho (2012). Why Do IPO Firms Have Takeover
Defenses? 7th Annual Conference on Empirical Legal Studies Paper. Available at SSRN:
http://ssrn.com/abstract=1923667 or http://dx.doi.org/10.2139/ssrn.1923667
Krishnan, C.N.V., and Ronald W. Masulis (2013). Law Firm Expertise and Merger and Acquisition
Outcomes, Journal of Law and Economics, vol. 56, issue 1, pp. 189 – 226.
New York Times (2006). Looking for More Money, After Reaching a Deal, March 26.
Officer, Micah S. (2003). Termination Fees in Mergers and Acquisitions. Journal of Financial Economics,
69: 431-467.

33
Potter Anderson & Corroon LLP (2008). Go Shops: Market Check Magic or Mirage?
Roberts, J. and A. Sweeting (2011). When Should Sellers Use Auctions? NBER Working Paper 17624.
Signal Hill Capital Group LLC (2012). Go-Shop Provisions and Possibilities Transaction Case Study 2004-
2011: A Viable Mechanism for Sellers and Buyers. May.
Subramanian, G. (2008). Go-Shops vs. No-Shops in Private Equity Deals: Evidence and Implications, The
Business Lawyer (May).
Sautter, C.M. (2008). Shopping During Extended Store Hours: From No Shops to Go Shops, Brooklyn Law
Review 73: 525-577.
Vella, Francis and Marno Verbeek (1999). Estimating and Interpreting Models with Endogenous Treatment
Effects, Journal of Business & Economic Statistics, Vol. 17, No. 4 (Oct.), pp. 473-478
Wooldridge, J.M. (2002). Econometric Analysis of Cross Section and Panel Data, Cambridge: MIT Press.
Yim Soujin (2013). The Acquisitiveness of Youth: CEO Age and Acquisition Behavior, Journal of Financial
Economics, Vol. 108, Issue 1, pp. 250–273

34
Figure 1: Number of go-shop vs no-shop deals by year of announcement. The total number of deals per
year is shown for each of the years 2004-2011. For each year, the upper bar shows the number of go-shop
deals and the lower bar the number of no-shop deals.
Figure 2: Value of go-shop vs no-shop deals by year of announcement. The total dollar value of deals per
year is shown for each of the years 2004-2011. For each year, the upper bar shows the total value of go-
shop deals and the lower bar the total value of no-shop deals.
020
4060
Num
ber
2004 2005 2006 2007 2008 2009 2010 2011
Go-shop vs No-shop number of deals
No-Shop Go-Shop
01
0020
030
04
00V
alue
($bi
l)
2004 2005 2006 2007 2008 2009 2010 2011
Go-shop vs No-shop value of deals
No-Shop Go-Shop

35
Figure 3: Distribution of offer-premium for go-shop vs no-shop deals. The diagrams show a kernel density
function for the offer-premium for go-shop deals (dashed line) and no-shop deals (solid line). Panel (a)
shows the distribution for the offer premium defined using the 30-day pre-offer price and panel (b) shows
the distribution for the offer premium defined using the 5-day pre-offer price.
Panel (a)
Panel (b)
0.5
11
.52
Den
sity
-1 0 1 2 3 430-day offer premium
No Shop Go Shop
Kernel density function for offer premium based on 30-day closing price0
.51
1.5
22
.5D
ensi
ty
-1 0 1 2 35-day offer premium
No Shop Go Shop
Kernel density function for offer premium based on 5-day closing price

36
Figure 4: Distribution of the log of enterprise value for go-shops vs no-shops. The diagrams show a kernel
density function for the natural logarithm of enterprise value for go-shop deals (dashed line) and no-shop
deals (solid line).
Figure 5: Distribution of target 31-day CARs. The figure shows the distribution of cumulative abnormal
returns for the target for the period starting 15 days prior to the announcement date and extending to 15
days after the announcement date. The distributions are shown separately for go-shops (dashed line) and
no-shops (solid line).
0.0
5.1
.15
.2.2
5D
ensi
ty
0 5 10 15Natural log of enterprise value
No Shop Go Shop
Kernel density function for natural log of enterprise value
0.5
11.
52
2.5
Den
sity
-.5 0 .5 1 1.5CAR
No Shop Go Shop
Kernel density function for cumulative abnormal returns (31-day window)

37
Figure 6: Evolution of target CARs. The figure shows the evolution of cumulative abnormal returns for the
target for windows starting 15 days prior to the announcement date and eventually extending to 15 days
after the announcement date. CARs are shown separately for go-shops (dashed line) and no-shops (solid
line).

38
Table 1
Variable Definitions
VARIABLE DEFINITION
Go-Shop Merger agreement contains a go-shop provision
30-day pre-offer price Closing price 30 days prior to announcement
5-day pre-offer price Closing price 5 days prior to announcement
Offer premium* (Offer price divided by pre-offer price)-1
52wk High Offer Ratio* Highest value of target stock price for the 252 trading days before
the day at which the pre-offer price is measured, divided by pre-
offer price
Volatility* Annualized standard deviation of daily log returns over the period
extending 252 trading days back from the day at which the pre-
offer price is measured
Leverage* (Total debt) divided by [(number of shares outstanding)*(pre-offer
price)+(total debt)]
Acq_Termin_Fee Acquiror termination fee as a percentage of transaction value
Target_Termin_Fee Target termination fee as a percentage of transaction value
Auction An auction was conducted as determined by Merger Metrics
Management_Buyout The transaction was a management buyout
Large_Target The target’s log of enterprise value lies above the median
Total Owner. by 5% Holders > 20% Total percentage ownership by owners of at least 5% stakes is
greater than 20%
Largest Owner.>20% OR O&D Owner.>20% Ownership by largest shareholder or collective ownership by
officers and directors is greater than 20%
Number_O&D Number of officers and directors of the target
Financing_Condition The merger agreement contains a financing condition
Target_Adv_Fin The target’s financial advisor provided financing for the acquiror
Target_Adv_AcqServ The target’s financial advisor provided other services for the
acquiror
Legal_Adv_Rank The average of the total number of deals of the target’s legal
advisors over the three years prior to the year of announcement
lies above the upper quartile of the distribution
Multiple_Lawyers The target had multiple legal advisors
Special_Committee A special committee was formed
CAR [-t1,t2] Cumulative abnormal daily returns over the window which starts
t1 days before the announcement date and ends t2 days after the
announcement date. Daily abnormal returns are calculated using
the market model with parameters estimated over the period
which starts 268 days and ends 16 days prior to the
announcement day. The S&P 500 index return is the market return
Jumper Takes the value of 1 if either (a) there is a change in the cash
consideration offered due to a subsequent bid being placed or (b)
there is a change in the winning bidder, and 0 otherwise.
*The variable has alternative definitions using either the 5-day or the 30-day pre-offer price

39
Table 2
Sample Descriptive Statistics
This table presents descriptive statistics for a sample of acquisitions announced over the period January
1, 2004 to December 31, 2011 identified based on information set forth in the database of MergerMetrics,
which is a product of FactSet, where the target is a U.S. public company, the transaction reflects the
consideration set forth in the initially executed merger agreement between the target and acquiror,
consideration paid to the target shareholders was cash and was offered pursuant to a transaction whereby
public ownership in the target would cease, the acquiror was either a financial or private equity buyer,
the transaction was not pursuant to a tender offer and target had available each of the (a) merger
agreement and Merger Proxy Statement for the transaction and the most recent proxy statement for the
regularly scheduled annual meeting of shareholders on the EDGAR database of the SEC and (b) stock price
data. Definitions for the variables are shown in Table 1. Columns (1)-(6) show the mean, median, standard
deviation, minimum value, maximum value, and number of observations respectively.
Mean Median SD Min Max N
VARIABLE (1) (2) (3) (4) (5) (6)
Go-Shop 0.278 0 0.449 0 1 306
Offer premium based on 30-day closing price 0.334 0.244 0.482 -0.748 3.523 306
Offer premium based on 5-day closing price 0.304 0.225 0.388 -0.738 3.208 306
52wk High Offer Ratio 30 days prior to
announcement
1.487 1.183 1.199 1 16.88 306
52wk High Offer Ratio 5 days prior to announcement 1.426 1.169 0.794 1 8.652 306
Volatility 30 days prior to announcement 0.482 0.382 0.325 0.157 2.656 306
Volatility 5 days prior to announcement 0.478 0.375 0.322 0.164 2.543 306
Leverage based on 30-day closing price 0.221 0.123 0.249 0 0.927 306
Leverage based on 5-day closing price 0.220 0.128 0.248 0 0.924 306
Acq_Termin_Fee 0.0301 0.0275 0.0330 0 0.165 306
Target_Termin_Fee 0.0358 0.0326 0.0190 0 0.198 306
Auction 0.605 1 0.490 0 1 306
Management_Buyout 0.105 0 0.307 0 1 306
Enterprise Value ($mil) 2,308 529.8 8,222 0.300 123,345 306
Total Ownership by 5% Holders > 20% 0.866 1 0.341 0 1 306
Largest Owner.>20% OR O&D Owner.>20% 0.565 1 0.497 0 1 306
Number_O&D 12.75 12 4.251 4 34 306
Financing_Condition 0.229 0 0.421 0 1 306
Target_Adv_Fin 0.147 0 0.355 0 1 306
Target_Adv_AcqServ 0.490 0 0.501 0 1 306
Legal_Adv_Rank 0.225 0 0.419 0 1 306
Multiple_Lawyers 0.0980 0 0.298 0 1 306
Special_Committee 0.572 1 0.496 0 1 306

40
Table 3
Conditional Means Tests
This table presents t tests on the equality of means for a list of variables for a sample of acquisitions of
U.S. public companies, announced over the period January 1, 2004 to December 31, 2011. Definitions for
the variables are shown in Table 1 and sample selection is discussed in detail in Section III. Column (1)
shows the mean value of each variable within the group of deals with a no-shop provision, column (2)
shows the mean value within the group of deals with a go-shop provision, and column (3) shows the
difference in the means of the two groups tested against the null of equal means and assuming unequal
variances for the distributions of the two groups, ***, **, and * denote that the mean of deals with go-
shop provisions differs significantly from the mean of deals with no-shop provisions at the 1%, 5%, and
10% level, respectively.
NO-SHOP GO-SHOP DIFFERENCE
VARIABLE (1) (2) (3)
Offer premium based on 30-day closing price 0.3156 0.3834 0.0677
Offer premium based on 5-day closing price 0.2825 0.3615 0.0790
52wk High Offer Ratio 30 days prior to announcement 1.4536 1.5737 0.1201
52wk High Offer Ratio 5 days prior to announcement 1.3842 1.5355 0.1513
Volatility 30 days prior to announcement 0.4796 0.4870 0.0074
Volatility 5 days prior to announcement 0.4764 0.4812 0.0047
Leverage based on 30-day closing price 0.2054 0.2624 0.0570*
Leverage based on 5-day closing price 0.2039 0.2610 0.0571*
Acq_Termin_Fee 0.0277 0.0363 0.0086**
Target_Termin_Fee 0.0363 0.0344 -0.0019
Auction 0.7195 0.3059 -0.4136***
Management_Buyout 0.0905 0.1412 0.0507
Enterprise Value 2.0e+03 3.0e+03 939.8212
Total Ownership by 5% Holders > 20% 0.8914 0.8000 -0.0914*
Largest Owner.>20% OR O&D Owner.>20% 0.5973 0.4824 -0.1149*
Number_O&D 12.3394 13.8000 1.4606**
Financing_Condition 0.2579 0.1529 -0.1050**
Target_Adv_Fin 0.1538 0.1294 -0.0244
Target_Adv_AcqServ 0.4480 0.6000 0.1520**
Legal_Adv_Rank 0.1855 0.3294 0.1439**
Multiple_Lawyers 0.0814 0.1412 0.0597
Special_Committee 0.5294 0.6824 0.1529**

41
Table 4
OLS Estimates For The Offer Premium
This table shows the results of an OLS regression of the offer premium, for a sample of acquisitions of U.S.
public companies announced over the period January 1, 2004 to December 31, 2011. Definitions for the
variables are shown in Table 1 and sample selection is discussed in detail in Section III. The offer premium
is defined as the initial bid price divided by the pre-offer price, minus 1. Go-Shop is a variable that takes
the value of 1 if the merger agreement included a go-shop provision and 0 otherwise. In columns (1)-(2)
variables are defined using the closing price 30 days prior to the announcement date as the pre-offer
price. Column (1) reports the coefficients for the complete sample which includes MBOs and column (2)
for the subsample which excludes MBOs. Columns (3)-(4) repeat the estimations shown in columns (1)-
(2), using definitions of variables based on the closing price 5 days prior to the announcement date as the
pre-offer price. The regressions control for year fixed effects. Robust standard errors in parenthesis, ***,
**, and * indicate statistical significance at the 1%, 5%, and 10% level respectively.
DEFINITIONS BASED ON 30-DAY PRE-OFFER PRICE BASED ON 5-DAY PRE-OFFER PRICE
MANAGEMENT BUYOUTS INCLUDED EXCLUDED INCLUDED EXCLUDED
DEPENDENT VARIABLE: OFFER PREMIUM (1) (2) (3) (4)
Go-Shop -0.0133 -0.0751 -0.0029 -0.0638
(0.0696) (0.0575) (0.0619) (0.0492)
52wk_High_Ratio 0.1855*** 0.2029*** 0.1908*** 0.2333***
(0.0381) (0.0451) (0.0561) (0.0565)
Volatility 0.1691 0.1871* 0.2202** 0.2101**
(0.1134) (0.1118) (0.0944) (0.0927)
Acq_Termin_Fee 1.0929 0.5950 -0.2011 -0.6616
(0.9552) (0.9837) (0.7119) (0.6802)
Target_Termin_Fee -4.0819*** -3.1588*** -1.8065 -1.2222
(1.5482) (1.1630) (1.3453) (1.1002)
Leverage 0.3796*** 0.3208*** 0.2788*** 0.2164**
(0.1308) (0.1158) (0.1012) (0.0845)
Auction -0.0356 -0.0589 -0.0467 -0.0696**
(0.0411) (0.0422) (0.0334) (0.0338)
Management_Buyout 0.0140 0.0502
(0.1179) (0.0974)
Large_Target -0.0788 -0.0532 -0.0442 -0.0163
(0.0484) (0.0435) (0.0406) (0.0369)
Total Owner. by 5% Holders > 20% -0.0732 -0.0884 -0.0841* -0.0934*
(0.0546) (0.0566) (0.0473) (0.0499)
Largest Owner.>20% OR O&D Owner.>20% 0.0825 0.0450 0.0539 0.0223
(0.0557) (0.0508) (0.0464) (0.0404)
Number_O&D -0.0002 0.0019 -0.0024 0.0006
(0.0064) (0.0050) (0.0057) (0.0046)
Financing_Condition -0.1014 -0.0370 -0.0787 -0.0190
(0.0693) (0.0514) (0.0597) (0.0467)
Target_Adv_Fin -0.0128 -0.0045 -0.0001 0.0129
(0.0533) (0.0515) (0.0499) (0.0491)
Target_Adv_AcqServ 0.0384 0.0254 0.0473 0.0258
(0.0494) (0.0454) (0.0433) (0.0386)
Constant -0.0020 -0.0154 -0.0467 -0.0875
(0.1268) (0.1157) (0.1088) (0.1001)
Observations 306 274 306 274
Adjusted R-Squared 0.338 0.439 0.292 0.416

42
Table 5
Determinants Of The Go-Shop Decision
The table presents results for a probit regression analysis of the decision to include a go-shop provision in
the initial agreement, for a sample of acquisitions of U.S. public companies announced over the period
January 1, 2004 to December 31, 2011. Definitions for the variables are shown in Table 1 and sample
selection is discussed in detail in Section III. The dependent variable takes the value of 1 if the merger
agreement included a go-shop provision and 0 otherwise. In all definitions, the closing price 30 days prior
to the announcement date is used as the pre-offer price. Column (1) reports the coefficients for a model
which includes a full set of control variables, instruments, and year fixed effects, and column (2) reports
the coefficients for a parsimonious model which includes only the instruments and does not control for
year fixed effects. Both models are estimated over the complete sample which includes MBOs. Columns
(3) and (4) repeat the estimations shown in columns (1) and (2) respectively over the subsample which
excludes MBOs. Robust standard errors in parenthesis, ***, **, and * indicate statistical significance at
the 1%, 5%, and 10% level respectively.
MANAGEMENT BUYOUTS INCLUDED EXCLUDED
MODEL FULL INSTR. ONLY FULL INSTR. ONLY
DEPENDENT VARIABLE: GO-SHOP DECISION (1) (2) (3) (4)
Multiple_Lawyers 0.4113 0.4813* 0.3256 0.4240
(0.2880) (0.2467) (0.3123) (0.2625)
Legal_Adv_Rank 0.6116*** 0.5527*** 0.6530*** 0.5453***
(0.2330) (0.1820) (0.2515) (0.1879)
Special_Committee 0.6334*** 0.4975*** 0.6591*** 0.4549***
(0.2210) (0.1657) (0.2295) (0.1720)
52wk_High_Ratio 0.0110 -0.0060
(0.0711) (0.0671)
Volatility 0.2389 0.2111
(0.4200) (0.4170)
Acq_Termin_Fee 1.9033 -2.1261
(3.5393) (3.8073)
Target_Termin_Fee -2.7234 -9.3770
(5.2070) (7.0768)
Leverage -0.1667 0.0449
(0.4948) (0.5535)
Auction -1.5710*** -1.6545***
(0.2237) (0.2403)
Management_Buyout 0.3292
(0.3648)
Large_Target 0.5950** 0.5241*
(0.2410) (0.2738)
Total Owner. by 5% Holders > 20% 0.3057 0.3879
(0.2861) (0.3078)
Largest Owner.>20% OR O&D Owner.>20% -0.9647*** -1.1595***
(0.2719) (0.3333)
Number_O&D 0.0227 0.0470*
(0.0235) (0.0250)
Financing_Condition 0.4306 0.6059*
(0.3306) (0.3604)
Target_Adv_Fin 0.0934 0.1946
(0.2790) (0.2887)
Target_Adv_AcqServ 0.1414 0.0904
(0.2137) (0.2256)
Constant -2.2946*** -1.0773*** -2.5271*** -1.0654***
(0.6775) (0.1496) (0.7881) (0.1501)
Observations 306 306 274 274
Pseudo R-Squared 0.392 0.0514 0.422 0.0488

43
Table 6
2SLS Estimates For The Offer Premium
The table shows the results of a 2SLS estimation of the effect of the go-shop provision on the offer-premium for a
sample of acquisitions of U.S. public companies announced over the period January 1, 2004 to December 31, 2011.
Definitions for the variables are shown in Table 1 and sample selection is discussed in detail in Section III. We employ
a 2SLS methodology, adapted for the case of an endogenous binary variable and discussed in detail in the Appendix.
The dependent variable in the second stage is the offer premium, defined as the initial bid price divided by the pre-
offer price, minus 1. The endogenous variable is Go-Shop, and takes the value of 1 if the merger agreement included
a go-shop provision and 0 otherwise. In columns (1)-(2) variables are defined using the closing price 30 days prior to
the announcement date as the pre-offer price. Column (1) reports the coefficients for the complete sample which
includes MBOs and column (2) for the subsample which excludes MBOs. Columns (3)-(4) repeat the estimations
shown in columns (1)-(2), using definitions of variables based on the closing price 5 days prior to the announcement
date as the pre-offer price. All 2SLS regressions control for year fixed effects. Robust standard errors in parenthesis,
***, **, and * indicate statistical significance at the 1%, 5%, and 10% level respectively.
DEFINITIONS BASED ON 30-DAY PRE-OFFER PRICE BASED ON 5-DAY PRE-OFFER PRICE
MANAGEMENT BUYOUTS INCLUDED EXCLUDED INCLUDED EXCLUDED
DEPENDENT VARIABLE: OFFER PREMIUM (1) (2) (3) (4)
Go-Shop -0.3508** -0.2384* -0.2378* -0.1540
(0.1698) (0.1329) (0.1433) (0.1100)
52wk_High_Ratio 0.1872*** 0.2028*** 0.2029*** 0.2364***
(0.0393) (0.0443) (0.0532) (0.0551)
Volatility 0.1733 0.1896* 0.2087** 0.2072**
(0.1134) (0.1086) (0.0933) (0.0886)
Acq_Termin_Fee 1.0886 0.5120 -0.1880 -0.7012
(0.9688) (0.9573) (0.7152) (0.6565)
Target_Termin_Fee -4.0102** -3.3143*** -1.8293 -1.3195
(1.6234) (1.2224) (1.3964) (1.1113)
Leverage 0.3879*** 0.3325*** 0.2853*** 0.2233***
(0.1327) (0.1122) (0.1023) (0.0814)
Auction -0.1604** -0.1194** -0.1326** -0.1030**
(0.0758) (0.0557) (0.0640) (0.0437)
Management_Buyout 0.0418 0.0680
(0.1287) (0.1063)
Large_Target -0.0210 -0.0279 -0.0035 -0.0021
(0.0615) (0.0474) (0.0518) (0.0393)
Total Owner. by 5% Holders > 20% -0.0753 -0.0897* -0.0851* -0.0940**
(0.0530) (0.0534) (0.0444) (0.0471)
Largest Owner.>20% OR O&D Owner.>20% 0.0302 0.0210 0.0169 0.0088
(0.0490) (0.0496) (0.0381) (0.0385)
Number_O&D 0.0010 0.0033 -0.0014 0.0013
(0.0060) (0.0051) (0.0053) (0.0045)
Financing_Condition -0.0651 -0.0212 -0.0524 -0.0095
(0.0650) (0.0516) (0.0539) (0.0457)
Target_Adv_Fin -0.0312 -0.0123 -0.0124 0.0088
(0.0567) (0.0503) (0.0509) (0.0468)
Target_Adv_AcqServ 0.0551 0.0299 0.0574 0.0280
(0.0537) (0.0436) (0.0461) (0.0367)
Constant 0.0366 0.0053 -0.0276 -0.0788
(0.1238) (0.1102) (0.1059) (0.0963)
Observations 306 274 306 274
Centered R-Squared 0.321 0.464 0.295 0.452
Anderson-Rubin Wald (signif. of endogenous, pval) 0.0292 0.0686 0.0873 0.163
Kleibergen-Paap rk LM (underid, pval) 6.67e-11 1.97e-10 5.71e-11 1.56e-10
Kleibergen-Paap rk Wald F (weakid, stat) 67.45 60.55 68.13 61.29
Stock-Yogo 10% maximal IV size (weakid, critical val) 16.38 16.38 16.38 16.38

44
Table 7
2SLS Estimates For The Offer Premium With Instruments Treated as Controls The table shows the results of a 2SLS estimation of the effect of the go-shop provision on the offer-premium for a sample of acquisitions of U.S.
public companies announced over the period January 1, 2004 to December 31, 2011. Definitions for the variables are shown in Table 1 and sample
selection is discussed in detail in Section III. We employ a 2SLS methodology, adapted for the case of an endogenous binary variable and discussed
in detail in the Appendix. Instrumental variables are also treated as controls, and the estimator thus relies solely on the non-linearity of the probit
stage for identification. The dependent variable in the second stage is the offer premium, defined as the initial bid price divided by the pre-offer
price, minus 1. The endogenous variable is Go-Shop, and takes the value of 1 if the merger agreement included a go-shop provision and 0
otherwise. All variables are defined using the closing price 30 days prior to the announcement date as the pre-offer price. Column (1) reports the
coefficients for the complete sample which includes MBOs and column (2) for the subsample which excludes MBOs. Columns (3)-(4) repeat the
estimations shown in columns (1)-(2), using a parsimonious model in the linear stages, but a full model in the probit stage. All 2SLS regressions
control for year fixed effects. Robust standard errors in parenthesis, ***, **, and * indicate statistical significance at the 1%, 5%, and 10% level
respectively.
MODEL FULL PARSIMONIOUS
MANAGEMENT BUYOUTS INCLUDED EXCLUDED INCLUDED EXCLUDED
DEPENDENT VARIABLE: OFFER PREMIUM (1) (2) (3) (4)
Go-Shop -0.2187 -0.1315 -0.2932** -0.1847
(0.1678) (0.1321) (0.1373) (0.1146)
Legal_Adv_Rank -0.0784* -0.0749 -0.0369 -0.0457
(0.0475) (0.0468) (0.0458) (0.0429)
Multiple_Lawyers -0.1013** -0.0912* -0.0864* -0.0832*
(0.0491) (0.0480) (0.0474) (0.0476)
Special_Committee -0.0233 -0.0298 -0.0166 -0.0285
(0.0444) (0.0395) (0.0439) (0.0391)
fiftytwo_week_high_ratio 0.1854*** 0.2026*** 0.1899*** 0.2040***
(0.0381) (0.0435) (0.0405) (0.0450)
volatility 0.1678 0.1826* 0.1343 0.1628
(0.1094) (0.1072) (0.1036) (0.0990)
Acq_Termin_Fee 1.0832 0.5570
(0.9480) (0.9410)
Target_Termin_Fee -3.9941** -3.1376*** -4.1526*** -3.3784***
(1.6041) (1.1672) (1.5052) (1.1599)
leverage 0.3910*** 0.3350*** 0.4181*** 0.3428***
(0.1295) (0.1118) (0.1475) (0.1152)
Auction -0.1190 -0.0883 -0.1508** -0.1068*
(0.0736) (0.0560) (0.0732) (0.0560)
Management_Buyout 0.0282
(0.1228)
Large_Target -0.0261 -0.0255
(0.0596) (0.0466)
Total Ownership by 5% Holders > 20% -0.0898* -0.1026* -0.0766 -0.0965*
(0.0541) (0.0560) (0.0556) (0.0566)
Largest Owner.>20% OR O&D Owner.>20% 0.0581 0.0473
(0.0496) (0.0507)
Number_O&D 0.0010 0.0030
(0.0058) (0.0050)
Financing_Condition -0.0831 -0.0342
(0.0633) (0.0512)
Target_Adv_Fin -0.0270 -0.0111
(0.0535) (0.0492)
Target_Adv_AcqServ 0.0648 0.0413
(0.0559) (0.0462)
Constant 0.0543 0.0179 0.0754 0.0772
(0.1219) (0.1120) (0.1024) (0.0985)
Observations 306 274 306 274
Centered R-Squared 0.369 0.488 0.333 0.475
Anderson-Rubin Wald (signif. of endogenous, pval) 0.179 0.316 0.0271 0.106
Kleibergen-Paap rk LM (underid, pval) 1.03e-09 2.47e-09 0 0
Kleibergen-Paap rk Wald F (weakid, stat) 53.58 47.71 96.47 92.12
Stock-Yogo 10% maximal IV size (weakid, critical val) 16.38 16.38 16.38 16.38

45
Table 8
2SLS Estimates For The Probability of a “Jumper”
The table shows the results of a 2SLS estimation of the effect of the go-shop provision on the probability of a jumper
for a sample of acquisitions of U.S. public companies announced over the period January 1, 2004 to December 31,
2011. Definitions for the variables are shown in Table 1 and sample selection is discussed in detail in Section III. We
employ a 2SLS methodology, adapted for the case of an endogenous binary variable and discussed in detail in the
Appendix. The dependent variable in the second stage is the jumper dummy, which takes the value of 1 if either (a)
there is a change in the cash consideration offered due to a subsequent bid being placed or (b) there is a change in
the winning bidder, and 0 otherwise. The endogenous variable is Go-Shop, and takes the value of 1 if the merger
agreement included a go-shop provision and 0 otherwise. Variables are defined using the closing price 30 days prior
to the announcement date as the pre-offer price. Column (1) reports the coefficients for the complete sample which
includes MBOs and column (2) for the subsample which excludes MBOs. All 2SLS regressions control for year fixed
effects. Robust standard errors in parenthesis, ***, **, and * indicate statistical significance at the 1%, 5%, and 10%
level respectively.
MANAGEMENT BUYOUTS INCLUDED EXCLUDED
DEPENDENT VARIABLE: PROBABILITY OF A JUMPER (1) (2)
Go-Shop 0.0419 0.0348
(0.0976) (0.1068)
52wk_High_Ratio 0.0040 -0.0028
(0.0095) (0.0083)
Volatility -0.0718* -0.0712*
(0.0368) (0.0375)
Acq_Termin_Fee -0.4597 -0.8521*
(0.5419) (0.4901)
Target_Termin_Fee -0.1927 -0.1309
(0.9048) (1.0034)
Leverage 0.0443 0.0003
(0.0585) (0.0561)
Auction -0.0377 -0.0523
(0.0442) (0.0446)
Management_Buyout 0.0115
(0.0493)
Large_Target -0.0593 -0.0254
(0.0433) (0.0396)
Total Owner. by 5% Holders > 20% -0.0340 -0.0441
(0.0566) (0.0615)
Largest Owner.>20% OR O&D Owner.>20% -0.0743** -0.0642*
(0.0362) (0.0341)
Number_O&D 0.0003 0.0002
(0.0048) (0.0053)
Financing_Condition 0.0120 0.0196
(0.0373) (0.0432)
Target_Adv_Fin -0.0142 -0.0175
(0.0374) (0.0391)
Target_Adv_AcqServ 0.0258 0.0211
(0.0358) (0.0380)
Constant 0.2098 0.1909
(0.1288) (0.1325)
Observations 306 274
Centered R-Squared 0.0602 0.0700
Anderson-Rubin Wald (signif. of endogenous, pval) 0.668 0.745
Kleibergen-Paap rk LM (underid, pval) 6.67e-11 1.97e-10
Kleibergen-Paap rk Wald F (weakid, stat) 67.45 60.55
Stock-Yogo 10% maximal IV size (weakid, critical val) 16.38 16.38

46
Table 9
Conditional means tests for target CARs
This table presents t tests on the equality of means for target CARs for a sample of acquisitions of U.S.
public companies, announced over the period January 1, 2004 to December 31, 2011. Definitions for the
variables are shown in Table 1 and sample selection is discussed in detail in Section III. Daily abnormal
returns are calculated using the market model with parameters estimated over the period which starts
268 days and ends 16 days prior to the announcement day. The S&P 500 index return is the market return.
The CARs are computed over the windows indicated in the square brackets, with the numbers indicating
days from the announcement date. Day 0 corresponds to the announcement dates, negative numbers
indicate days prior to the announcement date and positive numbers days after the announcement date.
Column (1) shows the mean value of each variable within the group of deals with a no-shop provision,
column (2) shows the mean value within the group of deals with a go-shop provision, and column (3)
shows the difference in the means of the two groups tested against the null of equal means and assuming
unequal variances for the distributions of the two groups, ***, **, and * denote that the mean of deals
with go-shop provisions differs significantly from the mean of deals with no-shop provisions at the 1%,
5%, and 10% level, respectively.
VARIABLE NO-SHOP GO-SHOP DIFFERENCE
(1) (2) (3)
CAR [-15,15] 0.1835 0.2303 0.0469**
CAR [-15,-1] 0.0204 0.0111 -0.0093**
CAR [0,15] 0.1631 0.2192 0.0561*
CAR [-5,5] 0.1812 0.2195 0.0383*
CAR [-5,-1] 0.0174 -0.0016 -0.0189*
CAR [0,5] 0.1638 0.2211 0.0573**
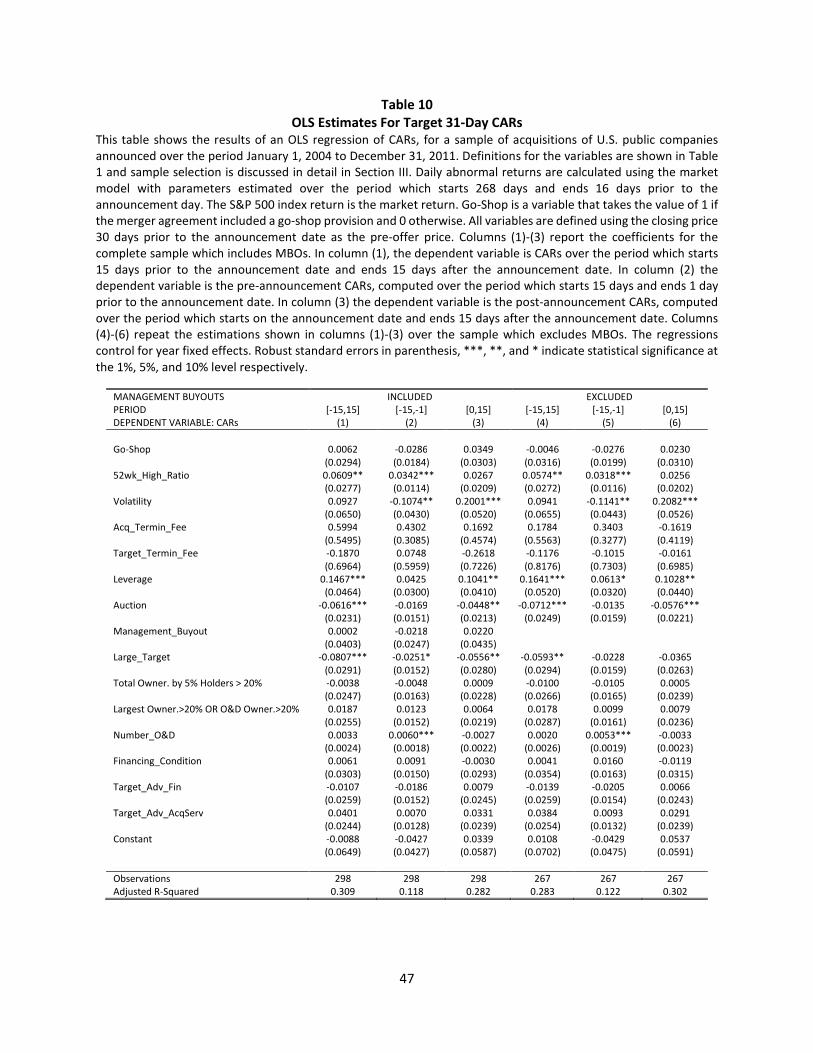
47
Table 10
OLS Estimates For Target 31-Day CARs
This table shows the results of an OLS regression of CARs, for a sample of acquisitions of U.S. public companies
announced over the period January 1, 2004 to December 31, 2011. Definitions for the variables are shown in Table
1 and sample selection is discussed in detail in Section III. Daily abnormal returns are calculated using the market
model with parameters estimated over the period which starts 268 days and ends 16 days prior to the
announcement day. The S&P 500 index return is the market return. Go-Shop is a variable that takes the value of 1 if
the merger agreement included a go-shop provision and 0 otherwise. All variables are defined using the closing price
30 days prior to the announcement date as the pre-offer price. Columns (1)-(3) report the coefficients for the
complete sample which includes MBOs. In column (1), the dependent variable is CARs over the period which starts
15 days prior to the announcement date and ends 15 days after the announcement date. In column (2) the
dependent variable is the pre-announcement CARs, computed over the period which starts 15 days and ends 1 day
prior to the announcement date. In column (3) the dependent variable is the post-announcement CARs, computed
over the period which starts on the announcement date and ends 15 days after the announcement date. Columns
(4)-(6) repeat the estimations shown in columns (1)-(3) over the sample which excludes MBOs. The regressions
control for year fixed effects. Robust standard errors in parenthesis, ***, **, and * indicate statistical significance at
the 1%, 5%, and 10% level respectively.
MANAGEMENT BUYOUTS INCLUDED EXCLUDED
PERIOD [-15,15] [-15,-1] [0,15] [-15,15] [-15,-1] [0,15]
DEPENDENT VARIABLE: CARs (1) (2) (3) (4) (5) (6)
Go-Shop 0.0062 -0.0286 0.0349 -0.0046 -0.0276 0.0230
(0.0294) (0.0184) (0.0303) (0.0316) (0.0199) (0.0310)
52wk_High_Ratio 0.0609** 0.0342*** 0.0267 0.0574** 0.0318*** 0.0256
(0.0277) (0.0114) (0.0209) (0.0272) (0.0116) (0.0202)
Volatility 0.0927 -0.1074** 0.2001*** 0.0941 -0.1141** 0.2082***
(0.0650) (0.0430) (0.0520) (0.0655) (0.0443) (0.0526)
Acq_Termin_Fee 0.5994 0.4302 0.1692 0.1784 0.3403 -0.1619
(0.5495) (0.3085) (0.4574) (0.5563) (0.3277) (0.4119)
Target_Termin_Fee -0.1870 0.0748 -0.2618 -0.1176 -0.1015 -0.0161
(0.6964) (0.5959) (0.7226) (0.8176) (0.7303) (0.6985)
Leverage 0.1467*** 0.0425 0.1041** 0.1641*** 0.0613* 0.1028**
(0.0464) (0.0300) (0.0410) (0.0520) (0.0320) (0.0440)
Auction -0.0616*** -0.0169 -0.0448** -0.0712*** -0.0135 -0.0576***
(0.0231) (0.0151) (0.0213) (0.0249) (0.0159) (0.0221)
Management_Buyout 0.0002 -0.0218 0.0220
(0.0403) (0.0247) (0.0435)
Large_Target -0.0807*** -0.0251* -0.0556** -0.0593** -0.0228 -0.0365
(0.0291) (0.0152) (0.0280) (0.0294) (0.0159) (0.0263)
Total Owner. by 5% Holders > 20% -0.0038 -0.0048 0.0009 -0.0100 -0.0105 0.0005
(0.0247) (0.0163) (0.0228) (0.0266) (0.0165) (0.0239)
Largest Owner.>20% OR O&D Owner.>20% 0.0187 0.0123 0.0064 0.0178 0.0099 0.0079
(0.0255) (0.0152) (0.0219) (0.0287) (0.0161) (0.0236)
Number_O&D 0.0033 0.0060*** -0.0027 0.0020 0.0053*** -0.0033
(0.0024) (0.0018) (0.0022) (0.0026) (0.0019) (0.0023)
Financing_Condition 0.0061 0.0091 -0.0030 0.0041 0.0160 -0.0119
(0.0303) (0.0150) (0.0293) (0.0354) (0.0163) (0.0315)
Target_Adv_Fin -0.0107 -0.0186 0.0079 -0.0139 -0.0205 0.0066
(0.0259) (0.0152) (0.0245) (0.0259) (0.0154) (0.0243)
Target_Adv_AcqServ 0.0401 0.0070 0.0331 0.0384 0.0093 0.0291
(0.0244) (0.0128) (0.0239) (0.0254) (0.0132) (0.0239)
Constant -0.0088 -0.0427 0.0339 0.0108 -0.0429 0.0537
(0.0649) (0.0427) (0.0587) (0.0702) (0.0475) (0.0591)
Observations 298 298 298 267 267 267
Adjusted R-Squared 0.309 0.118 0.282 0.283 0.122 0.302

48
Table 11
2SLS Estimates For Target 31-day CARs The table shows the results of a 2SLS estimation of the effect of the go-shop provision on CARs for a sample of acquisitions of
U.S. public companies announced over the period January 1, 2004 to December 31, 2011. Definitions for the variables are shown
in Table 1 and sample selection is discussed in detail in Section III. We employ a 2SLS methodology, adapted for the case of an
endogenous binary variable and discussed in detail in Section IV. The dependent variable in the second stage is CARs. Daily
abnormal returns are calculated using the market model with parameters estimated over the period which starts 268 days and
ends 16 days prior to the announcement day. The S&P 500 index return is the market return. The endogenous variable is Go-
Shop, and takes the value of 1 if the merger agreement included a go-shop provision and 0 otherwise. All variables are defined
using the closing price 30 days prior to the announcement date as the pre-offer price. Columns (1)-(3) report the coefficients for
the complete sample which includes MBOs. In column (1), the dependent variable is CARs over the period which starts 15 days
prior to the announcement date and ends 15 days after the announcement date. In column (2) the dependent variable is the pre-
announcement CARs, computed over the period which starts 15 days and ends 1 day prior to the announcement date. In column
(3) the dependent variable is the post-announcement CARs, computed over the period which starts on the announcement date
and ends 15 days after the announcement date. Columns (4)-(6) repeat the estimations shown in columns (1)-(3) over the sample
which excludes MBOs. The regressions control for year fixed effects. Robust standard errors in parenthesis, ***, **, and * indicate
statistical significance at the 1%, 5%, and 10% level respectively.
MANAGEMENT BUYOUTS INCLUDED EXCLUDED
PERIOD [-15,15] [-15,-1] [0,15] [-15,15] [-15,-1] [0,15]
DEPENDENT VARIABLE: CARs (1) (2) (3) (4) (5) (6)
Go-Shop 0.0128 0.0137 -0.0009 0.0239 0.0286 -0.0047
(0.0638) (0.0446) (0.0618) (0.0698) (0.0472) (0.0645)
52wk_High_Ratio 0.0609** 0.0343*** 0.0266 0.0578** 0.0324*** 0.0253
(0.0266) (0.0109) (0.0205) (0.0260) (0.0114) (0.0195)
Volatility 0.0925 -0.1086** 0.2011*** 0.0930 -0.1163*** 0.2093***
(0.0624) (0.0427) (0.0513) (0.0628) (0.0450) (0.0519)
Acq_Termin_Fee 0.5987 0.4254 0.1733 0.1886 0.3604 -0.1718
(0.5273) (0.2992) (0.4433) (0.5360) (0.3198) (0.3976)
Target_Termin_Fee -0.1782 0.1317 -0.3100 -0.0082 0.1143 -0.1225
(0.6712) (0.5599) (0.6943) (0.8072) (0.6693) (0.6926)
Leverage 0.1464*** 0.0411 0.1054*** 0.1613*** 0.0559* 0.1054**
(0.0450) (0.0293) (0.0395) (0.0510) (0.0319) (0.0419)
Auction -0.0592** -0.0009 -0.0583** -0.0606* 0.0073 -0.0679**
(0.0299) (0.0194) (0.0272) (0.0319) (0.0206) (0.0276)
Management_Buyout -0.0003 -0.0251 0.0248
(0.0390) (0.0242) (0.0425)
Large_Target -0.0819*** -0.0328** -0.0492* -0.0636** -0.0313* -0.0323
(0.0293) (0.0161) (0.0290) (0.0298) (0.0162) (0.0271)
Total Owner. by 5% Holders > 20% -0.0040 -0.0056 0.0017 -0.0106 -0.0118 0.0011
(0.0237) (0.0153) (0.0216) (0.0255) (0.0155) (0.0226)
Largest Owner.>20% OR O&D Owner.>20% 0.0197 0.0184 0.0013 0.0216 0.0175 0.0041
(0.0256) (0.0158) (0.0226) (0.0286) (0.0165) (0.0236)
Number_O&D 0.0032 0.0058*** -0.0026 0.0017 0.0048** -0.0031
(0.0024) (0.0018) (0.0021) (0.0026) (0.0020) (0.0023)
Financing_Condition 0.0055 0.0052 0.0003 0.0019 0.0118 -0.0099
(0.0288) (0.0152) (0.0289) (0.0331) (0.0158) (0.0305)
Target_Adv_Fin -0.0103 -0.0163 0.0060 -0.0126 -0.0179 0.0053
(0.0250) (0.0146) (0.0236) (0.0248) (0.0146) (0.0232)
Target_Adv_AcqServ 0.0398* 0.0050 0.0348 0.0378 0.0080 0.0298
(0.0234) (0.0126) (0.0231) (0.0242) (0.0129) (0.0227)
Constant -0.0098 -0.0491 0.0393 0.0047 -0.0549 0.0596
(0.0628) (0.0403) (0.0561) (0.0679) (0.0449) (0.0569)
Observations 298 298 298 267 267 267
Centered R-Squared 0.360 0.165 0.331 0.338 0.161 0.355
Anderson-Rubin Wald (signif. of endogenous, pval) 0.841 0.758 0.989 0.731 0.540 0.942
Kleibergen-Paap rk LM (underid, pval) 0 0 0 9.02e-11 9.02e-11 9.02e-11
Kleibergen-Paap rk Wald F (weakid, stat) 74.73 74.73 74.73 67.10 67.10 67.10
Stock-Yogo 10% maximal IV size (weakid, critical
val)
16.38 16.38 16.38 16.38 16.38 16.38

49
Appendix: Methodology and Additional Tables
2SLS Methodology Adjusted for a Binary Endogenous Variable
The 2SLS estimation method consists of two linear stages, the first modeling the go-shop decision
and the second using the fitted values from the first stage to estimate the exogenous effect of the go-
shop decision on the offer premium. More concretely, in the first stage we estimate the specification
shown in Equation (2), where the go-shop decision is modeled as a linear equation, which includes a set
of control variables ( , ) and exogenous instruments ( ):
(2)
Controls are defined as variables that affect both the go-shop decision and the acquisition
premium. Instruments are assumed only to affect the go-shop decision; instruments only matter for the
acquisition premium through their effect on the go-shop decision. For each deal, this linear first stage
would yield estimates of the probability of including a go-shop decision, and this projected probability (
) would be used in the place of the go-shop dummy in the second stage, which models the offer
premium. The second stage is shown in Equation (3), where the exogenous effect of the go-shop provision
on the offer premium is captured by the estimated value of :
(3)
The go-shop decision is a binary variable, and although we could model this variable using a linear
equation as described above, we can greatly improve the fit and efficiency of 2SLS by employing the use
of a non-linear binary choice model such as the probit model for the first-stage regression. As in the linear
case, we estimate the probit model using as explanatory variables a set of control variables that are
common to the first and second stage, as well as one or more instrumental variables. The specification
we use is shown in Equation (4), where is the indicator function and is a normally distributed error
term:
tα itControls itsInstrument
itititti wsInstrumentControlsGO +⋅+⋅+= µδα
∧
iGO
β
itititit uControlsGOOP +⋅+⋅+=∧
γβκ
( ).I itε
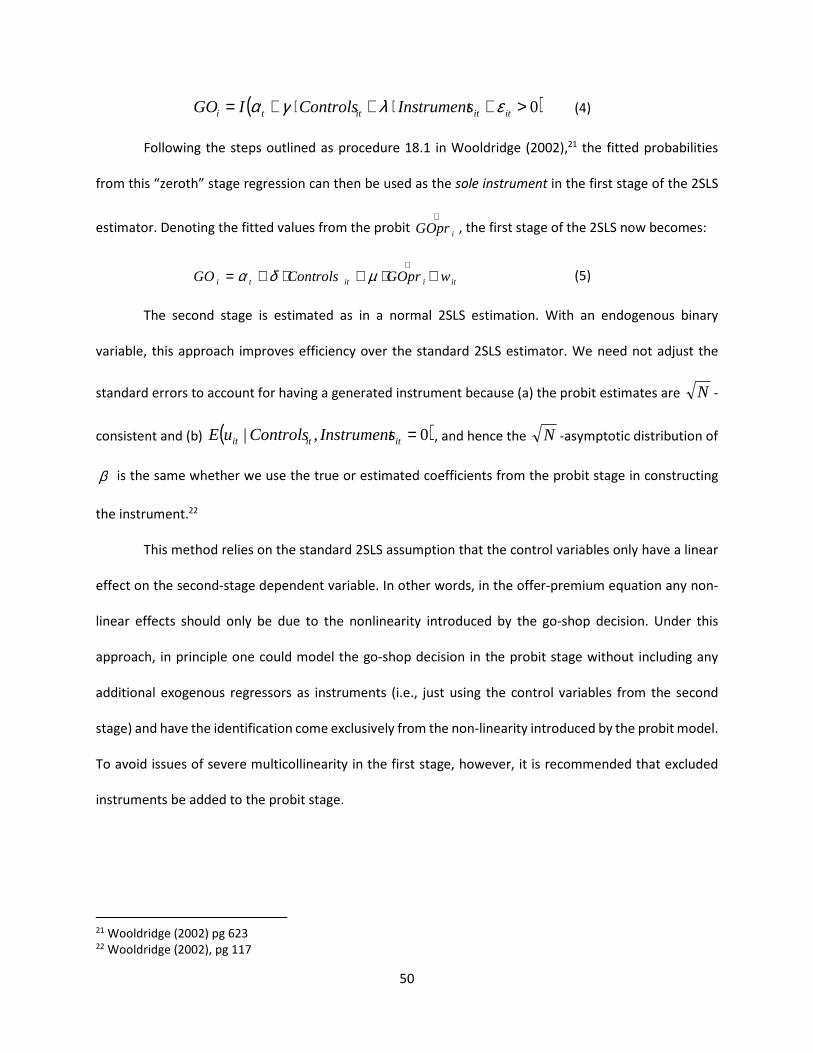
50
(4)
Following the steps outlined as procedure 18.1 in Wooldridge (2002),21 the fitted probabilities
from this “zeroth” stage regression can then be used as the sole instrument in the first stage of the 2SLS
estimator. Denoting the fitted values from the probit , the first stage of the 2SLS now becomes:
(5)
The second stage is estimated as in a normal 2SLS estimation. With an endogenous binary
variable, this approach improves efficiency over the standard 2SLS estimator. We need not adjust the
standard errors to account for having a generated instrument because (a) the probit estimates are -
consistent and (b) , and hence the -asymptotic distribution of
is the same whether we use the true or estimated coefficients from the probit stage in constructing
the instrument.22
This method relies on the standard 2SLS assumption that the control variables only have a linear
effect on the second-stage dependent variable. In other words, in the offer-premium equation any non-
linear effects should only be due to the nonlinearity introduced by the go-shop decision. Under this
approach, in principle one could model the go-shop decision in the probit stage without including any
additional exogenous regressors as instruments (i.e., just using the control variables from the second
stage) and have the identification come exclusively from the non-linearity introduced by the probit model.
To avoid issues of severe multicollinearity in the first stage, however, it is recommended that excluded
instruments be added to the probit stage.
21 Wooldridge (2002) pg 623 22 Wooldridge (2002), pg 117
( )0>+⋅+⋅+= itititti sInstrumentControlsIGO ελγα
∧
iGOpr
itiitti wGOprControlsGO +⋅+⋅+=∧
µδα
N
( )0,| =ititit sInstrumentControlsuE N
β

51
Two-Step Heckman Estimator
As an additional robustness test, we estimate the exogenous effect of the go-shop provision on
the offer premium and CARs using a Heckman estimator.23
If we think of the go-shop decision as the treatment variable, the bias we are concerned with
arises from the fact that assignment to the treated (go-shop) and untreated (no-shop) groups may not be
random and thus potentially endogenous to the outcome variable (offer premium or CARs). Similar to the
2SLS case, we can think of two stages, an assignment first stage and a primary second stage as shown in
Equations (6) and (7) respectively:
(6)
(7)
In this setting, the endogeneity of the go-shop variable in the offer premium equation arises from a
correlation between the error terms of the first and second stages. The Heckman estimator employs a
control function approach in which the nature of the endogeneity is explicitly modeled in the second
stage. In particular, after estimating the non-linear first stage, we include the generalized probit residual
as an additional control in the second stage. Defining as in Equation (8) and allowing for the covariance
between the error terms in the two stages to differ between the treated and untreated groups24, the
augmented second stage used in this approach is shown in Equation (9). In this framework, consistently
estimates the exogenous effect of the go-shop provision on the offer premium.
(8)
23 See Vella and Verbeek (1999) for a detailed discussion of the similarities between the IV and Heckman approach. 24 The results remain unchanged if we assume the treated and untreated groups to have equal covariances
between the error terms of the two stages.
( )0>+⋅+⋅+= itititti sInstrumentControlsIGO ελγα
itititit uControlsGOOP +⋅+⋅+= γβκ
itZ
β
itittit sInstrumentControlsZ ⋅+⋅+= λγα

52
(9)
The estimation method proceeds in two stages. We first estimate the decision to include a go-
shop provision in the merger agreement using a probit model with a full set of controls, including variables
capturing exogenous litigation risk aversion (the instruments). We then add the generalized probit
residuals from this first stage (_wL1, _wL0) as additional controls in the second stage.
The results are shown for samples including or excluding management buyouts, and for full or
parsimonious specifications of the offer-premium equation. Regressions control for year fixed effects.
Bootstrapped standard errors are computed over 500 iterations. Appendix Table A1 displays the Heckman
estimates for the 30-day premium using samples including or excluding MBOs, and for full and
parsimonious specifications. Note that the corresponding probit stage always includes the full list of
controls and the instruments. As can be seen, the results are qualitatively unchanged when compared to
the ones obtained employing the 2SLS approach. The Heckman estimates also remain unchanged for the
5-day premium, as shown in columns (3)-(4) of Appendix Table A1.
We also repeat our tests for CARs using the Heckman estimator. Appendix Table A2 shows the
results for the three CAR periods. Columns (1)-(3) show estimates for the complete sample and columns
(4)-(6) show estimates for the sample that excludes MBOs. The estimates are very similar to those
obtained using the 2SLS estimator. In unreported regressions we show that the results remain
qualitatively unchanged if we estimate the effect over an 11-day window instead.
Construction of the lawyer rank variable
To construct the rank variable, we first compute the total number of deals that each legal advisor
was involved in over the three-year period prior to the year of announcement of the acquisition. We then
create a variable (avgdeals) which averages these deals over all of the legal advisors involved in each
particular acquisition. Finally, we construct a dummy variable (Legal_Adv_Rank) which assumes the value
( )( )
( )( ) ( ) iti
it
iti
it
itititit uGO
Z
ZGO
Z
ZControlsGOOP +−⋅
−Φ−
+⋅−Φ−
−+⋅+⋅+= 1
1 01
φωφωγβκ

53
of 1 if the value of avgdeals for the particular acquisition exceeds a predefined threshold. The threshold
we use is the upper quartile of the distribution of avgdeals over all acquisitions that were announced
during the same year. 25
25 We have experimented with different definitions of this variable involving the value of the deals instead of the
number of deals, the maximum value of deals instead of the average for each acquisition, and using alternative
threshold rules such as the mean and median of the distribution. The definition that created the strongest
instrument was the one using the number of deals, averaged over the legal advisors involved in the acquisition, and
compared against the upper quartile of the distribution.

54
Appendix Table A1
Heckman Estimates For The Offer Premium The table shows the results of a Heckman estimation of the effect of the go-shop provision on the offer-premium for a sample of
acquisitions of U.S. public companies announced over the period January 1, 2004 to December 31, 2011. Definitions for the
variables are shown in Table 1 and sample selection is discussed in detail in Section III. We employ a Heckman estimator discussed
in detail in the Appendix. The dependent variable in the second stage is the offer premium, defined as the initial bid price divided
by the pre-offer price, minus 1. The selection variable is Go-Shop, and takes the value of 1 if the merger agreement included a
go-shop provision and 0 otherwise. In all definitions the closing price 30 days prior to the announcement date is used as the pre-
offer price. We first estimate the decision to include a go-shop provision in the initial agreement using a probit model with a full
set of controls, including variables capturing exogenous litigation risk aversion, shown in Column 1 of Table 5. We then add the
generalized probit residuals from this first stage (_wL1, _wL0) as additional controls and estimate the second stage. In columns
(1)-(2) variables are defined using the closing price 30 days prior to the announcement date as the pre-offer price. Column (1)
reports the coefficients for the complete sample which includes MBOs and column (2) for the subsample which excludes MBOs.
Columns (3)-(4) repeat the estimations shown in columns (1)-(2), using definitions of variables based on the closing price 5 days
prior to the announcement date as the pre-offer price. All regressions control for year fixed effects. Standard errors in
parenthesis, bootstrapped over 500 iterations, ***, **, and * indicate statistical significance at the 1%, 5%, and 10% level
respectively.
DEFINITIONS BASED ON 30-DAY PRE-OFFER PRICE BASED ON 5-DAY PRE-OFFER PRICE
MANAGEMENT BUYOUTS INCLUDED EXCLUDED INCLUDED EXCLUDED
DEPENDENT VARIABLE: OFFER PREMIUM (1) (2) (3) (4)
Go-Shop -0.4054** -0.2920** -0.2724** -0.1809
(0.1730) (0.1336) (0.1378) (0.1164)
52wk_High_Ratio 0.1874*** 0.2035** 0.2046*** 0.2383***
(0.0681) (0.0802) (0.0654) (0.0669)
Volatility 0.1753 0.1862 0.2019* 0.1970*
(0.1275) (0.1325) (0.1078) (0.1115)
Acq_Termin_Fee 1.0749 0.5387 -0.0987 -0.5335
(0.9317) (0.9678) (0.7525) (0.7150)
Target_Termin_Fee -4.0059** -3.3510*** -1.7653 -1.2972
(1.6760) (1.1701) (1.4077) (1.2786)
Leverage 0.3902*** 0.3330*** 0.2788*** 0.2127**
(0.1388) (0.1164) (0.1026) (0.0847)
Auction -0.1814** -0.1368** -0.1397** -0.1050**
(0.0729) (0.0603) (0.0636) (0.0476)
Management_Buyout 0.0473 0.0645
(0.1218) (0.1003)
Large_Target -0.0108 -0.0224 -0.0035 -0.0073
(0.0611) (0.0490) (0.0509) (0.0424)
Total Ownership by 5% Holders > 20% -0.0753 -0.0915 -0.0875* -0.0988*
(0.0560) (0.0610) (0.0472) (0.0505)
Largest Owner.>20% OR O&D Owner.>20% 0.0210 0.0158 0.0170 0.0138
(0.0527) (0.0518) (0.0463) (0.0424)
Number_O&D 0.0012 0.0036 -0.0014 0.0013
(0.0062) (0.0053) (0.0054) (0.0047)
Financing_Condition -0.0590 -0.0165 -0.0498 -0.0092
(0.0691) (0.0531) (0.0562) (0.0487)
Target_Adv_Fin -0.0339 -0.0155 -0.0157 0.0060
(0.0580) (0.0527) (0.0506) (0.0488)
Target_Adv_AcqServ 0.0579 0.0314 0.0589 0.0287
(0.0540) (0.0476) (0.0460) (0.0378)
_wL1 0.2546* 0.1590* 0.2071* 0.1218*
(0.1347) (0.0822) (0.1196) (0.0698)
_wL0 -0.2650** -0.1269 -0.1318 -0.0107
(0.1303) (0.1093) (0.1003) (0.0885)
Constant 0.0437 0.0102 -0.0317 -0.0826
(0.1545) (0.1353) (0.1192) (0.1109)
Observations 306 274 306 274
Adjusted R-Squared 0.349 0.442 0.302 0.419

55
Appendix Table A2
Heckman Estimates For Target 31-Day CARs The table shows the results of a Heckman estimation of the effect of the go-shop provision on CARs for a sample of acquisitions of U.S. public
companies announced over the period January 1, 2004 to December 31, 2011. Definitions for the variables are shown in Table 1 and sample
selection is discussed in detail in Section III. We employ a Heckman estimator discussed in detail in the Appendix. The dependent variable in the
second stage is CARs. Daily abnormal returns are calculated using the market model with parameters estimated over the period which starts 268
days and ends 16 days prior to the announcement day. The S&P 500 index return is the market return. The selection variable is Go-Shop, and
takes the value of 1 if the merger agreement included a go-shop provision and 0 otherwise. In all definitions the closing price 30 days prior to the
announcement date is used as the pre-offer price. We first estimate the decision to include a go-shop provision in the initial agreement using a
probit model with a full set of controls, including variables capturing exogenous litigation risk aversion, shown in column 1 of Table 5. We then
add the generalized probit residuals from this first stage (_wL1, _wL0) as additional controls and estimate the second stage. Columns (1)-(3)
report second stage coefficients estimated over the complete sample which includes MBOs. In column (1), the dependent variable is CARs over
the period which starts 15 days prior to the announcement date and ends 15 days after the announcement date. In column (2) the dependent
variable is the pre-announcement CARs, computed over the period which starts 15 days and ends 1 day prior to the announcement date. In
column (3) the dependent variable is the post-announcement CARs, computed over the period which starts on the announcement date and ends
15 days after the announcement date. Columns (4)-(6) repeat the estimations shown in columns (1)-(3) over a subsample which excludes MBOs.
The regressions control for year fixed effects. Standard errors in parenthesis, bootstrapped over 500 iterations, ***, **, and * indicate statistical
significance at the 1%, 5%, and 10% level respectively.
MANAGEMENT BUYOUTS INCLUDED EXCLUDED
PERIOD [-15,15] [-15,-1] [0,15] [-15,15] [-15,-1] [0,15]
DEPENDENT VARIABLE: CARs (1) (2) (3) (4) (5) (6)
Go-Shop -0.0132 0.0300 -0.0431 -0.0023 0.0388 -0.0411
(0.0702) (0.0474) (0.0693) (0.0712) (0.0500) (0.0667)
52wk_High_Ratio 0.0614 0.0344 0.0270 0.0602 0.0319 0.0283
(0.0479) (0.0209) (0.0370) (0.0568) (0.0265) (0.0402)
Volatility 0.0888 -0.1095** 0.1983*** 0.0815 -0.1137** 0.1952***
(0.0797) (0.0449) (0.0575) (0.0780) (0.0445) (0.0579)
Acq_Termin_Fee 0.6435 0.4287 0.2149 0.2928 0.3373 -0.0445
(0.5818) (0.3038) (0.4784) (0.5901) (0.3427) (0.4378)
Target_Termin_Fee -0.1639 0.1597 -0.3236 0.0508 0.1159 -0.0651
(0.7833) (0.5691) (0.7823) (0.9665) (0.7596) (0.8052)
Leverage 0.1431*** 0.0400 0.1031** 0.1529** 0.0575* 0.0954**
(0.0488) (0.0332) (0.0465) (0.0619) (0.0340) (0.0477)
Auction -0.0660** 0.0057 -0.0717** -0.0655* 0.0099 -
0.0754***
(0.0329) (0.0216) (0.0315) (0.0334) (0.0233) (0.0282)
Management_Buyout -0.0027 -0.0270 0.0242
(0.0428) (0.0249) (0.0428)
Large_Target -0.0800*** -0.0360** -0.0440 -0.0652** -0.0316* -0.0336
(0.0306) (0.0178) (0.0303) (0.0303) (0.0183) (0.0287)
Total Owner. by 5% Holders > 20% -0.0050 -0.0062 0.0012 -0.0145 -0.0109 -0.0035
(0.0260) (0.0153) (0.0222) (0.0283) (0.0174) (0.0243)
Largest Owner.>20% OR O&D
Owner.>20%
0.0189 0.0211 -0.0022 0.0254 0.0172 0.0082
(0.0286) (0.0166) (0.0264) (0.0291) (0.0178) (0.0279)
Number_O&D 0.0033 0.0058*** -0.0025 0.0018 0.0048** -0.0030
(0.0025) (0.0018) (0.0022) (0.0027) (0.0021) (0.0024)
Financing_Condition 0.0075 0.0036 0.0039 0.0037 0.0110 -0.0073
(0.0302) (0.0159) (0.0291) (0.0347) (0.0190) (0.0313)
Target_Adv_Fin -0.0127 -0.0156 0.0028 -0.0149 -0.0172 0.0023
(0.0263) (0.0155) (0.0242) (0.0268) (0.0165) (0.0250)
Target_Adv_AcqServ 0.0408* 0.0042 0.0367 0.0384 0.0078 0.0306
(0.0242) (0.0131) (0.0230) (0.0255) (0.0141) (0.0222)
_wL1 0.0289 -0.0371 0.0659 0.0313 -0.0546 0.0859
(0.0488) (0.0314) (0.0510) (0.0493) (0.0340) (0.0581)
_wL0 0.0111 0.0420 -0.0309 0.0529 0.0347 0.0182
(0.0540) (0.0424) (0.0565) (0.0542) (0.0418) (0.0486)
Constant -0.0100 -0.0521 0.0421 0.0032 -0.0555 0.0586
(0.0769) (0.0438) (0.0675) (0.0982) (0.0542) (0.0797)
Observations 298 298 298 267 267 267
Adjusted R-Squared 0.305 0.118 0.283 0.283 0.128 0.314

56