No 34 Shareholder Newsletter - Kaba Group · Kaba®, Com-ID®, Ilco ... Net profit grew by CHF 16.2...
20
Security in a dynamic world 1 January 2010 to 30 June 2010 No 34 Shareholder Newsletter
Transcript of No 34 Shareholder Newsletter - Kaba Group · Kaba®, Com-ID®, Ilco ... Net profit grew by CHF 16.2...

Kaba Holding AGHofwisenstrasse 248153 RümlangSwitzerlandPhone +41 44 818 90 61Fax +41 44 818 90 52www.kaba.com
Security in a dynamic world
1 January 2010 to 30 June 2010
No 34 Shareholder Newsletter
SHARE PRICE DEVELOPMENT
Share price in CHF Trade volume
325
300
275
250
225
200
175
30,000
25,000
20,000
15,000
10,000
5,000
0
Kaba share price SPI (rebased) Kaba volume
July 2009 January 2010 June 2010April 2010October 2009
SALES BY SEGMENTS
in %
Access+Data Systems
2007/2008
Key Systems
Door Automation
Others
Industrial Locks
2008/2009 2009/2010
1
50
19
15
15
1
53
17
15
14
1
52
17
16
14
EBIT MARGIN BY SEGMENTS*
in %
2008/2009 2009/2010*before restructuring expenses
Access+ Data Systems
13.414.2
28.9
23.0
12.4
7.2 9.66.1
Industrial Locks Key Systems Door Automation
EBIT BY SEGMENTS*
in CHF million
Access+Data Systems
79.7 (54%)
Industrial Locks
48.9 (33%)
*before restructuring expenses
Corporate/Others—24.0 (—16%)
Door Automation
17.4 (12%)
Key Systems
24.9 (17%)
EditorKaba Holding AGHofwisenstrasse 248153 RümlangSwitzerlandPhone +41 44 818 90 61Fax +41 44 818 90 [email protected]
Project managementKaba Management + Consulting AG, RümlangJean-Luc FerrazziniChief Communications Officer
Copyrights© Kaba Holding AG, 2010
Picture credits© Getty Images International (Cover)
This information contains certain forward-looking statements in- cluding, but not limited to, those using the words “believes”, “assumes”, “expects” or formulations of a similar kind. Such forward-looking statements are made on the basis of assumptions and expectations that the Company believes to be reasonable at this time, but may prove to be erroneous. They involve known and unknown risks, uncertainties and other factors which could lead to substantial differences between the actual future results, the financial situation, the development or performance of the Company and those either expressed or implied by such statements. Such factors include, but are not limited to:
competition from other companies, >
the effects and risks of new technologies, >the Company’s continuing capital requirements, >financing costs, >delays in the integration of acquisitions, >changes in the operating expenses, >currency and raw material price fluctuations, >the Company’s ability to recruit and retain qualified employees, >political risks in countries where the Company operates, >changes in applicable law >and other factors identified in this publication. >
Should one or more of these risks or uncertainties materialize, or should any underlying assumption prove incorrect, actual outcomes may vary substantially from those indicated. In view of these uncertainties, readers are cautioned not to place undue reliance on such forward-looking state ments. Except as required by law, the Company accepts no obligation to continue to report or update such forward-looking statements or adjust them to future events or developments.
Kaba®, Com-ID®, Ilco®, La Gard®, LEGIC®, SAFLOK®, Silca®, etc. are registered trademarks, CardLink™, TouchGo™ etc. are trademarks of the Kaba Group.
Due to country-specific constraints or marketing considerations, some of the Kaba Group products and systems may not be available in every market.
Key figures 2009/2010
This product was climate-neutrally produced.
KEy FIGuRES
in CHF million except per share amounts/personnelFinancial year
ended 30. 06. 2010 in %Financial year
ended 30. 06. 2009 in %
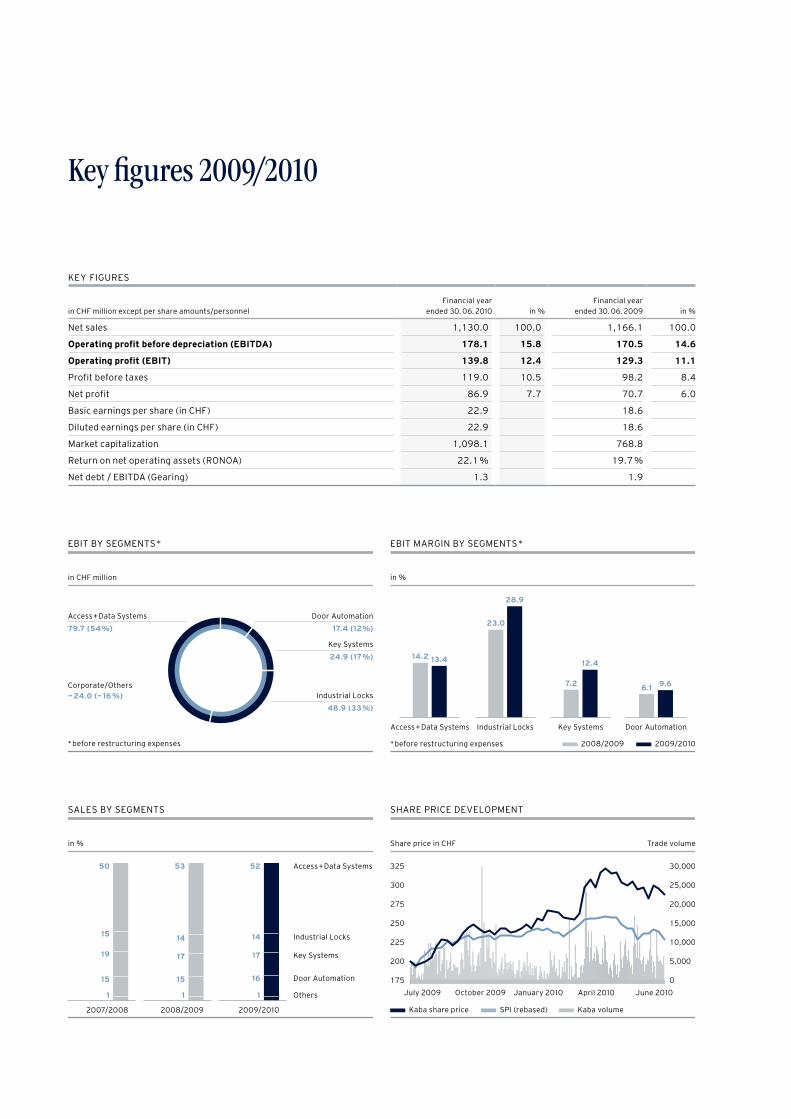
Net sales 1,130.0 100.0 1,166.1 100.0
Operating profit before depreciation (EBITDA) 178.1 15.8 170.5 14.6
Operating profit (EBIT) 139.8 12.4 129.3 11.1
Profit before taxes 119.0 10.5 98.2 8.4
Net profit 86.9 7.7 70.7 6.0
Basic earnings per share (in CHF) 22.9 18.6
Diluted earnings per share (in CHF) 22.9 18.6
Market capitalization 1,098.1 768.8
Return on net operating assets (RONOA) 22.1 % 19.7 %
Net debt / EBITDA (Gearing) 1.3 1.9

1Nr. 34 2010 Kaba Shareholder Newsletter
Pleasing sales development in the year under review >
Recession-resistant: sales down only 6 % (in organic terms) in the last two years >
Organic growth in the second half (4.2 %) >
Net profit up 23 % at CHF 86.9 million >
Earnings ratios at record level >
49 % increase in dividend proposed: CHF 7.00 per share >
Dear Shareholder,Ladies and Gentlemen
The Kaba Group returned to growth in the course of the 2009/2010 financial year. At the same time, it lifted finan-cial ratios to higher levels than before the crisis. Perfor-mance varied depending on product group and market. The measures implemented at the start of the recession to adjust capacity and cost structure paid off in the year under review. Moreover, they will continue to have a beneficial effect. Kaba’s business model has proved its worth over the last two difficult years. The Group now has a good basis to benefit swiftly from economic growth by generating even stronger earnings.
Organic sales on same levelIn financial 2009/2010, the Kaba Group managed to keep its sales figures just under the level of the previous year. Sales went back 3.1 % to CHF 1,130 million. 80 % of this reduction was the result of exchange rate movements, which equals 2.8 % of the decline. The average rate for the euro against the Swiss franc was 4.5 % lower than in the previous year, going down from CHF 1.54 to CHF 1.47, whilst the US dollar average was down 3.6 %, from CHF 1.11 to CHF 1.07. Currency-adjusted, sales in the year under review decreased by only 0.4 %, or CHF 4.5 million. Thus, the Kaba Group held up well
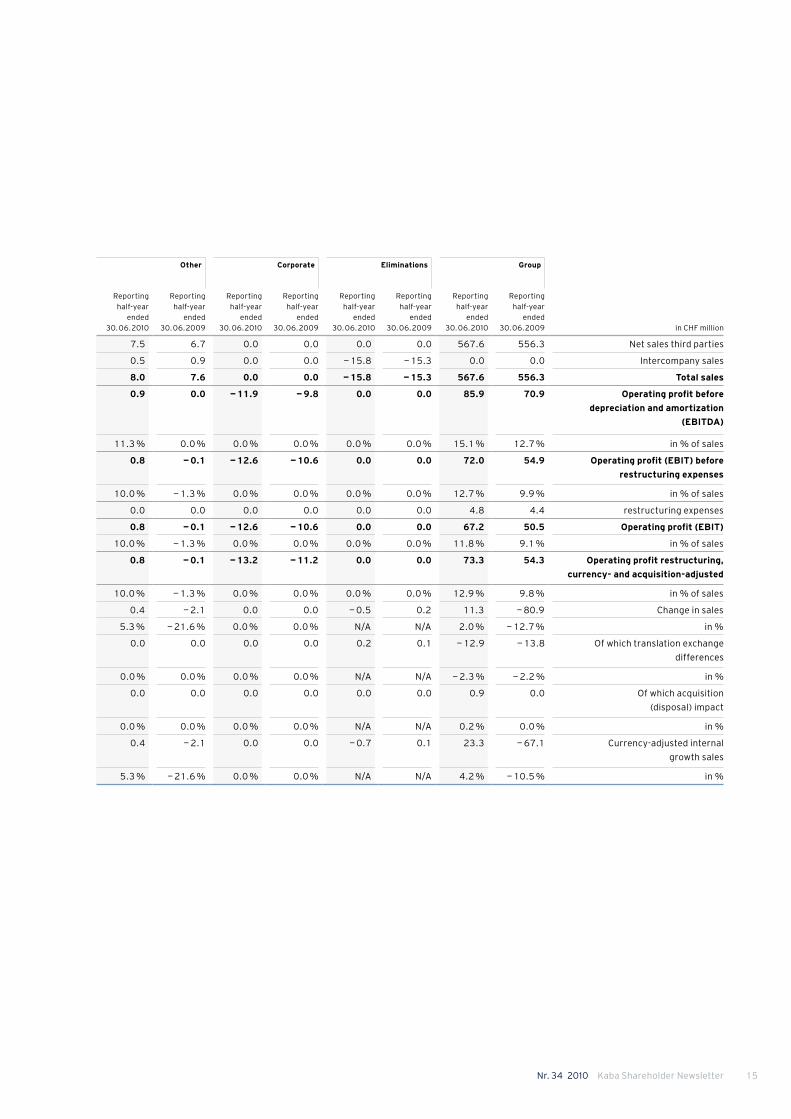
in an environment which remained difficult and subject to heterogeneous trends. The slight decline in sales in the year under review occurred in the first half, when Kaba was down 4.6 % in currency-adjusted terms. In the second half of the year, Kaba re-turned to a growth path with an organic increase of 4.2 % or CHF 23.3 million.
Significantly improved earnings situation Despite the lower sales figure, EBIT (earnings before interest and taxes) before restructuring expenses rose 9.5 %, from CHF 134.2 million to CHF 146.9 million. This CHF 12.7 million improvement in the EBIT figure was accounted for principally by the capacity adjustments implemented in the previous year and by ongoing optimization in the cost structure. At 13 % before restructuring expenses, the EBIT margin beat the 12.6 % record set in 2007/2008. This means that the Kaba Group is in an outstanding position to reap the benefits of a new period of growth. Kaba has demonstrated in the past that attractive organic growth can be achieved, while keeping the increase in costs disproportionately low. This means that growth has a dispro-portionately large effect on operating results. In contrast to previous business cycles, however, this time the effect will start from a still higher level.After accounting for one-off costs of CHF 7.1 million for ca-pacity adjustments (CHF 4.9 million in the previous year),
New growthANNUAL FINANCIAL STATEMENTS AS AT 30 jUNE 2010

2 Kaba Shareholder Newsletter Nr. 34 2010
EBIT rose 8.1 %, from CHF 129.3 million to CHF 139.8 mil-lion, producing an EBIT margin of 12.4 % (previous year: 11.1 %). The quick reduction of capacities at the beginning of the recession period as well as further measures to cut costs allowed for a further improvement of the Group’s profitability. In january 2010, the convertible bond was redeemed at CHF 180.8 million. Part of the funds required for this came from a syndicated loan for CHF 575 million, which the Kaba Group arranged in May 2009 with a term of four years. These refinancing measures led to a CHF 10 million reduction in net financing costs, from CHF 31.1 million to CHF 21.1 million.Net profit grew by CHF 16.2 million, or 23 %, from CHF 70.7 million to CHF 86.9 million, which equals a profit margin of 7.7 %. Earnings per share increased accordingly.
Marginal impact of the recessionThe Kaba Group was not immune to the recessionary weak-ness in demand in its main markets. However, analysis of the Kaba Group’s performance during the recession period shows that the decline in sales was a very limited one when set against the figures for other comparable industrial firms: In the 2007/2008 financial year, before the economy began to suffer, Kaba generated sales of CHF 1,303.7 mil-lion. Thus, the sales figure for the 2009/2010 financial year, at CHF 1,130 million, was only CHF 173.7 million lower. After adjustment is made for the effect of currency trans-lation (CHF — 87.7 million) and of acquisitions and divest-ments (CHF — 7.4 million), the result is a reduction in the organic sales figure of CHF 78.6 million. In other words, during the recession the Kaba Group suf-fered a reduction in organic sales of just 6 % cumulatively. Kaba also succeeded in returning to a growth path sooner than its rivals, despite the effects of the recession kicking in at about the same time or rather a little later than at compa-rable firms.At the same time, Kaba can point to key earnings ratios at record levels: at 16.4 % of sales, EBITDA is easily above the 2007/2008 high of 15.9 %; EBIT, at 13 %, exceeded the record (12.6 %) achieved in the same year; and the profit margin, at 8.3 %, is well above the figure of 7.5 % for 2007/2008. These
ratios refer to underlying earnings power, i. e. earnings before deduction of one-off restructuring expenses.This pleasing performance is attributable to several factors. Firstly, the Kaba Group has a strategically constructed prod-uct portfolio which is relatively resistant to the business cycle. Around 70 % of turnover comes from products and services provided for existing buildings (installed base). Sec-ondly, the Kaba Group benefited from its positioning as a technology leader in lasting security solutions. And thirdly, the company is managed in a way which is characterized by a close understanding of the customer, flexibility and deter-mination. Thanks to these qualities, capacity was rapidly adjusted to local market conditions, and the EBIT margin was kept well within the double-digit range.
New segment structure and management set-up The segment structure and adjusted management set-up introduced on 1 july 2009 has proved its worth. The four centrally managed business segments — Access + Data Sys-tems, Industrial Locks, Key Systems and Door Automation — have enabled measurable efficiency gains to be achieved. The business in Physical Access Systems (high-security doors, high-security barriers, tripod barriers, etc. manufac-tured by the former Kaba Gallenschütz in Germany), which was part of the old Door Systems segment, became part of the Access + Data Systems business segment in mid-2009. The segment also includes Safe + Vault, the bank installation business in Switzerland.The Safe Locks operation (high-security locks) and the activities of the company Wah Yuet, which were previously also part of the Access + Data Systems segment, are now brought together in the new Industrial Locks business seg-ment. Because both operations use similar distribution chan-nels, putting them together means considerable efficiency improvements and synergies can be generated.The Key Systems business segment includes operations in connection with key blanks and key cutting machines.Finally, the old Door Systems segment was renamed Door Automation, and focuses on the automatic sliding doors pro-duced by Kaba Gilgen in Switzerland, along with the accom-panying distribution companies and the business in Platform Screen Doors.

3Nr. 34 2010 Kaba Shareholder Newsletter
The reporting below follows the new segment structure, as did the semi-annual report as at 31 December 2009. The figures for the previous year are comparable. All EBIT figures given below are before restructuring expenses.
Access + Data Systems down 2.7 % (organic)Sales for the Access + Data Systems business segment declined by 4.9 % to CHF 593.8 million. Exchange rate changes cut 2.5 % from the sales figure. The organic sales decrease in the period under review was 2.7 %. EBIT was down 10.4 % to CHF 79.7 million. This figure does not take account of restructuring expenses of CHF 1.4 million (pre- vious year CHF 2.1 million). The EBIT margin before restruc-turing expenses went down from 14.2 % to 13.4 %. The mar-gin contraction was caused in particular by legal conditions in Europe, which make cost-effective adjustment to fluctu-ating demand difficult.In Europe, organic sales were down 1.3 % at CHF 425.4 mil-lion. However, organic growth was recorded in the period from january to june 2010. Physical Access Systems (prod-ucts such as tripod barriers and sensor barriers) benefited from double-digit growth in infrastructure investment in Europe and Asia. On the other hand, the Workforce Manage-ment business (enterprise data collection) suffered as a result of falling volumes and cost-cutting measures under-taken by its customers in European manufacturing.In America, sales dropped 9.3 % in organic terms to CHF 140.5 million. The hotel sector held back on investing in locking sys-tems. Kaba estimates that the volume of new business in this market has approximately halved. The significant reduction in the sales figure was also down to the robust number for the previous year, when sales were still benefiting from strong replacement business in the hotel sector. However, business in commercial access solutions put in a positive performance. Overall, the American operation saw ongoing improvement in sales over the twelve months of the period under review. In the last quarter, organic sales were only slightly negative.The distribution companies in Asia Pacific nominally in-creased their sales in the period under review by 6.7 % to CHF 42.8 million.
Industrial Locks boosts EBIT margin to 28.9 % Organic sales in the Industrial Locks business segment were down 1.7 % at CHF 169 million. However, the second half of the 2009/2010 financial year saw organic growth of 14.1 %. This stemmed mainly from Asian OEM production for the American residential market. EBIT reached CHF 48.9 million, significantly up from the previous year’s total of CHF 41.2 mil-lion. The EBIT margin increased from 23 % to 28.9 %. The stronger earnings figure was achieved by focused cost re-ductions, particularly in Asia. In addition to higher capacity utilization, more favorable raw materials costs also had an advantageous effect.
Cost cuts and growth result in EBIT margin of 12.4 % for Key Systems In the Key Systems business segment, organic sales rose 4.3 % to CHF 201.1 million. A 3.3 % reduction in the first half-year contrasted with an increase of 12.2 % in the second. Benefiting from the effect of early cost reductions and lower materials costs, EBIT rose by no less than 72 % to CHF 24.9 million. The EBIT margin improved from 7.2 % to 12.4 %, thereby reaching a higher level than before the recession.
Door Automation with organic growth and increased EBIT margin at 9.6 %The Door Automation business segment continued on its growth path irrespective of the recession, recording organic growth of 4.8 % in the second half of the year. For the full 2009/2010 financial year, nominal sales increased 1.2 % to CHF 182.1 million. The platform screen doors contract for the Paris Metro, involving several years of work, made a consider-able contribution to the overall increase. EBIT rose by 58.2 % to CHF 17.4 million. The EBIT margin improved from 6.1 % to 9.6 %. The positive performance was made possible by opti-mized structures at the distribution companies and system-atic and stringent cost management.

4 Kaba Shareholder Newsletter Nr. 34 2010
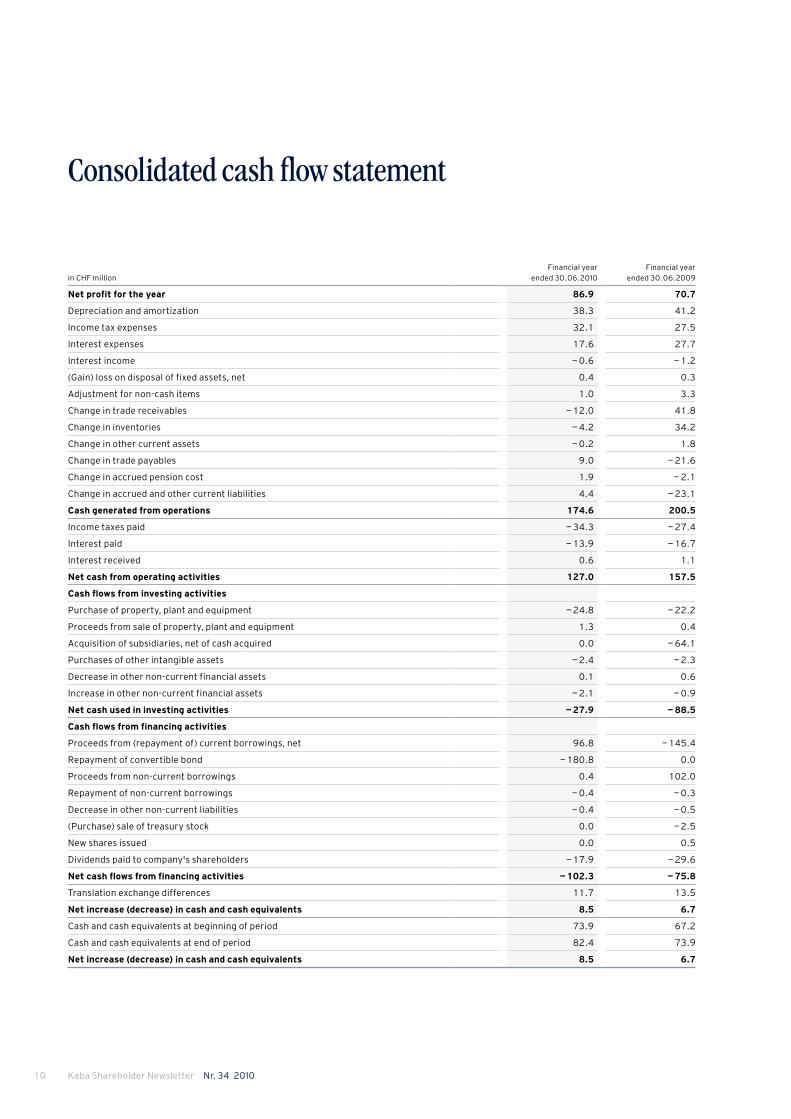
Net debt reduced by another CHF 92.5 millionNet cash from operating activities (i.e. cash generated from profit after allowing for changes in net current assets), at CHF 127 million (previous year CHF 157.5 million), reached a ratio of 11.2 % against sales, and was therefore well above the long-term goal of over 10 % of sales. Despite growth kicking in during the period under review, net current assets remained practically constant. Consequently, net debt was reduced by CHF 92.5 million (CHF 87.5 million in the previous year) to CHF 232.7 million, cutting the key net debt ratio (net debt divided by EBITDA) to 1.3 (1.9 in the previous year).
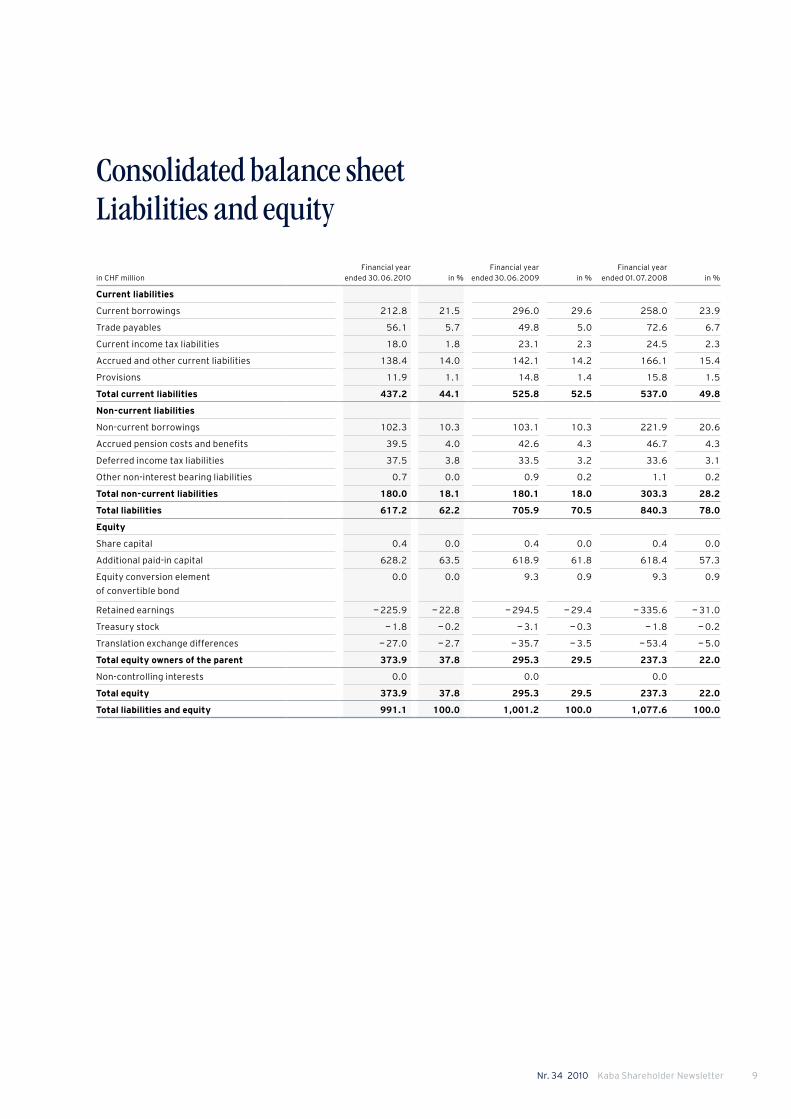
Equity ratio of almost 38 %Ongoing generation of profits pushed equity capital at 30 june 2010 up to CHF 373.9 million. This is 37.8 % of total assets (previous year 29.5 %).
Outlook The strategic measures implemented since 2006 to ensure proximity to the market, to promote organic growth, to simplify structures and to add sustained strength to the Group’s earning power have proved to be just right. The strategy embarked upon helped the Kaba Group to return to growth in the second half of the 2009/2010 financial year, which is earlier than at comparable firms. The EBIT margin of 13 % (before restructuring expenses) posted at 30 june 2010 is likely to rise further in a future phase of new growth, as experience has shown that, as sales rise, costs rise at a slower rate. Kaba expects this leverage effect to operate even at the current (high) ratios. How sustained the nascent economic recovery will prove to be is difficult to gauge conclusively at the moment. Although many branches of industry have seen some sharp sales growth, the economic environment remains susceptible to negative political and exchange-rate-policy effects. Large parts of the world’s economy are still in a delicate state of health. The investment behavior of government and related institutions, which represent an important customer segment for some parts of the Kaba Group, is difficult to predict. Very positive trading overall in the first half of the 2010 calendar year underpins visibility for the Kaba Group and
supports an assumption that the 2010/2011 financial year will be characterized by new growth. Kaba expects its free cash flow to remain high, allowing further debt to be paid down. This will enable financing costs to be further reduced. The CHF 182 million redemption of a convertible bond in january 2010, paid for out of a four-year loan arranged with a consortium of banks, will cut net interest expenses in the 2010/2011 financial year by around CHF 6 million to approximately CHF 15 million.With sales growth, the EBIT margin is likely to see further improvement in 2010/2011.
Proposed dividend of CHF 7.00 per share (up 49 %) Based on the Group’s improved consolidated results for the 2009/2010 financial year, the Board of Directors will pro-pose to the Annual General Meeting on 19 October 2010 an increase in the dividend from CHF 4.70 in the previous year to CHF 7.00 per share. After a 23 % rise in Group profits for the period under review, the Board of Directors will propose that the dividend be raised by even more, at 49 %. In so doing, it wishes to provide further demonstration of its shareholder-friendly distribution policy.The existing authorized capital, amounting to 380,000 shares, expires on 21 October 2010 under Swiss law. The Board of Directors therefore will propose to the Annual General Meeting that new authorized capital of 380,000 shares be created, again amounting to around 10 % of share capital. In so doing, the Board of Directors wishes to keep options open over the next two years for the refinancing of Kaba and, in particular, for acquisitions. However, it has no intentions in this respect at the moment.
Elections to the Board of DirectorsThe terms of office of Maurice P. Andrien, Rolf Dörig and Karina Dubs-Kuenzle expire at the Annual General Meeting of 19 October 2010. The Board of Directors will propose that they be reelected.

5Nr. 34 2010 Kaba Shareholder Newsletter
Invitation to the Annual General Meeting on Tuesday 19 October 2010, 3 p. m.,at the Mövenpick Hotel Zurich-Regensdorf, Zentrum, 8105 Zurich-Regensdorf
Our shareholders will be sent the following documents for the AGM on 22 September 2010:
Invitation with agenda and Board of Directors proposals >Reply form >Reply envelope >
To take part in our AGM, please complete the delivered reply form and return it to us as soon as possible in the reply en- velope. You will then receive an entry ticket and voting card as well as a timetable (for those coming by train) or a map (for those travelling by car). Since there are only a limited number of parking spaces available, we recommend that you use public transport.
The Kaba Group’s reportingIn response to requests from shareholders, we are only sending out the Shareholder Newsletter automatically. How-ever, you can use the enclosed form to request the following additional publications:
Annual Report >Investor’s Handbook >
You can also go to our website www.kaba.com to access and/or download all of our publications.
Thank youWe would like to thank you, our valued shareholders, for your interest and trust in Kaba. A heartfelt thanks also goes to all our staff. Through their commitment and hard work they have helped ensure that the Kaba Group was able to react flexibly to the various challenges and that it emerges strengthened from economic crisis.
Yours faithfully, for Kaba Holding AG
Ulrich Graf Rudolf WeberChairman of the Board of Directors CEO


7Nr. 34 2010 Kaba Shareholder Newsletter
Consolidated income statement
in CHF million, except per share amountsFinancial year
ended 30. 06. 2010 in %Financial year
ended 30. 06. 2009 in %
Net sales 1,130.0 100.0 1,166.1 100.0
Changes in finished goods and work in progress — 3.8 — 0.3 — 13.0 — 1.1
Other operating income 10.9 1.0 12.0 1.0
Material expenses — 361.8 — 32.0 — 382.1 — 32.8
Personnel expenses — 430.1 — 38.1 — 439.5 — 37.7
Other operating expenses — 167.1 — 14.8 — 173.0 — 14.8
Operating profit before depreciation (EBITDA) 178.1 15.8 170.5 14.6
Depreciation and amortization — 38.3 — 3.4 — 41.2 — 3.5
Operating profit (EBIT) 139.8 12.4 129.3 11.1
Result from associates and joint ventures 0.3 0.0 0.0 0.0
Financial expenses — 21.8 — 1.9 — 32.4 — 2.8
Financial income 0.7 0.0 1.3 0.1
Profit before taxes 119.0 10.5 98.2 8.4
Income taxes — 32.1 — 2.8 — 27.5 — 2.4
Net profit 86.9 7.7 70.7 6.0
Net profit attributable to non-controlling interests 0.0 0.0
Net profit attributable to owners of the parent 86.9 70.7
Basic earnings per share (in CHF) 22.9 18.6
Diluted earnings per share (in CHF) 22.9 18.6

8 Kaba Shareholder Newsletter Nr. 34 2010
Consolidated balance sheet Assets
in CHF millionFinancial year
ended 30. 06. 2010 in %Financial year
ended 30. 06. 2009 in %Financial year
ended 01. 07. 2008 in %
Current assets
Cash and cash equivalents 82.4 8.3 73.9 7.4 67.2 6.2
Trade receivables 200.4 20.2 199.4 19.9 246.2 22.9
Inventories 198.7 20.0 203.1 20.3 237.8 22.1
Current income tax assets 7.7 0.8 5.0 0.5 5.4 0.5
Other current assets 22.5 2.3 16.4 1.6 19.1 1.8
Total current assets 511.7 51.6 497.8 49.7 575.7 53.5
Non-current assets
Property, plant and equipment 185.2 18.7 197.8 19.8 207.7 19.3
Goodwill and other intangible assets 263.8 26.6 272.1 27.2 263.5 24.4
Investments in associates and joint ventures
5.6 0.6 6.1 0.6 6.0 0.6
Non-current financial assets 19.1 1.9 20.1 2.0 15.5 1.4
Deferred income tax assets 5.7 0.6 7.3 0.7 9.2 0.9
Total non-current assets 479.4 48.4 503.4 50.3 501.9 46.5
Total assets 991.1 100.0 1,001.2 100.0 1,077.6 100.0
9Nr. 34 2010 Kaba Shareholder Newsletter
Consolidated balance sheet Liabilities and equity
in CHF millionFinancial year
ended 30. 06. 2010 in %Financial year
ended 30. 06. 2009 in %Financial year
ended 01. 07. 2008 in %
Current liabilities
Current borrowings 212.8 21.5 296.0 29.6 258.0 23.9
Trade payables 56.1 5.7 49.8 5.0 72.6 6.7
Current income tax liabilities 18.0 1.8 23.1 2.3 24.5 2.3
Accrued and other current liabilities 138.4 14.0 142.1 14.2 166.1 15.4
Provisions 11.9 1.1 14.8 1.4 15.8 1.5
Total current liabilities 437.2 44.1 525.8 52.5 537.0 49.8
Non-current liabilities
Non-current borrowings 102.3 10.3 103.1 10.3 221.9 20.6
Accrued pension costs and benefits 39.5 4.0 42.6 4.3 46.7 4.3
Deferred income tax liabilities 37.5 3.8 33.5 3.2 33.6 3.1
Other non-interest bearing liabilities 0.7 0.0 0.9 0.2 1.1 0.2
Total non-current liabilities 180.0 18.1 180.1 18.0 303.3 28.2
Total liabilities 617.2 62.2 705.9 70.5 840.3 78.0
Equity
Share capital 0.4 0.0 0.4 0.0 0.4 0.0
Additional paid-in capital 628.2 63.5 618.9 61.8 618.4 57.3
Equity conversion element of convertible bond
0.0 0.0 9.3 0.9 9.3 0.9
Retained earnings — 225.9 — 22.8 — 294.5 — 29.4 — 335.6 — 31.0
Treasury stock — 1.8 — 0.2 — 3.1 — 0.3 — 1.8 — 0.2
Translation exchange differences — 27.0 — 2.7 — 35.7 — 3.5 — 53.4 — 5.0
Total equity owners of the parent 373.9 37.8 295.3 29.5 237.3 22.0
Non-controlling interests 0.0 0.0 0.0
Total equity 373.9 37.8 295.3 29.5 237.3 22.0
Total liabilities and equity 991.1 100.0 1,001.2 100.0 1,077.6 100.0
10 Kaba Shareholder Newsletter Nr. 34 2010
Consolidated cash flow statement
in CHF millionFinancial year
ended 30. 06. 2010Financial year
ended 30. 06. 2009
Net profit for the year 86.9 70.7
Depreciation and amortization 38.3 41.2
Income tax expenses 32.1 27.5
Interest expenses 17.6 27.7
Interest income — 0.6 — 1.2
(Gain) loss on disposal of fixed assets, net 0.4 0.3
Adjustment for non-cash items 1.0 3.3
Change in trade receivables — 12.0 41.8
Change in inventories — 4.2 34.2
Change in other current assets — 0.2 1.8
Change in trade payables 9.0 — 21.6
Change in accrued pension cost 1.9 — 2.1
Change in accrued and other current liabilities 4.4 — 23.1
Cash generated from operations 174.6 200.5
Income taxes paid — 34.3 — 27.4
Interest paid — 13.9 — 16.7
Interest received 0.6 1.1
Net cash from operating activities 127.0 157.5
Cash flows from investing activities
Purchase of property, plant and equipment — 24.8 — 22.2
Proceeds from sale of property, plant and equipment 1.3 0.4
Acquisition of subsidiaries, net of cash acquired 0.0 — 64.1
Purchases of other intangible assets — 2.4 — 2.3
Decrease in other non-current financial assets 0.1 0.6
Increase in other non-current financial assets — 2.1 — 0.9
Net cash used in investing activities — 27.9 — 88.5
Cash flows from financing activities
Proceeds from (repayment of) current borrowings, net 96.8 — 145.4
Repayment of convertible bond — 180.8 0.0
Proceeds from non-current borrowings 0.4 102.0
Repayment of non-current borrowings — 0.4 — 0.3
Decrease in other non-current liabilities — 0.4 — 0.5
(Purchase) sale of treasury stock 0.0 — 2.5
New shares issued 0.0 0.5
Dividends paid to company's shareholders — 17.9 — 29.6
Net cash flows from financing activities — 102.3 — 75.8
Translation exchange differences 11.7 13.5
Net increase (decrease) in cash and cash equivalents 8.5 6.7
Cash and cash equivalents at beginning of period 73.9 67.2
Cash and cash equivalents at end of period 82.4 73.9
Net increase (decrease) in cash and cash equivalents 8.5 6.7

11Nr. 34 2010 Kaba Shareholder Newsletter
Statement of comprehensive income and Changes in equity
Statement of comprehensive income
in CHF million, except per share amountsFinancial year
ended 30. 06. 2010Financial year
ended 30. 06. 2009Financial year
beginning 01. 07. 2008
Net profit for the reporting period 86.9 70.7 97.1
Other comprehensive income
Translation exchange differences 8.7 17.7 — 52.7
Other comprehensive income, net of tax 8.7 17.7 — 52.7
Total comprehensive income for the period 95.6 88.4 44.4
Net profit attributable to non-controlling interests 0.0 0.0 0.0
Net profit attributable to owners of the parent 95.6 88.4 44.4
Changes in equity
in CHF millonShare
capital
Additional paid-in capital
Equity convers. element of conv.
bond 1)
Cash flow hedging reserve
Retained earnings
Treasury stock
Cumul. translation
adjustm.
Non- controlling
interestsTotal
equity
Financial year ended 30. 06. 2009
Balance at 30. 06. 2008 before restatement
0.4 618.4 9.3 0.0 — 335.3 — 1.8 — 53.4 0.0 237.6
Restatement (Improvement IAS38) — 0.3 — 0.3
Balance at 01. 07. 2008 after restatement
0.4 618.4 9.3 0.0 — 335.6 — 1.8 — 53.4 0.0 237.3
Net profit for the reporting period 70.7 70.7
Other comprehensive income, net of tax 17.7 17.7
Total comprehensive income for the period
70.7 17.7 0.0 88.4
Dividend paid — 29.6 — 29.6
New shares issued 2) 0.0 0.4 1.2 1.6
Treasury stock (purchased) re-issued — 2.5 — 2.5
Employee options granted 0.1 0.1
Balance at 30. 06. 2009 0.4 618.9 9.3 0.0 — 294.5 — 3.1 — 35.7 0.0 295.3
Financial year ended 30. 06. 2010
Balance at 30. 06. 2009 0.4 618.9 9.3 0.0 — 294.5 — 3.1 — 35.7 0.0 295.3
Net profit for the reporting period 86.9 86.9
Other comprehensive income, net of tax 8.7 8.7
Total comprehensive income for the period
86.9 8.7 0.0 95.6
Dividend paid — 17.9 — 17.9
Repayment of convertible bond 9.3 — 9.3 0.0
Treasury stock (purchased) re-issued — 0.4 1.3 0.9
Balance at 30. 06. 2010 0.4 628.2 0.0 0.0 — 225.9 — 1.8 — 27.0 0.0 373.9
1) Net of income tax.2) 2,300 shares at CHF 0.10 par value

12 Kaba Shareholder Newsletter Nr. 34 2010
Segment reporting full year
Access + Data Systems Industrial Locks Key Systems Door Automation Other Corporate Eliminations Group
in CHF million
Financial year ended
30. 06. 2010
Financial year ended
30. 06. 2009
Financial year ended
30. 06. 2010
Financial year ended
30. 06. 2009
Financial year ended
30. 06. 2010
Financial year ended
30. 06. 2009
Financial year ended
30. 06. 2010
Financial year ended
30. 06. 2009
Financial year ended
30. 06. 2010
Financial year ended
30. 06. 2009
Financial year ended
30. 06. 2010
Financial year ended
30. 06. 2009
Financial year ended
30. 06. 2010
Financial year ended
30. 06. 2009
Financial year ended
30. 06. 2010
Financial year ended
30. 06. 2009 in CHF million
Net sales third parties 584.8 614.9 153.9 162.7 198.3 198.6 179.5 177.0 13.5 12.9 0.0 0.0 0.0 0.0 1,130.0 1,166.1 Net sales third parties
Intercompany sales 9.0 9.7 15.1 16.1 2.8 2.4 2.6 2.9 1.2 2.3 0.0 0.0 — 30.7 — 33.4 0.0 0.0 Intercompany sales
Total sales 593.8 624.6 169.0 178.8 201.1 201.0 182.1 179.9 14.7 15.2 0.0 0.0 — 30.7 — 33.4 1,130.0 1,166.1 Total sales
Operating profit before depreciation and amortization (EBITDA)
94.0 103.5 54.3 50.4 32.4 22.0 19.6 14.2 0.5 — 0.6 — 22.7 — 19.0 0.0 0.0 178.1 170.5 Operating profit before depreciation and amortization
(EBITDA)
in % of sales 15.8 % 16.6 % 32.1 % 28.2 % 16.1 % 10.9 % 10.8 % 7.9 % 3.4 % — 3.9 % 0.0 % 0.0 % 0.0 % 0.0 % 15.8 % 14.6 % in % of sales
Operating profit (EBIT) before restructuring expenses
79.7 89.0 48.9 41.2 24.9 14.5 17.4 11.0 0.2 — 0.9 — 24.2 — 20.6 0.0 0.0 146.9 134.2 Operating profit (EBIT) before restructuring expenses
in % of sales 13.4 % 14.2 % 28.9 % 23.0 % 12.4 % 7.2 % 9.6 % 6.1 % 1.4 % — 5.9 % 0.0 % 0.0 % 0.0 % 0.0 % 13.0 % 11.5 % in % of sales
restructuring expenses 1.4 2.1 2.9 0.3 0.8 1.0 2.0 1.5 0.0 0.0 0.0 0.0 0.0 0.0 7.1 4.9 restructuring expenses
Operating profit (EBIT) 78.3 86.9 46.0 40.9 24.1 13.5 15.4 9.5 0.2 — 0.9 — 24.2 — 20.6 0.0 0.0 139.8 129.3 Operating profit (EBIT)
in % of sales 13.2 % 13.9 % 27.2 % 22.9 % 12.0 % 6.7 % 8.5 % 5.3 % 1.4 % — 5.9 % 0.0 % 0.0 % 0.0 % 0.0 % 12.4 % 11.1 % in % of sales
Operating profit restructuring, currency- and acquisition-adjusted
82.2 92.0 50.5 42.0 25.5 15.6 16.9 10.9 0.2 — 0.9 — 25.0 — 22.1 0.0 0.0 150.3 137.5 Operating profit restructuring, currency- and acquisition-adjusted
in % of sales 13.8 % 14.7 % 29.9 % 23.5 % 12.7 % 7.8 % 9.3 % 6.1 % 1.4 % — 5.9 % 0.0 % 0.0 % 0.0 % 0.0 % 13.3 % 11.8 % in % of sales
Change in sales — 30.8 — 39.0 — 9.8 — 32.5 0.1 — 44.5 2.2 — 23.2 — 0.5 — 5.5 0.0 0.0 2.7 7.2 — 36.1 — 137.6 Change in sales
in % — 4.9 % — 5.9 % — 5.5 % — 15.4 % 0.0 % — 18.1 % 1.2 % — 11.4 % — 3.3 % — 26.6 % 0.0 % 0.0 % N/A N/A — 3.1 % — 10.6 % in %
Of which translation exchange differences
— 15.5 — 32.8 — 6.7 — 1.3 — 8.5 — 11.1 — 3.2 — 11.1 0.0 0.0 0.0 0.0 1.0 1.5 — 32.9 — 54.8 Of which translation exchange differences
in % — 2.5 % — 4.9 % — 3.7 % — 0.6 % — 4.2 % — 4.5 % — 1.8 % — 5.4 % 0.0 % 0.0 % 0.0 % 0.0 % N/A N/A — 2.8 % — 4.2 % in %
Of which acquisition (disposal) impact
1.3 — 8.7 0.0 0.0 0.0 0.0 0.0 0.0 0.0 0.0 0.0 0.0 0.0 0.0 1.3 — 8.7 Of which acquisition (disposal) impact
in % 0.2 % — 1.3 % 0.0 % 0.0 % 0.0 % 0.0 % 0.0 % 0.0 % 0.0 % 0.0 % 0.0 % 0.0 % N/A N/A 0.1 % — 0.7 % in %
Currency-adjusted internal growth sales
— 16.6 2.5 — 3.1 — 31.2 8.6 — 33.4 5.4 — 12.2 — 0.5 — 5.5 0.0 0.0 1.7 5.7 — 4.5 — 74.1 Currency-adjusted internal growth sales
in % — 2.7 % 0.4 % — 1.7 % — 14.8 % 4.3 % — 13.6 % 3.0 % — 6.0 % — 3.3 % — 26.6 % 0.0 % 0.0 % N/A N/A — 0.4 % — 5.7 % in %

13Nr. 34 2010 Kaba Shareholder Newsletter
Access + Data Systems Industrial Locks Key Systems Door Automation Other Corporate Eliminations Group
in CHF million
Financial year ended
30. 06. 2010
Financial year ended
30. 06. 2009
Financial year ended
30. 06. 2010
Financial year ended
30. 06. 2009
Financial year ended
30. 06. 2010
Financial year ended
30. 06. 2009
Financial year ended
30. 06. 2010
Financial year ended
30. 06. 2009
Financial year ended
30. 06. 2010
Financial year ended
30. 06. 2009
Financial year ended
30. 06. 2010
Financial year ended
30. 06. 2009
Financial year ended
30. 06. 2010
Financial year ended
30. 06. 2009
Financial year ended
30. 06. 2010
Financial year ended
30. 06. 2009 in CHF million
Net sales third parties 584.8 614.9 153.9 162.7 198.3 198.6 179.5 177.0 13.5 12.9 0.0 0.0 0.0 0.0 1,130.0 1,166.1 Net sales third parties
Intercompany sales 9.0 9.7 15.1 16.1 2.8 2.4 2.6 2.9 1.2 2.3 0.0 0.0 — 30.7 — 33.4 0.0 0.0 Intercompany sales
Total sales 593.8 624.6 169.0 178.8 201.1 201.0 182.1 179.9 14.7 15.2 0.0 0.0 — 30.7 — 33.4 1,130.0 1,166.1 Total sales
Operating profit before depreciation and amortization (EBITDA)
94.0 103.5 54.3 50.4 32.4 22.0 19.6 14.2 0.5 — 0.6 — 22.7 — 19.0 0.0 0.0 178.1 170.5 Operating profit before depreciation and amortization
(EBITDA)
in % of sales 15.8 % 16.6 % 32.1 % 28.2 % 16.1 % 10.9 % 10.8 % 7.9 % 3.4 % — 3.9 % 0.0 % 0.0 % 0.0 % 0.0 % 15.8 % 14.6 % in % of sales
Operating profit (EBIT) before restructuring expenses
79.7 89.0 48.9 41.2 24.9 14.5 17.4 11.0 0.2 — 0.9 — 24.2 — 20.6 0.0 0.0 146.9 134.2 Operating profit (EBIT) before restructuring expenses
in % of sales 13.4 % 14.2 % 28.9 % 23.0 % 12.4 % 7.2 % 9.6 % 6.1 % 1.4 % — 5.9 % 0.0 % 0.0 % 0.0 % 0.0 % 13.0 % 11.5 % in % of sales
restructuring expenses 1.4 2.1 2.9 0.3 0.8 1.0 2.0 1.5 0.0 0.0 0.0 0.0 0.0 0.0 7.1 4.9 restructuring expenses
Operating profit (EBIT) 78.3 86.9 46.0 40.9 24.1 13.5 15.4 9.5 0.2 — 0.9 — 24.2 — 20.6 0.0 0.0 139.8 129.3 Operating profit (EBIT)
in % of sales 13.2 % 13.9 % 27.2 % 22.9 % 12.0 % 6.7 % 8.5 % 5.3 % 1.4 % — 5.9 % 0.0 % 0.0 % 0.0 % 0.0 % 12.4 % 11.1 % in % of sales
Operating profit restructuring, currency- and acquisition-adjusted
82.2 92.0 50.5 42.0 25.5 15.6 16.9 10.9 0.2 — 0.9 — 25.0 — 22.1 0.0 0.0 150.3 137.5 Operating profit restructuring, currency- and acquisition-adjusted
in % of sales 13.8 % 14.7 % 29.9 % 23.5 % 12.7 % 7.8 % 9.3 % 6.1 % 1.4 % — 5.9 % 0.0 % 0.0 % 0.0 % 0.0 % 13.3 % 11.8 % in % of sales
Change in sales — 30.8 — 39.0 — 9.8 — 32.5 0.1 — 44.5 2.2 — 23.2 — 0.5 — 5.5 0.0 0.0 2.7 7.2 — 36.1 — 137.6 Change in sales
in % — 4.9 % — 5.9 % — 5.5 % — 15.4 % 0.0 % — 18.1 % 1.2 % — 11.4 % — 3.3 % — 26.6 % 0.0 % 0.0 % N/A N/A — 3.1 % — 10.6 % in %
Of which translation exchange differences
— 15.5 — 32.8 — 6.7 — 1.3 — 8.5 — 11.1 — 3.2 — 11.1 0.0 0.0 0.0 0.0 1.0 1.5 — 32.9 — 54.8 Of which translation exchange differences
in % — 2.5 % — 4.9 % — 3.7 % — 0.6 % — 4.2 % — 4.5 % — 1.8 % — 5.4 % 0.0 % 0.0 % 0.0 % 0.0 % N/A N/A — 2.8 % — 4.2 % in %
Of which acquisition (disposal) impact
1.3 — 8.7 0.0 0.0 0.0 0.0 0.0 0.0 0.0 0.0 0.0 0.0 0.0 0.0 1.3 — 8.7 Of which acquisition (disposal) impact
in % 0.2 % — 1.3 % 0.0 % 0.0 % 0.0 % 0.0 % 0.0 % 0.0 % 0.0 % 0.0 % 0.0 % 0.0 % N/A N/A 0.1 % — 0.7 % in %
Currency-adjusted internal growth sales
— 16.6 2.5 — 3.1 — 31.2 8.6 — 33.4 5.4 — 12.2 — 0.5 — 5.5 0.0 0.0 1.7 5.7 — 4.5 — 74.1 Currency-adjusted internal growth sales
in % — 2.7 % 0.4 % — 1.7 % — 14.8 % 4.3 % — 13.6 % 3.0 % — 6.0 % — 3.3 % — 26.6 % 0.0 % 0.0 % N/A N/A — 0.4 % — 5.7 % in %

14 Kaba Shareholder Newsletter Nr. 34 2010
Segment reporting 2nd half-year
Access + Data Systems Industrial Locks Key Systems Door Automation Other Corporate Eliminations Group
in CHF million
Reporting half-year
ended 30. 06. 2010
Reporting half-year
ended 30. 06. 2009
Reporting half-year
ended 30. 06. 2010
Reporting half-year
ended 30. 06. 2009
Reporting half-year
ended 30. 06. 2010
Reporting half-year
ended 30. 06. 2009
Reporting half-year
ended 30. 06. 2010
Reporting half-year
ended 30. 06. 2009
Reporting half-year
ended 30. 06. 2010
Reporting half-year
ended 30. 06. 2009
Reporting half-year
ended 30. 06. 2010
Reporting half-year
ended 30. 06. 2009
Reporting half-year
ended 30. 06. 2010
Reporting half-year
ended 30. 06. 2009
Reporting half-year
ended 30. 06. 2010
Reporting half-year
ended 30. 06. 2009 in CHF million
Net sales third parties 283.9 293.0 83.0 75.1 105.0 97.0 88.2 84.5 7.5 6.7 0.0 0.0 0.0 0.0 567.6 556.3 Net sales third parties
Intercompany sales 4.8 4.5 7.8 7.2 1.4 1.2 1.3 1.5 0.5 0.9 0.0 0.0 — 15.8 — 15.3 0.0 0.0 Intercompany sales
Total sales 288.7 297.5 90.8 82.3 106.4 98.2 89.5 86.0 8.0 7.6 0.0 0.0 — 15.8 — 15.3 567.6 556.3 Total sales
Operating profit before depreciation and amortization (EBITDA)
41.2 41.7 27.2 23.8 18.9 10.8 9.6 4.4 0.9 0.0 — 11.9 — 9.8 0.0 0.0 85.9 70.9 Operating profit before depreciation and amortization
(EBITDA)
in % of sales 14.3 % 14.0 % 30.0 % 28.9 % 17.8 % 11.0 % 10.7 % 5.1 % 11.3 % 0.0 % 0.0 % 0.0 % 0.0 % 0.0 % 15.1 % 12.7 % in % of sales
Operating profit (EBIT) before restructuring expenses
34.1 35.4 26.3 19.3 14.9 7.4 8.5 3.5 0.8 — 0.1 — 12.6 — 10.6 0.0 0.0 72.0 54.9 Operating profit (EBIT) before restructuring expenses
in % of sales 11.8 % 11.9 % 29.0 % 23.5 % 14.0 % 7.5 % 9.5 % 4.1 % 10.0 % — 1.3 % 0.0 % 0.0 % 0.0 % 0.0 % 12.7 % 9.9 % in % of sales
restructuring expenses 0.8 2.1 2.9 0.3 0.2 0.5 0.9 1.5 0.0 0.0 0.0 0.0 0.0 0.0 4.8 4.4 restructuring expenses
Operating profit (EBIT) 33.3 33.3 23.4 19.0 14.7 6.9 7.6 2.0 0.8 — 0.1 — 12.6 — 10.6 0.0 0.0 67.2 50.5 Operating profit (EBIT)
in % of sales 11.5 % 11.2 % 25.8 % 23.1 % 13.8 % 7.0 % 8.5 % 2.3 % 10.0 % — 1.3 % 0.0 % 0.0 % 0.0 % 0.0 % 11.8 % 9.1 % in % of sales
Operating profit restructuring, currency- and acquisition-adjusted
35.0 36.5 27.1 18.0 15.3 7.7 8.3 3.4 0.8 — 0.1 — 13.2 — 11.2 0.0 0.0 73.3 54.3 Operating profit restructuring, currency- and acquisition-adjusted
in % of sales 12.1 % 12.3 % 29.8 % 21.8 % 14.4 % 7.8 % 9.3 % 4.0 % 10.0 % — 1.3 % 0.0 % 0.0 % 0.0 % 0.0 % 12.9 % 9.8 % in % of sales
Change in sales — 8.8 — 29.8 8.5 — 14.2 8.2 — 26.2 3.5 — 8.8 0.4 — 2.1 0.0 0.0 — 0.5 0.2 11.3 — 80.9 Change in sales
in % — 3.0 % — 9.1 % 10.3 % — 14.7 % 8.4 % — 21.1 % 4.1 % — 9.3 % 5.3 % — 21.6 % 0.0 % 0.0 % N/A N/A 2.0 % — 12.7 % in %
Of which translation exchange differences
— 5.6 — 12.1 — 3.1 5.9 — 3.8 — 2.8 — 0.6 — 4.9 0.0 0.0 0.0 0.0 0.2 0.1 — 12.9 — 13.8 Of which translation exchange differences
in % — 1.9 % — 3.7 % — 3.8 % 6.1 % — 3.9 % — 2.3 % — 0.7 % — 5.2 % 0.0 % 0.0 % 0.0 % 0.0 % N/A N/A — 2.3 % — 2.2 % in %
Of which acquisition (disposal) impact
0.9 0.0 0.0 0.0 0.0 0.0 0.0 0.0 0.0 0.0 0.0 0.0 0.0 0.0 0.9 0.0 Of which acquisition (disposal) impact
in % 0.3 % 0.0 % 0.0 % 0.0 % 0.0 % 0.0 % 0.0 % 0.0 % 0.0 % 0.0 % 0.0 % 0.0 % N/A N/A 0.2 % 0.0 % in %
Currency-adjusted internal growth sales
— 4.1 — 17.7 11.6 — 20.1 12.0 — 23.4 4.1 — 3.9 0.4 — 2.1 0.0 0.0 — 0.7 0.1 23.3 — 67.1 Currency-adjusted internal growth sales
in % — 1.4 % — 5.4 % 14.1 % — 20.9 % 12.2 % — 18.8 % 4.8 % — 4.1 % 5.3 % — 21.6 % 0.0 % 0.0 % N/A N/A 4.2 % — 10.5 % in %
15Nr. 34 2010 Kaba Shareholder Newsletter
Access + Data Systems Industrial Locks Key Systems Door Automation Other Corporate Eliminations Group
in CHF million
Reporting half-year
ended 30. 06. 2010
Reporting half-year
ended 30. 06. 2009
Reporting half-year
ended 30. 06. 2010
Reporting half-year
ended 30. 06. 2009
Reporting half-year
ended 30. 06. 2010
Reporting half-year
ended 30. 06. 2009
Reporting half-year
ended 30. 06. 2010
Reporting half-year
ended 30. 06. 2009
Reporting half-year
ended 30. 06. 2010
Reporting half-year
ended 30. 06. 2009
Reporting half-year
ended 30. 06. 2010
Reporting half-year
ended 30. 06. 2009
Reporting half-year
ended 30. 06. 2010
Reporting half-year
ended 30. 06. 2009
Reporting half-year
ended 30. 06. 2010
Reporting half-year
ended 30. 06. 2009 in CHF million
Net sales third parties 283.9 293.0 83.0 75.1 105.0 97.0 88.2 84.5 7.5 6.7 0.0 0.0 0.0 0.0 567.6 556.3 Net sales third parties
Intercompany sales 4.8 4.5 7.8 7.2 1.4 1.2 1.3 1.5 0.5 0.9 0.0 0.0 — 15.8 — 15.3 0.0 0.0 Intercompany sales
Total sales 288.7 297.5 90.8 82.3 106.4 98.2 89.5 86.0 8.0 7.6 0.0 0.0 — 15.8 — 15.3 567.6 556.3 Total sales
Operating profit before depreciation and amortization (EBITDA)
41.2 41.7 27.2 23.8 18.9 10.8 9.6 4.4 0.9 0.0 — 11.9 — 9.8 0.0 0.0 85.9 70.9 Operating profit before depreciation and amortization
(EBITDA)
in % of sales 14.3 % 14.0 % 30.0 % 28.9 % 17.8 % 11.0 % 10.7 % 5.1 % 11.3 % 0.0 % 0.0 % 0.0 % 0.0 % 0.0 % 15.1 % 12.7 % in % of sales
Operating profit (EBIT) before restructuring expenses
34.1 35.4 26.3 19.3 14.9 7.4 8.5 3.5 0.8 — 0.1 — 12.6 — 10.6 0.0 0.0 72.0 54.9 Operating profit (EBIT) before restructuring expenses
in % of sales 11.8 % 11.9 % 29.0 % 23.5 % 14.0 % 7.5 % 9.5 % 4.1 % 10.0 % — 1.3 % 0.0 % 0.0 % 0.0 % 0.0 % 12.7 % 9.9 % in % of sales
restructuring expenses 0.8 2.1 2.9 0.3 0.2 0.5 0.9 1.5 0.0 0.0 0.0 0.0 0.0 0.0 4.8 4.4 restructuring expenses
Operating profit (EBIT) 33.3 33.3 23.4 19.0 14.7 6.9 7.6 2.0 0.8 — 0.1 — 12.6 — 10.6 0.0 0.0 67.2 50.5 Operating profit (EBIT)
in % of sales 11.5 % 11.2 % 25.8 % 23.1 % 13.8 % 7.0 % 8.5 % 2.3 % 10.0 % — 1.3 % 0.0 % 0.0 % 0.0 % 0.0 % 11.8 % 9.1 % in % of sales
Operating profit restructuring, currency- and acquisition-adjusted
35.0 36.5 27.1 18.0 15.3 7.7 8.3 3.4 0.8 — 0.1 — 13.2 — 11.2 0.0 0.0 73.3 54.3 Operating profit restructuring, currency- and acquisition-adjusted
in % of sales 12.1 % 12.3 % 29.8 % 21.8 % 14.4 % 7.8 % 9.3 % 4.0 % 10.0 % — 1.3 % 0.0 % 0.0 % 0.0 % 0.0 % 12.9 % 9.8 % in % of sales
Change in sales — 8.8 — 29.8 8.5 — 14.2 8.2 — 26.2 3.5 — 8.8 0.4 — 2.1 0.0 0.0 — 0.5 0.2 11.3 — 80.9 Change in sales
in % — 3.0 % — 9.1 % 10.3 % — 14.7 % 8.4 % — 21.1 % 4.1 % — 9.3 % 5.3 % — 21.6 % 0.0 % 0.0 % N/A N/A 2.0 % — 12.7 % in %
Of which translation exchange differences
— 5.6 — 12.1 — 3.1 5.9 — 3.8 — 2.8 — 0.6 — 4.9 0.0 0.0 0.0 0.0 0.2 0.1 — 12.9 — 13.8 Of which translation exchange differences
in % — 1.9 % — 3.7 % — 3.8 % 6.1 % — 3.9 % — 2.3 % — 0.7 % — 5.2 % 0.0 % 0.0 % 0.0 % 0.0 % N/A N/A — 2.3 % — 2.2 % in %
Of which acquisition (disposal) impact
0.9 0.0 0.0 0.0 0.0 0.0 0.0 0.0 0.0 0.0 0.0 0.0 0.0 0.0 0.9 0.0 Of which acquisition (disposal) impact
in % 0.3 % 0.0 % 0.0 % 0.0 % 0.0 % 0.0 % 0.0 % 0.0 % 0.0 % 0.0 % 0.0 % 0.0 % N/A N/A 0.2 % 0.0 % in %
Currency-adjusted internal growth sales
— 4.1 — 17.7 11.6 — 20.1 12.0 — 23.4 4.1 — 3.9 0.4 — 2.1 0.0 0.0 — 0.7 0.1 23.3 — 67.1 Currency-adjusted internal growth sales
in % — 1.4 % — 5.4 % 14.1 % — 20.9 % 12.2 % — 18.8 % 4.8 % — 4.1 % 5.3 % — 21.6 % 0.0 % 0.0 % N/A N/A 4.2 % — 10.5 % in %
16 Kaba Shareholder Newsletter Nr. 34 2010
19 October 2010, Tuesday, 3 p. m.Annual General Meeting of Kaba Holding AG >
7 March 2011, MondayPresentation for financial analysts >Results press conference >Shareholder Newsletter and press release >on the half-year results to 31 December 2010
19 September 2011, MondayPresentation for financial analysts >Results press conference >Shareholders Newsletter with the results for >the 2010/2011 financial yearDistrubution of Annual Report >Invitation to the Annual General Meeting of Shareholders >
25 October 2011, Tuesday, 3 p. m.Annual General Meeting of Kaba Holding AG >
Take a look at our Web site! It provides quick access to more attractive information. just click on www.kaba.com and you will be able to gain swift insight into our ten business areas, or find out the current share price, or access recent press releases, annual and interim reports as well as the popular Investor’s Handbook.
Agenda

SHARE PRICE DEVELOPMENT
Share price in CHF Trade volume
325
300
275
250
225
200
175
30,000
25,000
20,000
15,000
10,000
5,000
0
Kaba share price SPI (rebased) Kaba volume
July 2009 January 2010 June 2010April 2010October 2009
SALES BY SEGMENTS
in %
Access+Data Systems
2007/2008
Key Systems
Door Automation
Others
Industrial Locks
2008/2009 2009/2010
1
50
19
15
15
1
53
17
15
14
1
52
17
16
14
EBIT MARGIN BY SEGMENTS*
in %
2008/2009 2009/2010*before restructuring expenses
Access+ Data Systems
13.414.2
28.9
23.0
12.4
7.2 9.66.1
Industrial Locks Key Systems Door Automation
EBIT BY SEGMENTS*
in CHF million
Access+Data Systems
79.7 (54%)
Industrial Locks
48.9 (33%)
*before restructuring expenses
Corporate/Others—24.0 (—16%)
Door Automation
17.4 (12%)
Key Systems
24.9 (17%)
EditorKaba Holding AGHofwisenstrasse 248153 RümlangSwitzerlandPhone +41 44 818 90 61Fax +41 44 818 90 [email protected]
Project managementKaba Management + Consulting AG, RümlangJean-Luc FerrazziniChief Communications Officer
Copyrights© Kaba Holding AG, 2010
Picture credits© Getty Images International (Cover)
This information contains certain forward-looking statements in- cluding, but not limited to, those using the words “believes”, “assumes”, “expects” or formulations of a similar kind. Such forward-looking statements are made on the basis of assumptions and expectations that the Company believes to be reasonable at this time, but may prove to be erroneous. They involve known and unknown risks, uncertainties and other factors which could lead to substantial differences between the actual future results, the financial situation, the development or performance of the Company and those either expressed or implied by such statements. Such factors include, but are not limited to:
competition from other companies, >
the effects and risks of new technologies, >the Company’s continuing capital requirements, >financing costs, >delays in the integration of acquisitions, >changes in the operating expenses, >currency and raw material price fluctuations, >the Company’s ability to recruit and retain qualified employees, >political risks in countries where the Company operates, >changes in applicable law >and other factors identified in this publication. >
Should one or more of these risks or uncertainties materialize, or should any underlying assumption prove incorrect, actual outcomes may vary substantially from those indicated. In view of these uncertainties, readers are cautioned not to place undue reliance on such forward-looking state ments. Except as required by law, the Company accepts no obligation to continue to report or update such forward-looking statements or adjust them to future events or developments.
Kaba®, Com-ID®, Ilco®, La Gard®, LEGIC®, SAFLOK®, Silca®, etc. are registered trademarks, CardLink™, TouchGo™ etc. are trademarks of the Kaba Group.
Due to country-specific constraints or marketing considerations, some of the Kaba Group products and systems may not be available in every market.
Key figures 2009/2010
This product was climate-neutrally produced.
KEy FIGuRES
in CHF million except per share amounts/personnelFinancial year
ended 30. 06. 2010 in %Financial year
ended 30. 06. 2009 in %
Net sales 1,130.0 100.0 1,166.1 100.0
Operating profit before depreciation (EBITDA) 178.1 15.8 170.5 14.6
Operating profit (EBIT) 139.8 12.4 129.3 11.1
Profit before taxes 119.0 10.5 98.2 8.4
Net profit 86.9 7.7 70.7 6.0
Basic earnings per share (in CHF) 22.9 18.6
Diluted earnings per share (in CHF) 22.9 18.6
Market capitalization 1,098.1 768.8
Return on net operating assets (RONOA) 22.1 % 19.7 %
Net debt / EBITDA (Gearing) 1.3 1.9
Kaba Holding AGHofwisenstrasse 248153 RümlangSwitzerlandPhone +41 44 818 90 61Fax +41 44 818 90 52www.kaba.com
Security in a dynamic world
1 January 2010 to 30 June 2010
No 34 Shareholder Newsletter