No. 3 October 2011 Crop Prospects and Food Situation
36
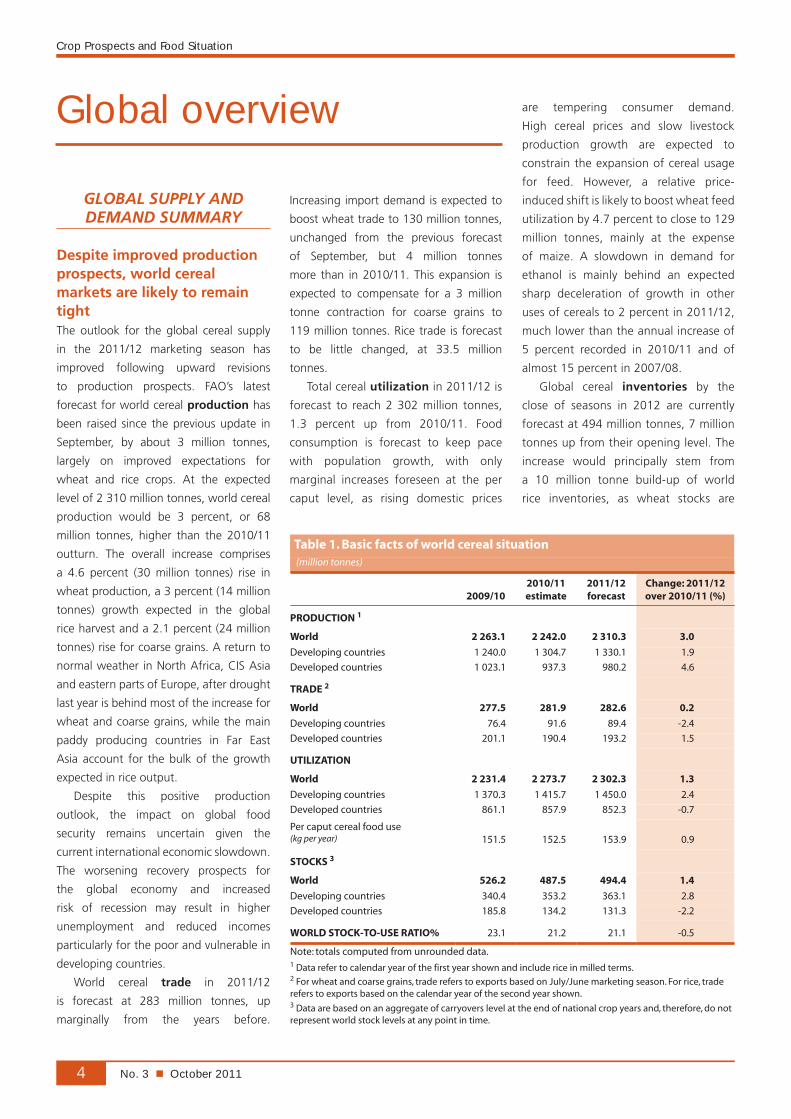
global information and early warning system on food and agriculture GIEWS HIGHLIGHTS CONTENTS No. 3 n October 2011 Crop Prospects and Food Situation Countries requiring external assistance for food 2 Global overview 4 LIFDC food situation overview 8 Regional reviews Africa 11 Asia 19 Latin America and the Caribbean 24 North America, Europe and Oceania 27 Special features/boxes Somalia 15 Statistical appendix 30 n Prospects for global cereal production in 2011 have improved since September, following better expectations for rice and wheat. At the expected record level of 2 310 million tonnes, world cereal production would be 3 percent, or 68 million tonnes, above the reduced 2010 level. n In September, international prices of all cereals with the exception of rice fell sharply, triggered by global economic slowdown and the strengthening of the US dollar as well as large export supplies from the Black Sea region. The expected slower recovery in the world economy will bring more uncertainty to the food security situation. n The aggregate cereal imports of LIFDCs in the 2011/12 are estimated to increase after declining for the previous two years. n In Eastern Africa, the drought-induced humanitarian crisis, especially in famine ravaged southern Somalia, continues to claim lives and decimate livestock. Furthermore, the outlook in the drought affected pastoralist areas remains grim as the lean season progresses. However, the forecast for improved October to December rains in most of the eastern Horn and ongoing relief interventions are expected to ameliorate the situation later in the year. n In West Africa, several areas of the Sahelian belt have been affected by irregular rains during the 2011 cropping season. An early cessation of rains will lead to significant drop in production and increased food insecurity in these regions. n In Far East Asia, record 2011 cereal harvest is anticipated, however, severe localized monsoon floods in several countries - Bangladesh, Democratic People’s Republic of Korea, India, Lao People’s Democratic Republic, Pakistan, Thailand and the Philippines may dampen the final outcome. Flooding in Sindh province of Pakistan particularly, has resulted in severe devastation affecting over 8 million people, destroying some 880 000 hectares of standing crops and causing death of large numbers of livestock. n In Central American countries, excluding Mexico, harvest of the 2011 main season maize crop recovered from last year’s reduced level due to favourable weather during the season and production support programmes. n In South America, the 2011 maize production is estimated at near record level mainly as a result of an increase in plantings. By contrast, this year’s wheat output is forecast to decline from the good level of 2010 mainly due to adverse weather in parts of the region. n FAO’s latest estimates indicate that 32 countries around the world are in need of external assistance as a result of crop failures, conflict or insecurity, natural disasters, and high domestic food prices. The food and nutrition situation remains critical in parts of East Africa. 2010 2008 2011 100 200 300 400 500 600 700 800 900 1000 S A J J M A M F J D N O S A J J M A M F J D N O S A J J M A M F J D N O S A J J M A M F J 2009 Wheat Rice USD/tonne Maize Selected international cereal prices Note: Prices refer to monthly average. See Table 3 for details
Transcript of No. 3 October 2011 Crop Prospects and Food Situation

global information and early warning system on food and agricultureGIEWS
HIGHLIGHTS CONTENTS
No. 3 n October 2011
Crop Prospects and Food Situation
Countries requiring external assistance for food 2
Global overview 4
LIFDC food situation overview 8
Regional reviews Africa 11Asia 19Latin America and the Caribbean 24North America, Europe and Oceania 27
Special features/boxesSomalia 15
Statistical appendix 30
n Prospects for global cereal production in 2011 have improved since September, following better expectations for rice and wheat. At the expected record level of 2 310 million tonnes, world cereal production would be 3 percent, or 68 million tonnes, above the reduced 2010 level.
n In September, international prices of all cereals with the exception of rice fell sharply, triggered by global economic slowdown and the strengthening of the US dollar as well as large export supplies from the Black Sea region. The expected slower recovery in the world economy will bring more uncertainty to the food security situation.
n The aggregate cereal imports of LIFDCs in the 2011/12 are estimated to increase after declining for the previous two years.
n In Eastern Africa, the drought-induced humanitarian crisis, especially in famine ravaged southern Somalia, continues to claim lives and decimate livestock. Furthermore, the outlook in the drought affected pastoralist areas remains grim as the lean season progresses. However, the forecast for improved October to December rains in most of the eastern Horn and ongoing relief interventions are expected to ameliorate the situation later in the year.
n In West Africa, several areas of the Sahelian belt have been affected by irregular rains during the 2011 cropping season. An early cessation of rains will lead to significant drop in production and increased food insecurity in these regions.
n In Far East Asia, record 2011 cereal harvest is anticipated, however, severe localized monsoon floods in several countries - Bangladesh, Democratic People’s Republic of Korea, India, Lao People’s Democratic Republic, Pakistan, Thailand and the Philippines may dampen the final outcome. Flooding in Sindh province of Pakistan particularly, has resulted in severe devastation affecting over 8 million people, destroying some 880 000 hectares of standing crops and causing death of large numbers of livestock.
n In Central American countries, excluding Mexico, harvest of the 2011 main season maize crop recovered from last year’s reduced level due to favourable weather during the season and production support programmes.
n In South America, the 2011 maize production is estimated at near record level mainly as a result of an increase in plantings. By contrast, this year’s wheat output is forecast to decline from the good level of 2010 mainly due to adverse weather in parts of the region.
n FAO’s latest estimates indicate that 32 countries around the world are in need of external assistance as a result of crop failures, conflict or insecurity, natural disasters, and high domestic food prices. The food and nutrition situation remains critical in parts of East Africa.
20102008 2011
100
200
300
400
500
600
700
800
900
1000
SAJJMAMFJDNOSAJJMAMFJDNOSAJJMAMFJDNOSAJJMAMFJ
2009
Wheat
Rice
USD/tonne
Maize
Selected international cereal prices
Note: Prices refer to monthly average. See Table 3 for details

No. 3 n October 20112
Crop Prospects and Food Situation
Countries requiring external assistance for food1
Sierra LeoneSlow recovery from war-related damage. Depreciation of currency led to higher inflation rates negatively affecting households’ purchasing power and food security conditions
Severe localized food insecurity
BeninReduced crop harvest in 2010, generally low food stocks and persistent high prices exacerbate current food insecurity
Burundi Reduced early harvest, low food stocks and high prices. Good B season output improves supplies
Central African RepublicCivil insecurity restricts access to agricultural land and food
ChadLarge numbers of refugees are located in southern and eastern regions of Chad (over 300 000 people from Sudan’s Darfur region and the Central African Republic). Also, the return of an estimated 79 000 Chadians from Libya is putting additional pressure on local food supply
CongoInflux of more than 100 000 refugees since the end of 2009, mostly from DRC, has increased pressure on limited food resources
Côte d’IvoireConflict-related damage to agriculture in recent years and the lack of support services mainly in the northern regions. The recent post-election crisis has forced thousands of people to leave the country and seek refuge mostly in eastern Liberia, where about 172 970 Ivorian refugees were still living as of late August
Dem. Rep. of CongoCivil strife, internally displaced persons, returnees and high food prices
EthiopiaAbout 4.6 million people (plus about 260 000 refugees) are in need of food assistance due to poor rains in southern and south-eastern pastoral areas and in some secondary belg season crop producing areas
AFRICA (24 countries)
Exceptional shortfall in aggregate food production/supplies
LesothoHeavy rains, flooding and prolonged water-logging caused a large decline in 2010/11 cereal production. Just over 500 000 persons categorised as food insecure
SomaliaFamine in several southern areas due to the severe drought affecting agro-pastoralists since last October and the ongoing civil conflict; several livelihood zones of central and northern areas are identified as in crisis; and high international food and fuel prices. About 4 million people in need of food assistance
ZimbabweEconomic constraints and reduced production in southern areas have impacted food insecurity despite the overall improvement in availability of maize
Widespread lack of access
DjiboutiAbout 147 000 people (plus about 19 000 refugees) are in need of humanitarian assistance adversely affected by high food prices; the effects on pastoralists of four consecutive poor rainy seasons; and conflict mainly in neighbouring Somalia
EritreaVulnerability to food insecurity due to economic constraints, high international food and fuel prices, and the negative impact of dry weather especially for the pastoralists
LiberiaSlow recovery from war-related damage. Inadequate social services and infrastructure, as well as poor market access. Massive influx of refugees from Côte d’Ivoire: about 172 970 Ivorian refugees were still living in Liberia as of late August
NigerLingering effects of the 2009/10 food crisis; rising numbers of refugees and returning national migrant workers from Libya are placing increasing demand on food: about 115 000 people arrived in Niger as of mid-August. The most affected areas are Tanout and Gouré
country requiring external assistance for food
World: 32 countries

No. 3 n October 2011 3
Crop Prospects and Food Situation
GuineaAccess to food is negatively affected by high food prices and general inflation
KenyaAn estimated 3.75 million people (plus about 560 000 refugees) are food insecure, due to late and erratic 2011 long-rains in northern, eastern and north-eastern pastoralist and agro-pastoralist areas and in south-eastern and coastal cropping lowlands
Madagascar Localized flooding and the passing of Cyclone Bingiza in early 2011 caused damage to infrastructure and crops in eastern and southern parts of the country
MalawiLocalized flooding and a dry-spell have caused crop losses, affecting the northern district of Karonga and some southern areas. However, prevailing low prices and good national maize supplies have helped to stabilise food security conditions
MozambiqueFlooding and dry conditions in central and southern provinces result in localized production losses but good national cereal harvest boosts supplies
South SudanAbout 1.5 million people are estimated to be food insecure due to a combination of factors, including civil insecurity, trade restrictions along the border areas with Sudan, high food prices and increasing demand by IDPs and returnees
+
SudanAbout 4 million people are in need of food assistance (including about 2 million IDPs in Darfur), due to a combination of factors, including civil insecurity (mainly in South Kordofan, Blue Nile and Darfur) and high food prices
UgandaHigh food prices affecting urban households. About 600 000 people are estimated to be moderately food insecure, mainly in Karamoja and Acholi regions
ASIA (7 countries)
Exceptional shortfall in aggregate food production/supplies
IraqSevere civil insecurity
Widespread lack of access
Democratic People’s Republic of KoreaEconomic constraints and lack of agricultural inputs leading to inadequate food production of the main season aggravated food insecurity. Earlier severe winter conditions reduced wheat harvest and damaged stored seed potatoes; recent floods may reduce the main harvest
MongoliaLingering effects of Dzud in 2009/10 winter resulted in the death of nearly 6 million heads of livestock and affected livelihoods of some 500 000 people
YemenSevere food insecurity persists as a result of recent socio-political unrest, high food prices, internally displaced persons (about 300 000 people still in camps) and refugees (about 170 000 people)
Severe localized food insecurity
AfghanistanDrought, conflict, insecurity and high food prices. Moderately food insecure areas are in the centre and north-east of the country. Poor 2011 wheat harvest exacerbated food insecurity
Countries with unfavourable prospects for current crops2
AFRICA (3 countries)
Kenya Delayed and insufficient 2011 long rains affecting crops, being harvested in southern and coastal marginal agricultural areas
South SudanErratic rainfall in some producing areas
+
SudanHigh likelihood of reduced cereal output in main producing areas due to late onset of the rainy season followed by long dry spells in June and July
+
ASIA (1 country)
Dem. People’s Rep. of KoreaUnfavourable weather - localized floods
+
LATIN AMERICA AND THE CARIBBEAN (1 country)
Severe localized food insecurity
HaitiHouseholds affected by recent hurricanes; lingering effects of devastating earthquake of January 2010
Key - Changes since last report (June 2011)No change Improving Deteriorating New Entry +
Terminology1 Countries requiring external assistance for food are expected to lack the resources to deal with reported critical problems of food insecurity. Food crises are nearly always due to a combination of factors but for the purpose of response planning, it is important to establish whether the nature of food crises is predominantly related to lack of food availability, limited access to food, or severe but localized problems. Accordingly, the list of countries requiring external assistance is organized into three broad, not mutually exclusive, categories:
•Countries facing an exceptional shortfall in aggregate food production/supplies as a result of crop failure, natural disasters, interruption of imports, disruption of distribution, excessive post-harvest losses, or other supply bottlenecks.
•Countries withwidespread lack of access, where a majority of the population is considered to be unable to procure food from local markets, due to very low incomes, exceptionally high food prices, or the inability to circulate within the country.
•Countrieswithsevere localized food insecurity due to the influx of refugees, a concentration of internally displaced persons, or areas with combinations of crop failure and deep poverty.
2 Countries facing unfavourable prospects for current crops are countries where prospects point to a shortfall in production of current crops as a result of a reduction of the area planted and/or yields due to adverse weather conditions, plant pests, diseases and other calamities.
KyrgyzstanLingering effects of socio-political conflict since June 2010 in Jalalabad, Osh and Batken Oblasts; and high prices of staple food after their sharp rise since July 2010
PakistanSevere monsoon flooding in Sindh province affecting over 8 million people, destroying some 840 000 hectares of standing crops and causing death of large numbers of livestock
+
No. 3 n October 20114
Crop Prospects and Food Situation
Global overview
GLOBAL SUPPLY AND DEMAND SUMMARY
Despite improved production prospects, world cereal markets are likely to remain tightThe outlook for the global cereal supply
in the 2011/12 marketing season has
improved following upward revisions
to production prospects. FAO’s latest
forecast for world cereal production has
been raised since the previous update in
September, by about 3 million tonnes,
largely on improved expectations for
wheat and rice crops. At the expected
level of 2 310 million tonnes, world cereal
production would be 3 percent, or 68
million tonnes, higher than the 2010/11
outturn. The overall increase comprises
a 4.6 percent (30 million tonnes) rise in
wheat production, a 3 percent (14 million
tonnes) growth expected in the global
rice harvest and a 2.1 percent (24 million
tonnes) rise for coarse grains. A return to
normal weather in North Africa, CIS Asia
and eastern parts of Europe, after drought
last year is behind most of the increase for
wheat and coarse grains, while the main
paddy producing countries in Far East
Asia account for the bulk of the growth
expected in rice output.
Despite this positive production
outlook, the impact on global food
security remains uncertain given the
current international economic slowdown.
The worsening recovery prospects for
the global economy and increased
risk of recession may result in higher
unemployment and reduced incomes
particularly for the poor and vulnerable in
developing countries.
World cereal trade in 2011/12
is forecast at 283 million tonnes, up
marginally from the years before.
Increasing import demand is expected to
boost wheat trade to 130 million tonnes,
unchanged from the previous forecast
of September, but 4 million tonnes
more than in 2010/11. This expansion is
expected to compensate for a 3 million
tonne contraction for coarse grains to
119 million tonnes. Rice trade is forecast
to be little changed, at 33.5 million
tonnes.
Total cereal utilization in 2011/12 is
forecast to reach 2 302 million tonnes,
1.3 percent up from 2010/11. Food
consumption is forecast to keep pace
with population growth, with only
marginal increases foreseen at the per
caput level, as rising domestic prices
are tempering consumer demand.
High cereal prices and slow livestock
production growth are expected to
constrain the expansion of cereal usage
for feed. However, a relative price-
induced shift is likely to boost wheat feed
utilization by 4.7 percent to close to 129
million tonnes, mainly at the expense
of maize. A slowdown in demand for
ethanol is mainly behind an expected
sharp deceleration of growth in other
uses of cereals to 2 percent in 2011/12,
much lower than the annual increase of
5 percent recorded in 2010/11 and of
almost 15 percent in 2007/08.
Global cereal inventories by the
close of seasons in 2012 are currently
forecast at 494 million tonnes, 7 million
tonnes up from their opening level. The
increase would principally stem from
a 10 million tonne build-up of world
rice inventories, as wheat stocks are
Table 1. Basic facts of world cereal situation (million tonnes)
2009/102010/11 estimate
2011/12 forecast
Change: 2011/12 over 2010/11 (%)
PRODUCTION 1
World 2 263.1 2 242.0 2 310.3 3.0
Developing countries 1 240.0 1 304.7 1 330.1 1.9
Developed countries 1 023.1 937.3 980.2 4.6
TRADE 2
World 277.5 281.9 282.6 0.2
Developing countries 76.4 91.6 89.4 -2.4
Developed countries 201.1 190.4 193.2 1.5
UTILIZATION
World 2 231.4 2 273.7 2 302.3 1.3
Developing countries 1 370.3 1 415.7 1 450.0 2.4
Developed countries 861.1 857.9 852.3 -0.7
Per caput cereal food use (kg per year) 151.5 152.5 153.9 0.9
STOCKS 3
World 526.2 487.5 494.4 1.4
Developing countries 340.4 353.2 363.1 2.8
Developed countries 185.8 134.2 131.3 -2.2
WORLD STOCK-TO-USE RATIO% 23.1 21.2 21.1 -0.5
Note: totals computed from unrounded data.1 Data refer to calendar year of the first year shown and include rice in milled terms.2 For wheat and coarse grains, trade refers to exports based on July/June marketing season. For rice, trade refers to exports based on the calendar year of the second year shown. 3 Data are based on an aggregate of carryovers level at the end of national crop years and, therefore, do not represent world stock levels at any point in time.

No. 3 n October 2011 5
Crop Prospects and Food Situation
anticipated to grow only marginally and,
in the case of coarse grains, to contract
by 4 million tonnes to 161 million tonnes,
the lowest level since 2007. Overall, the
stock-to-use ratio for cereals is expected
to remain low at around 21 percent.
INTERNATIONAL PRICE ROUNDUP
The benchmark US wheat price (No. 2
Hard Red Winter) averaged USD 329 in
September, 2 percent down from USD 336
in August. The tendency for wheat export
prices to slide intensified over the month,
as large supplies from the Black Sea put
downward pressure on prices from other
origins. A stronger US dollar further
contributed to the price decline. Likewise,
the US maize price (yellow, No 2. f.o.b)
dropped by 4 percent in September to
USD 300 per tonne, losing all the ground
gained in August, amid prospects of good
crops in the southern hemisphere countries
and larger old crop supplies (i.e. carryovers
from 2010/11 season) in the United States.
By contrast, international rice prices have
resumed an upward trend since June
2011, influenced by the announcement of
Thailand’s high procurement price policy
to be implemented in October. As a result,
the benchmark Thai rice price (Thai white,
100% B) rose by 6.2 percent in September
to USD 618 per tonne. The price strength,
however, was less apparent in other
origins, dampened by India’s decision to
relax restrictions on non-basmati rice sales
to world markets.
GLOBAL PRODUCTION ROUNDUP
Prospects for world wheat crop in 2011 improved in past few monthsFAO’s latest forecast for global wheat
production in 2011 has been revised
upward for the second month in
succession and now stands at 682.5
million tonnes, 4.6 percent above last
Table 2. Cereal export prices* (USD/tonne)
2010 2011 Sept Apr May Jun Jul Aug Sept*
United States Wheat1 372 364 362 333 307 336 329
Maize2 206 321 309 308 304 313 300
Sorghum2 215 302 277 285 279 304 285
Argentina3 Wheat 299 352 351 341 310 292 300
Maize 229 314 303 306 300 312 295
Thailand4 Rice, white5 499 507 500 519 548 582 618
Rice, broken6 414 423 419 421 445 471 497
*Prices refer to the monthly average. 1 No.2 Hard Red Winter (Ordinary Protein) f.o.b. Gulf.2 No.2 Yellow, Gulf.3 Up river, f.o.b.4 Indicative traded prices.5 100% second grade, f.o.b. Bangkok.6 A1 super, f.o.b. Bangkok.
1800
1900
2000
2100
2200
2300
201120092007200520032001
Million tonnes
Figure 1. World cereal production and utilization
Production
Utilization
f’cast
% %
12
16
20
24
28
32
12
16
20
24
28
32
11/1210/1109/1008/0907/08 2
Total cereals
Rice
Coarse grains
Wheat
forecastestim.
Figure 2. Ratio of world cerealstocks to utilization1
1 Compares closing stocks with utilization in following season.2 Utilization in 2011/12 is a trend value based on extrapolation from the 2000/01-2010/11 period.
year’s level, and only 2.6 million tonnes
below the 2009 record. The revision of the
past months mostly concerns some major
wheat producing countries in Europe and
Asia.
In Europe, the sharp recovery in
production in the CIS countries from the
drought-reduced level of 2010 that was
already predicted early in the season has
turned out even larger than expected,
while particularly favourable conditions
in some eastern EU countries, particularly
Romania and Hungary, have also led to
unexpectedly good outputs, partially
offsetting significant yield reduction this
year in France, due to drought. Thus, the
region’s overall wheat output is currently
forecast to increase by 9.7 percent
compared to last year’s reduced level.
In Asia, after concern over exceptionally
dry conditions in some parts early in the
season, the 2011 wheat harvest in China

No. 3 n October 20116
Crop Prospects and Food Situation
looks set to reach a new record, 1.4
percent up from the previous high last
year. In the CIS group in Asia, production
in Kazakhstan recovered sharply after
drought last year. Elsewhere in the
northern hemisphere, the bulk of the
harvest in the United States was already
completed several weeks ago and after
some delays the spring wheat harvest is
also nearing completion. Latest figures
confirm the country’s aggregate wheat
output is down by about 6 percent on
the previous year. Aggregate output
in North Africa recovered significantly
from last year’s drought-reduced level
following production recoveries in the
main producing countries.
In the southern hemisphere, the bulk
of the major 2011 wheat crops are to be
harvested between now and the end of
the year. In South America, prospects in
Argentina remain satisfactory but more
rains would benefit crops in most areas. On
current indications yields will decline from
last year’s records and given a similar area
planted, the country’s wheat crop is forecast
to drop by almost 5 percent from last year’s
relatively good level. In Brazil, a sharp drop
in output is forecast this year from last
year’s bumper level but production will
remain above the average of the past five
years. In Oceania, prospects for the wheat
crop in some eastern parts of Australia
have deteriorated a little over the past two
months but conditions in Western Australia
still favour a sharp recovery after last year’s
drought in that region. The country’s
aggregate wheat output is forecast to
remain close to last year’s good level.
Wheat planting for 2012 In many parts of the northern
hemisphere the winter wheat crops
for harvest in 2012 are already being
planted or are due to be sown in the
next few weeks. Planting conditions are
reported to be generally favourable in
most of the concerned areas, with the
exception of the United States, where
prolonged dryness in southern parts
is hampering fieldwork and Ukraine,
where conditions are also adversely
dry. With current wheat prices similar
to their levels a year ago and utilization
expected to outstrip supply in 2011/12,
the crop should remain an attractive
option for producers who are expected
to at least maintain similar areas of
wheat as in the previous year or in some
cases increase it. In the United States,
early indications point to a considerable
increase in wheat plantings for the
2012 harvest after relatively small
areas in the past two years. In Europe,
plantings may also increase in the CIS
countries, where farmers will be keen
to continue benefitting from strong
prices and strong demand in the region
after the huge production shortfall in
2010. In the EU, however, with other
crops competing strongly for land,
the wheat area is expected to remain
relatively unchanged. Elsewhere, in
Asia, planting of the winter wheat for
harvest in 2012 is already underway
or due to start in October in the main
producing countries. Persisting dryness
in parts of China and severe floods in
the Sindh province of Pakistan could
impact on the sown area in the affected
regions. However, with favourable
prospects in India, and overall good
incentive for producers to plant wheat
given the continuing relatively high
prices, the aggregate wheat area is
expected to remain near normal.
Growth in global coarse grains output less than anticipatedFAO’s latest forecast for world production
of coarse grains in 2011 stands at 1 147
million tonnes, about 14 million tonnes
down since July, but still 2.1 percent
above the previous year’s level and
virtually matching the record 2008 crop.
The decrease over the past two months
Table 3. World cereal production1 (million tonnes)
20092010
estimate2011
forecastChange: 2011 over 2010 (%)
Asia 987.2 1 010.1 1 042.5 3.2
Far East 885.3 915.6 942.0 2.9
Near East 66.7 69.1 69.1 0.0
CIS in Asia 35.0 25.3 31.3 23.7
Africa 154.6 161.3 158.0 -2.0
North Africa 39.6 33.4 37.6 12.6
Western Africa 49.6 55.2 53.3 -3.4
Central Africa 3.5 3.6 3.5 -2.8
Eastern Africa 32.7 37.3 33.7 -9.7
Southern Africa 29.1 31.8 29.9 -6.0
Central America and Caribbean 37.7 40.5 39.6 -2.2
South America 118.4 142.4 143.4 0.7
North America 466.1 443.8 437.0 -1.5
Europe 463.6 403.3 449.3 11.4
EU 296.4 279.3 283.7 1.6
CIS in Europe 150.8 107.5 149.7 39.3
Oceania 35.5 40.8 40.4 -1.0
World 2 263.1 2 242.0 2 310.3 3.0
Developing countries 1 240.0 1 304.7 1 330.1 1.9
Developed countries 1 023.1 937.3 980.2 4.6
- wheat 685.1 652.4 682.5 4.6
- coarse grains 1 122.4 1 123.2 1 147.3 2.1
- rice (milled) 455.6 466.4 480.5 3.0
Note: Totals computed from unrounded data.1 Includes rice in milled terms.

No. 3 n October 2011 7
Crop Prospects and Food Situation
is all attributed to a reduced forecast for
the maize crop in the United States, which
more than offset raised expectations in
most other major producing countries.
In the United States, the condition of
the maize crop has deteriorated due to
extreme temperatures and dry conditions
and below average yields are now
expected. The latest official forecast puts
output at 317 million tonnes, virtually
unchanged from last year despite a
significant increase in plantings. In Europe,
as for wheat, production of small coarse
grains has recovered this year in countries
that were affected by drought in 2010. In
addition, weather conditions have been
particularly favourable in some key maize
growing areas, and the region’s aggregate
output of maize is forecast to reach a
record high level. In Asia, this year’s coarse
grains crop is also forecast to reach a
new record high, 3 percent up from the
previous high last year. The bulk of the
increase is expected in China, by far the
biggest producer in the region.
In the southern hemisphere, the
main 2011 maize crops were already
gathered earlier in the year. In South
America, output remained close to the
previous year’s relatively good level.
Planting of the 2012 crop is already
underway in some parts. In Argentina
and Brazil, farmers are expected to
expand plantings sharply in response
to strong demand and price prospects.
Maize planting is also starting in
southern Africa where plantings
are expected to increase after some
reduction for the 2011 crop.
World rice production heading to a record on favourable growing conditionsThe outlook for global rice production
in 2011 has improved over the past two
months and the latest FAO forecast has
been raised by 1.6 million tonnes to
480.5 million tonnes (milled rice basis),
3 percent up from 2010 and a new
record. Much of the improvement reflects
better crop prospects in China and
Egypt, but also in Argentina, Cambodia,
Mozambique, the Russian Federation and
the United States. By contrast, prospects
deteriorated for Bangladesh, the Republic
of Korea, Madagascar and Pakistan.
Production in Asia is anticipated to
expand by 2.9 percent, driven by generally
favourable growing conditions and
attractive prices. The increase is foreseen
in all the major rice producing countries,
particularly Bangladesh, China, India and
Indonesia. Moreover, production is expected
to rise in Cambodia, the Philippines,
Thailand and Viet Nam. Output in Pakistan
is set to recover from last year’s reduced
level due to disastrous inundations, despite
recurrence of floods in Sindh province since
mid-August, and seasonal monsoon floods
in several other countries.
In Africa, rice production in 2011
may hover around 17 million tonnes,
2.5 percent more than in 2010. Much
of the increase would be on account of
Egypt, where producers are reported
to have planted much more than last
year, despite government limits on
irrigation water usage. In Western
Africa, favourable growing conditions
and initiatives to boost the rice sector
point to an expansion of production this
season in virtually all of the subregion,
particularly in Nigeria and Sierra Leone.
The late arrival of the rains may well
result in a 10 percent decline in output
in Madagascar.
Much improved weather conditions
are behind a 12 percent recovery of
rice production in Latin America and
the Caribbean to 19.8 million tonnes.
With the exception of Peru and Ecuador,
where drought conditions had prevailed
early in the season, all countries situated
in the southern cone harvested larger
crops, with particularly sizeable gains in
Argentina, Brazil and Uruguay, but also
in Colombia and Venezuela.
In North America, production in the
United States is likely to experience a 20
percent contraction because of reduced
plantings. In Australia, the area under rice
expanded with improved water availability
this year and output is estimated to be
four-fold of the previous year. In Europe,
the Russian Federation is expected to
harvest its largest crop in the decade, but
only a small increase is foreseen in the EU,
triggered by yield improvements.

No. 3 n October 20118
Crop Prospects and Food Situation
Low-Income Food-Deficit Countries food situation overview1
Cereal production of LIFDCs forecast to increase modestly in 2011 but mixed performance in individual countriesThe revised FAO 2011 cereal production
forecast for 70 LIFDC countries indicates
a modest growth of 1.8 percent over
the good harvest of 2010. However,
excluding India, the largest country in this
group accounting for about 40 percent
of the output, aggregate cereal output
of the remaining LIFDCs is expected to
remain stagnant in 2011. Production
increases are expected in the subregions
of Central America, North Africa,
Southern Africa and the Far East,
although the full impact of the ongoing
monsoon flooding situation in many
countries of Asia remains to be quantified.
Cereal production, on the other hand, is
forecast to decline in 2011 as compared
to 2010 in the rest of the subregions. A
major decrease of about 17 percent, is
foreseen in the Near East attributed to
a precipitation deficit during the early
months of the agricultural season and
warmer than usual temperatures during
the later part. Similarly, in Eastern Africa
the output is forecast to decrease by 9.5
percent compared to the previous year’s
record level reflecting devastating impact
of one of the worst droughts currently
ongoing in southern Ethiopia, north-
eastern Kenya, southern and central
Somalia and Djibouti.
Elsewhere in Africa, relatively good
cereal harvests were gathered, particularly
in Southern and North Africa, although
poor outcomes were obtained in some
individual countries, notably Lesotho
and Madagascar. In Western and
Central Africa, where the harvest of
the 2011 main season has started or is
about to start, the aggregate outputs
are projected below the high levels of
2010. Below-normal precipitation during
autumn and shortages of irrigation
water have damped crop yields, in some
countries of CIS, reducing the cereal
output from last year’s marginal levels,
particularly in Turkmenistan, Uzbekistan
and Tajikistan. In Georgia, production
recovered from the reduced level of the
previous year with output increasing by
64 percent. In Moldova, the only LIFDC
in Europe, unfavourable weather has
reduced the 2011 cereal output.
The 2010 cereal production of LIFDCs,
as a group, has been revised slightly
upwards to 545.5 million tonnes from the
543 million tonnes estimate reported in
the June issue of this publication.
Cereal imports of LIFDCs for 2011/12 expected to rise after declining for the previous two yearsThe total cereal import requirements
of LIFDCs in the 2011/12 marketing
year are forecast to increase by about 4
million tonnes, representing a 5 percent
rise over the previous year (Table 6). This
is consistent with the situation of the
stagnant cereal production of LIFDCs,
excluding India, in 2011 and some
anticipated stock building during the
marketing year. Among the subregions,
only the Far East and North Africa are
expected to require lower cereal imports,
mainly due to the improved domestic
food availability in their major countries.
In Southern Africa, in spite of the overall
increase in aggregate production recorded
in the subregion, import requirements
are estimated to increase mainly due to
1 The Low-Income Food-Deficit (LIFDC) group of countries includes net food deficit countries with annual per caput income below the World Bank’s IDA assistance criteria; for full details see http://www.fao.org/countryprofiles/lifdc.asp. The 2011 list of LIFDCs includes 70 countries as opposed to 77 on the 2010 list. Countries graduated from the list are Angola, Armenia, Azerbaijan, China, Equatorial Guinea, Morocco and Swaziland.
Table 4. Basic facts of the Low-Income Food-Deficit Countries (LIFDCs)1 cereal situation (million tonnes, rice in milled basis)
2009/10 2010/11 2011/12Change: 2011/12 over 2010/11 (%)
Cereal production2 518.7 545.5 555.1 1.8
excluding India 315.0 329.3 329.4 0.0
Utilization 581.5 602.3 615.3 2.2
Food use 467.1 480.8 491.5 2.2
excluding India 284.7 293.6 301.4 2.7
Per caput cereal food use (kg per year) 156.3 158.0 159.2 0.8
excluding India 159.0 160.6 162.4 1.1
Feed 53.6 56.7 58.7 3.5
excluding India 43.5 46.1 47.3 2.6
End of season stocks3 104.1 107.7 109.9 2.0
excluding India 63.9 67.7 67.1 -0.9
1 The Low-Income Food-Deficit (LIFDC) group of countries includes net food deficit countries with annual per caput income below the level used by the World Bank to determine eligibility for IDA assistance (i.e. USD 1 855 in 2008); for full details see http://www.fao.org/countryprofiles/lifdc.asp.2 Data refer to calendar year of the first year shown.3 May not equal the difference between supply and utilization because of differences in individual country marketing years.

No. 3 n October 2011 9
Crop Prospects and Food Situation
the poor production in Madagascar and
Lesotho.
Among different commodities, the
aggregate LIFDC wheat imports are
the most important, and are forecast
at about 50 million tonnes in 2011/12.
They represent more than double the
level of rice and coarse grains imports
combined, each around 17 million tonnes.
These commodity imports are forecast
to increase in 2011/12 by 7, 6 and 5
percent for coarse grains, rice and wheat,
respectively, over their corresponding
levels during the year before.
As shown in Figure 3, more than half
(some 36) of the LIFDCs have a very high
cereal import dependency as measured
by the import share of the past five
years, averaging at 30 percent or higher
Table 5. Cereal production1 of LIFDCs(million tonnes)
20092010
estimate2011
forecastChange: 2011 over 2010 (%)
Africa (39 countries) 119.8 130.5 126.9 -2.8
North Africa 20.4 19.6 21.1 7.7
Eastern Africa 32.7 37.3 33.7 -9.7
Southern Africa 13.6 14.8 15.4 4.1
Western Africa 49.6 55.2 53.3 -3.4
Central Africa 3.5 3.6 3.4 -5.6
Asia (22 countries) 394.7 410.6 423.6 3.2
CIS in Asia 11.7 11.4 11.0 -3.5
Far East 369.1 384.3 400.1 4.1
- India 203.7 216.2 225.7 4.4
Near East 13.9 15.0 12.5 -16.7
Central America (3 countries) 2.0 2.0 2.2 10.0
Oceania (5 countries) - - - -
Europe (1 country) 2.2 2.4 2.4 0.0
LIFDC (70 countries) 518.7 545.5 555.1 1.8
Note: Totals computed from unrounded data.1 Includes rice in milled terms. '-' means nil or negligible.
Table 6. Cereal import position of LIFDCs(thousand tonnes)
2009/10 2010/11 or 2011 2011/12 or 2012
or 2010 Requirements1 Import position2 Requirements1
Actual
importsTotal
imports:of which food aid
Total imports:
of which food aid pledges
Total imports:
of which food aid
Africa (39 countries) 41 001 37 689 1 860 25 838 1 075 40 344 2 709
North Africa 15 652 15 671 0 15 671 0 15 671 0
Eastern Africa 8 558 5 786 1 151 3 186 624 7 822 2 066
Southern Africa 2 174 1 715 225 1 725 187 1 870 203
Western Africa 12 878 12 617 369 4 551 208 13 072 296
Central Africa 1 738 1 900 115 704 57 1 909 145
Asia (22 countries) 39 440 38 920 1 430 36 767 552 40 348 1 046
CIS in Asia 3 841 3 620 51 3 599 53 3 829 42
Far East 19 730 22 931 1 213 21 299 378 21 827 834
Near East 15 868 12 369 166 11 869 122 14 692 170
Central America (3 countries) 1 669 1 732 130 1 733 128 1 696 183
Oceania (5 countries) 436 455 0 96 0 464 0
Europe (1 country) 75 70 0 70 0 86 0
Total (70 countries) 82 620 78 866 3 420 64 503 1 755 82 938 3 938
Note: Totals computed from unrounded data.1 The import requirement is the difference between utilization (food, feed, other uses, export plus closing stocks) and domestic availability (production plus opening stocks).2 Estimates based on information available as of early September 2011.

No. 3 n October 201110
Crop Prospects and Food Situation
in the total domestic utilization. The
weighted average of the cereal import
share of LIFDCs, excluding India, is about
20 percent. Currently the number of
LIFDCs with high dependence has been
revised down from 39 in June 2011.
Mozambique, Sierra Leone and Ghana
have reduced their five-year average of
the share of cereal imports in their total
domestic utilization below 30 percent. Of
these 36, the bulk of the countries are
in Africa (19) and the rest in Asia (9) and
elsewhere (8). These countries are highly
vulnerable to food insecurity caused by
high international food prices and thus
require constant monitoring. The sharp
increase in international prices of the main
traded cereals (wheat, rice and maize)
during 2010/11 has had a detrimental
impact on the cereal import bills of these
import dependent countries.
In 2010/11, the cereal import
requirements of the LIFDCs as a whole
are revised to 79.1 million tonnes, some
4.5 percent lower than the previous year’s
actual imports. LIFDCs gathered a record
harvest in 2010, an increase of about 25
million tonnes, over the generally poor
harvest of 2009. Consistent with the
record domestic production of cereals in
2010, imports are estimated to decline
in Asia and in Africa but increase slightly
elsewhere.
0
20
40
60
80
100
Africa (19)
Nicaragua
HondurasHaiti
Vanuatu
Tuvalu
Solomon Is.
Kiribati
Papua New G
uinea
Sri Lanka
Syrian Arab Republic
Tajik
istan
MongoliaIraq
Georgia
Yemen
Cameroon
Zimbabwe
KenyaEgypt
Guinea-Bissau
Eritrea
Gambia
Senegal
Côte D'iv
oire
Lesoth
o
Somalia
Liberia
Mauritania
Comoros
Congo
Sao Tome and Prin
cipe
Djibouti
Others (8)Asia (9)
Average 2006/07-2010/11
2011/12 import requirement
Figure 3. Share of imports in total domestic utilization of cereals (where average share is 30 percent or more)
Bhutan
Timor L
este
Burundi
Dem.Rep. Congo
Table 7. Cereal import bill in LIFDCs by region and type(July/June, USD million)
2006/07 2007/08 2008/09 2009/10 2010/11 2011/12 estimate f'cast
LIFDC 20 734 32 533 26 537 24 633 31 828 32 438
Africa 9 221 16 103 13 015 12 034 15 119 15 837
Asia 11 025 15 527 12 953 11 995 15 919 15 812Latin America and Caribbean 378 605 410 442 585 585
Oceania 99 175 124 136 173 171
Europe 10 123 35 26 33 34
Wheat 12 344 19 426 17 522 14 295 18 392 18 654
Coarse grains 2 562 3 461 3 529 3 152 4 784 5 612
Rice 5 828 9 647 5 485 7 187 8 653 8 171


No. 3 n October 201112
Crop Prospects and Food Situation
estimated at about 3.1 percent in July. The measures adopted by
the countries to combat inflation include subsidizing commodity
prices and/or reducing import taxes on some food items. By
contrast, Algeria’s food inflation rate has been increasing steadily
since December 2010. In July, the increase in the year-on-year
inflation was about 8 percent. In Egypt, the rate of inflation was
estimated at 10 percent in July 2011, down from the previous
month following a peak of 22 percent in April 2011.
Humanitarian assistance needs persist following large movements of refugees and returnees from Libyan Arab JamahiriyaThe civil strife in Libyan Arab Jamahiriya has resulted in high
levels of population displacements, both internally and externally.
According to the International Organization for Migration (IOM),
as of end–August, more than 1.5 million people have been
displaced. Currently, about 190 000 Libyan refugees are in Egypt
and Tunisia. Within Libyan Arab Jamahiriya, large numbers of
internally displaced persons (IDPs) are also reported to be in need
of food assistance and the affected areas have now increased
to include western parts of the country. According to a recent
assessment by FAO and WFP, food stocks are rapidly being
depleted in Libya and together with the deteriorating exchange
rate, there is a growing concern of serious food shortages.
However, the resumption of oil and natural gas and exports is
expected to have a positive impact on Libya’s capacity to replenish
national food stocks and to pay salaries.
In response to the humanitarian situation, an Emergency
Operation was initiated in March 2011 to distribute food to
about 1.5 million people in Libya, Tunisia and Egypt and has now
been extended until February 2012 to cover a total of almost
1.6 million beneficiaries.
Western AfricaOverall crop prospects remain uncertain in West AfricaIn the Sahel region, most countries witnessed a late start of
the rainy season as well as prolonged dry spells through late
July that resulted in replantings in several areas. Precipitation
improved significantly since beginning of August over the main
producing areas, thus replenishing water reserves, providing
relief to stressed crops and improving crop prospects in several
countries. Nevertheless, in the areas affected by earlier dry
conditions, potential yield will be reduced. Extended rains (until
October) will be required to cover their entire growing cycle for
late planted crops. The most affected areas include western
Mali, western and northern Senegal, southern Mauritania,
western Niger as well as the Sahelian zone of Chad. Similarly,
in the coastal countries of the Gulf of Guinea, precipitation has
been irregular in several areas, including parts of Nigeria, the
largest producer in the subregion, whose agricultural sector
can strongly affect the food supply position of its neighbouring
Sahel nations.
Coarse grain prices remain relatively low in most countries while prices of imported commodities, such as rice and wheat, are increasingReflecting the good harvests from late last year, markets have
been generally well supplied. Although coarse grain prices
increased in recent months in most countries, following
seasonal patterns, they remained generally below their levels
of the corresponding months of the previous year. For instance,
millet prices in markets in Niger (Niamey), Mali (Bamako) and
Burkina Faso (Ouagadougou) in September 2011, were 15,
16 and 9 percent, respectively, lower than in September 2010.
In Chad (Ndjamena), millet prices in July 2011 were about 8
percent below their level of a year earlier despite the significant
increase in the past few months. They declined by 49 percent
in the year to July 2011 in Abéché, a food-deficit area located
in the eastern part of the country and home to thousands of
Sudanese refugees.
By contrast, prices of imported commodities have exhibited
significant pass-through from the international market. For
example, in Mauritania (Nouakchott), the average wheat price
increased by 50 percent in July 2011 over July 2010. Similarly,
domestic rice prices have been following an upward trend in
recent months in several countries; about 20 percent higher in
Niger and Burkina Faso in August 2011 than a year earlier.
10000
14000
18000
22000
26000
30000
SAJJMAMFJDNOSAJJMAMFJDNOS2009 20112010
Niger Niamey
Figure 4. Millet prices in selected Western African markets
CFA Franc BCEAO (XOF)/100kg Burkina Faso Ouagadougou
Source: Afrique Verte.
Mali Bamako

No. 3 n October 2011 13
Crop Prospects and Food Situation
Increased transport costs have contributed to higher price of
imported commodities. This effect has been exacerbated in
Liberia by the impact of the recent political crisis in neighbouring
Côte d’Ivoire which has adversely affected trade flows and led
to the influx of thousands of refugees. In spite of the various
measures (such as the suspension of the import tariff on rice and
sale of rice at subsidised price) taken by the Liberian Government,
the price of imported rice in Monrovia in July 2011 was still 28
percent higher than in July 2010. Depreciation of local currencies
against the US Dollar is also fuelling food price increases in several
cereal import dependent countries such a Guinea, Sierra Leone
and the Gambia.
Food security affected by civil insecurity The situation in Libya Arab Jamahiriya is having a serious impact
on food security in neighbouring countries, notably Niger and
Chad where rising numbers of returning migrant workers and
refugees place increasing demand on food. According to the
International Organization for Migration (IOM), about 88 000 and
79 000 persons arrived in Niger and Chad respectively as of early
August. This has practically eliminated the remittances and has
negatively affected the food security of the local communities.
The recent post-election crisis in Côte d’Ivoire forced over
180 000 people to leave the country and seek refuge, mostly
in eastern Liberia while thousands others were internally
displaced. Most displaced
persons have returned to their
areas of origin, following the
improvement of the security
situation but, as of late August,
about 172 970 Ivorian refugees
were still living in Liberia .
Access to food is constrained
for many households by the
disruption of their livelihoods.
The Emergency Humanitarian
Action Plan (EHAP) launched
in April 2011 for Côte d’Ivoire
and neighbouring countries
(including Liberia) has been
revised in July 2011, requesting
USD 166.6 million in support
of humanitarian efforts to
cover the most urgent needs
of refugees, displaced people
and host population. As of
31 August, 47 percent of the
EHAP has been funded.
Central AfricaProspects for the 2011 cereal crops are mixedIn Cameroon and the Central African Republic, harvesting of
the 2011 first maize crop in the southern parts is underway, while
in the Republic of Congo planting is underway. Erratic rains have
caused some crop damage in Cameroon, while above average
rainfall has benefited crops in the Central African Republic
and the Republic of Congo. The late maturing maize crop, for
harvest from December, in northern parts of Cameroon and the
Central African Republic are developing satisfactorily. The FAO
provisional forecast indicates about 5 percent drop in cereal
production in 2011 compared to the year before.
Increasing food pricesIn Cameroon, despite the good 2010 harvest, maize prices have
been increasing since February 2011 across the country. The
highest increase was recorded in Bameda, where maize prices
in June, at 287 CFA Franc/kg, were 40 percent higher than one
year earlier. However, in Yaoundé, at 329 CFA Franc/kg, prices
were only 4 percent higher. In Gabon, higher international
cereal prices have resulted in increased domestic prices, due to
the country’s high dependence on cereal imports. The annual
food inflation rate was estimated at 5.6 percent in July. In
the Central African Republic, relatively good overall food
production during 2010 pushed annual inflation rate down to
1.5 percent from the 3.5 percent the previous year.
Table 9. Western Africa cereal production (million tonnes)
Coarse grains Rice (paddy) Total cereals 1
20092010
estim.2011 f'cast 2009
2010 estim.
2011 f'cast 2009
2010 estim.
2011 f'cast
Change: 2011/2010 (%)
Western Africa 42.3 47.2 45.0 11.5 12.5 12.9 53.9 59.7 58.0 -2.8
Burkina Faso 3.4 4.3 3.8 0.2 0.3 0.3 3.6 4.6 4.1 -10.9
Chad 1.4 3.1 2.4 0.1 0.2 0.2 1.6 3.3 2.7 -18.2
Ghana 2.2 2.4 2.3 0.4 0.5 0.5 2.6 2.9 2.8 -3.4
Mali 4.4 4.1 3.8 2.0 2.3 2.4 6.3 6.4 6.2 -3.1
Niger 3.4 5.2 4.8 0.1 0.1 0.1 3.5 5.3 4.9 -7.5
Nigeria 21.3 22.3 22.1 4.3 4.2 4.3 25.7 26.5 26.4 -0.4
Note: Totals computed from unrounded data, '-' means nil or negligible.1 Total cereals includes wheat, coarse grains and rice (paddy).
Table 10. Central Africa cereal production (million tonnes)
Coarse grains Rice (paddy) Total cereals 1
20092010
estim.2011 f'cast 2009
2010 estim.
2011 f'cast 2009
2010 estim.
2011 f'cast
Change: 2011/2010 (%)
Central Africa 3.2 3.3 3.1 0.5 0.5 0.5 3.7 3.8 3.6 -5.3
Cameroon 1.7 1.8 1.6 0.1 0.1 0.1 1.8 1.9 1.7 -10.5
Central Africa Rep. 0.2 0.2 0.2 - - - 0.2 0.2 0.2 0.0
Note: Totals computed from unrounded data, '-' means nil or negligible.1 Total cereals includes wheat, coarse grains and rice (paddy).
No. 3 n October 201114
Crop Prospects and Food Situation
Civil insecurity still a major cause of food insecurityPersistent civil insecurity continues to hinder agricultural recovery
and humanitarian efforts in the region. Civil conflict in the
Democratic Republic of Congo (DRC) during the end of 2009 led
to a large influx of refugees from the Equateur Province into the
Republic of Congo. The estimated 120 000 refugees, 82 percent
of them women and children, are still living in precarious conditions
in Likouala province (a structurally food-deficit region), in the far
north of Congo. Likouala is the poorest and currently the most
food insecure province in Congo. The sharp increase in population
(by 89 percent in the affected areas) puts pressure on natural
resources, major source of livelihood for the local population.
Trading routes between DRC and Congo have been disrupted,
further affecting food availability. A similar situation is reported
in eastern and northern parts of the Central African Republic,
where civil conflict has exacerbated the already poor food security
situation. Some 192 000 IDPs and 21 000 refugees and asylum
seekers from the Democratic Republic of Congo, Chad and Sudan
continue to require food assistance.
Eastern AfricaContinued humanitarian crisis in SomaliaEastern parts of the Horn of Africa are experiencing the worst
drought in several decades. In the last twelve months the
estimated number of people requiring emergency assistance has
significantly increased. The drought started in late 2010, with
the failure of the October-December rainy season in southern
Ethiopia, north-eastern Kenya, southern and central Somalia and
Djibouti, and it resulted in failed crop production, depletion of
grazing resources and significant livestock mortality. In addition,
the 2011 April-June rains began late and performed erratically
in many parts of the region, preventing recovery of pastures and
affecting yields of the main season crops.
In Somalia, indicators of acute malnutrition, crude mortality
and food access have progressively deteriorated, surpassing
famine thresholds in several southern areas including Bay
Region, Lower Shabelle Region, areas of Bakool Region, areas
of Balcad and Cadale districts in Middle Shabelle Region and
among IDPs in Mogadishu and the Afgooye corridor. The food
insecurity situation is expected to deteriorate until the next
deyr harvest at the beginning of next year and famine may
extend into regions of Gedo, Juba, Middle Shabelle and Hiran.
About 750 000 people are currently estimated to have a high
mortality risk during the next four months if the humanitarian
response is not properly scaled-up. Massive displacement
of people has also occurred both within Somalia and into
neighbouring countries with more than 1.4 million IDPs and
about 917 000 Somali refugees being currently hosted in
Kenya, Ethiopia, Djibouti and Yemen.
In western parts of the Horn of Africa, despite being spared
from the current severe drought, food security conditions remain
difficult in Northern Uganda (especially in Karamoja and Acholi
regions), in Sudan (especially Darfur, South Kordofan and Blue
Nile) and in South Sudan, especially along the northern border
due to disruption of trade activities and the extra burden of
internally displaced persons and returnees following referendum
in January 2011. In the main crop producing areas of central and
northern Ethiopia, western Kenya and central Sudan, rainfall are
expected to be average to above-average until December (with
already some floods reported in Kenya and Uganda) and food
security conditions are likely to improve by the end of the year
with the arrival on markets of the newly harvested crops.
In the whole subregion, 18.6 million people, including 4.6
million in Ethiopia, 4 million each in Somalia and Sudan, 3.75
million in Kenya, 600 000 in Uganda and 147 000 in Djibouti
require emergency assistance. The overall situation is also
exacerbated by extremely high food and fuel prices that limit
access to food for most vulnerable households.
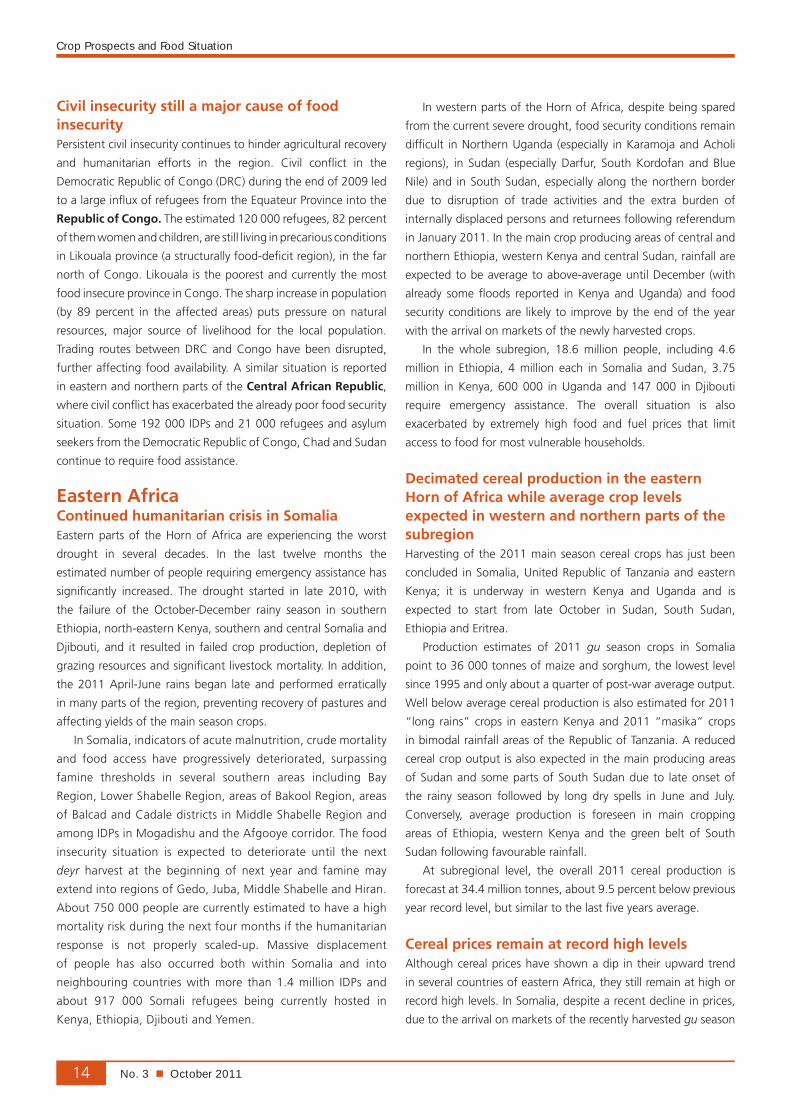
Decimated cereal production in the eastern Horn of Africa while average crop levels expected in western and northern parts of the subregionHarvesting of the 2011 main season cereal crops has just been
concluded in Somalia, United Republic of Tanzania and eastern
Kenya; it is underway in western Kenya and Uganda and is
expected to start from late October in Sudan, South Sudan,
Ethiopia and Eritrea.
Production estimates of 2011 gu season crops in Somalia
point to 36 000 tonnes of maize and sorghum, the lowest level
since 1995 and only about a quarter of post-war average output.
Well below average cereal production is also estimated for 2011
“long rains” crops in eastern Kenya and 2011 “masika” crops
in bimodal rainfall areas of the Republic of Tanzania. A reduced
cereal crop output is also expected in the main producing areas
of Sudan and some parts of South Sudan due to late onset of
the rainy season followed by long dry spells in June and July.
Conversely, average production is foreseen in main cropping
areas of Ethiopia, western Kenya and the green belt of South
Sudan following favourable rainfall.
At subregional level, the overall 2011 cereal production is
forecast at 34.4 million tonnes, about 9.5 percent below previous
year record level, but similar to the last five years average.
Cereal prices remain at record high levelsAlthough cereal prices have shown a dip in their upward trend
in several countries of eastern Africa, they still remain at high or
record high levels. In Somalia, despite a recent decline in prices,
due to the arrival on markets of the recently harvested gu season

No. 3 n October 2011 15
Crop Prospects and Food Situation
Somalia: Famine conditions likely to spread in coming months1
Southern regions facing famineBetween October and December, the food security situation
is projected to deteriorate to famine in agropastoral areas
of Gedo, Juba, Hiran and Middle Shabelle, riverine areas of
Gedo and Juba and pastoral areas of Bakool. The projection
is based on current global acute malnutrition (GAM) levels
exceeding 30 percent, mortality rates exceeding 1 in 10 000
per day, and an expectation of further deterioration in food
access. Worsening food access is considered likely due to
the absence of cereal stocks at the household level, limited
income options, weakening purchasing power as a result of
anticipated surge in cereal prices and continuing constraints
to humanitarian efforts.
Local cereal prices, which have shown some decline
following the inflow of the gu harvest to markets, are likely to
start escalating again from October as the limited supply from
the recent harvest is soon exhausted. These prices particularly
for red sorghum are likely to reach levels even higher than
during the recent May-June 2011 peak. Therefore, the
purchasing power and the standard of living of the population
in rural and urban areas will continue to fall across most parts
of the country through to the end of the year.
Based on the current climate outlook, a normal start of the
2011 deyr rainy season is expected across the country. The
rains will encourage cultivation in southern regions although
in the main sorghum-producing region of Bay planting,
plantings are projected to be below normal. This is mainly
attributable to large population outflow from Bay region
towards refugee camps in Kenya and Ethiopia and feeding
centres in Mogadishu. As the out-migrated populations
mostly comprise poor households who lack food and income,
the chances of them returning to their region for deyr season
cultivation are low, particularly for those who went across
the border to Ethiopia and Kenya. Therefore, cultivation
among the poor households, who normally contribute about
27 percent of the total cultivated land in the region, will be
considerably reduced.
Some improvement may occur in pastoral areas of Gedo
and Juba assuming pasture and water conditions improve
with the onset of the deyr season in October, which may
also prompt the return of camel herds. Conversely, the onset
of the rainy season is expected to increase the mortality risk
related to malaria and other diseases.
Central and Northern Regions in crisisThe livelihood zones of central and northern areas are expected
to remain in the current phase of in-crisis for several months
as the recovery from the impact of the prolonged drought
(e.g. high livestock off-take and indebtedness) will require
several normal seasons. However, these pastoral livelihoods
will benefit from improved pasture and water in the deyr rainy
season as well as increased livestock prices during the Hajj
period (October-November).
In the agro-pastoral areas of the North-West, the gu-
karan harvest outlook is favourable due to on-going karan
rains, which have partly improved crop establishment and
development.
Drought responseThe revised Somalia Consolidated Appeal has been completed
in August and total requirements were set at about one billion
US dollars. Funding received by 14 September is USD 644
million, leaving an uncovered gap of 38 percent. Food
assistance interventions are 81 percent funded, while actions
to support agriculture and livelihoods are only 26 percent
covered.
The main activities of the FAO drought response
programme are: (1) restoring crop production capacity by
distributing seeds and tools; (2) distribution of fodder to
small-scale herders; (3) vaccination and treatment of livestock;
(4) provision of water tanks and water trucking; and (5) cash-
for-work activities. FAO’s short term response appeal amounts
to USD 161 million, of which funds received plus in pipeline
total USD 65 million as of 29 September 2011.
1 Based on information provided by FAO/FSNAU and FEWSNET.

No. 3 n October 201116
Crop Prospects and Food Situation
crops and the relative increase in food aid distribution, the August
price of red sorghum in Mogadishu, Baidoa and Marka markets
was still between USD 500 and USD 690 per tonne, about 170
and 230 percent higher than a year earlier. Similar situation is
reported in Kenya, Uganda and the United Republic of Tanzania,
where maize prices dropped substantially in August, but were
still well above their levels of twelve months earlier. By contrast,
cereal prices in main markets in Ethiopia continued their rising
trend that started last February, with increases between 40 and
140 percent in the last six months registering record levels for all
crops. This trend is likely to continue in the next few months until
the start of the 2011 main meher season harvest. In Sudan, prices
of sorghum increased from June to August in several markets
but are still lower (between 7 and 50 percent) than a year earlier
due to good stock levels from
the 2010 bumper harvest
and reduced exports to South
Sudan. Cereal prices in South
Sudan are well above their
levels of a year ago (an increase
of between 10 and 70 percent)
following the increased demand
from IDPs and returnees from
Sudan and the trade restrictions
in bordering areas with Sudan.
Southern AfricaGood harvest in the subregion but floods and dry spell damaged crops in some countriesHarvesting of the main food crop, maize, was completed in July
and latest estimates point to an aggregate crop for the subregion
of approximately 23 million tonnes, lower than last year’s record
level. Continued input support and expansion in area planted
in most countries resulted in the good crop. However, torrential
rains across the Zambezi basin and southern and western parts
of the subregion caused localized flooding negatively impacting
crop development and reducing national cereal production in
Angola, Lesotho and Namibia. A period of relative dryness that
followed during February also caused crop wilting, notably in
southern parts of Malawi and Zimbabwe.
The largest producing country of the subregion, South Africa,
registered a 16 percent drop in maize production, primarily on
account of a contraction in the area planted in response to lower
maize prices in 2010 at planting. In addition, some flood damage
was also experienced and unusually wet conditions in June and
July delayed harvesting. Zambia and Malawi achieved record
maize crops of 3 and 3.9 million tonnes, respectively, supported
by generally favourable rainfall patterns and good availability
of inputs; however, southern areas in both countries suffered
localized production losses. In Zimbabwe and Swaziland,
despite an increase in the planted area to maize, the irregular rains
impacted yields, resulting in only moderate production increases.
Production of maize in Mozambique is estimated at slightly above
while the rice harvest in Madagascar is estimated to be below
the previous season’s output. Sorghum and millet production in
the subregion fell relative to last year, partly attributed to a switch
to maize production that is favoured for input supplies. Following
the decline in wheat production in 2010, a growth in the area
planted in Zambia and South Africa, which account for about
95 percent of the subregion’s output, has increased production
prospects for 2011. The preliminary forecast for wheat is for a
level just over 2 million tonnes, 20 percent above last season’s
harvest. The prevailing high international prices spurred an
expansion in wheat plantings in South Africa.
Table 11. Eastern Africa cereal production (million tonnes)
Wheat Coarse grains Total cereals 1
20092010
estim.2011 f'cast 2009
2010 estim.
2011 f'cast 2009
2010 estim.
2011 f'cast
Change: 2011/2010 (%)
Eastern Africa 4.2 4.0 3.6 27.3 32.1 28.8 33.3 38.0 34.4 -9.5
Ethiopia 3.3 3.0 2.7 13.4 14.2 12.6 16.8 17.4 15.5 -10.9
Kenya 0.2 0.3 0.2 2.6 3.2 3.0 2.9 3.5 3.3 -5.7
Sudan 2 0.4 0.4 0.5 3.1 5.3 4.6 3.6 5.8 5.1 -12.1
Tanzania U.R. 0.1 0.1 0.1 4.3 4.7 4.3 5.7 6.2 5.7 -8.1
Uganda - - - 2.6 3.2 3.0 2.8 3.4 3.2 -5.9
Note: Totals computed from unrounded data, '-' means nil or negligible.1 Total cereals includes wheat, coarse grains and rice (paddy). 2 Including South Sudan.
100
200
300
400
500
600
SAJJMAMFJDNOSAJJMAMFJDNOS2009 20112010
USD/tonne
Tanzania U.R. Dar-es-Salaam
Kenya Nairobi
Figure 5. Maize prices in selected Eastern African markets
Uganda Kampala
Sources: Regional Agricultural Trade Intelligence Network;Ethiopian Grain Trade Enterprise.
Ethiopia Addis Ababa

No. 3 n October 2011 17
Crop Prospects and Food Situation
The 2011/12 rainfall forecast indicates that the subregion is
likely to experience normal to below normal rainfall during the
first half of the rainy season (October-December), except for far
northern portions of Malawi, Mozambique and Zambia, which
are expected to receive above normal rainfall. During the second
period, from January to March 2012, rainfall levels are forecast
to increase, with heavier rains expected in eastern areas. Many
of the input programmes are shifting towards subsidized voucher
schemes as opposed to direct distribution of inputs.
Import requirements remain below average for the subregionCurrent estimates for the 2011/12 marketing year indicate that the
subregion’s aggregate cereal import requirement is expected to rise
slightly to 6.2 million tonnes. Disaggregated by crop, total maize
import requirements are forecast to contract marginally; however,
Angola, Lesotho and Namibia are anticipated to import larger
quantities following the smaller harvests gathered in 2011. Wheat
Table 12. Southern Africa cereal production (million tonnes)
Wheat Coarse grains Rice (paddy) Total cereals
20092010
estim.2011 f'cast 2009
2010 estim.
2011 f'cast 2009
2010 estim.
2011 f'cast 2009
2010 estim.
2011 f'cast
Change: 2011/2010 (%)
Southern Africa 2.2 1.7 2.2 23.5 26.6 24.5 5.0 5.2 4.8 30.7 33.5 31.5 -6.0
- excl. South Africa 0.3 0.3 0.3 11.3 12.7 12.8 5.0 5.2 4.8 16.6 18.2 17.9 -1.6Madagascar - - - 0.4 0.4 0.4 4.5 4.8 4.3 4.9 5.2 4.7 -9.6
Malawi - - - 3.7 3.5 4.0 0.1 0.1 0.1 3.9 3.6 4.1 13.9
Mozambique - - - 2.4 2.5 2.6 0.3 0.3 0.3 2.6 2.8 2.9 3.6
South Africa 2.0 1.4 1.9 12.2 13.9 11.7 - - - 14.1 15.3 13.6 -11.1
Zambia 0.2 0.2 0.2 2.0 2.9 3.1 - 0.1 - 2.2 3.1 3.4 9.7
Zimbabwe - - - 1.5 1.6 1.7 - - - 1.6 1.6 1.7 6.3
Note: Totals computed from unrounded data, '-' means nil or negligible.
import requirements, which have been increasing over the last ten
years in response to the general fall in production, are estimated to
grow moderately, while the estimated trade in millet and sorghum
remains comparatively unchanged. Rice imports are anticipated
to increase for Madagascar and Mozambique due to a reduced
harvest relative to last year’s output and also South Africa.
Adequate supplies maintain comparatively low prices; seasonable increase observedSeasonal increase in maize prices has been observed, following
low levels reached in May-June in most markets across the
subregion. National average retail maize grain prices in Malawi
hit a seasonal low in May at USD 0.16 per kg, its lowest level since
2007. Similarly in Zambia at USD 0.20 per kg in June, the national
average retail price of maize was at its lowest level since 2008. In
July and August, prices increased moderately in both countries.
In Mozambique, maize prices remain at comparable levels to
last year while in Zimbabwe prices are at slightly elevated levels
relative to the previous season. The re-introduction of import
duties in Zimbabwe on maize meal products is expected to exert
some upward pressure on prices, but it is too early to gauge the
impact of the reinstatement. Rice prices in Madagascar increased
in July and August and are at a higher level than last year by
about 14 percent, in response to a lower harvest and higher
transportation costs. By contrast, in Maputo, Mozambique, rice
prices are below levels of last year, despite some increase in the
previous two months.
In contrast to the subregion’s general price movements,
South Africa’s monthly maize (white) price has been increasing
since mid-2010 and in August 2011 reached a record level, at
Rand 2 067 per tonne. The upward trend is attributed to several
factors, including stronger international prices and an estimated
drop in production for the 2011 harvest. Furthermore the weaker
Rand and relatively low domestic prices of maize compared to
the international market have supported strong export demand,
applying pressure to price rises over the last year.

No. 3 n October 201118
Crop Prospects and Food Situation
Overall satisfactory food security conditions, but pockets of vulnerability exist due to localized production shortfallsThe favourable national harvests enabled households to replenish
their stocks, while increased market supplies have contributed to
lower prices, benefiting net-buying households. However, despite
adequate subregional cereal supplies as well as normal flows of
trade, localized food insecurity conditions exist in areas affected
by erratic weather conditions in Lesotho, northern Namibia,
southern and northern parts of Malawi, southern Zimbabwe and
Angola, and the semi-arid regions of Mozambique. Torrential
rains had a severe impact on national production levels in Angola,
Lesotho and Namibia, and vulnerability assessments indicate that
cereal supplies from own production for some of the affected
households in Namibia are already exhausted, increasing their
reliance on market supplies earlier than normal. The number of
food insecure in Lesotho and Namibia more than doubled as a
result of the poor harvests this year, estimated to be 514 000
and 243 474 persons respectively. Elsewhere, the generally
satisfactory food security conditions that prevail across the
subregion are expected to continue until the beginning of the
lean season towards the end of 2011.
Great Lakes RegionOverall improved harvest, despite localized crop lossesIn Burundi and Rwanda, the 2011 B season (February-July)
was characterized by generally adequate rains and an increase
in area planted. The B season cereal harvest, estimated at
224 403 and 441 000 tonnes, is 6 percent and 30 percent
higher in Burundi and Rwanda respectively, relative to the
corresponding season in 2010. However, despite the generally
favourable conditions, in eastern Burundi irregular and
insufficient rains led to some crop losses, while heavy rains
around the harvesting period caused damage to the bean
crop. The occurrence of banana bacterial wilt in Burundi and
the prevalence of cassava mosaic disease continue to impact
production, with negative consequences for households’
income and food stocks.
Food security conditions in Rwanda are generally stable,
following improved national supplies from the B season’s harvest.
In Burundi, however, generally depleted stock levels, due to a
poor A season harvest earlier in the year, continue to constrain
households’ food security conditions.
Cereal prices remain high, despite seasonal declineFood prices remain generally higher than the previous year in
Burundi and Rwanda, however, prices began to decline following
the favourable B season harvests in both countries. Maize prices
in Rwanda, at USD 0.36 per kg in August were more than double
their levels of 2010, while bean prices, at USD 0.47 per kg were
at a comparable level to last year. Similarly, in Burundi maize
prices were higher by 33 percent in August 2011, but bean prices
were marginally lower. The elevated prices are attributed to a
combination of factors, including higher transportation costs and
higher demand from regional markets, particularly for cereals,
following the impact of drought in several east African countries.
Given the large portion of poorer households’ income allocated
to food purchases, the higher prices are expected to impede food
access and further aggravate the food insecurity conditions of
vulnerable groups.
In the Democratic Republic of Congo, maize prices
exhibit mixed trends, resulting in significant variability across
the country. In the southern town of Lubumbashi, continued
imports from Zambia and the arrival of the 2011 harvest
improved supplies and lowered prices between May to
August 2011. In contrast, prices in the north-eastern town
of Bunia increased significantly (by 50 percent) between May
and July, partly due to the high regional demand. However,
new supplies from the harvest in July/August helped lower
prices, but they still remain more than 50 percent higher
than in August 2010. Civil insecurity continues to constrain
agricultural production and exacerbates the food insecurity
of vulnerable groups, particularly in north-eastern parts of
the country. Limited agricultural productive capacity and the
deterioration of the mining industry have also severely affected
food security in central provinces.
0.0
0.1
0.2
0.3
0.4
0.5
0.6
AJJMAMFJDNOSAJJMAMFJDNOSA2009 20112010
Figure 7. White maize prices in selected Southern African markets
USD/kg
South Africa* Randfontein
Mozambique Manica
Zambia National average
*Wholesale prices, all others retail prices.
Zimbabwe Harare
Sources: Central Statistical Office, Zambia; Sistema de Informação de Mercados Agrícolas de Moçambique, Mozambique; SAFEX Agricultural Products Division, South Africa; WFP/CFSAM/FEWSNET, Zimbabwe.

No. 3 n October 2011 19
Crop Prospects and Food Situation
Note: Comments refer to situation as of September.
Southeastern Asia: •rice(main):reproductivetomaturing/harvesting•maize:planting
Near East: •wintergrains:landpreparation
China: •singlecroprice,maize(north)andsoybean:harvesting•laterice:maturing•winterwheat:planting
South Asia: •rice:maturingtoharvesting•coarsegrains:harvesting
India: •rice(Kharif):harvestingbegins•maizeandmillet::reproductive to maturing•wheat(Rabi):plantingbegins•rice(Rabi):landpreparationto planting
Asia (CIS): •wheat:harvested•maize:harvested•wintercrops:planting
Table 13. Far East cereal production (million tonnes)
Wheat Coarse grains Rice (paddy) Total cereals
20092010
estim.2011 f'cast 2009
2010 estim.
2011 f'cast 2009
2010 estim.
2011 f'cast 2009
2010 estim.
2011 f'cast
Change: 2011/2010 (%)
Far East 223.4 223.3 229.6 253.9 273.6 281.4 611.2 627.6 646.1 1 088.5 1 124.4 1 157.1 2.9
Bangladesh 0.8 1.0 1.0 1.0 1.1 1.2 48.0 50.3 51.3 49.8 52.3 53.5 2.3
Cambodia - - - 0.9 0.8 0.9 7.6 8.2 8.8 8.5 9.0 9.7 7.8
China 115.1 115.2 116.8 173.2 186.7 191.9 196.7 197.2 200.8 485.0 499.1 509.6 2.1
India 80.7 80.8 84.3 33.9 40.1 41.4 133.6 143.0 150.0 248.2 263.9 275.6 4.4
Indonesia - - - 17.6 18.4 17.9 64.4 66.5 68.1 82.0 84.8 86.0 1.4
Japan 0.7 0.8 0.8 0.2 0.2 0.2 10.6 10.6 10.3 11.5 11.7 11.3 -3.4
Korea Rep. of - - - 0.4 0.4 0.3 6.6 5.8 5.8 7.0 6.2 6.1 -1.6
Korea DPR 0.1 0.1 0.2 1.8 1.7 1.8 2.3 2.4 2.5 4.3 4.2 4.4 4.8
Myanmar 0.2 0.2 0.2 1.4 1.4 1.5 31.0 30.8 31.0 32.5 32.4 32.6 0.6
Nepal 1.3 1.6 1.8 2.2 2.4 2.4 4.0 4.5 4.5 7.5 8.4 8.7 3.6
Pakistan 24.0 23.3 24.2 3.8 3.9 4.1 10.3 7.2 9.7 38.1 34.5 38.0 10.1
Philippines - - - 7.0 6.4 7.3 15.5 16.7 17.3 22.5 23.1 24.6 6.5
Thailand - - - 4.8 4.1 4.4 32.1 34.5 35.0 36.9 38.6 39.4 2.1
Viet Nam - - - 4.4 4.7 4.8 38.9 40.0 41.0 43.3 44.6 45.8 2.7
Note: Totals computed from unrounded data, '-' means nil or negligible.
Asia
Far EastRecord 2011 cereal harvest for the subregion, but monsoon floods may dampen production in some countriesHarvesting of the 2011 main season cereal crops is
beginning in most countries of the subregion. FAO
preliminarily estimates the aggregate cereal output
(including rice in paddy terms) at 1.16 billion
tonnes, about 2.8 percent above the 2010 record
harvest. Significant gains in Cambodia, India, the
Philippines and Timor-Leste and recovery from
last year’s poor harvests in Pakistan are anticipated.
However, severe localized flooding in Bangladesh,
Democratic People’s Republic of Korea, India,
Lao People’s Democratic Republic, Pakistan,
Thailand and the Philippines, may dampen the actual harvest
of the current monsoon season. Particularly, the monsoon floods
in Sindh province of Pakistan this year have resulted in a severe
devastation affecting over 8 million people, destroying some
880 000 hectares of standing crops and causing death of nearly
92 000 heads of livestock. However, damage to the current
paddy crop is moderate and is estimated by FAO and Pakistan’s
space agency (SUPARCO), as of 20 September, at about 252 700
tonnes, or 2.5 percent of the normal national production.
Production of paddy rice, the major staple crop in the subregion,
accounting for about 56 percent of the total cereal output, is
tentatively forecast at a record level of 647 million tonnes or 2.8
percent greater than the bumper harvest of 2010. Though no precise
flood damage estimates are currently available, the heavy rains
primarily affected the main wet season rice crop (with low lying areas
particularly susceptible to seasonal flooding) and to some extent
coarse grains which were at the growing stage in many countries
of the subregion. In China, although the worst drought in 60 years
has been reported in northern and eastern parts, no significant
drop in output is anticipated given the corrective measures, such
as the increased water outflows through the irrigation systems
and provision of other resources to farmers, undertaken by the
Government to mitigate the impact of the drought. However, a poor
harvest was estimated in Sri Lanka due to severe flooding earlier

No. 3 n October 201120
Crop Prospects and Food Situation
Sindh province of Pakistan which has been
affected by severe floods. However, for the
region as whole, the relatively high prices
for the commodity are expected to boost
the area planted.
Rice imports and wheat exports are expected to remain strong in 2011/12Despite the estimated overall increase
in cereal production in 2011 in most
countries of the subregion, the aggregate
cereal imports in 2011/12 are expected to
remain strong, similar to the year before.
In the case of rice, a significant increase of
about 500 000 tonnes or 6.2 percent over the 2010/11 level is
anticipated mostly due to the forecast increases in rice imports by
Indonesia, the Philippines and Malaysia. The subregion is a net
exporter of rice and in spite of the improvement in the aggregate
production, the commodity exports are preliminarily estimated to
decrease slightly in 2011/12. On the other hand, the subregion is
a net importer of wheat and the import volume of this commodity
is expected to remain high at about 33 million tonnes in 2011/12
similar to 2010/11. The overall trade (imports plus exports) in
2011/12 is also set to increase for the fourth year in a row.
Rice and wheat prices follow mixed trendsDomestic prices for rice in several countries of the subregion,
such as China, Indonesia and Pakistan, have been rising
Table 14. Far East cereal production and anticipated trade in 2011/12 1 (thousand tonnes)
Avg 5-yrs (2006/07 to
2010/11) 2010/11 2011/12
2011/12 over 2010/11
(%)
2011/12 over 5-yr avg
(%)
Cereals - Exports 32 361 34 898 35 473 1.6 9.6
Cereals - Imports 80 851 87 052 87 390 0.4 8.1
Cereals - Production 873 195 915 554 942 046 2.9 7.9
Rice-millled - Exports 24 494 26 295 26 020 -1.0 6.2
Rice-millled - Imports 8 613 9 310 9 884 6.2 14.8
Rice-millled - Production 404 451 418 718 431 057 2.9 6.6
Wheat - Exports 2 744 3 160 4 060 28.5 48.0
Wheat - Imports 31 076 33 202 33 045 -0.5 6.3
Wheat - Production 215 405 223 259 229 590 2.8 6.6
1 Marketing year July/June for most countries. Rice trade figures are for the second year shown.
2009 2011
0.2
0.3
0.4
0.5
0.6
0.7
0.8
0.9
1.0
1.1
SAJJMAMFJDNOSAJJMAMFJDNOS2010
USD/kg
Figure 8. Rice retail prices in selected Far Eastcountries
Indonesia national average
Sources: Badan Pusat Statistik (BPS), Indonesia; Ministry of Consumer Affairs, India; Bureau of Agriculture Statistics, Philippines; Agroinfo, Viet Nam.
Philippines, (RMR) national average
Viet Nam, (25% broken milled) Dong Thap
India Delhi
2009 2011
0.2
0.3
0.4
0.5
0.6
0.7
0.8
SAJJMAMFJDNOSAJJMAMFJDNOS2010
USD/kg
Figure 9. Wheat and wheat flour retail prices in selected Far East countries
Sources: Pakistan Bureau of Statistics; Ministry of Consumer Affairs, India; Management Information System and Monitoring, Bangladesh; National Bureau of Statistics of China.
India (wheat)Delhi
Pakistan (wheat)Lahore
Bangladesh (wheat flour)Dhaka
China (wheat flour)Average of main 50 cities
in the season, while a powerful earthquake on 11 March 2011
and ensuing tsunami and the Fukushima nuclear plant radioactive
leakage have impaired the crop in Japan this year.
Harvesting of winter crops, such as wheat and barley, was
completed earlier in the year in the main wheat producing countries
- China, India and Pakistan. The aggregate subregional wheat
harvest of 2011, revised upwards from FAO’s June estimate at
229.6 million tonnes, represents an improvement of 2.7 percent
over the generally poor production in 2010.
Planting of the 2012 winter crops, mainly wheat, is underway
in China and will begin in October and continue until mid-
December in India and Pakistan. The aggregate area planted is
anticipated to be near normal given the ongoing dry conditions in
China but above average rainfall in the Indian subcontinent, except

No. 3 n October 2011 21
Crop Prospects and Food Situation
since March-April of this year following the trend in export
prices, in the main exporting countries in the region namely
Thailand and Viet Nam. The prices are also considered
to be high particularly in comparison with the pre-crisis
period before mid-2008. In Thailand, a new Government
paddy buying scheme is scheduled to be introduced in
early October 2011. However, the rice export prices have
firmed since the announcement of this scheme. Under this
scheme, procurement prices will be set at THB 15 000/
tonne (USD 502) for premium white rice and 20 000/tonne
(USD 667) for fragrant rice, which are 66 and 33 percent
higher than current market prices, respectively. In Viet Nam
and Indonesia, rice prices moved upwards reaching record
levels in September 2011, being 32 and 13 percent,
respectively, above their levels of a year ago. In some other
countries such as Bangladesh, Bhutan, Cambodia, Lao PDR,
Nepal and the Philippines, where domestic markets may be
somewhat insulated from the price volatility, they remained
virtually unchanged compared to the corresponding month
last year. In China, the average retail price of rice has been
stable since March 2011; however, it was 14 percent higher
in September 2011 than a year ago.
Food security difficulties worsened by monsoon floods and high food prices in several countriesOverall food security conditions have improved in several
countries, such as India, Nepal and the Philippines, following
the good harvests, increased incomes due to employment
opportunities provided by development programs and regular
supply of food to the local markets. However, excessive
downpour during this monsoon season has led to flash flooding
in many countries of the subregion. In Pakistan, torrential rains
destroyed vast areas of cotton, sugarcane, rice and vegetable
crops. The adverse impact of the floods which caused significant
losses of households’ food stocks and livestock are worsening
food security of the vulnerable population.
Near EastMixed outturn of winter crop harvests Harvesting of 2011 winter wheat and barley crops is
complete throughout the subregion. In Turkey, official early
estimates indicate a bumper wheat production of 21.8 million
tonnes, essentially due to favourable growing conditions
during the season that led to high yields in major producing
areas of central Anatolian highlands, the Cukurova region
and throughout the south and south-east. By contrast, in
Afghanistan, Iraq and the Syrian Arab Republic, wheat
production is estimated at below average levels as the
season has been characterized by late and erratic rains
which negatively affected crop planting and development.
In the Islamic Republic of Iran, the 2011 wheat harvest
is similar to last year’s level but about one million tonnes
below the average annual output achieved between 2004
and 2007.
In aggregate, the 2011 winter cereal production in the
Near East subregion is forecast at 58.7 million tonnes,
similar to the good output of previous year and 4 percent
above the last five year average.
High food prices and civil unrest, in parts, affecting food securityIn Yemen and the Syrian Arab Republic, current political
and social unrest is causing disruptions commodity and
humanitarian aid distribution channels, with consequent
localized food shortages in main markets and unusual
increases in food prices. As result of recent violence in
south Yemen, the total number of IDPs and refugees,
predominantly Somalis, has reached a record figure of
600 000, and are in need of food assistance. Flash floods in
western areas of Afghanistan, followed by dry-conditions
in the northern, north-eastern and western areas of the
country, have reduced households’ grain harvests and
worsened food security especially of the vulnerable people.
Table 15. Near East cereal production (million tonnes)
Wheat Coarse grains Rice (paddy) Total cereals
20092010
estim.2011 f'cast 2009
2010 estim.
2011 f'cast 2009
2010 estim.
2011 f'cast 2009
2010 estim.
2011 f'cast
Change: 2011/2010 (%)
Near East 45.1 45.3 45.3 19.2 21.1 21.2 3.8 4.2 4.2 68.1 70.6 70.7 0.1
Afghanistan 5.1 4.5 3.3 0.8 0.8 0.6 0.6 0.6 0.6 6.5 5.9 4.5 -23.7
Iran (Islamic Rep. of ) 13.0 13.5 13.5 3.5 4.7 5.0 2.3 2.5 2.5 18.8 20.7 21.0 1.4
Iraq 1.4 2.4 2.0 0.7 1.3 1.1 0.2 0.2 0.2 2.3 3.8 3.3 -13.2
Syrian Arab Republic 3.7 3.6 3.2 1.0 0.9 0.8 - - - 4.7 4.5 4.1 -8.9
Turkey 20.6 19.7 21.8 12.2 12.2 12.5 0.8 0.9 0.9 33.6 32.7 35.2 7.6
Note: Totals computed from unrounded data, '-' means nil or negligible.
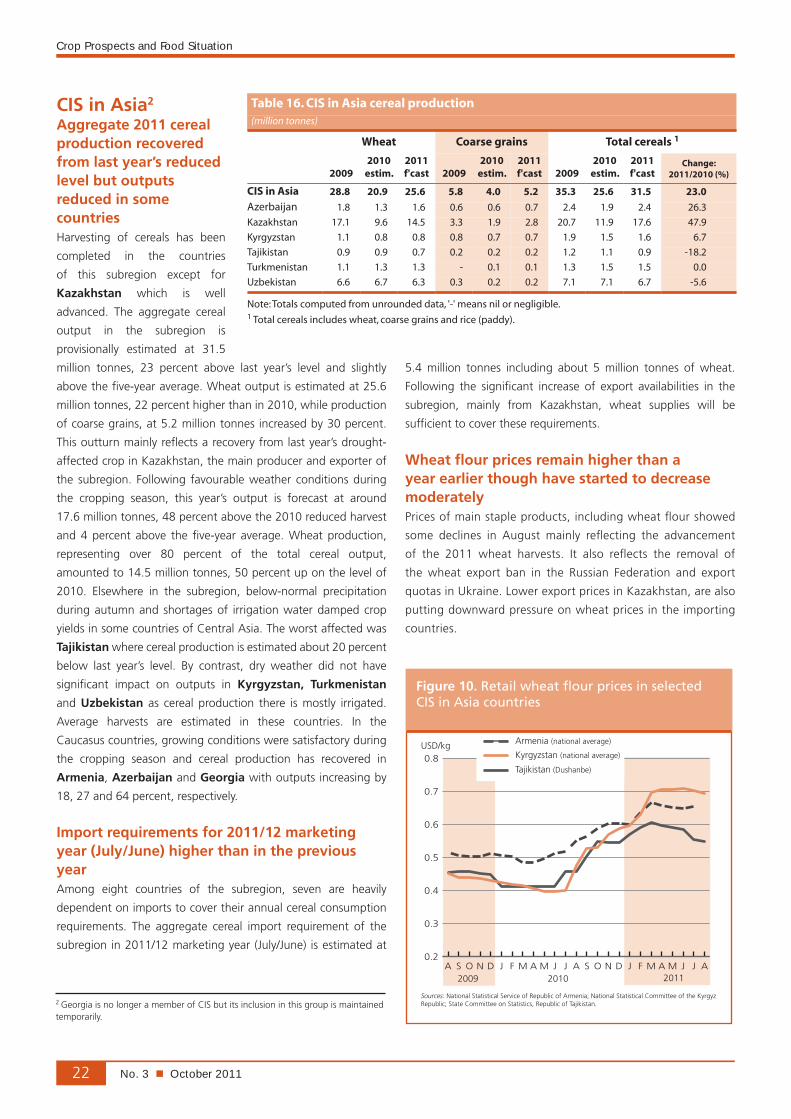
No. 3 n October 201122
Crop Prospects and Food Situation
CIS in Asia2
Aggregate 2011 cereal production recovered from last year’s reduced level but outputs reduced in some countriesHarvesting of cereals has been
completed in the countries
of this subregion except for
Kazakhstan which is well
advanced. The aggregate cereal
output in the subregion is
provisionally estimated at 31.5
million tonnes, 23 percent above last year’s level and slightly
above the five-year average. Wheat output is estimated at 25.6
million tonnes, 22 percent higher than in 2010, while production
of coarse grains, at 5.2 million tonnes increased by 30 percent.
This outturn mainly reflects a recovery from last year’s drought-
affected crop in Kazakhstan, the main producer and exporter of
the subregion. Following favourable weather conditions during
the cropping season, this year’s output is forecast at around
17.6 million tonnes, 48 percent above the 2010 reduced harvest
and 4 percent above the five-year average. Wheat production,
representing over 80 percent of the total cereal output,
amounted to 14.5 million tonnes, 50 percent up on the level of
2010. Elsewhere in the subregion, below-normal precipitation
during autumn and shortages of irrigation water damped crop
yields in some countries of Central Asia. The worst affected was
Tajikistan where cereal production is estimated about 20 percent
below last year’s level. By contrast, dry weather did not have
significant impact on outputs in Kyrgyzstan, Turkmenistan
and Uzbekistan as cereal production there is mostly irrigated.
Average harvests are estimated in these countries. In the
Caucasus countries, growing conditions were satisfactory during
the cropping season and cereal production has recovered in
Armenia, Azerbaijan and Georgia with outputs increasing by
18, 27 and 64 percent, respectively.
Import requirements for 2011/12 marketing year (July/June) higher than in the previous year Among eight countries of the subregion, seven are heavily
dependent on imports to cover their annual cereal consumption
requirements. The aggregate cereal import requirement of the
subregion in 2011/12 marketing year (July/June) is estimated at
5.4 million tonnes including about 5 million tonnes of wheat.
Following the significant increase of export availabilities in the
subregion, mainly from Kazakhstan, wheat supplies will be
sufficient to cover these requirements.
Wheat flour prices remain higher than a year earlier though have started to decrease moderately Prices of main staple products, including wheat flour showed
some declines in August mainly reflecting the advancement
of the 2011 wheat harvests. It also reflects the removal of
the wheat export ban in the Russian Federation and export
quotas in Ukraine. Lower export prices in Kazakhstan, are also
putting downward pressure on wheat prices in the importing
countries.
2 Georgia is no longer a member of CIS but its inclusion in this group is maintained temporarily.
Table 16. CIS in Asia cereal production (million tonnes)
Wheat Coarse grains Total cereals 1
20092010
estim.2011 f'cast 2009
2010 estim.
2011 f'cast 2009
2010 estim.
2011 f'cast
Change: 2011/2010 (%)
CIS in Asia 28.8 20.9 25.6 5.8 4.0 5.2 35.3 25.6 31.5 23.0
Azerbaijan 1.8 1.3 1.6 0.6 0.6 0.7 2.4 1.9 2.4 26.3
Kazakhstan 17.1 9.6 14.5 3.3 1.9 2.8 20.7 11.9 17.6 47.9
Kyrgyzstan 1.1 0.8 0.8 0.8 0.7 0.7 1.9 1.5 1.6 6.7
Tajikistan 0.9 0.9 0.7 0.2 0.2 0.2 1.2 1.1 0.9 -18.2
Turkmenistan 1.1 1.3 1.3 - 0.1 0.1 1.3 1.5 1.5 0.0
Uzbekistan 6.6 6.7 6.3 0.3 0.2 0.2 7.1 7.1 6.7 -5.6
Note: Totals computed from unrounded data, '-' means nil or negligible.1 Total cereals includ