No. 1 October 28, 2005 Japan Petroleum Energy Center Further Challenge in Automobile and Fuel...
31
No. 1 October 28, 2005 Japan Petroleum Energy Center http://www.pecj.or.jp/jcap/ Further Challenge in Automobile and Fuel Technologies for Better Air Quality Air Quality Simulation in Japan Clean Air Program II
-
Upload
elmer-shaw -
Category
Documents
-
view
214 -
download
1
Transcript of No. 1 October 28, 2005 Japan Petroleum Energy Center Further Challenge in Automobile and Fuel...

No. 1
October 28, 2005Japan Petroleum Energy Center
http://www.pecj.or.jp/jcap/
Further Challenge in Automobile and Fuel Technologies
for Better Air Quality
Air Quality Simulation in Japan Clean Air
Program II

No. 2
Content
1.Outline of JCAP and Air Quality Model Research
2.JCAP II Air Quality Simulation Model
Development Concept
3.Air Pollution Concentration Simulation Precision
4.Future Air Quality Prediction Results
5.Summary

No. 3
1. Outline of JCAP and Air Quality Model Research

No. 4
What is JCAP?
• Collaborative study by automobile and oil industries to find the best combination of automobile and fuel technologies to improve the air quality of Japan and to provide the government with rational technical data for policy making.
• Supported by Petroleum Energy Center, a subsidy of METI METI: Ministry of Economy, Trade and Industry
• JCAP I :1997 – 2001 (Budget: Approx. 5.4 billion yen, Numbers of staffs: over 100 members)
• JCAP II: 2002 – 2006 (Budget : Approx. 5.6 billion yen, Numbers of staffs: about 130 members)
Japan Clean Air Program

No. 5
Motivation of JCAP -1-
(Whole Japan Ave.)1975 1980 1985 1990 1995 2000
Year
SP
M
(p
pm
)
1975 1980 1985 1990 1995 2000Year
NO
2
(p
pm
)
0
0.04
0.08
0.12
0.16
0.02
0.06
0.10
0.14
0.18
0
0.01
0.02
0.03
0.04
0.05
0.06
0.07
0.08
■■
RoadsideUrban Background
NO2 SPM ■■
RoadsideUrban Background
Air Quality:-Not improved in early 1990’s-Attainment Ratio was poor at Urban Area Photochem. Oxidant (0.06ppm)
SPM (0.1mg/m3)
NO2 (0.06ppm)A
ttai
nm
ent
Rat
io (
% ) ( ):Air Quality Standard
100
50
0’90 ’91 ’92 ’93 ’94 ’95 ’96 ’97 ’98 ’99 ’00

No. 6
Motivation of JCAP -2-Emission/Vehicle Reduction vs. Emission Inventory Increase No. of Vehicles increase Diesel Increase RV, Fuel Cost, etc.
Stringent Emission Regulation introduction-1989 Reg. Diesel NOx-1994 Reg. Diesel NOx-1998 Reg. Diesel NOx and PM-2003 Reg. (Under discussion)-2005 Reg. (Under discussion)
1015
0
0.4
0.0
0.6
'04 '06 '08 '10'90 '92 '94 '96 '98 '00 '02
EURO4EURO3
Japan
EURO3 EURO4
Year
NO
x(g/
kWh)
PM
(g/k
Wh)
Japan5
0.2
2005Reg.
2005Reg.
2003Reg.
2003Reg.EU
EU
USA
USA
0
10
20
30
40
50
60
70
80
1970 1975 1980 1985 1990 1995 2000年
台数
(百
万台
)
PCTruck
Mini PCBus, Special
Combine fuel and automobile technology for further emission reduction
Develop of Air Quality Simulation Model and Evaluate future air quality improvement

No. 7
Emissions reduction target
Technical evaluation for automobile emissions reduction
(Automobile technology x Fuel technology)
Technical information helpful for more reasonable environmental measures
Target of JCAP study
Estimate of Air quality
improvement
Cost evaluation of Air quality
improvement

No. 8Example of JCAP Results Reflection in Environment and Energy Policies
1. Great effect of sulfur content in fuel on exhaust emissions. Reflected in fuel standard: 50ppm S content; gasoline/diesel fuel from 2005. 10ppm S content; gasoline/diesel from 2008/2007.
2. Great effect of Reid Vapor Pressure (RVP) of gasoline on evaporative emissions. Reflected in self-imposed control of gasoline RVP.
3. Diesel Particulate Filter (DPF) retrofitted to in-use vehicles is not sufficient, under urban driving conditions.Reflected in preparation of Tokyo Metropolitan
Government’s diesel vehicle emission regulations.These are reflected through: • Experts Committee on Motor Vehicle Exhaust Emission, • Petroleum Products Quality Sub-committee of Advisory Committee for Natural Resources
and Energy, • Evaluation Committee of Diesel vehicle Emission Control Technologies.

No. 9
Tasks of JCAP II
1. Pursuing the future automobile and fuel technologies aimed at realizing Zero Emissions and improving fuel consumption, based on the latest technologies and overall energy efficiency.
2. Developing Air Quality models with high accuracy to predict real world.
3. Study of un-regulated emissions and nanoparticles from the vehicles.

No. 10
JCAP II Study Subject Outline(1) Automobile and Fuel Technology Study
Evaluate high technology for gasoline/diesel vehicles aiming at near Zero Emissions and fuel/oil properties
Evaluate emissions and CO2 reduction potentialExamine fine particle measurement method and evaluate high
technology through high measurement methods Key Word: Zero Emissions, CO2 reduction, Octane Number of
Gasoline, Bio fuel, Nanoparticle, Oil properties (Ash, P,S)
(2) Air Quality Model StudyBuild Real-world Emission Inventory Simulation ModelBuild Integrated Air Quality Model of Urban Air Quality Model
and Roadside Air Quality ModelEvaluate Integrated Air Quality Model and Case Study
Key Word: Real world, High accurate model, Roadside, Nanoparticle

No. 11
Role of JCAP II to Regulatory Affairs
Researches on Air Quality Modeling with high-grade accuracy and database
establishment enabling to evaluate policies
Environmental policies
Energy policies
Researches on automobile and fuel technologies aimed at
realizing Zero emission (compatible with CO2
emission control measures)
Emission inventory
estimate in real world in the
future
Direction of future automobile technologies and the required
fuel quality
Prospects of Air Quality improvement effects such as
automobile emission reduction
Forecast for petroleum quality, supply and demand
Contribution to environment and energy policies through Fair Data

No. 12
JCAP II results and incorporation into policy-making
• Fuel economy improvement due to fuel sulfur content reduction (from 50 to 10ppm) has been verified.– Reported to the Petroleum Products Quality Subcommittee of Advisory
Committee for Natural Resources and Energy.
・ The report has been incorporated into the Subcommittee report, “Fuel sulfur content should be reduced to 10ppm or less from 2007 for diesel fuel and 2008 for gasoline, respectively.”
• Air quality improvement effect due to new emission control technologies has been simulated.– Reported to a hearing of Experts Committee on Motor Vehicle Exhaust
Emissions of the Central Environment Council.• The results were used for the 8th report of the Central Environment Council of the
Ministry of the Environment as data predicting the air quality improvement effect due to enforcement of stricter emission regulations quantitatively.

No. 13
Air Quality Improvement in Japan(Tokyo)Average NOAverage NO22/SPM concentrations decreased, and the attainment of the /SPM concentrations decreased, and the attainment of the
environmental standards is low on the roadside. environmental standards is low on the roadside.
Att
ain
men
t
Rat
io
(%)
RoadsideUrban Background
Att
ain
men
t
Rat
io
(%)
NO2
SPM0
20
406080
100NO2
SPM
SP
M(
mg
/m3
)
020
406080
100
NO
2(pp
m)
0
0.04
0.08
0.02
0.06
0.10
'97 '98
'99‘00‘01‘02‘03'97'98 '99
‘00‘01‘02‘03’04 ’04
'98
'99‘00‘01‘02‘03'98 '99
‘00‘01‘02‘03’04 ’04
NO2
SPM
NO2
SPM
SP
M(
mg
/m3
)
NO
2(pp
m)
Annual Ave. Conc.
Attainment Ratio
0
0.04
0.08
0.02
0.06
0.10
'97'97

No. 14
2 JCAP II Air Quality Simulation Model Development Concept

No. 15
General Formation of Air Quality Models
Roadside
Nanoparticle
Keyword
Regional Scale Model
Roadside Model
Meteorological Model
Nanoparticle ModelDeposition
Condensation
Coagulation/Evaporation
Nucleation
Secondary organicaerosol formation
Airflow Model
Model Integration
2-300km
1km

No. 16
Emission inventory estimate other than
automobiles
Micro-scale traffic flow simulation
Micro-scale emission inventory Estimate
(Roadside Air QualityModel)
Roadside Air Quality Simulation Model
Multi-scale Air Quality
Simulation Model
(Regional Air Quality Model)
Road linkageRoad structure
Transport demand(OD, PT data)
Macro-scale traffic flow Simulation
Macro-scale emission inventory Estimate (Regional / Urban Air Quality Model)
Secondary Aerosol Model
Meteorological model
High-emitting vehicleactual condition survey
(Remote-sensing)
Air pollutant concentrations
incl. nanoparticles at
roadside ~ in urban area ~ regional area
Effect evaluation of
Automobile emissions
Emission measurementon chassis-dynamometer
(1) Air Quality Model Data Flow

No. 17
(2) Sensitivity Analysis Method Outline
Sensitivity analysis method in URM
-> Decoupled Direct Method (DDM)
Parameter p = P
∂c
∂Transportation / reaction equation for
Analogous with concentration equation
( Initial condition, boundary condition, emission inventory, wind speed, diffusion coefficient, etc. )
(What is DDM?)
Solve in parallel with concentration c For emission inventory simulation, simulation target place can be appointed.
Parameter
Conc.Present
stateData
replacement
Sensitivity analysis

No. 18Sensitivity to NO2 (Time-series analysis at Kanda-Central of Tokyo)
0
20
40
60
80
100
NO
2 (p
pb)
- 5
0
5
10
15
20
25
30
9 00日 時 9 12日 時 10 00日 時 10 12日 時
NO
2 (pp
b/10
0%)
感度
Calculated value
Observed value
NOx emissionsWind speed
Initial conc. Diffusion coefficient
Boundary conc. Deposition rate
NO
2 c
onc
.
Dec.9 00:00
Dec.9 12:00
Dec.10 00:00
Dec.10 12:00
High sensitivity to wind speed in the morning while calculated values are underestimated
High sensitivity to deposition rate at night
High sensitivity to emission inventory while calculated values are small

No. 19
(3) Key Points in Air Quality Model development
- Measures for simulation precision improvement through sensitivity analysis -
i) Establish Multi-scale model
iv) Establish tertiary grid cell emission source data
iii) Consider trans-boundary air pollution
ii) Reproduce complex weather condition at city center

No. 20
0
25
50
75
12/ 7 00時
12/ 7 12時
12/ 8 00時
12/ 8 12時
12/ 9 00時
12/ 9 12時
12/ 10 00時
12/ 1012時
NO
2 (p
pb)
Utsunomiya - NO2
JCAP IObserved value CMAQ
0
50
100
150
12/ 700時
12/ 712時
12/ 800時
12/ 812時
12/ 900時
12/ 912時
12/ 1000時
12/ 1012時
SPM
(μ
g/m3 )
Utsunomiya - SPM
(3)-1 Integration of long range air pollution transportation effect
Boundary condition: Apply CMAQ simulation results of grid cells ranging from 10 to 4 km square CMAQ boundary is set based on East Asia area simulation resultsInitial condition: Start the simulation 8 days before the evaluation target day
Dec.700:00
Dec.712:00
Dec.800:00
Dec.812:00
Dec.900:00
Dec.912:00
Dec.1000:00
Dec.1012:00
CMAQ G1
URM
CMAQ G2
CMAQ East Asia area
Dec.8, 1999

No. 21
(3)-2 Remote-Sensing Device(1) Speed-Acceleration Detector - Comprehend test vehicle driving conditions - Exclude inaccurate analysis results because of exceeding acceleration and deceleration
(2) Emissions Detector
- CO , CO2 , HC* : Measurement using Infrared rays (IR) - NO , PM** : Measurement using Ultraviolet rays (UV)
• * Conversion into propane (C3H8)• ** Conversion into PM weight per 100g of fuel (smoke
factor) instead of Opacity
(3) Automatic License Plate Reader - Test vehicle information such as vehicle type, applicable regulations, GVW, fuel type, etc. is obtained from license plate. Information is used for emission test result analysis.
(4) Data Processing Equipment
- Speed-Acceleration, emission measured values, imagery of test vehicles are recorded in real time. Number plate information is input separately.
(1)
(2)(3)
(4)

No. 22
RSD Emission inventory measurement Limit speed/acceleration range, and set Cut Point for high-emitting vehicles(Ex. NO: 1250ppm, corresponding to level of US I/M test Cut Point * 2) Ratio estimate in number of high-emitting vehicles by model year Set emission factor for high-emitting vehicles (Basis: ’78 reg. meeting vehicle w/o catalyst) High-emitting vehicle emission inventory estimate
High-emitting vehicle emission inventory estimate method (Gasoline vehicles only)
0 200 200 200 200 200 200 200 200 200 200 200 20 0 200 20 0 20
0
2
4
6
8
10
12
14
16
0 y
r
1 y
r
2 y
rs
3 y
rs
4 y
rs
5 y
rs
6 y
rs
7 y
rs
8 y
rs
9 y
rs
10
yrs
11
yrs
12
yrs
13
yrs
14
yrs
Vehicle age (First registration year: 2002)
Rat
io o
f hig
h-em
ittin
g ve
hicl
es[%
] 1978 reg. (+ ’98 reg. Idling control) reg. meeting vehicle
2000 reg. meeting vehicle (Incl.☆ ,☆☆,☆☆☆ )
-800-400
0400800
12001600200024002800
~1
98
8
19
89
19
90
19
91
19
92
19
93
19
94
19
95
19
96
19
97
19
98
19
99
20
00
20
01
20
02
First registration year
NO
[p
pm
]
1978 reg. meeting vehicle
Cut Point
=>
=>
=>
=>
No. 23
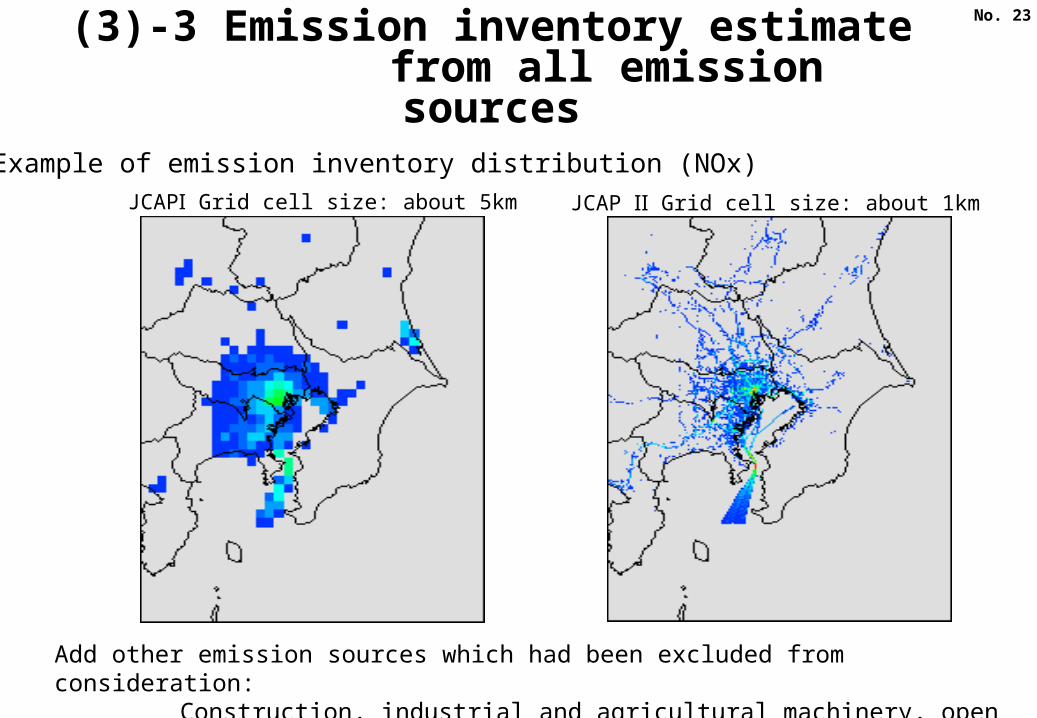
(3)-3 Emission inventory estimate from all emission sources
JCAP Grid cell size: about 5kmⅠ JCAP Grid cell size: about 1kmⅡ
Example of emission inventory distribution (NOx)
Add other emission sources which had been excluded from consideration: Construction, industrial and agricultural machinery, open burning, etc.

No. 24
3. Air Pollution ConcentrationSimulation Precision
No. 25
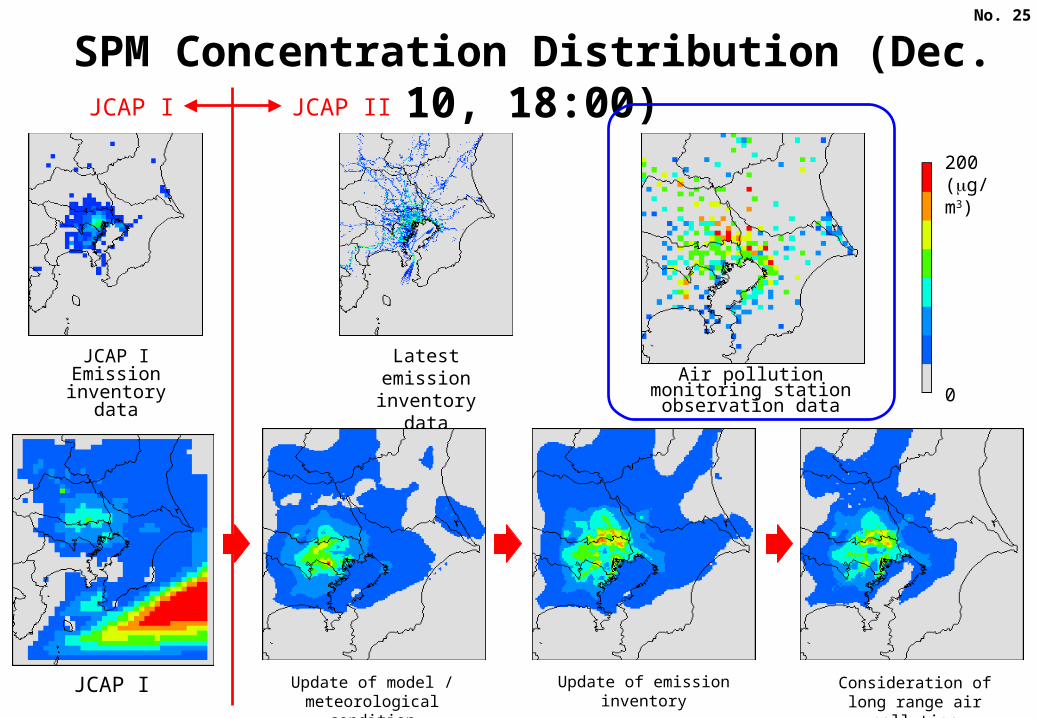
SPM Concentration Distribution (Dec. 10, 18:00)
0
200(g/m3)
Air pollution monitoring station observation data
Latest emission inventory data
JCAP IEmission
inventory data
JCAP I JCAP II
JCAP I Update of model /meteorological condition
Consideration of long range air pollution transportation
Update of emission inventory

No. 26
SPM Simulation precisionSPM average conc.
in target areaNormalized Mean Bias
Normalized Mean Error Unpaired Peak Accuracy
Measured value
Update of model /meteorological condition
Update of emission inventory
Consideration of Long range air
pollution transportation
Update of model /meteorological condition
Update of emission inventory
Consideration ofLong range air
pollutiontransportation
SPM average conc. in target area (g/m3)
Upgrade of model /meteorological condition
Update ofemission inventory
Consideration of Long range air
pollutiontransportation
Update of model /meteorological condition
Update ofEmission inventory
Consideration ofLong range air
pollutiontransportation
JCAP
JCAP I
JCAP I JCAP I
64.0
29.5
36.3
45.9
38.4
0 10 20 30 40 50 60 70
-50.9
-40.1
-25.7
-38.2
-60 -50 -40 -30 -20 -10 0
-69.9
-48.3
-34.8
-41.6
-80 -60 -40 -20 0
51.1
41.3
30.6
39.7
0 10 20 30 40 50 60

No. 27
4. Future Air Quality Prediction Results

No. 28
0 20 40 60 80 100
0 200 400 600 800 1000
Total Emission Inventory EstimateTotal emission inventory in the specified area for Automobile NOx/PM Laws in Kanto bloc (t/day)
Year 2000
Base case (Spontaneous turnoverbefore 2005 reg. introduction)
Introduction of 2005 reg. &High-emitting vehicle elimination
Case 1: Emission level reduction to ½ of 2005 reg.
Case 2: Emission level equivalent to US 07 reg.
Year 2000
Base case (Spontaneous turnoverbefore 2005 reg. introduction)
Introduction of 2005 reg. &High-emitting vehicle elimination
Case 1: Emission level reduction to ½ of 2005 reg.
Case 2: Emission level equivalent to US 07 reg.
-22%
-32% Year 2015
NOx
-29%
-32%Year 2015
SPM
Automobile
Mobile source
Large-scalepoint source
Small-scalepoint source
Automobile
Mobile source
Large-scalepoint source
Small-scale point source
Tire wear
Road dust
-30%
-27%
-29%
-30%
No. 29
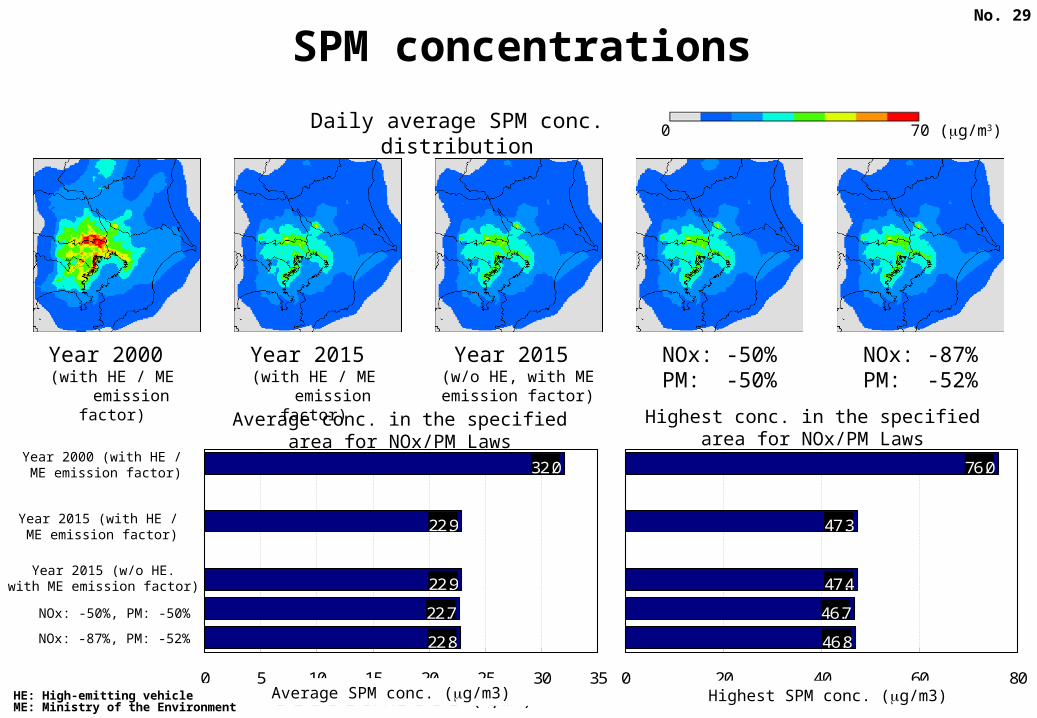
SPM concentrations
Daily average SPM conc. distribution 0 70 (g/m3)
Year 2000 (with HE / ME
emission factor)
Year 2015 (with HE / ME
emission factor)
Year 2015 (w/o HE, with MEemission factor)
NOx: -50%PM: -50%
NOx: -87%PM: -52%
76.0
47.3
47.4
46.7
46.8
0 20 40 60 80SPM (規制地域内 最大濃度 g/ m3)
Average conc. in the specified area for NOx/PM Laws
Highest conc. in the specified area for NOx/PM Laws
32.0
22.9
22.9
22.7
22.8
0 5 10 15 20 25 30 35
2000 HE年( 有り・環境省)
2015 HE年( 有り・環境省)
2015 HE年( 無し・環境省)
NOx-50% PM-50%、
NOx-87% PM-52%、
SPM (規制地域内 平均濃度 g/ m3)
Year 2000 (with HE / ME emission factor)
Year 2015 (with HE / ME emission factor)
Year 2015 (w/o HE.with ME emission factor)
NOx: -50%, PM: -50%
NOx: -87%, PM: -52%
Average SPM conc. (g/m3) Highest SPM conc. (g/m3)HE: High-emitting vehicleME: Ministry of the Environment

No. 30
5.Summary
JCAP II Air Quality Model Study are summarized as follows:• Sensitivity Analysis method was introduced for prediction
accuracy improvement• Multi-scale model, Emission data accuracy and precise
meteorological data in central metropolis. are key points for simulation accuracy improvement
• Air quality simulation is an effective way for policy making to improve future air quality
• JCAP Model will be opened to the public widely when the JCAP II finished

No. 31
End of Presentation
![Employment Relations in the Automobile Industries … [JILPT, 2006. 3. 27] Employment Relations in the Automobile Industries of Japan, Korea and China - Focusing on Nonstandard Workers](https://static.fdocuments.us/doc/165x107/5aad0b6a7f8b9aa06a8dd01a/employment-relations-in-the-automobile-industries-jilpt-2006-3-27-employment.jpg)