NMV/NMT and Vendors in Indian Cities
50
NMV/NMT and Vendors in Indian Cities Geetam Tiwari TRIPP Indian Institute of Technology, Delhi Workshop on Transport Environment, Health and Equity 17 th -19 th December, 2007
Transcript of NMV/NMT and Vendors in Indian Cities

NMV/NMT and Vendors in Indian Cities
Geetam Tiwari
TRIPP
Indian Institute of Technology, Delhi
Workshop on Transport Environment, Health and Equity
17th -19th December, 2007

Cities within cities

Mismatch between road design and usage• Poor utilization of
space(~50%)
• 3 lane wide road is used as 2 lane road
• Regardless of NMV numbers, NMV presence reduces road capacity
• NMVs are exposed to higher risk
• Hawkers/vendors at the bus stop have a correlation with number of commuters

Bicycle Master Plan for Delhi
• TRIPP, IIT Delhi prepared Bicycle Master Plan for Delhi in 1998 for Transport Department of Delhi.
• The final report was submitted in August 1998. The report was based on extensive research involving survey of traffic and travel patterns, landuse patterns and detailed layout plan for two selected corridors.
• The report contained eight chapters

NMVsare required for the whole city

Review of Delhi Network
• More than 500 km of arterial roads in Delhi have 45m or more ROW. Segregated tracks can be made in another 250 km of roads by changing the priority of traffic on the roads.
• Traffic analyses shows it is more efficient to provide one bicycle lane and one or two motorized lanes instead of non-segergated three lanes.
• 58 traffic zones have 5-10% bicycle traffic. Another 26 traffic zones have more than 10% bicycle traffic. 31 zones have 3-5% bicycle traffic.These are spread all over the city.

BMP 1997
– Phase I: Routes which have heavy bicycle traffic ( 90 km).
– Phase II: Major arterials which carry fast traffic (276km).
– Roads with 30 m ROW to complete the network.(370 km.
– Through parks and green belts for enhancing the capacity.

Bicycle Master Plan Proposal
• Origin and destination of bicyclists are same as other vehicle user. Catchment area of work-based bicycle trips with a radius of 3 km from major work centers covers all arterial roads. This requires that all arterial roads should be developed for bicycle routes. This can be prioritized as follows:
– Phase I: Routes which have heavy bicycle traffic ( 90 km).– Phase II: Major arterials which carry fast traffic (276km).– Roads with 30 m ROW to complete the network.(370 km.– Through parks and green belts for enhancing the capacity.

Corridor Designs
• General arrangement drawings were prepared for two corridors. These were (1) Preet Vihar to Connaught Place and Wazirabad Bridge to NandNagari. Design criteria included the following:
– MV lane width 3m– Bus lane 3.3m– NMV lane 2.5m– Separate service lane and footpath.– Intersection modification to include restricting free
left turn, modifying traffic signal, roadside furniture to ensure bicycle safety.

Feedback on Proposed Designs• Community meetings organized in 5 locations (JJ clusters).
Suggestions raised the issue of linking residential locations with transport plans and work places. Rickshaw stands should be near bus stands. Pedestrian lanes should be separate. Cycle tracks should be wide enough to accommodate rickshaws.
• 10 workshops were organized with MCD, PWD, NDMC, DDA, Traffic Police and Transport department. Following concerns were raised:
– Restriction on free left turn may affect the intersection capacity(formotorized vehicles).
– Sufficient parking should be given near the commercial areas.– Provision should be made for had pulled carts and rickshaws.– Bus stops should be located to improve the efficiency of bus system– Existing round about design needs improvement.

Future Plan of Action
• Implementation to be coordinated with the implementing agency for preparing detailed drawings( 1:500, and 1:100 scaled drawings). Detailed cost estimates to be prepared for straight sections and intersections.
• Experiments using movable furniture for closing free left turns, providing right turn bays, alternates roundabout designs, traffic calming, central bus lanes.
• Quantitative measures to be developed based on pilot projects and workshops to discuss the results and modify the proposed designs.
• Preparation of design manual for bicycle infrastructure.• Preparation of Bicycle Network in residential
neighbourhoods• Evaluation of the first pilot corridor after implementation.

foot path
parking
srvce lane
parking
foot path
cycle track
median
mv lane
Bus Stop
Bus Lane
bus stop
bus lane
median
Bus lane
bus lane
median
mv lane
median
cycle track
foot path
parking
srvc lane
parking
footpath
Total R/W
0 0 0 0 1.5 1.35 0.15 8.25 2 2.9 2 2.9 0.15 0 2.9 0.15 5.75 0.15 1.35 1.5 0 0 0 0 330 0 0 0 1.75 1.35 0.15 8.25 2.25 2.9 2.25 2.9 0.15 0 2.9 0.15 5.75 0.15 1.35 1.75 0 0 0 0 340 0 0 0 1.75 1.55 0.15 8.25 2.5 2.9 2.5 2.9 0.15 0 3 0.15 5.75 0.15 1.55 1.75 0 0 0 0 350 0 0 0 1.65 2.05 0.15 8.25 2.5 3 2.5 3 0.15 0 3 0.15 5.75 0.15 2.05 1.65 0 0 0 0 360 0 0 0 1.7 2.5 0.15 8.25 2.5 3 2.5 3 0.15 0 3 0.15 5.75 0.15 2.5 1.7 0 0 0 0 370 0 0 0 1.7 1.5 0.15 8.25 2.5 3 2.5 3 0.15 3 3 0.15 5.75 0.15 1.5 1.7 0 0 0 0 380 0 0 0 1.7 2 0.15 8.25 2.5 3 2.5 3 0.15 3 3 0.15 5.75 0.15 2 1.7 0 0 0 0 390 0 0 0 1.55 2.5 0.15 8.25 2.5 3 2.5 3 0.3 3 3 0.3 5.75 0.15 2.5 1.55 0 0 0 0 400 0 0 0 1.75 2.8 0.15 8.25 2.5 3 2.5 3 0.3 3 3 0.3 5.75 0.15 2.8 1.75 0 0 0 0 410 0 0 0 2.15 2.9 0.15 8.25 2.5 3 2.5 3 0.3 3 3 0.3 5.75 0.15 2.9 2.15 0 0 0 0 420 0 0 0 2.15 2.9 0.15 8.75 2.5 3 2.5 3 0.3 3 3 0.3 6.25 0.15 2.9 2.15 0 0 0 0 430 0 0 0 1.9 2.9 0.15 9.75 2.5 3 2.5 3 0.3 3 3 0.3 6.75 0.15 2.9 1.9 0 0 0 0 440 0 0 0 2.4 2.9 0.15 9.75 2.5 3 2.5 3 0.3 3 3 0.3 6.75 0.15 2.9 2.4 0 0 0 0 450 0 0 0 2.9 2.9 0.15 9.75 2.5 3 2.5 3 0.3 3 3 0.3 6.75 0.15 2.9 2.9 0 0 0 0 460 0 0 0 3.4 2.9 0.15 9.75 2.5 3 2.5 3 0.3 3 3 0.3 6.75 0.15 2.9 3.4 0 0 0 0 47
0.5 0 3.7 0 1.6 2.9 0.15 9.75 2.5 3 2.5 3 0.3 3 3 0.3 6.75 0.15 2.9 2 0 0 0 0 481.5 0 3.7 0 1.6 2.9 0.15 9.75 2.5 3 2.5 3 0.3 3 3 0.3 6.75 0.15 2.9 2 0 0 0 0 49
0.95 0 3.75 0 1.5 2.85 0.15 8.25 2.5 3 2.5 3 0.3 3 3 0.3 5.75 0.15 2.85 1.5 0 3.75 0 0.95 501.2 0 3.75 0 1.5 2.85 0.15 8.25 2.5 3 2.5 3 0.3 3 3 0.3 6.25 0.15 2.85 1.5 0 3.75 0 1.2 51
Table for road cross-section design at BUS SHELTER (in metres)
Road Space allocation

Road Space Allocation cont.
1.2 0 3.75 0 1.5 2.85 0.15 8.25 2.5 3 2.5 3 0.3 3 3 0.3 6.25 0.15 2.85 1.5 0 3.75 0 1.2 510.65 0 3.75 0 1.8 2.85 0.15 9.75 2.5 3 2.5 3 0.3 3 3 0.3 6.25 0.15 2.85 1.8 0 3.75 0 0.65 520.9 0 3.75 0 1.8 2.85 0.15 9.75 2.5 3 2.5 3 0.3 3 3 0.3 6.75 0.15 2.85 1.8 0 3.75 0 0.9 531.4 0 3.75 0 1.8 2.85 0.15 9.75 2.5 3 2.5 3 0.3 3 3 0.3 6.75 0.15 2.85 1.8 0 3.75 0 1.4 541.4 0 4.25 0 1.8 2.85 0.15 9.75 2.5 3 2.5 3 0.3 3 3 0.3 6.75 0.15 2.85 1.8 0 4.25 0 1.4 550.6 1.8 3.75 0 1.8 2.85 0.15 9.75 2.5 3 2.5 3 0.3 3 3 0.3 6.75 0.15 2.85 1.8 0 3.75 1.8 0.6 56
0.85 2.05 3.75 0 1.8 2.85 0.15 9.75 2.5 3 2.5 3 0.3 3 3 0.3 6.75 0.15 2.85 1.8 0 3.75 2.05 0.85 571.6 2.05 3.75 0 1.8 2.9 0.15 9.75 2.5 3 2.5 3 0.3 3 3 0.3 6.75 0.15 2.9 1.8 0 3.75 2.05 1 581.9 1.95 3.75 0 1.8 2.9 0.15 9.75 2.5 3 2.5 3 0.3 3 3 0.3 6.75 0.15 2.9 1.8 0 3.75 1.95 1.9 590.6 1.95 3.75 1.8 1.8 2.9 0.15 9.75 2.5 3 2.5 3 0.3 3 3 0.3 6.75 0.15 2.9 1.8 1.8 3.75 1.95 0.6 600.8 1.95 3.75 2.1 1.8 2.9 0.15 9.75 2.5 3 2.5 3 0.3 3 3 0.3 6.75 0.15 2.9 1.8 2.1 3.75 1.95 0.8 611.3 1.95 3.75 2.1 1.8 2.9 0.15 9.75 2.5 3 2.5 3 0.3 3 3 0.3 6.75 0.15 2.9 1.8 2.1 3.75 1.95 1.3 621.8 1.95 3.75 2.1 1.8 2.9 0.15 9.75 2.5 3 2.5 3 0.3 3 3 0.3 6.75 0.15 2.9 1.8 2.1 3.75 1.95 1.8 631.8 0 3.75 4.25 1.8 2.9 0.15 9.75 2.8 3 2.8 3 0.3 3 3 0.3 6.75 0.15 2.9 1.8 4.25 3.75 0 1.8 641.8 0 4.25 4.25 1.8 2.9 0.15 9.75 2.8 3 2.8 3 0.3 3 3 0.3 6.75 0.15 2.9 1.8 4.25 4.25 0 1.8 651.8 0 4.75 4.25 1.8 2.9 0.15 9.75 2.8 3 2.8 3 0.3 3 3 0.3 6.75 0.15 2.9 1.8 4.25 4.75 0 1.8 661.8 0 5.25 4.25 1.8 2.9 0.15 9.75 2.8 3 2.8 3 0.3 3 3 0.3 6.75 0.15 2.9 1.8 4.25 5.25 0 1.8 671.8 0 5.75 4.25 1.8 2.9 0.15 9.75 2.8 3 2.8 3 0.3 3 3 0.3 6.75 0.15 2.9 1.8 4.25 5.75 0 1.8 681.8 0 6.25 4.25 1.8 2.9 0.15 9.75 2.8 3 2.8 3 0.3 3 3 0.3 6.75 0.15 2.9 1.8 4.25 6.25 0 1.8 691.8 0 6.75 4.25 1.8 2.9 0.15 9.75 2.8 3 2.8 3 0.3 3 3 0.3 6.75 0.15 2.9 1.8 4.25 6.75 0 1.8 70
1.75 0 6.75 4.5 1.8 2.9 0.15 9.75 2.8 3 2.8 3 0.3 3.3 3.3 0.3 6.75 0.15 2.9 1.8 4.5 6.75 0 1.75 711.75 0 6.75 5 1.8 2.9 0.15 9.75 2.8 3 2.8 3 0.3 3.3 3.3 0.3 6.75 0.15 2.9 1.8 5 6.75 0 1.75 72
2 0 6.75 5 2.05 2.9 0.15 9.75 2.8 3 2.8 3 0.3 3.3 3.3 0.3 6.75 0.15 2.9 2.05 5 6.75 0 2 732.25 0 6.75 5 2.3 2.9 0.15 9.75 2.8 3 2.8 3 0.3 3.3 3.3 0.3 6.75 0.15 2.9 2.3 5 6.75 0 2.25 742.5 0 6.75 5 2.45 3 0.15 9.75 2.8 3 2.8 3 0.3 3.3 3.3 0.3 6.75 0.15 3 2.45 5 6.75 0 2.5 75
2.75 0 6.75 5 2.7 3 0.15 9.75 2.8 3 2.8 3 0.3 3.3 3.3 0.3 6.75 0.15 3 2.7 5 6.75 0 2.75 763 0 6.75 5 2.95 3 0.15 9.75 2.8 3 2.8 3 0.3 3.3 3.3 0.3 6.75 0.15 3 2.95 5 6.75 0 3 77
3.25 0 6.75 5 3.2 3 0.15 9.75 2.8 3 2.8 3 0.3 3.3 3.3 0.3 6.75 0.15 3 3.2 5 6.75 0 3.25 783.5 0 6.75 5 3.45 3 0.15 9.75 2.8 3 2.8 3 0.3 3.3 3.3 0.3 6.75 0.15 3 3.45 5 6.75 0 3.5 79
3.75 0 6.75 5 3.7 3 0.15 9.75 2.8 3 2.8 3 0.3 3.3 3.3 0.3 6.75 0.15 3 3.7 5 6.75 0 3.75 804 0 6.75 5 4.95 3 0.15 9.75 2.8 3 2.8 3 0.3 3.3 3.3 0.3 6.75 0.15 3 3.95 5 6.75 0 4 82
4.25 0 6.75 5 4.2 3 0.15 9.75 2.8 3 2.8 3 0.3 3.3 3.3 0.3 6.75 0.15 3 4.2 5 6.75 0 4.25 822.25 4.75 6.75 4.75 2.2 3 0.15 9.75 2.8 3 2.8 3 0.3 3.3 3.3 0.3 6.75 0.15 3 2.2 4.75 6.75 4.75 2.25 83

Myths:
•NMT Infrastrucure exists in the form of Service Lanes.
•Mere widening of roads in Delhi, will serve the purpose of capacity augmentation and congestion relief.

Guiding Principles
• Road geometric standards from Buses/VRUs perspective
• Traffic management policies that enable safe mobility of VRUs
• Road side vendors/ informal sector to be viewed as service providers

Bus
Lan
e
Bus
Lan
e
Cyc
le/r
icks
haw
lane
Cyc
le/r
icks
haw
lane
Car
s. T
wo
whe
eler
s
Car
s. T
wo
whe
eler
s
Hou
ses/
sho
ps
Hou
ses/
sho
ps
Bus
She
lter

Proposed road cross sections
�MVlane width on main carriageway 3m (minimum), asphalt surface.
� Recommended lane width for buses 3.3 m ( 3 m minimum), cment concrete surface.
� Recommended lane width for bicycles 2.5 m (1.5 m minimum), cement concrete surface.
� Separate service lane( asphalt) and footpath (interlocking cement concrete blocks).
�Road cross section required 30m -51 m

JB Road Existing conditions

J.B.Road Corridor planning

1
2345
67
8
9
1. Min. (inner) turning radis of 8.5m and max. (outer of 12.8m for 9.5m long design vehicle for 15km/hr
2. Cycle track across asphalt in coloured concrete
3. Zebra crossing set back by 5m. To accommodate a car (stopped at ped. Crossing) outside cycle track.
4. 2.4m to 4.8m wide zebra crossing in different color of cobbled stone.
5. Stop line set back by min. 2.5m from xebra crrosingand perpendicular to carriageway. Cycle track ramps down to carriageway at stop line.
6. Median continues till cycle track with break (with bollards at 1.2m) for pedestrians at zebra xing.
7. Curb radius is max. 5.2m with sloping edge (at 1:12) and protection with bollards at 1.2m.
8. Lane indication for bus lane continues through intersection in paint and reflector studs.
9. Cycle rickshaw parking adjacent to cycle track
10. Bus shelters continue till intersection to allow easy commuter access from ped. Xings.
10
Intersection Design Principles

Poor surface quality of service lanes and it’s use by motorized vehicles, both as a thoroughfare and as parking discourages it’s use by NMV. For reasons of comfort and mobility, carriageway is preferred to the service lane.

Commuters, Buses, Cycles, TSR and Hawkers occupying the carriageway at Wazirpur Bus Shelter, when separate infrastructure has been provided for all.
19/1/2002

147
177
28 206 3 3
0
50
100
150
200
< 1Town
1-5 lakhA & B
5-10 lakhC
10-20 lakhD
20-50 lakhE
50-100lakh
F
1 croreG
No. Of Cities

0
10
20
30
40
50
60
70
80
90
100
Modal share
0.05-0.1 0.1-0.5 .5-1 1.0-2.0 2.0-5.0 >5.0
City population
walk Public Transport Cycle Three Rick-shaw Cars MTW

TRIP LENGTH DISTRIBUTION IN SELECTED CITIES
0
10
20
30
40
50
60
70
< 2 Km 2-5 Km 5-10 km 10-15 Km > 15 km
Delhi
Mumbai
Pune
Hyderabad
�85% trips are less than 10 km long
� conducive to road based system

Modal Shares in Delhi 2002Aurobindo Intersection
5 3 3 3 31 1 1 1 2
43 41
4945
51
27
38
3135
29
1411
149
12116
36
4
0
10
20
30
40
50
60
8:00-9:00 9:00-10:00 13:00-14:00 17:00-18:00 21:00-22:00
Time Interval
% V
olu
me
Co
mp
osi
tio
n
HV LCV CAR M2W M3W NMV
Hazrat Nizamuddin Intersection
42 2 2 32 1 2 1
6
38 37 37
41 42
23
30
2629
21
1314
20
1517
20
1513 13
10
0
5
10
15
20
25
30
35
40
45
8:00-9:00 9:00 to 10:00 13:00 to 14:00 17:00 to 18:00 21:00 to 22:00
Time
Per
cen
tag
es
HV LCV CAR M2W M3W NMV

Modal Shares in Delhi 2002I.T.O
14
6 6 6 52 1 2 1 3
26
3033 31
33
27
40
35 3532
17
13
2017
22
13
9
4
106
0
5
10
15
20
25
30
35
40
45
8:00-9:00 9:00-10:00 13:00-14:00 17:00-18:00 21:00-22:00
Time Interval
% V
olu
me
Co
mp
osi
tio
n
Punjabi Bagh
5 4 4 3 31 25
14
3336
4240
53
3944
3336
27
5 610 10
6
17
86
9 8
0
10
20
30
40
50
60
8:00-9:00 9:00-10:00 13:00-14:00 17:00-18:00 21:00-22:00
Time Interval
Per
cen
tag
es
HV LCV CAR M2W M3W NMV

Five Year Volume Trends of NMVs at ITO
0
200400
600800
10001200
1400
2002 2003 2004 2005 2006
Years
Hou
rly
Vol
ume
Peak Hours
Non Peak Hours
Total
13
87
67
2 21
1 1
27
32
34 3434
28
31
35
33
27
16 17
13
1617
14
10 1111
8
0
5
10
15
20
25
30
35
40
2002(6088) 2003(8682) 2004(9936) 2005(9338) 2006(9300)
Y e a r ( T o t a l V o l u me )
HV LCV CA R M 2W M 3W NM V

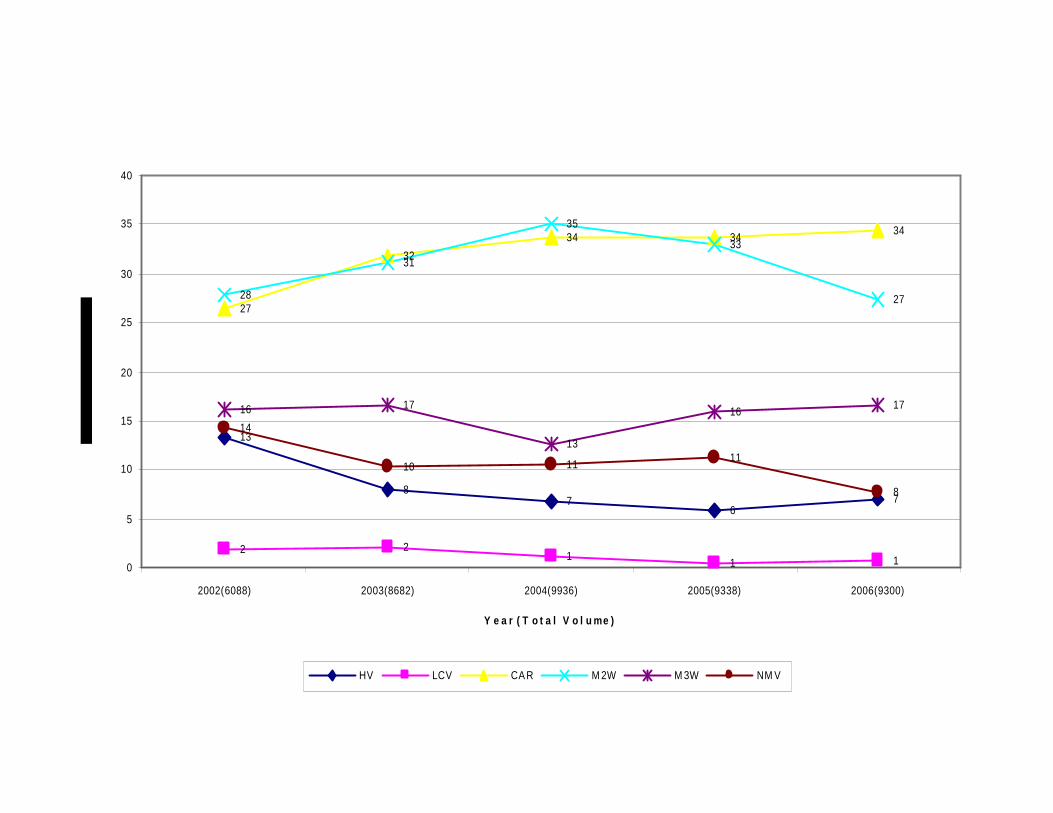
Some Details
• The study was conducted for a single weekday for each of the five years from 2002 to 2006.
• Five time intervals were chosen on that particular day, as in 8:00-9:00, 9:00-10:00, 13:00-14:00, 17:00-18:00 and 21:00-22:00 hours.
• Peak hours considered for hourly volume are 8:00-9:00, 9:00-10:00 and 17:00-18:00 hours.
• Non Peak hours considered for hourly volume are 13:00-14:00 and 21:00-22:00 hours.
• Total hourly volume is average of all the five intervals.

Investments ?
• Estimated cost of 1km of NMV and bus priority lane :Rs. 3-5cr.– (460 km possible)
• Estimated cost of 1km of metro : Rs. 200-300 cr.– (41 km underground, 86 surface planned)
• 1flyover : Rs. 0.3 - 1.0 cr.– (21 under construction, 50 planned)
• 1 bus shelter/bay : Rs. 0.04 cr.

Possible Modal Shifts (excludes captive users)
• Short bus trips (1-6 kms) to bicycles(~ 3% to 5%)
• long two wheeler trips(16-25kms) to buses (reduced two wheelers 29% to 25%) & increased bus 36 to 37%)
• 1/3 Short car trips to bicycles (5% to 7%) cars reduce from 28% to 26%)
• 1/3 short MTW trips to bicycles (7% to 9%) MTW reduces from 25% to 22%

Expected modal shifts due to phased construction of NMV& Bus priority lanes in Delhi
2001 M ODAL SHARE BY DE NSI T Y
0
5
10
15
20
25
30
35
40
45
BUSES CARS 3-WHEELERS 2-WHEELERS BICYCLE
EXISTING CONDITION AFTER 50% MODAL SHIFTAFTER 100% MODAL SHIFT

0
5 0 0 0 0 0 0
10 0 0 0 0 0 0
15 0 0 0 0 0 0
2 0 0 0 0 0 0 0
2 5 0 0 0 0 0 0
Bus Car M C
Bef or e
Af t er
Impact of Modal shift on Fuel Consumption
• 17% increase in bus fuel consumption (higher modal shares and trip length)
• 13% saving in car fuel consumption
• 40% saving in MC fuel consumption

Impact of modal shift and Fuel efficiency( Dedicated bus lanes and bicycle lanes)
0
2 0 0 0 0 0 0
4 0 0 0 0 0 0
6 0 0 0 0 0 0
8 0 0 0 0 0 0
10 0 0 0 0 0 0
12 0 0 0 0 0 0
14 0 0 0 0 0 0
16 0 0 0 0 0 0
18 0 0 0 0 0 0
2 0 0 0 0 0 0 0
Bus Car M c
Bef or e
Af t er
• 12 % saving in bus fuel
• 30% saving in car fuel
• 55% saving in MC fuel
• Total 18% saving in fuel consumption

Impact of infrastructure improvement Pune
0
20000
40000
60000
80000
100000
120000
140000
B us Car M C A ut o C y c l e Wal k
B ef or e
A f t er
• Modal share of bus and mc reduces
• Veh-km by buses remains the same
• Share of cycles increase
No. of trips by different modes
0
100000
200000
300000
400000
500000
600000
700000
800000
B us Car M C A ut o Cy c l e Wal k
B ef or e
A f t er
Km traveled by different modes

Fuel Saving in Pune
• 25% saving in bus
• 20% saving in car
• 34% saving in MC
• 26% total saving0
5 0 0 0 0
10 0 0 0 0
15 0 0 0 0
2 0 0 0 0 0
2 5 0 0 0 0
Bus Car M C
Bef or e
Af t er

Avoided costs due to investments in NMT /PT infrastructure
• Capacity improvement 19-23% with exclusive NMT lane.
• Capacity improvement 56-73% with high capacity bus system
• 46% reduction in safety costs on a typical Delhi arterial.
• 80% reduction in junction delays.
• 28% reduction in fuel consumption.
• 29% reduction in health costs

PLANNING FOR SUSTAINABLE URBAN TRANSPORT
gPromotion of public transport only possible if pedestrians and bicyclists are safer
gDesigns of bus stands and vehicles for safe entry and exit
gRole of street hawkers and vendors to be integrated in road design
gProvision of segregated bicycle lanes on all arterial roads otherwise bus operation inefficient
gConvenient bus stop locations

Access based Mode Choice Model
• In year 2021 (full network of metro in operation), expected ridership of metro : 4.45 million (35% of expected demand , 12.6 million trips) by DMRC.
• However, Accessibility based nested mode choice model, 23% trips by metro.
• If we compare trips made by public transport, approximately 30% trips would be made by the metro and rest 70% trips would be made by road based bus transport services

IIT Delhi 2007
Understanding non homogeneous traffic
• Lane capacity in the presence of NMVs and two wheelers (IRC PCU?)
• Lane width ~ f( desired speed) and capacity
• Impact of free left turns
• Traffic signal vs round about
• Data collection methods

Ambedkar Nagar-ISBT
3 km long, MB Road- ChiragDelhi(Outer Ring Road)
10 bus stops, avg. dist. 600m
2 bus lns each dir, 3 at bus stops
2.5 km, Chirag Delhi(Outer Ring Rd)-Moolchand(RingRoad), 8 bus stops, 2 midblock

PROPOSED BRT SHELTER AT CHIRAGH DELHI
THE BENGAL CHAMBER OF COMMERCE AND INDUSTRY INITIATIVE : SUPPORTED BY DPSC, DESCON
L I M I T E D
ISO 9001:2000
IIT Delhi
TRIPP

IIT Delhi2007
Road based public transport systems
• Geometric and operational requirements for bus systems ; lane widths, signal priority, bus stop location( movement on grade separated junctions)
• Exclusive lane : center vs curbside? Capacity?
• Bus stop location: near side vs far side?
• Bus stop design: geometory, configuration(linear vsparallel, overtaking lane, capacity)
• Approach to bus stops= pedestrian facilities, safe crossings
Analytical and simulation models

Bus stop location
• All four sides at the signalized junction
• Shortest crossing distance for pedestrians at the zebra crossing
• Avg. pedestrian delay 30-50
secs.
• Required road width(R/W) 33m(minimum) 37m(desirable)
Bus stopPedestrian crossing

BRT bus stops on three sides,pedestrian crossing at grade

HAWKER SPACE
M V LANE
M V LANE
M V LANE
M V LANE
MEDIAN
M V LANE
M V LANE
M V LANE
M V LANE
M V LANE
BUS LANE
BUS LANE
BUS SHELTER
BUS LANE
BUS SHELTER
M V LANE
M V LANE
M V LANE
M V LANE
CYCLE TRACK
FOOTPATH
UNPAVED
CYCLE TRACK
FOOTPATH
UNPAVED
CYCLE TRACK
FOOTPATH
M V
LA
NE
M V
LA
NE
BU
S S
HE
LTE
RB
US
LA
NE
BU
S S
HE
LT
ER
BU
S L
AN
EM
ED
IAN
M V
LA
NE
M V
LA
NE
UN
PA
VE
DC
YC
LE
TR
AC
KFO
OTP
AT
H
DELHI GATE TO
TILAK BRIDGE JUNCTION
AMBEDKAR NAGAR JUNCTION
TO DELHI GATE
CYCLE TRACK
FOOTPATH
UNPAVED PATCHBUS SHELTER
BUS
M V
PARK
LEGEND
ME
TR
O O
VE
R B
RID
GE
M V
LA
NE
M V
LA
NE
M V
LA
NE
M V
LA
NE
M V
LA
NE
M V
LA
NE
M V
LA
NE
TILAK BRIDGE JUNCTION
PROPOSED
23
BU
S L
AN
E
BUS LANE
Railwaystation
PROPOSED TILAK BRIDGE
Area Available for Pedestrian (Sq m)Existing - 2507Proposed - 3330

Free Left Turn at S.B.Marg: Proposed
Additional railing to prevent jaywalking

IIT Delhi 2007
Movement of pedestrians and bicycles
• Impact of NMV on lane capacity( low volume vs high volume of NMVs)
• Segregation where and how? Arterial? Collector, other roads?
• Junction design; free left turns, round about
• Signalization for pedestrians (pedestrian delays)
• Pedestrian crossings, FOB vs subway, meeting disability requirements
Analytical and simulation models required

BRT Status in Indian Cities(JNURM Funding approved)
• Delhi
• Pune 13 km (pilot), 65 km phase I, (Rs.600 cr)
• Ahemdabad
• Indore
• Bhopal
• Jaipur
• Vishakhaptnam
• Hyderabad
• Nagpur
Lloyd Wright


![Untitled-1 [salvichem.com]salvichem.com/assets/SCI-IRON-SALTS-BOOKLET.pdf · NMT. 1 Oppm NMT 0.3% No turbidty is produced Wthin 5 minutes NMT 10ppm 16.5 to 18.5% FCC Passes Test NMT](https://static.fdocuments.us/doc/165x107/5f10a47d7e708231d44a1ca8/untitled-1-nmt-1-oppm-nmt-03-no-turbidty-is-produced-wthin-5-minutes-nmt.jpg)