NMR Techniques in Metabolomic Studies: A Quick Overview on ...
21
REVIEW NMR Techniques in Metabolomic Studies: A Quick Overview on Examples of Utilization Joanna Kruk 1 • Marek Doskocz 2 • El _ zbieta Jodlowska 1 • Anna Zacharzewska 1 • Joanna Lakomiec 1 • Kornelia Czaja 1 • Jacek Kujawski 1,3 Received: 19 July 2016 / Revised: 10 October 2016 / Published online: 2 November 2016 Ó The Author(s) 2016. This article is published with open access at Springerlink.com Abstract Metabolomics is a rapidly developing branch of science that concentrates on identifying biologically active molecules with potential biomarker properties. To define the best biomarkers for diseases, metabolomics uses both models (in vitro, animals) and human, as well as, various techniques such as mass spectroscopy, gas chromatography, liquid chromatography, infrared and UV–VIS spectroscopy and nuclear magnetic resonance. The last one takes advantage of the magnetic properties of certain nuclei, such as 1 H, 13 C, 31 P, 19 F, especially their ability to absorb and emit energy, what is crucial for analyzing samples. Among many spectroscopic NMR techniques not only one-dimensional (1D) techniques are known, but for many years two-dimensional (2D, for example, COSY, DOSY, JRES, HETCORE, HMQS), three-dimensional (3D, DART-MS, HRMAS, HSQC, HMBC) and solid-state NMR have been used. In this paper, authors taking apart fundamental division of nuclear magnetic resonance techniques intend to shown their wide application in metabo- lomic studies, especially in identifying biomarkers. 1 Introduction Metabolomics is a rapidly growing branch of science and medicine that aims at identifying new biomarkers of a variety of human diseases and disorders, also investigating them on animal models. It focuses primarily on diseases for which & Joanna Kruk [email protected] 1 Department of Organic Chemistry, Faculty of Pharmacy, Poznan University of Medical Sciences, Grunwaldzka 6 Str., 60-780 Poznan, Poland 2 RootInnovation Sp. z o.o., Jana Matejki 11 Str., 50-333 Wroclaw, Poland 3 Foundation for Development of Science and Business on Medical and Exact Sciences Area, Legnicka 65 Str., 54-206 Wroclaw, Poland 123 Appl Magn Reson (2017) 48:1–21 DOI 10.1007/s00723-016-0846-9 Applied Magnetic Resonance
Transcript of NMR Techniques in Metabolomic Studies: A Quick Overview on ...
REVIEW
NMR Techniques in Metabolomic Studies: A QuickOverview on Examples of Utilization
Joanna Kruk1• Marek Doskocz2
• El _zbieta Jodłowska1•
Anna Zacharzewska1• Joanna Łakomiec1
•
Kornelia Czaja1• Jacek Kujawski1,3
Received: 19 July 2016 / Revised: 10 October 2016 / Published online: 2 November 2016
� The Author(s) 2016. This article is published with open access at Springerlink.com
Abstract Metabolomics is a rapidly developing branch of science that concentrates
on identifying biologically active molecules with potential biomarker properties. To
define the best biomarkers for diseases, metabolomics uses both models (in vitro,
animals) and human, as well as, various techniques such as mass spectroscopy, gas
chromatography, liquid chromatography, infrared and UV–VIS spectroscopy and
nuclear magnetic resonance. The last one takes advantage of the magnetic properties
of certain nuclei, such as 1H, 13C, 31P, 19F, especially their ability to absorb and emit
energy, what is crucial for analyzing samples. Among many spectroscopic NMR
techniques not only one-dimensional (1D) techniques are known, but for many years
two-dimensional (2D, for example, COSY, DOSY, JRES, HETCORE, HMQS),
three-dimensional (3D, DART-MS, HRMAS, HSQC, HMBC) and solid-state NMR
have been used. In this paper, authors taking apart fundamental division of nuclear
magnetic resonance techniques intend to shown their wide application in metabo-
lomic studies, especially in identifying biomarkers.
1 Introduction
Metabolomics is a rapidly growing branch of science and medicine that aims at
identifying new biomarkers of a variety of human diseases and disorders, also
investigating them on animal models. It focuses primarily on diseases for which
& Joanna Kruk
1 Department of Organic Chemistry, Faculty of Pharmacy, Poznan University of Medical
Sciences, Grunwaldzka 6 Str., 60-780 Poznan, Poland
2 RootInnovation Sp. z o.o., Jana Matejki 11 Str., 50-333 Wrocław, Poland
3 Foundation for Development of Science and Business on Medical and Exact Sciences Area,
Legnicka 65 Str., 54-206 Wrocław, Poland
123
Appl Magn Reson (2017) 48:1–21
DOI 10.1007/s00723-016-0846-9
AppliedMagnetic Resonance

currently no definite biomarker is known. The techniques most commonly utilized
in metabolomics are: mass spectrometry (MS) as an analytical technique, together
with gas or liquid chromatography (GC or LC) as additive methods, or nuclear
magnetic resonance (NMR) spectroscopy. Other methods are: UV–VIS (Fig. 1), IR,
RAMAN and SEM [1]. Whereas mass spectroscopy measures the ratio of mass to
charge of ionized particles, nuclear magnetic spectroscopy takes advantage of the
magnetic properties of certain nuclei, such as 1H, 13C, 31P and others [2–4]. This
spectroscopy consists in arousing nuclear spins being located in a magnetic external
field through rapid changes of the magnetic field, and then recording of the
electromagnetic radiation occurring as a result of occurrences of the relaxation.
When a given frequency of the electromagnetic wave is used, only the nuclei with
such resonance frequency absorb it. The immediate surroundings of the nucleus
affect its resonance frequency (frequency for which pulses have the largest
amplitude), thus making it possible to distinguish nuclei, which are surrounded by
different atoms in a given compound.
We intend to show wide application of nuclear magnetic resonance techniques in
metabolic studies based on crucial division on one-dimensional, two-dimensional,
three-dimensional and solid-state NMR (ssNMR) techniques. We also briefly
present examples of 19F NMR spectroscopy techniques from the discussed
standpoint; however, it is noteworthy that due to number of literature data
regarding this method, this topic will be a goal of further review. To facilitate
broadening knowledge about spectroscopy and metabolomics, fundamental abbre-
viations are presented (Table 1).
Fig. 1 UV–Vis spectrum of human urine. 1 Water, 2 6-year-old kids, 3 adult. Own researches
2 J. Kruk et al.
123

1.1 One-Dimensional Techniques
The most popular NMR technique is 1H NMR based on 1H nucleus because of their
abundance in nature (over 99.98%) [5], low relaxation time and an appreciable
nuclear spin.
Because this method has been commonly used in metabolomics of different
biofluids for years, there are numerous emerging techniques involving NMR that are
particularly useful in this area [2, 3]. There are many reviews concerning the latest
advances in this branch of science [4, 6], but to the authors’ knowledge, there is
none regarding the types of NMR techniques and approaches used for metabolomic
studies [7, 8], and the authors aim at filling this gap. Moreover, we want to show
why these techniques were introduced, what they help to achieve and which
challenges they help to overcome. Apart from 1H NMR, the techniques employing
other nuclei will also be included, such as 13C [9], 31P [10], 43Ca [11].
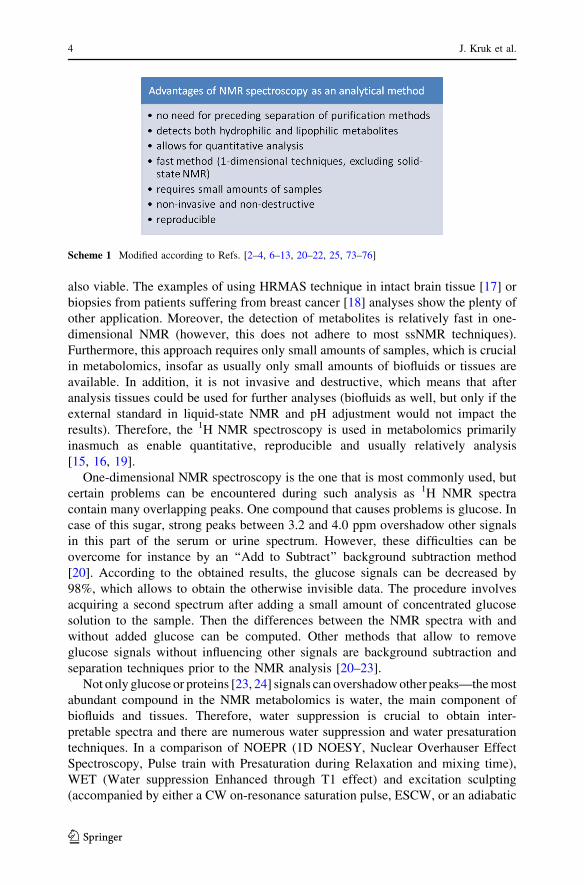
NMR spectroscopy has numerous advantages listed in Scheme 1. However, it is
capable of detecting the compounds given above micromolar concentrations. To
perform the analysis, liquid-state NMR requires an addition of an external standard;
for example, tetramethylsilane (TMS) or 4,4-dimethyl-4-silapentane-1-sulfonate
(DSS) in case of using water as solvent or octadecanoic acid and methyl
octadecanoate for fatty acids and theirs derivatives [12–14]. To perform the
quantitative analysis, for example, method utilizing the area per proton (determined
by integration) [14], LCModel [15] or OPLSA-DA strategy [16] is used.
Quantitative analysis is somewhat more challenging in ssNMR, nevertheless, it is
Table 1 List of abbreviations used in current publication
Abbreviation Technique
NOEPR 1D Nuclear Overhauser Effect spectroscopy, Pulse train with Presaturation during
Relaxation and mixing time
WET Water suppression Enhanced through T1 effect
ES Excitation sculpting
ESCW CW on-resonance saturation pulse
ESWGL Adiabatic frequency modulation ‘‘wiggly’’ pulse during the relaxation delay
MISSISSIPPI Multiple Intense Solvent Suppression Intended for Sensitive Spectroscopic Investigation
of Protonated Proteins, Instantly
CPMG Carr–Purcell–Meiboom–Gill
HRMAS High-Resolution Magic-Angle Spinning
PASS Phase-Adjusted Spinning Sidebands
PHORMAT PHase-cORrected Magic-Angle Turning
MACS Magic-Angle Coil Spinning
ERETIC Electronic REference To access In vivo Concentrations
CP Cross-Polarization
DEPT Distortionless Enhancement by Polarization Transfer
q-MAS
PGSE
Magic-Angle Spinning of the Q-vector in Pulsed-Gradient Spin-Echo
NMR Techniques in Metabolomic Studies: A Quick Overview… 3
123
also viable. The examples of using HRMAS technique in intact brain tissue [17] or
biopsies from patients suffering from breast cancer [18] analyses show the plenty of
other application. Moreover, the detection of metabolites is relatively fast in one-
dimensional NMR (however, this does not adhere to most ssNMR techniques).
Furthermore, this approach requires only small amounts of samples, which is crucial
in metabolomics, insofar as usually only small amounts of biofluids or tissues are
available. In addition, it is not invasive and destructive, which means that after
analysis tissues could be used for further analyses (biofluids as well, but only if the
external standard in liquid-state NMR and pH adjustment would not impact the
results). Therefore, the 1H NMR spectroscopy is used in metabolomics primarily
inasmuch as enable quantitative, reproducible and usually relatively analysis
[15, 16, 19].
One-dimensional NMR spectroscopy is the one that is most commonly used, but
certain problems can be encountered during such analysis as 1H NMR spectra
contain many overlapping peaks. One compound that causes problems is glucose. In
case of this sugar, strong peaks between 3.2 and 4.0 ppm overshadow other signals
in this part of the serum or urine spectrum. However, these difficulties can be
overcome for instance by an ‘‘Add to Subtract’’ background subtraction method
[20]. According to the obtained results, the glucose signals can be decreased by
98%, which allows to obtain the otherwise invisible data. The procedure involves
acquiring a second spectrum after adding a small amount of concentrated glucose
solution to the sample. Then the differences between the NMR spectra with and
without added glucose can be computed. Other methods that allow to remove
glucose signals without influencing other signals are background subtraction and
separation techniques prior to the NMR analysis [20–23].
Not only glucose or proteins [23, 24] signals can overshadow other peaks—the most
abundant compound in the NMR metabolomics is water, the main component of
biofluids and tissues. Therefore, water suppression is crucial to obtain inter-
pretable spectra and there are numerous water suppression and water presaturation
techniques. In a comparison of NOEPR (1D NOESY, Nuclear Overhauser Effect
Spectroscopy, Pulse train with Presaturation during Relaxation and mixing time),
WET (Water suppression Enhanced through T1 effect) and excitation sculpting
(accompanied by either a CW on-resonance saturation pulse, ESCW, or an adiabatic
Scheme 1 Modified according to Refs. [2–4, 6–13, 20–22, 25, 73–76]
4 J. Kruk et al.
123

frequency modulation ‘‘wiggly’’ pulse during the relaxation delay, ESWGL), it was
concluded that ESCW, ESWGL, NOEPR and ES methods obtain great water
suppression with high reproducibility. WET yielded distinctly worse results [21]. It is
worth mentioning that NOESY technique is the most popular and enables optimization
of process. Other solvent suppression techniques are being developed, such as
Multiple Intense Solvent Suppression Intended for Sensitive Spectroscopic Investi-
gation of Protonated Proteins, Instantly (MISSISSIPPI), which consists of gradient
and saturation pulses [22]. Currently, due to the variability in the quality of water
suppression, the water peaks are present in the spectra and, therefore, the region of
water resonance is not included in the metabolomic analysis (approximately
4.50–5.00 ppm). The emerging water suppression techniques might change it and
make it possible to retrieve data also from this part of the spectrum [22].
1D spectra are also acquired with the Carr–Purcell–Meiboom–Gill (CPMG)
pulse sequence to decrease broad signals from proteins and lipoproteins because of
their relatively long transverse relaxation times [23, 25]. Thus, the signals from
compounds with low molecular weight are not overshadowed by signals of
macromolecules. An example of mentioned spectrum is given in Fig. 2.
Fig. 2 Example of one-dimensional Carr– Purcell–Meiboom–Gill (1D – CPMG) 1H NMR spectra ofserum spectra from: a healthy patient, b patient suffering from esophageal cancer showing keymetabolites. Modified according to [25]
NMR Techniques in Metabolomic Studies: A Quick Overview… 5
123

1.2 Two-Dimensional (2D) Techniques
The problems that arise from signal overlap can be partly overcome by employing
two-dimensional NMR spectroscopy. It allows to determine the peak intensity and
its properties, such as the spin multiplicity and coupling constant, even if in 1D
spectra it is overshadowed by a stronger signal. Table 2 outlines a concise
comparison of 1D and 2D NMR techniques. There are a number of 2D NMR
methods that are particularly commonly used in metabolomics to determine the
presence and concentrations of otherwise undetectable compounds or confirm peak
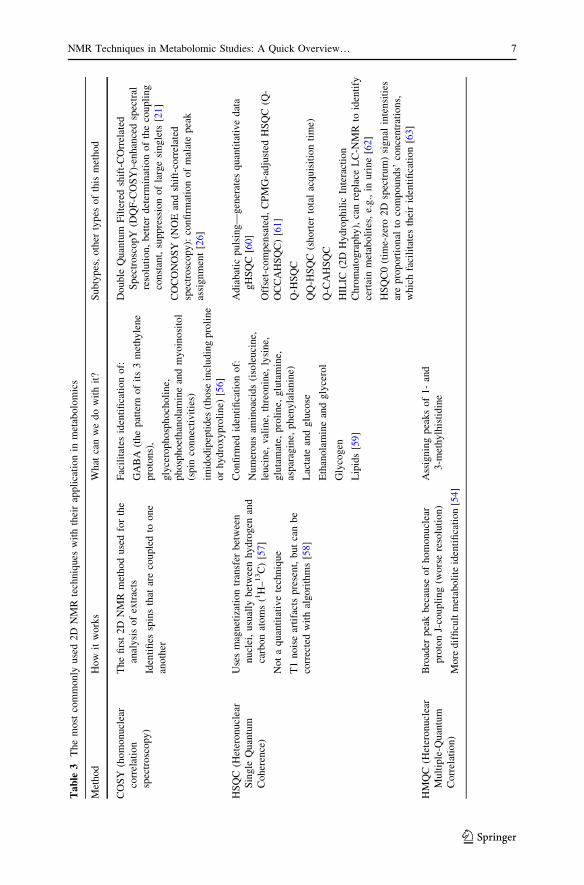
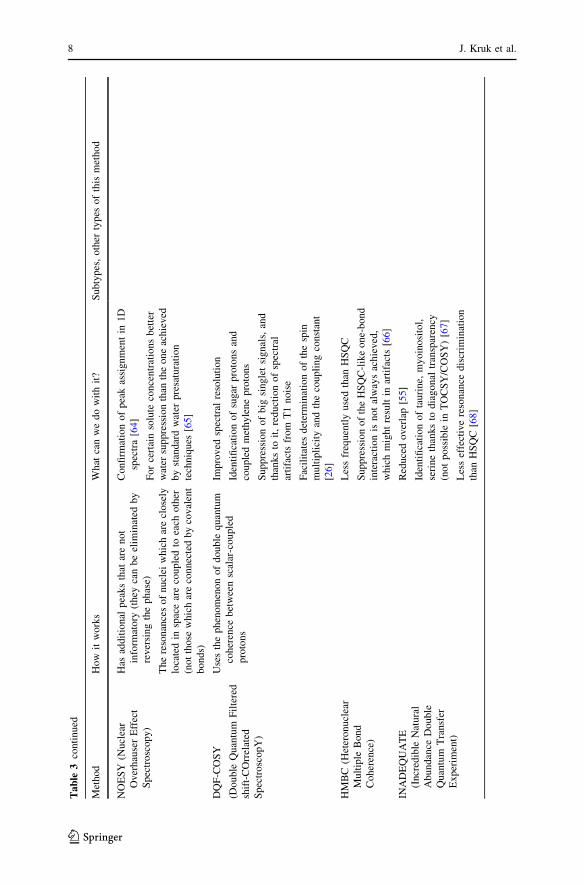
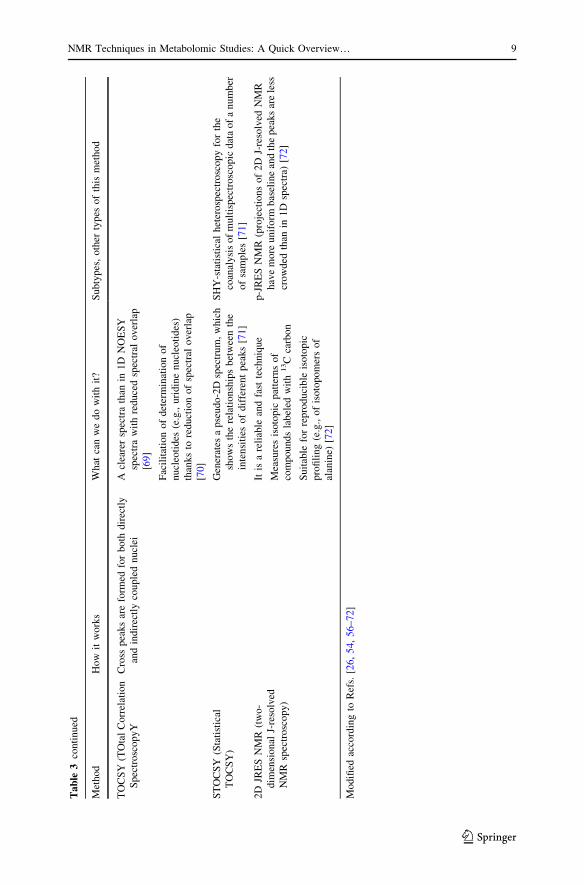
assignment by spin connectivities [26]. In Table 3 are depicted the most commonly
used 2D NMR techniques with their application in metabolomics. So far, there is not
known a fast and automatic methodology of signal’ deconvolution and times of
measurements are not acceptable.
It is noteworthy that the difficulties encountered during analysis depend on
properties of biofluid tested. The most widely used biofluids in metabolomics are
serum/plasma and urine (Figs. 3, 4). They are relatively easy to obtain and their
collection is relatively non-invasive. Additionally, the cerebrospinal fluid (CSF) is
also examined [27], but on a smaller scale because of the invasiveness of the
lumbar puncture. Herein, the fact that NMR analysis requires only small amounts
of samples is particularly important, inasmuch as bigger amounts of CSF would
be extremely difficult to obtain without side effects for the patient. On the other
hand, this small amount of sample is sufficient for detecting crucial substances
(Fig. 5) [28].
Appropriate identification of compounds and determination of their concentra-
tions is of utmost significance. Furthermore, also a dataset of ‘control’ NMR
biofluid results needs to be gathered so as to have a reference group that can be
compared to those with a particular disease. It is difficult, inasmuch as compounds
of low molecular weight can easily be disturbed by a number of factors, not only a
given disease or treatment. Therefore, it is crucial to establish the NMR metabolome
Table 2 Comparison of parameters of 1D and 2D NMR techniques
Parameter 1D 2D
Degree of overlap for
quantitative analysis
Higher Lower
Sensitivity to pulse
imperfections
Lower (lower signal
to noise ratio)
Higher
Number of factors
influencing peak
Lower Higher (e.g., J-coupling or relaxation time)
Calibration procedure One for the whole
experiment
Individual for each compound (for quantitative
analysis—peaks ratio does not reflect the
concentration ratio directly)
Experiment duration Shorter Longer
Efficacy (particularly for
small molecules)
Lower Higher
Modified according to Refs. [26, 55]
6 J. Kruk et al.
123
Ta
ble
3T
he
most
com
mon
lyu
sed
2D
NM
Rte
chniq
ues
wit
hth
eir
app
lica
tio
nin
met
abo
lom
ics
Met
ho
dH
ow
itw
ork
sW
hat
can
we
do
wit
hit
?S
ub
typ
es,
oth
erty
pes
of
this
met
ho
d
CO
SY
(ho
mo
nucl
ear
corr
elat
ion
spec
tro
scop
y)
Th
efi
rst
2D
NM
Rm
eth
od
use
dfo
rth
e
anal
ysi
so
fex
trac
ts
Iden
tifi
essp
ins
that
are
cou
ple
dto
on
e
ano
ther
Fac
ilit
ates
iden
tifi
cati
on
of:
GA
BA
(th
ep
atte
rno
fit
s3
met
hy
len
e
pro
ton
s),
gly
cero
ph
osp
ho
cho
lin
e,
ph
osp
ho
eth
ano
lam
ine
and
my
oin
osi
tol
(sp
inco
nn
ecti
vit
ies)
imid
od
ipep
tid
es(t
ho
sein
clu
din
gp
roli
ne
or
hy
dro
xy
pro
lin
e)[5
6]
Double
Quan
tum
Fil
tere
dsh
ift-
CO
rrel
ated
Sp
ectr
osc
op
Y(D
QF
-CO
SY
)-en
han
ced
spec
tral
reso
luti
on
,b
ette
rd
eter
min
atio
no
fth
eco
up
ling
con
stan
t,su
pp
ress
ion
of
larg
esi
ng
lets
[21]
CO
CO
NO
SY
(NO
Ean
dsh
ift-
corr
elat
ed
spec
trosc
op
y):
con
firm
atio
no
fm
alat
ep
eak
assi
gn
men
t[2
6]
HS
QC
(Het
ero
nu
clea
r
Sin
gle
Qu
antu
m
Coh
eren
ce)
Use
sm
agn
etiz
atio
ntr
ansf
erb
etw
een
nu
clei
,u
sual
lyb
etw
een
hy
dro
gen
and
carb
on
ato
ms
(1H
–13C
)[5
7]
No
ta
qu
anti
tati
ve
tech
niq
ue
T1
nois
ear
tifa
cts
pre
sent,
but
can
be
corr
ecte
dw
ith
alg
ori
thm
s[5
8]
Con
firm
edid
enti
fica
tio
no
f:
Nu
mer
ou
sam
ino
acid
s(i
sole
uci
ne,
leu
cin
e,v
alin
e,th
reo
nin
e,ly
sin
e,
glu
tam
ate,
pro
lin
e,g
luta
min
e,
asp
arag
ine,
ph
enyla
lan
ine)
Lac
tate
and
glu
cose
Eth
ano
lam
ine
and
gly
cero
l
Gly
cog
en
Lip
ids
[59]
Adia
bat
icpuls
ing—
gen
erat
esquan
tita
tive
dat
a
gH
SQ
C[6
0]
Off
set-
com
pen
sate
d,
CP
MG
-ad
just
edH
SQ
C(Q
-
OC
CA
HS
QC
)[6
1]
Q-H
SQ
C
-HS
QC
(sh
ort
erto
tal
acq
uis
itio
nti
me)
Q-C
AH
SQ
C
HIL
IC(2
DH
yd
roph
ilic
Inte
ract
ion
Chro
mat
ogra
phy),
can
repla
ceL
C-N
MR
toid
enti
fy
cert
ain
met
abo
lite
s,e.
g.,
inu
rin
e[6
2]
HS
QC
0(t
ime-
zero
2D
spec
trum
)si
gn
alin
ten
siti
es
are
pro
port
ion
alto
com
po
und
s’co
nce
ntr
atio
ns,
wh
ich
faci
lita
tes
thei
rid
enti
fica
tio
n[6
3]
HM
QC
(Het
ero
nu
clea
r
Mult
iple
-Quan
tum
Corr
elat
ion
)
Bro
ader
pea
kb
ecau
seo
fh
om
onu
clea
r
pro
ton
J-co
up
lin
g(w
ors
ere
solu
tio
n)
Mo
red
iffi
cult
met
abo
lite
iden
tifi
cati
on
[54]
Ass
ign
ing
pea
ks
of
1-
and
3-m
eth
ylh
isti
din
e
NMR Techniques in Metabolomic Studies: A Quick Overview… 7
123
Ta
ble
3co
nti
nu
ed
Met
ho
dH
ow
itw
ork
sW
hat
can
we
do
wit
hit
?S
ub
typ
es,
oth
erty
pes
of
this
met
ho
d
NO
ES
Y(N
ucl
ear
Ov
erh
ause
rE
ffec
t
Sp
ectr
osc
op
y)
Has
add
itio
nal
pea
ks
that
are
no
t
info
rmat
ory
(th
eyca
nb
eel
imin
ated
by
rev
ersi
ng
the
ph
ase)
Th
ere
son
ance
so
fn
ucl
eiw
hic
har
ecl
ose
ly
loca
ted
insp
ace
are
cou
ple
dto
each
oth
er
(no
tth
ose
wh
ich
are
con
nec
ted
by
cov
alen
t
bo
nds)
Con
firm
atio
no
fp
eak
assi
gn
men
tin
1D
spec
tra
[64]
Fo
rce
rtai
nso
lute
con
cen
trat
ion
sb
ette
r
wat
ersu
ppre
ssio
nth
anth
eone
achie
ved
by
stan
dar
dw
ater
pre
satu
rati
on
tech
niq
ues
[65]
DQ
F-C
OS
Y
(Double
Quan
tum
Fil
tere
d
shif
t-C
Orr
elat
ed
Sp
ectr
osc
opY
)
Use
sth
ep
hen
om
eno
no
fd
ou
ble
qu
antu
m
coher
ence
bet
wee
nsc
alar
-couple
d
pro
ton
s
Imp
rov
edsp
ectr
alre
solu
tio
n
Iden
tifi
cati
on
of
sugar
pro
tons
and
cou
ple
dm
eth
yle
ne
pro
ton
s
Suppre
ssio
nof
big
single
tsi
gnal
s,an
d
than
ks
toit
,re
du
ctio
no
fsp
ectr
al
arti
fact
sfr
om
T1
no
ise
Fac
ilit
ates
det
erm
inat
ion
of
the
spin
mult
ipli
city
and
the
coupli
ng
const
ant
[26
]
HM
BC
(Het
ero
nu
clea
r
Mu
ltip
leB
on
d
Coh
eren
ce)
Les
sfr
equen
tly
use
dth
anH
SQ
C
Suppre
ssio
nof
the
HS
QC
-lik
eone-
bond
inte
ract
ion
isnot
alw
ays
achie
ved
,
whic
hm
ight
resu
ltin
arti
fact
s[6
6]
INA
DE
QU
AT
E
(Incr
edib
leN
atu
ral
Ab
un
dan
ceD
ou
ble
Qu
antu
mT
ran
sfer
Ex
per
imen
t)
Red
uce
do
ver
lap
[55]
Iden
tifi
cati
on
of
tauri
ne,
myoin
osi
tol,
seri
ne
than
ks
tod
iag
on
altr
ansp
aren
cy
(no
tp
oss
ible
inT
OC
SY
/CO
SY
)[6
7]
Les
sef
fect
ive
reso
nan
ced
iscr
imin
atio
n
than
HS
QC
[68]
8 J. Kruk et al.
123
Ta
ble
3co
nti
nu
ed
Met
ho
dH
ow
itw
ork
sW
hat
can
we
do
wit
hit
?S
ub
typ
es,
oth
erty
pes
of
this
met
ho
d
TO
CS
Y(T
Ota
lC
orr
elat
ion
Sp
ectr
osc
op
yY
Cro
ssp
eak
sar
efo
rmed
for
bo
thd
irec
tly
and
indir
ectl
yco
uple
dnucl
ei
Acl
eare
rsp
ectr
ath
anin
1D
NO
ES
Y
spec
tra
wit
hre
du
ced
spec
tral
ov
erla
p
[69]
Fac
ilit
atio
no
fd
eter
min
atio
no
f
nu
cleo
tid
es(e
.g.,
uri
din
en
ucl
eoti
des
)
than
ks
tore
du
ctio
no
fsp
ectr
alo
ver
lap
[70
]
ST
OC
SY
(Sta
tist
ical
TO
CS
Y)
Gen
erat
esa
pse
udo
-2D
spec
tru
m,
wh
ich
show
sth
ere
lati
onsh
ips
bet
wee
nth
e
inte
nsi
ties
of
dif
fere
nt
pea
ks
[71]
SH
Y-s
tati
stic
alhet
erosp
ectr
osc
opy
for
the
coan
alysi
sof
mult
ispec
trosc
opic
dat
aof
anum
ber
of
sam
ple
s[7
1]
2D
JRE
SN
MR
(tw
o-
dim
ensi
on
alJ-
reso
lved
NM
Rsp
ectr
osc
op
y)
Itis
are
liab
lean
dfa
stte
chniq
ue
Mea
sure
sis
oto
pic
pat
tern
so
f
com
po
und
sla
bel
edw
ith
13C
carb
on
Su
itab
lefo
rre
pro
du
cib
leis
oto
pic
pro
fili
ng
(e.g
.,o
fis
oto
po
mer
so
f
alan
ine)
[72
]
p-J
RE
SN
MR
(pro
ject
ion
so
f2
DJ-
reso
lved
NM
R
hav
em
ore
un
ifo
rmb
asel
ine
and
the
pea
ks
are
less
crow
ded
than
in1
Dsp
ectr
a)[7
2]
Mo
difi
edac
cord
ing
toR
efs.
[26,
54,
56–7
2]
NMR Techniques in Metabolomic Studies: A Quick Overview… 9
123
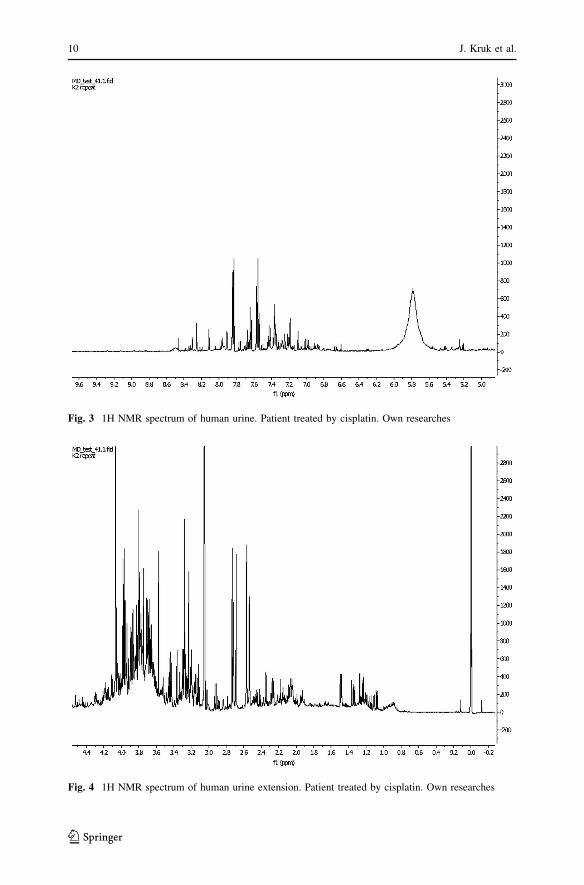
Fig. 3 1H NMR spectrum of human urine. Patient treated by cisplatin. Own researches
Fig. 4 1H NMR spectrum of human urine extension. Patient treated by cisplatin. Own researches
10 J. Kruk et al.
123
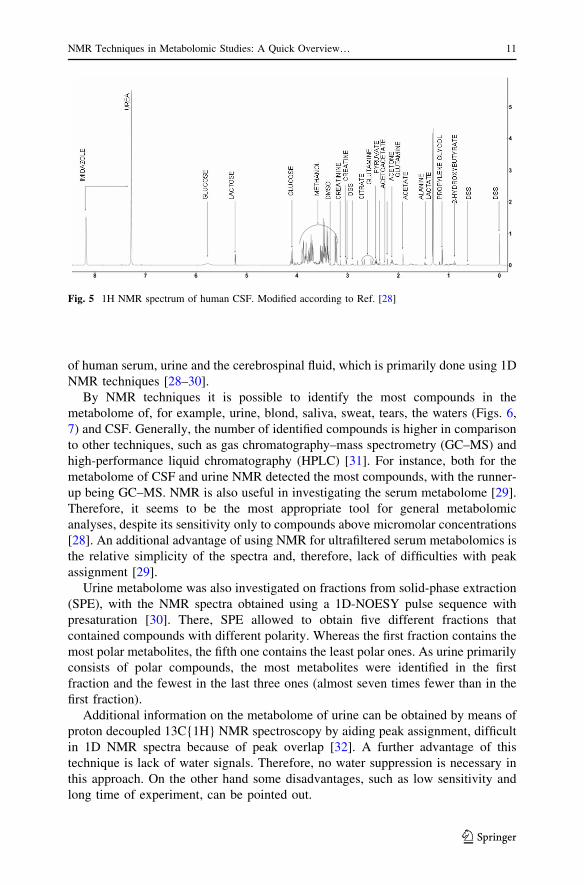
of human serum, urine and the cerebrospinal fluid, which is primarily done using 1D
NMR techniques [28–30].
By NMR techniques it is possible to identify the most compounds in the
metabolome of, for example, urine, blond, saliva, sweat, tears, the waters (Figs. 6,
7) and CSF. Generally, the number of identified compounds is higher in comparison
to other techniques, such as gas chromatography–mass spectrometry (GC–MS) and
high-performance liquid chromatography (HPLC) [31]. For instance, both for the
metabolome of CSF and urine NMR detected the most compounds, with the runner-
up being GC–MS. NMR is also useful in investigating the serum metabolome [29].
Therefore, it seems to be the most appropriate tool for general metabolomic
analyses, despite its sensitivity only to compounds above micromolar concentrations
[28]. An additional advantage of using NMR for ultrafiltered serum metabolomics is
the relative simplicity of the spectra and, therefore, lack of difficulties with peak
assignment [29].
Urine metabolome was also investigated on fractions from solid-phase extraction
(SPE), with the NMR spectra obtained using a 1D-NOESY pulse sequence with
presaturation [30]. There, SPE allowed to obtain five different fractions that
contained compounds with different polarity. Whereas the first fraction contains the
most polar metabolites, the fifth one contains the least polar ones. As urine primarily
consists of polar compounds, the most metabolites were identified in the first
fraction and the fewest in the last three ones (almost seven times fewer than in the
first fraction).
Additional information on the metabolome of urine can be obtained by means of
proton decoupled 13C{1H} NMR spectroscopy by aiding peak assignment, difficult
in 1D NMR spectra because of peak overlap [32]. A further advantage of this
technique is lack of water signals. Therefore, no water suppression is necessary in
this approach. On the other hand some disadvantages, such as low sensitivity and
long time of experiment, can be pointed out.
Fig. 5 1H NMR spectrum of human CSF. Modified according to Ref. [28]
NMR Techniques in Metabolomic Studies: A Quick Overview… 11
123

Fig. 6 1H NMR spectrum of the human waters (0–5 ppm). Own researches
Fig. 7 1H NMR spectrum of the human waters (5–10 ppm). Own researches
12 J. Kruk et al.
123

2 Solid-State NMR (ssNMR)
Apart from body fluids and tissue extracts (Fig. 8), metabolomics also allows to
examine tissue samples, but separate methods have to be used then, such as ssNMR.
The advantages of such spectra is the fact that they require little preparation and
they retrieve results comparable to those obtained in NMR of considerably more
time-consuming tissue extracts. Furthermore, ssNMR is a non-destructive technique
and require small tissue samples. Being non-destructive is particularly important in
solid-state NMR as it means that after NMR analysis the tissue can be sent for
histopathology examination. Obviously, such spectra comprise numerous different
peaks and, therefore, 2D NMR techniques also have to be used. However, in solid-
state spectra due to dipolar coupling and chemical shift anisotropies, the obtained
signals are broadened and, therefore, the signal overlap is increased and they are
more difficult to identify. At first, these difficulties were overcome by isotope
labeling (particularly in collagen research); nevertheless, it was a costly and time-
consuming method. This is why currently in solid-state experiments, high-resolution
magic-angle spinning (HRMAS) spectroscopy is used. It decreases line broadening
by rotating the sample at the angle of 54.74� (the ‘magic angle’) with respect to the
external magnetic field, thus eliminating the anisotropic interactions. It is necessary
to use high spinning rates because they have to be higher than or similar to the
interaction strength: and especially the dipolar couplings between two hydrogen
atoms are quite strong. When lower spinning rates are used, a series of narrow peaks
Fig. 8 Example of 2D 1H, 13C HSQC NMR spectrum of biological sample—an extract of fish eggs.Modified according to [35]
NMR Techniques in Metabolomic Studies: A Quick Overview… 13
123
is obtained, separated by equal intervals (equal to multiples of the applied frequency
of rotations) [33].
HRMAS techniques allow to achieve better resolution; however, the factors
influencing line broadening are highly dependent on the material structure and
enable, for example, investigation of bone mineralization [33]. This is why there are
few methods that make it possible to conduct recoupling of the anisotropic
Hamiltonians and to separate the anisotropic and isotropic interactions, thanks to
which more comprehensive data can be obtained that inform us about the material
structure [33].
Nevertheless, the spinning in MAS may cause cell and tissue destruction both by
rotations and an increase of temperature, and thus impact the measurements. This is
why in cases of particularly vulnerable specimens, slow MAS can be used.
Obviously, then an additional method must be used to suppress the spinning
sidebands, which is normally achieved by fast MAS. Such methods are phase-
adjusted spinning sidebands (PASS) and phase-corrected magic-angle turning
(PHORMAT). They can be used with magic-angle coil spinning (MACS) to
examine small samples with high sensitivity [75].
A challenge, not encountered in NMR of solutions, presents itself in solid-state
NMR—quantification of metabolites. In solid-state NMR, it is very difficult or even
impossible to add an exact amount of a reference compound. Nonetheless, a method
was developed that makes it possible to overcome this obstacle, namely ERETIC
(Electronic REference To access In vivo Concentrations). Since its development, it
has become widespread in HRMAS NMR as a method that allows to quantify the
detected metabolites, e.g., in brain tissue examinations or breast cancer biopsies
[17, 18].
Apart from tissue samples, such as prostate, cancer biopsies and other organs,
also bone and cartilage are researched using HRMAS spectroscopy. Particularly for
bone, because of its high phosphate content, cross-polarization HRMAS spec-
troscopy is used to obtain 31P spectra of better resolution. It uses magnetization
transfer from abundant nuclei (such as 1H) to those less abundant (for example 31P)
via dipolar couplings to enhance the signals from the less numerous ones. However,
as was mentioned, fast spinning rate decreases heteronuclear dipolar couplings
(such as those between 1H and 31P atoms)—which impairs CP. This way, signals
from atoms other than hydrogen that do not have strong couplings to hydrogen
nuclei can be eliminated [35]. Because of these relationships, the signal intensity is
dependent on the time during which the polarization transfer takes place. This is
why in such experiments signal intensity must be compared over a variety of contact
times, and not only for its fixed value. Such investigations were carried out
considering the phosphorus components and their structure in bone (the graph of
intensity vs. contact time is strongly dependent on the material structure) [36–39]
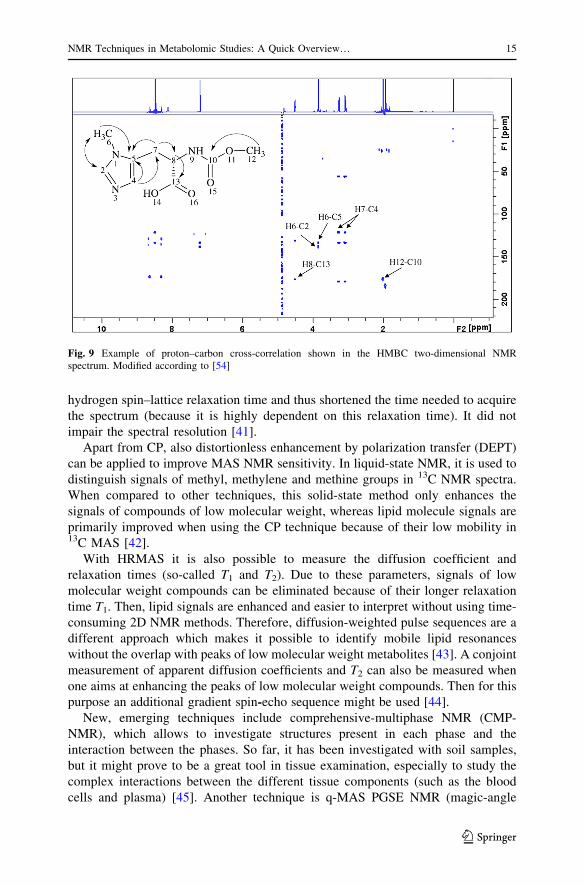
and bone implants [33] (Fig. 9). Cross-polarization can be improved using multiple
cross-polarization pulse sequences, which considerably shorten the acquisition time
[76].
The time required to obtain the spectra in ssNMR can be decreased, e.g., using
paramagnetic doping. Then an addition of a solution of copper (II) ions to powdered
tissues containing collagen prior to 13C CP MAS resulted in a shortening of the
14 J. Kruk et al.
123
hydrogen spin–lattice relaxation time and thus shortened the time needed to acquire
the spectrum (because it is highly dependent on this relaxation time). It did not
impair the spectral resolution [41].
Apart from CP, also distortionless enhancement by polarization transfer (DEPT)
can be applied to improve MAS NMR sensitivity. In liquid-state NMR, it is used to
distinguish signals of methyl, methylene and methine groups in 13C NMR spectra.
When compared to other techniques, this solid-state method only enhances the
signals of compounds of low molecular weight, whereas lipid molecule signals are
primarily improved when using the CP technique because of their low mobility in13C MAS [42].
With HRMAS it is also possible to measure the diffusion coefficient and
relaxation times (so-called T1 and T2). Due to these parameters, signals of low
molecular weight compounds can be eliminated because of their longer relaxation
time T1. Then, lipid signals are enhanced and easier to interpret without using time-
consuming 2D NMR methods. Therefore, diffusion-weighted pulse sequences are a
different approach which makes it possible to identify mobile lipid resonances
without the overlap with peaks of low molecular weight metabolites [43]. A conjoint
measurement of apparent diffusion coefficients and T2 can also be measured when
one aims at enhancing the peaks of low molecular weight compounds. Then for this
purpose an additional gradient spin-echo sequence might be used [44].
New, emerging techniques include comprehensive-multiphase NMR (CMP-
NMR), which allows to investigate structures present in each phase and the
interaction between the phases. So far, it has been investigated with soil samples,
but it might prove to be a great tool in tissue examination, especially to study the
complex interactions between the different tissue components (such as the blood
cells and plasma) [45]. Another technique is q-MAS PGSE NMR (magic-angle
Fig. 9 Example of proton–carbon cross-correlation shown in the HMBC two-dimensional NMRspectrum. Modified according to [54]
NMR Techniques in Metabolomic Studies: A Quick Overview… 15
123
spinning of the q-vector in pulsed-gradient spin-echo NMR), which is used to
examine the pores of different materials by investigating the diffusion of water,
without the contribution of anisotropic interactions (they are nullified). Furthermore,
comparing q-MAS PGSE NMR and PGSE NMR results makes it possible to
determine whether microscopic diffusion anisotropy is present in the examined
system. In metabolomics, it might find applications in researching the structure of
axons [46].
3 19F NMR Spectroscopy in Metabolomic Studies
In our paper, we described some 1H NMR spectroscopy applications; nevertheless,
the progress of 19F spectroscopy approaches in metabolomics requires attention
herein. The nuclei of 19F is characterised by gyromagnetic ratio almost equal to that
of the proton and broader range of chemical shift. Due to connection between
metabolomics and pharmaceuticals studies, we would like to indicate some
achievements [47–53].
An experiments using glioma model (similarity to human glioblastoma)
demonstrate that 19F MRI in combination with 1H MRI can selectively map the
bio-distribution of 19F-BPA (boronophenylalanine). The 19F BPA monitoring
uptake in tumors by 19F imaging indicates the 19F MRI as a tool of better
understanding and investigating the pharmacokinetics of fluorinate-containing
drugs. The results of experiments give information about optimal timing for neutron
irradiation. In boron neutron capture therapy (BNCT), the exposure time is very
important and conclusions from quoted experiment can be useful while conducting
therapy [47].1H, 19F, 13C and 10B magnetic resonance spectroscopy for another boron neutron
capture therapy agent, an 19F-labeled, 10B-enriched p-boronophenylalanine–fructose
complex (19F-BPA–fr) is also reported [48]. The aim of the cited study was a
reaction yield optimization for the synthesis and the complexation of the BNCT
agent. In addition, the feasibility of using 19F-MRS to perform pharmacokinetic
studies of the 19F-BPA–fr complex was proven [49].
Moreover, application of 19F NMR spectroscopy in gene therapy is reported,
which is limited by difficulties in assessing the success of transfection in terms of
spatial extent, gene expression and longevity of expression [49]. Cui et al. prepared
the molecular and 19F NMR characteristics of PFONPG (4-fluoro-2-nitrophenyl-b-
D-galactopyranoside) in solution, blood and prostate tumor cells and showed new
possibilities into developments of the gene therapy [49].
Due to the popularity of 19F spectroscopy in environmental studies and metabolic
screening of new isolated organisms, it was used in exploring the aerobic microbial
degradation [50]. By analyzing reaction of fluorophenols, the potential of 19F
biodegradation studies was proven. Other studies explore the toxicity of a fluorine-
labeled derivative of ascorbic acid (F-ASA), a major antioxidant, by measuring
in vitro and in vivo accumulation of F-ASA, fluoro-dehydroascorbate or fluoro-2,3-
diketogulonate and their degradation products [51]. The importance of such
discoveries will be noticed when we make ourselves aware that a lot of drugs
16 J. Kruk et al.
123
contain the fluorine atom in their structure. Many anesthetics, chemotherapeutic
agents and molecules with high oxygen solubility for respiration and blood
substitution can be monitored by MRS techniques, as well as by fluorine (19F) MRI
[52]. It is worth to mention that the application of 19F spectroscopy techniques in the
specific targeting, imaging of cellular surface epitopes, cell tracking of endogenous
macrophages or injected immune cells is reported as well [52].
Compared to traditional attempt at exploring new biologically active compound,
another approach is possible thanks to fluorine NMR-based assay n-FABS (n-
fluorine atoms for biochemical screening), which enables screening and identifi-
cation of inhibitors for a specific enzymatic target [53]. Due to easy setup,
versatility and lack of interfering signals, this method might be widely applicable
and should facilitate the identification and characterization of small molecule
inhibitors for example of the membrane-bound serine amidase or fatty acid amide
hydrolase [53].
4 Conclusions
Since years an enormous development of nuclear magnetic resonance has been
observed and many explored techniques have been used in metabolomic studies.
Among advantages of 1D techniques applied in metabolomics, employing nuclei
such as 13C, 31P, 43Ca, possibility of quantitative analysis, needles of only small
amounts of samples and obtaining excellent quality of spectra thanks to solvent
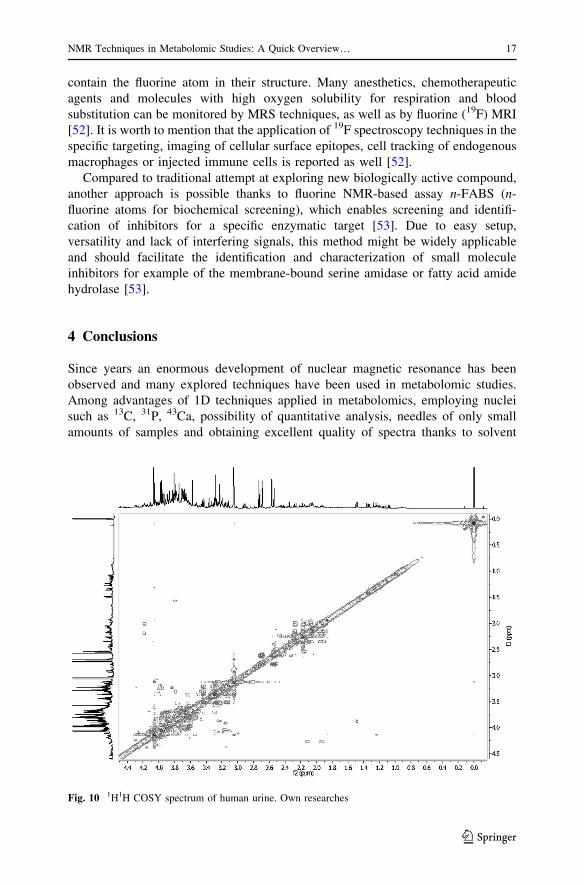
Fig. 10 1H1H COSY spectrum of human urine. Own researches
NMR Techniques in Metabolomic Studies: A Quick Overview… 17
123
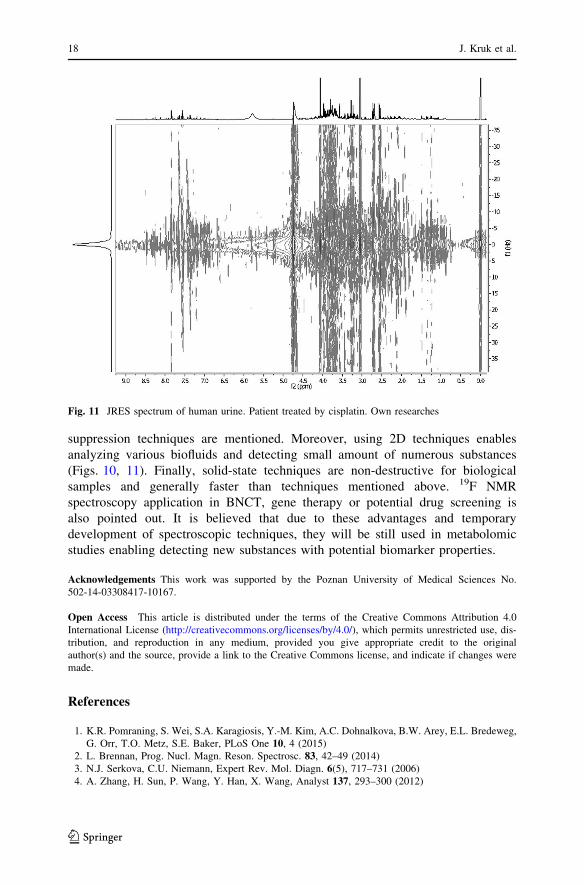
suppression techniques are mentioned. Moreover, using 2D techniques enables
analyzing various biofluids and detecting small amount of numerous substances
(Figs. 10, 11). Finally, solid-state techniques are non-destructive for biological
samples and generally faster than techniques mentioned above. 19F NMR
spectroscopy application in BNCT, gene therapy or potential drug screening is
also pointed out. It is believed that due to these advantages and temporary
development of spectroscopic techniques, they will be still used in metabolomic
studies enabling detecting new substances with potential biomarker properties.
Acknowledgements This work was supported by the Poznan University of Medical Sciences No.
502-14-03308417-10167.
Open Access This article is distributed under the terms of the Creative Commons Attribution 4.0
International License (http://creativecommons.org/licenses/by/4.0/), which permits unrestricted use, dis-
tribution, and reproduction in any medium, provided you give appropriate credit to the original
author(s) and the source, provide a link to the Creative Commons license, and indicate if changes were
made.
References
1. K.R. Pomraning, S. Wei, S.A. Karagiosis, Y.-M. Kim, A.C. Dohnalkova, B.W. Arey, E.L. Bredeweg,
G. Orr, T.O. Metz, S.E. Baker, PLoS One 10, 4 (2015)
2. L. Brennan, Prog. Nucl. Magn. Reson. Spectrosc. 83, 42–49 (2014)
3. N.J. Serkova, C.U. Niemann, Expert Rev. Mol. Diagn. 6(5), 717–731 (2006)
4. A. Zhang, H. Sun, P. Wang, Y. Han, X. Wang, Analyst 137, 293–300 (2012)
Fig. 11 JRES spectrum of human urine. Patient treated by cisplatin. Own researches
18 J. Kruk et al.
123

5. https://www.ncsu.edu/chemistry/msf/pdf/IsotopicMass_NaturalAbundance.pdf (last log-on
12.07.2016)
6. S. Moco, J. Vervoort, S. Moco, R.J. Bino, R.C.H. De Vos, R. Bino, TrAC. Trends Anal. Chem. 26(9),
855–866 (2007)
7. N.V. Reo, Drug Chem. Toxicol. 25(4), 375–382 (2002)
8. R. Verpoorte, Y.H. Choi, H.K. Kim, Phytochem. Rev. 6, 3–14 (2007)
9. H.A. Scheidt, S. Schibur, A. Magalhaes, E.R. de Azevedo, T.J. Bonagamba, O. Pascui, R. Schulz, D.
Reichert, D. Huster, Biopolymers 93(6), 520–532 (2010)
10. G.S. Payne, H. Troy, S.J. Vaidya, J.R. Griffiths, M.O. Leach, Y.L. Chung, NMR Biomed. 19(5),
593–598 (2006)
11. J. Xu, P. Zhu, Z. Gan, N. Sahar, M. Tecklenburg, M.D. Morris, D.H. Kohn, A. Ramamoorthy, J. Am.
Chem. Soc. 132(33), 11504–11509 (2010)
12. Z.-Z. Li, Q.-X. Guo, T. Ren, X.-Q. Zhu, Y-Ch. Liu, J. Inclusion. Phenom. Mol. Recogn. Chem. 15(1),
37–42 (1993)
13. R.M. Silverstein, F.X. Webster, D.J. Kiemle, Spektroskopowe Metody Identyfikacji Zwiazkow
Organicznych (Warszawa, Wydawnictwo Naukowe PWN, 2007), pp. 138–139
14. http://lipidlibrary.aocs.org/Analysis/content.cfm?ItemNumber=40256 (last log-on 12.07.2016)
15. D. Wishart, TrAC Trends Anal. Chem. 27(3), 228–237 (2007)
16. R. Schicho, R. Shaykhutdinov, J. Ngo, A. Nazyrova, C. Schneide, R. Panaccione, G.G. Kaplan, H.J.
Vogel, M. Storr, J. Proteome. Res. 11(6), 3344–3457 (2012)
17. O. Risa, T.M. Melø, U. Sonnewald, NMR Biomed. 22(3), 266–271 (2009)
18. M.D. Cao, B. Sitter, T.F. Bathen, A. Bofin, P.E. Lønning, S. Lundgren, I.S. Gribbestad, NMR
Biomed. 25(2), 369–378 (2012)
19. L. Da Silva, M. Godejohann, F.-P.J. Martin, S. Collino, A. Burkle, M. Moreno-Villanueva, J.
Bernhardt, O. Toussaint, B. Grubeck-Loebenstein, E.S. Gonos, E. Sikora, T. Grune, N. Breusing, C.
Franceschi, A. Hervonen, M. Spraul, S. Moco, Anal. Chem. 85(12), 5801–5809 (2013)
20. T. Ye, C. Zheng, S. Zhang, G.A. Gowda, O. Vitek, D. Raftery, Anal. Chem. 84(2), 994–1002 (2012)
21. N. Aranıbar, K.H. Ott, V. Roongta, L. Mueller, Anal. Biochem. 355(1), 62–70 (2006)
22. D.H. Zhou, C.M. Rienstra, J. Magn. Reson. 192(1), 167–172 (2008)
23. T. Ye, Ch. Zheng, S. Zhang, G.A. Nagana Gowgall, O. Vitek, D. Raftery, Anal. Chem. 84(2),
994–1002 (2012)
24. H.R. Tank, Y.L. Wang, J.K. Nicholson, Anal. Biochem. 325(2), 260–272 (2004)
25. X. Zhang, L. Xu, J. Shen, B. Cao, T. Cheng, T. Zhao, X. Liu, H. Zhang, Biochim. Biophys. Acta
1832(8), 1207–1216 (2013)
26. T.W.M. Fan, Prog. Nucl. Magn. Reson. Spectrosc. 28, 161–219 (1996)
27. A. Smolinska, J.M. Posma, L. Blanchet, K.A. Ampt, A. Atalli, T. Tuinstra, T. Luider, M. Doskocz,
P.J. Michiels, F.C. Girard, L.M. Buydens, S.S. Wijmenga, Anal. Bioanal. Chem. 403(4), 947–959
(2012)
28. D.S. Wishart, M.J. Lewis, J.A. Morrissey, M.D. Flegel, K. Jeroncic, Y. Xiong, D. Cheng, R. Eisner,
B. Gautam, D. Tzur, S. Sawhney, F. Bamforth, R. Greiner, L. Li, J. Chromatogr. B. Analyt. Technol.
Biomed. Life Sci. 871(2), 164–173 (2008)
29. N. Psychogios, D.D. Hau, J. Peng, A.C. Guo, R. Mandal, S. Bouatra, I. Sinelnikov, R. Krishna-
murthy, R. Eisner, B. Gautam, N. Young, J. Xia, C. Knox, E. Dong, P. Huang, Z. Hollander, T.L.
Pedersen, S.R. Smith, F. Bamforth, R. Greiner, B. McManus, J.W. Newman, T. Goodfriend, D.S.
Wishart, PLoS One 6(2), e16957 (2011)
30. S. Bouatra, F. Aziat, R. Mandal, A.C. Guo, M.R. Wilson, C. Knox, T.C. Bjorndahl, R. Krishna-
murthy, F. Saleem, P. Liu, Z.T. Dame, J. Poelzer, J. Huynh, F.S. Yallou, N. Psychogios, E. Dong, R.
Bogumil, C. Roehring, D.S. Wishart, PLoS One 8(9), e73076 (2013)
31. K.N. Patel, J.K. Patel, M.P. Patel, G.C. Rajput, H.A. Patel, Pharm. Methods 1(1), 2–13 (2010)
32. R.A. Shaykhutdinov, G.D. MacInnis, R. Dowlatabadi, A.M. Weljie, H.J. Vogel, Metabolomics 5(3),
307–317 (2009)
33. F. Weber, J. Bohme, H.A. Scheidt, W. Grunder, S. Rammelt, M. Hacker, M. Schulz-Siegmund, D.
Huster, NMR Biomed. 25(3), 464–475 (2012)
34. A. Wong, P.M. Aguiar, D. Sakellariou, Magn. Reson. Med. 63(2), 269–274 (2010)
35. Y. Xi, J.S. de Ropp, M.R. Viant, D.L. Woodruff, P. Yu, Anal. Chim. Acta 614(2), 127–133 (2008)
36. A. Kaflak-Hachulska, A. Samoson, W. Kolodziejski, Calcif. Tissue Int. 73(5), 476–486 (2003)
37. Y. Wu, J.L. Ackerman, E.S. Strawich, C. Rey, H.M. Kim, M.J. Glimcher, Calcif. Tissue Int. 72(5),
610–626 (2003)
NMR Techniques in Metabolomic Studies: A Quick Overview… 19
123
38. A. Kaflak, D. Chmielewski, A. Gorecki, A. Slosarczyk, W. Kolodziejski, Solid State Nucl. Magn.
Reson. 29(4), 345–348 (2006)
39. A. Kaflak, W. Kolodziejski, Magn. Reson. Chem. 46(4), 335–341 (2008)
40. R.L. Johnson, K. Schmid, – Rohr. J. Magn. Reson. 239, 44–49 (2014)
41. K.H. Mroue, N. MacKinnon, J. Xu, P. Zhu, E. McNerny, D.H. Kohn, M.D. Morris, A. Ramamoorthy,
J. Phys. Chem. B. 116(38), 11656–11661 (2012)
42. Y. Yang, L. Chen, H. Gao, D. Zeng, Y. Yue, M. Liu, H. Lei, F. Deng, C. Ye, Magn. Reson. Chem.
44(3), 263–268 (2006)
43. D. Zietkowski, R.L. Davidson, T.R. Eykyn, S.S. De Silva, N.M. Desouza, G.S. Payne, NMR Biomed.
23(4), 382–390 (2010)
44. O.M. Rooney, J. Troke, J.K. Nicholson, J.L. Griffin, Magn. Reson. Med. 50(5), 925–930 (2003)
45. D. Courtier-Murias, H. Farooq, H. Masoom, A. Botana, R. Soong, J.G. Longstaffe, M.J. Simpson,
W.E. Maas, M. Fey, B. Andrew, J. Struppe, H. Hutchins, S. Krishnamurthy, R. Kumar, M. Monette,
H.J. Stronks, A. Hume, A.J. Simpson, J. Magn. Reson. 217, 61–76 (2012)
46. S. Eriksson, S. Lasic, D. Topgaard, J. Magn. Reson. 226, 13–18 (2013)
47. P. Porcari, S. Capuani, E.D. Amore, M. Lecce, A. La Bella, F. Fasano, R. Campanella, L.M.
Migneco, F.S. Pastore, B. Maraviglia, Phys. Med. Biol. 53(23), 6979–6989 (2008)
48. P. Porcari, S. Capuani, R. Campanella, A. La Bella, L.M. Migneco, B. Maraviglia, Phys. Med. Biol.
51(12), 3141–3154 (2006)
49. W. Cui, P. Otten, Y. Li, K.S. Koeneman, J. Yu, R.P. Mason, Magn. Reson. Med. 51, 616–620 (2004)
50. M.G. Boersma, I.P. Solyanikova, W.J.H. Van Berkel, J. Vervoort, I.M.C.M. Rietjens, J. Ind.
Microbiol. Biotechnol. 26(1–2), 22–34 (2001)
51. M. Satake, B. Dmochowska, Y. Nishikawa, J. Madaj, J. Xue, Z. Guo, D.V. Reddy, P.L. Rinaldi, V.M.
Monnier, Invest. Ophthalmol. Vis. Sci. 44(5), 2047–2058 (2003)
52. J. Ruiz-Cabello, B.P. Barnett, P.A. Bottomley, J.W.M. Bulte, NMR Biomed. 24(2), 114–129 (2011)
53. M. Veronesi, F. Giacomina, E. Romeo, B. Castellani, G. Ottonello, C. Lambruschini, G. Garau, R.
Scarpelli, T. Bandiera, D. Piomelli, C. Dalvit, Anal. Biochem. 495, 52–59 (2016)
54. N. Aranibar, J.D. Vassallo, J. Rathmacher, S. Stryker, Y. Zhang, J. Dai, E.B. Janovitz, D. Robertson,
M. Reily, L. Lowe-Krentz, L. Lehman-McKeeman, Anal. Biochem. 410(1), 84–91 (2011)
55. C.E. Garner, S.C. Sumner, J.G. Davis, J.P. Burgess, Y. Yueh, J. Demeter, Q. Zhan, J. Valentine, A.R.
Jeffcoat, L.T. Burka, J.M. Mathews, Toxicol. Appl. Pharmacol. 215(1), 23–36 (2006)
56. S.H. Moolenaar, U.F. Engelke, N.G. Abeling, H. Mandel, M. Duran, R.A. Wevers, J. Inherit. Metab.
Dis. 24(8), 843–850 (2001)
57. M.K. Engskog, O. Karlsson, J. Haglof, A. Elmsjo, E. Brittebo, T. Arvidsson, C. Pettersson, Toxi-
cology 312, 6–11 (2013)
58. E.G. Stanley, N.J. Bailey, M.E. Bollard, J.N. Haselden, C.J. Waterfield, E. Holmes, J.K. Nicholson,
Anal. Biochem. 343(2), 195–202 (2005)
59. D. Misra, U. Bajpaic, Bull. Chem. Soc. Ethiop. 23(2), 211–221 (2009)
60. J.S. McKenzie, A.J. Charlton, J.A. Donarski, A.D. MacNicoll, J.C. Wilson, Metabolomics 6(4),
574–582 (2010)
61. H. Koskela, O. Heikkila, I. Kilpelainen, S. Heikkinen, J. Magn. Reson. 202(1), 24–33 (2010)
62. E. Appiah-Amponsah, K. Owusu-Sarfo, G.A. Gowda, T. Ye, D. Raftery, Metabolites 3, 575–591
(2013)
63. K. Hu, W.M. Westler, J.L. Markley, J. Am. Chem. Soc. 133(6), 1662–1665 (2011)
64. L. Zhao, H. Gao, F. Lian, X. Liu, Y. Zhao, D. Lin, Am. J. Physiol. Renal. Physiol. 300(4), F947–F956
(2011)
65. S. De Sanctis, W.M. Malloni, W. Kremer, A.M. Tome, E.W. Lang, K.P. Neidig, H.R. Kalbitzer, J.
Magn. Reson. 210(2), 177–183 (2011)
66. J.S. McKenzie, J.A. Donarski, J.C. Wilson, A.J. Charlton, Prog. Nucl. Magn. Reson. Spectrosc.
59(4), 336–539 (2011)
67. E. Martineau, I. Tea, S. Akoka, P. Giraudeau, NMR Biomed. 25(8), 985–992 (2012)
68. E. Martineau, P. Giraudeau, I. Tea, S. Akoka, J. Pharm. Biomed. Anal. 54(1), 252–257 (2011)
69. P. Sandusky, E. Appiah-Amponsah, D. Raftery, J. Biomol. NMR. 49(3–4), 281–290 (2011)
70. A.N. Lane, T.W.M. Fan, Metabolomics 3(2), 79–86 (2007)
71. J.C. Lindon, J.K. Nicholson, Annu. Rev. Anal. Chem. (Palo Alto Calif). 1, 45–69 (2008)
72. A. Beltran, M. Suarez, M.A. Rodrıguez, M. Vinaixa, S. Samino, L. Arola, X. Correig, O. Yanes,
Anal. Chem. 84(14), 5838–5844 (2012)
20 J. Kruk et al.
123

73. R.K. Adosraku, G.T. Choi, V. Constantinou-Kokotos, M.M. Anderson, W.A. Gibbons, J. Lipid Res.
35, 1925–1931 (1994)
74. H.J. Schneider, U. Buchheit, N. Becker, G. Schmidt, U. Siehl 107(24), 7027–7039 (1985)
75. J.U. Thomsen, B. Meyer, J. Magn. Reson. 84(1), 212–217 (1989)
76. M.S. Hodavance, S.L. Ralston, I. Pelczer 387(2), 533–537 (2007)
NMR Techniques in Metabolomic Studies: A Quick Overview… 21
123

![Systems Metabolomic Lecture[1]](https://static.fdocuments.us/doc/165x107/546af5e0b4af9f486b8b45b1/systems-metabolomic-lecture1.jpg)