NMB Audited Results for FY Ended 31 Dec 13
10
CHAIRMAN'S STA TEMENT INTRODUCTION The Group's capital raising initiatives resulted in the Group receiving a total of US$14 831 145 capital from three strategic foreign partners in June 2013. The net amount was used to recapitalise the banking subsidiary in order to contribute to the minimum capital requirements set by the Reserve Bank of Zimbabwe (RBZ). The increased capital will allow the Bank to underwrite more business, a prerequisite for the financial services sector to continue its key role of helping develop the economy. GROUP RESULTS Compliance with International Financial Reporting Standards The consolidated financial statements are prepared in accordance with International Financial Reporting Standards (IFRS). The financial statements are prepared in compliance with the provisions of the Companies Act (Chapter 24:03) and the Banking Act (Chapter 24:20). Assessme nt of the Economic Environment The Zimbabwean economy in the last two quarters of 2013 and replicated in the first quarter of 2014 has been characterised by slow economic growth primarily as a result of reduced operating margins and tight liquidity. The slow-down in the economic growth has led to increased default risk and the average banking sector non-performing loans have conse- quently risen to 15.92% as at 31 December 2013 as per the recent Monetary Policy Statement. Credit risk has become the critical area that banks and corporates have to deal with. Commentary on the Operating Results The loss before taxation was US$3 951 865 dur ing the period under r eview and this gave rise to an attributable loss of US$3 321 823. Total income for the period increased by 11% from a prior year of US$45 055 751 to US$50 135 302 which is split into interest income of US$33 181 704, fee and commission income of US$14 673 834, net foreign exchange gains of US$1 502 044 and non-interest income of US$777 720. Operating expenses amounted to US$25 232 756 and these were 18% up from prior year and comprise largely of administration expenses, depreciation and staff related expenditure. Impairment losses on loans and advances amounted to US$16 645 810 for the current period from a prior year of US$3 985 062. The Board of Directors took a decision to write off loans and advances amounting to US$12 230 408 during the year under review after recovery efforts had not yielded the an ticipated results. In February 2013, the Reserve Bank of Zimbabwe and participating members of the Bankers Association of Zimbabwe (BAZ) signed a Memorandum of Understanding (MoU) which provided limits on bank charges and interest rates. The measures took effect from 1 February 2013 and the MoU was not renewed in December 2013. Whilst we recognise the need to keep fees and interest rates as low as p ossible, this MoU has had a pronounced effect on the Bank's profitability for the period under review, as the risk has not been reduced in line with the controlled returns. Commentary on the Statement of financial position The Group's total assets grew by 15% from US$226 533 682 as at 31 December 2012 to US$259 483 112 as at 31 December 2013 . The assets comprised mainly of loans, advances and other accounts (US$181 316 271), investment securities held to maturity (US$4 685 471), investment in debentures (US$3 984 723), cash and short term funds (US $48 871 983), investment properties (US$4 385 300), no n-current assets held for sale (US$2 303 300) and property and equipment (US$7 372 943). Gross loans and advances increased by 25% from US$152 417 375 as at 31 December 2012 to US$189 990 724 a s at 31 December 2013. The Bank's liquidity ratio closed the period at 32.52% and this was above the statutory Capital The banking subsidiary's capital adequacy ratio at 31 December 2013 calculated in accordance with the guidelines of the RBZ was 17.28% (31 December 2012 – 15.50%). The minimum required by the RBZ is 12%. The Group's shareholders' funds have increased by 40% from US$30 942 083 as at 31 December 2012 to US$43 441 403 as at 31 December 2013 primarily as a result of the n ew capital injected into the Group. Dividend In view of the attributable loss position for the year, the nee d to retain cash in the business and to strengthen the statutory capital position for the banking subsidiary, the Board has proposed not to declare a dividend. CORPORATE SOCIAL INVESTMENTS The Group is committed to playing an active role in the communities it serves. Our community investments are channeled into education, the disadvantaged, vulnerable groups, protection of the environment, wild life conservation, the arts and various sporting disciplines. CORPORA TE DEVELOPMENTS In line with our strategic thrust to offer service excellence to our valued high net worth individuals and businesses, we successfully launched the Mobile Banking, Internet Banking, Tell er POS, Aptra Promote and EcoCash integration d uring the year under review. OUTLOOK AND STRAT EGY The Group has since dollarisation secured lines of credit amounting to US$57 million and these have allowed the Bank to underwrite more lending business for the benefit of our clients. Subsequent to year end, the Bank secured a US$10 million line of credit from a European Development Financial Institution (Proparco) and the Bank will continue to scout for more international lines of credit. The Group continues to pursue market opportunities which take advantage of strong liquidity, without exacerbating credit risk. DIRECTORATE Ms L Majonga, Mr B Ndachena, Mr F Zimuto and Mr J de la Fargue resigned as directors of NMBZ Holdings Limited and NMB Bank Limited with effect from 20 November 2013. Mr L Chinyamutangira and Mr F S Mangozho resigned from the NMB Bank Limited Board with effect from 20 November 2013. Mr B Ndachena, Mr F Zimuto, Mr L Chinyamutangira and Mr F S Mangozho remain employees of the Group. I would like to thank them all for their invaluable contribution to the respective Boards over the years. Subsequent to year end, Mr B Zwinkels, Ms M Svova, Mr B Chikwanha, Mr C Ndiaye and Mr D Malik were appointed to the Board with effect from 31 January 2014. I would like to welcome the new board members and wish them a fruitful tenure on the Board. APPRECIATION I would like to express my profound gratitude and appreciation to our valued clients, shareholders and the Regulatory Authorities for their unwavering support during the period under review. I would also like to thank my fellow Board members, management and staff for their steadfast commitment and dedication in the face of an increasingly difficult operating environment. T N MUNDAWARARA CHAIRMAN 31 Dec 31 Dec 2013 2012 Total income (US$) 50 135 302 45 055 751 Operating profit before impairments charge (US$) 12 693 945 13 987 286 Attributable (loss)/profit (US$) (3 321 823 ) 7 570 502 Basic (loss)/earnings per share (US cents) (1.00 ) 2.70 Total deposits (US$) 211 215 066 191 422 066 Total gross loans and advances (US$) 189 990 724 152 417 375 Total shareholders' funds (US$) 43 441 403 30 942 083 2 0 Enquiries NMBZ HOLDINGS LIMITED James A Mushore, Gr o up Ch ie f Ex e cu ti v e Off i ce r, NM BZ Ho ld i ngs Limit ed jam es m@nmb z. c o. zw Francis Zimuto, De puty Grou p Chief Exec utive Off icer, NMB Z Holdings Limi ted fran cis z@nmbz.co.zw Benefit P Washaya, Managing Director, NMB Bank Limited benefitw@nmbz.co.zw Benson Ndachena, Chief Financial Officer, NMBZ Holdings Limited bensonn@nmbz.co.zw Website: http://www.nmbz.co.zw Email: enquiries@nmbz.co.zw Tel: (+263-4) 759 651-9 CONDENSED AUDITED RESULTS FOR THE YEAR ENDED 31 DECEMBER 2013 HIGHLIGHTS Dually listed on the London Stock Exchange (LSE) and Zimbabwe Stock Exchange (ZSE) 1
-
Upload
business-daily-zimbabwe -
Category
Documents
-
view
225 -
download
0
Transcript of NMB Audited Results for FY Ended 31 Dec 13

8/12/2019 NMB Audited Results for FY Ended 31 Dec 13
http://slidepdf.com/reader/full/nmb-audited-results-for-fy-ended-31-dec-13 1/9
CHAIRMAN'S STATEMENT
INTRODUCTION
The Group's capital raising initiatives resulted in the Group receiving a total of US$14 831 145capital from three strategic foreign partners in June 2013. The net amount was used torecapitalise the banking subsidiary in order to contribute to the minimum capital requirementsset by the Reserve Bank of Zimbabwe (RBZ). The increased capital will allow the Bank tounderwrite more business, a prerequisite for the financial services sector to continue its keyrole of helping develop the economy.
GROUP RESULTS
Compliance with International Financial Reporting Standards
The consolidated financial statements are prepared in accordance with InternationalFinancial Reporting Standards (IFRS). The financial statements are prepared in compliancewith the provisions of the Companies Act (Chapter 24:03) and the Banking Act(Chapter 24:20).
Assessment of the Economic Environment
The Zimbabwean economy in the last two quarters of 2013 and replicated in the first quarter of2014 has been characterised by slow economic growth primarily as a result of reduced
operating margins and tight liquidity. The slow-down in the economic growth has led toincreased default risk and the average banking sector non-performing loans have conse-quently risen to 15.92% as at 31 December 2013 as per the recent Monetary PolicyStatement. Credit risk has become the critical area that banks and corporates have to dealwith.
Commentary on the Operating Results
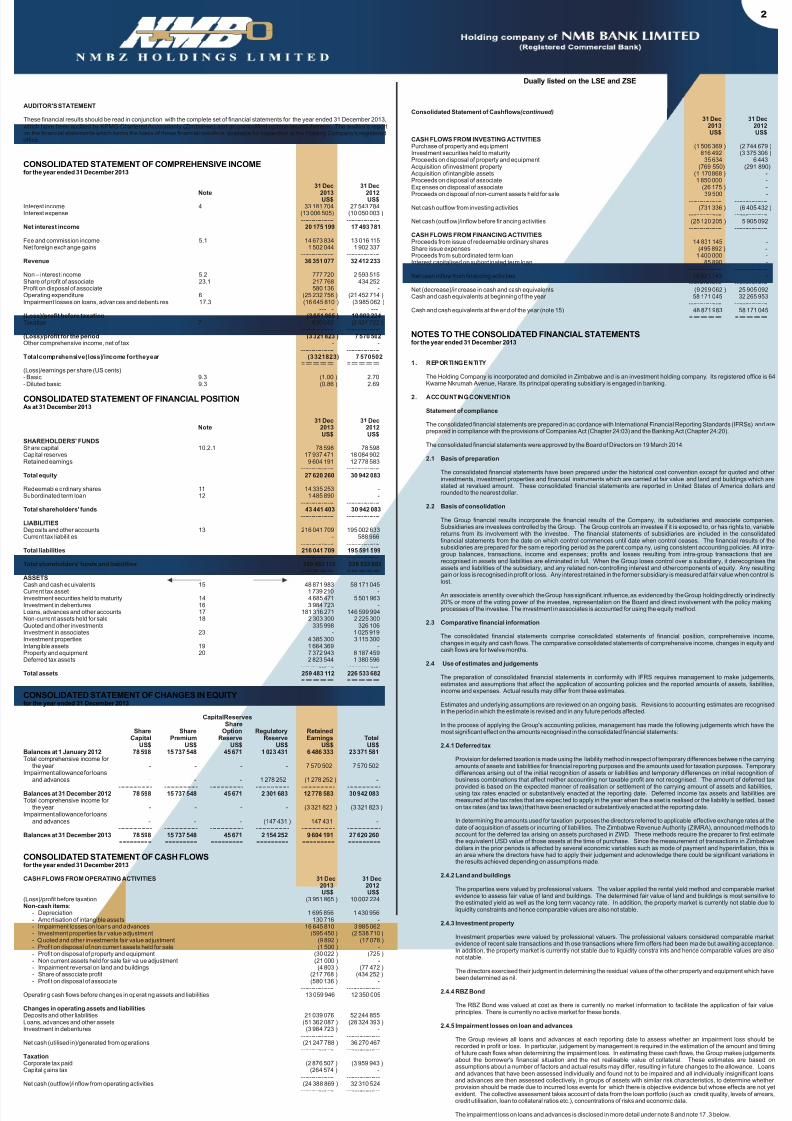
The loss before taxation was US$3 951 865 dur ing the period under review and this gave riseto an attributable loss of US$3 321 823. Total income for the period increased by 11% froma prior year of US$45 055 751 to US$50 135 302 which is split into interest income ofUS$33 181 704, fee and commission income of US$14 673 834, net foreign exchange gainsof US$1 502 044 and non-interest income of US$777 720.
Operating expenses amounted to US$25 232 756 and these were 18% up from prior year andcomprise largely of administration expenses, depreciation and staff related expenditure.
Impairment losses on loans and advances amounted to US$16 645 810 for the current periodfrom a prior year of US$3 985 062. The Board of Directors took a decision to write off loansand advances amounting to US$12 230 408 during the year under review after recoveryefforts had not yielded the anticipated results.
In February 2013, the Reserve Bank of Zimbabwe and participating members of the Bankers Association of Zimbabwe (BAZ) signed a Memorandum of Understanding (MoU) whichprovided limits on bank charges and interest rates. The measures took effect from1 February 2013 and the MoU was not renewed in December 2013. Whilst we recognise theneed to keep fees and interest rates as low as possible, this MoU has had a pronounced effecton the Bank's profitability for the period under review, as the risk has not been reduced in linewith the controlled returns.
Commentary on the Statement of financial position
The Group's total assets grew by 15% from US$226 533 682 as at 31 December 2012 toUS$259 483 112 as at 31 December 2013. The assets comprised mainly of loans, advancesand other accounts (US$181 316 271), investment securities held to maturity (US$4 685471), investment in debentures (US$3 984 723), cash and short term funds (US$48 871983), investment properties (US$4 385 300), non-current assets held for sale (US$2 303 300)and property and equipment (US$7 372 943). Gross loans and advances increased by 25%from US$152 417 375 as at 31 December 2012 to US$189 990 724 as at 31 December 2013.The Bank's liquidity ratio closed the period at 32.52% and this was above the statutoryrequirement of 30%.
Capital
The banking subsidiary's capital adequacy ratio at 31 December 2013 calculated inaccordance with the guidelines of the RBZ was 17.28% (31 December 2012 – 15.50%).The minimum required by the RBZ is 12%.
The Group's shareholders' funds have increased by 40% from US$30 942 083 as at31 December 2012 to US$43 441 403 as at 31 December 2013 primarily as a result of the newcapital injected into the Group.
Dividend
In view of the attributable loss position for the year, the need to retain cash in the business andto strengthen the statutory capital position for the banking subsidiary, the Board has proposednot to declare a dividend.
CORPORATE SOCIAL INVESTMENTS
The Group is committed to playing an active role in the communities it serves. Our communityinvestments are channeled into education, the disadvantaged, vulnerable groups, protectionof the environment, wild life conservation, the arts and various sporting disciplines.
CORPORATE DEVELOPMENTS
In line with our strategic thrust to offer service excellence to our valued high net worthindividuals and businesses, we successfully launched the Mobile Banking, Internet Banking,Teller POS, Aptra Promote and EcoCash integration during the year under review.
OUTLOOK AND STRATEGY
The Group has since dollarisation secured lines of credit amounting to US$57 million andthese have allowed the Bank to underwrite more lending business for the benefit of ourclients. Subsequent to year end, the Bank secured a US$10 million line of credit from aEuropean Development Financial Institution (Proparco) and the Bank will continue to scoutfor more international lines of credit. The Group continues to pursue market opportunitieswhich take advantage of strong liquidity, without exacerbating credit risk.
DIRECTORATE
Ms L Majonga, Mr B Ndachena, Mr F Zimuto and Mr J de la Fargue resigned as directors ofNMBZ Holdings Limited and NMB Bank Limited with effect from 20 November 2013.Mr L Chinyamutangira and Mr F S Mangozho resigned from the NMB Bank Limited Board with
effect from 20 November 2013. Mr B Ndachena, Mr F Zimuto, Mr L Chinyamutangira andMr F S Mangozho remain employees of the Group. I would like to thank them all for theirinvaluable contribution to the respective Boards over the years.
Subsequent to year end, Mr B Zwinkels, Ms M Svova, Mr B Chikwanha, Mr C Ndiaye andMr D Malik were appointed to the Board with effect from 31 January 2014. I would like towelcome the new board members and wish them a fruitful tenure on the Board.
APPRECIATION
I would like to express my profound gratitude and appreciation to our valued clients,shareholders and the Regulatory Authorities for their unwavering support during the periodunder review. I would also like to thank my fellow Board members, management and staff fortheir steadfast commitment and dedication in the face of an increasingly difficult operatingenvironment.
T N MUNDAWARARACHAIRMAN
19 March 2014
31 Dec 31 Dec2013 2012
Total income (US$) 50 135 302 45 055 751
Operating profit before impairments charge (US$) 12 693 945 13 987 286
Attributable (loss)/profit (US$) (3 321 823 ) 7 570 502
Basic (loss)/earnings per share (US cents) (1.00 ) 2.70
Total deposits (US$) 211 215 066 191 422 066
Total gross loans and advances (US$) 189 990 724 152 417 375
Total shareholders' funds (US$) 43 441 403 30 942 083
N
M B 1 4 - 2 2 0
Enquiries
NMBZ HOLDINGS LIMITEDJames A Mushore, Group Chief Executive Officer, NMBZ Holdings Limited [email protected] Zimuto, Deputy Group Chief Executive Officer, NMBZ Holdings Limited [email protected] P Washaya, Managing Director, NMB Bank Limited [email protected] Ndachena, Chief Financial Officer, NMBZ Holdings Limited [email protected]: http://www.nmbz.co.zwEmail: [email protected]: (+263-4) 759 651-9
CONDENSED AUDITED RESULTS
FOR THE YEAR ENDED
31 DECEMBER 2013
HIGHLIGHTS
Dually listed on the London Stock Exchange (LSE) and Zimbabwe Stock Exchange (ZSE)
1
8/12/2019 NMB Audited Results for FY Ended 31 Dec 13
http://slidepdf.com/reader/full/nmb-audited-results-for-fy-ended-31-dec-13 2/9
AUDITOR'S STATEMENT
These financial results should be read in conjunction with the complete set of financial statements for the year ended 31 December 2013,which have been audited by KPMG Chartered Accountants (Zimbabwe) and an unmodified opinion issued thereon. The auditor's reporton the financial statements which forms the basis of these financial results is available for inspection at the Holding Company's registeredoffice.
31 Dec 31 DecNote 2013 2012
US$ US$Interest income 4 33 181 704 27 543 784Interest expense (13 006 505) (10 050 003 )
---------------- ----------------Net interest income 20 175 199 17 493 781
Fee and commission income 5.1 14 673 834 13 016 115Net foreign exchange gains 1 502 044 1 902 337
---------------- ----------------Revenue 36 351 077 32 412 233
Non – interest income 5.2 777 720 2 593 515Share of profit of associate 23.1 217 768 434 252Profit on disposal of associate 580 136 -Operating expenditure 6 (25 232 756 ) (21 452 714 )Impairment losses on loans, advances and debentures 17.3 (16 645 810 ) (3 985 062 )
---------------- ----------------(Loss)/profit before taxation (3 951 865 ) 10 002 224Taxation 7 630 042 (2 431 722 )
---------------- ----------------(Loss)/profit for the period (3 321 823 ) 7 570 502Other comprehensive income, net of tax - -
---------------- ----------------Total comprehensive (loss)/income for the year (3 321 823) 7 570 502
========= =========(Loss)/earnings per share (US cents)- Basic 9.3 (1.00 ) 2.70- Diluted basic 9.3 (0.86 ) 2.69
31 Dec 31 DecNote 2013 2012
US$ US$SHAREHOLDERS' FUNDSShare capital 10.2.1 78 598 78 598Capital reserves 17 937 471 18 084 902Retained earnings 9 604 191 12 778 583
---------------- ----------------Total equity 27 620 260 30 942 083
Redeemable ordinary shares 11 14 335 253 -Subordinated term loan 12 1 485 890 -
---------------- ----------------Total shareholders' funds 43 441 403 30 942 083
---------------- ----------------LIABILITIESDeposits and other accounts 13 216 041 709 195 002 633Current tax liabilities - 588 966
---------------- ----------------Total liabilities 216 041 709 195 591 599
---------------- ----------------Total shareholders’ funds and liabilities 259 483 112 226 533 682
========= =========ASSETSCash and cash equivalents 15 48 871 983 58 171 045Current tax asset 1 739 210 -Investment securities held to maturity 14 4 685 471 5 501 963Investment in debentures 16 3 984 723 -Loans, advances and other accounts 17 181 316 271 146 599 994Non-current assets held for sale 18 2 303 300 2 225 300Quoted and other investments 335 998 326 106Investment in associates 23 - 1 025 919Investment properties 4 385 300 3 115 300Intangible assets 19 1 664 369 -Property and equipment 20 7 372 943 8 187 459Deferred tax assets 2 823 544 1 380 596
---------------- ----------------Total assets 259 483 112 226 533 682
========= =========
Capital ReservesShare
Share Share Option Regulatory RetainedCapital Premium Reserve Reserve Earnings Total
US$ US$ US$ US$ US$ US$Balances at 1 January 2012 78 598 15 737 548 45 671 1 023 431 6 486 333 23 371 581Total comprehensive income for
the year - - - - 7 570 502 7 570 502Impairment allowance for loans
and advances - - - 1 278 252 (1 278 252 ) -- -- -- -- -- -- -- -- - - -- -- -- -- -- -- -- - - -- -- -- -- -- -- -- - - -- -- -- -- -- -- -- - - -- -- -- -- -- -- -- - - -- -- -- -- -- -- -- -
Balances at 31 December 2012 78 598 15 737 548 45 671 2 301 683 12 778 583 30 942 083Total comprehensive income for
the year - - - - (3 321 823 ) (3 321 823 )Impairment allowance for loans
and advances - - - (147 431 ) 147 431 -- -- -- -- -- -- -- -- - - -- -- -- -- -- -- -- - - -- -- -- -- -- -- -- - - -- -- -- -- -- -- -- - - -- -- -- -- -- -- -- - - -- -- -- -- -- -- -- -
Balances at 31 December 2013 78 598 15 737 548 45 671 2 154 252 9 604 191 27 620 260========= ========= ========= ========= ========= =========
CASH FLOWS FROM OPERATING ACTIVITIES 31 Dec 31 Dec2013 2012US$ US$
(Loss)/profit before taxation (3 951 865 ) 10 002 224Non-cash items:
- Depreciation 1 695 856 1 430 956- Amortisation of intangible assets 130 716 -- Impairment losses on loans and advances 16 645 810 3 985 062- Investment properties fair value adjustment (595 450 ) (2 538 710 )- Quoted and other investments fair value adjustment (9 892 ) (17 078 )- Profit on disposal of non current assets held for sale (1 500 ) -
- Profit on disposal of property and equipment (30 022 ) (725 )- Non current assets held for sale fair value adjustment (21 000 ) -- Impairment reversal on land and buildings (4 803 ) (77 472 )- Share of associate profit (217 768 ) (434 252 )- Profit on disposal of associate (580 136 ) -
---------------- ----------------Operating cash flows before changes in operating assets and liabilities 13 059 946 12 350 005
Changes in operating assets and liabilitiesDeposits and other liabilities 21 039 076 52 244 855Loans, advances and other assets (51 362 087 ) (28 324 393 )Investment in debentures (3 984 723 ) -
---------------- ----------------Net cash (utilised in)/generated from operations (21 247 788 ) 36 270 467
---------------- ----------------TaxationCorporate tax paid (2 876 507 ) (3 959 943 )Capital gains tax (264 574 ) -
---------------- ----------------Net cash (outflow)/inflow from operating activities (24 388 869 ) 32 310 524
---------------- ----------------
CONSOLIDATED STATEMENT OF COMPREHENSIVE INCOMEfor the year ended 31 December 2013
CONSOLIDATED STATEMENT OF FINANCIAL POSITIONAs at 31 December 2013
CONSOLIDATED STATEMENT OF CHANGES IN EQUITYfor the year ended 31 December 2013
CONSOLIDATED STATEMENT OF CASH FLOWSfor the year ended 31 December 2013
Consolidated Statement of Cashflows (continued)31 Dec 31 Dec
2013 2012US$ US$
CASH FLOWS FROM INVESTING ACTIVITIESPurchase of property and equipment (1 506 369 ) (2 744 679 )Investment securities held to maturity 816 492 (3 375 306 )Proceeds on disposal of property and equipment 35 634 6 443 Acquisition of investment property (769 550) (291 890) Acquisition of intangible assets (1 170 868 ) -Proceeds on disposal of associate 1 850 000 -Expenses on disposal of associate (26 175 ) -Proceeds on disposal of non-current assets held for sale 39 500 -
---------------- ----------------Net cash outflow from investing activities (731 336 ) (6 405 432 )
---------------- ----------------Net cash (outflow)/inflow before financing activities (25 120 205 ) 5 905 092
---------------- ----------------CASH FLOWS FROM FINANCING ACTIVITIESProceeds from issue of redeemable ordinary shares 14 831 145 -Share issue expenses (495 892 ) -Proceeds from subordinated term loan 1 400 000 -Interest capitalised on subordinated term loan 85 890 -
---------------- ----------------Net cash inflow from financing activities 15 821 143 -
---------------- ----------------Net (decrease)/increase in cash and cash equivalents (9 299 062 ) 25 905 092Cash and cash equivalents at beginning of the year 58 171 045 32 265 953
---------------- ----------------Cash and cash equivalents at the end of the year (note 15) 48 871 983 58 171 045
========= =========
1. REPORTING ENTITY
The Holding Company is incorporated and domiciled in Zimbabwe and is an investment holding company. Its registered office is 64Kwame Nkrumah Avenue, Harare. Its principal operating subsidiary is engaged in banking.
2. ACCOUNTING CONVENTION
Statement of compliance
The consolidated financial statements are prepared in ac cordance with International Financial Reporting Standards (IFRSs) and areprepared in compliance with the provisions of Companies Act (Chapter 24:03) and the Banking Act (Chapter 24:20).
The consolidated financial statements were approved by the Board of Directors on 19 March 2014.
2.1 Basis of preparation
The consolidated financial statements have been prepared under the historical cost convention except for quoted and otherinvestments, investment properties and financial instruments which are carried at fair value and land and buildings which arestated at revalued amount. These consolidated financial statements are reported in United States of America dollars androunded to the nearest dollar.
2.2 Basis of consolidation
The Group financial results incorporate the financial results of the Company, its subsidiaries and associate companies.Subsidiaries are investees controlled by the Group. The Group controls an investee if it is exposed to, or has rights to, variablereturns from its involvement with the investee. The financial statements of subsidiaries are included in the consolidatedfinancial statements from the date on which control commences until date when control ceases. The financial results of thesubsidiaries are prepared for the sam e reporting period as the parent compa ny, using consistent accounting policies. All intra-group balances, transactions, income and expenses; profits and losses resulting from intra-group transactions that arerecognised in assets and liabilities are eliminated in full. When the Group loses control over a subsidiary, it derecognises theassets and liabilities of the subsidiary, and any related non-controlling interest and other components of equity. Any resultinggain or loss is recognised in profit or loss. Any interest retained in the former subsidiary is measured at fair value when control islost.
An associate is an entity over which the Group has significant influence, as evidenced by the Group holding directly or indirectly20% or more of the voting power of the investee, representation on the Board and direct involvement with the policy makingprocesses of the investee. The investment in associates is accounted for using the equity method.
2.3 Comparative financial information
The consolidated financial statements comprise consolidated statements of financial position, comprehensive income,changes in equity and cash flows. The comparative consolidated statements of comprehensive income, changes in equity andcash flows are for twelve months.
2.4 Use of estimates and judgements
The preparation of consolidated financial statements in conformity with IFRS requires management to make judgements,estimates and assumptions that affect the application of accounting policies and the reported amounts of assets, liabilities,income and expenses. Actual results may differ from these estimates.
Estimates and underlying assumptions are reviewed on an ongoing basis. Revisions to accounting estimates are recognisedin the period in which the estimate is revised and in any future periods affected.
In the process of applying the Group's accounting policies, management has made the following judgements which have themost significant effect on the amounts recognised in the consolidated financial statements:
2.4.1 Deferred tax
Provision for deferred taxation is made using the liability method in respect of temporary differences betwee n the carryingamounts of assets and liabilities for financial reporting purposes and the amounts used for taxation purposes. Temporarydifferences arising out of the initial recognition of assets or liabilities and temporary differences on initial recognition ofbusiness combinations that affect neither accounting nor taxable profit are not recognised. The amount of deferred taxprovided is based on the expected manner of realisation or settlement of the carrying amount of assets and liabilities,using tax rates enacted or substantively enacted at the reporting date. Deferred income tax assets and liabilities aremeasured at the tax rates that are expec ted to apply in the year when the a sset is realised or the liability is settled, basedon tax rates (and tax laws) that have been enacted or substantively enacted at the reporting date.
In determining the amounts used for taxation purposes the directors referred to applicable effective exchange rates at thedate of acquisition of assets or incurring of liabilities. The Zimbabwe Revenue Authority (ZIMRA), announced methods toaccount for the deferred tax arising on assets purchased in ZWD. These methods require the preparer to first estimatethe equivalent USD value of those assets at the time of purchase. Since the measurement of transactions in Zimbabwedollars in the prior periods is affected by several economic variables such as mode of payment and hyperinflation, this isan area where the directors have had to apply their judgement and acknowledge there could be significant variations inthe results achieved depending on assumptions made.
2.4.2 Land and buildings
The properties were valued by professional valuers. The valuer applied the rental yield method and comparable marketevidence to assess fair value of land and buildings. The determined fair value of land and buildings is most sensitive tothe estimated yield as well as the long term vacancy rate. In addition, the property market is currently not stable due toliquidity constraints and hence comparable values are also not stable.
2.4.3 Investment property
Investment properties were valued by professional valuers. The professional valuers considered comparable marketevidence of recent sale transactions and th ose transactions where firm offers had been ma de but awaiting acceptance.
In addition, the property market is currently not stable due to liquidity constra ints and hence comparable values are alsonot stable.
The directors exercised their judgment in determining the residual values of the other property and equipment which havebeen determined as nil.
2.4.4 RBZ Bond
The RBZ Bond was valued at cost as there is currently no market information to facilitate the application of fair valueprinciples. There is currently no active market for these bonds.
2.4.5 Impairment losses on loan and advances
The Group reviews all loans and advances at each reporting date to assess whether an impairment loss should berecorded in profit or loss. In particular, judgement by management is required in the estimation of the amount and timingof future cash flows when determining the impairment loss. In estimating these cash flows, the Group makes judgementsabout the borrower's financial situation and the net realisable value of collateral. These estimates are based onassumptions about a number of factors and actual results may differ, resulting in future changes to the allowance. Loansand advances that have been assessed individually and found not to be impaired and all individually insignificant loansand advances are then assessed collectively, in groups of assets with similar risk characteristics, to determine whetherprovision should be made due to incurred loss events for which there is objective evidence but whose effects are not yetevident. The collective assessment takes account of data from the loan portfolio (such as credit quality, levels of arrears,credit utilisation, loan to collateral ratios etc.), concentrations of risks and economic data.
The impairment loss on loans and advances is disclosed in more detail under note 8 and note 17 .3 below.
2.4.6 Going concern
The Directors have assessed the ability of the Group to continue operating as a going concern and believe that thepreparation of these consolidated financial statements on a going concern basis is still appropriat e.
NOTES TO THE CONSOLIDATED FINANCIAL STATEMENTSfor the year ended 31 December 2013
Dually listed on the LSE and ZSE
2

8/12/2019 NMB Audited Results for FY Ended 31 Dec 13
http://slidepdf.com/reader/full/nmb-audited-results-for-fy-ended-31-dec-13 3/9
3. ACCOUNTING POLICIES
The selected principal accounting policies applied in the preparation of these condensed financial statements are set out in Note 2and 3. These policies have been consistently applied unless otherwise stated.
3.1 Financial instruments
3.1.1 Classification
Financial assets and liabilities at fair value through profit and loss include fin ancial assets and liabilities held for trading i.e.those that the Group principally holds for the purpose of short-term profit taking as well as those that were, upon initialrecognition, designated by the entity as financial assets or liabilities at fair value through profit and loss.
Loans and receivables are non-derivative financial assets with fixed or determinable payments that are not quote d in anactive market other than those classified as held-for-trading and the Group upon initial recognition designates as at fairvalue through profit or loss and those the Group upon initial recognition designates as available-for-sale.
Held-to-maturity investments are non-derivative financial assets with fixed or determinable payments and fixed maturitythat the Group has the positive intention and ability to hold to maturity.
Financial assets available-for-sale are non-derivative financial assets that are designated as available-for- sale or are notclassified as loans and receivables, held-to-maturity investments or financial assets at fair value through profit or lo ss.
3.1.2 Recognition
The Group recognises financial assets at fair value through profit and loss and available for sale assets on the date itcommits to purchase the assets. From this date any gains and losses arising from changes in fair value of the assets arerecognised in the income statement and other comprehensive income respectively.
Held-to-maturity investments and loans and receivables are recognised at cost which is the fair value of the considerationgiven on the day that they are transferred to the Group.
3.1.3 Measurement
Financial assets and liabilities are measured initially at fair value. Subsequent to initial recognition, financial assets and
liabilities measured at fair value through profit and loss and available-for-s ale financial assets are measured at fair value,except that any instrument that does not have a quoted market pr ice in an active market and whose fair value cannot bereliably measured is stated at cost, less impairment losses.
Held-to-maturity investments and loans and receivables are measured at amortised cost less impairment losses. Amortised cost is calculated using the effective interest rate method. Premiums and discounts, including initialtransaction costs, are included in the carrying amount of the related instrument and amortised based on the effectiveinterest rate of the instrument.
3.1.4 Fair value measurement principles
The fair value of financial instruments is based on their quoted market price at the reporting date with out any deduction fortransaction costs. If a quoted market price is not available, the fair value of the instrument is estimated using pricingmodels or discounted cash flow techniques.
Where discounted cash flow techniques are used, estimated future cash flows are based on management's bestestimates and the discount rate is a market related rate at the reporting date for an instrument with similar terms andconditions. Where pricing models are used, inputs are based on market related measures at the rep orting date.
3.2 Investment properties
Investment properties are stated at fair value. Gains and losses arising from a change in fair value of investment properties arerecognized in the income statement. The fair value is determined at the end of each reporting period, by a registeredprofessional valuer.
3.3 Share - based payments
The Group issues share options to certain employees in terms of the Employee Share Option Scheme. Share options aremeasured at fair value at the date of grant. The fair value determined at the date of grant of the options is expensed on astraight-line basis over the vesting period, based on the Group's estimate of shares that will eventually vest. Fair value ismeasured using the Black-Scholes option pricing model. The expected life used in the model has been adjusted, based onmanagement's best estimate, for the effects of non-transferability, exercise restrictions and other behavioural considerations.
3.4 Property and equipment
International Accounting Standard 16 (IAS 16) stipulates that the residu al value and the useful life of an asset must b e reviewedat least each financial year-end. If the residual value of an asset increases by an amount equal to or greater than the asset'scarrying amount, then the depreciation of the asset ceases. Depreciation will re sume only when the residual value decreasesto an amount below the asset's carrying amount.
3.5 Intangible assets
Intangible assets are initially recognised at cost. Subsequently, the assets are measured at cost less accumulatedarmotisation and any accumulated impairment loss.
4. INTEREST INCOME 31 Dec 31 Dec2013 2012US$ US$
Loans and advances to banks 2 252 247 1 448 696Loans and advances to customers 30 615 147 25 554 697Investment securities 251 949 246 905Other 62 361 293 486
---------------- ----------------33 181 704 27 543 784
========= =========
5. FEE AND COMMISSION INCOME AND NON-INTEREST INCOME
5.1 FEE AND COMMISSION INCOME 31 Dec 31 Dec2013 2012US$ US$
Retail Banking customer fees 12 342 153 11 136 084Corporate Banking credit related fees 358 712 256 444Financial guarantee income 208 203 194 302International Banking commissions 1 756 199 1 429 285Other 8 567 -
---------------- ----------------14 673 834 13 016 115
========= =========
5.2 NON-INTEREST INCOME 31 Dec 31 Dec2013 2012US$ US$
Quoted and other investments fair value adjustments 9 892 17 078Fair value adjustment on non- current assets held for sale 21 000 -Fair value adjustment on investment properties 595 450 2 538 710Profit on disposal of non-current assets held for sale 1 500 -Profit on disposal of property and equipment 30 022 725Other net operating income 119 856 37 002
---------------- ----------------777 720 2 593 515
========= =========
6. OPERATING EXPENDITURE 31 Dec 31 Dec2013 2012US$ US$
The operating profit is after charging the following: Administration costs 11 496 337 9 540 865 Audit fees:
- Current year 77 337 51 885- Prior year 128 938 199 356
Staff costs – salaries, allowances and related costs 11 708 375 10 307 124 Amortisation of intangible assets 130 716 -Depreciation 1 695 856 1 430 956Impairment reversal on land and buildings (4 803 ) (77 472 )
---------------- ----------------25 232 75 6 21 452 714
========= =========
7. TAXATIONIncome tax expense 31 Dec 31 Dec
2013 2012US$ US$
Current tax 533 722 3 292 170 AIDS levy 14 609 98 765Deferred tax (1 442 947 ) (959 213 )Capital gains tax 264 574 -
---------------- ----------------(630 042 ) 2 431 722
========= =========
NOTES TO THE CONSOLIDATED FINANCIAL STATEMENTS
for the year ended 31 December 2013
NOTES TO THE CONSOLIDATED FINANCIAL STATEMENTS
for the year ended 31 December 2013
8. IMPAIRMENT LOSSES ON LOANS AND ADVANCES
Impairment losses are applied to write off loans and advances in part or in whole when they are considered partly or whollyirrecoverable. The aggregate impairment losses which are made during the year are dealt with as per paragraph 8.3 .
8.1 Specific provisions
Specific provisions are made where the repayment of identified loans and advances is in do ubt and reflect estimates of the loss.Loans and advances are written off against specific provisions once the probability of recovering any significant amountsbecomes remote.
8.2 Portfolio provisions
The portfolio provision relates to the inherent risk of losses which, although not separately identified, is known to be present inany loan portfolio.
8.3 Regulatory Guidelines and International Financial Reporting Standards Requirements
The Banking Regulations 2000 gives guidance on provisioning for doubtful deb ts and stipulates certain minimum percentagesto be applied to the respective categories of the loan book.
International Accounting Standard 39, Financial Instruments Recognition and Measurement (IAS 39), prescribes theprovisioning for impairment losses based on the a ctual loan losses incurred in the past applied to the sectoral analysis of bookdebts and the discounting of expected cash flows on specific problem accounts.
The two prescriptions are likely to give different results. The Group has taken the view that where the IAS 39 charge is less thanthe amount provided for in the Banking Regulations, the difference is recognized directly in equity as a transfer from retainedearnings to a regulatory reserve and where it is more, the full amount will be charged to the profit or loss.
8.4 Non-performing loans
Interest on loans and advances is accrued to income until such time as reasonable doubt exists about its collectability,thereafter and until all or part of the loan is written off, interest continues to accrue on customers' accounts, but is not included inincome. Such suspended interest is deducted from loans and advances in the statement of financial position. This policymeets the requirements of the Banking Regulations 2000 issued by the RBZ.
9. EARNINGS PER SHARE
Basic earnings per share is calculated by dividing the profit for the year attributable to ordinary equity holders of NMBZ HoldingsLimited by the weighted average number of ordinary shares outstanding during the year.
Diluted earnings per share is calculated by dividing the profit attributable to ordinary equity holders of NMBZ Holdings Limitedadjusted for the after tax effect of: (a) any dividends or other items related to dilutive potential ordinary shares deducted in arriving atprofit or loss attributable to ordinary equity holders of the parent entity; (b) any interest recognised in the period related to dilutepotential ordinary shares; (c) any other changes in income or expense that would result from the conversion of th e dilutive potentialordinary shares, by the weighted average number of ordinary shares outstanding during the year plus the weighted average numberof ordinary shares that would be issued on the conversion of all the dilutive potential ordinary shares into ordin ary shares.
9.1 (Losses)/earnings 31 Dec 31 Dec2013 2012
Attributable (losses)/earnings (3 321 823 ) 7 570 502
9.2 Number of shares 31 Dec 31 Dec2013 2012
9.2.1 Basic earnings per shareWeighted average number of ordinary shares for basic earn ings per share 332 569 065 280 710 729
9.2.2 Diluted earnings per shareNumber of shares at beginning of period 280 710 729 280 710 729Shares issued 103 716 672 -Redeemable ordinary shares (note 10.2.2) 103 714 287 -Shares issued on consolidation 2 385 -
Effect of dilution:Share options granted but not issued 907 200 907 200Share options approved but not granted 167 087 167 087
---------------- ----------------385 501 688 281 785 016========= =========
9.3 (Loss)/earnings per share (US cents) 31 Dec 31 Dec2013 2012
Basic (loss)/earnings per share (1.00 ) 2.70Diluted (loss)/earnings per share (0.86 ) 2.69
10. SHARE CAPITAL
10.1 Authorised 31 Dec 31 Dec 31 Dec 31 Dec2013 2012 2013 2012
Shares Shares US$ US$million million
Ordinary shares of US$0.00028 each 600 350 168 000 98 000========= ========= ========= =========
At an Extraordinary General Meeting held on 19 February 2013, the Company approved a share consolidation exercise at aratio of 10 : 1 and consolidated 3 500 000 000 (3.5 billion) shares with a nominal value of US$0.000028 per share to 350 000000 (350 million) shares with a nominal value of US$0.00028 per share. The Company also approved an increase in theauthorised share capital from 350 million shares with a nominal value of $0.00028 per share to 600 million shares with anominal value of $0.00028 per share.
10.2 Issued and fully paid
10.2.1 Ordinary shares 31 Dec 31 Dec 31 Dec 31 Dec2013 2012 2013 2012
Shares Shares US$ US$million million
Ordinary shares 281 281 78 598 78 598========= ========= ========= =========
10.2.2 Redeemable ordinary shares 31 Dec 31 Dec 31 Dec 31 Dec2013 2012 2013 2012
Shares Shares US$ US$million million
At 1 January - - - -Shares issued (note 11) 104 - 29 040 -
- -- -- -- -- -- -- -- - - -- -- -- -- -- -- -- - - -- -- -- -- -- -- -- - - -- -- -- -- -- -- -- -104 - 29 040 -
========= ========= ========= =========
Of the unissued ordinary shares of 215 million shares (2012– 69 million), options which may be granted in terms of theNMBZ 2005 Employee Share Option Scheme (ESOS) amounted to nil (2012 – 8 536 096) and out of these nil(2012 – 167 087) had not been issued. As at 31 December 2013, 907 200 (2012 – 907 200) share options out of theissued had not been exercised.
Share options which may be granted in terms of the 2 012 ESOS amount to 28 071 073 and as at 31 De cember 2013 noshare options had been allocated from the Scheme.
Subject to the provisions of section 183 of the Companies Act (Chapter 24:03), the unissued shares are under the controlof the directors.
11. REDEEMABLE ORDINARY SHARES 31 Dec 31 Dec2013 2012US$ US$
Redeemable ordinary share capital (note 10.2.2) 29 040 -Share premium 14 306 213 -
---------------- ----------------14 335 253 -
========= =========
The Company received US$14 831 145 capital from Nederlandse Financierings-Maatschappij Voor Ontiwikkelingslanden N.V.(FMO), Norwegian Investment Fund for Developing Countries (Norfund) and AfricInvest Financial Sector Holdings (AfricInvest) whowere allocated 34 571 429 shares each (total of 103 714 287) for individually investing US$4 94 3 715. This amount, net of share issueexpenses, was used to recapitalise the Bank in order to contribute towards the minimum capital requirements set by the ReserveBank of Zimbabwe of US$100 million by 31 December 2020.
NMBZ Holdings Limited (NMBZ) entered into a share buy-back agreement with Norfund, FMO and AfricInvest, where these threestrategic investors have a right on their own discretion at any time after the 5th anniversary but before the 9th anniversary of its firstsubscription date, to request NMBZ to buy back all or part of its NMBZ shares at a price to be determined using the agreed terms asentailed in the share buy-back agreement. It is a condition precedent that at any point when the share buy-back is being considered,the proceeds used to finance the buy-back should come from the distributable reserves which are over and above the minimumregulatory capital requirements. Further, no buy-back option can be exercised by any investor after the 9th anniversary of theeffective date.
The share buy-back agreement creates a potential obligation for NMBZ Holdings Limited to purchase its own instruments.Thus the shares issued gave rise to a financial liability and are classified as redeemable ordinary shares .
Dually listed on the LSE and ZSE
3
8/12/2019 NMB Audited Results for FY Ended 31 Dec 13
http://slidepdf.com/reader/full/nmb-audited-results-for-fy-ended-31-dec-13 4/9
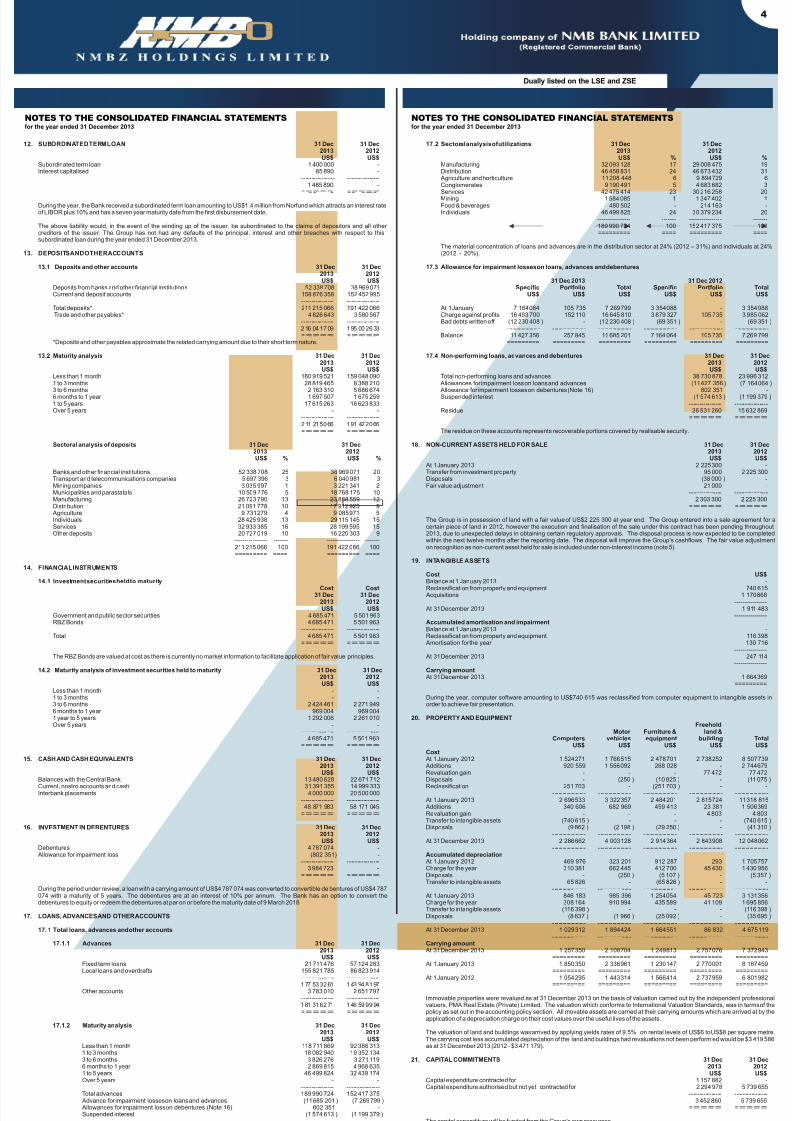
17.2 Sectoral analysis of utilizations2013 2012US$ % US$ %
Manufacturing 32 093 128 17 29 008 475 19Distribution 46 458 831 24 46 673 432 31 Agriculture and horticulture 11 208 448 6 9 894 729 6Conglomerates 9 190 491 5 4 683 682 3
Services 42 475 414 23 30 216 258 20Mining 1 584 085 1 1 347 402 1Food & beverages 480 502 - 214 163 -Individuals 46 499 825 24 30 379 234 20
---------------- ------- ---------------- -------189 990 724 100 152 417 375 100========= ==== ========= ====
The material concentration of loans and advances are in the distribution sector at 24% (2012 – 31%) and individuals at 24%(2012 - 20%).
17.3 Allowance for impairment losses on loans, advances and debentures
31 Dec 2013 31 Dec 2012Specific Portfolio Total Specific Portfolio Total
US$ US$ US$ US$ US$ US$
At 1 January 7 164 064 105 735 7 269 799 3 354 088 - 3 354 088Charge against profits 16 493 700 152 110 16 645 810 3 879 327 105 735 3 985 062Bad debts written off (12 230 408 ) - (12 230 408 ) (69 351 ) - (69 351 )
- -- -- -- -- -- -- -- - - -- -- -- -- -- -- -- - - -- -- -- -- -- -- -- - - -- -- -- -- -- -- -- - - -- -- -- -- -- -- -- - - -- -- -- -- -- -- -- -Balance 11 427 356 257 845 11 685 201 7 164 064 105 735 7 269 799
========= ========= ========= ========= ========= =========
17.4 Non-performing loans, advances and debentures 31 Dec 31 Dec2013 2012US$ US$
Total non-performing loans and advances 38 730 878 23 996 312
Allowances for impairment loss on loans and advances (11 427 356 ) (7 164 064 ) Allowance for impairment losses on debentures (Note 16) 802 351 -Suspended interest (1 574 613 ) (1 199 379 )
---------------- ----------------Residue 26 531 260 15 632 869
========= =========
The residue on these accounts represents recoverable portions covered by realisable security.
18. NON-CURRENT ASSETS HELD FOR SALE 31 Dec 31 Dec2013 2012US$ US$
At 1 January 2013 2 225 300 -Transfer from investment property 95 000 2 225 300Disposals (38 000 ) -Fair value adjustment 21 000 -
---------------- ----------------2 303 300 2 225 300
========= =========
The Group is in possession of land with a fair value of US$2 225 300 at year end. The Group entered into a sale agreement for acertain piece of land in 2012, however the execution and finalisation of the sale under this contract has been pending throughout2013, due to unexpected delays in obtaining certain regulatory approvals. The disposal process is now expected to be completedwithin the next twelve months after the reporting date. The disposal will improve the Group's cashflows. The fair value adjustmenton recognition as non-current asset held for sale is included under non-interest income (note 5).
19. INTANGIBLE ASSETS
CostBalance at 1 January 2013 -Reclassification from property and equipment 740 615 Acquisitions 1 170 868
---------------- At 31 December 2013 1 911 483
----------------Accumulated amortisation and impairmentBalance at 1 January 2013 -Reclassification from property and equipment 116 398 Amortisation for the year 130 716
---------------- At 31 December 2013 247 114
----------------Carrying amount At 31 December 2013 1 664 369
=========
During the year, computer software amounting to US$740 615 was reclassified from computer equipment to intangible assets inorder to achieve fair presentation.
20. PROPERTY AND EQUIPMENTFreehold
Motor Furniture & land &Computers vehicles equipment building Total
US$ US$ US$ US$ US$Cost At 1 January 2012 1 524 271 1 766 515 2 478 701 2 738 252 8 507 739 Additions 920 559 1 556 092 268 028 - 2 744 679Revaluation gain - - - 77 472 77 472Disposals - (250 ) (10 825 ) - (11 075 )Reclassification 251 703 - (251 703 ) - -
- -- -- -- -- -- -- -- - - -- -- -- -- -- -- -- - - -- -- -- -- -- -- -- - - -- -- -- -- -- -- -- - - -- -- -- -- -- -- -- - At 1 January 2013 2 696 533 3 322 357 2 484 201 2 815 724 11 318 815 Additions 340 606 682 969 459 413 23 381 1 506 369Revaluation gain - - - 4 803 4 803Transfer to intangible assets (740 615 ) - - - (740 615 )Disposals (9 862 ) (2 198 ) (29 250 ) - (41 310 )
- -- -- -- -- -- -- -- - - -- -- -- -- -- -- -- - - -- -- -- -- -- -- -- - - -- -- -- -- -- -- -- - - -- -- -- -- -- -- -- - At 31 December 2013 2 286 662 4 003 128 2 914 364 2 843 908 12 048 062
--- -- -- -- -- -- -- - - -- -- -- -- -- -- -- - - -- -- -- -- -- -- -- - - -- -- -- -- -- -- -- - - -- -- -- -- -- -- -- -Accumulated depreciation At 1 January 2012 469 976 323 201 912 287 293 1 705 757Charge for the year 310 381 662 445 412 700 45 430 1 430 956Disposals - (250 ) (5 107 ) - (5 357 )Transfer to intangible assets 65 826 - (65 826 ) - -
- -- -- -- -- -- -- -- - - -- -- -- -- -- -- -- - - -- -- -- -- -- -- -- - - -- -- -- -- -- -- -- - - -- -- -- -- -- -- -- - At 1 January 2013 846 183 985 396 1 254 054 45 723 3 131 356Charge for the year 308 164 910 994 435 589 41 109 1 695 856Transfer to intangible assets (116 398 ) - - - (116 398 )Disposals (8 637 ) (1 966 ) (25 092 ) - (35 695 )
- -- -- -- -- -- -- -- - - -- -- -- -- -- -- -- - - -- -- -- -- -- -- -- - - -- -- -- -- -- -- -- - - -- -- -- -- -- -- -- - At 31 December 2013 1 029 312 1 894 424 1 664 551 86 832 4 675 119
--- -- -- -- -- -- -- - - -- -- -- -- -- -- -- - - -- -- -- -- -- -- -- - - -- -- -- -- -- -- -- - - -- -- -- -- -- -- -- -Carrying amount At 31 December 2013 1 257 350 2 108 704 1 249 813 2 757 076 7 372 943
========= ========= ========= ========= ========= At 1 January 2013 1 850 350 2 336 961 1 230 147 2 770 001 8 187 459
========= ========= ========= ========= ========= At 1 January 2012 1 054 295 1 443 314 1 566 414 2 737 959 6 801 982
========= ========= ========= ========= =========
Immovable properties were revalued as at 31 December 2013 on the basis of valuation carried out by the independent professionalvaluers, PMA Real Estate (Private) Limited. The valuation which conforms to International Valuation Standards, was in terms of thepolicy as set out in the accounting policy section. All movable assets are carried at their carrying amounts which are arrived at by theapplication of a depreciation charge on their cost values over the useful lives of the assets.
The valuation of land and buildings was arrived by applying yields rates of 9.5% on rental levels of US$6 to US$8 per square metre.The carrying cost less accumulated depreciation of the land and buildings had revaluations not been perform ed would be $3 419 586as at 31 December 2013 (2012 - $3 471 179).
21. CAPITAL COMMITMENTS 31 Dec 31 Dec2013 2012US$ US$
Capital expenditure contracted for 1 157 882 -Capital expenditure authorised but not yet contracted for 2 294 978 5 739 655
---------------- ----------------3 452 860 5 739 655
========= =========
The capital expenditure will be funded from the Group's own resources.
31 Dec 31 Dec
US$
12. SUBORDINATED TERM LOAN2013 2012US$ US$
Subordinated term loan 1 400 000 -Interest capitalised 85 890 -
---------------- ----------------1 485 890 -
========= =========
During the year, the Bank received a subordinated term loan amounting to US$1.4 million from Norfund which attracts an interest rateof LIBOR plus 10% and has a seven year maturity date from the first disbursement date.
The above liability would, in the event of the winding up of the issuer, be subordinated to the claims of depositors and all othercreditors of the issuer. The Group has not had any defaults of the principal, interest and other breaches with respect to thissubordinated loan during the year ended 31 December 2013.
13. DEPOSITS AND OTHER ACCOUNTS
13.1 Deposits and other accounts 31 Dec 31 Dec2013 2012US$ US$
Deposits from banks and other financial institutions 52 338 708 38 969 071Current and deposit accounts 158 876 358 152 452 995
---------------- ----------------Total deposits* 211 215 066 191 422 066 Trade and other payables* 4 826 643 3 580 567
---------------- ----------------216 041 709 195 002 633========= =========
*Deposits and other payables approximate the related carrying amount due to their short term nature. 13.2 Maturity analysis 31 Dec 31 Dec
2013 2012US$ US$
Less than 1 month 160 919 521 159 048 090
1 to 3 months 28 819 465 8 388 2103 to 6 months 2 163 310 5 686 6746 months to 1 year 1 697 507 1 675 2591 to 5 years 17 615 263 16 623 833Over 5 years - -
---------------- ----------------211 215 066 191 422 066========= =========
Sectoral analysis of deposits 31 Dec 31 Dec2013 2012US$ % US$ %
Banks and other financial institutions 52 338 708 25 38 969 071 20Transport and telecommunications companies 5 697 396 3 6 040 981 3Mining companies 3 035 997 1 3 221 341 2Municipalities and parastatals 10 509 776 5 18 768 175 10Manufacturing 26 723 790 13 23 888 559 12Distribution 21 091 778 10 17 912 925 9 Agriculture 9 731 279 4 9 085 971 5Individuals 28 425 938 13 29 115 145 15Services 32 933 385 16 28 199 595 15Other deposits 20 727 019 10 16 220 303 9
---------------- ------- ---------------- -------211 215 066 100 191 422 066 100========= ==== ========= ====
14. FINANCIAL INSTRUMENTS
14.1 Investment securities held to maturityCost Cost
31 Dec 31 Dec2013 2012US$ US$
Government and public sector securities 4 685 471 5 501 963RBZ Bonds 4 685 471 5 501 963
---------------- ----------------Total 4 685 471 5 501 963
========= =========
The RBZ Bonds are valued at cost as there is currently no market information to facilitate application of fair value principles.
14.2 Maturity analysis of investment securities held to maturity 31 Dec 31 Dec2013 2012US$ US$
Less than 1 month - -1 to 3 months - -3 to 6 months 2 424 461 2 271 9496 months to 1 year 969 004 969 0041 year to 5 years 1 292 006 2 261 010Over 5 years - -
---------------- ----------------4 685 471 5 501 963
========= =========
15. CASH AND CASH EQUIVALENTS 31 Dec 31 Dec2013 2012US$ US$
Balances with the Central Bank 13 480 628 22 671 712Current, nostro accounts and cash 31 391 355 14 999 333Interbank placements 4 000 000 20 500 000
---------------- ----------------48 871 983 58 171 045
========= =========
16. INVESTMENT IN DEBENTURES 31 Dec 31 Dec2013 2012US$ US$
Debentures 4 787 074 - Allowance for impairment loss (802 351) -
---------------- ----------------3 984 723 -
========= =========
During the period under review, a loan with a carrying amount of US$4 787 074 was converted to convertible de bentures of US$4 787074 with a maturity of 5 years. The debentures are at an interest of 10% per annum. The Bank has an option to convert thedebentures to equity or redeem the debentures at par on or before the maturity date of 9 March 2018.
17. LOANS, ADVANCES AND OTHER ACCOUNTS
17. 1 Total loans, advances and other accounts
17.1.1 Advances 31 Dec 31 Dec
2013 2012US$ US$Fixed term loans 21 711 476 57 124 283Local loans and overdrafts 155 821 785 86 823 914
---------------- ----------------177 533 261 143 948 197
Other accounts 3 783 010 2 651 797---------------- ----------------181 316 271 146 599 994========= =========
17.1.2 Maturity analysis 31 Dec 31 Dec2013 2012US$ US$
Less than 1 month 118 711 869 92 386 3131 to 3 months 18 082 940 19 352 1343 to 6 months 3 826 276 3 271 1196 months to 1 year 2 869 815 4 968 6351 to 5 years 46 499 824 32 439 174Over 5 years - -
---------------- ----------------Total advances 189 990 724 152 417 375 Advance for impairment losses on loans and advances (11 685 201 ) (7 269 799 ) Allowances for impairment loss on debentures (Note 16) 802 351 -Suspended interest (1 574 613 ) (1 199 379 )
---------------- ----------------177 533 261 143 948 197
Other accounts 3 783 010 2 651 797
---------------- ----------------181 316 271 146 599 994========= =========
31 Dec 31 Dec
NOTES TO THE CONSOLIDATED FINANCIAL STATEMENTS
for the year ended 31 December 2013
NOTES TO THE CONSOLIDATED FINANCIAL STATEMENTS
for the year ended 31 December 2013
Dually listed on the LSE and ZSE
4
8/12/2019 NMB Audited Results for FY Ended 31 Dec 13
http://slidepdf.com/reader/full/nmb-audited-results-for-fy-ended-31-dec-13 5/9
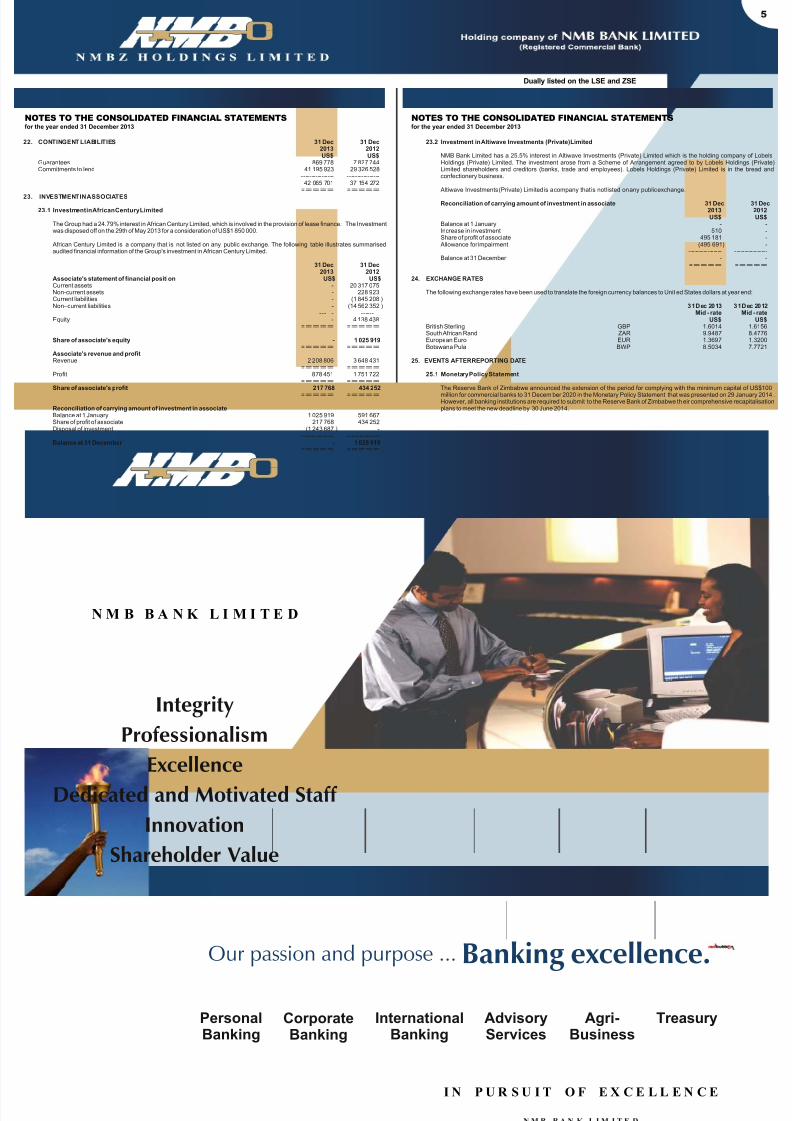
22. CONTINGENT LIABILITIES2013 2012US$ US$
Guarantees 869 778 7 827 744Commitments to lend 41 195 923 29 326 528
---------------- ----------------42 065 701 37 154 272
========= =========23. INVESTMENT IN ASSOCIATES
23.1 Investment in African Century Limited
The Group had a 24.79% interest in African Century Limited, which is involved in the provision of lease finance. The Investmentwas disposed off on the 29th of May 2013 for a consideration of US$1 850 000.
African Century Limited is a company that is not listed on any public exchange. The following table illustrates summarisedaudited financial information of the Group's investment in African Century Limited.
31 Dec 31 Dec2013 2012
Associate's statement of financial position US$ US$Current assets - 20 317 075Non-current assets - 228 923Current liabilities - (1 845 208 )Non–current liabilities - (14 562 352 )
---------------- ----------------Equity - 4 138 438
========= =========
Share of associate's equity - 1 025 919========= =========
Associate's revenue and profitRevenue 2 208 806 3 648 431
========= =========Profit 878 451 1 751 722
========= =========Share of associate's profit 217 768 434 252
========= =========
Reconciliation of carrying amount of investment in associateBalance at 1 January 1 025 919 591 667Share of profit of associate 217 768 434 252Disposal of investment (1 243 687 ) -
---------------- ----------------Balance at 31 December - 1 025 919
========= =========
31 Dec 31 Dec
NOTES TO THE CONSOLIDATED FINANCIAL STATEMENTS
for the year ended 31 December 2013
23.2 Investment in Altiwave Investments (Private) Limited
NMB Bank Limited has a 25.5% interest in Altiwave Investments (Private) Limited which is the holding company of LobelsHoldings (Private) Limited. The investment arose from a Scheme of Arrangement agreed to by Lobels Holdings (Private)Limited shareholders and creditors (banks, trade and employees). Lobels Holdings (Private) Limited is in the bread andconfectionery business.
Altiwave Investments (Private) Limited is a company that is not listed on any public exchange. Reconciliation of carrying amount of investment in associate 31 Dec 31 Dec
2013 2012US$ US$
Balance at 1 January - -Increase in investment 510 -Share of profit of associate 495 181 - Allowance for impairment (495 691) -
---------------- ----------------Balance at 31 December - -
========= =========
24. EXCHANGE RATES
The following exchange rates have been used to translate the foreign currency balances to Unit ed States dollars at year end:
31 Dec 2013 31 Dec 2012Mid - rate Mid - rate
US$ US$British Sterling GBP 1.6014 1.6156South African Rand ZAR 9.9487 8.4776European Euro EUR 1.3697 1.3200Botswana Pula BWP 8.5034 7.7721
25. EVENTS AFTER REPORTING DATE
25.1 Monetary Policy Statement
The Reserve Bank of Zimbabwe announced the extension of the period for complying with the minimum capital of US$100million for commercial banks to 31 Decem ber 2020 in the Monetary Policy Statement that was presented on 29 January 2014 .However, all banking institutions are required to submit to the Reserve Bank of Zimbabwe th eir comprehensive recapitalisationplans to meet the new deadline by 30 June 2014.
Dually listed on the LSE and ZSE
NOTES TO THE CONSOLIDATED FINANCIAL STATEMENTS
for the year ended 31 December 2013
NMB12-189
To open your NMB Bank account, visit our Customer Service Officers at your nearest NMB Bank branch,
call 04-850983-9 or email us on [email protected].
NMB Bank Limited. Registered Commercial Bank.
www.nmbz.co.zw
N M B B A N K L I M I T E D
I N P U R S U I T O F E X C E L L E N C E
N M B B A N K L I M I T E D
Integrity
Professionalism
ExcellenceDedicated and Motivated Staff
Innovation
Shareholder Value
Our passion and purpose ...
Banking excellence.
5
TreasuryCorporateBanking
InternationalBanking
AdvisoryServices
Agri-Business
PersonalBanking
8/12/2019 NMB Audited Results for FY Ended 31 Dec 13
http://slidepdf.com/reader/full/nmb-audited-results-for-fy-ended-31-dec-13 6/9
STATEMENT OF COMPREHENSIVE INCOMEfor the year ended 31 December 2013
STATEMENT OF FINANCIAL POSITIONAs at 31 December 2013
STATEMENT OF CHANGES IN EQUITYfor the year ended 31 December 2013
STATEMENT OF CASH FLOWSfor the year ended 31 December 2013
31 Dec 31 Dec2013 2012
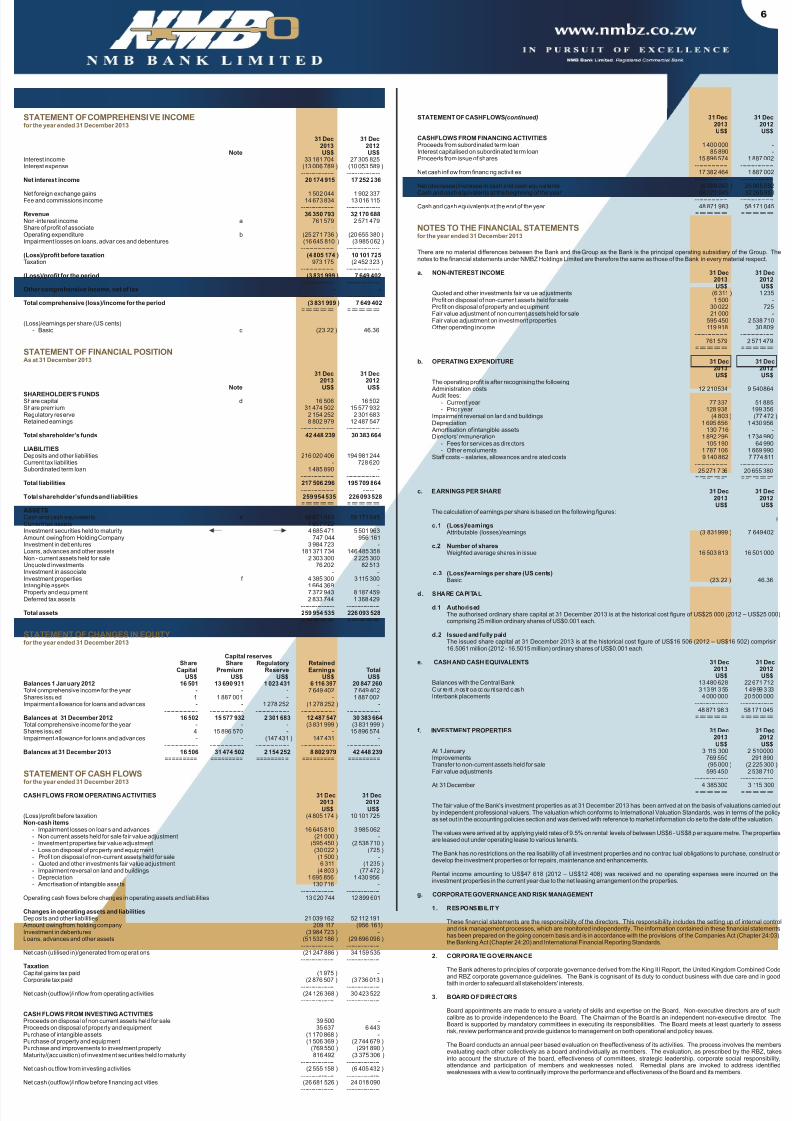
Note US$ US$Interest income 33 181 704 27 305 825Interest expense (13 006 789 ) (10 053 589 )
---------------- ----------------Net interest income 20 174 915 17 252 236
Net foreign exchange gains 1 502 044 1 902 337Fee and commissions income 14 673 834 13 016 115
---------------- ----------------Revenue 36 350 793 32 170 688Non-interest income a 761 579 2 571 479Share of profit of associate - -Operating expenditure b (25 271 736 ) (20 655 380 )Impairment losses on loans, advances and debentures (16 645 810 ) (3 985 062 )
---------------- ----------------(Loss)/profit before taxation (4 805 174 ) 10 101 725Taxation 973 175 (2 452 323 )
---------------- ----------------(Loss)/profit for the period (3 831 999 ) 7 649 402
---------------- ----------------Other comprehensive income, net of tax - -
---------------- ----------------Total comprehensive (loss)/income for the period (3 831 999 ) 7 649 402
========= =========
(Loss)/earnings per share (US cents)- Basic c (23.22 ) 46.36
31 Dec 31 Dec
2013 2012Note US$ US$
SHAREHOLDER'S FUNDS Share capital d 16 506 16 502Share premium 31 474 502 15 577 932Regulatory reserve 2 154 252 2 301 683Retained earnings 8 802 979 12 487 547
---------------- ----------------Total shareholder’s funds 42 448 239 30 383 664
LIABILITIESDeposits and other liabilities 216 020 406 194 981 244Current tax liabilities - 728 620Subordinated term loan 1 485 890 -
---------------- ----------------Total liabilities 217 506 296 195 709 864
---------------- ----------------Total shareholder’s funds and liabilities 259 954 535 226 093 528
========= =========ASSETSCash and cash equivalents e 48 871 983 58 171 045Current tax assets 1 657 722 -Investment securities held to maturity 4 685 471 5 501 963 Amount owing from Holding Company 747 044 956 161Investment in debentures 3 984 723 -Loans, advances and other assets 181 371 734 146 485 358Non - current assets held for sale 2 303 300 2 225 300Unquoted investments 76 202 82 513
Investment in associate - -Investment properties f 4 385 300 3 115 300Intangible assets 1 664 369 -Property and equipment 7 372 943 8 187 459Deferred tax assets 2 833 744 1 368 429
---------------- ----------------Total assets 259 954 535 226 093 528
========= =========
Capital reservesShare Share Regulatory Retained
Capital Premium Reserve Earnings TotalUS$ US$ US$ US$ US$
Balances 1 January 2012 16 501 13 690 931 1 023 431 6 116 397 20 847 260Total comprehensive income for the year - - - 7 649 402 7 649 402Shares issued 1 1 887 001 - - 1 887 002Impairment allowance for loans and advances - - 1 278 252 (1 278 252 ) -
- -- -- -- -- -- -- -- - - -- -- -- -- -- -- -- - - -- -- -- -- -- -- -- - - -- -- -- -- -- -- -- - - -- -- -- -- -- -- -- -Balances at 31 December 2012 16 502 15 577 932 2 301 683 12 487 547 30 383 664Total comprehensive income for the year - - - (3 831 999 ) (3 831 999 )Shares issued 4 15 896 570 - - 15 896 574Impairment allowance for loans and advances - - (147 431 ) 147 431 -
- -- -- -- -- -- -- -- - - -- -- -- -- -- -- -- - - -- -- -- -- -- -- -- - - -- -- -- -- -- -- -- - - -- -- -- -- -- -- -- -Balances at 31 December 2013 16 506 31 474 502 2 154 252 8 802 979 42 448 239
========= ========= ========= ========= =========
CASH FLOWS FROM OPERATING ACTIVITIES 31 Dec 31 Dec2013 2012US$ US$
(Loss)/profit before taxation (4 805 174 ) 10 101 725Non-cash items
- Impairment losses on loans and advances 16 645 810 3 985 062- Non current assets held for sale fair value adjustment (21 000 ) -- Investment properties fair value adjustment (595 450 ) (2 538 710 )- Loss on disposal of property and equipment (30 022 ) (725 )- Profit on disposal of non-current assets held for sale (1 500 ) -- Quoted and other investments fair value adjustment 6 311 (1 235 )- Impairment reversal on land and buildings (4 803 ) (77 472 )- Depreciation 1 695 856 1 430 956- Amortisation of intangible assets 130 716 -
---------------- ----------------Operating cash flows before changes in operating assets and liabilities 13 020 744 12 899 601
Changes in operating assets and liabilitiesDeposits and other liabilities 21 039 162 52 112 191 Amount owing from holding company 209 117 (956 161)Investment in debentures (3 984 723 ) -Loans, advances and other assets (51 532 186 ) (29 896 096 )
---------------- ----------------
Net cash (utilised in)/generated from operations (21 247 886 ) 34 159 535---------------- ----------------
TaxationCapital gains tax paid (1 975 ) -Corporate tax paid (2 876 507 ) (3 736 013 )
---------------- ----------------Net cash (outflow)/inflow from operating activities (24 126 368 ) 30 423 522
---------------- ----------------
CASH FLOWS FROM INVESTING ACTIVITIESProceeds on disposal of non current assets held for sale 39 500 -Proceeds on disposal of property and equipment 35 637 6 443Purchase of intangible assets (1 170 868 ) -Purchase of property and equipment (1 506 369 ) (2 744 679 )Purchase and improvements to investment property (769 550 ) (291 890 )Maturity/(acquisition) of investment securities held to maturity 816 492 (3 375 306 )
---------------- ----------------Net cash outflow from investing activities (2 555 158 ) (6 405 432 )
---------------- ----------------Net cash (outflow)/inflow before financing activities (26 681 526 ) 24 018 090
---------------- ----------------
STATEMENT OF CASHFLOWS (continued) 31 Dec 31 Dec2013 2012US$ US$
CASHFLOWS FROM FINANCING ACTIVITIESProceeds from subordinated term loan 1 400 000 -Interest capitalised on subordinated term loan 85 890 -Proceeds from issue of shares 15 896 574 1 887 002
---------------- ----------------Net cash inflow from financing activities 17 382 464 1 887 002
---------------- ----------------Net (decrease)/increase in cash and cash equivalents (9 299 062 ) 25 905 092Cash and cash equivalents at the beginning of the year 58 171 045 32 265 953
---------------- ----------------Cash and cash equivalents at the end of the year 48 871 983 58 171 045
========= =========
There are no material differences between the Bank and the Group as the Bank is the principal operating subsidiary of the Group. Thenotes to the financial statements under NMBZ Holdings Limited are therefore the same as those of the Bank in every material respect.
a. NON-INTEREST INCOME 31 Dec 31 Dec2013 2012US$ US$
Quoted and other investments fair value adjustments (6 311 ) 1 235Profit on disposal of non-current assets held for sale 1 500 -Profit on disposal of property and equipment 30 022 725Fair value adjustment of non current assets held for sale 21 000 -Fair value adjustment on investment properties 595 450 2 538 710Other operating income 119 918 30 809
---------------- ----------------761 579 2 571 479
========= =========
b. OPERATING EXPENDITURE 31 Dec 31 Dec2013 2012US$ US$
The operating profit is after recognising the following: Administration costs 12 210 534 9 540 864 Audit fees:
- Current year 77 337 51 885- Prior year 128 938 199 356
Impairment reversal on land and buildings (4 803 ) (77 472 )Depreciation 1 695 856 1 430 956 Amortisation of intangible assets 130 716 -Directors' remuneration 1 892 296 1 734 980
- Fees for services as directors 105 190 64 990- Other emoluments 1 787 106 1 669 990
Staff costs – salaries, allowances and related costs 9 140 862 7 774 811---------------- ----------------25 271 7 36 20 655 380
========= =========
c. EARNINGS PER SHARE 31 Dec 31 Dec2013 2012US$ US$
The calculation of earnings per share is based on the following figures:
c.1 (Loss)/earnings Attributable (losses)/earnings (3 831 999 ) 7 649 402
c.2 Number of shares Weighted average shares in issue 16 503 813 16 501 000
c.3 (Loss)/earnings per share (US cents) Basic (23.22 ) 46.36
d. SHARE CAPITAL
d.1 AuthorisedThe authorised ordinary share capital at 31 December 2013 is at the historical cost figure of US$25 000 (2012 – US$25 000)comprising 25 million ordinary shares of US$0.001 each.
d.2 Issued and fully paidThe issued share capital at 31 December 2013 is at the historical cost figure of US$16 506 (2012 – US$16 502) comprisin16.5061 million (2012 - 16.5015 million) ordinary shares of US$0.001 each.
e. CASH AND CASH EQUIVALENTS 31 Dec 31 Dec2013 2012US$ US$
Balances with the Central Bank 13 480 628 22 671 712Cur rent , nos tro accounts and cash 31 391 355 14 999 333Interbank placements 4 000 000 20 500 000
---------------- ----------------48 871 98 3 58 171 045
========= =========
f. INVESTMENT PROPERTIES 31 Dec 31 Dec2013 2012US$ US$
At 1 January 3 115 300 2 510 000Improvements 769 550 291 890
Transfer to non-current assets held for sale (95 000 ) (2 225 300 )Fair value adjustments 595 450 2 538 710
---------------- ---------------- At 31 December 4 385 300 3 115 300
========= =========
The fair value of the Bank's investment properties as at 31 December 2013 has been arrived at on the basis of valuations carried outby independent professional valuers. The valuation which conforms to International Valuation Standards, was in terms of the policyas set out in the accounting policies section and was derived with reference to market information clo se to the date of the valuation.
The values were arrived at by applying yield rates of 9.5% on rental levels of between US$6 - US$8 p er square metre. The propertiesare leased out under operating lease to various tenants.
The Bank has no restrictions on the rea lisability of all investment properties and no contrac tual obligations to purchase, construct or develop the investment properties or for repairs, maintenance and enhancements.
Rental income amounting to US$47 618 (2012 – US$12 408) was received and no operating expenses were incurred on theinvestment properties in the current year due to the net leasing arrangement on the properties.
g. CORPORATE GOVERNANCE AND RISK MANAGEMENT
1. RESPONSIBILITY
These financial statements are the responsibility of the directors. This responsibility includes the setting up of internal controland risk management processes, which are monitored independently. The information contained in these financial statementshas been prepared on the going concern basis and is in accordance with the provisions of the Companies Act (Chapter 24:03),the Banking Act (Chapter 24:20) and International Financial Reporting Standards.
2. CORPORATE GOVERNANCE
The Bank adheres to principles of corporate governance derived from the King III Report, the United Kingdom Combined Codeand RBZ corporate governance guidelines. The Bank is cognisant of its duty to conduct business with due care and in goodfaith in order to safeguard all stakeholders' interests.
3. BOARD OF DIRECTORS
Board appointments are made to ensure a variety of skills and expertise on the Board. Non-executive directors are of suchcalibre as to provide independence to the Board. The Chairman of the Board is an independent non-executive director. TheBoard is supported by mandatory committees in executing its responsibilities. The Board meets at least quarterly to assessrisk, review performance and provide guidance to management on both operational and policy issues.
The Board conducts an annual peer based evaluation on the effectiveness of its activities. The process involves the membersevaluating each other collectively as a board and individually as members. The evaluation, as prescribed by the RBZ, takesinto account the structure of the board, effectiveness of committees, strategic leadership, corporate social responsibility,attendance and participation of members and weaknesses noted. Remedial plans are invoked to address identifiedweaknesses with a view to continually improve the performance and effectiveness of the Board and its members.
NOTES TO THE FINANCIAL STATEMENTSfor the year ended 31 December 2013
6
8/12/2019 NMB Audited Results for FY Ended 31 Dec 13
http://slidepdf.com/reader/full/nmb-audited-results-for-fy-ended-31-dec-13 7/9
4.1 Credit risk
Credit risk is the risk that a financial contract will not be honoured according to the original set of terms. The risk ariseswhen borrowers or counterparties to a financial instrument fail to meet their contractual obligations. The Bank reviewed itscredit risk management structures aimed at enhancing credit risk and asset qua lity. The Bank's general credit strategiescentre on sound credit granting process, diligent credit monitoring and strong loan collection and recovery. There is aseparation between loan collection and recovery. There is a separation between loan granting and credit monitoring to
ensure independence and effective management of the loan portfolio. The Board has put in place sanctioningcommittees with specific credit approval limits. The Credit Management department does the initial review of allapplications before recommending them to the Executive Credit Committee and finally the Board Credit Committeedepending on the loan amount. The Bank has in place a Board Loans Review Committee responsible for reviewing thequality of the loan book.
The Bank is in the process of implementing a Credit Management System and this will entail an automated end to endmanagement of credit from the loan origination to recoveries. The system should be in place by the first half of 2014.
Management of credit risk is the responsibility of Credit Management, Credit Monitoring, Credit Administration andRecoveries departments with the following responsibilities:
Credit Management! Responsible for evaluating & approving credit proposals from the business units.! Together with business units, has primary responsibility on the quality of the loan book.! Reviewing credit policy for approval by the Board Credit Committee.! Reviewing business unit level credit portfolios to ascertain changes in the credit quality of individual customers or
other counterparties as well as the overall portfolio and detect unusual developments.! Approve initial customer internal credit grades or recommend to the Credit Committees for approval.! Setting the credit risk appetite parameters.! Ensure the bank adheres to limits, mandates and its credit policy.! Ensure adherence to facility covenants and conditions of sanction e.g. annual audits, gearing leve ls, management
accounts.! Manage trends in asset and portfolio composition, quality and growth and non-performing loans.! Manage concentration risk both in terms of single borrowers or group as well as sector concentrations and the
review of such limits.
Credit Monitoring and Financial Modelling
! Independent Credit Risk Management.! Independent on-going monitoring of individual credit and portfolios.! Triggers remedial actions to protect the interests of the Bank, if appropriate (e.g. in relation to deteriorated credits).! Monitors the on-going development and enhancement of credit risk management across the Bank.! Reviews the Internal Credit Rating System.! On-going championing of the Basel II methodologies across the Bank.! Ensures consistency in the rating processes and performs independent review of credit grades to ensure they
conform to the rating standards.! Confirm the appropriateness of the credit risk strategy and policy or reco mmends necessary revisions in response
to changes/trends identified.
Credit Administration! Prepares and keeps custody of all facility letters.! Security registration.! Safe custody of security documents.! Ensures all conditions of sanction are fulfilled before allowing drawdown or limit marking.! Review of credit files for documentation compliance e.g. call reports, management accounts.
RecoveriesThe recoveries unit is responsible for all collections and ensures that the Bank maximises recoveries from Non-Performing Loans (NPLs).
4.2 Market risk
This is the exposure of the Bank's on and off balance sheet positions to adverse movement in market prices resulting in aloss in earnings and capital. The market prices will range from money market (interest rate risk), foreign exchange andequity markets in which the Bank operates. The Bank has in place a Management Asset and Liability Committee (ALCO)which monitors market risk and recommends the appropriate levels to which the bank should be exposed at any time. Net
Interest Margin is the primary measure of interest rate risk, supported by periodic stress tests to assess the Bank's abilityto withstand stressed market conditions. On foreign exchange risk, the Bank monitors currency mismatches and makeadjustments depending on exchange rate movement forecast. The mismatches are also contained within 10% of theBank's capital position.
ALCO meets on a monthly basis and opera tes within the prudential guidelines and policies e stablished by the Board ALCO. The Board ALCO is responsible for setting exposure thresholds and limits, and meets on a quarterly basis.
4.3 Liquidity risk
Liquidity risk is the risk of financial loss arising from the inability of the Bank to fund asset increases or meet obligations asthey fall due without incurring unacceptable costs or losses. The Bank identifies this risk through maturity profiling ofassets and liabilities and assessment of expected cash flows and the availability of collateral which could be used ifadditional funding is required.
The daily liquidity position is monitored and regular liquidity stress testing is conducted under a variety of scenarioscovering both normal and more severe market condit ions. All liquidity policies and procedures are subject to review andapproval by the Board ALCO.
The key measure used by the Bank for managing liquidity risk is the ratio of net liquid assets to deposits to customers.The Bank also actively monitors its loans to deposit ratio against a set threshold in a bid to mo nitor and limit funding risk.Liquidity risk is monitored through a daily treasury strategy meeting. This is augmented by a monthly management ALCO and a quarterly Board ALCO.
4.4 Operational risk
This risk is inherent in all business activities and is the risk of loss arising from inadequate or failed internal processes,people, systems or from external events. The Bank utilises monthly key risk indicators to monitor operational risk in all
units. Further to this, the Bank has an elaborate operational loss reporting system in which all incidents with a materialimpact on the well-being of the Bank are reported to risk management. The risk department conducts periodic riskassessments on all the units within the Bank aimed at identifying the top risks and ways to minimise their impact. There isa Board Risk Committee whose function is to ensure that this risk is minimized. The Risk Committee with the assistance ofthe Internal Audit function and the Risk Management department assesses the adequacy of the internal controls andmakes the necessary recommendations to the Board.
4.5 Legal and compliance risk
Legal risk is risk from uncertainty due to legal actions or uncertainty in the applicability or interpretation of contracts, lawsor regulations. Legal risk may entail such issues as contract formation, capacity and contract fr ustration. Compliance riskis the risk arising from non – compliance with laws and regulations. To manage this risk permanent relationships aremaintained with firms of legal practitioners and access to legal advice is readily available to all departments. The Bank hasan independent compliance function which is responsible for identifying and monitoring all compliance issues andensures the Bank complies with all regulatory and statutory requirements.
4.7 Reputational risk
Reputation risk is the risk of loss of business as a result of negative publicity or negative perceptions by the market withregards to the way the Bank conducts its business. To manage this risk, the Bank strictly monitors customers' complaints,continuously train staff at all levels, conducts market surveys and periodic reviews of business practices through itsinternal audit department. The directors are satisfied with the risk management processes in the bank as these havecontributed to the minimization of losses arising from risky exposures.
4.8 Strategic risk
This refers to current and prospective impact on a Bank's earnings and capital arising from adverse business decisions orimplementing strategies that are not consistent with the internal and external environment. To manage this risk, the Bank
always has a strategic plan that is adopted by the Board of directors. Further, attainment of strategic objectives by thevarious departments is monitored periodically at management level. Further, there is an ALCO, Finance and StrategyCommittee at Board level responsible for monitoring overall progress towards attaining strategic objectives for the Bank.
The directors are satisfied with the risk management processes in the Bank as t hese have contributed to the minimisationof losses arising from risky exposures.
BOARD OF DIRECTORS (continued)
3.1 Directors' attendance at NMB Bank Limited Board meetings
3.1.1 Board of Directors
Name Meetings held Meetings attended
T N Mundawarara 4 4
A M T Mutsonziwa 4 4
J A Mushore 4 4
F Zimuto* 4 4
B Ndachena* 4 4
B W Madzivire 4 4
L Majonga (Ms)* 4 4
J Chigwedere 4 4
J de la Fargue* 4 4
J Chenevix-Trench 4 4
B P Washaya 4 4
L Chinyamutangira* 4 4
F S Mangozho* 4 4
* Resigned from the board with effect from 20 November 2013.
3.1.2 Audit Committee
Name Meetings held Meetings attended
Mr B W Madzivire 4 4
Mr A M T Mutsonziwa 4 3
Ms L Majonga* 4 4
* Resigned from the committee with effect from 20 November 2013
3.1.3 Risk Management Committee
Name Meetings held Meetings attended
Mr J Chigwedere 4 4
Ms L Majonga* 4 4
Mr B P Washaya 4 4
Mr J de la Fargue* 4 3
Mr J A Mushore 4 3
Mr F Zimuto* 4 4
Mr F Mangozho* 4 4
* Resigned from the committee with effect from 20 November 2013
3.1.4 Asset and Liability Management Committee (ALCO), Finance & Strategy Committee
Name Meetings held Meetings attended
Mr T N Mundawarara 4 4
Mr B P Washaya 4 4
Mr B Ndachena* 4 4Mr J Mushore 4 4
r J Chenevix-Trench (alternate J de la Fargue) 4 4
Mr J Chigwedere 4 4
Mr F Zimuto* 4 4
Mr F S Mangozho* 4 4
Mr L Chinyamutangira* 4 4
* Resigned from the committee with effect from 20 November 2013
3.1.5 Loans Review Committee
Name Meetings held Meetings attended
Mr A M T Mutsonziwa 4 4
Ms L Majonga* 4 4
Mr B Ndachena* 4 4
* Resigned from the committee with effect from 20 November 2013.
3.1.6 Human Resources, Remuneration and Nominations Committee
Name Meetings held Meetings attended
Mr A M T Mutsonziwa 6 6
Mr T N Mundawarara 6 6
Mr J Chenevix – Trench 6 6
Mr J A Mushore66Mr B Madzivire 6 5
Mr B P Washaya 6 4
Mr F Zimuto* 6 4
* Resigned from the committee with effect from 20 November 2013
3.1.7 Credit Committee
Name Meetings held Meetings attended
Mr T N Mundawarara 5 5
Mr J de la Fargue* 5 5
Mr J Mushore 5 3
Mr F Zimuto* 5 5
Mr B P Washaya 5 5
Mr L Chinyamutangira* 5 4
* Resigned from the committee with effect from 20 November 2013
4. RISK MANAGEMENT
The Board of Directors has overall responsibility for the establishment and oversight of the Bank's risk managementframework. The Board has established the Board Asset and Liability Management Committee (ALCO) and Board RiskCommittee, which are responsible for defining the Bank's risk universe, developing policies and monitoring implementation.The Bank strengthened its risk management function by appointing a Chief Risk Officer in September 2013 with overallresponsibility over all risks in the Bank. The Bank has complied with Basel II implementation timelines set by the Reserve Bankof Zimbabwe.
Risk management is linked logically from the level of individual transactions to the Bank level Risk management activitiesbroadly take place simultaneously at the following different hierarchy levels:a) Strategic Level: This involves risk management functions performed by senior management and the board of directors.
It includes the definition of risk, ascertaining the Bank's risk appetite, formulating strategy and policy formanaging risk and establishes adequate systems and controls to ensure overall risk remains withinacceptable levels and is adequately compensated.
b) Macro Level: It encompasses risk management within a business area or across business lines. These riskmanagement functions are performed by middle management.
c) Micro Level: This involves “On-the-line” risk management where risks are actually created. These are the riskmanagement activities performed by individuals who assume risk on behalf of the organization such asTreasury Front Office, Corporate Banking, Retail banking etc. The risk management in these areas isconfined to operational procedures set by management.
Risk management is premised on four (4) mutually reinforcing pillars, namely:a) adequate board and senior management oversight;b) adequate strategy, policies, procedures and limits;c) adequate risk identification, measurement, monitoring and information systems; andd) comprehensive internal controls and independent reviews.
NOTES TO THE FINANCIAL STATEMENTS
for the year ended 31 December 2013
7
NOTES TO THE FINANCIAL STATEMENTS
for the year ended 31 December 2013
8/12/2019 NMB Audited Results for FY Ended 31 Dec 13
http://slidepdf.com/reader/full/nmb-audited-results-for-fy-ended-31-dec-13 8/9
6. CAPITAL MANAGEMENT
The primary objective of the Bank's capital management is to ensure that the Bank complies with the RBZ requirements. Inimplementing the current capital requirements, the RBZ requires the Banking subsidiary to maintain a prescribed ratio of totalcapital to total risk weighted assets.
Regulatory capital consists of Tier 1 capital, which comprises share capital, share premium, retained earnings (including
current year profit), statutory reserve and other equity reserves.
The other component of regulatory capital is Tier 2 capital, which includes subordinated term debt, revaluation reserves andportfolio provisions.
Tier 3 capital relates to an allocation of capital to market and operational risk.
Various limits are applied to elements of the capital base. The core capital (Tier 1) shall comprise not less than 50% of thecapital base and the regulatory reserves and portfolio provisions are limited to 1.25% of total risk weighted asset s.
The Bank's regulatory capital position at 31 December 2013 was as follows: 31 Dec 31 Dec2013 2012US$ US$
Share capital 16 506 16 502Share premium 31 474 502 15 577 932Retained earnings 8 802 979 12 487 547Fair value gain on investment properties (2 925 868 ) (2 411 775 )
---------------- ----------------37 368 119 25 670 206
Less: capital allocated for market and operational risk (1 240 678 ) (1 198 520 )Credit to insiders (4 734 129 ) (2 231 128 )
---------------- ----------------
Tier 1 capital 31 393 312 22 240 558Tier 2 capital (subject to limit as per Banking Regulations) 6 823 855 4 819 193
Fair value gain on investment properties 2 925 868 2 411 775Subordinated debt 1 485 890 -
Regulatory reserve (limited to 1.25% of risk weighted assets) 2 154 252 2 301 683Portfolio provisions (limited to 1.25% of risk weighted assets) 257 845 105 735---------------- ----------------
Total Tier 1 & 2 capital 38 217 167 27 059 751Tier 3 capital (sum of market and operational risk capital) 1 240 678 1 198 520
---------------- ----------------Total capital base 39 457 845 28 258 271
========= =========Total risk weighted assets 228 275 322 182 361 802
========= =========
Tier 1 ratio 13.75% 12.20%Tier 2 ratio 2.99% 2.64%Tier 3 ratio 0.54% 0.66%Total capital adequacy ratio 17.28% 15.50%RBZ minimum required 12.00% 12.00%
7. SEGMENT INFORMATION
For management purposes, the Bank is organised into four operating segments based on prod ucts and services as follows: Retail Banking - Individual customers deposits and consumer loans, overdrafts, credit card facilities and funds
transfer facilities.
Corporate Banking - Loans and other credit facilities and deposit and current accounts for corporate and institutionalcustomers.
Treasury - Money market investment, securities trading, accepting and discounting of instruments and
foreign currency trading.
International Banking - Handles the Bank's foreign currency denominated banking business and managesrelationships with correspondent banks.
Management monitors the operating results of its business units separately for the purpose of making decisions about resourceallocation and performance assessment. Segment performance is evaluated based on operating profit or loss which in certainrespects is measured differently from operating profit or loss in the financial statements. Income taxes are managed on a bankwide basis and are not allocated to operating segments.
Interest income is reported net as management primarily relies on net interest revenue as a performance measure, not thegross income and expense.
Transfer prices between operating segments are on arm's length basis in a manner similar to transactions with third parties.
No revenue from transactions with a single external customer or counterparty amounted to 10% or more of the Bank’s totalrevenue in 2013 and 2012.
The following table presents income and profit and certain asset and liability information regarding the Bank's operatingsegments and service units:
For the year ended 31 December 2013
Retail Corporate Treasury InternationalBanking Banking Banking Banking Unallocated Total
US$ US$ US$ US$ US$ US$IncomeThird party 21 444 523 21 749 625 4 006 239 1 756 443 1 162 331 50 119 161Impairment losses on loans and advances (658 002 ) (15 987 808 ) - - - (16 645 810 )
- -- -- -- -- -- -- -- - - -- -- -- -- -- -- -- - - -- -- -- -- -- -- -- -- - -- -- -- -- -- -- -- - - -- -- -- -- -- -- -- - - -- -- -- -- -- -- -- -Net operating income 20 786 521 5 761 817 4 006 239 1 756 443 1 162 331 33 473 351- -- -- -- -- -- -- -- - - -- -- -- -- -- -- -- - - -- -- -- -- -- -- -- - - -- -- -- -- -- -- -- - - -- -- -- -- -- -- -- - - -- -- -- -- -- -- -- -
ResultsInterest and similar income 7 363 929 22 925 394 2 504 195 - 388 186 33 181 704Interest and similar expense (2 368 543 ) (9 120 441 ) (1 517 805 ) - - (13 006 789 )
- -- -- -- -- -- -- -- - - -- -- -- -- -- -- -- - - -- -- -- -- -- -- -- - - -- -- -- -- -- -- -- - - -- -- -- -- -- -- -- - - -- -- -- -- -- -- -- -Net interest income 4 995 386 13 804 953 986 390 - 388 186 20 174 915
- -- -- -- -- -- -- -- - - -- -- -- -- -- -- -- - - -- -- -- -- -- -- -- - - -- -- -- -- -- -- -- - - -- -- -- -- -- -- -- - - -- -- -- -- -- -- -- -Fee and commission income 12 342 153 566 915 - 1 756 199 8 567 14 673 834
Depreciation of property and equipment 744 735 135 675 41 694 46 718 727 034 1 695 856Segment profit/ (loss) 8 423 563 (11 457 558 ) 1 965 903 381 721 (4 118 803 ) (4 805 174 )Income tax credit - - - - 973 175 973 175
- -- -- -- -- -- -- -- - - -- -- -- -- -- -- -- - - -- -- -- -- -- -- -- - - -- -- -- -- -- -- -- - - -- -- -- -- -- -- -- - - -- -- -- -- -- -- -- -Profit/(loss) for the year 8 423 563 (11 457 558 ) 1 965 903 381 721 (3 145 628 ) (3 831 999 )
========= ========= ========= ========= ========= =========
Asset and LiabilitiesCapital expenditure 1 058 456 133 532 132 113 12 027 1 341 108 2 677 236Total assets 54 124 890 144 209 819 41 326 313 121 897 20 171 616 259 954 535Total liabilities 72 525 463 77 182 723 61 092 072 - 6 706 038 217 506 296
The following table presents income and profit and certain asset and liability information regarding the Bank's operatingsegments.
For the year ended 31 December 2012
Retail Corporate Treasury InternationalBanking Banking Banking Banking Unallocated Total
US$ US$ US$ US$ US$ US$IncomeThird party 17 420 843 19 816 731 2 806 291 1 441 235 3 310 656 44 795 756Impairment losses on loans and advances (631 814 ) (3 353 248 ) - - - (3 985 062 )
- -- -- -- -- -- -- -- - - -- -- -- -- -- -- -- - - -- -- -- -- -- -- -- - - -- -- -- -- -- -- -- - - -- -- -- -- -- -- -- - - -- -- -- -- -- -- -- -Net operating income 16 789 029 16 463 483 2 806 291 1 441 235 3 310 666 40 810 694
- -- -- -- -- -- -- -- - - -- -- -- -- -- -- -- - - -- -- -- -- -- -- -- - - -- -- -- -- -- -- -- - - -- -- -- -- -- -- -- - - -- -- -- -- -- -- -- -ResultsInterest and similar income 6 178 887 19 431 337 1 695 601 - - 27 305 825Interest and similar expense (1 921 638 ) (7 339 485 ) (792 466 ) - - (10 053 589 )
- -- -- -- -- -- -- -- - - -- -- -- -- -- -- -- - - -- -- -- -- -- -- -- - - -- -- -- -- -- -- -- - - -- -- -- -- -- -- -- - - -- -- -- -- -- -- -- -Net interest income 4 257 249 12 091 852 903 135 - - 17 252 236
- -- -- -- -- -- -- -- - - -- -- -- -- -- -- -- - - -- -- -- -- -- -- -- - - -- -- -- -- -- -- -- - - -- -- -- -- -- -- -- - - -- -- -- -- -- -- -- -Fee and commission income 11 136 084 450 746 - 1 429 285 - 13 016 115
Depreciation of property and equipment 615 387 127 980 20 727 27 064 639 798 1 430 956Segment profit/ (loss) 4 885 799 6 665 804 2 431 151 416 494 (4 297 523 ) 10 101 725Income tax expense - - - - (2 452 323 ) (2 452 323 )
- -- -- -- -- -- -- -- - - -- -- -- -- -- -- -- - - -- -- -- -- -- -- -- - - -- -- -- -- -- -- -- - - -- -- -- -- -- -- -- - - -- -- -- -- -- -- -- -Profit/ (loss) for the year 4 885 799 6 665 804 2 431 151 416 494 (6 749 846 ) 7 649 402
========= ========= ========= ========= ========= =========Assets and LiabilitiesCapital expenditure 974 520 107 131 450 160 829 1 501 749 2 744 679Total assets 41 315 622 116 785 291 48 849 157 160 829 18 982 629 226 093 528Total liabilities 75 893 282 76 327 413 40 146 035 - 3 343 134 195 709 864
8. GEOGRAPHICAL INFORMATION
The Bank operates in one geographical market, Zimbabwe.
NOTES TO THE FINANCIAL STATEMENTS
for the year ended 31 December 2013
RISK MANAGEMENT (continued)
4.9 Risk Ratings
4.9.1 Reserve Bank of Zimbabwe Ratings
During the year the Reserve Bank of Zimbabwe conducted an onsite inspection on the Bank and the following
ratings were issued;
4..9.1.1 CAMELS* Ratings
CAMELS Component Latest RBS** Previous RBS Previous RBSRatings Ratings Ratings30/06/2013 3 1/01/2008 30/ 06/2007
Capital Adequacy 2 4 4
Asset Quality 4 2 3
Management 3 3 3
Earnings 2 3 3
Liquidity 2 3 3
Sensitivity to Market Risk 2 3 3
Composite Rating 3 3 4
* CAMELS is an acronym for Capital Adequacy, Asset quality, Management, Earnings, Liquidity and Sensitivity toMarket Risk. CAMELS rating system uses a rating scale of 1-5, where '1' is Strong, '2' is Satisfactory, '3' is Fair,'4' is Weak and '5' is Critical.
** RBS stands for Risk-Based Supervision.
4.9.1.2 Summary RAS ratings
Latest RAS*** Previous RAS Previous RAS
Ratings Ratings Ratings30/06/2013 3 1/01/2008 30/0 6/2007
Overall Inherent Risk Moderate Moderate High
Overall R isk M anagement S ystems Acceptable A cceptable Weak
Overall Composite Risk Moderate Moderate High
Direction of Overall Composite Risk Stable Stable Increasing
*** RAS stands for Risk Assessment System.
4.9.1.3 Summary risk matrix -30 June 2013 on – site examination
Type of Inherent Risk Level of Inherent Adequacy of Overall Composite Direction of Risk Risk Risk Overall
Management CompositeSystems Risk
Credit High Weak High Increasing
Liquidity Moderate Acceptable Moderate Stable
Interest Rate Moderate Acceptable Moderate Stable
Foreign Exchange Low Acceptable Low Stable
Strategic Risk Moderate Acceptable Moderate Stable
Stable Operational Risk Moderate Acceptable Moderate Stable
Legal & Compliance Moderate Strong Moderate Stable
Reputation Moderate Strong Moderate Stable
Overall Moderate Acceptable Moderate Stable
KEY
Level of Inherent Risk
Low – reflects a lower than average probability of an adverse impact on a banking institution's capital and earnings.Losses in a functional area with low inherent risk would have little negative impact on the banking institution's overallfinancial condition.
Moderate – could reasonably be expected to result in a loss which could be absorbed by a banking institution in thenormal course of business.
High – reflects a higher than average probability of potential loss. High inherent risk could reasonably be expectedto result in a significant and harmful loss to the banking institution.
Adequacy of Risk Management Systems
Weak – risk management systems are inadequate or inappropriate given the size, complexity and risk profile of thebanking institution. Institution's risk management systems are lacking in important ways and therefore a cause ofmore than normal supervisory attention. The internal control systems will be lacking in important aspectsparticularly as indicated by continued control exceptions or by the failure to adhere to written policies andprocedures.
Acceptable – management of risk is largely effective but lacking to some modest degree. While the institution
might be having some minor risk management weaknesses, these have been recognised and are being addressed.Management information systems are generally adequate.
Strong – management effectively identifies and controls all types of risk posed by the relevant functional areas orper inherent risk. The board and senior management are active participants in managing risk and ensureappropriate policies and limits are put in place. The policies comprehensively define the bank's risk tolerance,responsibilities and accountabilities are effectively communicated.
Overall Composite Risk
Low – would be assigned to low inherent risk areas. Moderate risk areas may be assigned a low composite riskwhere internal controls and risk management systems are strong and effectively mitigate much of the risk.
Moderate – risk management systems appropriately mitigates inherent risk. For a given low risk area, significantweaknesses in the risk management systems may result in a moderate composite risk assessment. On the otherhand, a strong risk management system may reduce the risk so that any potential financial loss from the activitywould have only a moderate negative impact on the financial condition of the organisation.
High – risk management systems do not significantly mitigate the high inherent risk. Thus, the activity couldpotentially result in a financial loss that would have a significant impact on the bank's overall condition.
Direction of Overall Composite Risk
Increasing – based on the current information, risk is expected to increase in the next 12 months.Decreasing – based on current information, risk is expected to decrease in the next 12 months.Stable – based on the current information, risk is expected to be stable in the next 12 months.
4.9.2 External Credit Ratings
The external credit ratings were given by Global Credit Rating (GCR), a credit rating agency accredited with theReserve Bank of Zimbabwe.
Security class 2013 2012Long term BBB- BBB-
5 REGULATORY COMPLIANCE
There were no instances of regulatory non compliance in the period under review. The Bank remains committed to complyingwith and adhering to all regulatory requirements.
NOTES TO THE FINANCIAL STATEMENTS
for the year ended 31 December 2013
8

8/12/2019 NMB Audited Results for FY Ended 31 Dec 13
http://slidepdf.com/reader/full/nmb-audited-results-for-fy-ended-31-dec-13 9/9
REGISTERED OFFICES
4th Floor, Unity Court NMB Centrecnr 1st St / Kwame Nkrumah Ave cnr George Silundika Ave /Harare Leopold Takawira StZimbabwe Bulawayo
Telephone: (+263-4) 759651-9 (+263-9) 70169Facsimile (+263-4) 759648 (+263-9) 68535
Website: http://www.nmbz.co.zwEmail : enqui [email protected]
TRANSFER SECRETARIES
In Zimbabwe In UKF ir st Trans fe r Secr et ari es C omput er shar e Se rvi ces PLC1 Armagh Ave (off Enterprise Rd) The PavilionsEastlea Bridgewater RdP O Box 11 BristolHarare
ZimbabweBs99 9ZZ
Zimbabwe United Kingdom
NOTICE TO MEMBERS
Notice is hereby given that the 19th Annual General Meeting of Members of NMBZ Holdings Limited will be held atthe Registered Office of the Company at 4th Floor, Unity Court, Corner 1st Street / Kwame Nkrumah Avenue, HarareonTuesday 19 June 2014 at10.00 hours for the following purposes:
ORDINARY BUSINESS
1. To receive and adopt the Financial Statements for the year ended 31 December 2013, together with the reportsof the Directors and Auditors thereon.
2. To appoint Directors.a. In accordance with the Articles of Association, Mr J Mushore, Mr T N Mundawarara and Dr J T Makoni retire
by rotation. Being eligible, the retiring directors offer themselves for re-election.b. Mr B Zwinkels, Ms M Svova, Mr B Chikwanha, Mr C Ndiaye and Mr D Malik were appointed as directors
subsequent to the last Annual General Meeting and in accordance with the Articles of Association retirefrom office. They being eligible, the retiring directors offer themselves for re-election.
3. To appoint Auditors for 2014.4. To approve Messrs KPMG's remuneration for the year ended 31 December 2013.
Note: A member of the company entitled to attend and vote at this meeting is entitled to appoint a proxy to attend,speak and on a poll, vote in his stead. A proxy need not be a member of the company. Proxy forms shouldbe forwarded to reach the office of the transfer secretaries at least 48 hours before the commencement ofthe meeting.
By Order of the Board
V MutandwaCompany Secretary
28 March 2014
Always there.
Secure.
Convenient.
NMBDIRECTInternet Banking.
Anywhere. Anytime.
Terms & Conditions Apply
Bringing you peace of mind and ease of effort.
With the convenience of NMBDIRECT OnlineBanking you have the assurance that you are only a clickaway from having access to your NMB Bank account.
RTGS payments
ZIMRA payments
Funds transfers
Bill payments
Statement downloads
Online service requests
Personal Financial Management facility
Individuals - Register online and get instantaccess at https://www.nmbdirect.co.zw
Corporates - Download registration forms athttps://www.nmbdirect.co.zw and submit to your Account Relationship Manager
To open your NMB Bank account, visit our Customer Service Officers at your nearest NMB Bank branch, call 04-850983-9 or email us on [email protected].
NMB Bank Limited. Registered Commercial Bank.
www.nmbz.co.zw
N M B B A N K L I M I T E D
I N P U R S U I T O F E X C E L L E N C E
N M B B A N K L I M I T E D
9
Dually listed on the LSE and ZSE