Nitriding((Ferritic(Nitrocarburizing)(–(fundamentals ... · Report’1201’ Page’2’! Develop...
51
Report 1201 Page 1 Nitriding (Ferritic Nitrocarburizing) – fundamentals, modeling and process optimization Report No. 1301 Research Team: Mei Yang [email protected] (508) 8315825 Xiaolan Wang [email protected] Richard D. Sisson, Jr. [email protected] (508) 8315335 Focus group: 1. Project Statements Objectives Develop a fundamental understanding of the nitriding process in terms of: Mass transfer kinetics from the atmosphere into the surface. The nitriding potential in the atmosphere is determined by the initial gas mixture (NH3/H2) and can be calculated from thermodynamics. The transfer of nitrogen from the atmosphere to the surface of the steel is controlled by the nitriding potential in the atmosphere as well as the surface condition (chemistry/contamination, and roughness) and the steel composition. The mass transfer may be modeled by either a mass transfer coefficient, or a flux as a function of time. Develop a computational model to determine the nitrogen concentration and nitride profiles in the steel in terms of temperature, atmosphere composition, steel surface condition, alloy composition and the pre- nitriding steel microstructure. This tool will be designed to predict the nitride profile as well as the nitrogen concentration profile (i.e. case depth) based on the input of the process parameters of temperature (time), NH3/H2 (time), the alloy designation (4140 or Nitralloy – 135) and the surface condition of the steel. • NitrideTool will be created by simulating the nitrogen uptake and diffusion into ferrite and the precipitation of nitrides and conversion of carbides to carbonitrides during the process. The fundamentals of these phenomena as described above will be used for the model generation. The model will include multiple boosts and diffuse type cycles. The model will also rely on the isopleths and Lehrer diagrams from Thermo-Calc. • Verify the model by comparison with experimental results. The verification will initially be conducted by comparison with results in the literature and results from CHTE member companies. Selected experiments will also be conducted to test the model’s accuracy and capabilities.
Transcript of Nitriding((Ferritic(Nitrocarburizing)(–(fundamentals ... · Report’1201’ Page’2’! Develop...
Report 1201 Page 1
Nitriding (Ferritic Nitrocarburizing) – fundamentals, modeling and process optimization
Report No. 13-‐01
Research Team: Mei Yang [email protected] (508) 831-‐5825 Xiaolan Wang [email protected] Richard D. Sisson, Jr. [email protected] (508) 831-‐5335 Focus group:
1. Project Statements
Objectives Develop a fundamental understanding of the nitriding process in terms of:
Mass transfer kinetics from the atmosphere into the surface. The nitriding potential in the atmosphere is determined by the initial gas mixture (NH3/H2) and can be calculated from thermodynamics. The transfer of nitrogen from the atmosphere to the surface of the steel is controlled by the nitriding potential in the atmosphere as well as the surface condition (chemistry/contamination, and roughness) and the steel composition. The mass transfer may be modeled by either a mass transfer coefficient, or a flux as a function of time.
Develop a computational model to determine the nitrogen concentration and nitride profiles in the steel in terms of temperature, atmosphere composition, steel surface condition, alloy composition and the pre-nitriding steel microstructure. This tool will be designed to predict the nitride profile as well as the nitrogen concentration profile (i.e. case depth) based on the input of the process parameters of temperature (time), NH3/H2 (time), the alloy designation (4140 or Nitralloy – 135) and the surface condition of the steel.
• NitrideTool will be created by simulating the nitrogen uptake and diffusion into ferrite and the precipitation of nitrides and conversion of carbides to carbonitrides during the process. The fundamentals of these phenomena as described above will be used for the model generation. The model will include multiple boosts and diffuse type cycles. The model will also rely on the isopleths and Lehrer diagrams from Thermo-Calc.
• Verify the model by comparison with experimental results. The verification will initially be conducted by comparison with results in the literature and results from CHTE member companies. Selected experiments will also be conducted to test the model’s accuracy and capabilities.
Report 1201 Page 2
Develop a model-based optimization process to determine the optimum process parameters for several process goals: minimum cycle time, minimum cost, maximum productivity, minimum gas consumption.
Strategy 1. Literature review –
a. Nitriding practices in industry b. NH3/H2 thermodynamics – effects of H2O c. N solubility in steel – alloying effects including C d. N diffusion in steel – alloying effects including C e. Nitride precipitation in steels – kinetics and size f. N adsorption, decomposition and absorption g. Nitride hardening mechanisms h. Effects of steel microstructure – tempered Martensite carbide distribution – on diffusion
and nitride precipitation 2. Determine the boundary conditions for nitriding of steel
a. Flux? b. Mass transfer coefficient? c. Constant surface concentration?
3. Create Nitridetool for N diffusion and nitride precipitation in steels a. Nitralloy – 135 b. 4140
4. Verify computer model a. Literature data b. Selected experiments
5. Develop optimization methods for nitriding a. Minimum cycle time b. Minimum cost
6. Test optimization methods
2. Achievement to date
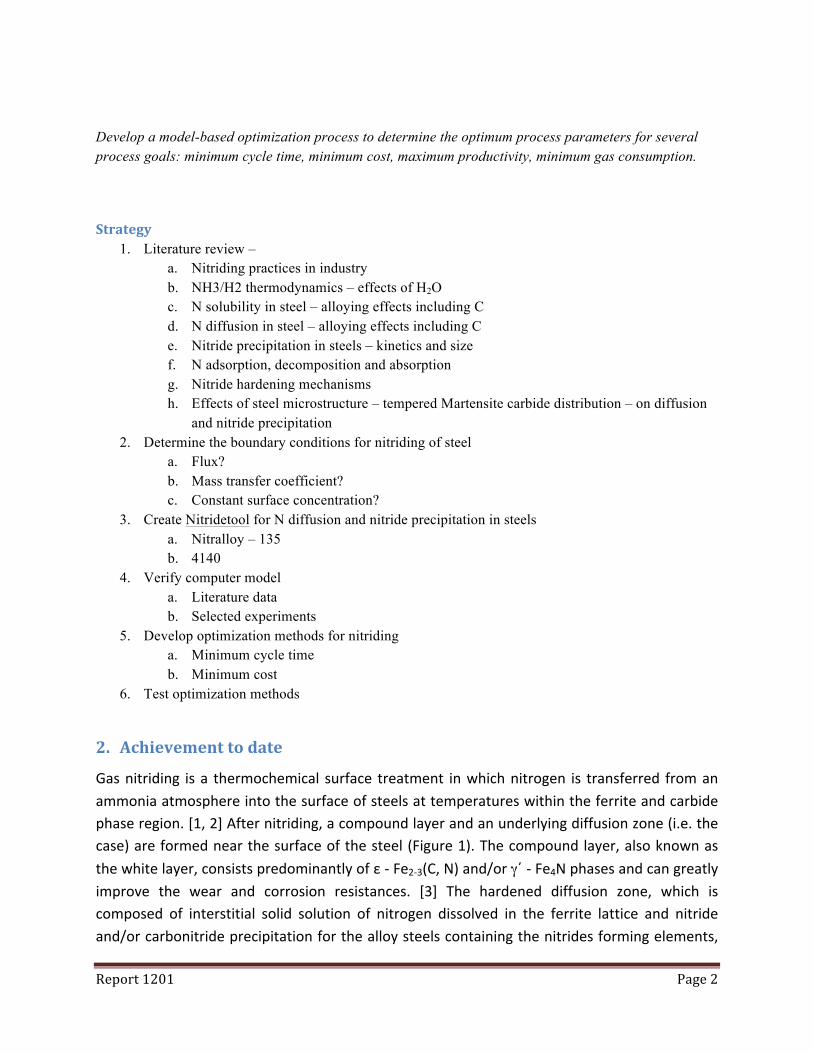
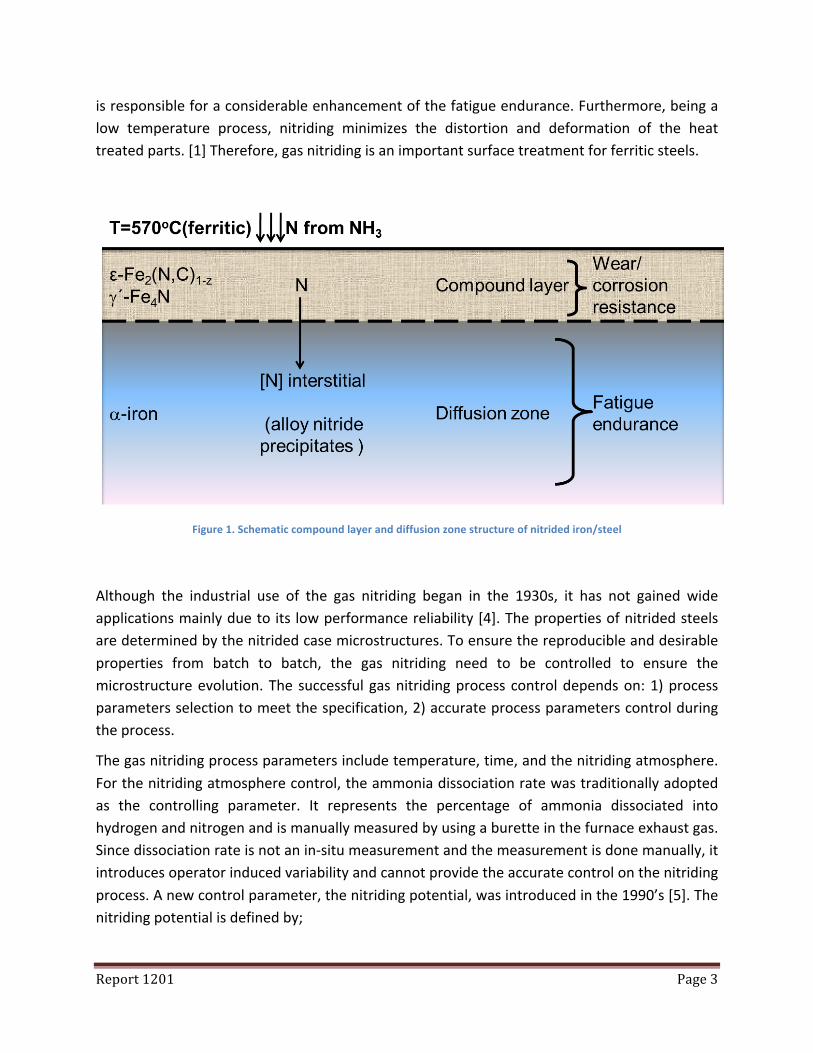
Gas nitriding is a thermochemical surface treatment in which nitrogen is transferred from an ammonia atmosphere into the surface of steels at temperatures within the ferrite and carbide phase region. [1, 2] After nitriding, a compound layer and an underlying diffusion zone (i.e. the case) are formed near the surface of the steel (Figure 1). The compound layer, also known as the white layer, consists predominantly of ε -‐ Fe2-‐3(C, N) and/or γ΄ -‐ Fe4N phases and can greatly improve the wear and corrosion resistances. [3] The hardened diffusion zone, which is composed of interstitial solid solution of nitrogen dissolved in the ferrite lattice and nitride and/or carbonitride precipitation for the alloy steels containing the nitrides forming elements,
Report 1201 Page 3
is responsible for a considerable enhancement of the fatigue endurance. Furthermore, being a low temperature process, nitriding minimizes the distortion and deformation of the heat treated parts. [1] Therefore, gas nitriding is an important surface treatment for ferritic steels.
Figure 1. Schematic compound layer and diffusion zone structure of nitrided iron/steel
Although the industrial use of the gas nitriding began in the 1930s, it has not gained wide applications mainly due to its low performance reliability [4]. The properties of nitrided steels are determined by the nitrided case microstructures. To ensure the reproducible and desirable properties from batch to batch, the gas nitriding need to be controlled to ensure the microstructure evolution. The successful gas nitriding process control depends on: 1) process parameters selection to meet the specification, 2) accurate process parameters control during the process.
The gas nitriding process parameters include temperature, time, and the nitriding atmosphere. For the nitriding atmosphere control, the ammonia dissociation rate was traditionally adopted as the controlling parameter. It represents the percentage of ammonia dissociated into hydrogen and nitrogen and is manually measured by using a burette in the furnace exhaust gas. Since dissociation rate is not an in-‐situ measurement and the measurement is done manually, it introduces operator induced variability and cannot provide the accurate control on the nitriding process. A new control parameter, the nitriding potential, was introduced in the 1990’s [5]. The nitriding potential is defined by;
Report 1201 Page 4
(1)
where 3NHp and
2Hp are the partial pressures of the ammonia and hydrogen gases respectively.
By utilizing the thermal conductivity hydrogen sensor in conjunction with the two-‐loop controller/programmer, the nitriding potential can be calculated and controlled automatically and accurately. [6]
With the development of measure and control systems, the gas nitriding process parameters can be controlled accurately. How to pre-‐define the nitriding process parameters to meet the specifications becomes the main challenge of the gas nitriding process control. Conventionally, trial and error methods were used to define the nitriding process parameters to meet the specifications. This method is expensive, time consuming, and hard to control. Therefore, an effective simulation tool is needed to define the process parameters based on the performance specifications of various steels. By using this tool, the properties of the nitrided steels based on the phase constitution, surface nitrogen concentration, nitrogen concentration profile, case depth, as well as growth kinetics can be simulated through variation of process parameters (temperature, time, and the nitriding atmosphere). [7]
There has been ongoing effort on the simulation of the gas nitriding process since 1990s and most of the work has been done to simulate the nitriding process of pure iron [8-‐10]. However, the pure iron is never used for nitriding in industry while the simulation for nitridable steels is greatly needed.
In the present work a computational model is developed to determine the nitrogen concentration and nitride profiles in the nitrided steels in terms of temperature, atmosphere composition, steel surface condition, alloy composition and the pre-‐nitriding steel microstructure. Based on this model, the nitride profile as well as the nitrogen concentration profile can be predicted from the input of the process parameters such as nitriding potential, temperature, time, and the steel composition.
2.1. Experiments
2.1.1. Materials and experimental procedures The AISI 4140 bars used in the experimental study were acquired from Peterson Steel Corporation and their composition determined by optical emission spectroscopy (OES) is reported in Table 1.
2/32
3
H
NHn p
pK =
Report 1201 Page 5
Table 1. Composition of AISI 4140 in wt.%
C Mn P S Si Cr Mo Fe
0.399 0.91 0.01 0.029 0.266 0.88 0.166 Balance
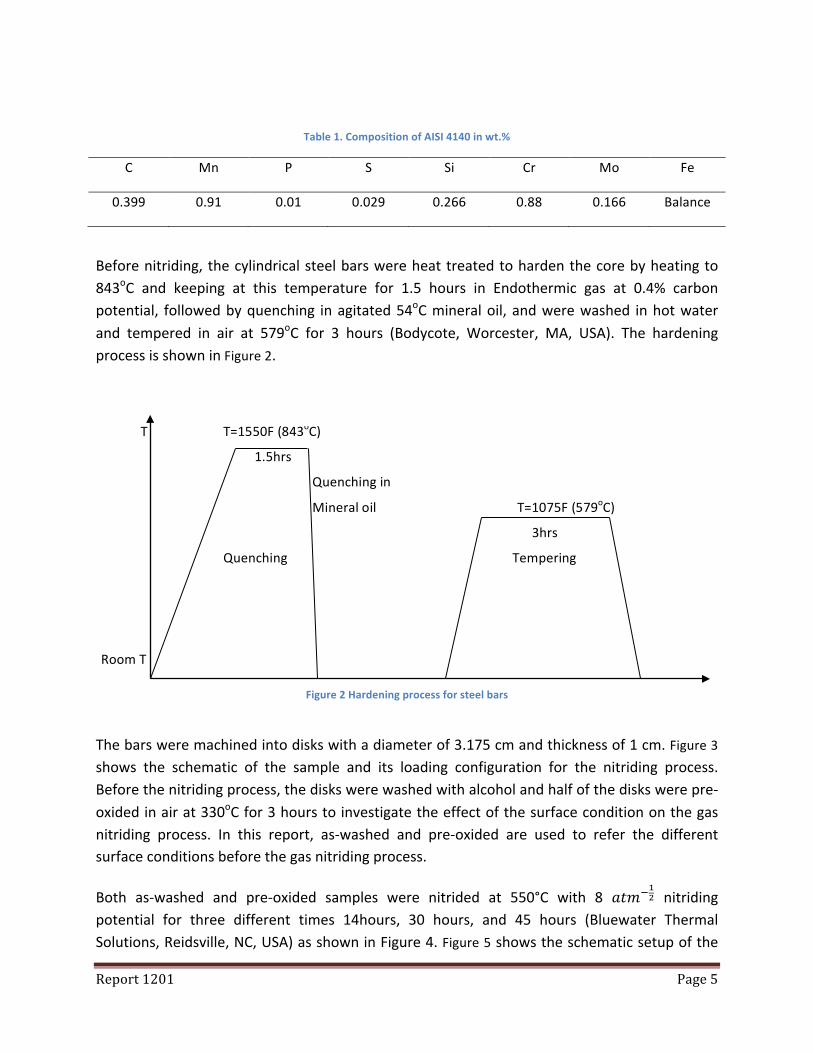
Before nitriding, the cylindrical steel bars were heat treated to harden the core by heating to 843oC and keeping at this temperature for 1.5 hours in Endothermic gas at 0.4% carbon potential, followed by quenching in agitated 54oC mineral oil, and were washed in hot water and tempered in air at 579oC for 3 hours (Bodycote, Worcester, MA, USA). The hardening process is shown in Figure 2.
Figure 2 Hardening process for steel bars
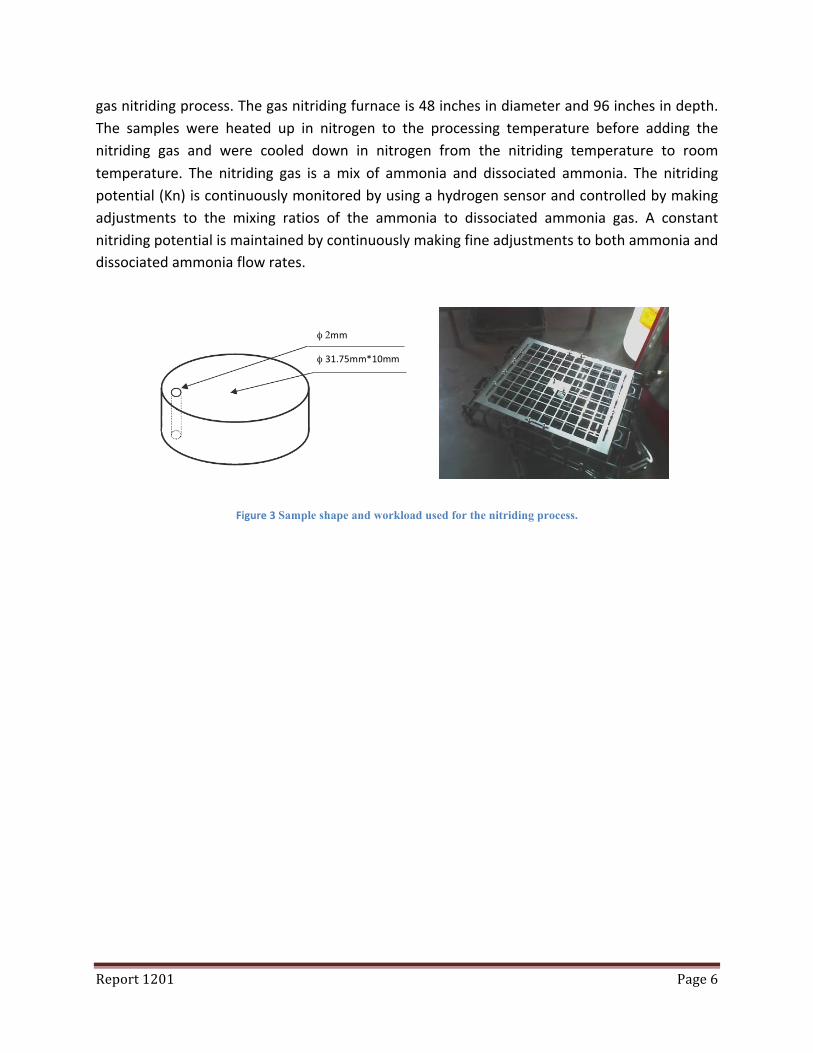
The bars were machined into disks with a diameter of 3.175 cm and thickness of 1 cm. Figure 3 shows the schematic of the sample and its loading configuration for the nitriding process. Before the nitriding process, the disks were washed with alcohol and half of the disks were pre-‐oxided in air at 330oC for 3 hours to investigate the effect of the surface condition on the gas nitriding process. In this report, as-‐washed and pre-‐oxided are used to refer the different surface conditions before the gas nitriding process.
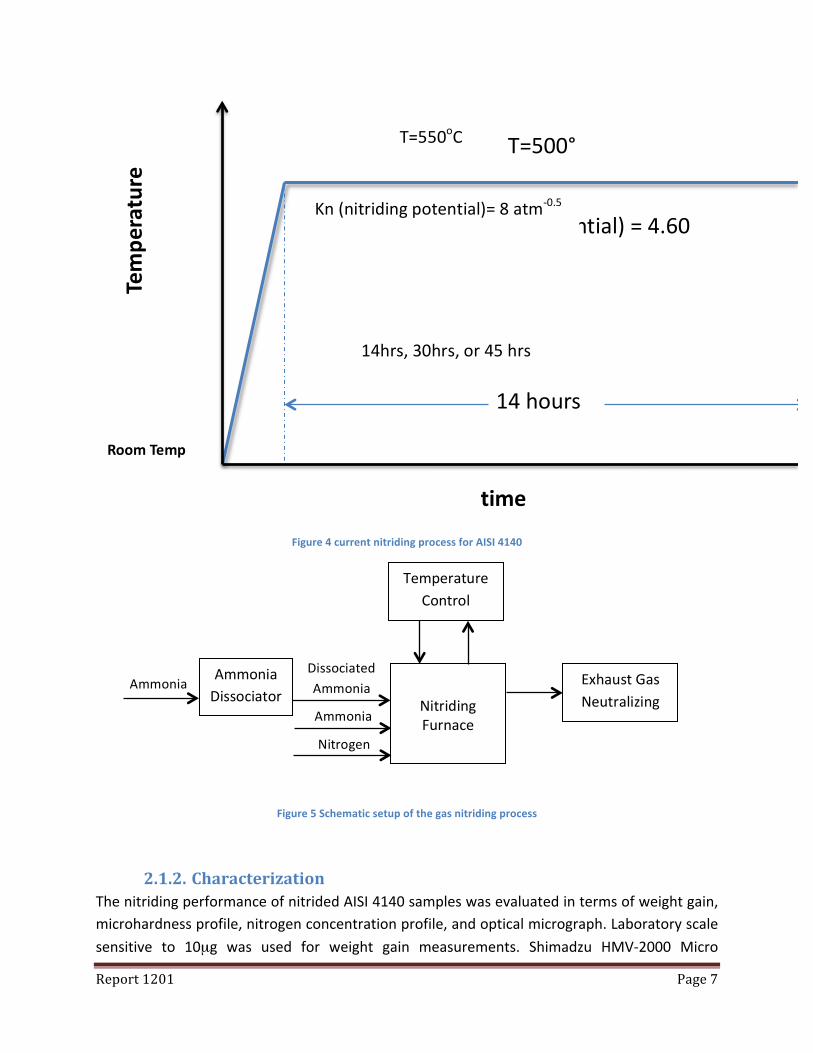
Both as-‐washed and pre-‐oxided samples were nitrided at 550°C with 8 𝑎𝑡𝑚!!! nitriding potential for three different times 14hours, 30 hours, and 45 hours (Bluewater Thermal Solutions, Reidsville, NC, USA) as shown in Figure 4. Figure 5 shows the schematic setup of the
T T=1550F (843oC)
1.5hrs
Quenching in
Mineral oil T=1075F (579oC)
3hrs
Quenching Tempering
Room T
Report 1201 Page 6
gas nitriding process. The gas nitriding furnace is 48 inches in diameter and 96 inches in depth. The samples were heated up in nitrogen to the processing temperature before adding the nitriding gas and were cooled down in nitrogen from the nitriding temperature to room temperature. The nitriding gas is a mix of ammonia and dissociated ammonia. The nitriding potential (Kn) is continuously monitored by using a hydrogen sensor and controlled by making adjustments to the mixing ratios of the ammonia to dissociated ammonia gas. A constant nitriding potential is maintained by continuously making fine adjustments to both ammonia and dissociated ammonia flow rates.
Figure 3 Sample shape and workload used for the nitriding process.
φ 2mm
φ 31.75mm*10mm
Report 1201 Page 7
Figure 4 current nitriding process for AISI 4140
Figure 5 Schematic setup of the gas nitriding process
2.1.2. Characterization The nitriding performance of nitrided AISI 4140 samples was evaluated in terms of weight gain, microhardness profile, nitrogen concentration profile, and optical micrograph. Laboratory scale sensitive to 10µg was used for weight gain measurements. Shimadzu HMV-‐2000 Micro
time
Tempe
rature
T=500°
Kn (Nitriding Potential) = 4.60
Room Temp
14 hours
T=550oC
Kn (nitriding potential)= 8 atm-‐0.5
14hrs, 30hrs, or 45 hrs
Temperature Control
Nitriding Furnace
Ammonia Dissociator
Exhaust Gas Neutralizing Equipment
Ammonia
Ammonia
Nitrogen
Dissociated Ammonia

Report 1201 Page 8
Hardness Tester was used for microhardness testing with a 200gf load and 15s loading time. Nitrogen concentration profiles were obtained by Spectro MaXx LMM14 optical emission spectroscopy (OES) analyzer.
2.1.2.1. The weight gain and average flux The weight gain from the nitriding process was calculated based on the weight measurements of each disk before and after the nitriding process separately. The average flux is calculated from the following equation:
⎟⎠
⎞⎜⎝
⎛ Δ⋅=AM
tJ 1
where J is the average flux, AMΔ is weight gain per unit surface area, and t is the nitriding time.
The measured weight gain and average flux for as-‐washed and pre-‐oxided AISI 4140 samples from different nitriding times are presented in Figure 6. It shows the pre-‐oxidation can benefit the gas nitriding process (accelerate the intake of the nitrogen) but the effect decreases with increasing times.
Figure 6 The weight gain (a) and Average flux (b) of pre-‐oxided and as-‐washed AISI 4140 samples after nitriding process with different nitriding process time, i.e. 14hrs, 30hrs, and 45hrs.
4.0E-‐05
5.0E-‐05
6.0E-‐05
7.0E-‐05
8.0E-‐05
9.0E-‐05
1.0E-‐04
1.1E-‐04
3.5 4 4.5 5 5.5 6 6.5 7
Weight G
ain (kg)
Time1/2 (hour1/2)
4140(Pre-‐oxide)
4140(As-‐wash)
1.0E-‐07
2.0E-‐07
3.0E-‐07
4.0E-‐07
5.0E-‐07
6.0E-‐07
3.5 4 4.5 5 5.5 6 6.5 7
Flux (k
g/m
2 /s)
Time1/2 (hour1/2)
4140(Pre-‐oxide)
4140(As-‐wash)
Report 1201 Page 9
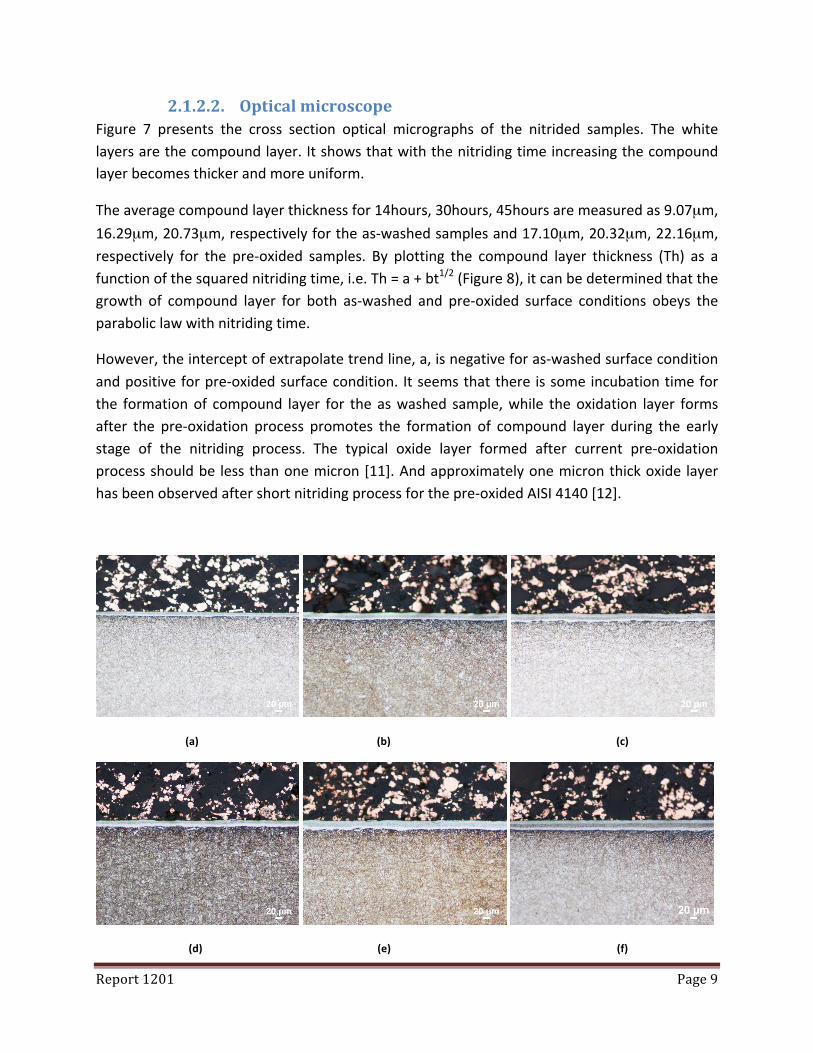
2.1.2.2. Optical microscope Figure 7 presents the cross section optical micrographs of the nitrided samples. The white layers are the compound layer. It shows that with the nitriding time increasing the compound layer becomes thicker and more uniform.
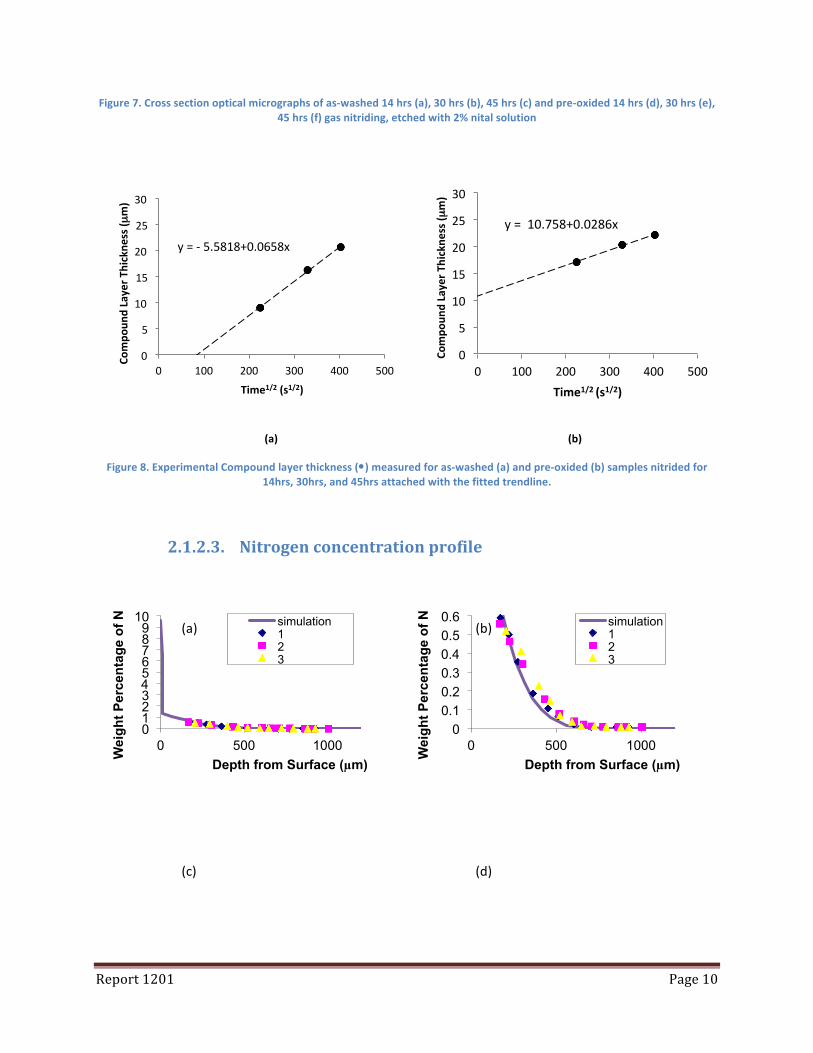
The average compound layer thickness for 14hours, 30hours, 45hours are measured as 9.07µm, 16.29µm, 20.73µm, respectively for the as-‐washed samples and 17.10µm, 20.32µm, 22.16µm, respectively for the pre-‐oxided samples. By plotting the compound layer thickness (Th) as a function of the squared nitriding time, i.e. Th = a + bt1/2 (Figure 8), it can be determined that the growth of compound layer for both as-‐washed and pre-‐oxided surface conditions obeys the parabolic law with nitriding time.
However, the intercept of extrapolate trend line, a, is negative for as-‐washed surface condition and positive for pre-‐oxided surface condition. It seems that there is some incubation time for the formation of compound layer for the as washed sample, while the oxidation layer forms after the pre-‐oxidation process promotes the formation of compound layer during the early stage of the nitriding process. The typical oxide layer formed after current pre-‐oxidation process should be less than one micron [11]. And approximately one micron thick oxide layer has been observed after short nitriding process for the pre-‐oxided AISI 4140 [12].
(a) (b) (c)
(d) (e) (f)
Report 1201 Page 10
Figure 7. Cross section optical micrographs of as-‐washed 14 hrs (a), 30 hrs (b), 45 hrs (c) and pre-‐oxided 14 hrs (d), 30 hrs (e), 45 hrs (f) gas nitriding, etched with 2% nital solution
(a) (b)
Figure 8. Experimental Compound layer thickness (•) measured for as-‐washed (a) and pre-‐oxided (b) samples nitrided for 14hrs, 30hrs, and 45hrs attached with the fitted trendline.
2.1.2.3. Nitrogen concentration profile
y = -‐ 5.5818+0.0658x
0
5
10
15
20
25
30
0 100 200 300 400 500 Com
poun
d Layer T
hickne
ss (µ
m)
Time1/2 (s1/2)
y = 10.758+0.0286x
0
5
10
15
20
25
30
0 100 200 300 400 500
Com
poun
d Layer T
hickne
ss (µ
m)
Time1/2 (s1/2)
0 1 2 3 4 5 6 7 8 9
10
0 500 1000
Wei
ght P
erce
ntag
e of
N
Depth from Surface (µm)
simulation 1 2 3
0 0.1 0.2 0.3 0.4 0.5 0.6
0 500 1000
Wei
ght P
erce
ntag
e of
N
Depth from Surface (µm)
simulation 1 2 3
(a) (b)
(c) (d)
Report 1201 Page 11
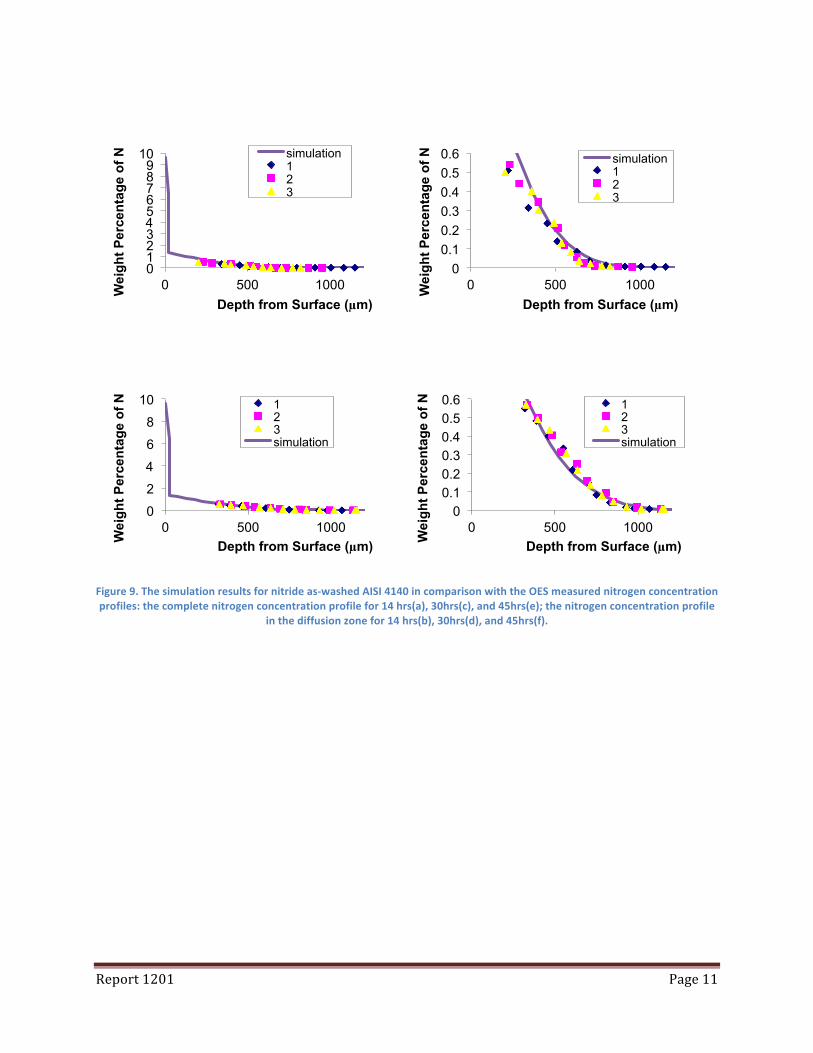
Figure 9. The simulation results for nitride as-‐washed AISI 4140 in comparison with the OES measured nitrogen concentration profiles: the complete nitrogen concentration profile for 14 hrs(a), 30hrs(c), and 45hrs(e); the nitrogen concentration profile
in the diffusion zone for 14 hrs(b), 30hrs(d), and 45hrs(f).
0 1 2 3 4 5 6 7 8 9
10
0 500 1000 Wei
ght P
erce
ntag
e of
N
Depth from Surface (µm)
simulation 1 2 3
0 0.1 0.2 0.3 0.4 0.5 0.6
0 500 1000 Wei
ght P
erce
ntag
e of
N
Depth from Surface (µm)
simulation 1 2 3
0
2
4
6
8
10
0 500 1000
Wei
ght P
erce
ntag
e of
N
Depth from Surface (µm)
1 2 3 simulation
0 0.1 0.2 0.3 0.4 0.5 0.6
0 500 1000
Wei
ght P
erce
ntag
e of
N
Depth from Surface (µm)
1 2 3 simulation
Report 1201 Page 12
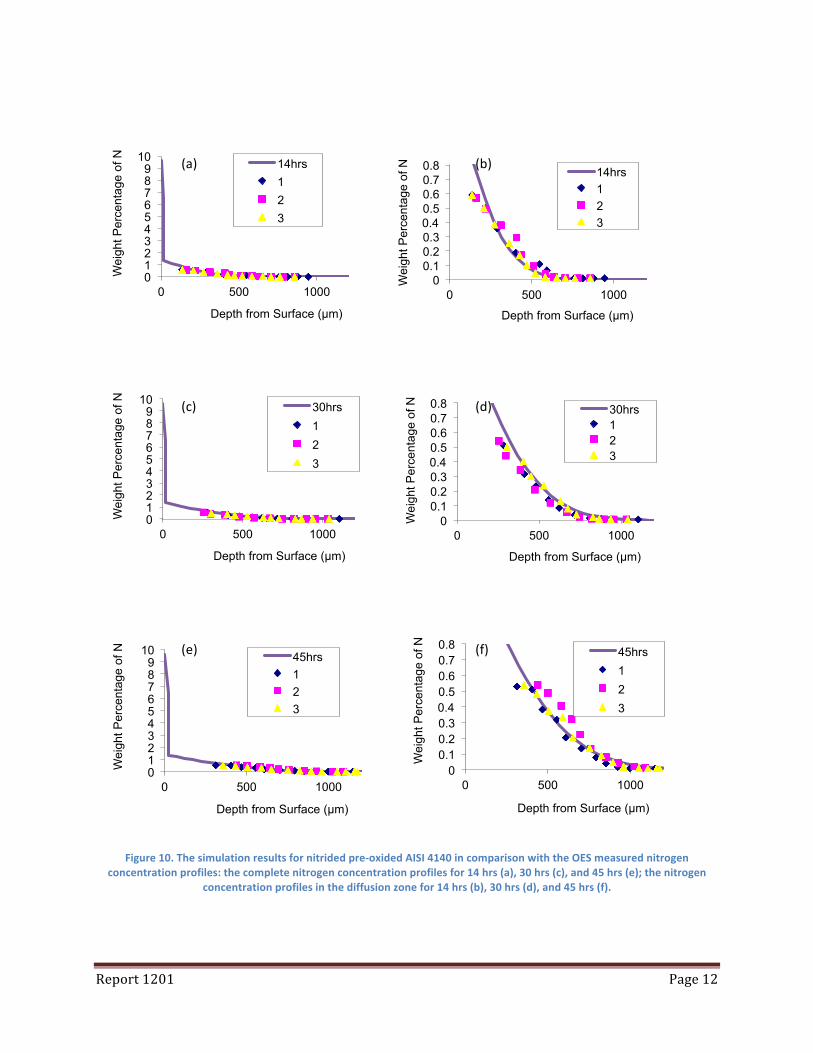
Figure 10. The simulation results for nitrided pre-‐oxided AISI 4140 in comparison with the OES measured nitrogen concentration profiles: the complete nitrogen concentration profiles for 14 hrs (a), 30 hrs (c), and 45 hrs (e); the nitrogen
concentration profiles in the diffusion zone for 14 hrs (b), 30 hrs (d), and 45 hrs (f).
0 1 2 3 4 5 6 7 8 9
10
0 500 1000
Wei
ght P
erce
ntag
e of
N
Depth from Surface (µm)
14hrs 1 2 3
0 0.1 0.2 0.3 0.4 0.5 0.6 0.7 0.8
0 500 1000
Wei
ght P
erce
ntag
e of
N
Depth from Surface (µm)
14hrs 1 2 3
0 1 2 3 4 5 6 7 8 9
10
0 500 1000
Wei
ght P
erce
ntag
e of
N
Depth from Surface (µm)
30hrs 1 2 3
0 0.1 0.2 0.3 0.4 0.5 0.6 0.7 0.8
0 500 1000
Wei
ght P
erce
ntag
e of
N
Depth from Surface (µm)
30hrs 1 2 3
0 1 2 3 4 5 6 7 8 9
10
0 500 1000
Wei
ght P
erce
ntag
e of
N
Depth from Surface (µm)
45hrs 1 2 3
0 0.1 0.2 0.3 0.4 0.5 0.6 0.7 0.8
0 500 1000
Wei
ght P
erce
ntag
e of
N
Depth from Surface (µm)
45hrs 1 2 3
(a) (b)
(c) (d)
(e) (f)

Report 1201 Page 13
Surface nitrogen concentration can be measured by spectral analysis on the OES (Optical Emission Spectroscopy). Currently, the upper limitation of accurate nitrogen measurement is 0.4 wt.%. Extrapolation to 0.6 wt.% is made for samples with higher nitrogen concentrations. However, the further calibration is needed for high nitrogen concentration measurements. As Figure 11 shows, concentrations at 3 different positions were measured on the surface. The nitrogen concentration profiles are obtained by removing the measured surface layer one by one. The experimental nitrogen concentration profiles for various nitriding times are shown in Figure 9 for as-‐washed samples and in Figure 10 for pre-‐oxided samples separately.
Figure 11 Photo of 4140 steel sample after the 3-‐point OES analysis
2.1.2.4. Vickers microhardness profile The microhardness for the cross section of the nitrided AISI 4140 samples were measured to see the hardness change from the surface layer to the core substrate. The measurements started at 50μm below the surface. Figure 12 shows the hardness decrease from the surface to the core for both as-‐washed and pre-‐oxided samples. With the nitriding time increasing, i.e. from 14 hours to 30 hours to 45 hours, the hardness profiles shift toward right and the case depth also increases.
1 2
3
Report 1201 Page 14
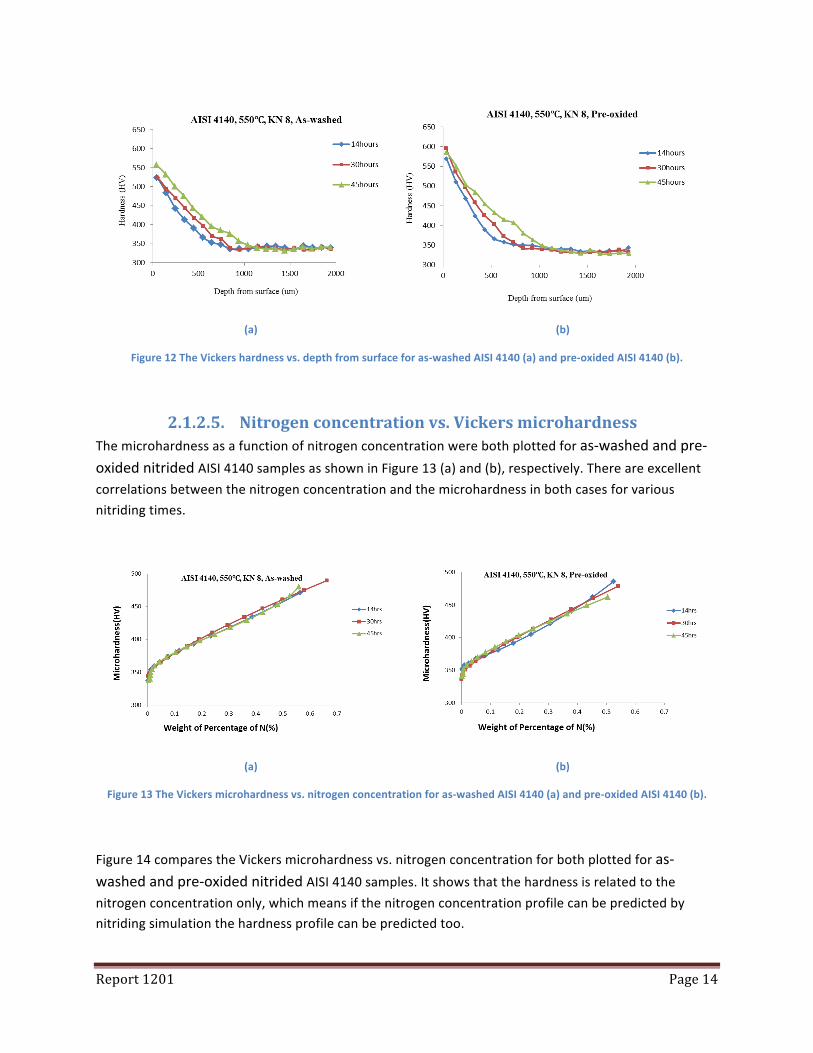
(a) (b)
Figure 12 The Vickers hardness vs. depth from surface for as-‐washed AISI 4140 (a) and pre-‐oxided AISI 4140 (b).
2.1.2.5. Nitrogen concentration vs. Vickers microhardness The microhardness as a function of nitrogen concentration were both plotted for as-‐washed and pre-‐oxided nitrided AISI 4140 samples as shown in Figure 13 (a) and (b), respectively. There are excellent correlations between the nitrogen concentration and the microhardness in both cases for various nitriding times.
(a) (b)
Figure 13 The Vickers microhardness vs. nitrogen concentration for as-‐washed AISI 4140 (a) and pre-‐oxided AISI 4140 (b).
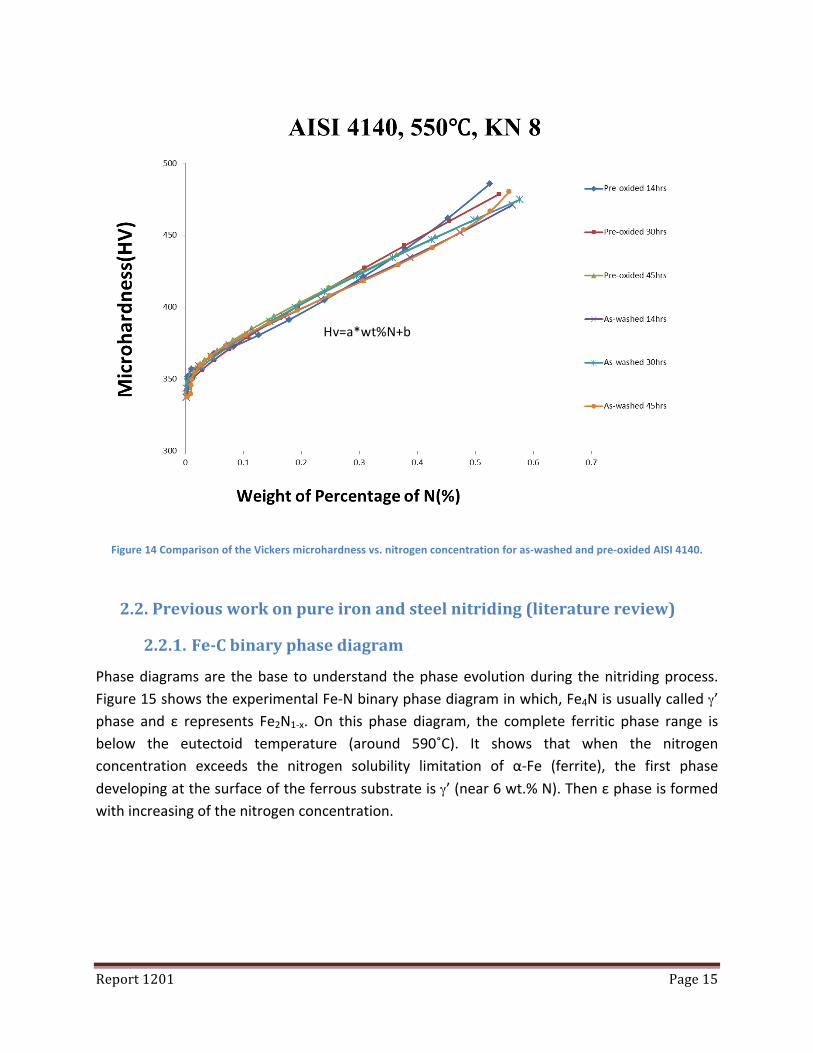
Figure 14 compares the Vickers microhardness vs. nitrogen concentration for both plotted for as-‐washed and pre-‐oxided nitrided AISI 4140 samples. It shows that the hardness is related to the nitrogen concentration only, which means if the nitrogen concentration profile can be predicted by nitriding simulation the hardness profile can be predicted too.
Report 1201 Page 15
Figure 14 Comparison of the Vickers microhardness vs. nitrogen concentration for as-‐washed and pre-‐oxided AISI 4140.
2.2. Previous work on pure iron and steel nitriding (literature review)
2.2.1. Fe-‐C binary phase diagram
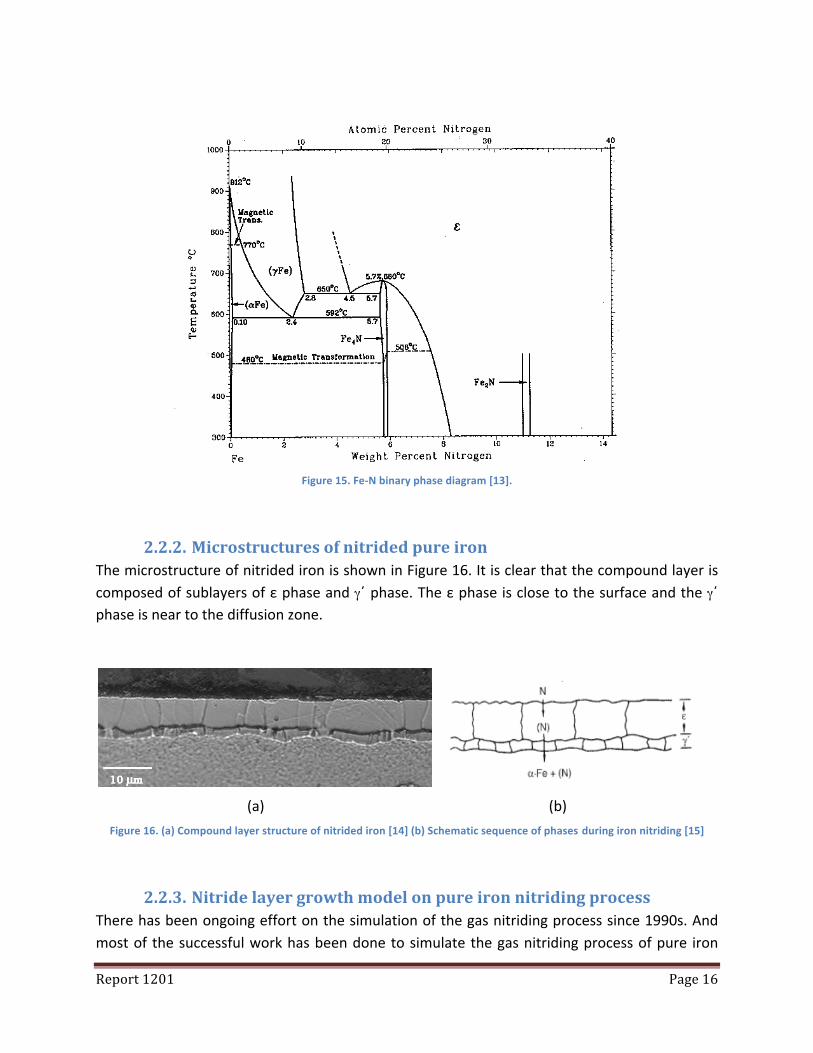
Phase diagrams are the base to understand the phase evolution during the nitriding process. Figure 15 shows the experimental Fe-‐N binary phase diagram in which, Fe4N is usually called γ’ phase and ε represents Fe2N1-‐x. On this phase diagram, the complete ferritic phase range is below the eutectoid temperature (around 590˚C). It shows that when the nitrogen concentration exceeds the nitrogen solubility limitation of α-‐Fe (ferrite), the first phase developing at the surface of the ferrous substrate is γ’ (near 6 wt.% N). Then ε phase is formed with increasing of the nitrogen concentration.
Hv=a*wt%N+b
Report 1201 Page 16
Figure 15. Fe-‐N binary phase diagram [13].
2.2.2. Microstructures of nitrided pure iron The microstructure of nitrided iron is shown in Figure 16. It is clear that the compound layer is composed of sublayers of ε phase and γ΄ phase. The ε phase is close to the surface and the γ΄ phase is near to the diffusion zone.
(a) (b)
Figure 16. (a) Compound layer structure of nitrided iron [14] (b) Schematic sequence of phases during iron nitriding [15]
2.2.3. Nitride layer growth model on pure iron nitriding process There has been ongoing effort on the simulation of the gas nitriding process since 1990s. And most of the successful work has been done to simulate the gas nitriding process of pure iron
Report 1201 Page 17
due to the limited thermodynamics and kinetics information available on the gas nitriding process of steels.
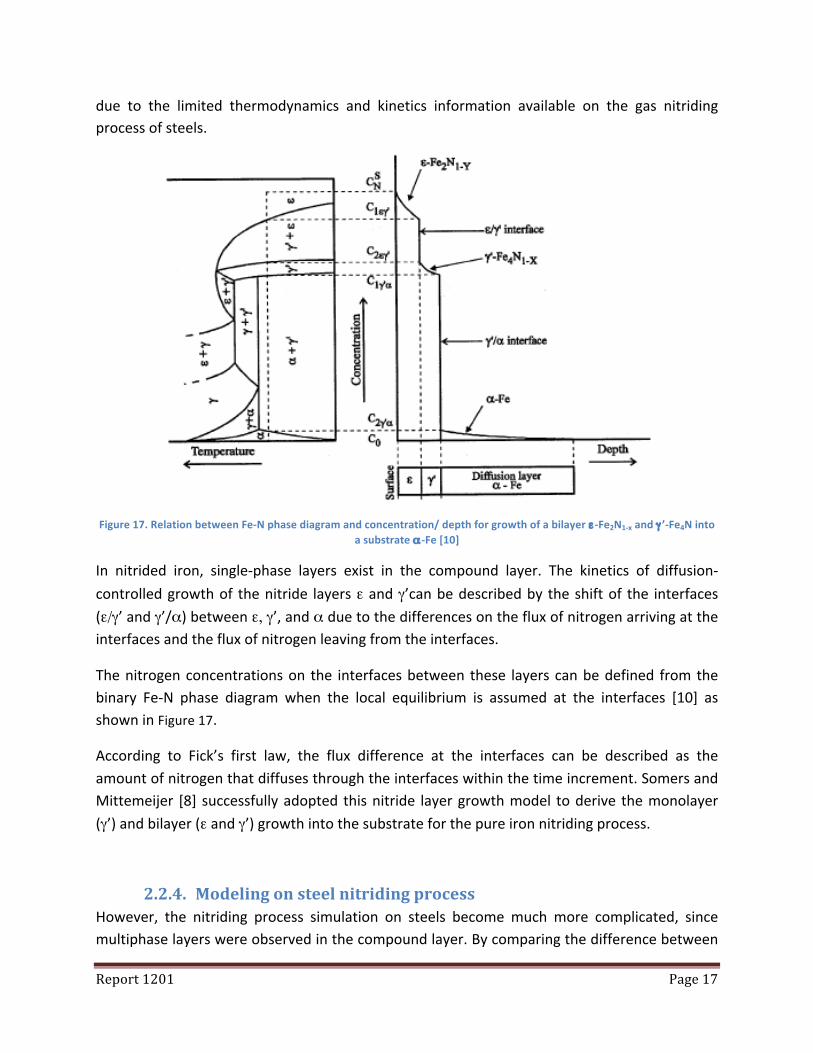
Figure 17. Relation between Fe-‐N phase diagram and concentration/ depth for growth of a bilayer ε-‐Fe2N1-‐x and γ ’-‐Fe4N into a substrate α -‐Fe [10]
In nitrided iron, single-‐phase layers exist in the compound layer. The kinetics of diffusion-‐controlled growth of the nitride layers ε and γ’can be described by the shift of the interfaces (ε/γ’ and γ’/α) between ε, γ’, and α due to the differences on the flux of nitrogen arriving at the interfaces and the flux of nitrogen leaving from the interfaces.
The nitrogen concentrations on the interfaces between these layers can be defined from the binary Fe-‐N phase diagram when the local equilibrium is assumed at the interfaces [10] as shown in Figure 17.
According to Fick’s first law, the flux difference at the interfaces can be described as the amount of nitrogen that diffuses through the interfaces within the time increment. Somers and Mittemeijer [8] successfully adopted this nitride layer growth model to derive the monolayer (γ’) and bilayer (ε and γ’) growth into the substrate for the pure iron nitriding process.
2.2.4. Modeling on steel nitriding process However, the nitriding process simulation on steels become much more complicated, since multiphase layers were observed in the compound layer. By comparing the difference between
Report 1201 Page 18
the nitrided pure iron and steel, the challenges of nitriding process simulation on steels will be presented below.
2.2.4.1. Challenges of steel nitriding process modeling
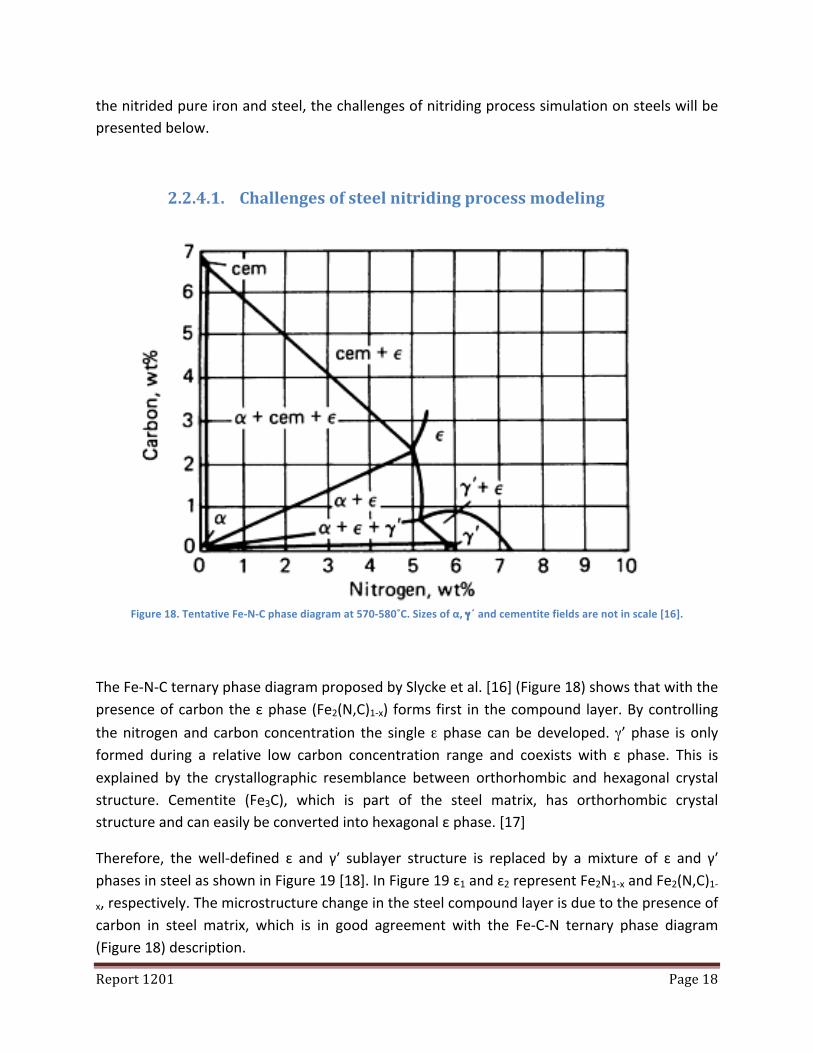
Figure 18. Tentative Fe-‐N-‐C phase diagram at 570-‐580˚C. Sizes of α, γ΄ and cementite fields are not in scale [16].
The Fe-‐N-‐C ternary phase diagram proposed by Slycke et al. [16] (Figure 18) shows that with the presence of carbon the ε phase (Fe2(N,C)1-‐x) forms first in the compound layer. By controlling the nitrogen and carbon concentration the single ε phase can be developed. γ’ phase is only formed during a relative low carbon concentration range and coexists with ε phase. This is explained by the crystallographic resemblance between orthorhombic and hexagonal crystal structure. Cementite (Fe3C), which is part of the steel matrix, has orthorhombic crystal structure and can easily be converted into hexagonal ε phase. [17]
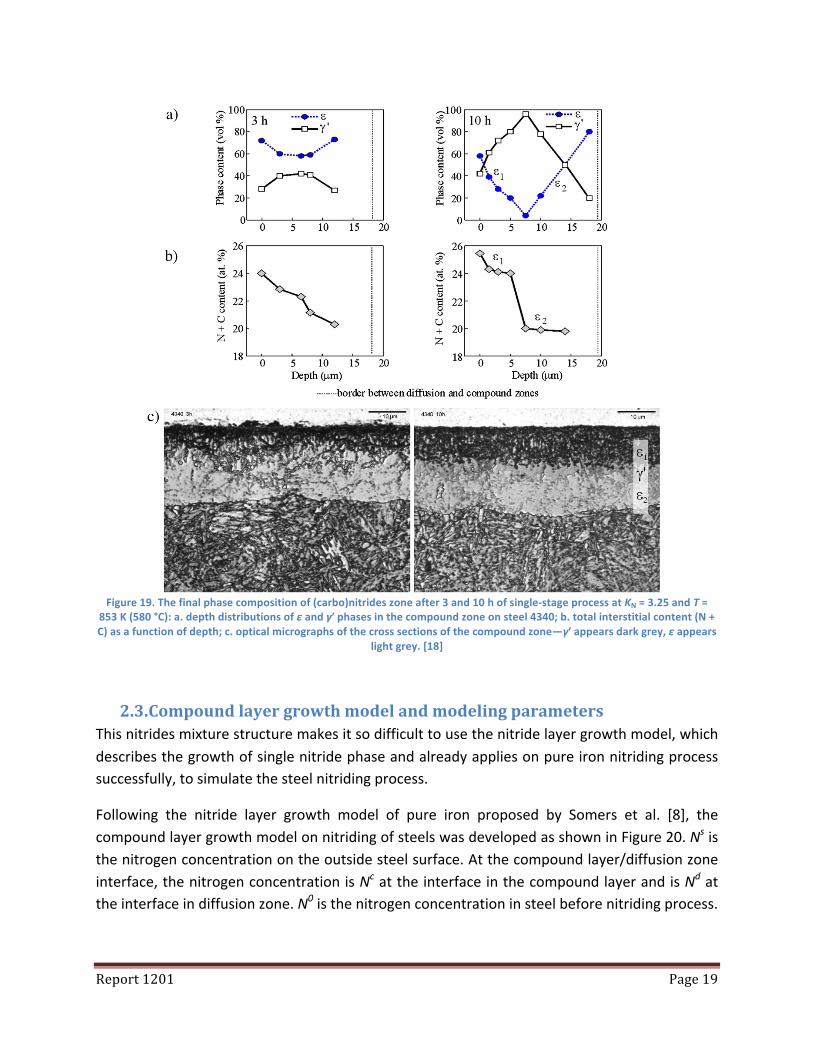
Therefore, the well-‐defined ɛ and γʹ′ sublayer structure is replaced by a mixture of ɛ and γʹ′ phases in steel as shown in Figure 19 [18]. In Figure 19 ɛ1 and ɛ2 represent Fe2N1-‐x and Fe2(N,C)1-‐x, respectively. The microstructure change in the steel compound layer is due to the presence of carbon in steel matrix, which is in good agreement with the Fe-‐C-‐N ternary phase diagram (Figure 18) description.
Report 1201 Page 19
Figure 19. The final phase composition of (carbo)nitrides zone after 3 and 10 h of single-‐stage process at KN = 3.25 and T = 853 K (580 °C): a. depth distributions of ε and γʹ′ phases in the compound zone on steel 4340; b. total interstitial content (N + C) as a function of depth; c. optical micrographs of the cross sections of the compound zone—γʹ′ appears dark grey, ε appears
light grey. [18]
2.3. Compound layer growth model and modeling parameters This nitrides mixture structure makes it so difficult to use the nitride layer growth model, which describes the growth of single nitride phase and already applies on pure iron nitriding process successfully, to simulate the steel nitriding process.
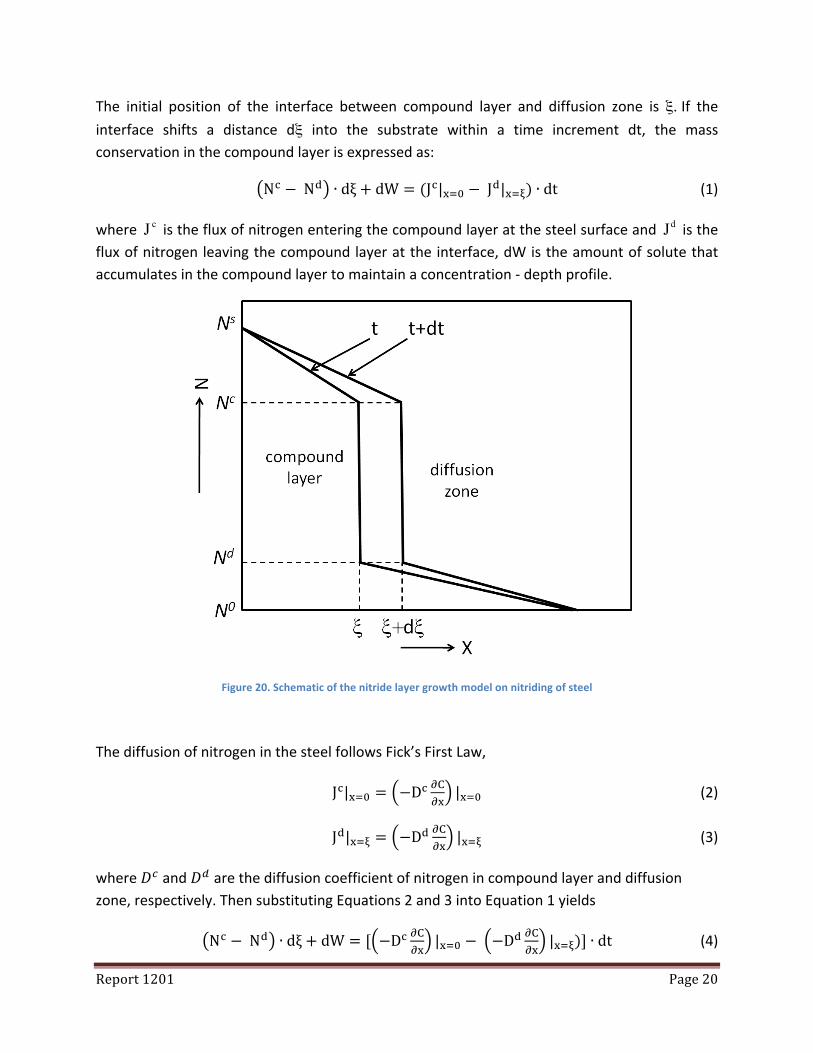
Following the nitride layer growth model of pure iron proposed by Somers et al. [8], the compound layer growth model on nitriding of steels was developed as shown in Figure 20. Ns is the nitrogen concentration on the outside steel surface. At the compound layer/diffusion zone interface, the nitrogen concentration is Nc at the interface in the compound layer and is Nd at the interface in diffusion zone. N0 is the nitrogen concentration in steel before nitriding process.
Report 1201 Page 20
The initial position of the interface between compound layer and diffusion zone is ξ. If the interface shifts a distance dξ into the substrate within a time increment dt, the mass conservation in the compound layer is expressed as:
N! − N! ∙ dξ+ dW = (J!|!!! − J!|!!!) ∙ dt (1)
where cJ is the flux of nitrogen entering the compound layer at the steel surface and dJ is the flux of nitrogen leaving the compound layer at the interface, dW is the amount of solute that accumulates in the compound layer to maintain a concentration -‐ depth profile.
Figure 20. Schematic of the nitride layer growth model on nitriding of steel
The diffusion of nitrogen in the steel follows Fick’s First Law,
J!|!!! = −D! !!!!
|!!! (2)
J!|!!! = −D! !!!!
|!!! (3)
where 𝐷! and 𝐷! are the diffusion coefficient of nitrogen in compound layer and diffusion zone, respectively. Then substituting Equations 2 and 3 into Equation 1 yields
N! − N! ∙ dξ+ dW = [ −D! !!!!
|!!! − −D!!!!!
|!!!)] ∙ dt (4)
Report 1201 Page 21
In equation 4, Ns, Nc, Nd, Dc, and Dd are the main parameters needed to be defined to simulate the nitriding process of steels.
2.3.1. Modeling parameters determination According to the compound layer growth model, there are two kinds of modeling parameters. One is boundary conditions including Ns, Nc, and Nd, the other one is the diffusivities including Dc and Dd. In the present work, AISI 4140 is chosen to show the modeling parameters determination.
2.3.1.1. Boundary conditions determination
2.3.1.1.1. Lehrer diagram The dissociation rate of ammonia or the nitriding potential is the most critical parameter to understand and control the nitriding process. The chemical potential of nitrogen μN thermodynamically defines the nitridability of the nitriding atmosphere. [19] At thermodynamic equilibrium, the chemical potential in the steel surface (µμ!,!) equals that in the nitriding
atmosphere (!!µμ!!,!). That means
!!μ!!,! = μ!,! (5)
And the chemical potential of nitrogen in the steel can be related to nitrogen activity aN by
!!μ!!,!! + !
!𝑅𝑇𝑙𝑛
!!!!!!! = μ!,!
! + 𝑅𝑇𝑙𝑛𝑎! (6)
where R is the gas constant, T is temperature, 𝑝!! is the partial pressure of nitrogen, 𝑝!!! is the
partial pressure of nitrogen at the standard state.
Since the chemical potential of nitrogen is extremely low in N2 and relatively high in ammonia, ammonia is used as the principal constituent of the nitriding atmosphere, [19] giving
𝑁𝐻! = 𝑁 + !!𝐻! (7)
where [N] represents nitrogen which is dissolved on the steel surface.
For local equilibrium between N in the gas phase and N in the steel surface the activity of nitrogen, aN, is given by:
𝑎! = 𝐾!!"!!!!!/! 𝑝!
!/! (8)
Report 1201 Page 22
where K is the equilibrium constant of reaction, 𝑝! is the total pressure, and 𝑝!"! and 𝑝!!are the partial pressures of the ammonia and hydrogen gases respectively. On the basis of eq.(4),
𝐾!!!!"!!!!!/! (9)
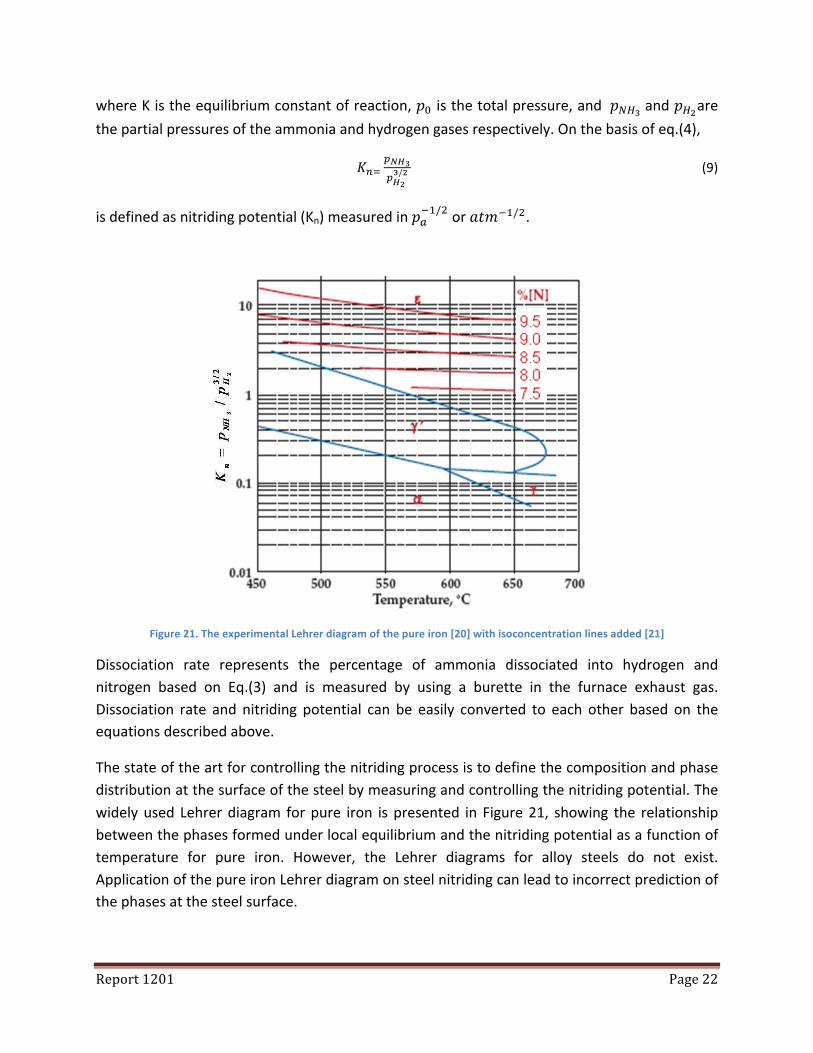
is defined as nitriding potential (Kn) measured in 𝑝!!!/! or 𝑎𝑡𝑚!!/!.
Figure 21. The experimental Lehrer diagram of the pure iron [20] with isoconcentration lines added [21]
Dissociation rate represents the percentage of ammonia dissociated into hydrogen and nitrogen based on Eq.(3) and is measured by using a burette in the furnace exhaust gas. Dissociation rate and nitriding potential can be easily converted to each other based on the equations described above.
The state of the art for controlling the nitriding process is to define the composition and phase distribution at the surface of the steel by measuring and controlling the nitriding potential. The widely used Lehrer diagram for pure iron is presented in Figure 21, showing the relationship between the phases formed under local equilibrium and the nitriding potential as a function of temperature for pure iron. However, the Lehrer diagrams for alloy steels do not exist. Application of the pure iron Lehrer diagram on steel nitriding can lead to incorrect prediction of the phases at the steel surface.
Report 1201 Page 23
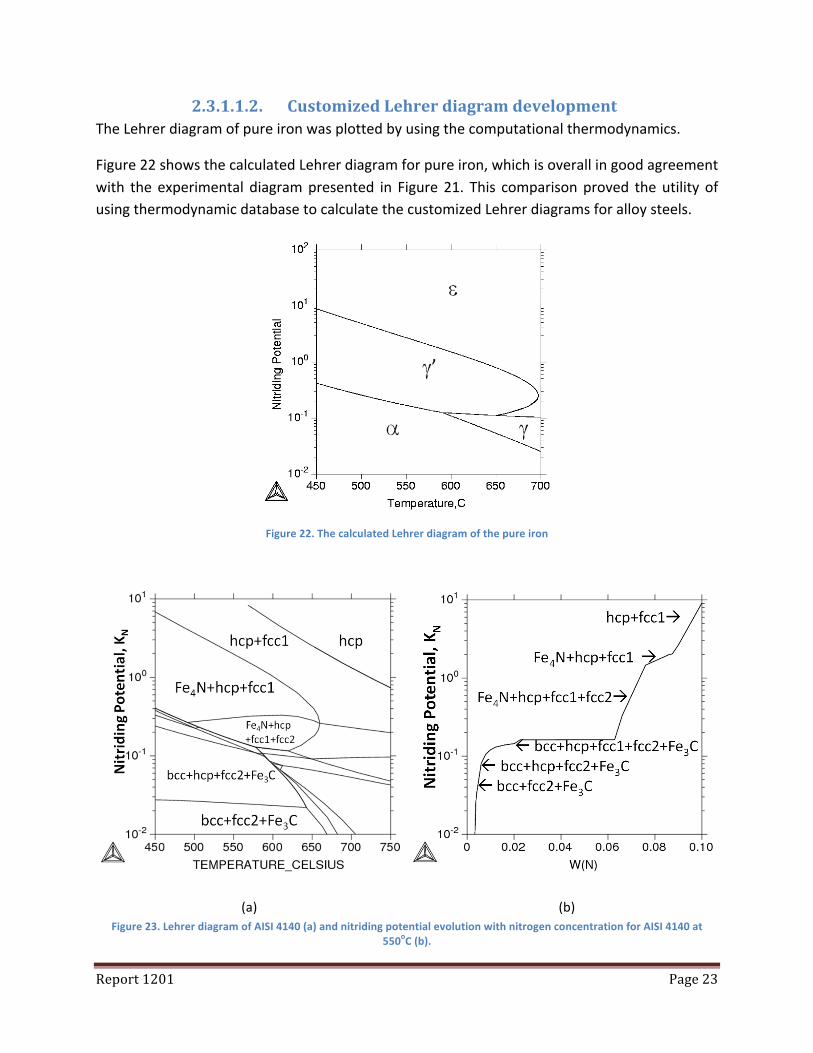
2.3.1.1.2. Customized Lehrer diagram development The Lehrer diagram of pure iron was plotted by using the computational thermodynamics.
Figure 22 shows the calculated Lehrer diagram for pure iron, which is overall in good agreement with the experimental diagram presented in Figure 21. This comparison proved the utility of using thermodynamic database to calculate the customized Lehrer diagrams for alloy steels.
Figure 22. The calculated Lehrer diagram of the pure iron
Figure 23. Lehrer diagram of AISI 4140 (a) and nitriding potential evolution with nitrogen concentration for AISI 4140 at 550oC (b).
(a) (b)
Report 1201 Page 24
With the same approach, the customized Lehrer diagram of AISI 4140 (Figure 23 (a)) has been successfully developed. The Lehrer diagram of AISI 4140 presents the phase regions corresponding to different nitriding potentials and is significantly different from Lehrer diagram of pure iron. The accuracy of the customized Lehrer diagram has been verified in the previous work.
2.3.1.1.3. Boundary conditions determination Based on this Lehrer diagram of AISI 4140, the relationship between the nitriding potential and the nitrogen concentration at fixed temperature can be calculated. Figure 23 (b) shows nitriding potential as a function of nitrogen concentration at 550°C, which is the nitriding temperature.
If the thermodynamic equilibrium between the gaseous atmosphere and the steel surface is assumed, when the nitriding potential is 8 the nitrogen concentration on the nitrided AISI 4140 surface should be equal to approximately 9.917wt.% according to this diagram.
It is also important to note the horizontal line on Figure 23 (b) when the nitrogen concentration varies from 2.3 to 6.5 wt.%N. The nitriding potential is constant along this line. According to the definition of nitriding potential as shown in Equation 8, the nitriding potential is proportional to the activity of nitrogen (N) in the steel. Therefore, constant nitriding potential corresponds to the constant nitrogen activity, which lies on the interface between the compound layer and the diffusion zone in nitrided AISI 4140 when the nitrogen concentration is between 2.3 and 6.5 wt.%N. The position of this interface on Figure 23 (b) can be verified from the phase evolution along the change of nitrogen concentration. As the diagram shows, the bcc (ferrite) doesn’t exist above the horizontal line but exists below this line. The nitrogen concentration higher than 6.5wt.%N represents the compound layer and the nitrogen concentration lower than 2.3wt.% represents the diffusion zone.
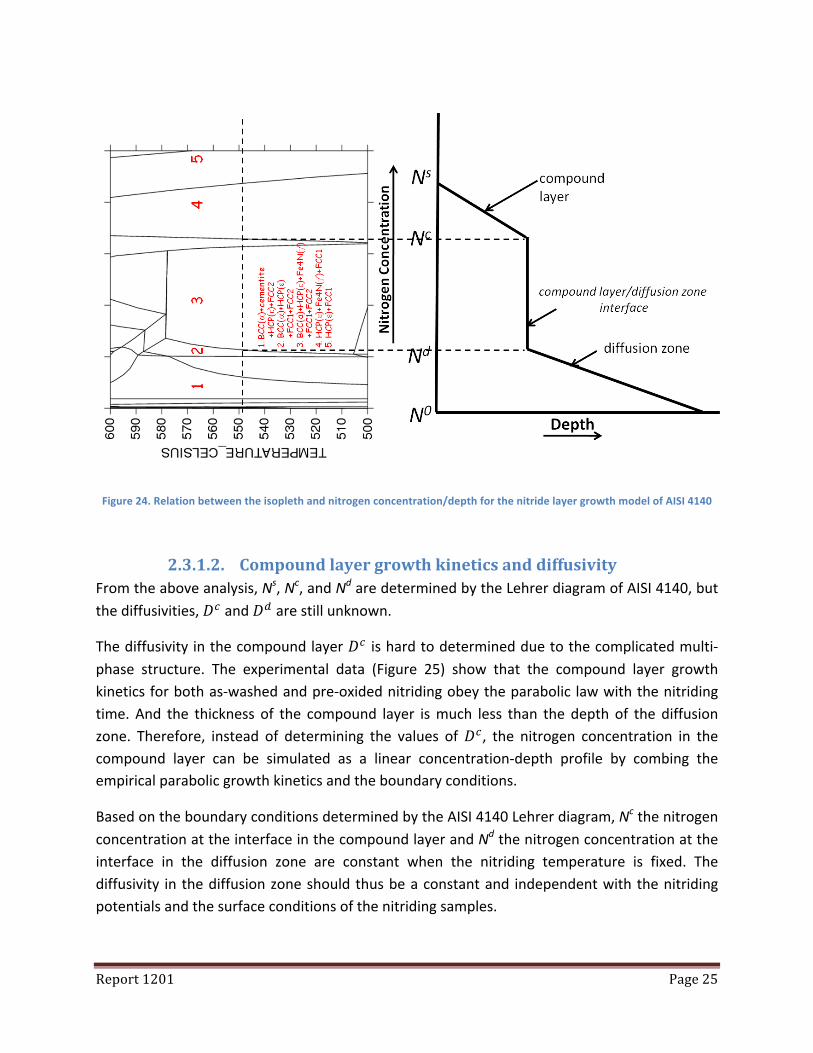
In conclusion, the boundary conditions can be defined as Ns = 9.92wt.%N. Nc = 6.5wt.%N, and Nd = 2.3wt.%N from the nitriding potential vs. nitrogen concentration diagram. Figure 24 shows the relationship between the isopleth and nitrogen concentration/depth for the compound layer growth model of AISI 4140.
Report 1201 Page 25
Figure 24. Relation between the isopleth and nitrogen concentration/depth for the nitride layer growth model of AISI 4140
2.3.1.2. Compound layer growth kinetics and diffusivity From the above analysis, Ns, Nc, and Nd are determined by the Lehrer diagram of AISI 4140, but the diffusivities, 𝐷! and 𝐷! are still unknown.
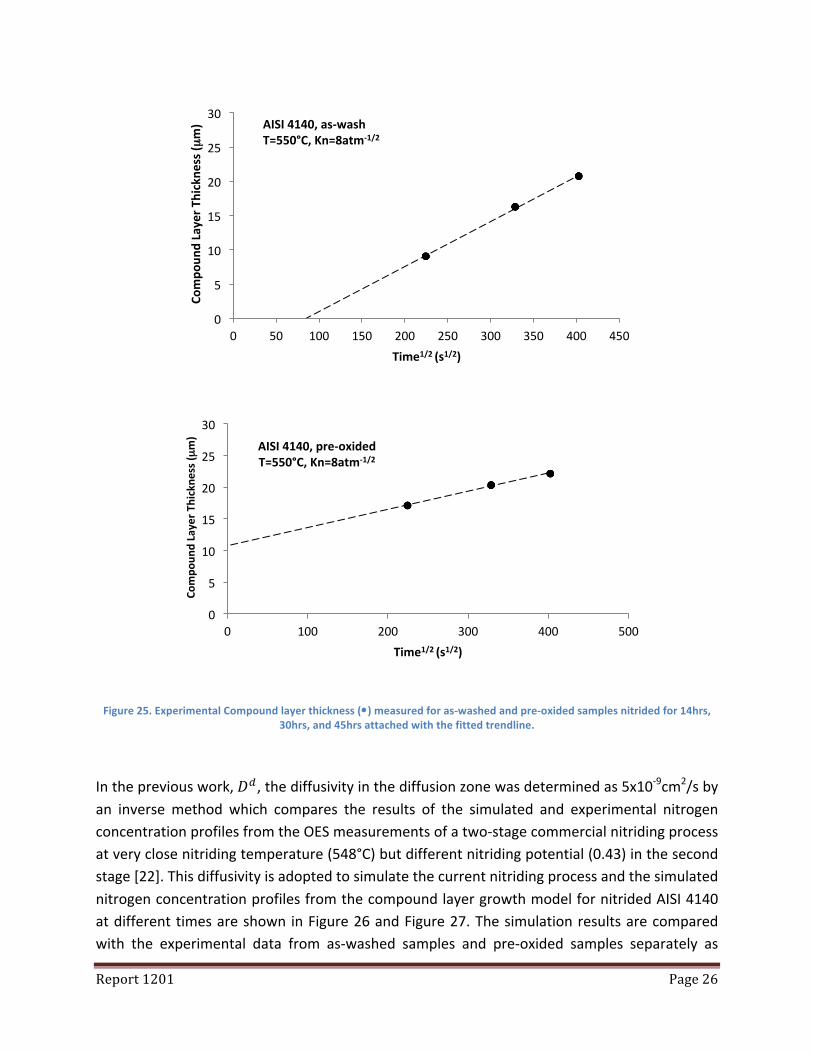
The diffusivity in the compound layer 𝐷! is hard to determined due to the complicated multi-‐phase structure. The experimental data (Figure 25) show that the compound layer growth kinetics for both as-‐washed and pre-‐oxided nitriding obey the parabolic law with the nitriding time. And the thickness of the compound layer is much less than the depth of the diffusion zone. Therefore, instead of determining the values of 𝐷!, the nitrogen concentration in the compound layer can be simulated as a linear concentration-‐depth profile by combing the empirical parabolic growth kinetics and the boundary conditions.
Based on the boundary conditions determined by the AISI 4140 Lehrer diagram, Nc the nitrogen concentration at the interface in the compound layer and Nd the nitrogen concentration at the interface in the diffusion zone are constant when the nitriding temperature is fixed. The diffusivity in the diffusion zone should thus be a constant and independent with the nitriding potentials and the surface conditions of the nitriding samples.
Report 1201 Page 26
Figure 25. Experimental Compound layer thickness (•) measured for as-‐washed and pre-‐oxided samples nitrided for 14hrs, 30hrs, and 45hrs attached with the fitted trendline.
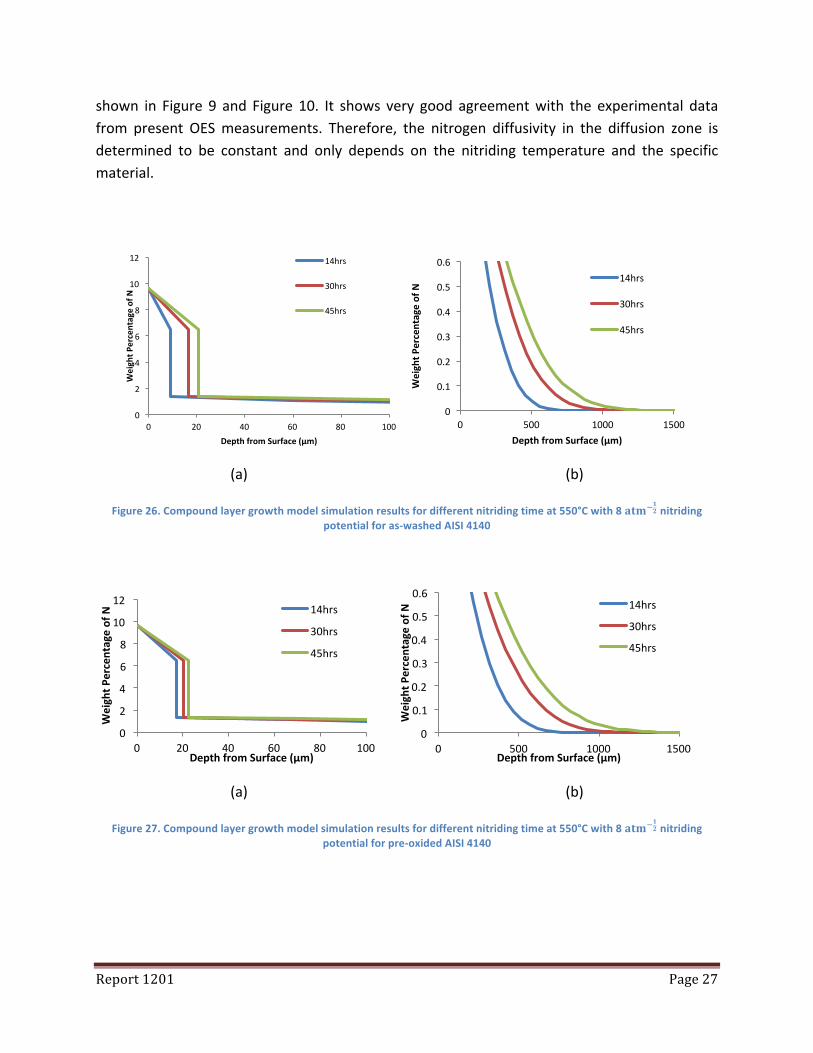
In the previous work, 𝐷!, the diffusivity in the diffusion zone was determined as 5x10-‐9cm2/s by an inverse method which compares the results of the simulated and experimental nitrogen concentration profiles from the OES measurements of a two-‐stage commercial nitriding process at very close nitriding temperature (548°C) but different nitriding potential (0.43) in the second stage [22]. This diffusivity is adopted to simulate the current nitriding process and the simulated nitrogen concentration profiles from the compound layer growth model for nitrided AISI 4140 at different times are shown in Figure 26 and Figure 27. The simulation results are compared with the experimental data from as-‐washed samples and pre-‐oxided samples separately as
0
5
10
15
20
25
30
0 50 100 150 200 250 300 350 400 450
Com
poun
d Layer T
hickne
ss (µ
m)
Time1/2 (s1/2)
AISI 4140, as-‐wash T=550°C, Kn=8atm-‐1/2
AISI 4140, pre-‐oxided T=550°C, Kn=8atm-‐1/2
0
5
10
15
20
25
30
0 100 200 300 400 500
Com
poun
d Layer T
hickne
ss (µ
m)
Time1/2 (s1/2)
Report 1201 Page 27
shown in Figure 9 and Figure 10. It shows very good agreement with the experimental data from present OES measurements. Therefore, the nitrogen diffusivity in the diffusion zone is determined to be constant and only depends on the nitriding temperature and the specific material.
(a) (b)
Figure 26. Compound layer growth model simulation results for different nitriding time at 550°C with 8 𝐚𝐭𝐦!𝟏𝟐 nitriding potential for as-‐washed AISI 4140
(a) (b)
Figure 27. Compound layer growth model simulation results for different nitriding time at 550°C with 8 𝐚𝐭𝐦!𝟏𝟐 nitriding potential for pre-‐oxided AISI 4140
0
2
4
6
8
10
12
0 20 40 60 80 100
Weight P
ercentage of N
Depth from Surface (µm)
14hrs
30hrs
45hrs
0
0.1
0.2
0.3
0.4
0.5
0.6
0 500 1000 1500 Weight P
ercentage of N
Depth from Surface (µm)
14hrs
30hrs
45hrs
0
2
4
6
8
10
12
0 20 40 60 80 100
Weight P
ercentage of N
Depth from Surface (µm)
14hrs
30hrs
45hrs
0
0.1
0.2
0.3
0.4
0.5
0.6
0 500 1000 1500
Weight P
ercentage of N
Depth from Surface (µm)
14hrs
30hrs
45hrs
Report 1201 Page 28
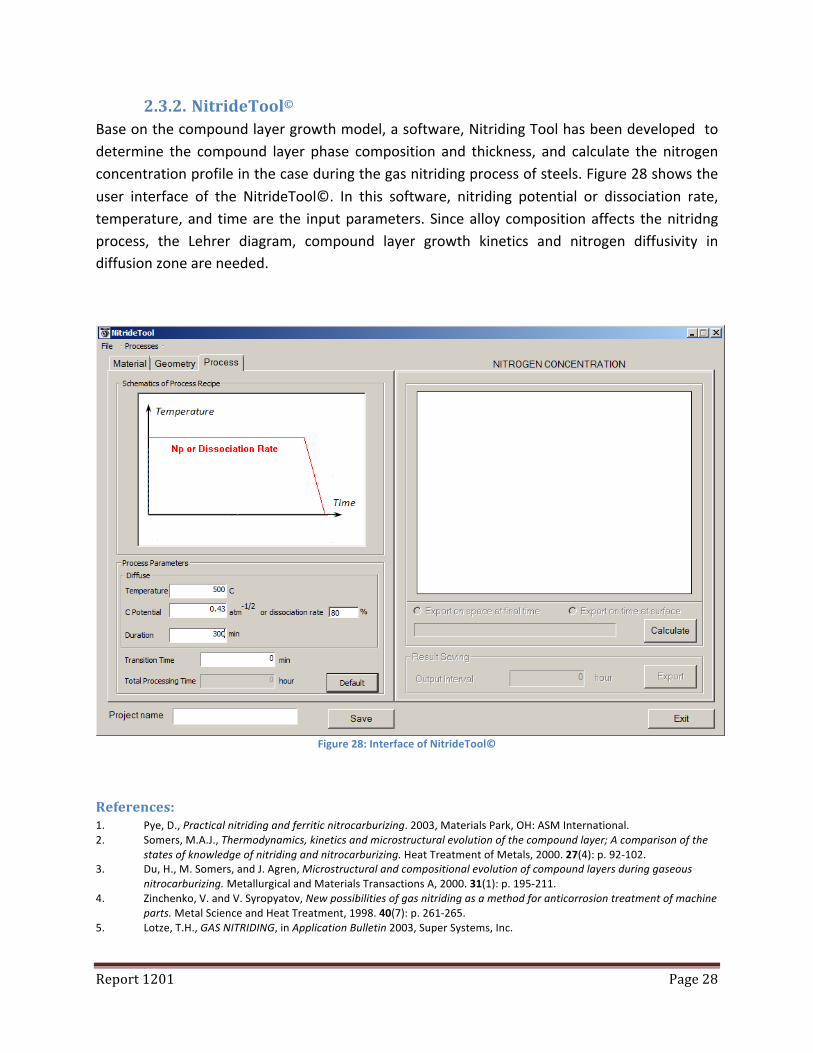
2.3.2. NitrideTool© Base on the compound layer growth model, a software, Nitriding Tool has been developed to determine the compound layer phase composition and thickness, and calculate the nitrogen concentration profile in the case during the gas nitriding process of steels. Figure 28 shows the user interface of the NitrideTool©. In this software, nitriding potential or dissociation rate, temperature, and time are the input parameters. Since alloy composition affects the nitridng process, the Lehrer diagram, compound layer growth kinetics and nitrogen diffusivity in diffusion zone are needed.
Figure 28: Interface of NitrideTool©
References: 1. Pye, D., Practical nitriding and ferritic nitrocarburizing. 2003, Materials Park, OH: ASM International. 2. Somers, M.A.J., Thermodynamics, kinetics and microstructural evolution of the compound layer; A comparison of the
states of knowledge of nitriding and nitrocarburizing. Heat Treatment of Metals, 2000. 27(4): p. 92-‐102. 3. Du, H., M. Somers, and J. Agren, Microstructural and compositional evolution of compound layers during gaseous
nitrocarburizing. Metallurgical and Materials Transactions A, 2000. 31(1): p. 195-‐211. 4. Zinchenko, V. and V. Syropyatov, New possibilities of gas nitriding as a method for anticorrosion treatment of machine
parts. Metal Science and Heat Treatment, 1998. 40(7): p. 261-‐265. 5. Lotze, T.H., GAS NITRIDING, in Application Bulletin 2003, Super Systems, Inc.
Report 1201 Page 29
6. Lohrmann, M., Improved nitriding and nitrocarburizing atmosphere control with the HydroNit sensor Heat Treatment of Metals, 2001(3): p. 53-‐55.
7. Maldzinski, L., et al., New possibilities for controlling gas nitriding process by simulation of growth kinetics of nitride layers. Surface Engineering, 1999. 15(5): p. 377-‐384.
8. Somers, M.A.J. and E.J. Mittemeijer, Layer-‐Growth Kinetics on Gaseous Nitriding of Pure Iron -‐ Evaluation of Diffusion-‐Coefficients for Nitrogen in Iron Nitrides. Metallurgical and Materials Transactions a-‐Physical Metallurgy and Materials Science, 1995. 26(1): p. 57-‐74.
9. Somers, M.A.J. and E.J. Mittemeijer, Modeling the Kinetics of the Nitriding and Nitrocarburizing of Iron. Heat Treating 1997: Proceedings of the 17th Conference (ASM International), 2000. 15-‐18(3): p. 321-‐330.
10. Torchane, L., et al., Control of iron nitride layers growth kinetics in the binary Fe-‐N system. Metallurgical and Materials Transactions a-‐Physical Metallurgy and Materials Science, 1996. 27(7): p. 1823-‐1835.
11. Boggs, W.E., R.H. Kachik, and G.E. Pellissier, The Effect of Oxygen Pressure on the Oxidation of Zone-‐Refined Iron. Journal of The Electrochemical Society, 1965. 112(6): p. 539-‐546.
12. Yang, M., et al. (private communication, 2011). 13. Handbook, A.S.M., Alloy Phase Diagrams. 1992, ASM: Metals Park, OH. 14. Tatiana, L., Phase transformations in interstitial Fe-‐N alloys. 2005. p. 52. 15. Somers, M.A.J., Härt.-‐Tech. Mitt., 1991. 46: p. 375. 16. Slycke, J.S.L.A.J., Nitrocarburizing and the ternary Fe-‐N-‐C phase diagram. Scand. J. Metal., 1988. 17(3): p. 122. 17. Mittemeijer, E.J., et al., The Conversion Cementite -‐ > Epsilon-‐Nitride During the Nitriding of FeC Alloys Scr. Metall. ,
1980. 14(11): p. 1189-‐1192. 18. Ratajski, J., J. Tacikowski, and M.A.J. Somers, Development of compound layer of iron (carbo)nitrides during nitriding
of steel. Surface Engineering, 2003. 19(4): p. 285-‐291. 19. Mittemeijer, E.J. and J.T. Slycke, Chemical potentials and activities of nitrogen and carbon imposed by gaseous
nitriding and carburizing atmosphere. Surface Engineering, 1996. 12(2): p. 152-‐162 20. Lehrer, E., The equilibrium, iron-‐hydrogen-‐ammonia. Zeitschrift fuer Elektrochemie und Angewandte Physikalische
Chemie, 1930. 36: p. 383. 21. Maldzinski L., P.Z., Kunze L., Equilibrium Between NH3/H2 and Nitrogen in ε Phase of Iron-‐Nitrogen System. Steel
Research, 1986. 12: p. 645-‐649. 22. Yang, M. and R.D.S. Jr., Modeling the Nitriding of Steel by Compound Layer Growth Model. Materials Performance and
Characterization, 2012. 1(1): p. 1-‐10.

Report 1201 Page 30
Appendix A Experimenal Data for steels nitrided at 550oC
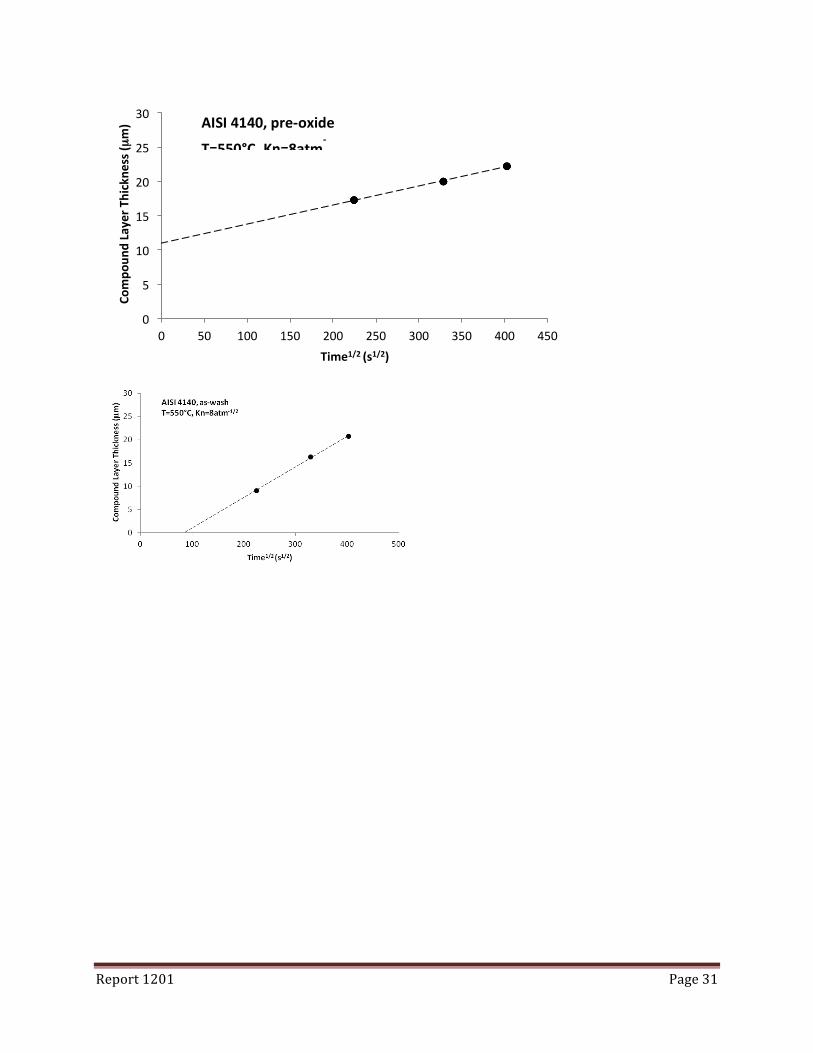
Figure A-‐ 1. Weight gain of nitrided samples, including pre-‐oxided and as-‐washed AISI 4140, AISI 5130, CAT 135, and H13 for three different nitriding process times, 14hrs, 30hrs, and 45hrs.
Figure A-‐ 2. Flux of nitrided samples, including pre-‐oxided and as-‐washed AISI 4140, AISI 5130, CAT 135, and H13 for three different nitriding process times, 14hrs, 30hrs, and 45hrs.
0.0E+00
2.0E-‐05
4.0E-‐05
6.0E-‐05
8.0E-‐05
1.0E-‐04
1.2E-‐04
1.4E-‐04
1.6E-‐04
10 15 20 25 30 35 40 45 50
Weight G
ain (kg)
Time (hour)
4140(Pre-‐oxide)
4140(As-‐wash)
5130(Pre-‐oxide)
5130(As-‐wash)
135(Pre-‐oxide)
135(As-‐wash)
H13(pre-‐oxide)
H13(As-‐wash)
0.0E+00
1.0E-‐07
2.0E-‐07
3.0E-‐07
4.0E-‐07
5.0E-‐07
6.0E-‐07
7.0E-‐07
8.0E-‐07
3.5 4 4.5 5 5.5 6 6.5 7
Flux
Time1/2 (hour1/2)
4140(Pre-‐oxide) 4140(As-‐wash) 5130(Pre-‐oxide) 5130(As-‐wash) 135(Pre-‐oxide) 135(As-‐wash) H13(pre-‐oxide) H13(As-‐wash)
Report 1201 Page 31
0
5
10
15
20
25
30
0 50 100 150 200 250 300 350 400 450
Com
poun
d Layer T
hickne
ss (µ
m)
Time1/2 (s1/2)
AISI 4140, pre-‐oxide T=550°C, Kn=8atm
-‐
Report 1201 Page 32
0
5
10
15
20
25
30
35
40
45
0 50 100 150 200 250 300 350 400 450
Com
poun
d Layer T
hickne
ss (µ
m)
Time1/2 (s1/2)
CAT 135, pre-‐oxide T=550°C, Kn=8atm
-‐
Report 1201 Page 33
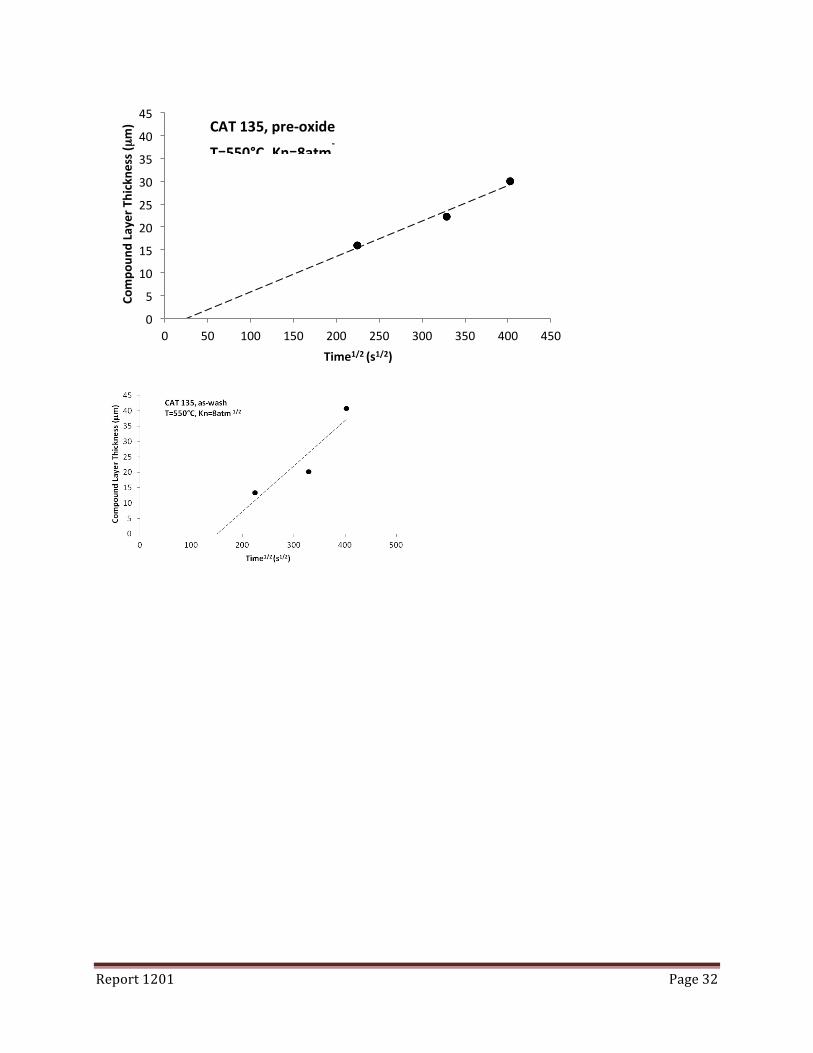
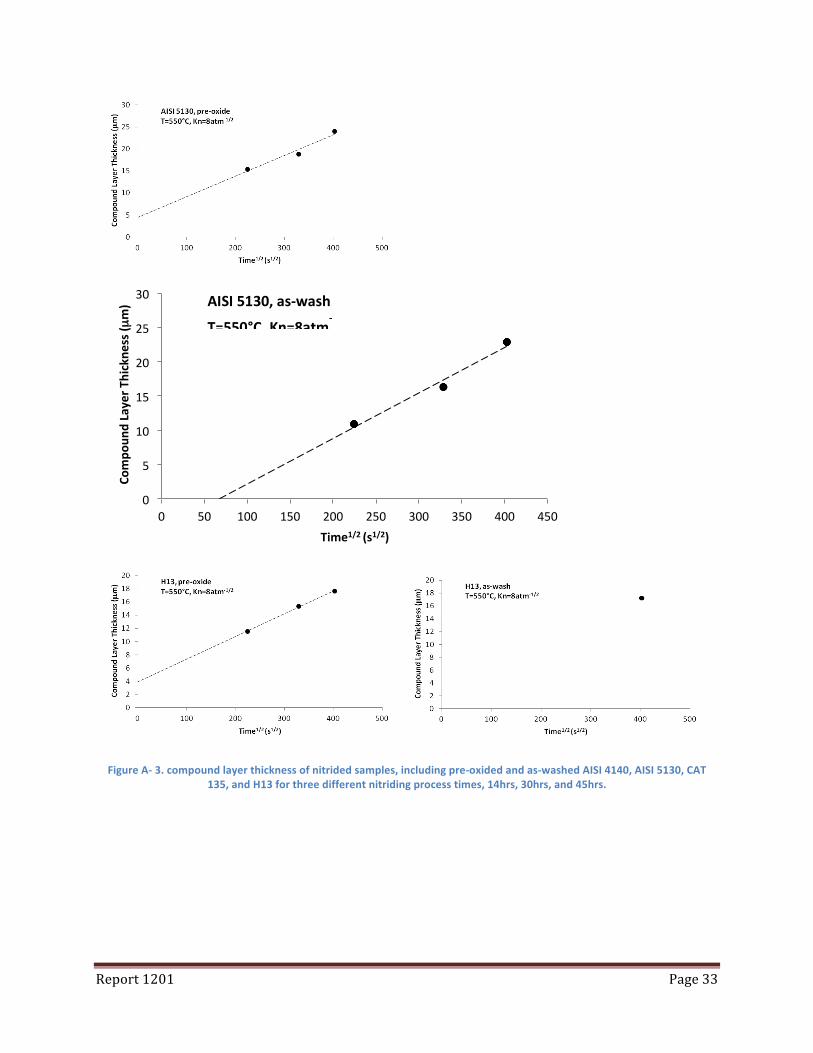
Figure A-‐ 3. compound layer thickness of nitrided samples, including pre-‐oxided and as-‐washed AISI 4140, AISI 5130, CAT 135, and H13 for three different nitriding process times, 14hrs, 30hrs, and 45hrs.
0
5
10
15
20
25
30
0 50 100 150 200 250 300 350 400 450
Com
poun
d Layer T
hickne
ss (µ
m)
Time1/2 (s1/2)
AISI 5130, as-‐wash T=550°C, Kn=8atm
-‐
Report 1201 Page 34
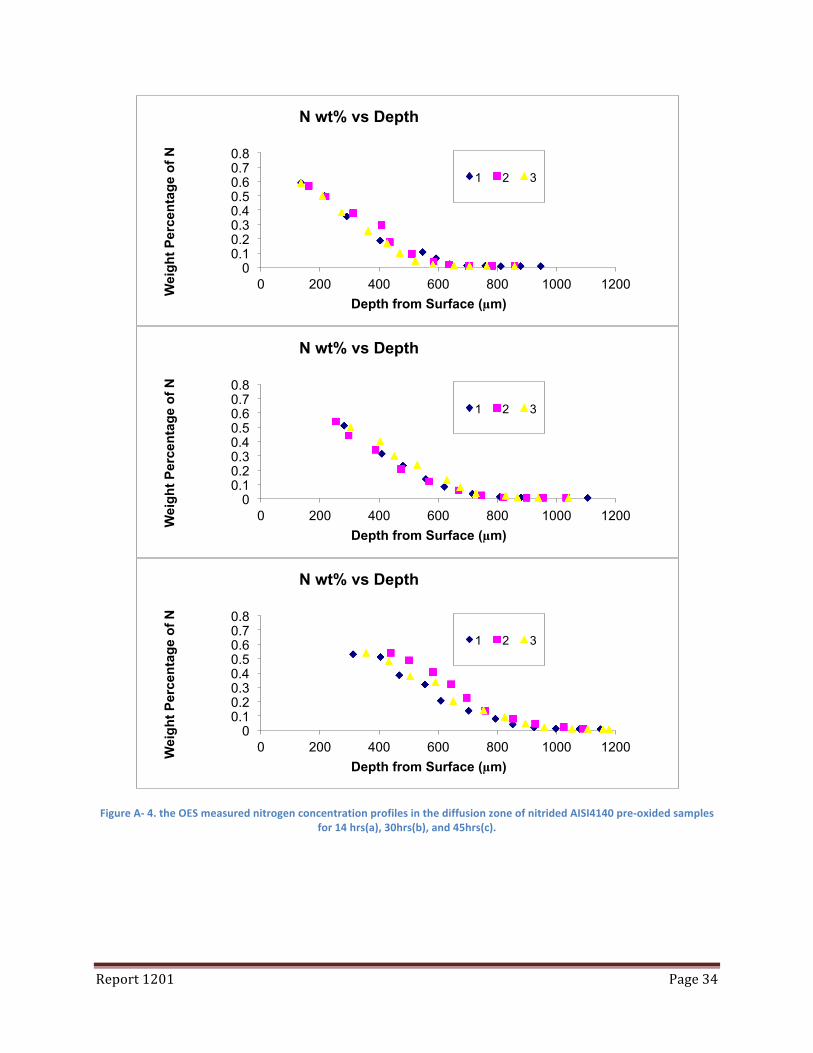
Figure A-‐ 4. the OES measured nitrogen concentration profiles in the diffusion zone of nitrided AISI4140 pre-‐oxided samples for 14 hrs(a), 30hrs(b), and 45hrs(c).
0 0.1 0.2 0.3 0.4 0.5 0.6 0.7 0.8
0 200 400 600 800 1000 1200 Wei
ght P
erce
ntag
e of
N
Depth from Surface (µm)
N wt% vs Depth
1 2 3
0 0.1 0.2 0.3 0.4 0.5 0.6 0.7 0.8
0 200 400 600 800 1000 1200 Wei
ght P
erce
ntag
e of
N
Depth from Surface (µm)
N wt% vs Depth
1 2 3
0 0.1 0.2 0.3 0.4 0.5 0.6 0.7 0.8
0 200 400 600 800 1000 1200 Wei
ght P
erce
ntag
e of
N
Depth from Surface (µm)
N wt% vs Depth
1 2 3

Report 1201 Page 35
Figure A-‐ 5. the OES measured nitrogen concentration profiles in the diffusion zone of nitrided AISI4140 as-‐washed samples
for 14 hrs(a), 30hrs(b), and 45hrs(c).
0
0.2
0.4
0.6
0.8
0 200 400 600 800 1000 1200
Wei
ght P
erce
ntag
e of
N
Depth from Surface (µm)
N wt% vs Depth
1 2 3
0 0.1 0.2 0.3 0.4 0.5 0.6 0.7 0.8
0 200 400 600 800 1000 1200
Wei
ght P
erce
ntag
e of
N
Depth from Surface (µm)
N wt% vs Depth
1 2 3
0 0.1 0.2 0.3 0.4 0.5 0.6 0.7 0.8
0 200 400 600 800 1000 1200
Wei
ght P
erce
ntag
e of
N
Depth from Surface (µm)
N wt% vs Depth
1 2 3
Report 1201 Page 36
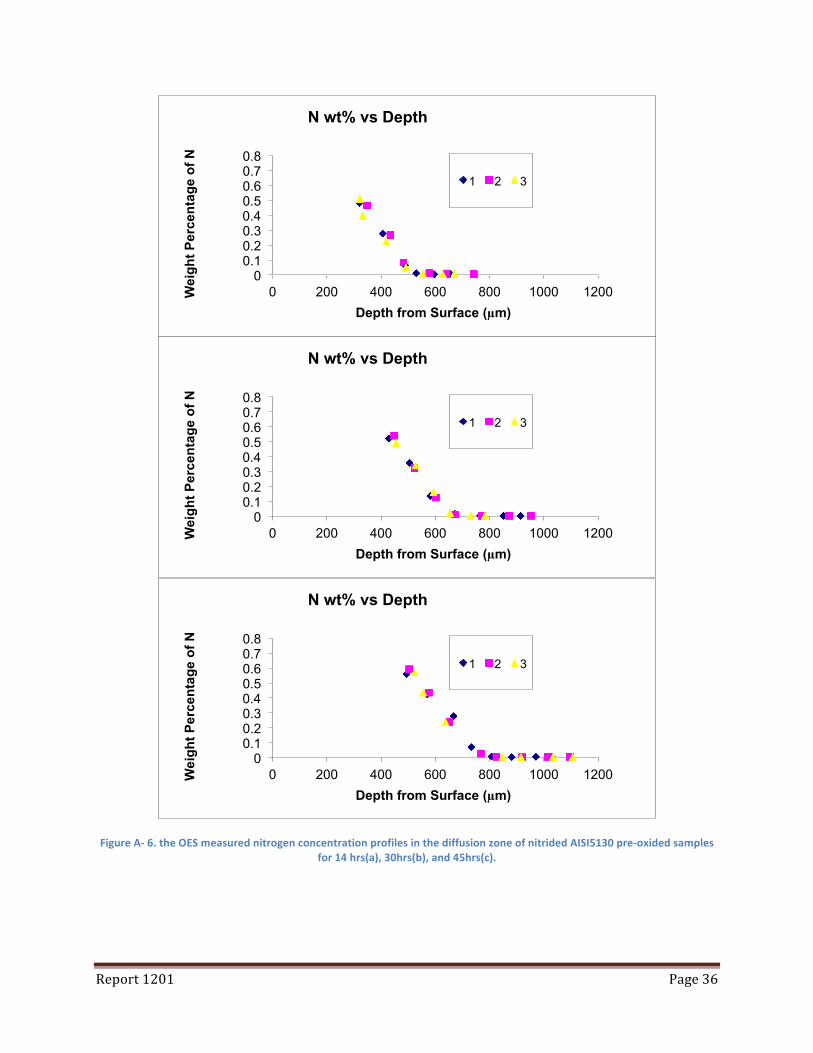
Figure A-‐ 6. the OES measured nitrogen concentration profiles in the diffusion zone of nitrided AISI5130 pre-‐oxided samples for 14 hrs(a), 30hrs(b), and 45hrs(c).
0 0.1 0.2 0.3 0.4 0.5 0.6 0.7 0.8
0 200 400 600 800 1000 1200 Wei
ght P
erce
ntag
e of
N
Depth from Surface (µm)
N wt% vs Depth
1 2 3
0 0.1 0.2 0.3 0.4 0.5 0.6 0.7 0.8
0 200 400 600 800 1000 1200 Wei
ght P
erce
ntag
e of
N
Depth from Surface (µm)
N wt% vs Depth
1 2 3
0 0.1 0.2 0.3 0.4 0.5 0.6 0.7 0.8
0 200 400 600 800 1000 1200 Wei
ght P
erce
ntag
e of
N
Depth from Surface (µm)
N wt% vs Depth
1 2 3
Report 1201 Page 37
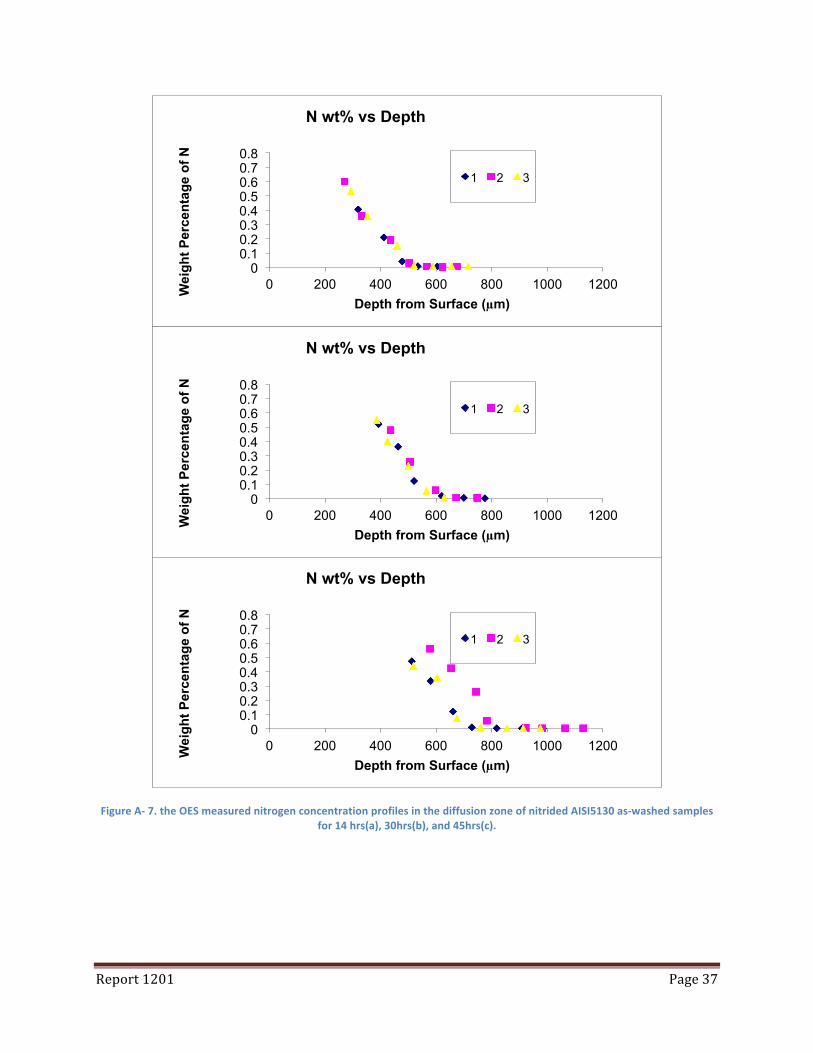
Figure A-‐ 7. the OES measured nitrogen concentration profiles in the diffusion zone of nitrided AISI5130 as-‐washed samples for 14 hrs(a), 30hrs(b), and 45hrs(c).
0 0.1 0.2 0.3 0.4 0.5 0.6 0.7 0.8
0 200 400 600 800 1000 1200 Wei
ght P
erce
ntag
e of
N
Depth from Surface (µm)
N wt% vs Depth
1 2 3
0 0.1 0.2 0.3 0.4 0.5 0.6 0.7 0.8
0 200 400 600 800 1000 1200 Wei
ght P
erce
ntag
e of
N
Depth from Surface (µm)
N wt% vs Depth
1 2 3
0 0.1 0.2 0.3 0.4 0.5 0.6 0.7 0.8
0 200 400 600 800 1000 1200 Wei
ght P
erce
ntag
e of
N
Depth from Surface (µm)
N wt% vs Depth
1 2 3
Report 1201 Page 38
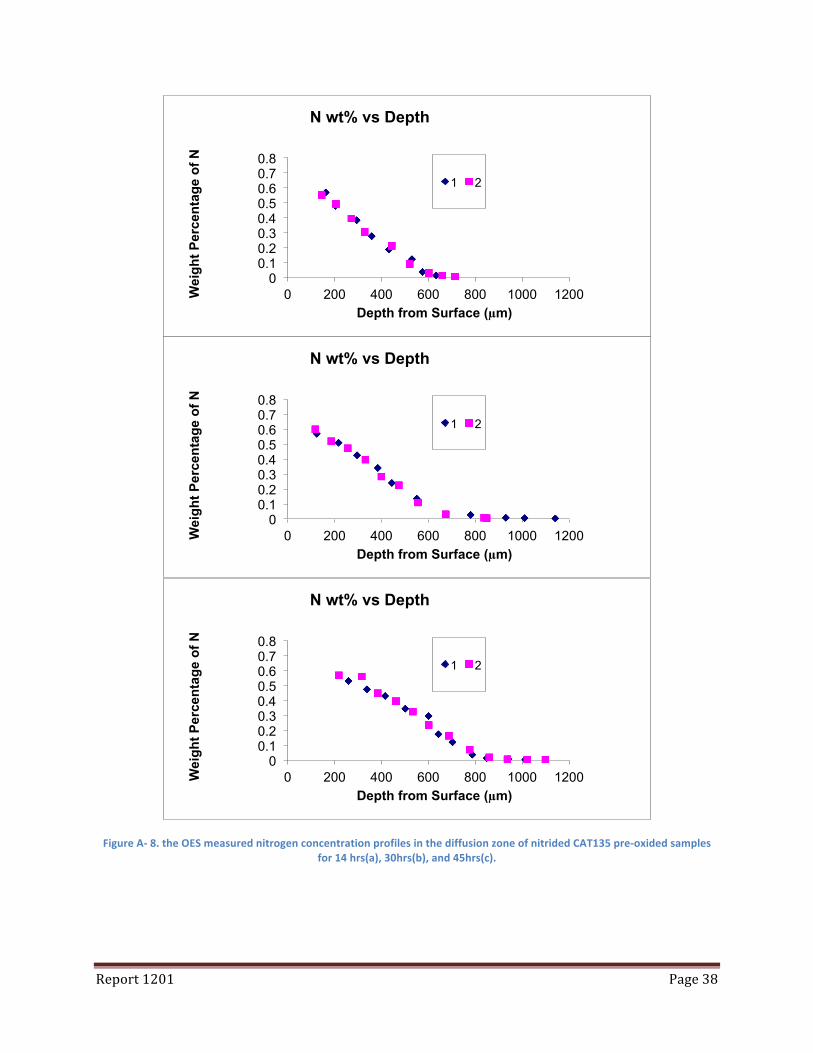
Figure A-‐ 8. the OES measured nitrogen concentration profiles in the diffusion zone of nitrided CAT135 pre-‐oxided samples for 14 hrs(a), 30hrs(b), and 45hrs(c).
0 0.1 0.2 0.3 0.4 0.5 0.6 0.7 0.8
0 200 400 600 800 1000 1200 Wei
ght P
erce
ntag
e of
N
Depth from Surface (µm)
N wt% vs Depth
1 2
0 0.1 0.2 0.3 0.4 0.5 0.6 0.7 0.8
0 200 400 600 800 1000 1200 Wei
ght P
erce
ntag
e of
N
Depth from Surface (µm)
N wt% vs Depth
1 2
0 0.1 0.2 0.3 0.4 0.5 0.6 0.7 0.8
0 200 400 600 800 1000 1200 Wei
ght P
erce
ntag
e of
N
Depth from Surface (µm)
N wt% vs Depth
1 2
Report 1201 Page 39
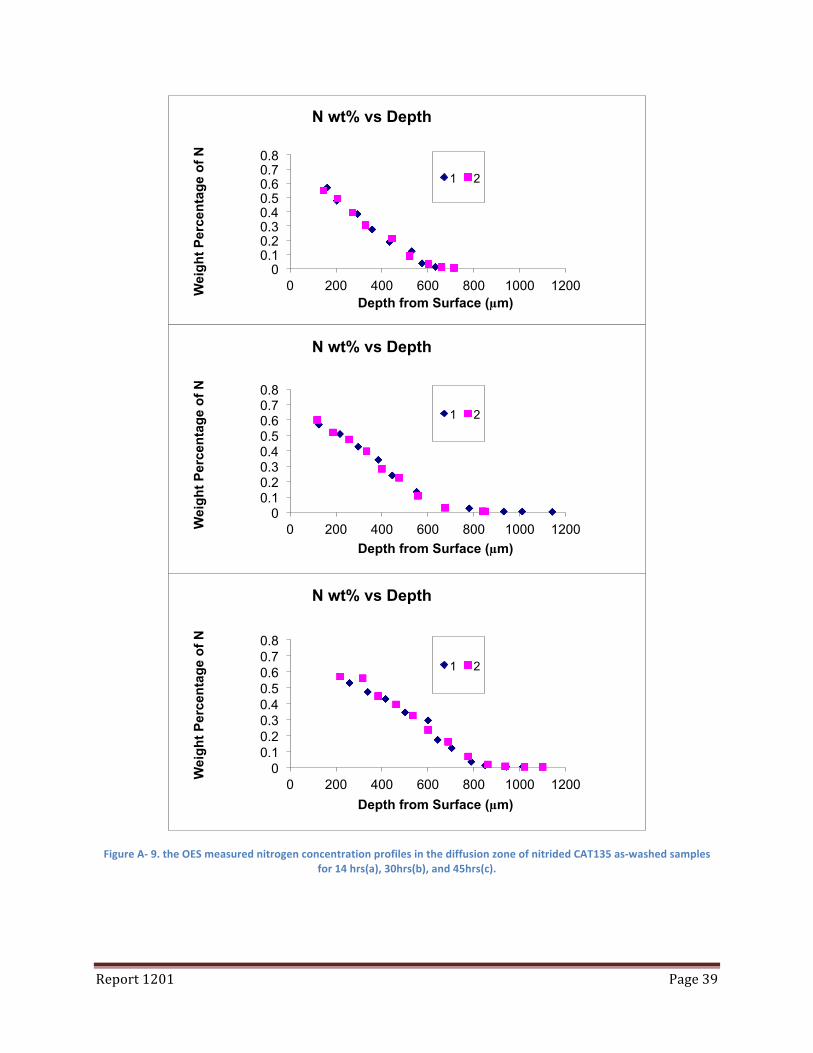
Figure A-‐ 9. the OES measured nitrogen concentration profiles in the diffusion zone of nitrided CAT135 as-‐washed samples for 14 hrs(a), 30hrs(b), and 45hrs(c).
0 0.1 0.2 0.3 0.4 0.5 0.6 0.7 0.8
0 200 400 600 800 1000 1200 Wei
ght P
erce
ntag
e of
N
Depth from Surface (µm)
N wt% vs Depth
1 2
0 0.1 0.2 0.3 0.4 0.5 0.6 0.7 0.8
0 200 400 600 800 1000 1200 Wei
ght P
erce
ntag
e of
N
Depth from Surface (µm)
N wt% vs Depth
1 2
0 0.1 0.2 0.3 0.4 0.5 0.6 0.7 0.8
0 200 400 600 800 1000 1200
Wei
ght P
erce
ntag
e of
N
Depth from Surface (µm)
N wt% vs Depth
1 2

Report 1201 Page 40
Figure A-‐ 10. The microhardness of nitrided samples, including pre-‐oxided and as-‐washed AISI 4140, AISI 5130, CAT 135, and H13 for three different nitriding process times, 14hrs, 30hrs, and 45hrs.
300
350
400
450
500
550
600
650
0 500 1000 1500 2000
14hours
30hours
45hours
AISI 4140, 550℃, KN 8, As-washed
Har
dnes
s (H
V)
Depth from surface (um)
300
350
400
450
500
550
600
650
0 500 1000 1500 2000
14hours
30hours
45hours
AISI 4140, 550℃, KN 8, Pre-oxided
Depth from surface (um)
Har
dnes
s (H
V)
300 350 400 450 500 550 600 650 700
0 500 1000 1500 2000
14hours
30hours
45hours
Har
dnes
s (H
V)
Depth from surface (um)
AISI 5130, 550℃, KN 8, As-washed
300 350 400 450 500 550 600 650 700
0 500 1000 1500 2000
14hours 30hours 45hours
Har
dnes
s (H
V)
Depth from surface (um)
AISI 5130, 550℃, KN 8, Pre-oxided
300
350
400
450
500
550
600
0 200 400 600 800 1,000 1,200
Hardne
ss (H
V)
Depth (μm)
CAT 135, 550C, KN 8, As-‐wash
14 hours 30 hours 45 hours
300
350
400
450
500
550
600
0 200 400 600 800 1,000 1,200
Hardne
ss (H
V)
Depth (μm)
CAT 135, 550C, KN 8, Pre-‐oxide
14 hours 30 hours 45 hours
Report 1201 Page 41
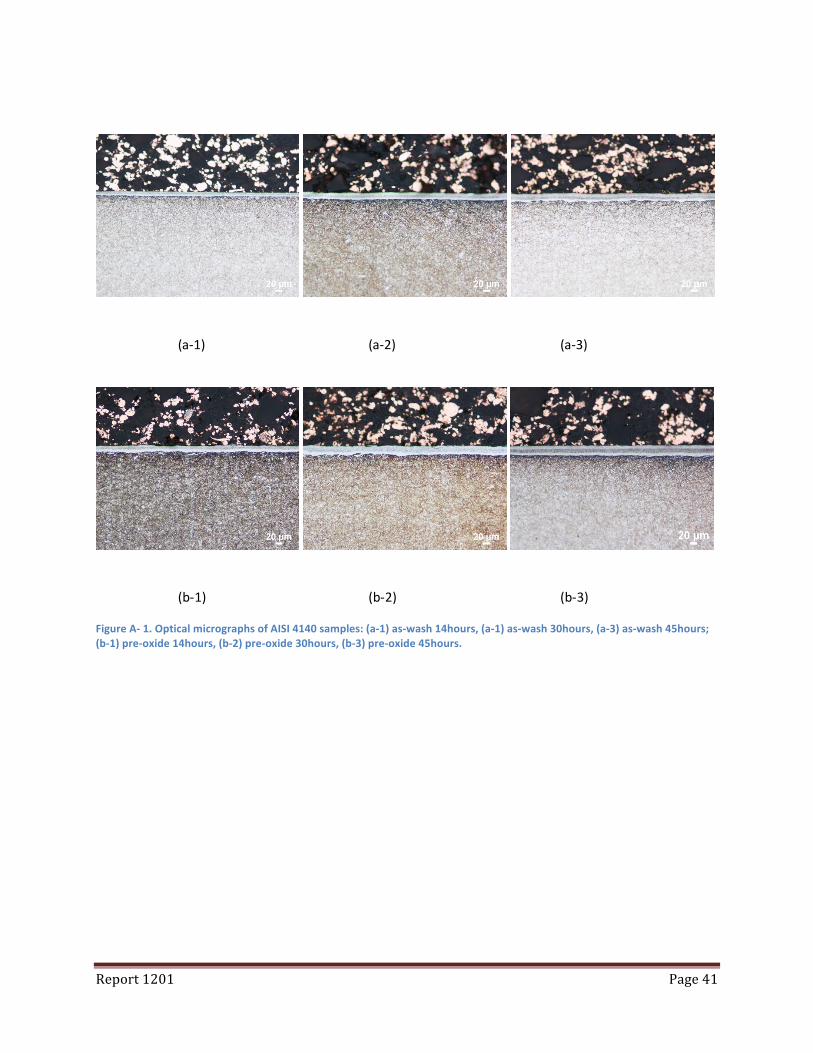
Figure A-‐ 1. Optical micrographs of AISI 4140 samples: (a-‐1) as-‐wash 14hours, (a-‐1) as-‐wash 30hours, (a-‐3) as-‐wash 45hours; (b-‐1) pre-‐oxide 14hours, (b-‐2) pre-‐oxide 30hours, (b-‐3) pre-‐oxide 45hours.
(a-‐1) (a-‐2) (a-‐3)
(b-‐1) (b-‐2) (b-‐3)
Report 1201 Page 42
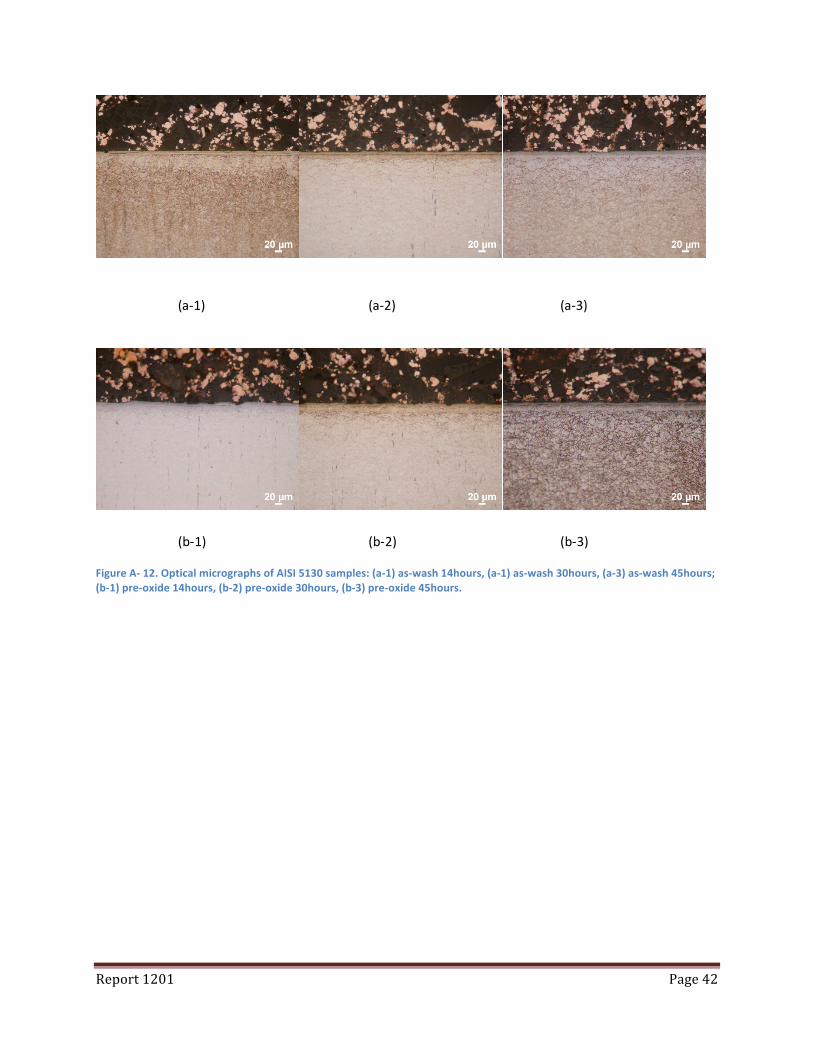
Figure A-‐ 12. Optical micrographs of AISI 5130 samples: (a-‐1) as-‐wash 14hours, (a-‐1) as-‐wash 30hours, (a-‐3) as-‐wash 45hours; (b-‐1) pre-‐oxide 14hours, (b-‐2) pre-‐oxide 30hours, (b-‐3) pre-‐oxide 45hours.
(a-‐1) (a-‐2) (a-‐3)
(b-‐1) (b-‐2) (b-‐3)
Report 1201 Page 43
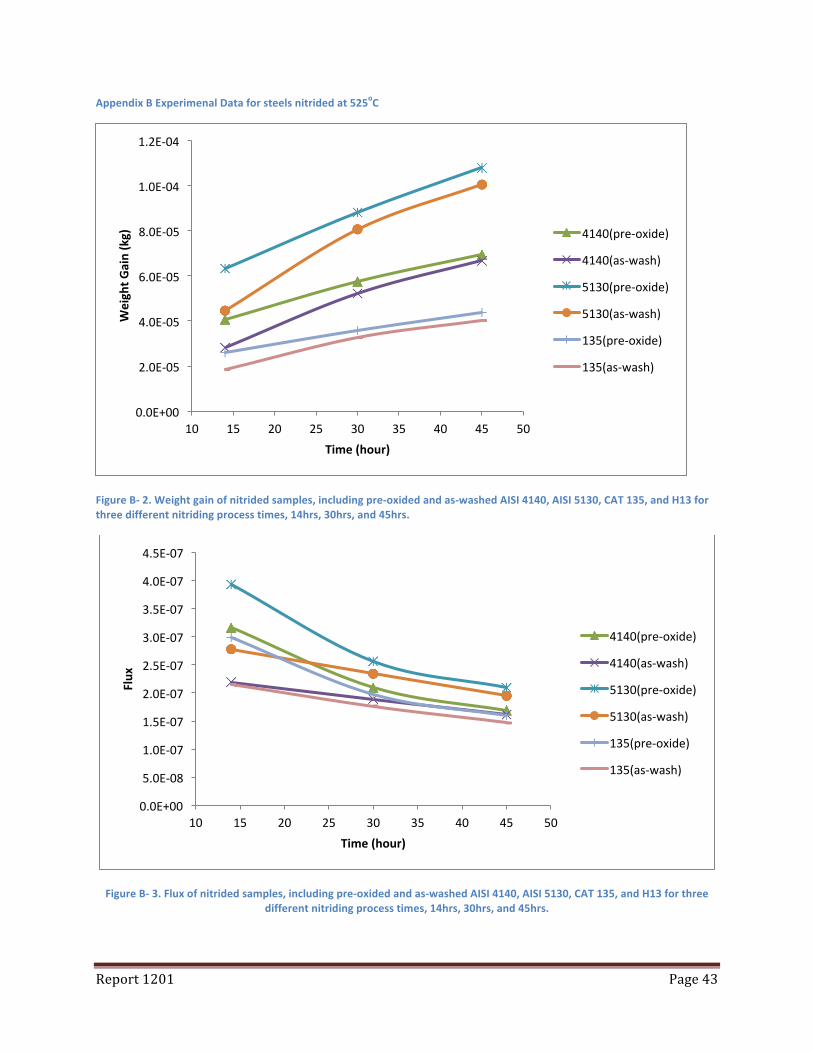
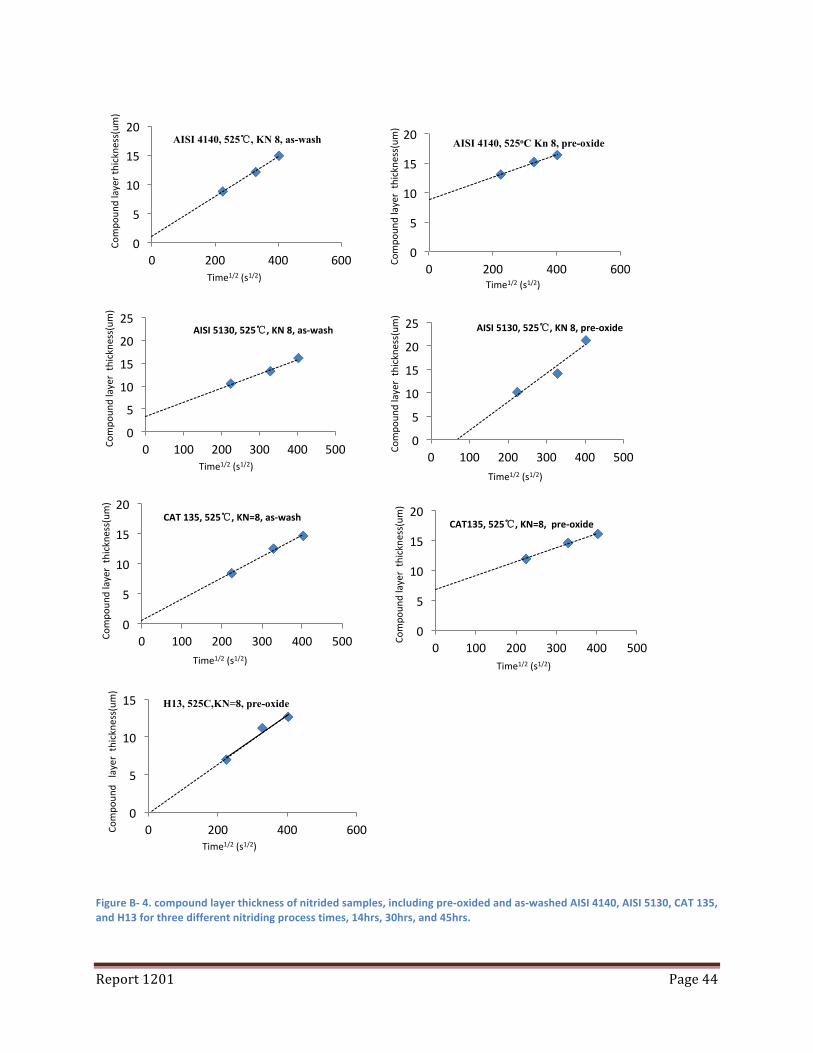
Appendix B Experimenal Data for steels nitrided at 525oC
Figure B-‐ 2. Weight gain of nitrided samples, including pre-‐oxided and as-‐washed AISI 4140, AISI 5130, CAT 135, and H13 for three different nitriding process times, 14hrs, 30hrs, and 45hrs.
Figure B-‐ 3. Flux of nitrided samples, including pre-‐oxided and as-‐washed AISI 4140, AISI 5130, CAT 135, and H13 for three different nitriding process times, 14hrs, 30hrs, and 45hrs.
0.0E+00
2.0E-‐05
4.0E-‐05
6.0E-‐05
8.0E-‐05
1.0E-‐04
1.2E-‐04
10 15 20 25 30 35 40 45 50
Weight G
ain (kg)
Time (hour)
4140(pre-‐oxide)
4140(as-‐wash)
5130(pre-‐oxide)
5130(as-‐wash)
135(pre-‐oxide)
135(as-‐wash)
0.0E+00
5.0E-‐08
1.0E-‐07
1.5E-‐07
2.0E-‐07
2.5E-‐07
3.0E-‐07
3.5E-‐07
4.0E-‐07
4.5E-‐07
10 15 20 25 30 35 40 45 50
Flux
Time (hour)
4140(pre-‐oxide)
4140(as-‐wash)
5130(pre-‐oxide)
5130(as-‐wash)
135(pre-‐oxide)
135(as-‐wash)
Report 1201 Page 44
0
5
10
15
20
25
0 100 200 300 400 500
AISI 5130, 525℃, KN 8, pre-‐oxide
Compo
und layer thickness(um
)
Time1/2 (s1/2)
0
5
10
15
20
0 100 200 300 400 500
CAT135, 525℃, KN=8, pre-‐oxide
Compo
und layer thickness(um
)
Time1/2 (s1/2)
Figure B-‐ 4. compound layer thickness of nitrided samples, including pre-‐oxided and as-‐washed AISI 4140, AISI 5130, CAT 135, and H13 for three different nitriding process times, 14hrs, 30hrs, and 45hrs.
0
5
10
15
20
0 200 400 600
AISI 4140, 525℃, KN 8, as-wash
Compo
und layer thickne
ss(um)
Time1/2 (s1/2)
0
5
10
15
20
25
0 100 200 300 400 500
AISI 5130, 525℃, KN 8, as-‐wash
Compo
und layer thickness(um
)
Time1/2 (s1/2)
0
5
10
15
20
0 100 200 300 400 500
CAT 135, 525℃, KN=8, as-‐wash
Compo
und layer thickness(um
)
Time1/2 (s1/2)
0
5
10
15
20
0 200 400 600
AISI 4140, 525oC Kn 8, pre-oxide
Compo
und layer thickness(um
)
Time1/2 (s1/2)
0
5
10
15
0 200 400 600
H13, 525C,KN=8, pre-oxide
Compo
und layer thickne
ss(um)
Time1/2 (s1/2)
Report 1201 Page 45
0
0.2
0.4
0.6
0 200 400 600 800
14hrs 30hrs 45hrs
AISI5130, 525℃, KN 8, pre-oxide
Weight p
ercentage of N
Depth from the surface (um)
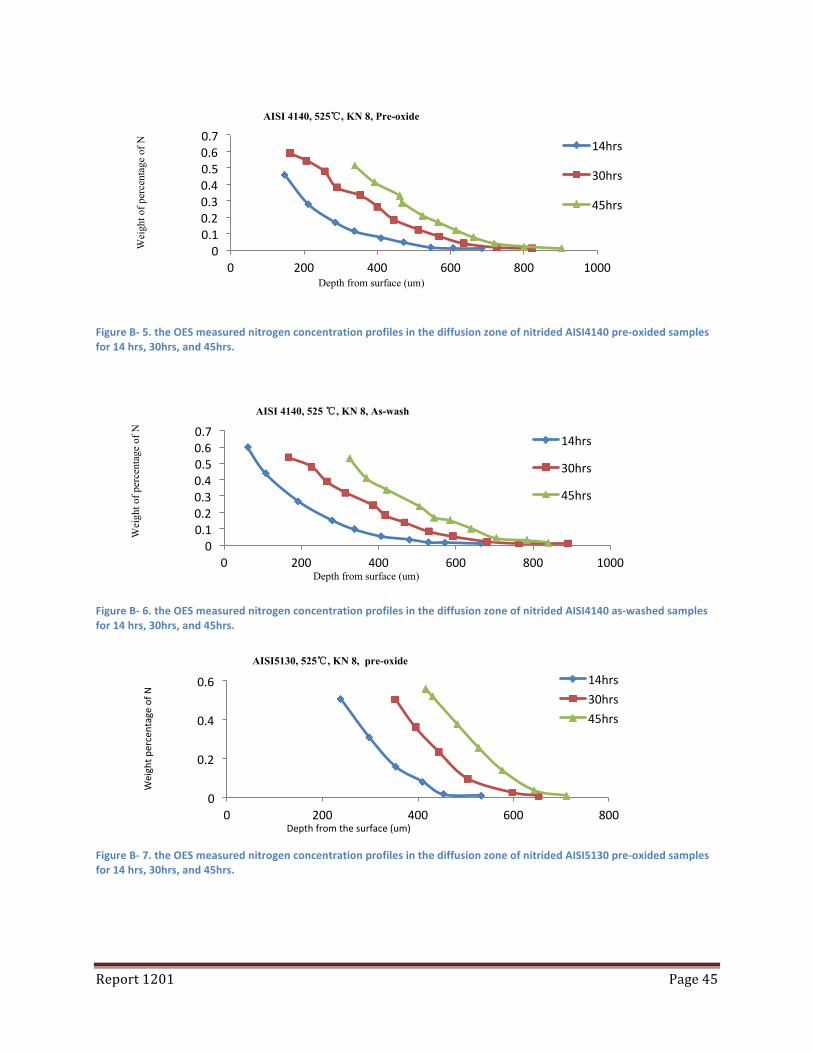
Figure B-‐ 5. the OES measured nitrogen concentration profiles in the diffusion zone of nitrided AISI4140 pre-‐oxided samples for 14 hrs, 30hrs, and 45hrs.
Figure B-‐ 6. the OES measured nitrogen concentration profiles in the diffusion zone of nitrided AISI4140 as-‐washed samples for 14 hrs, 30hrs, and 45hrs.
Figure B-‐ 7. the OES measured nitrogen concentration profiles in the diffusion zone of nitrided AISI5130 pre-‐oxided samples for 14 hrs, 30hrs, and 45hrs.
0 0.1 0.2 0.3 0.4 0.5 0.6 0.7
0 200 400 600 800 1000
14hrs
30hrs
45hrs
AISI 4140, 525 ℃, KN 8, As-wash
Wei
ght o
f per
cent
age
of N
Depth from surface (um)
0 0.1 0.2 0.3 0.4 0.5 0.6 0.7
0 200 400 600 800 1000
14hrs
30hrs
45hrs
Depth from surface (um)
Wei
ght o
f per
cent
age
of N
AISI 4140, 525℃, KN 8, Pre-oxide

Report 1201 Page 46
-‐0.1
0.1
0.3
0.5
0.7
0 300 600 900
14hrs 30hrs 45hrs
CAT135, 525℃, KN 8, Pre-oxide
Wei
ght o
f per
cent
age
of N
Depth from surface (um)
Figure B-‐ 8. the OES measured nitrogen concentration profiles in the diffusion zone of nitrided AISI5130 as-‐washed samples for 14 hrs, 30hrs, and 45hrs.
Figure B-‐ 9. the OES measured nitrogen concentration profiles in the diffusion zone of nitrided CAT 135 pre-‐oxided samples for 14 hrs, 30hrs, and 45hrs.
Figure B-‐ 10. the OES measured nitrogen concentration profiles in the diffusion zone of nitrided CAT 135 as-‐washed samples for 14 hrs, 30hrs, and 45hrs
0
0.2
0.4
0.6
0 200 400 600 800
14hrs
30hrs
45hrs
AISI5130, 525℃, KN 8, as-wash Weight p
ercentage of N
Depth from the surface (um)
-‐0.1
0.1
0.3
0.5
0.7
0 300 600 900
14hrs 30hrs 45hrs
CAT 135, 525℃, KN=8, as-wash
Wei
ght o
f per
cent
age
of N
Depth from surface (um)
Report 1201 Page 47
0
0.1
0.2
0.3
0 100 200 300 400 500
14hrs 30hrs
H13, 525℃, KN=8, pre-‐oxide
Wei
ght o
f per
cent
age
of N
Depth from surface (um)
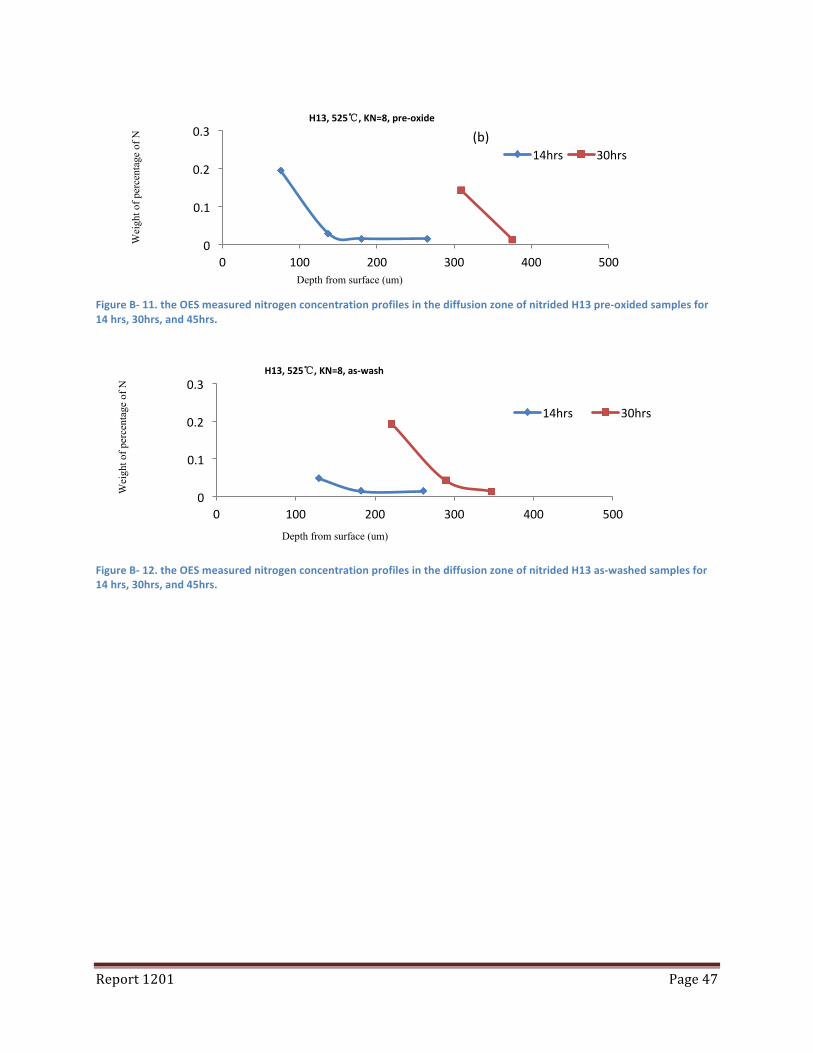
Figure B-‐ 11. the OES measured nitrogen concentration profiles in the diffusion zone of nitrided H13 pre-‐oxided samples for 14 hrs, 30hrs, and 45hrs.
Figure B-‐ 12. the OES measured nitrogen concentration profiles in the diffusion zone of nitrided H13 as-‐washed samples for 14 hrs, 30hrs, and 45hrs.
0
0.1
0.2
0.3
0 100 200 300 400 500
14hrs 30hrs
H13, 525℃, KN=8, as-‐wash
Wei
ght o
f per
cent
age
of N
Depth from surface (um)
(b)
Report 1201 Page 48
300
400
500
600
700
0 500 1000 1500 2000
14hrs
30hrs
45hrs
AISI 4140, 525℃, KN 8, as-wash Microhardne
ss (H
V)
Depth from surface (um)
300
400
500
600
700
0 500 1000 1500 2000
14hrs
30hrs
45hrs
Microhardne
ss (H
V)
Depth from surface (um)
AISI 4140, 525℃, KN 8, as-wash
300
400
500
600
700
800
0 500 1000 1500 2000
14hrs 30hrs 45hrs
AISI 5130, 525℃, KN 8, pre-oxide
Microhardne
ss (H
V)
Depth from surface (um)
300 350 400 450 500 550 600 650
0 500 1000 1500 2000
14hrs 30hrs 45hrs
Har
dnes
s (H
V)
Depth from surface (um)
CAT 135, 525 ℃, KN=8, as-wash
500 600 700 800 900
1000 1100
0 500 1000 1500 2000
14hrs 30hrs 45hrs
H13, 525℃, KN=8, pre-oxide
Har
dnes
s (H
V)
Depth from surface (um)
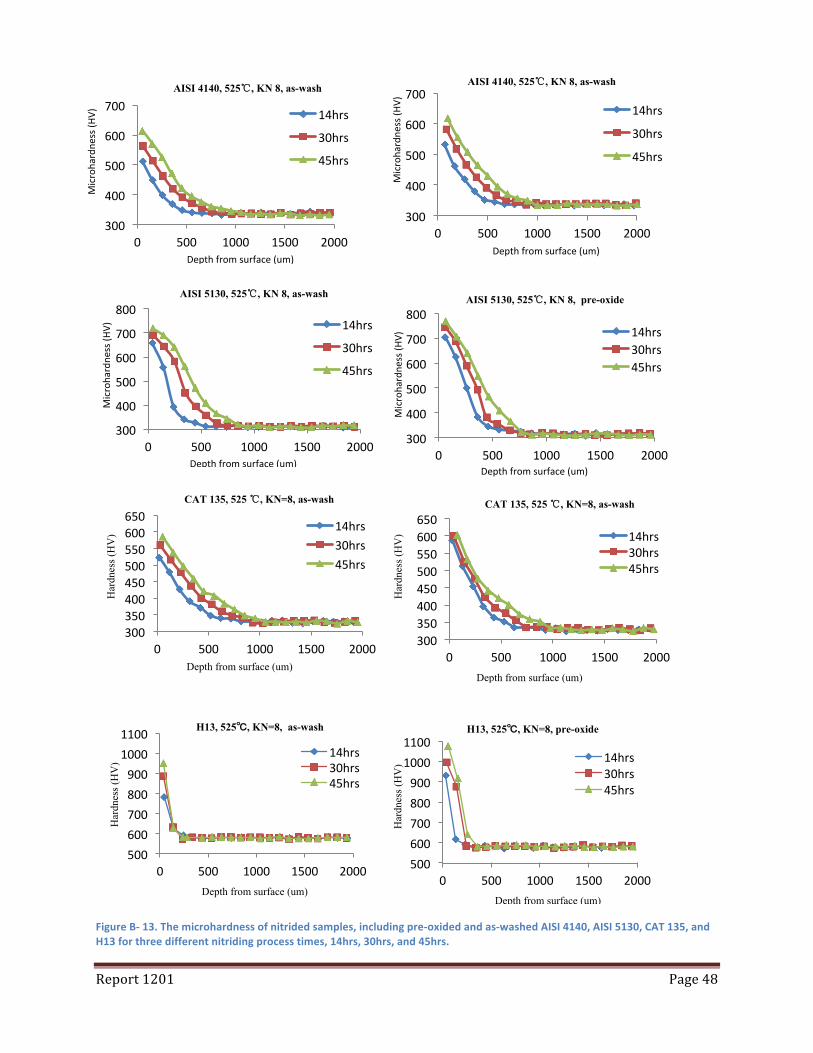
Figure B-‐ 13. The microhardness of nitrided samples, including pre-‐oxided and as-‐washed AISI 4140, AISI 5130, CAT 135, and H13 for three different nitriding process times, 14hrs, 30hrs, and 45hrs.
300
400
500
600
700
800
0 500 1000 1500 2000
14hrs
30hrs
45hrs
AISI 5130, 525℃, KN 8, as-wash
Microhardne
ss (H
V)
Depth from surface (um)
300 350 400 450 500 550 600 650
0 500 1000 1500 2000
14hrs 30hrs 45hrs
Har
dnes
s (H
V)
Depth from surface (um)
CAT 135, 525 ℃, KN=8, as-wash
500 600 700 800 900 1000 1100
0 500 1000 1500 2000
14hrs 30hrs 45hrs
H13, 525℃, KN=8, as-wash
Har
dnes
s (H
V)
Depth from surface (um)
Report 1201 Page 49
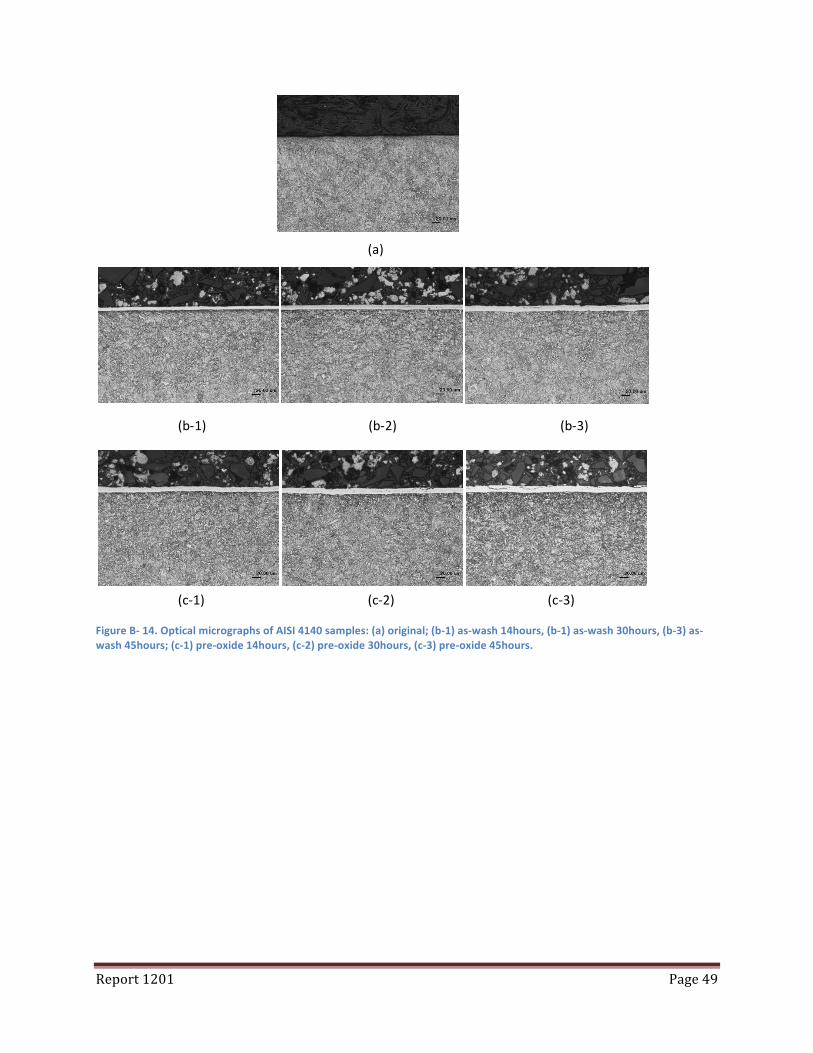
Figure B-‐ 14. Optical micrographs of AISI 4140 samples: (a) original; (b-‐1) as-‐wash 14hours, (b-‐1) as-‐wash 30hours, (b-‐3) as-‐wash 45hours; (c-‐1) pre-‐oxide 14hours, (c-‐2) pre-‐oxide 30hours, (c-‐3) pre-‐oxide 45hours.
(a)
(b-‐1) (b-‐2) (b-‐3)
(c-‐1) (c-‐2) (c-‐3)
Report 1201 Page 50
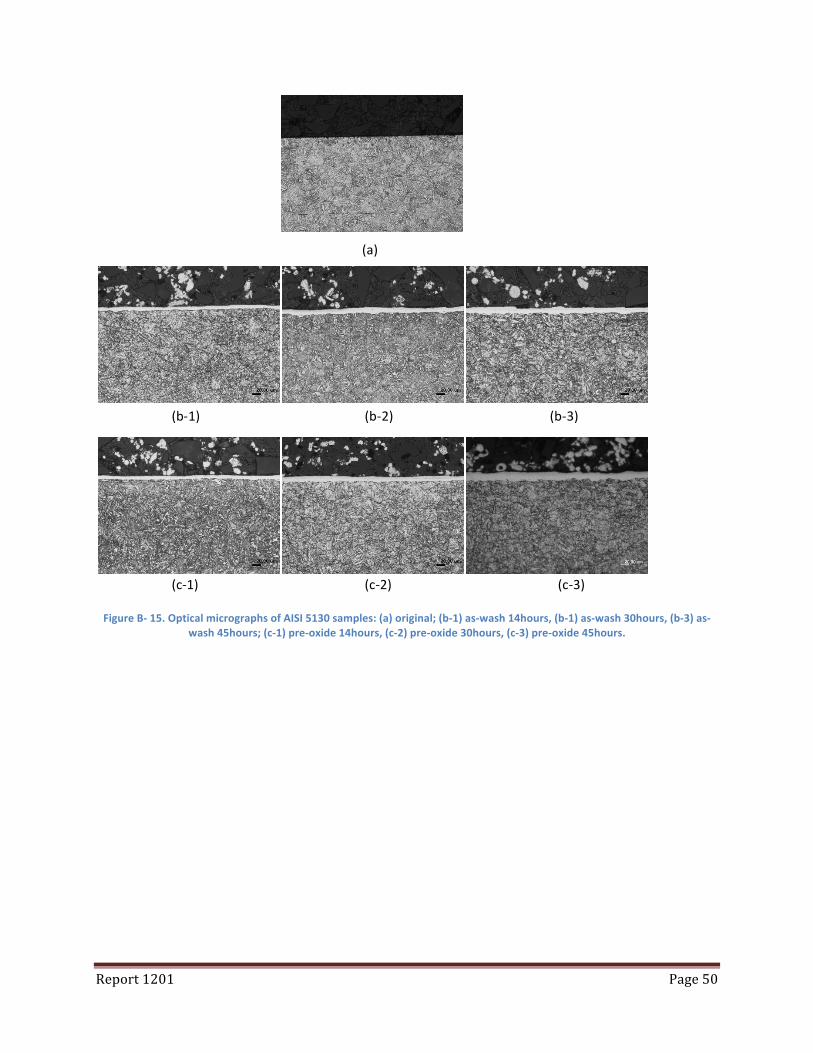
Figure B-‐ 15. Optical micrographs of AISI 5130 samples: (a) original; (b-‐1) as-‐wash 14hours, (b-‐1) as-‐wash 30hours, (b-‐3) as-‐
wash 45hours; (c-‐1) pre-‐oxide 14hours, (c-‐2) pre-‐oxide 30hours, (c-‐3) pre-‐oxide 45hours.
(a)
(b-‐1) (b-‐2) (b-‐3)
(c-‐1) (c-‐2) (c-‐3)

Report 1201 Page 51
Figure B-‐ 16. Optical micrographs of CAT 135 samples: (a) original; (b-‐1) as-‐wash 14hours, (b-‐1) as-‐wash 30hours, (b-‐3) as-‐wash 45hours; (c-‐1) pre-‐oxide 14hours, (c-‐2) pre-‐oxide 30hours, (c-‐3) pre-‐oxide 45hours.
Figure B-‐ 17. Optical micrographs of H13 samples: (a) pre-‐oxide 14hours, (b) pre-‐oxide 30hours, (c) pre-‐oxide 45hours.
(a)
(b-‐1) (b-‐1) (b-‐1)
(c-‐1) (c-‐2) (c-‐3)
(a) (b) (c)