Nitric oxide synthesis is reduced in subjects with Type 2...
21
Nitric oxide synthesis is reduced in subjects with Type 2 Diabetes and nephropathy Short running title: Insulin-resistance to NO metabolism in T2DM Paolo Tessari, Diego Cecchet, Alessandra Cosma, Monica Vettore, Anna Coracina, Renato Millioni, Elisabetta Iori, Lucia Puricelli, Angelo Avogaro, Monica Vedovato. Dept. of Clinical and Experimental Medicine, Metabolism Division, University of Padova, Italy. Address for correspondence: Prof. Paolo Tessari, Email: [email protected] Submitted 3 December 2009 and accepted 11 May 2010. This is an uncopyedited electronic version of an article accepted for publication in Diabetes. The American Diabetes Association, publisher of Diabetes, is not responsible for any errors or omissions in this version of the manuscript or any version derived from it by third parties. The definitive publisher-authenticated version will be available in a future issue of Diabetes in print and online at http://diabetes.diabetesjournals.org. Diabetes Publish Ahead of Print, published online May 18, 2010 Copyright American Diabetes Association, Inc., 2010
Transcript of Nitric oxide synthesis is reduced in subjects with Type 2...

Nitric oxide synthesis is reduced in subjects with Type 2 Diabetes and
nephropathy
Short running title: Insulin-resistance to NO metabolism in T2DM
Paolo Tessari, Diego Cecchet, Alessandra Cosma, Monica Vettore, Anna Coracina, Renato Millioni, Elisabetta Iori, Lucia Puricelli, Angelo Avogaro, Monica Vedovato.
Dept. of Clinical and Experimental Medicine, Metabolism Division, University of Padova,
Italy.
Address for correspondence: Prof. Paolo Tessari,
Email: [email protected]
Submitted 3 December 2009 and accepted 11 May 2010. This is an uncopyedited electronic version of an article accepted for publication in Diabetes. The American Diabetes Association, publisher of Diabetes, is not responsible for any errors or omissions in this version of the manuscript or any version derived from it by third parties. The definitive publisher-authenticated version will be available in a future issue of Diabetes in print and online at http://diabetes.diabetesjournals.org.
Diabetes Publish Ahead of Print, published online May 18, 2010
Copyright American Diabetes Association, Inc., 2010

Insulin-resistance to NO metabolism in T2DM
2
Objective. Nitric oxide (NO) is a key metabolic and vascular regulator. Its production is stimulated by insulin. A reduced urinary excretion of NO products (NOx) is frequently found in T2DM, particularly in association with nephropathy. However, whether the decreased NOx excretion in T2DM is caused by a defective NOx production from arginine in response to hyperinsulinemia, has never been studied. Research design and methods. We measured NOx fractional (FSR) and absolute (ASR) synthesis rates in T2DM patients with diabetic nephropathy, and in control subjects, following L-[15N2-guanidino]-arginine infusion, and use of precursor-product relationships. The study was conducted both before and following an euglycemic, hyperinsulinemic (≈1000-1200 pmol/L) clamp. Results. In T2DM, NOx FSR was reduced both under basal (19.3±3.9%/day, vs. 22.9±4.5%/day in controls) and hyperinsulinemic states (24.0±5.6%/day, vs. 37.9±6.4%/day in controls; p<0.03 by ANOVA). Similarly, in T2DM, NOx ASR was lower than in controls under both conditions (basal: 0.32±0.06 vs. 0.89±0.34 moles/day; hyperinsulinemia: 0.35±0.07 vs. 1.15±0.38 moles/day; p=0.01 by ANOVA). In T2DM, the ability of insulin to stimulate both the FSR (+4.7±3.2%/day) and the ASR (+0.03±0.04 moles/day) of NOx was several-fold lower than that in controls (+15.0±2.9%/day, and +0.25±0.07 moles/day, p<0.03 and p<0.02, respectively). Also the fraction of arginine flux converted to NOx (basal: 0.22±0.05% vs. 0.65±0.25%; hyperinsulinemia: 0.32±0.06% vs. 1.03±0.33%), was sharply reduced in the patients (p<0.01 by ANOVA). Conclusion. In T2DM patients with nephropathy, intravascular NOx synthesis from arginine is decreased under both basal and hyperinsulinemic states. This defect extends the concept of insulin-resistance to NO metabolism.

Insulin-resistance to NO metabolism in T2DM
3
itric oxide is a key regulatory molecule with extensive metabolic, vascular and cellular effects (1-6).
The regulation of nitric oxide metabolism is particularly important in type 2 diabetes mellitus (T2DM), also because activation of NO synthase is under insulin control through the Akt pathway (3, 5). Thus, disturbances of NO generation may be a consequence of insulin resistance affecting also the vascular response (3). An impaired NO metabolism is found in T2DM (7-10), in particular in the presence of nephropathy (11). A reduced urinary excretion of nitric oxide-related products, such as nitrites and nitrates, collectively termed as [NOx], has been reported in T2DM patients with nephropathy (12, 13). Conversely, microalbuminuria is associated with impaired endothelial function in T2DM subjects (14). Hyperglycemia may also play a role in the decreased NO production in T2DM, since high glucose per se inhibited endothelial eNOS activity in the glomeruli, through a PKC-associated mechanism (15). Moreover, high glucose and/or the associated advanced glycosylation end-products, decreased NOS expression (11). Urinary NOx production is reduced in non-diabetic renal disease (16), although also increased plasma nitrate concentrations have been reported in T2DM, as well as in the Metabolic Syndrome (17-18), thus questioning the validity of urinary methods to assess whole-body NOx production. Since the stimulation of NOS activity by insulin is impaired in muscle of T2DM patients (19), investigations on the response to the hormone of whole-body NO production in T2DM is of key relevance. As a matter of fact, an impaired NO generation in T2DM may be another feature of insulin-resistance (3).
We recently developed a precursor-product, stable isotope method to measure whole-body synthesis of NO-related compounds in vivo (20). Therefore, the aim of this study was two-fold: 1) To measure NOx production rate (both fractional and absolute), as well as the rate of arginine conversion to NOx, in T2DM patients with diabetic nephropathy; and 2) To study the effects of acute hyperinsulinemia on these parameters. MATERIALS AND METHODS Subjects. Eight male T2DM patients with diabetic nephropathy, and ten male non diabetic healthy volunteers, comparable for age and BMI, were recruited. Their clinical and biochemical characteristics are reported on Table 1. All subjects had been adapted for at least one month to a diet containing ≈50% calories as CHO, ≈20% as proteins and ≈30% as lipids. Protein intake was ≈80-100 grams/per day, and was not restricted in any subject. In the day before the study, all subjects consumed a low-nitrate diet to minimize the contribution of exogenous nitrates to whole body NOx turnover. All the diabetic subjects and five control subjects were hypertensive (the latter affected by essential hypertension), and treated with combinations of hypotensive drugs, such as ACE inhibitors (in 3 T2DM and 5 controls), ARBs (in 5 T2DMs), calcium antagonists (in 3 T2DMs), beta-blockers (in 3 T2DMs and 2 controls) and diuretics (in 3 T2DMs and 2 controls). Four diabetic and one control subject were also treated with statins. All drugs were suspended the night before the study-day. The antidiabetic treatment in the patients consisted of diet alone (two subjects), oral hypoglycemic agents (OHA) (four subjects, two with glybenclamide, one with metformin, and
N

Insulin-resistance to NO metabolism in T2DM
4
one with glybenclamide, metformin and pioglitazone), intermediate-acting insulin plus metformin (one patient), and split insulin doses (one patient). The antidiabetic therapy was suspended the night before the study day. The control subjects had no history of either diabetes or impaired glucose tolerance, and their fasting plasma glucose, HbA1c, and general blood chemistry were normal. The urinary albumin excretion rate (AER) was measured on at least two 12-hour urine collections. The T2DM patients had by definition an increased AER (five in the macroalbuminuria, and three in the microalbuminuria range). The glomerular filtration rate (GFR) in the diabetic subjects was determined by 51Cr- EDTA infusion (21), and in both study groups it was estimated also using the Cockcroft-Gault formula (22). The T2DM patients had either a normal (GFR: > 80 ml/m2 x min, n=5) or a moderately impaired renal function (i.e. a GFR between 60-80 ml/m2 x min, n=3). Aims, benefits and potential risks of the study were explained in detail, and each subject signed an informed consent. The protocol was approved by the Ethical Committee of the Medical Faculty at the University of Padova, Italy, and it was performed according to the Helsinki Declaration (as revised in 1983). Experimental design. All subjects were admitted to the Metabolic Unit of the Department of Metabolic Diseases at 7:00 AM on the study day, after the overnight fast. The diabetic subjects were moderately hyperglycemic (Table 1). An 18-gauge polyethylene catheter was placed in an antecubital vein of the right arm, for isotope, insulin, and glucose infusion. A contra lateral wrist vein was cannulated in a retrograde fashion, and the hand was placed in a box heated at
55°C throughout the study, for venous-arterialized blood sampling. After a baseline blood sample (Figures 1 and 2), a primed- (2.4 µmol/kg), continuous (0.04 µmol/kg x min) infusion of L-[15N2-guanidino]-arginine (15N2-arginine, sterile and pyrogen-free) (MassTrace, Woburn, MA, USA; isotope purity: 99%) was started approximately at 07:30 AM (defined as -180’). Blood samples were drawn every 30' for ≈2 hrs, to assess the achievement of steady state in blood isotope enrichment (data not shown). In the diabetic group, after 100’ from the start of isotope infusion, five blood samples were collected every 20’ (i.e. between -80’ and 0’), for measurements of whole-blood isotope enrichments of NOx and arginine, as well as for plasma substrate and hormone concentrations (Figures 2 and 3, upper panels). In the control group, there were minor changes in blood sampling, which started 120’ after the initiation of isotope infusion (i.e. at -60’), and was spaced by 15’ intervals (i.e. five samples) for blood isotope enrichments of NOx, and by 30’ intervals (three samples) for blood arginine, plasma substrate and hormone concentrations (Figures 2 and 3, lower panels). Thereafter, an euglycemic, hyperinsulinemic clamp was started as described elsewhere (20). (Figure 1). Briefly, regular insulin (Humulin R, Eli-Lilly, Indianapolis, USA) was infused at the rate of 1.9 mU/kg x min-1 for 180’. In the first 10’, the rate of insulin infusion was doubled to rapidly prime the insulin pool. Plasma glucose concentration was monitored every 10’. In the non-diabetic subjects, euglycemia (between 4.7 and 5 mmol/L) was maintained by a variable exogenous 20% dextrose infusion, whereas in the diabetic subjects blood glucose was allowed to decrease from

Insulin-resistance to NO metabolism in T2DM
5
the basal values and reached the euglycemic range within 74±9 min. Thereafter, blood glucose values were maintained between 4.7 and 5 mmol/L by dextrose infusion, for additional 120’. Therefore, the total duration of the clamp period was 180’ in the control subjects, and ≈195’ in the diabetic patients (Figures 1 and 2). After ≈120’-135’ from the start of the insulin infusion, five additional blood samples were again drawn every 15’, for the measurements at the new steady-state. Analytical measurements. Three ml of blood were collected into pre-weighed chilled tubes containing three ml of 20% perchloric acid (w/vol) (PCA), vigorously shaken, and immediately kept on ice. Two additional ml of blood were collected into pre-weighed chilled tubes containing four ml of absolute ethanol, gently shaken and kept on ice. Two ml of blood were also collected into chilled tubes containing 50 µliter of EDTA (6% w/vol), gently mixed, and kept on ice. All tubes were centrifuged within one hour, reweighed, and the supernatant was stored at –80°C until assay. Whole-blood 15N2-arginine enrichment was measured from one ml of the PCA extract, titrated to alkaline pH with 6 N KOH and eluted through an AG 50W-X8 resin with 4 N NH4OH. The eluate was analyzed by Gas-Chromatography Mass-Spectrometry (GCMS) (Mod. 5973, Agilent, Palo Alto, Ca, USA) as trifluoroacetyl derivative using positive chemical ionization, by monitoring the fragments (m/z) [479/477]. Enrichments were expressed as tracer-to-tracee ratio (TTR) (23). Whole-blood NOx enrichments were determined in the supernatant of the ethanol-containing tubes as nitrobenzene derivative (24), by Gas Chromatography Combustion-Isotope Ratio Mass-Spectrometry (GC-C-
IRMS) (Delta Plus GC-C-IRMS, ThermoElectron, Bremen, Germany), as described in detail elsewhere (20). Blood NOx concentrations were determined from the ethanol supernatant (25), using a commercial assay (Nitrate/Nitrite Colorimetric Assay Kit, Cayman Chemical Co., Ann Arbor, MI, USA), after correction of blood dilution by weight differences, and accounting for blood specific weight. Plasma insulin and amino acid concentrations were determined as reported in (20). TNF-α, IL-6, Il-8 and Il-10 and hsCRP were measured using commercial assays (1). Calculations. The arginine Rate of appearance (Ra) was calculated according to a standard steady-state formula (20, 23): TTRi Arg Ra = i x (Eq. 1) TTRwb where: “i” is L-[15N2-guanidino]-arginine tracer infusion rate (in µmol/kg x min); “TTRi“ is the isotope enrichment (as trace- to-tracee ratio, TTR) of the infused tracer; and “TTRwb“ is whole blood 15N2-arginine TTR, (corrected for the natural pre-infusion value), in either the basal or the insulin infusion period. A near steady-state in blood arginine TTR was attained in both the basal and the hyperinsulinemic periods (Figure 2). Arginine flux was also expressed on a 24-hr basis to calculate the fraction of daily 15NOx production from [15N2]-arginine (see below). The fractional synthesis rate (FSR) of NOx conceptually corresponds to the percent of the circulating pool newly
1 hsCRP: by an automated immunonephelometric assay (Dade-Behring, Marburg, Germany). TNF-α, IL 6, Il-8 and Il-10: by an ELISA assay (Biosciences, MD, USA).

Insulin-resistance to NO metabolism in T2DM
6
synthesized over the unit of time (20, 23), and it was calculated as follows: dTTR (15NOx) dt NOx FSR = x 1440 x 100 (Eq. 2) 15N-Arg TTR where: [dTTR (15NOx)] is the derivative with respect to time (dt), of the change of whole-blood NOx TTR values, which were calculated on four to five time points in the basal state as well as in the insulin-infusion period, respectively (Figures 1 and 2). The [15N-Arg TTR] is the mean blood 15N-arginine TTR within the same experimental periods. The factor [1440] converts the results to 24 hours; and [100] expresses them on a percent basis. The absolute synthesis rate of NOx (ASR) (in mmol/day) is then calculated by multiplying FSR times the total NOx pool, which is the product between the average whole-blood NOx concentration (in mmol/liter) of each experimental period, and the nitrate distribution volume (in liters), taken as 28% of body weight (26). Statistical analysis. The two way ANOVA for repeated measurements was employed to compare basal and clamp periods between diabetic and control subjects. The post-hoc Tukey test was employed to test changes vs. basal within each group. The two-tailed Student T test for unpaired data was employed to compare two sets of single data (i.e. the delta changes vs. basal following the clamp). Analyses were performed on the log transformations when data distribution was not normal. Regression analysis was performed using simple linear relationships, by the Statistica Software (Version 6, StatSoft, Tulsa, OK, USA). A p value less than 0.05 was considered statistically significant. Data have been expressed as Means±SE.
RESULTS Substrates, hormones, insulin mediated glucose disposal, and isotope enrichments. In the fasting state, the T2DM subjects had significantly greater glucose, HbA1c, insulin and creatinine plasma concentrations than control subjects (Table 1). In the T2DM patients, the mean albumin excretion rate was ≈2 grams/day, and their GFR was ≈25% lower (albeit not significantly, p>0.05) than the calculated values in controls. During the clamp, plasma insulin was acutely raised by ≈10 times vs. basal values in both the diabetic (to 1240±70 pmol/L) and the control subjects (to 1037±117 pmol/L), to similar values in both groups. In the T2DM patients, plasma glucose was slowly decreased to near euglycemia (≈4.7-5 mmol/L) that was then maintained at this level throughout the study. At steady-state (i.e. in the last 30’ min of the clamp period, average values) plasma glucose concentrations were similar between the T2DM (4.83±0.05 mmol/L) and the control subjects (4.96±0.12 mmol/L), whereas the insulin-mediated glucose disposal (i.e. the “M” value) was 4.48±0.56 mg/kg x min in the T2DM, and 6.98±0.84 mg/kg x min in the controls (p = 0.032 between the two groups), indicating insulin-resistance in T2DM. Similar results were obtained when the glucose disposal rate was normalized over the average insulin concentration (expressed as the [M/I] value, i.e. in mg/kg/µU of plasma insulin) (T2DM: 0.0262±0.0030; controls: 0.0519±0.0069, p<0.01 between the two). Plasma amino acid concentrations are reported on Table 2. Hyperinsulinemia reduced, as expected, the concentrations of most amino acids. Interestingly, arginine decreased significantly in the
Insulin-resistance to NO metabolism in T2DM
7
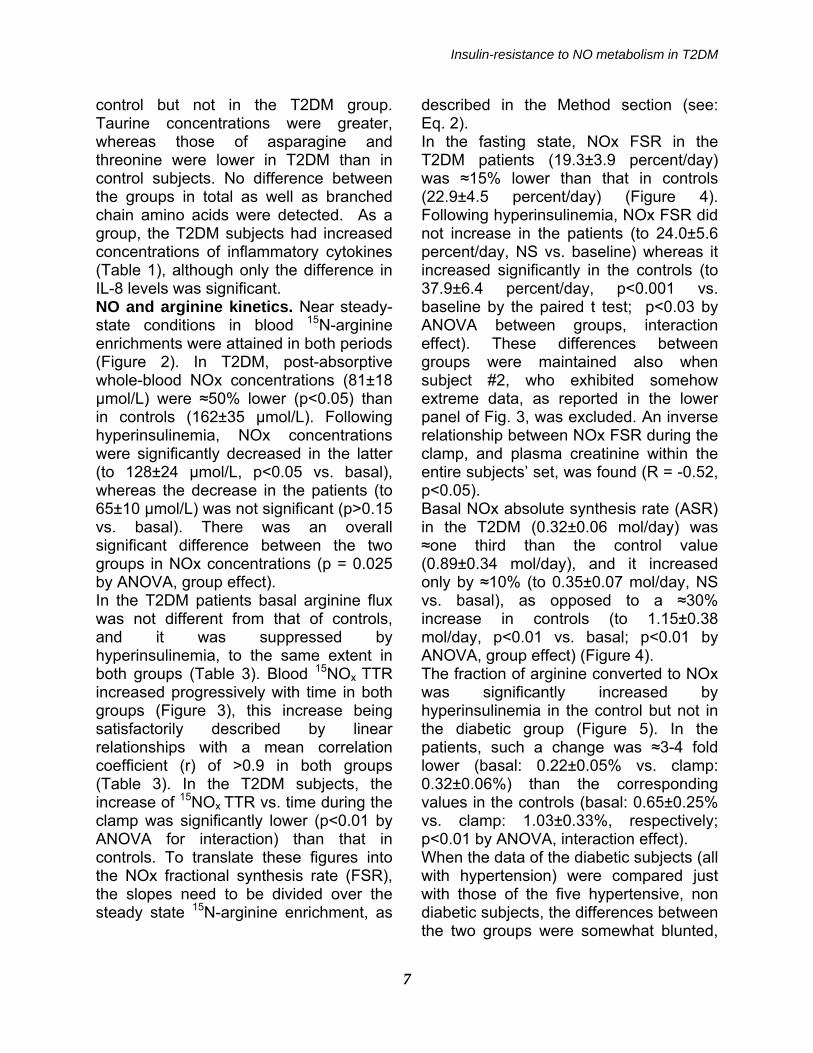
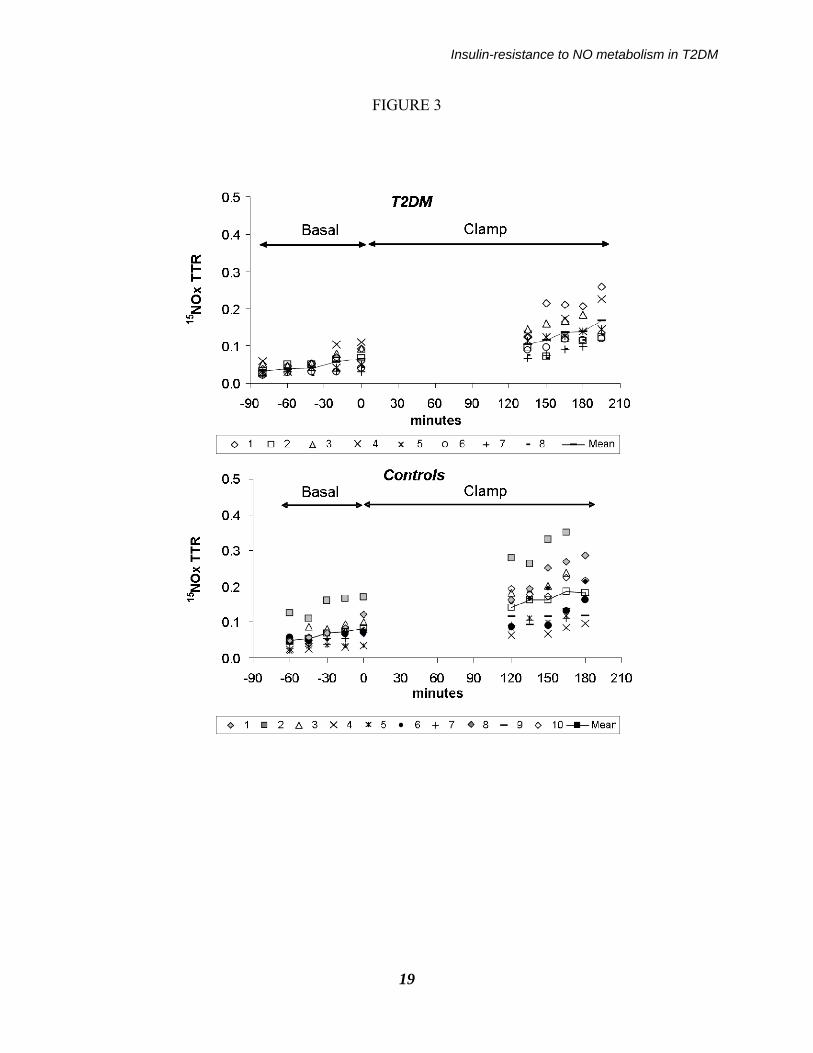
control but not in the T2DM group. Taurine concentrations were greater, whereas those of asparagine and threonine were lower in T2DM than in control subjects. No difference between the groups in total as well as branched chain amino acids were detected. As a group, the T2DM subjects had increased concentrations of inflammatory cytokines (Table 1), although only the difference in IL-8 levels was significant. NO and arginine kinetics. Near steady-state conditions in blood 15N-arginine enrichments were attained in both periods (Figure 2). In T2DM, post-absorptive whole-blood NOx concentrations (81±18 µmol/L) were ≈50% lower (p<0.05) than in controls (162±35 µmol/L). Following hyperinsulinemia, NOx concentrations were significantly decreased in the latter (to 128±24 µmol/L, p<0.05 vs. basal), whereas the decrease in the patients (to 65±10 µmol/L) was not significant (p>0.15 vs. basal). There was an overall significant difference between the two groups in NOx concentrations (p = 0.025 by ANOVA, group effect). In the T2DM patients basal arginine flux was not different from that of controls, and it was suppressed by hyperinsulinemia, to the same extent in both groups (Table 3). Blood 15NOx TTR increased progressively with time in both groups (Figure 3), this increase being satisfactorily described by linear relationships with a mean correlation coefficient (r) of >0.9 in both groups (Table 3). In the T2DM subjects, the increase of 15NOx TTR vs. time during the clamp was significantly lower (p<0.01 by ANOVA for interaction) than that in controls. To translate these figures into the NOx fractional synthesis rate (FSR), the slopes need to be divided over the steady state 15N-arginine enrichment, as
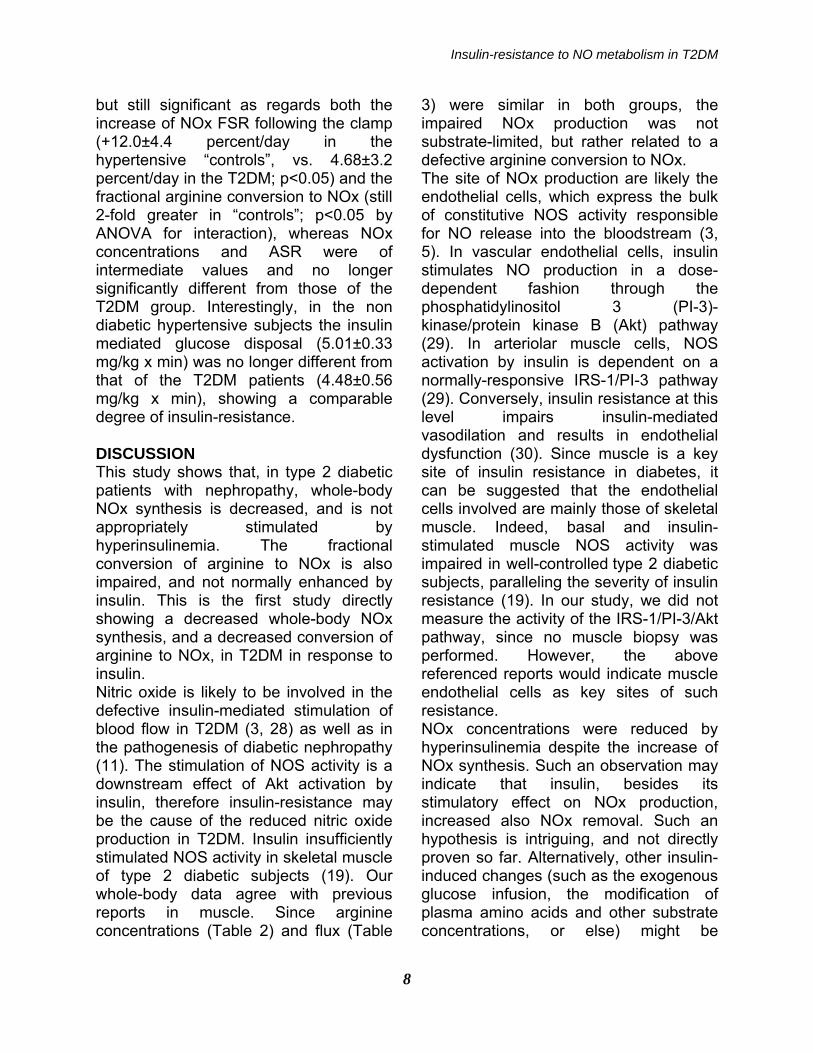
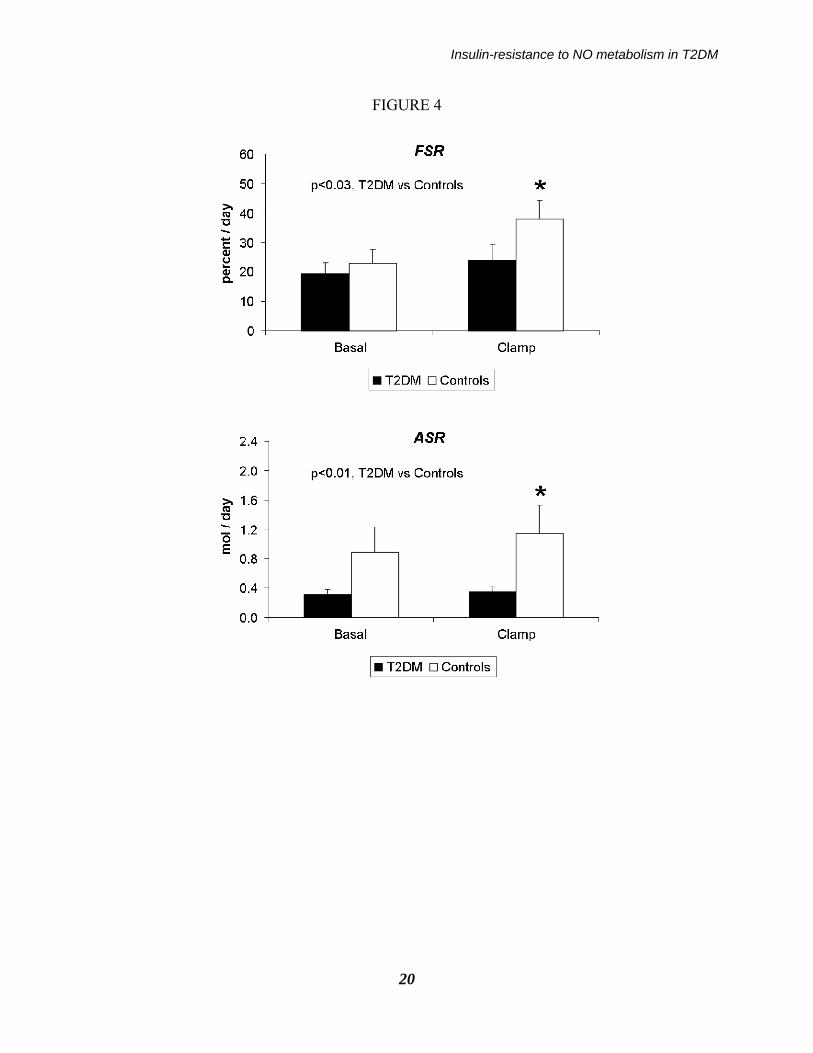
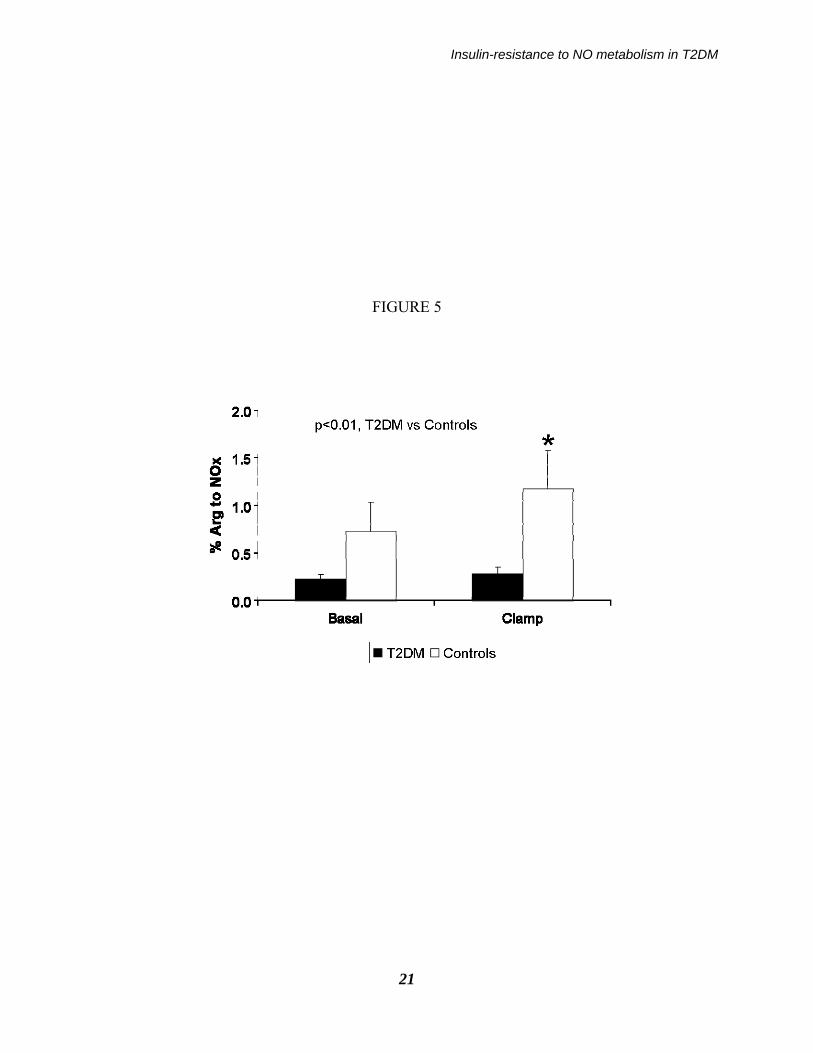
described in the Method section (see: Eq. 2). In the fasting state, NOx FSR in the T2DM patients (19.3±3.9 percent/day) was ≈15% lower than that in controls (22.9±4.5 percent/day) (Figure 4). Following hyperinsulinemia, NOx FSR did not increase in the patients (to 24.0±5.6 percent/day, NS vs. baseline) whereas it increased significantly in the controls (to 37.9±6.4 percent/day, p<0.001 vs. baseline by the paired t test; p<0.03 by ANOVA between groups, interaction effect). These differences between groups were maintained also when subject #2, who exhibited somehow extreme data, as reported in the lower panel of Fig. 3, was excluded. An inverse relationship between NOx FSR during the clamp, and plasma creatinine within the entire subjects’ set, was found (R = -0.52, p<0.05). Basal NOx absolute synthesis rate (ASR) in the T2DM (0.32±0.06 mol/day) was ≈one third than the control value (0.89±0.34 mol/day), and it increased only by ≈10% (to 0.35±0.07 mol/day, NS vs. basal), as opposed to a ≈30% increase in controls (to 1.15±0.38 mol/day, p<0.01 vs. basal; p<0.01 by ANOVA, group effect) (Figure 4). The fraction of arginine converted to NOx was significantly increased by hyperinsulinemia in the control but not in the diabetic group (Figure 5). In the patients, such a change was ≈3-4 fold lower (basal: 0.22±0.05% vs. clamp: 0.32±0.06%) than the corresponding values in the controls (basal: 0.65±0.25% vs. clamp: 1.03±0.33%, respectively; p<0.01 by ANOVA, interaction effect). When the data of the diabetic subjects (all with hypertension) were compared just with those of the five hypertensive, non diabetic subjects, the differences between the two groups were somewhat blunted,
Insulin-resistance to NO metabolism in T2DM
8
but still significant as regards both the increase of NOx FSR following the clamp (+12.0±4.4 percent/day in the hypertensive “controls”, vs. 4.68±3.2 percent/day in the T2DM; p<0.05) and the fractional arginine conversion to NOx (still 2-fold greater in “controls”; p<0.05 by ANOVA for interaction), whereas NOx concentrations and ASR were of intermediate values and no longer significantly different from those of the T2DM group. Interestingly, in the non diabetic hypertensive subjects the insulin mediated glucose disposal (5.01±0.33 mg/kg x min) was no longer different from that of the T2DM patients (4.48±0.56 mg/kg x min), showing a comparable degree of insulin-resistance. DISCUSSION This study shows that, in type 2 diabetic patients with nephropathy, whole-body NOx synthesis is decreased, and is not appropriately stimulated by hyperinsulinemia. The fractional conversion of arginine to NOx is also impaired, and not normally enhanced by insulin. This is the first study directly showing a decreased whole-body NOx synthesis, and a decreased conversion of arginine to NOx, in T2DM in response to insulin. Nitric oxide is likely to be involved in the defective insulin-mediated stimulation of blood flow in T2DM (3, 28) as well as in the pathogenesis of diabetic nephropathy (11). The stimulation of NOS activity is a downstream effect of Akt activation by insulin, therefore insulin-resistance may be the cause of the reduced nitric oxide production in T2DM. Insulin insufficiently stimulated NOS activity in skeletal muscle of type 2 diabetic subjects (19). Our whole-body data agree with previous reports in muscle. Since arginine concentrations (Table 2) and flux (Table
3) were similar in both groups, the impaired NOx production was not substrate-limited, but rather related to a defective arginine conversion to NOx. The site of NOx production are likely the endothelial cells, which express the bulk of constitutive NOS activity responsible for NO release into the bloodstream (3, 5). In vascular endothelial cells, insulin stimulates NO production in a dose-dependent fashion through the phosphatidylinositol 3 (PI-3)-kinase/protein kinase B (Akt) pathway (29). In arteriolar muscle cells, NOS activation by insulin is dependent on a normally-responsive IRS-1/PI-3 pathway (29). Conversely, insulin resistance at this level impairs insulin-mediated vasodilation and results in endothelial dysfunction (30). Since muscle is a key site of insulin resistance in diabetes, it can be suggested that the endothelial cells involved are mainly those of skeletal muscle. Indeed, basal and insulin-stimulated muscle NOS activity was impaired in well-controlled type 2 diabetic subjects, paralleling the severity of insulin resistance (19). In our study, we did not measure the activity of the IRS-1/PI-3/Akt pathway, since no muscle biopsy was performed. However, the above referenced reports would indicate muscle endothelial cells as key sites of such resistance. NOx concentrations were reduced by hyperinsulinemia despite the increase of NOx synthesis. Such an observation may indicate that insulin, besides its stimulatory effect on NOx production, increased also NOx removal. Such an hypothesis is intriguing, and not directly proven so far. Alternatively, other insulin-induced changes (such as the exogenous glucose infusion, the modification of plasma amino acids and other substrate concentrations, or else) might be

Insulin-resistance to NO metabolism in T2DM
9
involved, and need to be specifically investigated. On the other hand, since high glucose inhibits NOS activity per se (15), the acute insulin-induced glucose decrease was not responsible for the blunted increased of NO production observed in the patients. The diabetic subjects were treated with hypoglycemic agents. Moreover, all of them, and half of the control subjects too, were also treated with pressure-lowering agents and with statins. These drugs may affect NOS activity (31-34). Nevertheless, the T2DM patients, who were more heavily and extensively treated than the controls, exhibited a decreased NOx production, suggesting that, despite therapy, they had an impaired NOS activity. Whether the observed defects in NOx metabolism are due to diabetes itself, to the accompanying nephropathy, or to insulin-resistance, possibly amplified by hypertension (35), cannot be concluded from our experiments. In order to account at least in part for hypertension as a potentially confounding factor, we enrolled in the non diabetic, “control” group also hypertensive subjects (five out of a total of ten), otherwise clinically and metabolically healthy. When compared to the diabetic group, the NOx & arginine kinetic data of these non-diabetic, hypertensive subjects, were somehow intermediate with respect to the whole “control” group. Nevertheless, a significant difference vs. the T2DM patients, in both NOx FSR and in the fractional arginine conversion to NOx were maintained. Interestingly, these non diabetic hypertensive subjects were insulin-resistant as regards glucose disposal, as much as the T2DM diabetic subjects. Thus, it cannot be excluded that hypertension per se, (and/or the associated insulin resistance) played at
least a partial role in the defects observed in T2DM. Hypertension however is an invariable finding in T2DM with nephropathy (36), therefore it would be impossible to distinguish between the effects of diabetes per se from those of hypertension in these patients. The relationships between hypertension and NO turnover should be further investigated. We intentionally chose to study T2DM subjects who were also likely to exhibit alterations in NOx homeostasis and metabolism, i.e. patients with nephropathy. It is possible that nephropathy itself had some effect. In this respect, we found an inverse relationship between NOx FSR during the clamp and plasma creatinine within the entire subjects’ set. Additional studies in T2DM patients without nephropathy, as well as in non diabetic subjects with other forms of nephropathy, are required to answer this question, particularly as regard the insulin effect. In this regard, we previously reported a decreased basal NOx synthesis in T2DM patients without nephropathy (10), although the response to insulin was not tested. The increase of inducible NO synthase (iNOS) by endotoxin and/or inflammatory states is associated with impaired insulin-stimulated muscle glucose uptake (37-41). Although our T2DM patients did not exhibit overt signs of inflammation, measured cytokines tended to be greater in the patients than in controls, although only the increase of IL-8 was significant (Table 1). However, an increased iNOS activity would be associated with an increased NOS generation, opposite to what was observed in our study. Plasma amino acid concentrations were grossly not different between diabetic and control subjects (Table 2) and they were roughly suppressed to the same extent in
Insulin-resistance to NO metabolism in T2DM
10
both groups, with the exception of taurine (greater in the diabetic group) and asparagine and threonine (lower in the patients). None of these amino acids are know to modulate NOx metabolism. Plasma taurine concentrations may be increased in insulin-resistant states (42). Asparagine was found to be increased in type 2 diabetic patients, contrary to our findings (43). The reasons for these discrepancies are unknown, possibly depending on the patients’ specific characteristics. To our knowledge, no data on plasma threonine concentrations in response to insulin are available. On the other hand, total, BCAA and most other amino acid plasma concentrations were not significantly different between the groups. Therefore, plasma amino acid levels should not be related to any of the basic findings on NOx metabolism of our study. In conclusion, whole blood NOx production from arginine, and its response to insulin, are decreased in T2DM with nephropathy, likely representing an additional feature of insulin-resistance. Such a defect can be responsible for the decreased NOx concentration and the altered vascular responses found in T2DM, and it can be linked to the pathophysiology of diabetic nephropathy.
Author Contributions: Paolo Tessari: researched data, performed the studies, wrote manuscript. Diego Cecchet: performed the studies. Alessandra Cosma: performed the studies. Monica Vettore: performed the studies. Anna Coracina: performed the studies. Renato Millioni: researched data, reviewed/edited manuscript. Elisabetta Iori: performed the studies, contributed to discussion. Lucia Puricelli: researched data, reviewed/ edited manuscript. Angelo Avogaro: researched data, contributed to discussion, Monica Vedovato: performed the studies, contributed to discussion, reviewed/edited manuscript.
ACKNOWLEDGEMENTS This study was supported by a 2001 FIRB Grant of the Italian Ministero dell’Università e della Ricerca Scientifica, and by a research grant (“assegno di ricerca”) from the University of Padova (“Development and application of a new method to measure nitric oxide synthesis in humans”), year 2002. We acknowledge dr. Daniela Vianello, from the Department of Medical an Surgical Sciences, University of Padova, for NOx blood measurements, and dr. Maria Cristina Marescotti, from the Department of Clinical and Experimental Medicine, University of Padova, for cytokine measurements.
REFERENCES 1. Moncada S, Higgs A: The L-arginine-nitric oxide pathway. N Engl J Med 329(27): 2002-2012, 1993. 2. Kleinbongard P, Keymel S, Kelm M: New functional aspects of the L-arginine-nitric oxide metabolism within the circulating blood. Thromb Haemost 98(5):970-974, 2007 Review. 3. Muniyappa R, Quon MJ: Insulin action and insulin resistance in vascular endothelium. Curr Opin Clin Nutr Metab Care 10(4):523-530, 2007 Review.

Insulin-resistance to NO metabolism in T2DM
11
4. Ware JA, Heistad DD: Seminars in medicine of the Beth Israel Hospital, Boston. Platelet-endothelium interactions. N Engl J Med 328(9):628-635, 1993 Review. 5. Vincent MA, Montaghani M, Quon MJ: Molecular and physiologic actions of insulin related to production of nitric oxide in vascular endothelium. Curr Diab Rep 3: 279-288, 2003. 6. Antunes F, Boveris A, Cadenas E: On the mechanism and biology of cytochrome oxidase inhibition by nitric oxide. Proc Natl Acad Sci USA 30;101(48):16774-16779, 2004. 7. Honing ML, Morrison PJ, Banga ES, Rabelink TJ: Nitric oxide availability in diabetes mellitus. Diabetes Metab Rev 14:241-249, 1998. 8. Vanizor B, Orem A, Karahan SC, Kiran E, Erem C, Aliyazicioğlu R, Uydu HA: Decreased nitric oxide end-products and its relationship with high density lipoprotein and oxidative stress in people with type 2 diabetes without complications. Diabetes Res Clin Pract 54(1):33-39, 2001. 9. Watkins CC, Sawa A, Jaffrey S, Blackshaw S, Barrow RK, Snyder SH, Ferris CD: Insulin restores neuronal nitric oxide synthase expression and function that is lost in diabetic gastropathy. J Clin Invest 106(3):373-384, 2000. Erratum in: J Clin Invest 106(6):803, 2000. 10. Avogaro A, Toffolo G, Kiwanuka E, de Kreutzenberg SV, Tessari P, Cobelli C: L-arginine-nitric oxide kinetics in normal and type 2 diabetic subjects: a stable-labelled 15N arginine approach. Diabetes 52(3):795-802, 2003. 11. Goligorsky MS, Chen J, Brodsky S. Workshop: endothelial cell dysfunction leading to diabetic nephropathy : focus on nitric oxide. Hypertension 37(2 Part 2):744-748, 2001. Review. 12. Earle KA, Mehrotra S, Dalton RN, Denver E, Swaminathan R: Defective nitric oxide production and functional renal reserve in patients with type 2 diabetes who have microalbuminuria of African and Asian origin compared with white origin. J Am Soc Nephrol 12:2125-2130, 2001. 13. Prabhakar S, Starnes J, Shi S, Lonis B, Tran R: Diabetic nephropathy is associated with oxidative stress and decreased renal nitric oxide production. J Am Soc Nephrol 18(11): 2945-2452, 2007. 14. Stehouver CD, Henry RM, Dekker JM, Nijpels G, Heine RJ, Bouter LM: Microalbuminuria is associated with impaired endothelium dependent, flow mediated vasodilation in elderly individuals without and with diabetes: further evidence for a link between microalbuminuria and endothelial dysfunction-the Hoorn Study. Kidney Int 92: S42-S44, 2004. 15. Chu S, Bohlen HG: High concentration of glucose inhibits glomerular endothelial eNOS through a PKC mechanism. Am J Physiol Renal Physiol 287(3):F384-F392, 2004. 16. Baylis C: Arginine, arginine analogs and nitric oxide production in chronic kidney disease. Nat Clin Pract Nephrol 2(4):209-220, 2006. Review. 17. Maejima K., Nakano S, Himeno M, Tsuda S, Makiishi H, Ito T, Nakagawa A, Kigoshi T, Ishibashi T, Nishio M, Uchida K: Increased basal levels of plasma nitric oxide in type 2 diabetic subjects. Relationship to microvascular complications. J Diabetes Complications 15:135-143, 2001.

Insulin-resistance to NO metabolism in T2DM
12
18. Zahedi AS, Ghasemi A, Azizi F: Serum nitric oxide metabolites in subjects with metabolic syndrome. Clin Biochem 41(16-17):1342-1347, 2008. 19. Kashyap SR, Roman LJ, Lamont J, Masters BS, Bajaj M, Suraamornkul S, Belfort R, Berria R, Kellogg DL Jr, Liu Y, DeFronzo RA: Insulin resistance is associated with impaired nitric oxide synthase activity in skeletal muscle of type 2 diabetic subjects. J Clin Endocrinol Metab 90(2): 1100-1105, 2005. 20. Tessari P, Coracina A, Puricelli L, Vettore M, Cosma A, Millioni R, Cecchet D, Avogaro A, Tiengo A, Kiwanuka E: Acute effect of insulin on nitric oxide synthesis in humans: a precursor-product isotopic study. Am J Physiol Endocrinol Metab 293(3):E776-E782, 2007. 21. Brochner-Mortesen J, Giese J, Rossing N: Renal inulin clearance versus total plasma clearance of 51Cr-EDTA. Scand J Clin Lab Invest 26:5-11, 1969. 22. Cockcroft DW, Gault MH: Prediction of creatinine clearance from serum creatinine. Nephron 16: 31-41, 1976. 23. Wolfe RR: Principles and practice of kinetics analysis. In Radioactive and stable isotope tracers in biomedicine. New York, Wiley-Liss, 1992, p. 62-70. 24. Green LC, Wagner DA, Glogowski J, Skipper PL, Wishnock JS, Tannenbaum SR: Analysis of nitrate, nitrite, and [15N]nitrate in biological fluids. Anal Biochem 126:131-138, 1992. 25. Ellis G, Adatia I, Yazdanpanah M, Makela SK: Nitrite and nitrate analyses: a clinical biochemistry perspective. Clin Biochem 31(4): 195-220, 1998. 26. Jurgensten L, Edlund A, Peterson AS, Wennmalm A: Plasma nitrate as an index of nitric oxide formation in man: analyses of kinetics and confounding factors. Clin Physiol 16: 369-379, 1996. 27. Dodge JT, Mitchell C, Hanahan DJ: The preparation and chemical characteristics of hemoglobin-free ghosts of human erythrocytes. Arch Biochem Biophys 100:119-130, 1963. 28. Laakso M, Edelman SV, Brechtel G, Baron AD: Impaired insulin-mediated skeletal muscle blood flow in patients with NIDDM. Diabetes 41(9):1076-1083, 1992. 29. Zeng G, Quon MJ: Insulin-stimulated production of nitric oxide is inhibited by wortmannin. Direct measurement in vascular endothelial cells. J Clin Invest 98:894–898, 1996. 30. Hsueh WA, Law RF: Insulin signalling in the arterial wall. Am J Cardiol 84:21J–24J, 1999. 31. Hamilton SJ, Chew GT, Watts GF: Therapeutic regulation of endothelial dysfunction in type 2 diabetes mellitus. Diab Vasc Dis Res 4(2):89-102, 2007. Review 32. Morawietz H, Rohrbach S, Rueckschloss U, Schellenberger E, Hakim K, Zerkowski HR, Kojda G, Darmer D, Holtz J: Increased cardiac endothelial nitric oxide synthase expression in patients taking angiotensin-converting enzyme inhibitor therapy. Eur J Clin Invest 36(10):705-712, 2006 33. Satoh M, Fujimoto S, Arakawa S, Yada T, Namikoshi T, Haruna Y, Horike H, Sasaki T, Kashihara N: Angiotensin II type 1 receptor blocker ameliorates uncoupled endothelial nitric oxide synthase in rats with experimental diabetic nephropathy. Nephrol Dial Transplant 23(12): 3806-13, 2008.
Insulin-resistance to NO metabolism in T2DM
13
34. Zhou MS, Schuman IH, Jaimes EA, Raij L: Renoprotection by statins is linked to a decrease in renal oxidative stress, TGF-beta, and fibronectin with concomitant increase in nitric oxide bioavailability. Am J Physiol Renal Physiol 295(1):F53-F59, 2008. 35. Ferrannini E, Haffner SM, Stern MP. Essential hypertension: an insulin-resistant state. J Cardiovasc Pharmacol 15 Suppl5:S18-25, 1990. 36. Gurley SB, Coffman TM. The renin-angiotensin system and diabetic nephropathy. Semin Nephrol 27(2):144-152, 2007. Review 37. Kapur S, Bedard S, Marcotte B, Cote CH, Marette A: Expression of nitric oxide synthase in skeletal muscle. A novel role for nitric oxide as a modulator of insulin action. Diabetes 46:1691–1700, 1997. 38. Andersen K, Pedersen BK: The role of inflammation in vascular insulin resistance with focus on IL-6. Horm Metab Res 40(9):635-639, 2008. 39. Andreozzi F, Laratta E, Procopio C, Hribal ML, Sciacqua A, Perticone M, Miele C, Perticone F, Sesti G: Interleukin-6 impairs the insulin signalling pathway, promoting production of nitric oxide in human umbilical vein endothelial cells. Mol Cell Biol 27(6):2372-238, 2007. 40. Navarro-González JF, Mora-Fernández C: The role of inflammatory cytokines in diabetic nephropathy. J Am Soc Nephrol 19(3):433-442, 2008. 41. Nathan C, Xie QW: Regulation of biosynthesis of nitric oxide. J Biol Chem 13;269(19): 13725-13728, 1994. 42. Wijekoon EP, Skinner C, Brosnan ME, Brosnan JT: Amino acid metabolism in the Zucker diabetic fatty rat: effects of insulin resistance and of type 2 diabetes. Can J Physiol Pharmacol 82(7):506-514, 2004. 43. Marchetti P, Masiello P, Benzi L, Cecchetti P, Fierabracci V, Giannarelli R, Gregorio F, Brunetti P, Navalesi R: Effects of metformin therapy on plasma amino acid pattern in patients with maturity-onset diabetes. Drugs Exp Clin Res 15(11-12):565-570, 1989.
Insulin-resistance to NO metabolism in T2DM
14
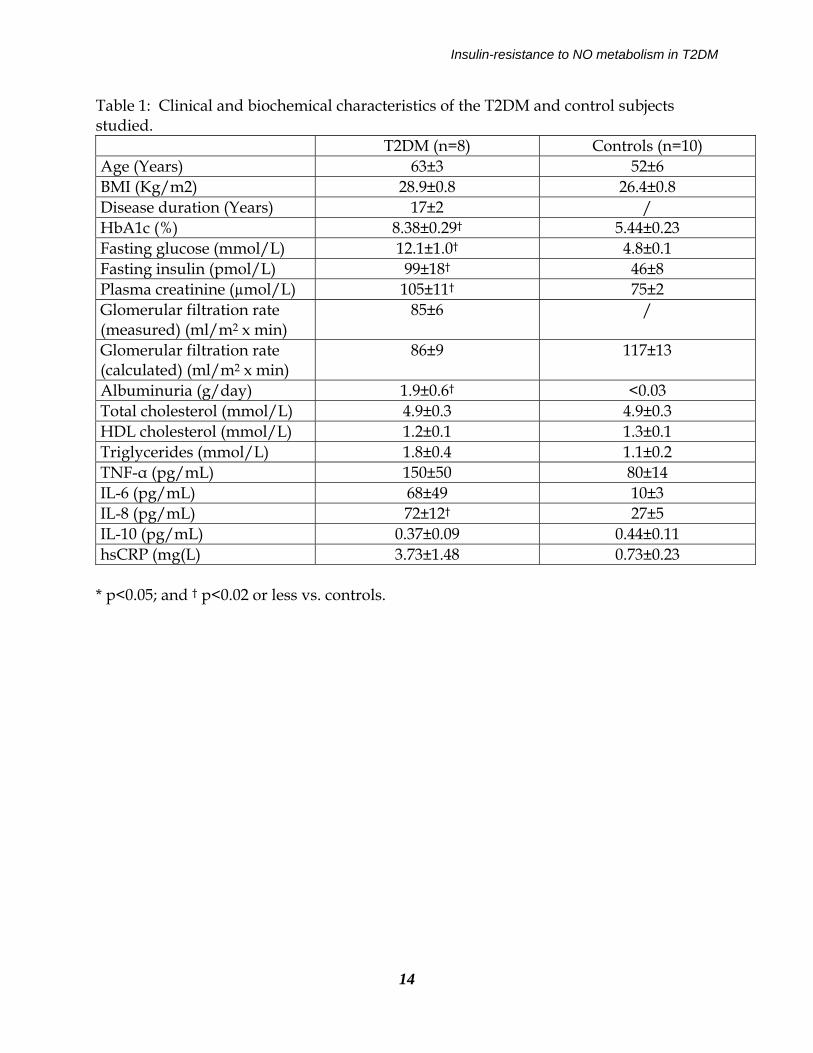
Table 1: Clinical and biochemical characteristics of the T2DM and control subjects studied. T2DM (n=8) Controls (n=10) Age (Years) 63±3 52±6 BMI (Kg/m2) 28.9±0.8 26.4±0.8 Disease duration (Years) 17±2 / HbA1c (%) 8.38±0.29† 5.44±0.23 Fasting glucose (mmol/L) 12.1±1.0† 4.8±0.1 Fasting insulin (pmol/L) 99±18† 46±8 Plasma creatinine (µmol/L) 105±11† 75±2 Glomerular filtration rate (measured) (ml/m2 x min)
85±6 /
Glomerular filtration rate (calculated) (ml/m2 x min)
86±9 117±13
Albuminuria (g/day) 1.9±0.6† <0.03 Total cholesterol (mmol/L) 4.9±0.3 4.9±0.3 HDL cholesterol (mmol/L) 1.2±0.1 1.3±0.1 Triglycerides (mmol/L) 1.8±0.4 1.1±0.2 TNF-α (pg/mL) 150±50 80±14 IL-6 (pg/mL) 68±49 10±3 IL-8 (pg/mL) 72±12† 27±5 IL-10 (pg/mL) 0.37±0.09 0.44±0.11 hsCRP (mg(L) 3.73±1.48 0.73±0.23
* p<0.05; and † p<0.02 or less vs. controls.
Insulin-resistance to NO metabolism in T2DM
15
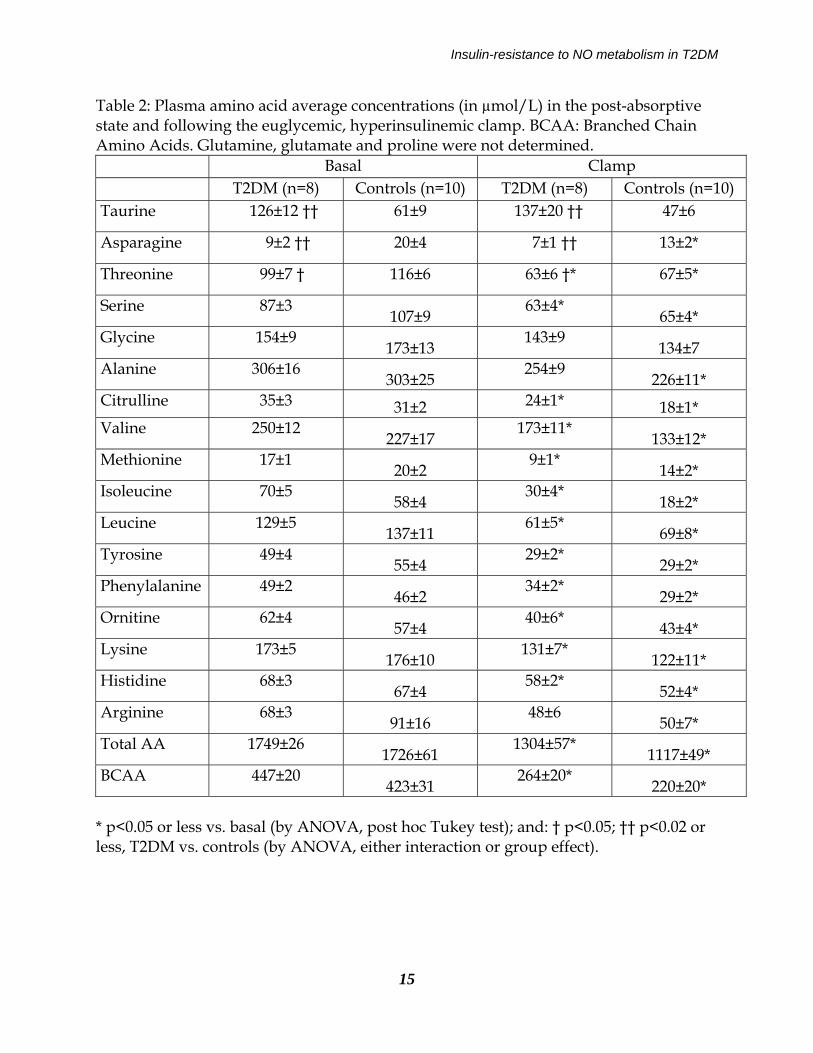
Table 2: Plasma amino acid average concentrations (in µmol/L) in the post-absorptive state and following the euglycemic, hyperinsulinemic clamp. BCAA: Branched Chain Amino Acids. Glutamine, glutamate and proline were not determined. Basal Clamp T2DM (n=8) Controls (n=10) T2DM (n=8) Controls (n=10) Taurine 126±12 †† 61±9 137±20 †† 47±6
Asparagine 9±2 †† 20±4 7±1 †† 13±2*
Threonine 99±7 † 116±6 63±6 †* 67±5*
Serine 87±3 107±9
63±4* 65±4*
Glycine 154±9 173±13
143±9 134±7
Alanine 306±16 303±25
254±9 226±11*
Citrulline 35±3 31±2 24±1* 18±1* Valine 250±12
227±17 173±11*
133±12* Methionine 17±1
20±2 9±1*
14±2* Isoleucine 70±5
58±4 30±4*
18±2* Leucine 129±5
137±11 61±5*
69±8* Tyrosine 49±4
55±4 29±2*
29±2* Phenylalanine 49±2
46±2 34±2*
29±2* Ornitine 62±4
57±4 40±6*
43±4* Lysine 173±5
176±10 131±7*
122±11* Histidine 68±3
67±4 58±2*
52±4* Arginine 68±3
91±16 48±6
50±7* Total AA 1749±26
1726±61 1304±57*
1117±49* BCAA 447±20
423±31 264±20*
220±20* * p<0.05 or less vs. basal (by ANOVA, post hoc Tukey test); and: † p<0.05; †† p<0.02 or less, T2DM vs. controls (by ANOVA, either interaction or group effect).
Insulin-resistance to NO metabolism in T2DM
16
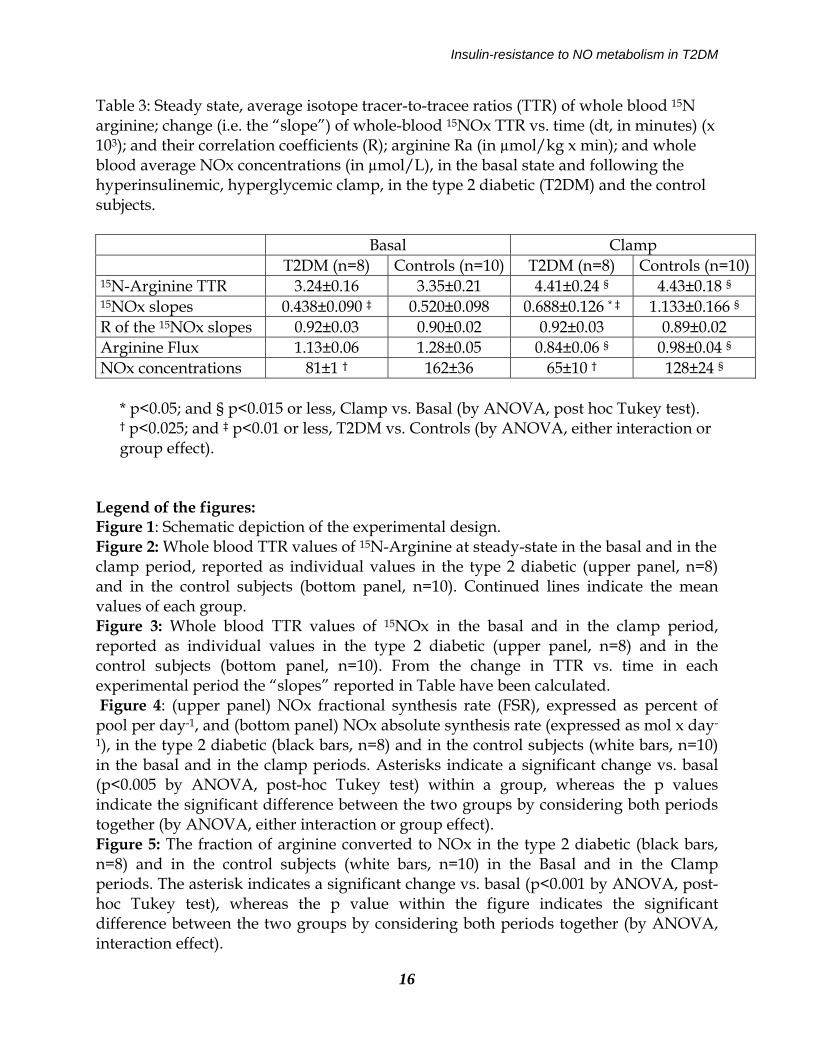
Table 3: Steady state, average isotope tracer-to-tracee ratios (TTR) of whole blood 15N arginine; change (i.e. the “slope”) of whole-blood 15NOx TTR vs. time (dt, in minutes) (x 103); and their correlation coefficients (R); arginine Ra (in µmol/kg x min); and whole blood average NOx concentrations (in µmol/L), in the basal state and following the hyperinsulinemic, hyperglycemic clamp, in the type 2 diabetic (T2DM) and the control subjects. Basal Clamp T2DM (n=8) Controls (n=10) T2DM (n=8) Controls (n=10) 15N-Arginine TTR 3.24±0.16 3.35±0.21 4.41±0.24 § 4.43±0.18 § 15NOx slopes 0.438±0.090 ‡ 0.520±0.098 0.688±0.126 * ‡ 1.133±0.166 § R of the 15NOx slopes 0.92±0.03 0.90±0.02 0.92±0.03 0.89±0.02 Arginine Flux 1.13±0.06 1.28±0.05 0.84±0.06 § 0.98±0.04 § NOx concentrations 81±1 † 162±36 65±10 † 128±24 §
* p<0.05; and § p<0.015 or less, Clamp vs. Basal (by ANOVA, post hoc Tukey test). † p<0.025; and ‡ p<0.01 or less, T2DM vs. Controls (by ANOVA, either interaction or group effect).
Legend of the figures: Figure 1: Schematic depiction of the experimental design. Figure 2: Whole blood TTR values of 15N-Arginine at steady-state in the basal and in the clamp period, reported as individual values in the type 2 diabetic (upper panel, n=8) and in the control subjects (bottom panel, n=10). Continued lines indicate the mean values of each group. Figure 3: Whole blood TTR values of 15NOx in the basal and in the clamp period, reported as individual values in the type 2 diabetic (upper panel, n=8) and in the control subjects (bottom panel, n=10). From the change in TTR vs. time in each experimental period the “slopes” reported in Table have been calculated. Figure 4: (upper panel) NOx fractional synthesis rate (FSR), expressed as percent of pool per day-1, and (bottom panel) NOx absolute synthesis rate (expressed as mol x day-
1), in the type 2 diabetic (black bars, n=8) and in the control subjects (white bars, n=10) in the basal and in the clamp periods. Asterisks indicate a significant change vs. basal (p<0.005 by ANOVA, post-hoc Tukey test) within a group, whereas the p values indicate the significant difference between the two groups by considering both periods together (by ANOVA, either interaction or group effect). Figure 5: The fraction of arginine converted to NOx in the type 2 diabetic (black bars, n=8) and in the control subjects (white bars, n=10) in the Basal and in the Clamp periods. The asterisk indicates a significant change vs. basal (p<0.001 by ANOVA, post-hoc Tukey test), whereas the p value within the figure indicates the significant difference between the two groups by considering both periods together (by ANOVA, interaction effect).

Insulin-resistance to NO metabolism in T2DM
17
FIGURE 1

Insulin-resistance to NO metabolism in T2DM
18
FIGURE 2
Insulin-resistance to NO metabolism in T2DM
19
FIGURE 3
Insulin-resistance to NO metabolism in T2DM
20
FIGURE 4
Insulin-resistance to NO metabolism in T2DM
21
FIGURE 5